Article

An Advanced Quality Assessment and Monitoring of ESA Sentinel-1 SAR Products via the CyCLOPS Infrastructure in the Southeastern Mediterranean Region

1
Department of Civil Engineering & Geomatics, Cyprus University of Technology, Limassol 3036, Cyprus
2
Eratosthenes Centre of Excellence, Limassol 3012, Cyprus
3
SAR Signal Processing Department, German Aerospace Center, 82234 Wessling, Germany
*
Author to whom correspondence should be addressed.
Remote Sens. 2024, 16(10), 1696; https://doi.org/10.3390/rs16101696
Submission received: 14 March 2024 / Revised: 6 May 2024 / Accepted: 8 May 2024 / Published: 10 May 2024
(This article belongs to the Special Issue Calibration and Validation of SAR Data and Derived Products)

Abstract

:
The Cyprus Continuously Operating Natural Hazards Monitoring and Prevention System, abbreviated CyCLOPS, is a national strategic research infrastructure devoted to systematically studying geohazards in Cyprus and the Eastern Mediterranean, Middle East, and North Africa (EMMENA) region. Amongst others, CyCLOPS comprises six permanent sites, each housing a Tier-1 GNSS reference station co-located with two calibration-grade corner reflectors (CRs). The latter are strategically positioned to account for both the ascending and descending tracks of SAR satellite missions, including the ESA’s Sentinel-1. As of June 2021, CyCLOPS has reached full operational capacity and plays a crucial role in monitoring the geodynamic regime within the southeastern Mediterranean area. Additionally, it actively tracks landslides occurring in the western part of Cyprus. Although CyCLOPS primarily concentrates on geohazard monitoring, its infrastructure is also configured to facilitate the radiometric calibration and geometric validation of Synthetic Aperture Radar (SAR) imagery. Consequently, this study evaluates the performance of Sentinel-1A SAR by exploiting the CyCLOPS network to determine key parameters including spatial resolution, sidelobe levels, Radar Cross-Section (RCS), Signal-to-Clutter Ratio (SCR), phase stability, and localization accuracy, through Point Target Analysis (PTA). The findings reveal the effectiveness of the CyCLOPS infrastructure to maintain high-quality radiometric parameters in SAR imagery, with consistent spatial resolution, controlled sidelobe levels, and reliable RCS and SCR values that closely adhere to theoretical expectations. With over two years of operational data, these findings enhance the understanding of Sentinel-1 SAR product quality and affirm CyCLOPS infrastructure’s reliability.

1. Introduction

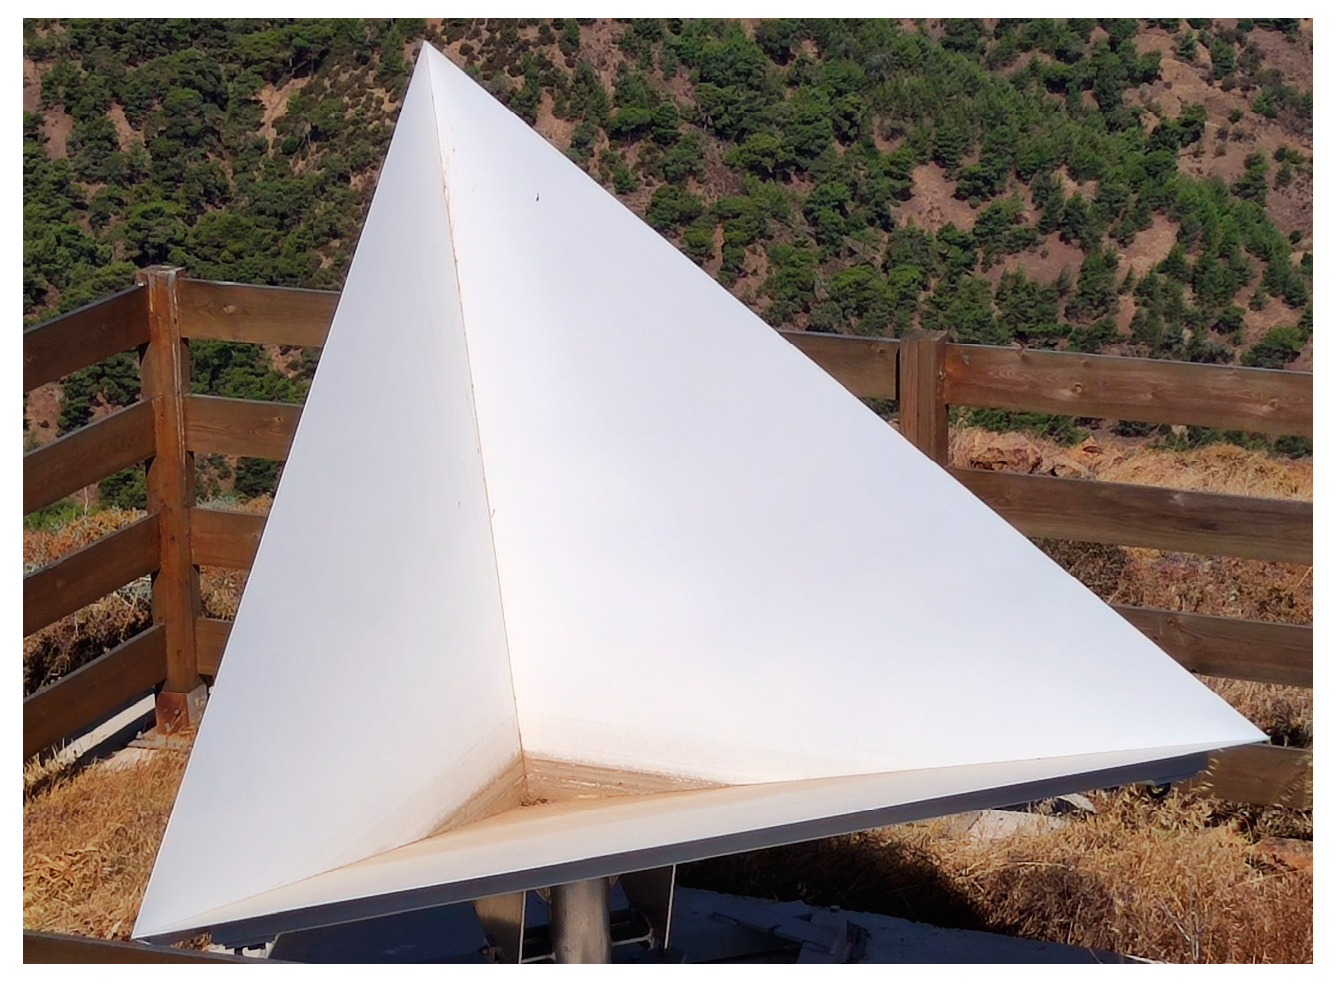
The CyCLOPS strategic infrastructure unit, located in Cyprus, comprises two main components: (a) a multi-parametric network of sensors (MPN) established throughout the government-controlled areas of Cyprus and (b) an Operation Centre (OC). The MPN consists of (i) a permanent and (ii) a mobile segment deployed in areas of interest. The permanent segment, as illustrated in Figure 1, includes six permanent sites, each of which contains a Tier-1 GNSS continuous operating reference station (CORS) co-located with two calibration-grade triangular trihedral corner reflectors (CRs) of 1.5 m inner length to account for both the ascending and descending tracks of SAR satellite missions, such as the ESA’s Sentinel-1 [1]. The existing CyCLOPS network of corner reflector arrays and its surrounding area periodically undergoes imaging by SAR satellites. Subsequently, these acquisitions are analyzed using interferometric SAR (InSAR) techniques to produce interferograms (phase changes over time), consequently generating deformation maps. The latter are relative referenced to a specific acquisition time rather than an absolute coordinate reference system [2]. However, for precise deformation monitoring applications using SAR acquisitions, data calibration is essential, and it can be categorized into two main types: internal and external. Internal calibration involves assessing radar performance using internally generated calibrated signal sources, which may be derived from pre-flight tests [3]. External calibration uses ground targets like CRs with known Radar Cross-Sections (RCSs) to achieve the end-to-end calibration of the SAR system. Its primary objective is to transform the pixel intensity of an image feature into a physical parameter, such as an RCS. This transformation is accomplished by calculating a calibration factor based on radiometric measurements gathered from CRs [4]. Evidently, the co-location of CRs with a GNSS CORS enhances the calibration process, improving the accuracy in estimating interferometric phases and yielding more dependable deformation products [5].
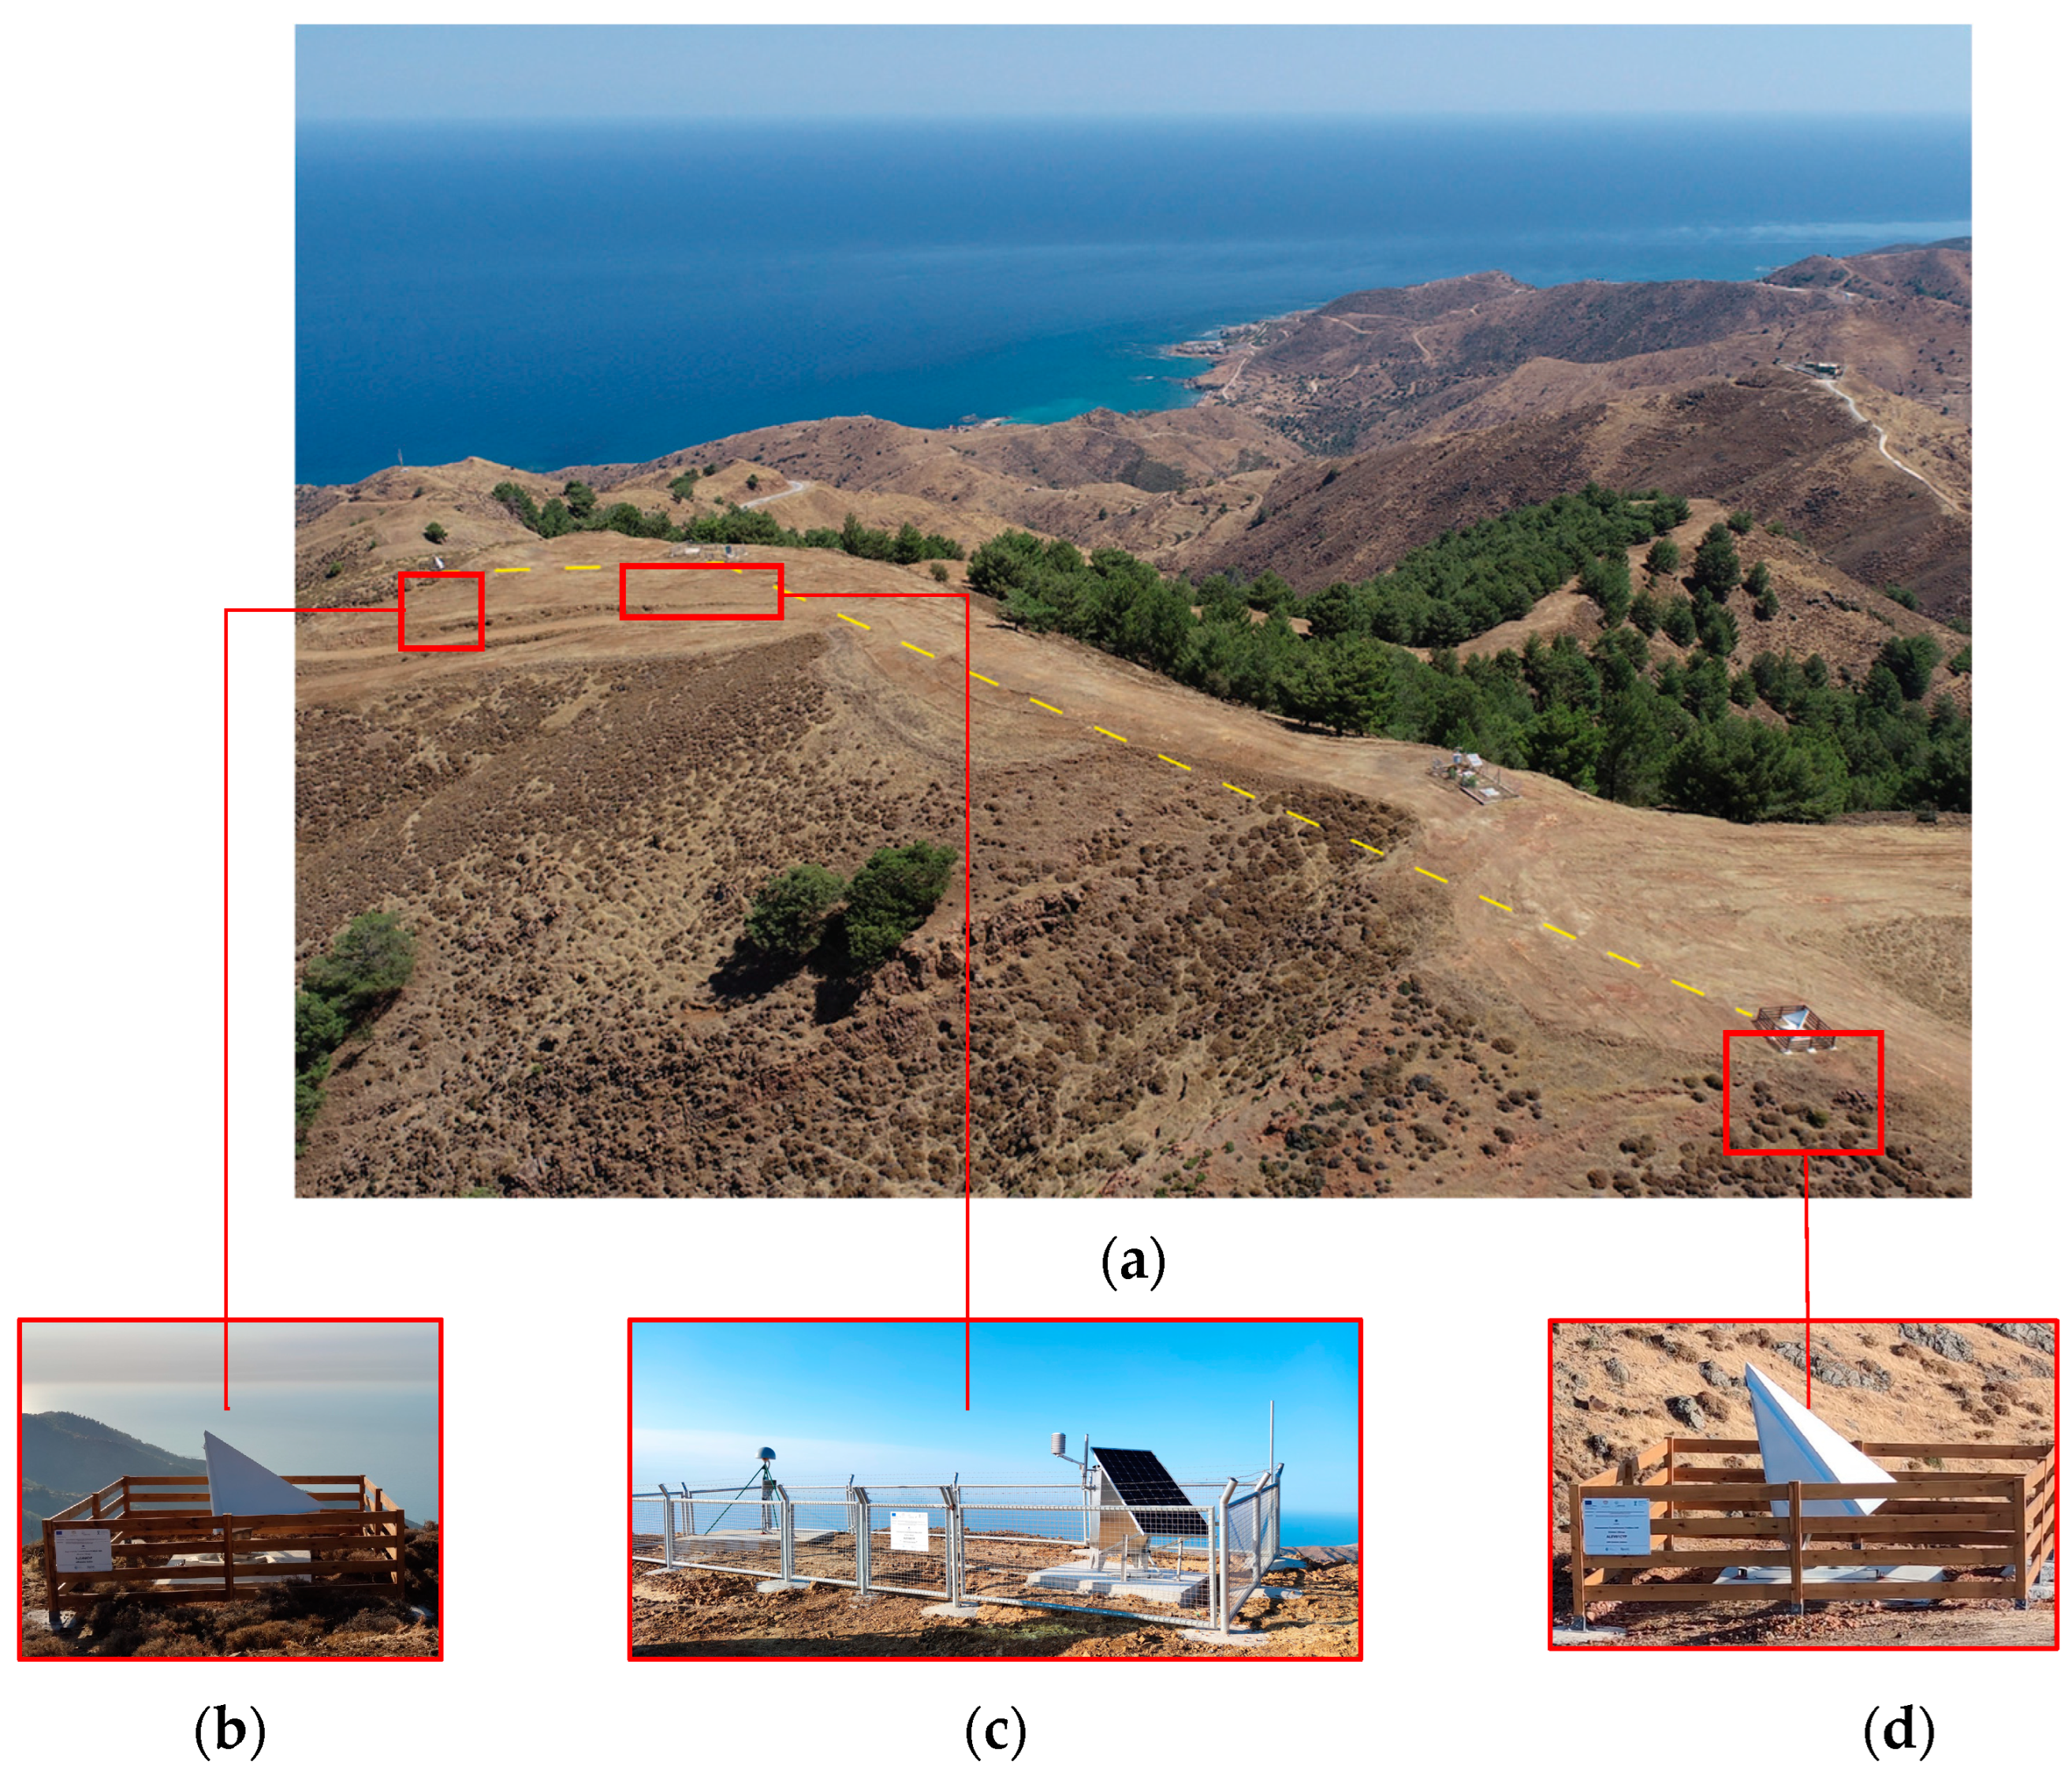
One of the most evident applications of a CORS is the continuous monitoring of crustal movement, demanding a constant high level of accuracy and precision. In order to mitigate GNSS signal interference and enhance the precision of position calculations, the IGS, EPN, and UNAVCO have established stringent instrumentation and monumentation criteria [7,8,9]. Moreover, selecting suitable locations for the permanent installation of CRs is crucial for their optimal performance in SAR applications. According to the literature [10,11,12], numerous factors must be considered when choosing a potential site for installation with one primary objective: ensuring that the reflector is more visible than the surrounding backscattered surface (clutter). The specific locations of the six permanent sites were thoughtfully selected using a semi-automatic, multi-criteria GIS-based methodology developed by the CUT Laboratory of Geodesy which is described in [6]. A representative example of the collocation can be seen in Figure 2.
Although the primary purpose of CyCLOPS is the geohazards’ monitoring, it is designed to support the radiometric calibration and geometric validation of C- and X-band SAR imagery; thus, besides its fundamental geodetic role, the unit aims to evolve into a calibration and validation (Cal/Val) infrastructure supporting existing and upcoming SAR satellite constellations.
External calibration, involving known target scattering characteristics, is frequently employed to finalize the calibration process and is a mean to confirm the calibration status of SAR data from a specific sensor [13]. Radiometric calibration, as a part of external calibration, is applied to correct the biases (e.g., antenna’s illumination pattern, fluctuation in transmitted power, system noise, receiver gains) of SAR data products [4]. Using CRs in radiometric calibration entails comparing the theoretical RCS (RCST) with the backscattered response observed from the same CRs in a SAR image. This process ensures that the pixel values of phase and amplitude in SAR images can be associated with the relevant geophysical parameters of interest [14]. Hence, by comparing the RCST with the integrated image power of a CR, the absolute calibration factor can be determined [13].
The accuracy with which an Earth-observing remote sensing platform can precisely determine the geographic positions of imaged surface features is known as its geolocation accuracy [15]. Due to accurate time measurements in range and precise orbit determination in azimuth dimension, SAR images demonstrate sufficient geometric accuracy. However, these measurements are susceptible to factors like variable atmospheric conditions, Earth dynamics, and approximations made during SAR processing. These influences can introduce apparent displacement shifts, occasionally reaching several metres. Mitigating the abovementioned influences requires several post-processing steps and external data for accurate correction [16]. Determining the geolocation accuracy of SAR products entails empirically assessing the system’s inherent biases in both range and azimuth timing. Typically, these biases are calculated using point targets with precisely surveyed positions, such as CRs. With range–Doppler geolocation, cartographic positions are converted into image coordinates in slant range. During the acquisition process, satellite positions and acquisition time are recorded and provided in the final products. Comparing the expected CR coordinates within a specific image with the actual locations of intensity peaks allows for determining an offset. The latter encompasses the system’s inherent biases, state vector errors, and effects like atmospheric path delay, plate tectonics, and solid Earth tide (SET) disturbances [17].
The objective of this article is to present the initial results of assessing ESA Sentinel-1A (S1A) SAR performance by means of the CyCLOPS CRs’ response, and it is structured as follows: Section 2 describes the theoretical background of SAR calibration, examining the radiometric parameters of Sentinel-1. It also provides an overview of the geolocation analysis. Section 3 presents the results of this study’s quality monitoring of Sentinel-1 and the step-by-step procedure used to validate CRs in terms of radiometric parameters and geolocation accuracy assessments of SAR products. Finally, Section 4 reviews the results of the evaluation process, and Section 5 concludes with final remarks.

2. Theoretical Background

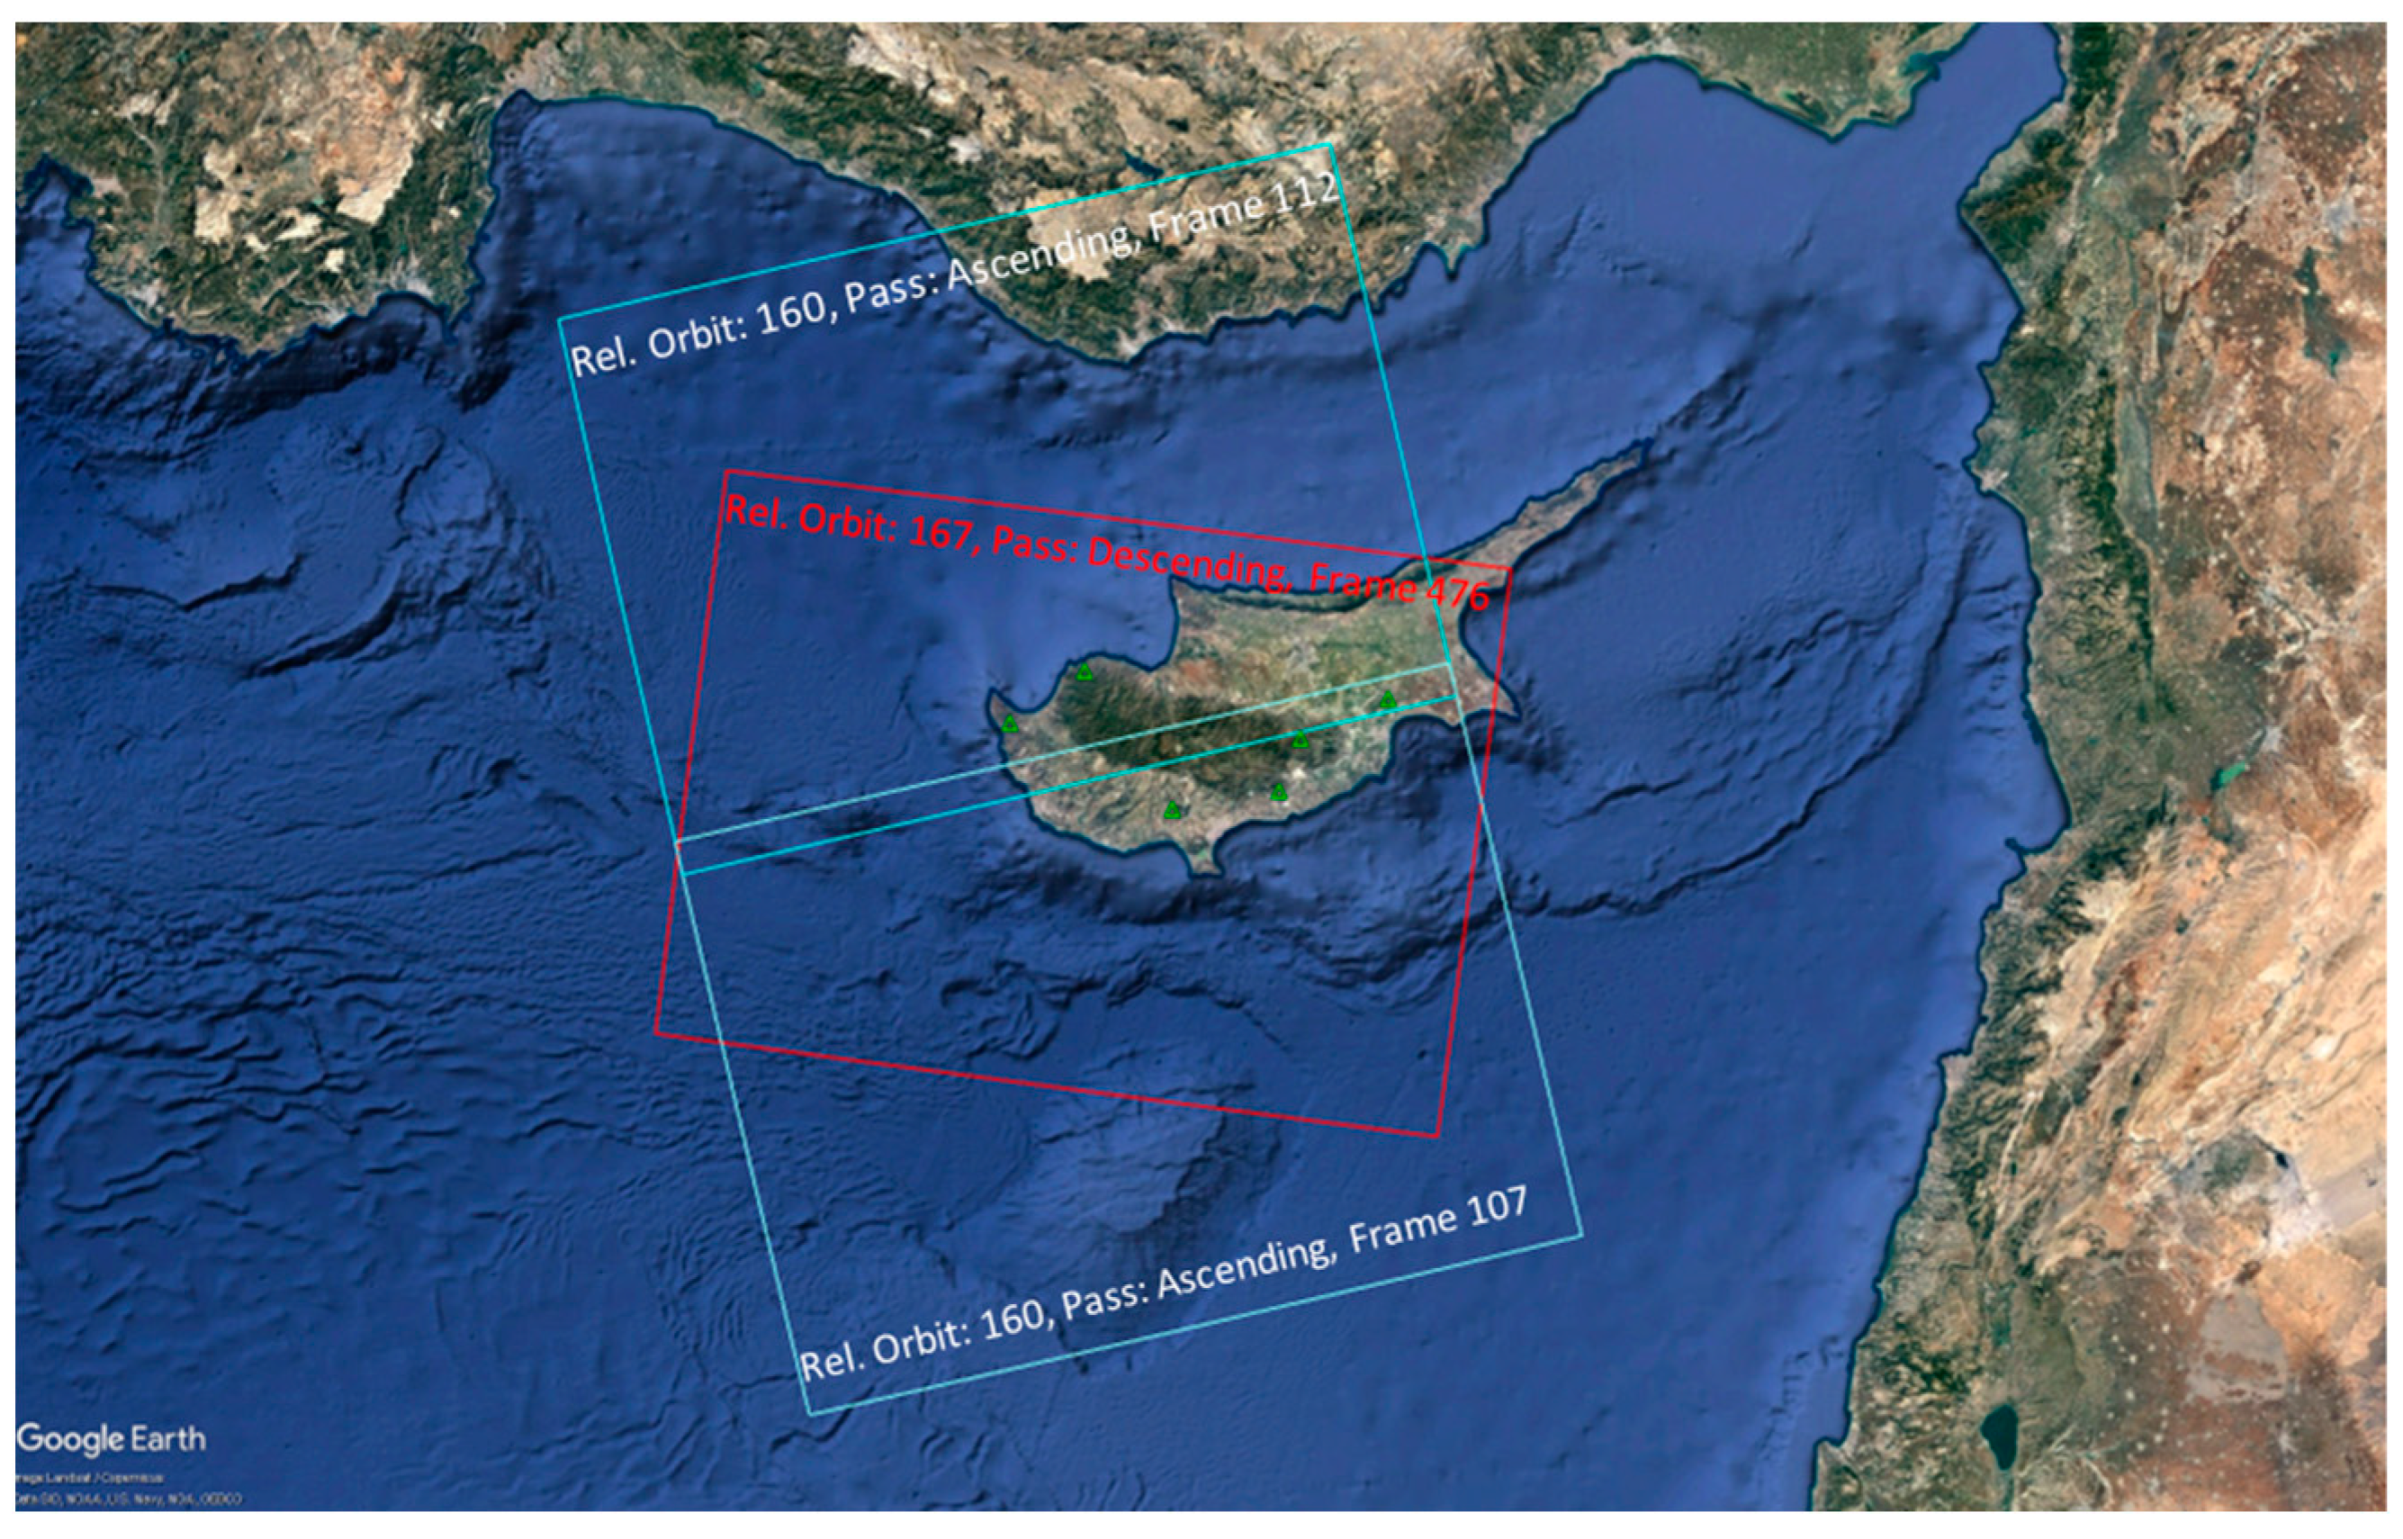
Sentinel-1 (S-1) is a near-polar, sun-synchronous, circular orbit, having an orbit height of 693 km, a repeat cycle of 12 days (175 orbits per cycle), and a revisit frequency over Cyprus of about one day. The S-1 mission was designed as a two-satellite constellation, Sentinel-1A (S-1A) and Sentinel-1B (S-1B). Unfortunately, on 23 December 2021, the ESA announced the end of the S-1B mission due to instrument electronics issues [18]. Figure 3 illustrates the frames of the S-1A acquisitions over Cyprus. Frames 107 and 112 correspond to the ascending pass of relative orbit 160, while frame 476 corresponds to the descending pass of relative orbit 167.
S-1A operates at C-band (central frequency of 5.405 GHz), corresponding to a wavelength (λ) of about 5.55 cm, supporting three data products: Level-0, Level-1, and Level-2. Level-1 data products are produced as Single Look Complex (SLC) and Ground Range Detected (GRD); these products are time-referenced, in a zero-Doppler geometry, and enriched with annotated information, including radiometric and geometric calibration coefficients, as well as georeferencing parameters [19]. Furthermore, the SLC image products include a single look in each dimension and have been corrected for biases (i.e., azimuth bistatic delay, elevation antenna pattern, and range spreading loss) while maintaining the phase information. The GRD image products, on the other hand, are multilooked (with reduced speckle noise) and projected to ground range using the WGS84 ellipsoid model. The phase information is lost in this image product, while pixels have square spatial resolution and square spacing [20].
The Cyprus coverage of S-1 provides two acquisitions within 12 days in IW swath and VV-VH dual polarization [21]. The IW swath mode captures three sub-swaths (i.e., IW1, IW2, and IW3) employing the Terrain Observation with Progressive Scans SAR (TOPSAR) technique. TOPSAR enhances traditional ScanSAR by not only steering the beam across the range but also electronically directing it from back to front in the azimuth for each burst [22]. This approach eliminates the issue of scalloping and ensures consistent image quality across the entire swath.

2.1. Radar Backscatter Coefficient

The ratio of the energy (intensity) reflected by the scatterer relative to the energy incident on it is called the RCS and can be expressed as follows [23]:
σ = l i m R 4 π R 2 Ε s 2 Ε i 2
where R represents the range between the scatterer and the target, and Es and Ei denote the scattered and incident electrical field strength, respectively, measured in watts per square metre (W/m2). The limit applied eliminates the dependency on range in the relation because, at an infinite distance, the target is illuminated by a planar wavefront. For this conceptualization of the target’s RCS, it is presupposed that the incoming energy disperses uniformly in all directions. In practice, the RCS is typically anisotropic, meaning its value depends on (a) the illumination angle, (b) the frequency of the SAR signal, and (c) the polarization [24]. The unit of the RCS is square metres (m2), though values are expressed in decibels (dB). The latter is a logarithmic measure (i.e., 10log10) of the signal intensity that diminishes the relative significance of weaker signals compared to strong ones. Thus, commonly, the RCS is referenced to an illuminated area A which is equal to the following:
A = ρ r ρ a sin ϑ
where ρ r and ρ a are the slant range and azimuth pixel spacing, respectively, and ϑ is the local incidence angle.
The standard measurement for evaluating the brightness of a distributed scatterer in a SAR image is known as the backscatter coefficient, commonly referred to as Sigma 0, which is actually the RCS normalized by A and is derived when converting the radar reflectivity into physical units, where the area normalization is aligned with the ground range plane [25]. The Earth model used is inflated with an average height such that the area normalization factor can be simplified to sin ϑ (in the case of Sigma 0). Concordantly, Sigma 0 (σ0) is calculated according to the following equation:
σ 0 = D N 2 A σ 2
where DN is the Digital Number of the pixel which is the amplitude provided in the measurements’ metadata file. A σ 2 transforms the radar reflectivity into the normalized RCS (σ0), where the area is aligned with the ground range plane. Nevertheless, the average Sigma 0 over AoI can be used instead to improve the accuracy:
σ 0 = < D N > 2 A 2
Using the above equation, the normalized RCS or Sigma 0 can be calculated. Note that <DN>2 is the average product intensity (brightness). Expressing σ0 in decibels, instead of natural values, it is then equal to the following:
σ d B 0 = 10 · log 10 ( σ 0 )

2.2. Radar Brightness

Sigma 0 is widely used, representing the RCS normalized to a unit area on the ground. An alternative option for RCS estimation is the use of the radar brightness, known as Beta 0 (β0), which is not influenced by the local incidence angle. This is because its area normalization is adjusted in accordance with the slant range direction and is calculated as follows [25,26]:
β 0 = D N 2 A β 2 = D N 2 K D N 2 K 1
The conversion process involves both the pixel scaling factor, KDN, and the calibration constant, K. These parameters are noted in look-up tables (LUTs) within the metadata of SLC products. The Calibration Annotation Data Set (CADS), A σ 2 , and A β 2 can be found in LUTs.
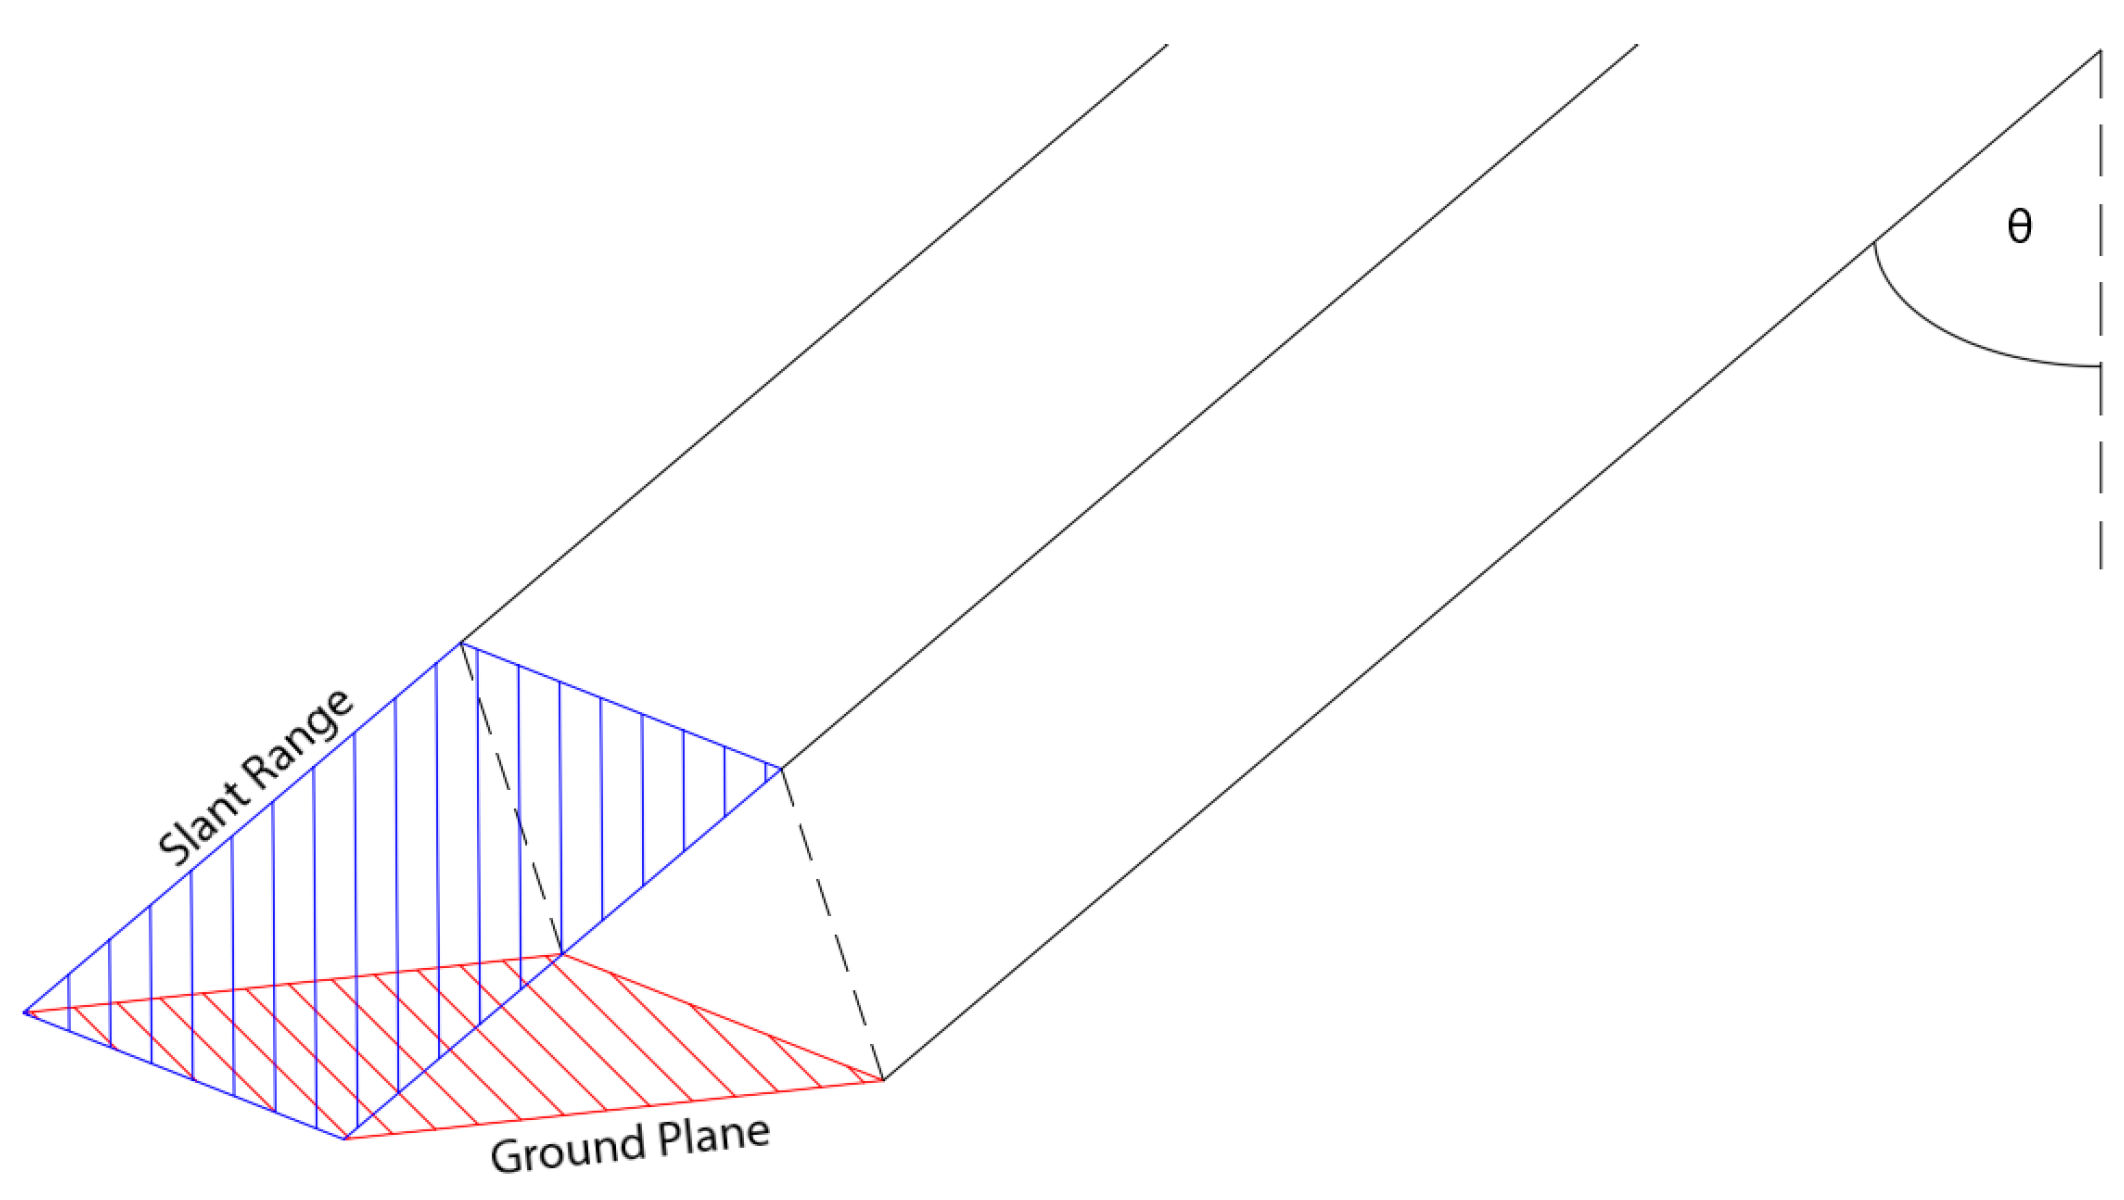
Concordantly, A β is used to convert the radar reflectivity into β0 where the area normalization is aligned with the slant range [27]. The A β and A σ reference areas within the β0 and σ0 conventions, respectively, are illustrated in Figure 4 below.

2.3. SAR Corner Reflectors

The main feature of a CR is its ability to reflect much higher amounts of electromagnetic energy compared to other materials; thus, despite its relatively small size, it has a large RCS. The size of the RCS is influenced by the dimensions and shape of the corner reflector; therefore, reflectors are constructed in various shapes and sizes to serve different operational needs [28]. Some of the main reflectors used are classified according to their facets into (a) flat, (b) dihedral, and (c) trihedral, with the latter classified into four categories: (i) square, (ii) cubic, (iii) circular, and (iv) triangular [29,30]. Although triangular trihedral corner reflectors (TTCRs) have the lowest RCS of all the aforementioned shapes, it is the most commonly used due to its structural rigidity, simplicity of installation, and requiring less material for construction. However, its most significant advantage is its tolerance to angular errors (orientation and inclination towards the satellite) as even if it is misaligned by 20° (in azimuth and elevation angle), the RCS loss will be 3 dB from its highest value due to the reflector having a 3 dB beamwidth of approximately 40° [24]. A TTCR with a side length of 1.5 m is generally suitable for satellite C-, L-, and X-bands. For optimal performance, it should be realigned each time a satellite with a different sensor makes a pass. To be useful for both the ascending and descending pass of a SAR satellite, two CRs with approximately opposite orientations need to be installed in the same area.
Considering the details described previously, the CRs used in CyCLOPS were chosen to be triangular trihedral with 1.5 m of inner length dimensions to support all SAR missions. Changes in the RCS depend on the azimuth and elevation angle; thus, a TTCR should be oriented during installation so that the azimuth and elevation angle of its phase centre (the apex originating from the point where the three triangular sides meet) align with the LoS of the SAR satellite [28]. This ensures that the reflector optimally reflects the radar signal back to the satellite sensor, maximizing the RCS and making the reflector effectively visible in SAR images for precise calibration and analysis purposes. A TTCR can be considered as an object whose RCS is determined by the aperture of its face. Consequently, the orientation angle is expressed as follows:
θ = π 4   o r   45 °
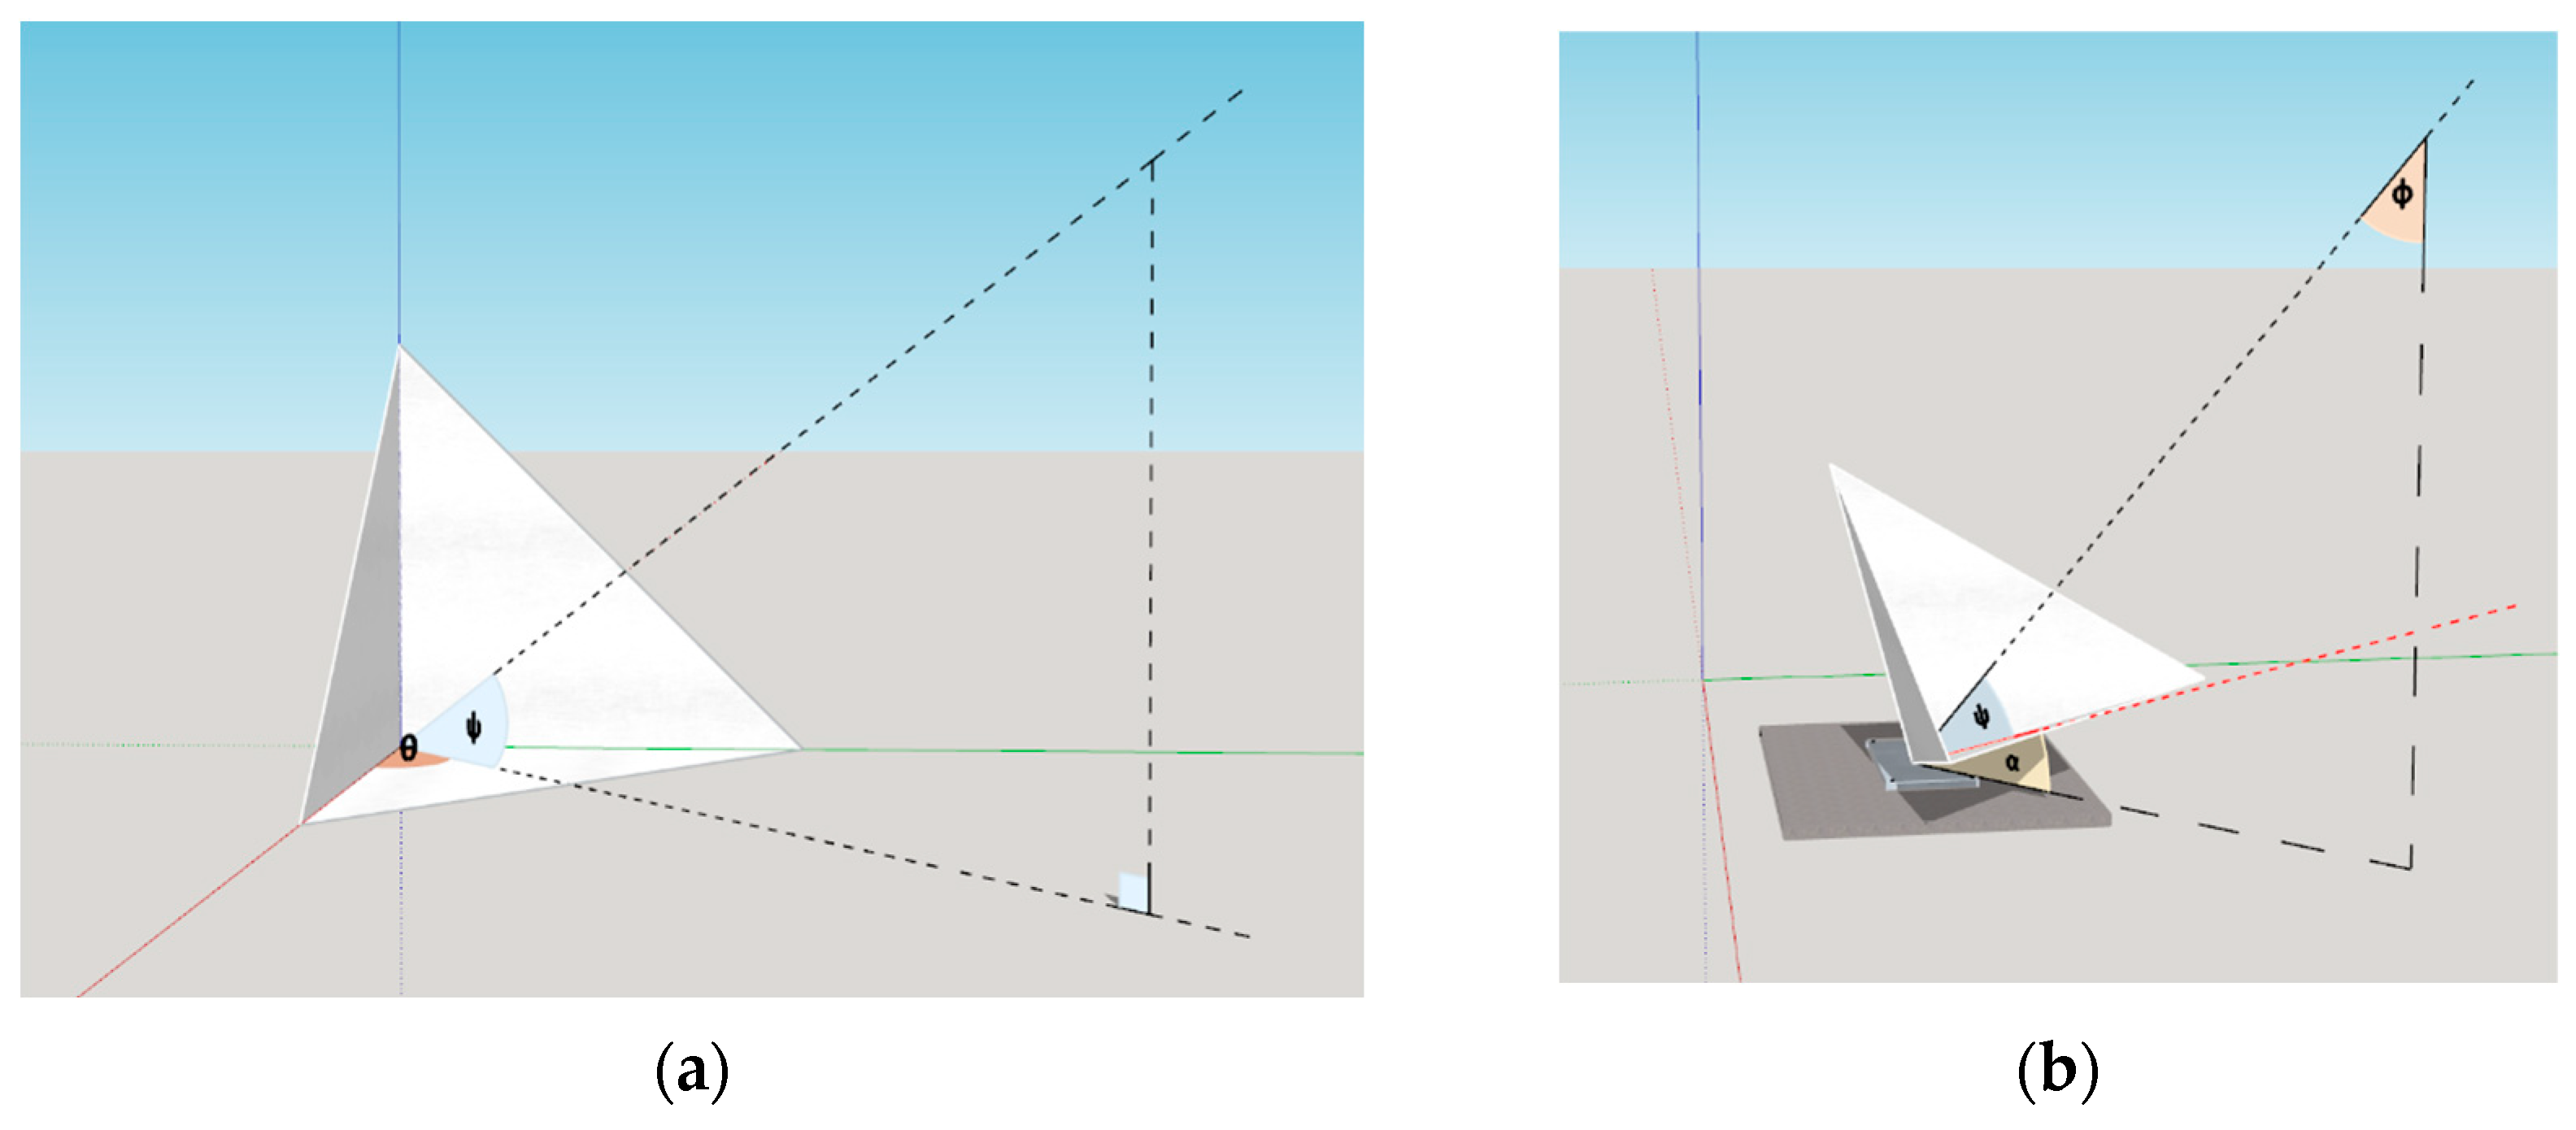
This expression accounts for how the reflector’s orientation towards the incoming radar wave impacts its effective RCS, optimizing its reflection characteristics for accurate radar detection and imaging. Moreover, the radar’s electromagnetic wave is considered perpendicular to the open face when the elevation angle of one of the three sides of the reflector is as follows (see Figure 5a) [31]:
ψ = tan 1 1 2 = 35.26 °
Consequently, as shown in Figure 5b, for a given nadir angle φ, the TTCR must be inclined at an angle α from its baseplate to achieve the maximum RCS. This specific alignment ensures the reflector is positioned to optimally redirect the radar signal back towards the sensor, exploiting the geometric structure for enhanced signal strength and visibility in radar imaging.

2.4. SAR Calibration Using Point Target Analysis

Point Target Analysis (PTA) involves the calculation of the quality parameters of a point target, in the exact position within a pixel. In SAR imagery, a point target’s response appears as a 2D sinc-like Impulse Response Function (IRF) in both range and azimuth dimensions [32]. A CR is typically the preferred choice for representing an ideal point target or scatterer (p). When considering SLC images in the zero-Doppler geometry, the phasor measurement yp, which can be expressed with Equation (9) below, for each resolution cell Rp that predominantly contains a point scatterer p, comprises both a real component Re{yp} and an imaginary component Im{yp} [33].
y p = R e y p + j I m y p = i R p A i exp j ψ i
These signal components represent the coherent summation of backscatter from the point scatterer and the scattering contributions from its surroundings (i.e., clutter) within the same Rp, where A is the amplitude, and ψ is the phase. Concordantly, A and ψ are the signal’s components, both stored in an SLC raster image and expressed as real and imaginary components of a complex number.
Combining the range and azimuth responses, the data captured by a SAR from an individual scatterer in the scene form an extended two-dimensional function. The extent of the data in the range direction is governed by the transmitted pulse’s duration, while its azimuth extent is defined by the azimuth beam width, determining the duration for which the scatterer remains within the azimuth beam. As the SAR images a scene, the data it records represent a coherent sum of these responses, each overlapping from every scatterer present within the scene [34].

2.4.1. Impulse Response Function

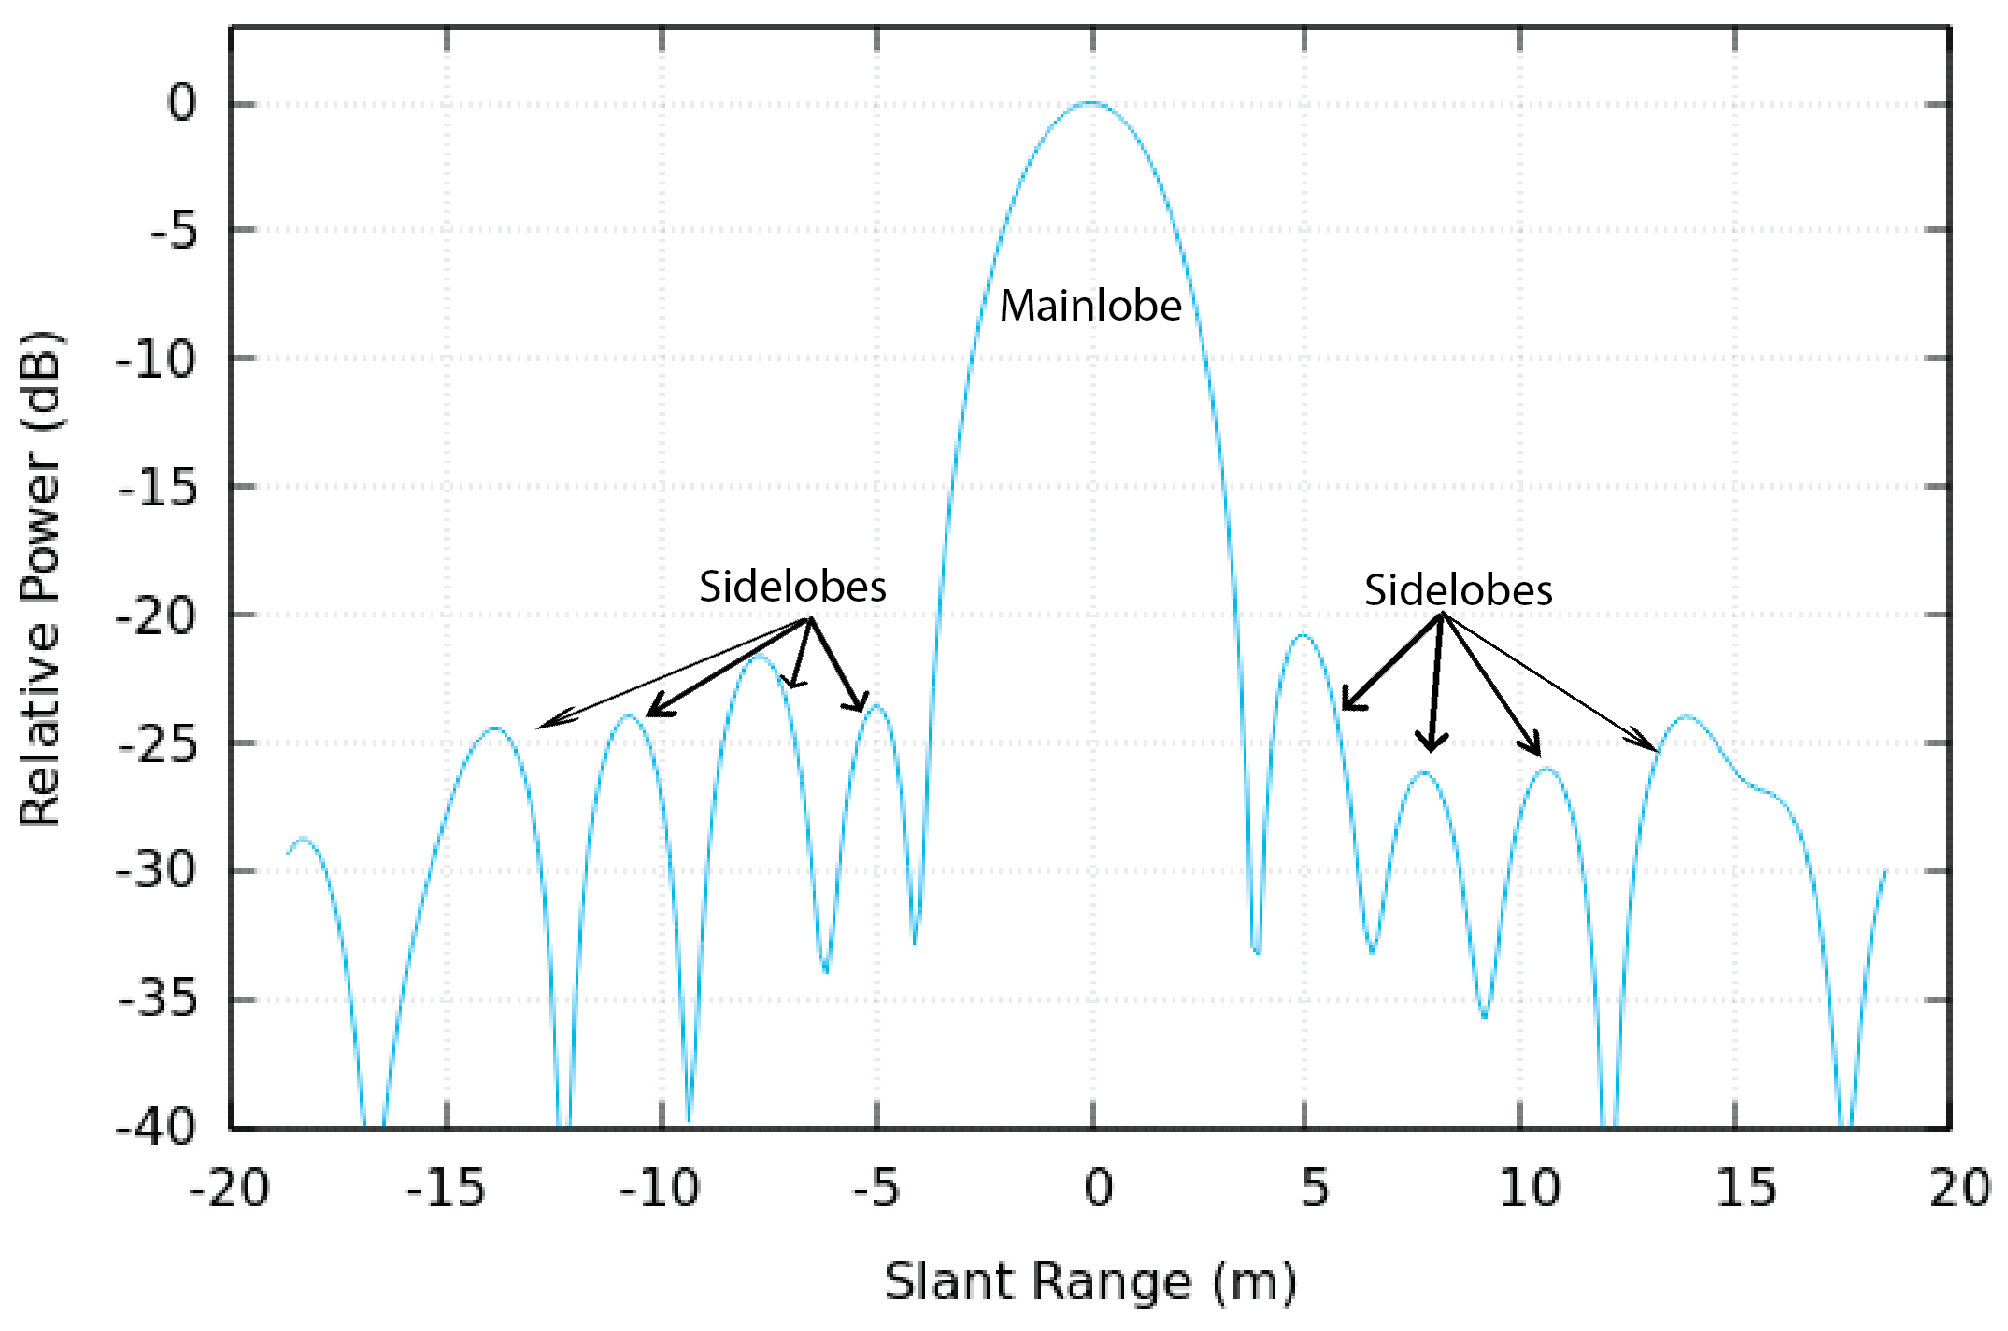
The IRF in SAR imagery, also known as the point-spread function, depicts the two-dimensional luminosity pattern of a point scatterer, like a CR or a transponder, in post-processed images. The response, originating from a single point scatterer, undergoes transformation during the image formation process. This transformation involves correlating the extended response in the range direction with a copy of the azimuth response, converting this extended response into a point. The result of this correlation process, in either the range or azimuth direction, is a sinc function [34]. The magnitude of this function is depicted in Figure 6. The mainlobe of the sinc function encapsulates the dominant energy and indicates its width. However, a notable characteristic of the sinc function is the presence of sidelobes, which cause the energy of the response to disperse away from the location of the scatterer. The peak sidelobe response or the integrated sidelobe energy are commonly utilized as metrics to evaluate the significance of these sidelobes in causing distortions in the image.
The IRF’s −3 dB width determines the spatial resolution, while the sidelobes offer insights into SAR instrument and processor performance. Key image quality metrics include spatial resolution (a −3 dB width of the peak lobe), the Peak Sidelobe Ratio (PSLR), and the Integrated Sidelobe Ratio (ISLR), all derived from the point target’s IRF [3]. These metrics are typically considered adequate for assessing the impulse response performance and are evaluated against previous estimations to determine how the image quality aligns with product specifications. Table 1 lists standard S-1 IW Level-1 SLC product characteristics as defined in the ESA S-1 product definition [35].
The peak of the point target is situated at the central pixel of the data segment, as identified by the image coordinates. The images are oversampled by a factor of 16 using zero-pad Fast Fourier Transform (FFT) interpolation, a technique which is used to generate spatial samples at a finer sampling grid [36], resulting in an oversampled point target image with dimensions of 256 × 256, originating from a 16 × 16 image. Consequently, the dimensions of the interpolated image are dictated by the magnitude of the oversampling factor. The IRF is calculated after compressing (in range and azimuth) the scattered signal received from each TTCR, as described in [37].
The temporal variation in the (a) spatial resolution and (b) the sidelobe level from each TTCR is obtained by analyzing the values from the abovementioned IRF estimations. The most important segments for the IRF analysis of the TTCRs can be illustrated as the following Figure 7.
Among the three aforementioned parameters, spatial resolution, which refers to the minimum distance at which two distinct objects on the ground surface can be discerned as separate entities in an image, is the most critical in assessing image quality [38].
  • Spatial Resolution in SAR imaging
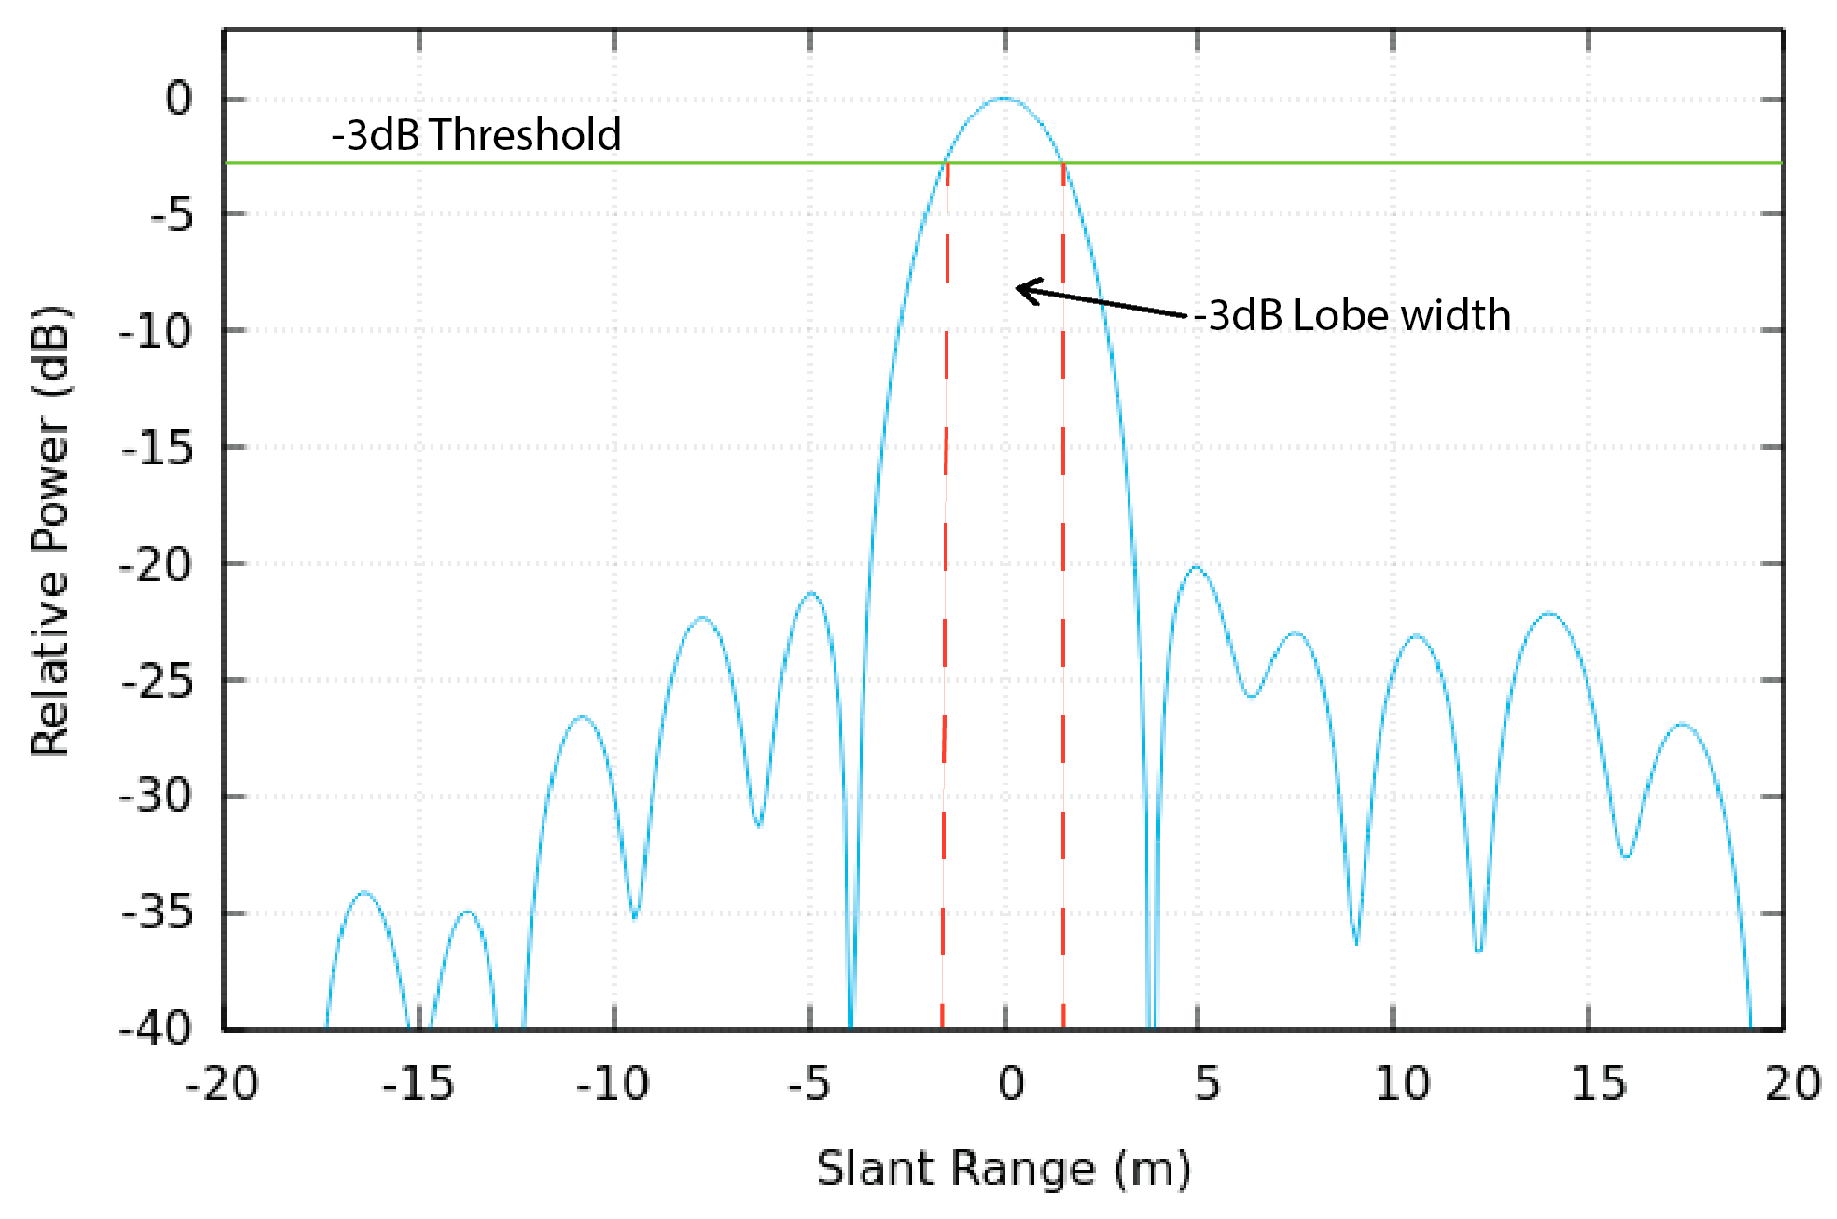
Spatial resolution in range and azimuth directions is defined by the width of two points at the −3 dB mainlobe [39]. Referring to Figure 8, for instance, a relative power of −3 dB (y-axis) represents a width of 3.1 m (x-axis) in range.
Following the extraction of the profiles along range and azimuth directions, the spatial resolution (Rgres, Azres) is measured from the profiles, as the −3 dB lobe width (Δpix). The latter can then be converted to resolution values (metres) according to Equations (10) and (11) below [39]:
R g r e s = Δ p i x c 2 f s R g
A z r e s = Δ p i x c 2 f s A z
where c is the speed of light, and f s R g ,   A z is the sampling frequency along the range and azimuth, respectively.
2.
Sidelobe Level
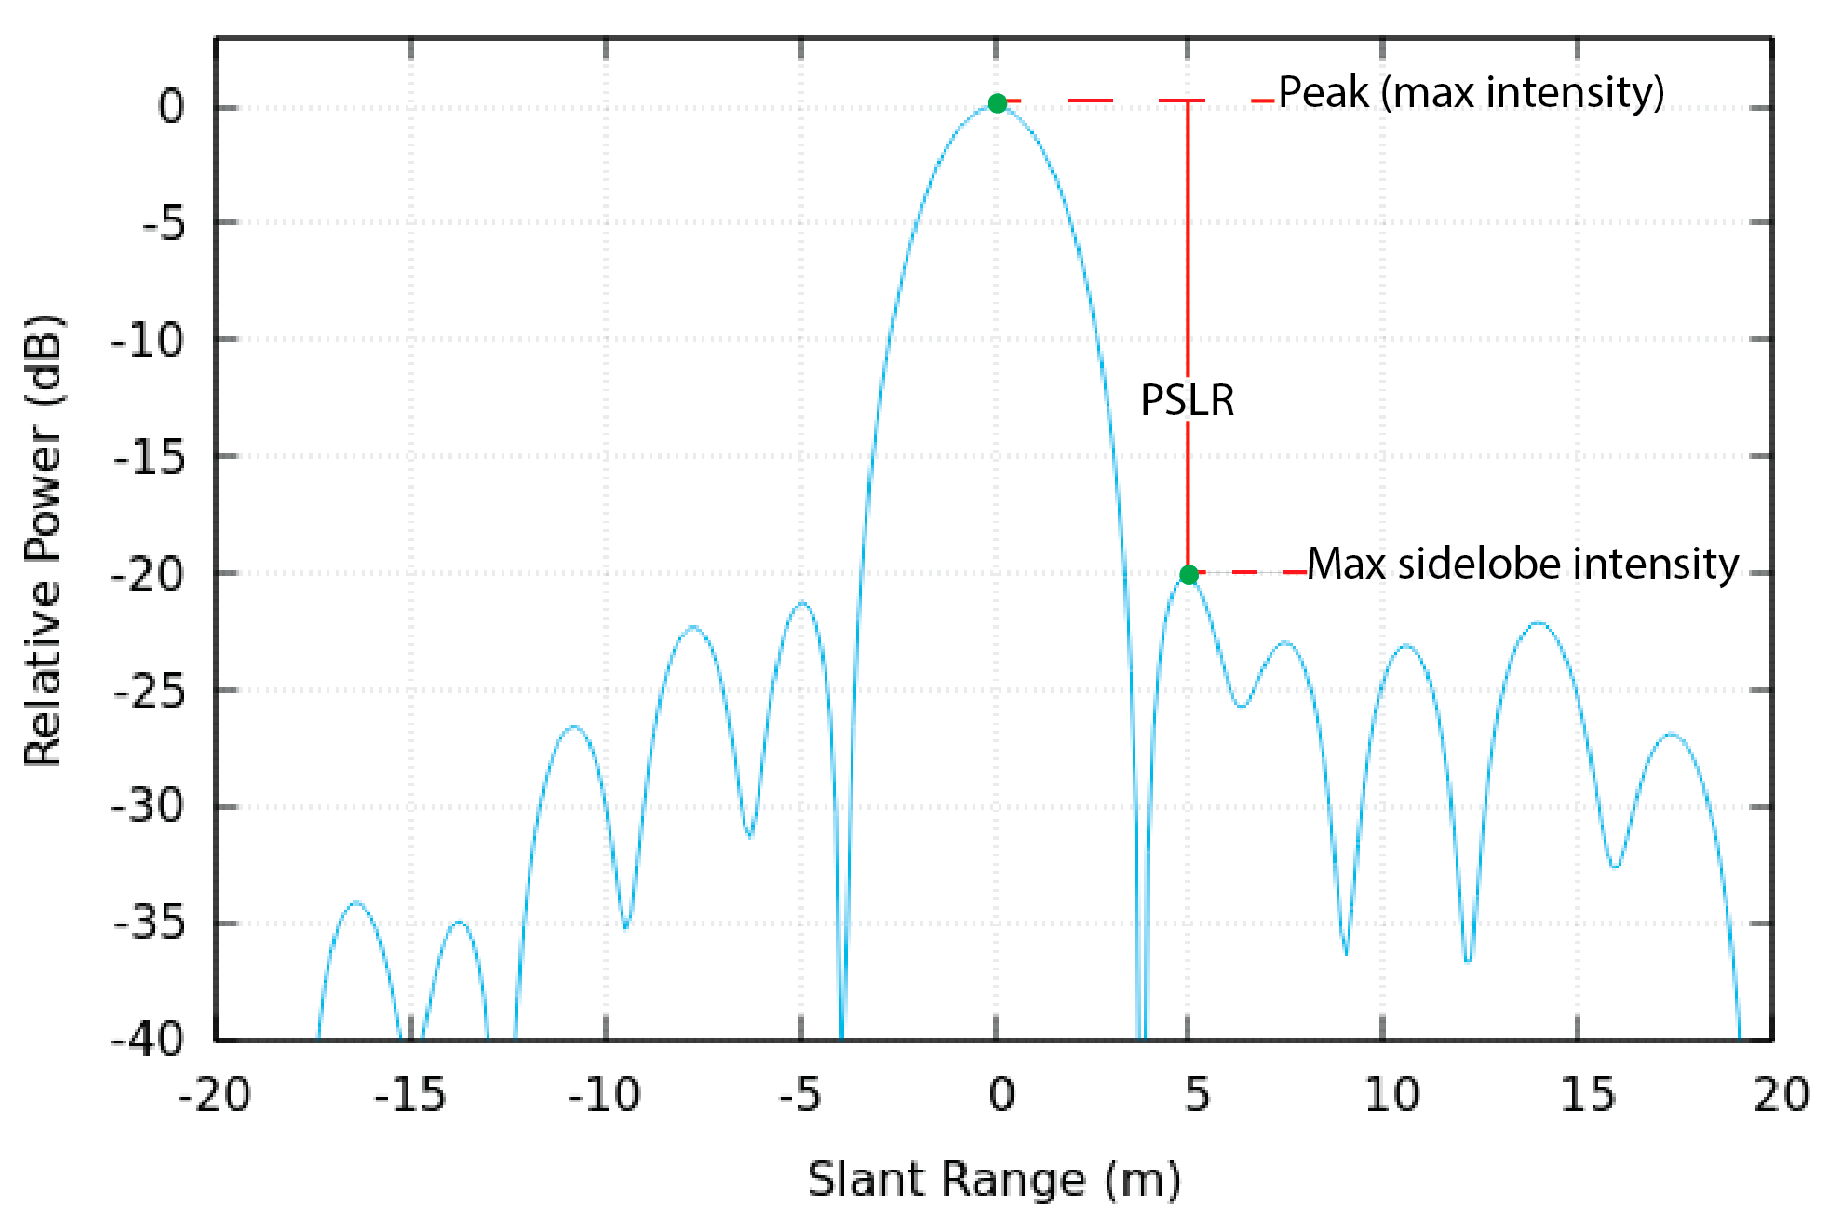
Controlling the intensity of the sidelobes is the second parameter that can be measured and compared against the theoretical values. The PSLR (see Figure 9) is defined as the ratio of the maximum (peak) intensity of the mainlobe to that of the most intense sidelobe in the IRF, representing the contrast or clarity between adjacent point targets [3], and is calculated as follows:
P S L R = 10 log 10 m a x { | E P e a k | 2 } m a x { | E S i d e | 2 }
where E is the maximum energy in the mainlobe (peak) and sidelobe (side) areas, respectively.
The mainlobe peak is estimated according to the two adjacent resolution cells of the peak point location, whereas the sidelobes’ peak is estimated within an area of 10 × 10 resolution cells, excluding the 2 × 2 mainlobe cells.
The third image quality estimate is the ISLR which is defined as the ratio of the sidelobe energy to the mainlobe energy of the response, indicating the capability to detect a weak target’s response near highly reflective targets. In particular, the sidelobe energy is calculated within an area of 20 × 20 resolution cells, excluding the mainlobe; thus, nine resolution cells to the left and to the right of the mainlobe are measured. The ISLR measures the relative reflectance of the sidelobes in comparison to the mainlobe, providing an assessment of the overall image quality and target distinguishability [40], and is calculated in the range and azimuth as the following Equations (13) and (14) below [38,39,41].
I S L R R g = 10 log 10 P e a k | E ( R g ) | 2 d R g S i d e | E ( R g ) | 2 d R g
I S L R A z = 10 log 10 P e a k | E ( A z ) | 2 d A z S i d e | E ( A z ) | 2 d A z

2.4.2. Radar Cross-Section

The RCS of TTCRs is used to evaluate the form of the impulse response. The signal returns from CRs can be considered completely coherent as the radar backscatter behaviour, under specific viewing geometries, is like a Dirac delta function [3]. The RCS of each TTCR was measured in every SAR image and compared to the theoretical value to calculate the mean RCS for evaluation. Furthermore, this comparison aims to derive the absolute calibration factor that can be used for the radiometric calibration [13,14,42] of the S-1 IW mode and sub-swaths. The theoretical maximum RCS (RCST) at the C-band of a TTCR of 1.5 m is equal to 38.378 dBm2 and is derived by Equation (15) [23,26,29,43,44]:
R C S T = 10 log 10 4 π a 4 3 λ 2  
where α is the inner-length dimension of the TTCR, and λ is the signal’s wavelength. The estimated RCS values should not be greater than the RCST. Moreover, another important consideration to note is the minimum suitable RCS value, which for a SAR image of a pixel spatial resolution of 100 m2 is at least 34 dBm2 [24]. In general, for SAR images with the aforementioned ground range resolution, the RCS of a target suitable for radiometric calibration at C-band should fall within the range of 34–38 dBm2 [24].
The RCS estimation can be performed either with the integral method [43] or the peak method [45]. On the one hand, the peak method necessitates the resolution parameters of the point targets, making its performance reliant on the quality of the point target image, such as its clarity and system focus, for precise calibration factor determination. On the other hand, the integral method is recommended since it is independent of point target parameters, meaning that it does not rely on system focus [45,46]. In particular, the peak method calculates the energy of a point target by multiplying the peak intensity (corrected for the sensor noise and clutter) with the resolution cell represented by an equivalent rectangular area (Δaz/rg), the same as the volume under the IRF, and is calculated as follows [26,43]:
R C S β 0 · Δ a z Δ r g
On the other hand, the integral method involves integrating the impulse response to obtain the energy, as follows [3,29,43]:
R C S I C R C F P A A σ 2
where CF is the relative power ( = 1 ( 1 + I S L R ) ) in the point target sidelobes, ICR is the total power in the point target IRF mainlobe (corrected for the clutter), and PA represents the product pixel area (not the pixel resolution). The clutter power is estimated from four separate quadrant areas located outside the IRF cross-shaped area, based on the assumption of spatial ergodicity, which suggests that spatial properties are uniform across these areas.

2.4.3. Signal-to-Clutter Ratio

The large RCS is required to ensure adequate visibility above the clutter. One measure of visibility is the Signal-to-Clutter Ratio (SCR) which can be used to predict the peak position variance, the expected localization limits, and the InSAR phase variance. Typically, for the radiometric calibration of SAR images, the SCR estimation of a CR must be at least 20 dB to reduce errors in calculating the calibration factor, and it is also important to ensure that the signal does not become saturated [3]. The SCR can be estimated by using the two aforementioned methods [29,32]. Hence using the spatial estimation method (i.e., the integral), the SCR can be estimated as the ratio between the point target energy (corrected for clutter) and the ensemble average clutter energy (Icl) per pixel (Pcl):
S C R = I C R I c l P c l R C S C R < R C S c l >
The described method provides an immediate estimation of the SCR. However, this approach of spatial ergodicity often fails for CRs situated in locations with less-than-ideal clutter conditions [33,47]. Those “difficult” environments (other than large areas with flat terrains) can affect the accuracy of the SCR estimation, as the clutter characteristics may vary significantly within these areas.
The temporal estimation method, as proposed by [33], is the second approach used to determine the SCR response. This method computes the average SCR by analyzing a time series (>20 images) of the CR’s RCS responses using the peak method. It also involves estimating the maximum likelihood (ML) for the average RCS (μ) and clutter, as described in [33]. This method is useful for differentiating between the clutter and the CR’s contributions, as it utilizes two key parameters. The first parameter, denoted as μML, when multiplied by the area of the resolution cell, gives the RCS of the CR. The second parameter, σML, indicates the clutter’s energy when the CR is installed, assuming the statistical properties of the clutter remain relatively constant over time. The ratio of these two parameters, as defined in Equation (19) below, provides an estimate of the SCR.
S C R ^ = μ M L 2 ^ 2 σ M L 2 ^ R C S C R β 0 c l Δ r g Δ a z

2.4.4. Slant Distance Error in LoS

A persistent scatterer is a pixel that maintains phase stability for extended periods [48]. When a single bright scatterer dominates the backscatter signal, those pixels are more prone to exhibit stable phase behaviour and, thus, more likely to be classified as persistent scatterer pixels. As an artificial persistent scatterer, a CR should have a low variance of the phase values. Nevertheless, the pixel value containing the CR results from a complex sum of the backscatter signal contributed by the CR, which is the dominant scatterer, and the distributed individual scatterers within the pixel.
This contribution of clutter to the pixel response results in an uncorrelated signal, and the probability density function (PDF) for the phase error (φerror) magnitude of a CR can be estimated by its SCR [24,30]. Note that when using a CR for SAR image calibration, the phase standard deviation (i.e., phase error) should be less than 0.25 radians so that the phase residuals can be assumed to be normally distributed and the SCR phase variance estimate unbiased [24,47,49]. The effective φerror is defined as follows:
φ e r r o r = 1 2 × S C R
Subsequently, by computing φ e r r o r for a single CR in each SAR image, the total standard deviation of φ e r r o r for the specified CR can be derived. Concordantly, by using λ, the radians of the φ e r r o r angle can be converted to an LoS slant distance error (i.e., displacement error in LoS) as follows [29,47]:
h e r r o r = λ × φ e r r o r 4 π
Therefore, for an SCR of 20 dB, the theoretical dispersion threshold for herror in C-band is approximately 0.31 mm. This is derived by expressing the SCR in natural values, instead of decibels, which is 10 log 10 S C R = 20   d B . By dividing both sides by 10, then, log 10 S C R = 2 . Now, the logarithmic equation can be converted to an exponential equation. The base of the logarithm is 10, and since log 10 x = y is equivalent to 10 ( y ) = x , we have 10 ( 2 ) = S C R = 100 .

2.4.5. Geolocation Analysis

For the effective identification of a CR in a SAR image, and specifically for pinpointing the pixel coordinates of its peak intensity, it is essential to ensure the sufficient visibility of the CR against the clutter background. This requires an adequate SCR response (>20 dB). Such a response is useful for estimating the limit of the expected location measurement accuracy, as outlined in Equation (22). The SCR of the point target is multiplied by both the slant range and azimuth resolution parameters, according to product specifications, as reported by [26,50,51,52].
σ r g , a z = 3 π 2 × Δ r g , a z S C R Δ r g , a z × 0.39 S C R
where Δ r g , a z is the specified resolution in the slant range and azimuth, respectively.
The primary positioning in SAR data is expressed in a two-dimensional radar datum of range (χ) and azimuth (y) pixel coordinates, which are transformed to slant range time and azimuth time. These coordinates are associated with the zero-Doppler geometry. The latter is essential for accurate SAR imagery interpretation and is governed by the range–Doppler equation [26,52]. The S-1 SLC image products, specifically, adhere to this zero-Doppler geometry convention. Consequently, the annotated two-dimensional coordinates on SAR images create an orthogonal raster where each range line of the ground point targets’ phase centre (in ITRF) corresponds to a single azimuth time, linked to the satellite’s phase centre and position and velocity vector.
The degree to which an SLC image product adheres to these equations in terms of accurately reflecting true ground positions determines the geolocation quality and, therefore, the geometric accuracy of the SAR system. The difference between the true position of a point target on the Earth’s surface and its estimated position of the peak intensity in the image (range and azimuth) can be named as the geometric location accuracy of a pixel in the image, or absolute location error (ALE), and is defined as [15]:
A L E r g   s a m p l e s = C R r g   m e a s u r e d C R r g   e s t i m a t e d
A L E a z   s a m p l e s = C R a z   m e a s u r e d C R a z   e s t i m a t e d
The geolocation accuracy process can be accomplished by transforming time coordinates into pixel coordinates via Pulse Repetition Frequency (PRF) and Range Sampling Frequency (RSF) for azimuth and range, respectively [32]. This transformation and its reverse are pivotal for interpreting SAR data accurately, relying on the SAR orbit’s state vectors. Geolocation accuracy evaluates the precision of this transformation by comparing a target’s peak position in SAR data against its expected position derived from precise GNSS measurements, through inverse geocoding [39]. This process involves oversampling the SLC image, transforming estimated pixel coordinates into time coordinates, and accounting for atmospheric and ground motion errors. Note that when these errors ignored, it can result in inaccuracies in the one-way slant range measurements which can range between 3 and 4 m [53,54]. The comparison involves the following [26,29,53]:
3.
Oversampling the SLC image to accurately estimate the position of the target, which is expressed in range and azimuth time coordinates; thus, the estimated pixel coordinates of the TTCR are transformed into time coordinates.
4.
Inverse geocoding to extract the azimuth time at which the satellite obtains the image with the CR’s position.
5.
The final step entails the estimation of the location error in the radar time coordinate system which is defined as the difference between the measured position and the expected coordinates of the CR. These time differences can then be transformed into units of length, defining the ALE, following the process explained in [53].

3. Performance Assessment of TTCRs

A thorough site assessment was conducted to evaluate the image quality characteristics of S-1A, in terms of a PTA by means of CyCLOPS TTCRs. The methodology and the findings of the IRF, RCS and SCR estimations, phase stability, and absolute location accuracy from the evaluation process are presented below.

3.1. Image Quality Performance

The actual image quality performance was derived from a temporal assessment on TTCRs’ responses within the SLC images. One study [38] suggests that annual monitoring is adequate; however, this study has performed more frequent assessments—every three months—to ensure the consistency, validity, and reliability of quality parameters across different seasons. A total of twenty-six (26) Level-1 uncalibrated intensity images, with linear VV polarization, from 29 June 2021 to 18 October 2023, were used to periodically monitor the consistency and stability of the quality parameters. Subsequently, the IRF parameters in both the range and azimuth for each TTCR were calculated as defined in the CEOS standard definition, using the GAMMA software package version 1.1 [55]. In particular, the IRF is generated for each TTCR for all of the acquired images, by applying the integral method [43], keeping the clutter window size as large as the window used for extracting the point target, to maintain result reliability.
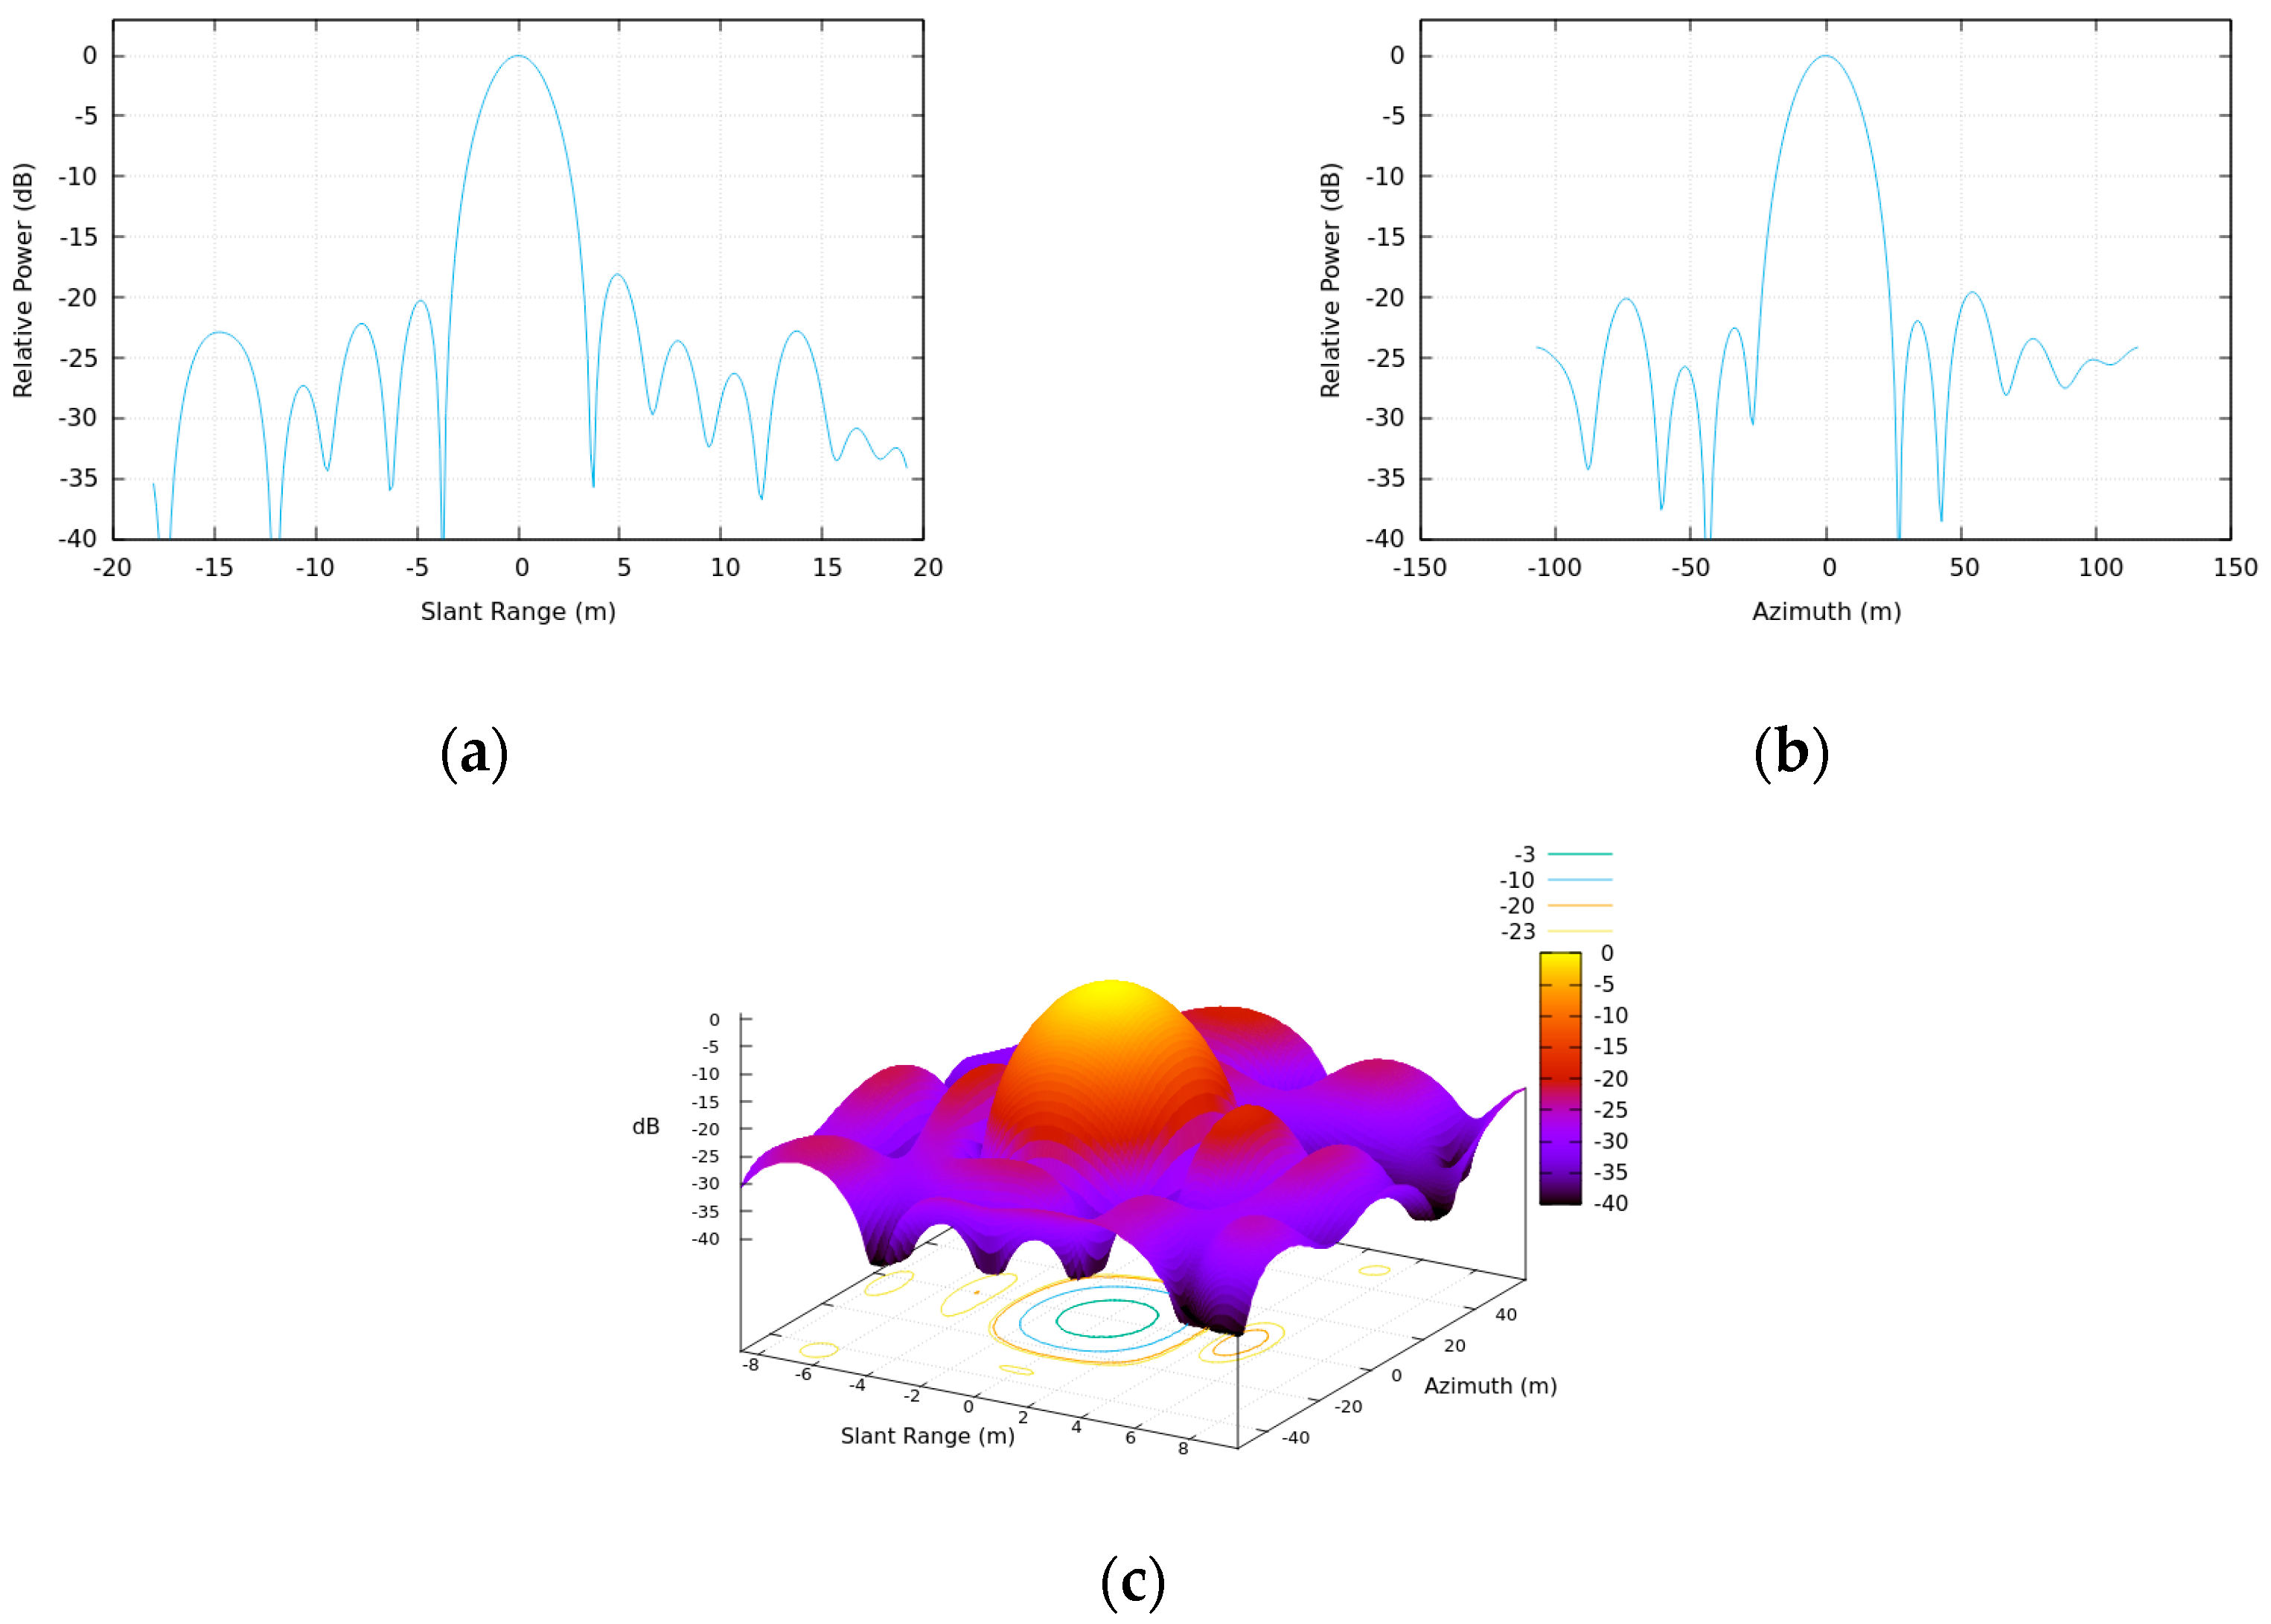
The representative example in Figure 10 and Figure A1 illustrates the impulse response for each TTCR for the acquired images of 17 October 2023 and 18 October 2023 (ascending and descending pass, respectively).
Finally, the temporal variation in the (a) spatial resolution and (b) the sidelobe level from each TTCR is obtained by analyzing the values from the abovementioned IRF estimations. The crucial segments for the IRF analysis of the TTCRs are illustrated in Figure 7 where the different rectangles define the IRF parameters, which were chosen and estimated according to ESA guidelines [25].
6.
Spatial Resolution
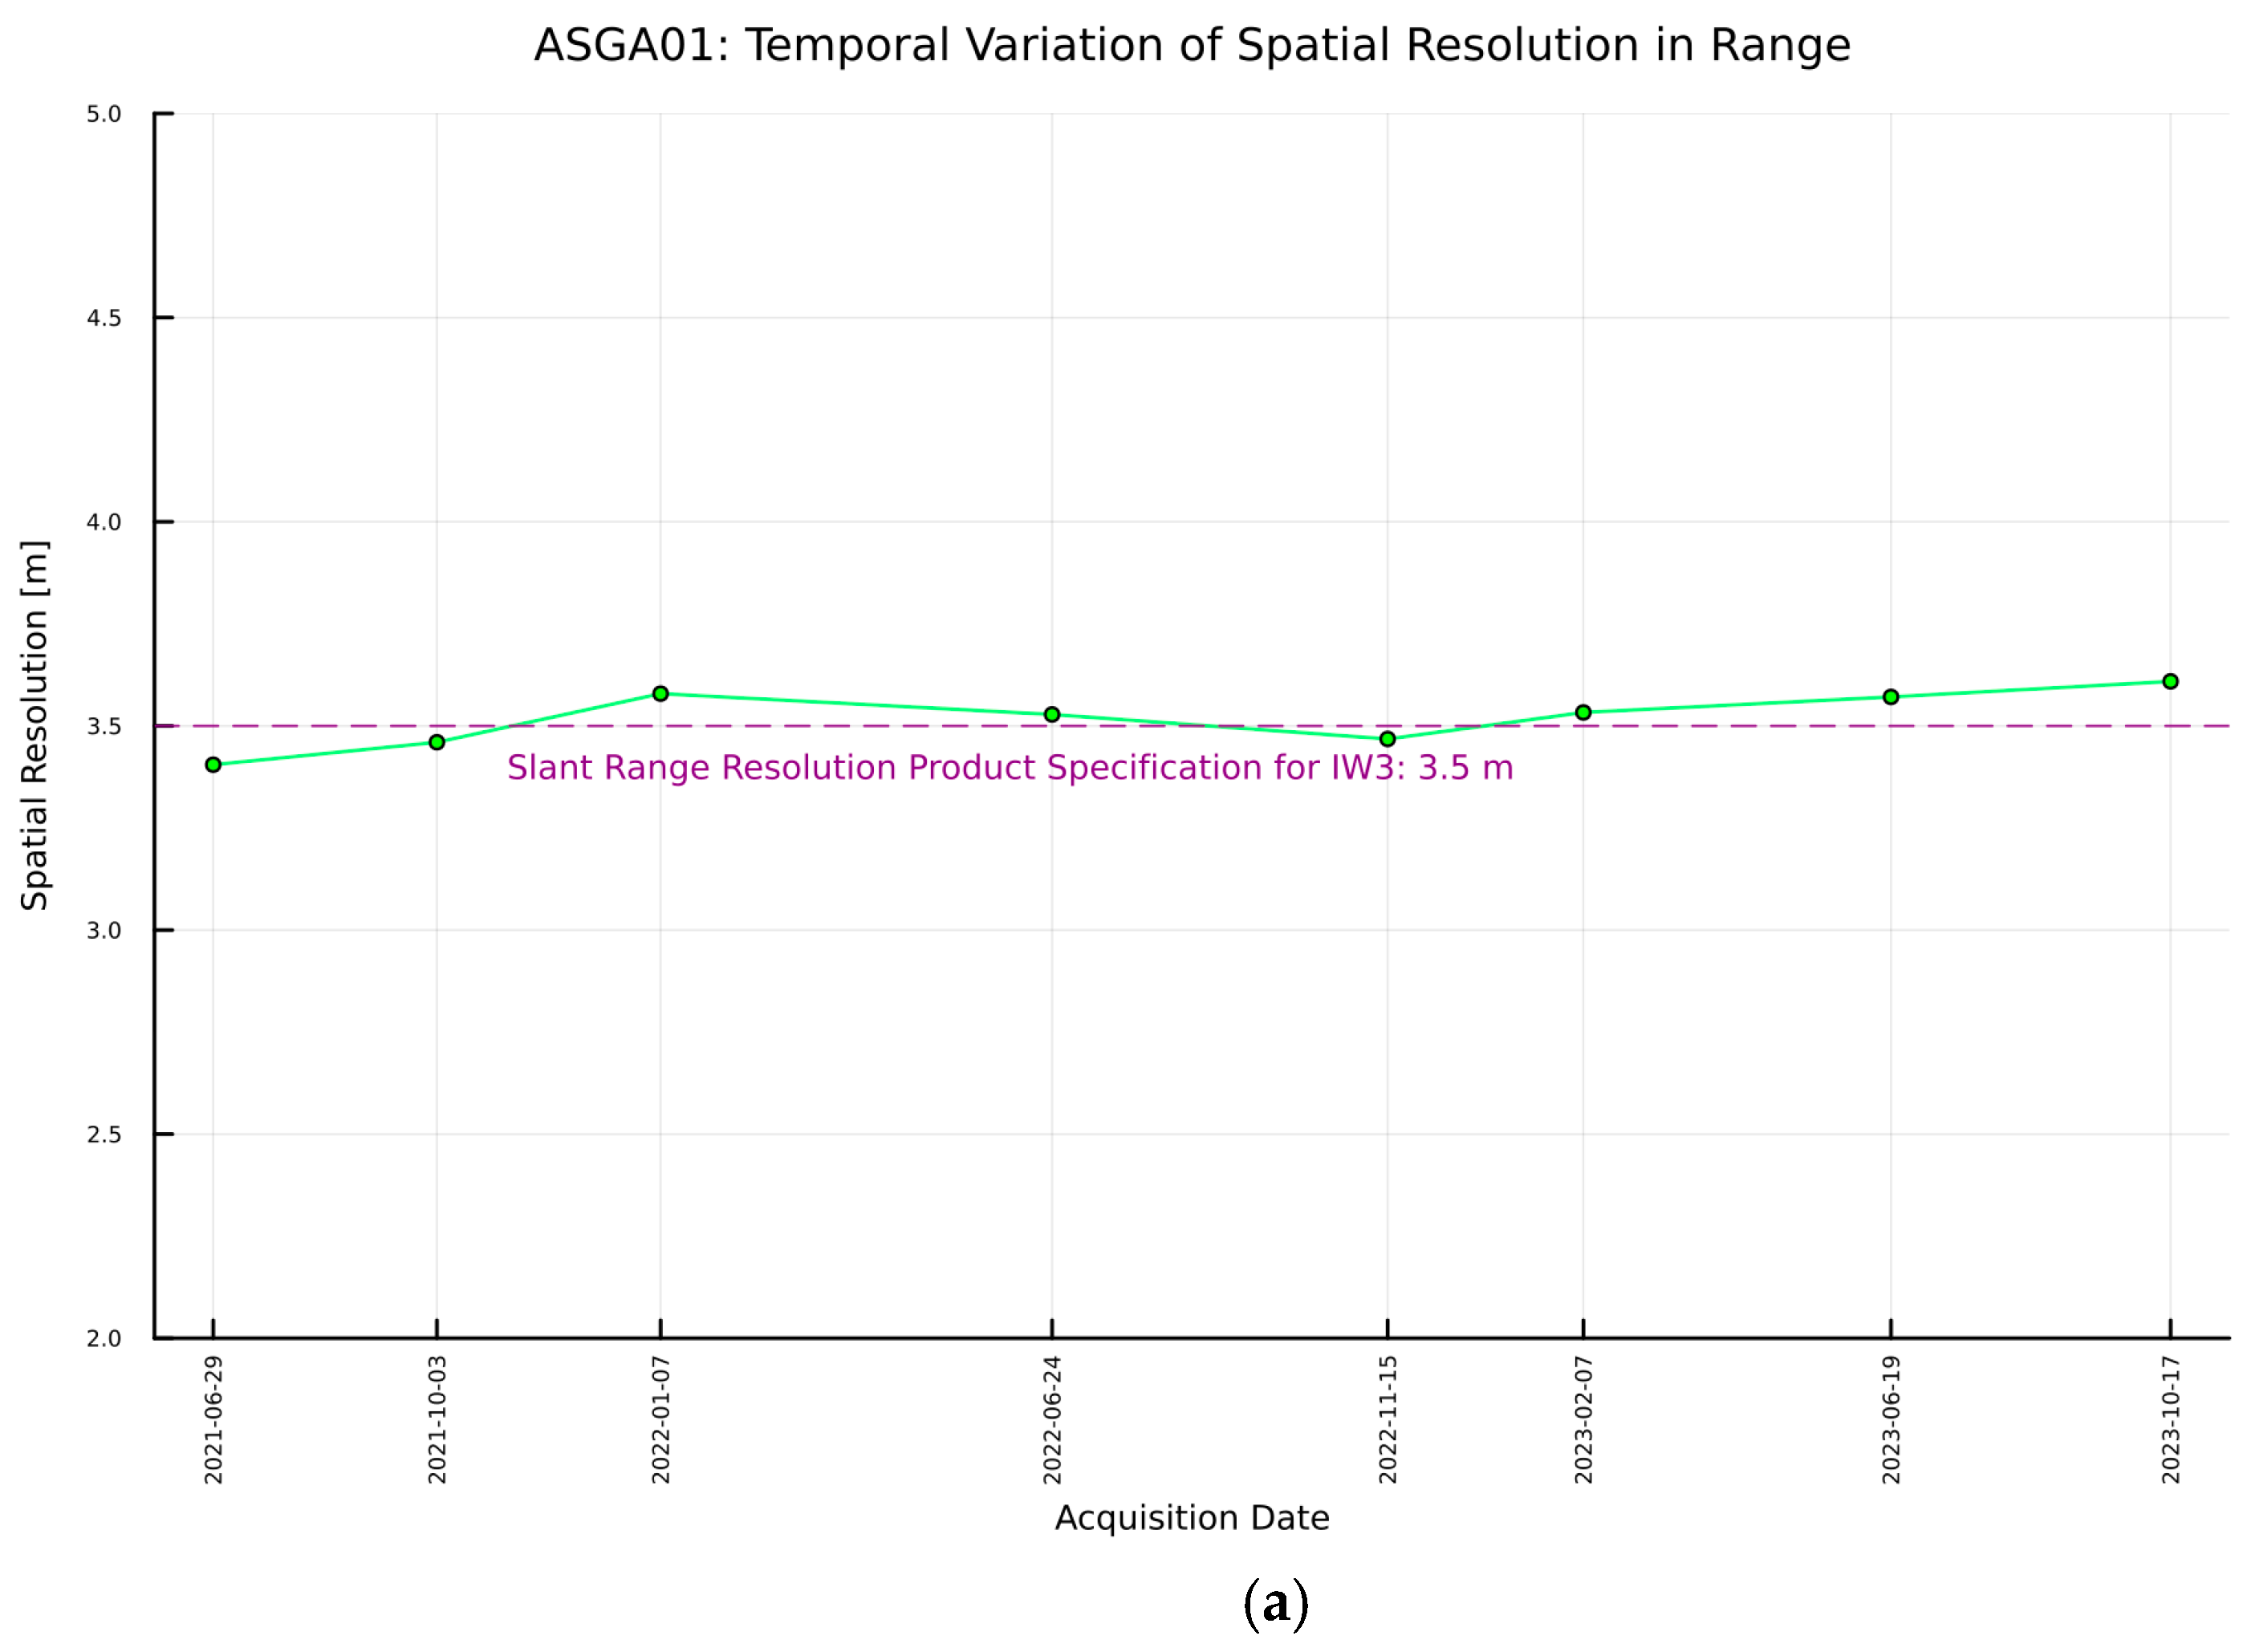
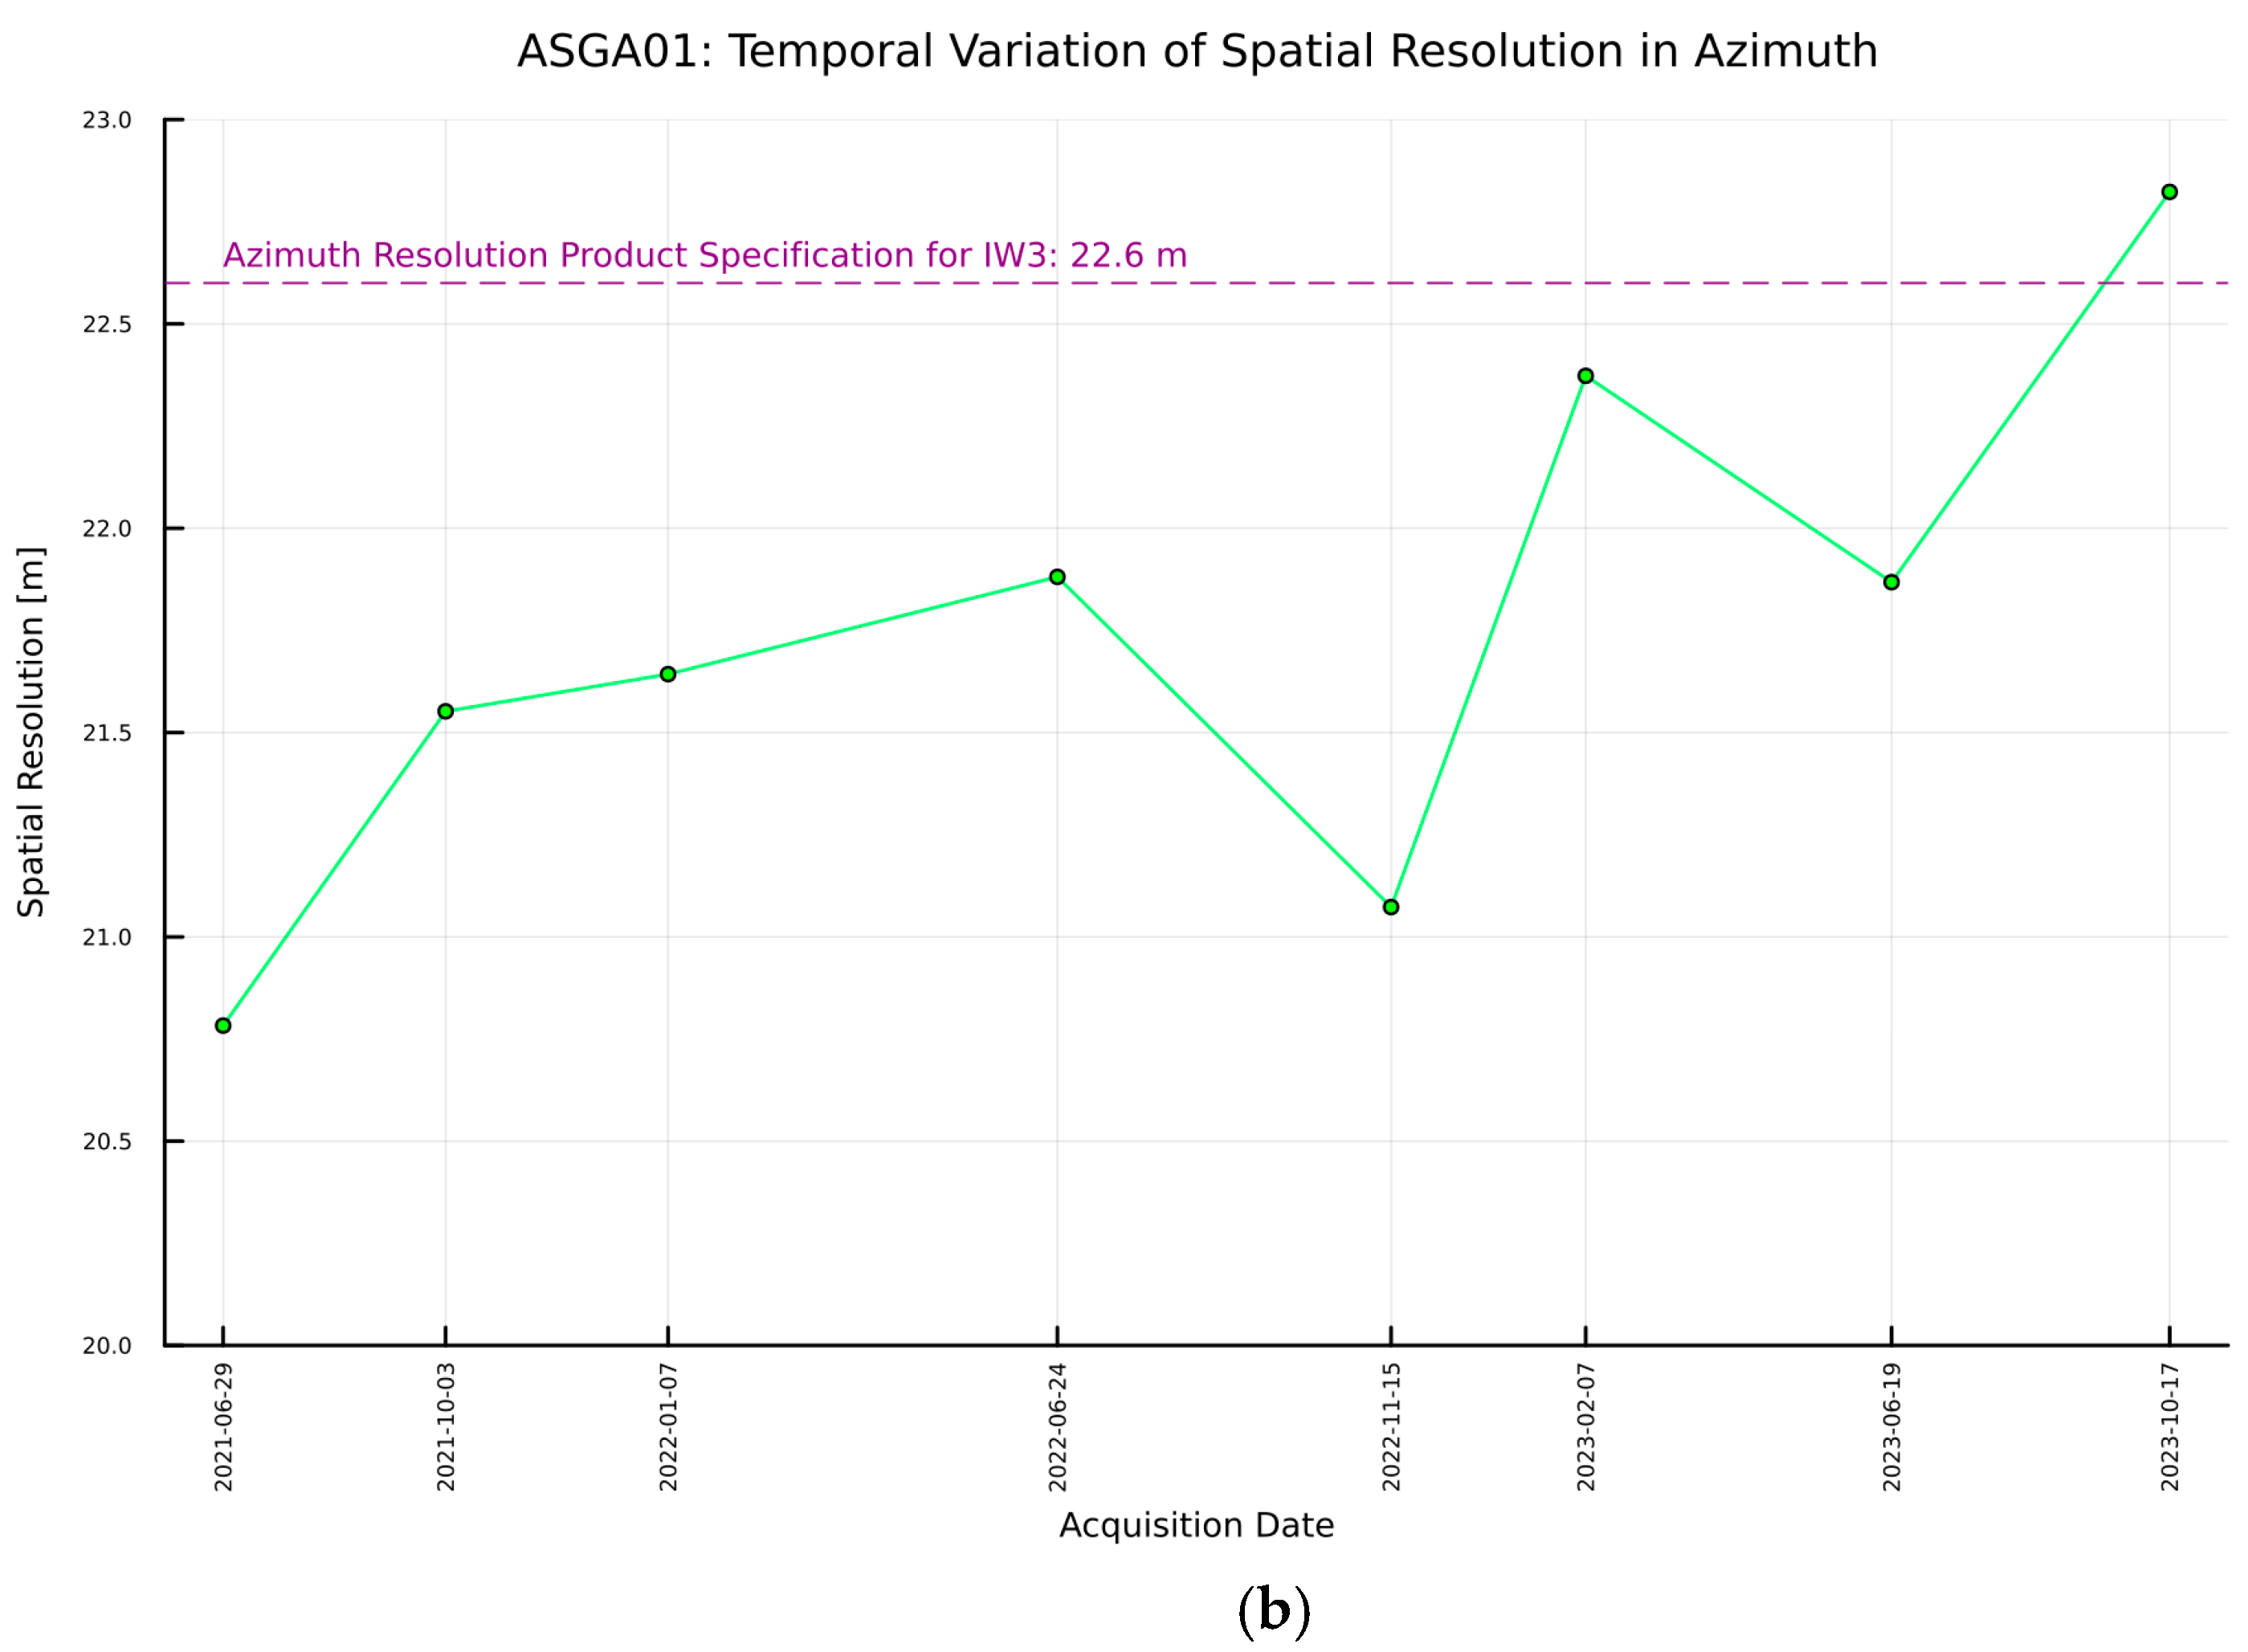
Subsequently, as described in Section 2.4.1, all the converted estimated values are compared to the theoretical characteristics of the SAR image reported in Table 1. A representative example of the temporal variation in the spatial resolution estimation from each TTCR in the ASGA site can be seen in Figure 11 and Figure A2 below.
The results indicate consistent and reliable spatial resolution, aligning with S-1 IW1, IW2, and IW3 sub-swaths’ specifications. The assessments across the sub-swaths (see Table 2) reveal that the TTCRs’ responses maintain consistency with theoretical slant range and azimuth resolutions. Discrepancies exceeding theoretical values suggest potential processing issues, such as inaccurate orbit data [39].
7.
Sidelobe Level
As described in Section 2.4.1, the ISLR is required for the calculation of the relative power in sidelobes, which is used in the basic equation of the SLC data for point target calibration. Table 3, below, provides the statistics of the ISLR estimation from all TTCRs.
The results indicate that the TTCRs were positioned in sites with a clutter below the threshold that would distort the CRs’ signature. Furthermore, the undistorted shape of the IRF demonstrates the quality of the image and the ability to clearly distinguish the target, thereby confirming the reliability of the assessed image quality parameters.

3.2. RCS and SCR Estimation

In order to conduct a comprehensive evaluation of the TTCRs, both the integral and peak methods were used, encompassing the two distinct S-1A SAR products; GRDH images were employed for the integral method, whereas SLC images were utilized for the peak method. Table 4 [35] provides a comprehensive overview of the products used in this paper for analysis. The calibration of the GRD images was performed with respect to σ0, while the SLC images were calibrated against β0. The RCS of each TTCR was estimated in every SAR image, using both methods, and compared to the theoretical value to calculate the mean RCS for evaluation.
Furthermore, the outcomes of these two methods were compared against each other. The methodology implemented for each method as well as the results derived are detailed in the following sub-sections.

3.2.1. Integral Method

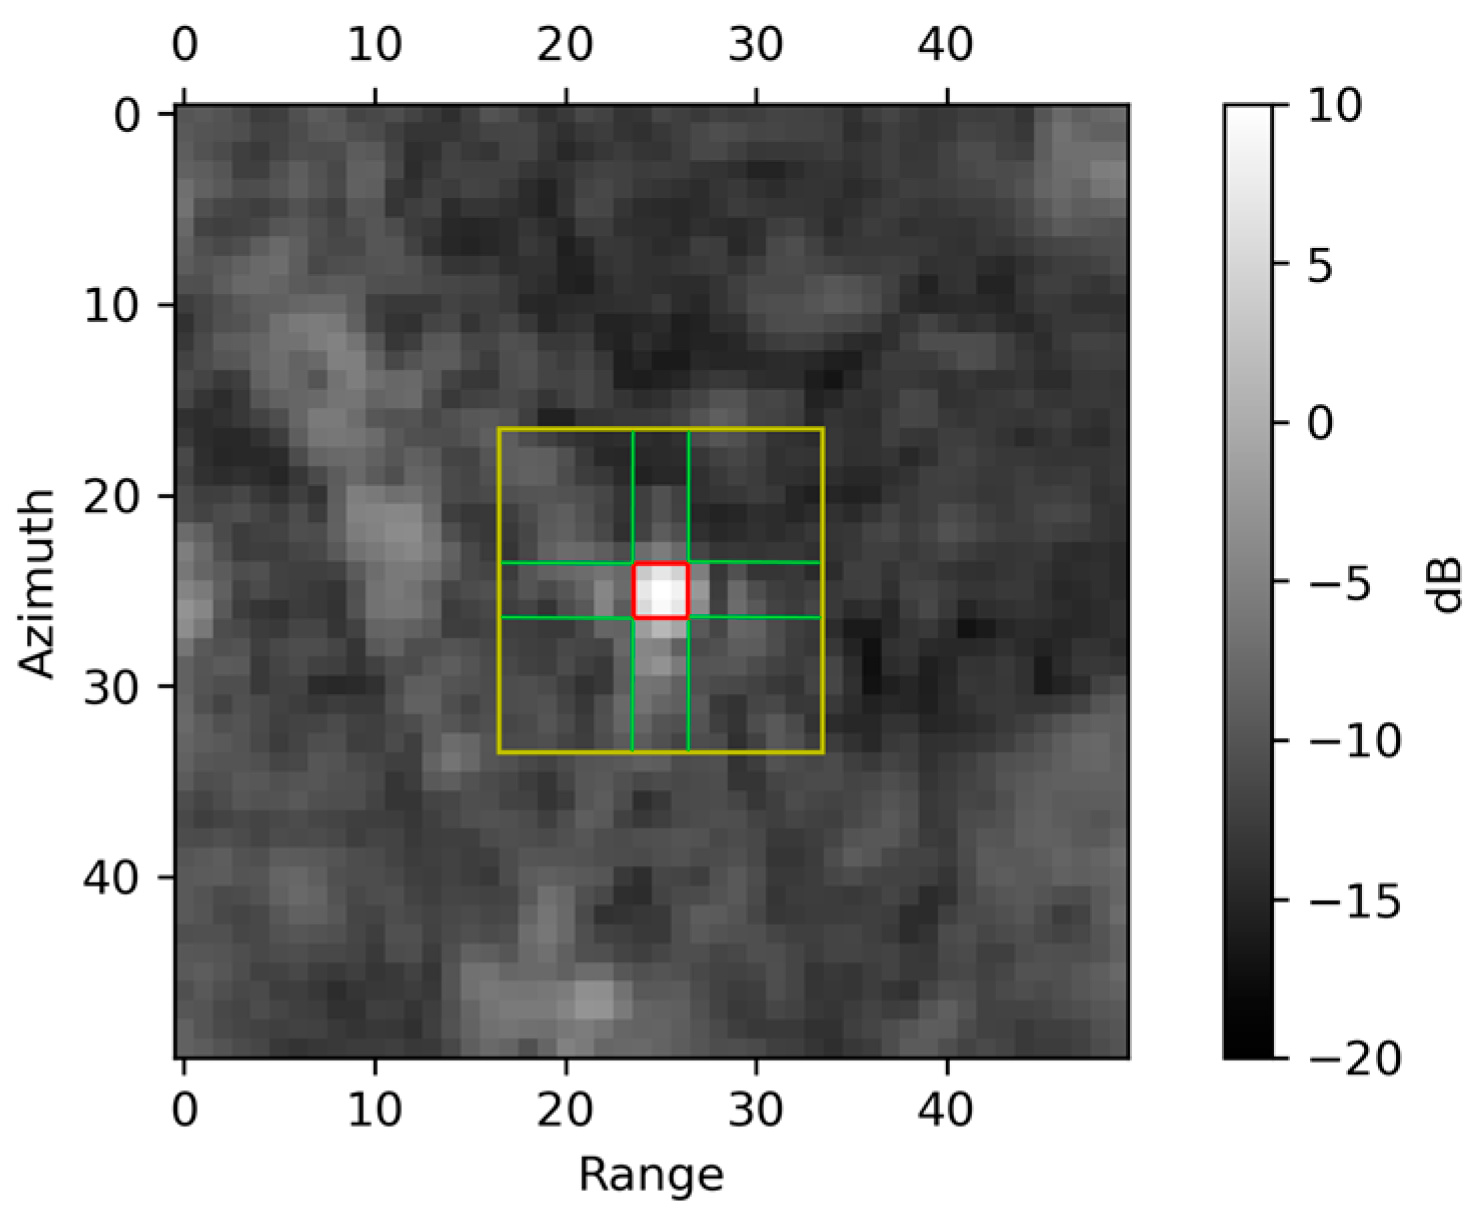
A total of 195 Ground Range Detected (GRDH) image products (IW swath, VV polarization), including both the ascending and descending pass, from 17 June 2021 to 26 July 2023, were processed for RCS and SCR estimation using the integral method, as the latter can be used in multilook images [43]. The responses of the TTCRs (see Figure A3) were calculated using the CoRAL library of tools [29], following the methodology described in [29]. The Level-1 GRDH products were downloaded from [56] using a python script. Because of the limited bandwidth of the transmitter and the finite duration that the ground remains within the radar beam’s view, the SAR signal is confined in both range and azimuth. Consequently, the CR’s point response is dispersed over multiple pixels, producing a signature resembling a cross [25,51]. To determine the total power, it is crucial to remove the background RCS contribution from the distributed scatterers over which the point target is superimposed. Hence, a square target window (see Figure 12) must be defined that includes the following: (a) a mainlobe containing the CR’s total power in the impulse response and (b) four adjacent clutter areas situated in the pixels surrounding the (c) sidelobe response of the target, containing the relative power in the point target.
The next step entails calculating the summed energy (Is) within the target window and the average clutter energy in the four clutter areas. The total energy of the clutter (Icl) is defined after excluding the pixels within the cross area. Finally, the corrected-for clutter energy of the TTCR (Icr) is calculated by subtracting the average clutter energy from the integrated energy as follows [29]:
I C R = I s I c I × P s P c l
where Ps and Pclutter are the number of samples (pixels) in the target window and clutter areas, respectively. Subsequently, the RCS of the TTCR can be calculated by using the equation below [57]:
R C S C R = 10 log 10 ( I C R × A )
where A is the illuminated area ground range resolution cell, which can be computed using Equation (2). Following the RCS estimation, target visibility and phase stability are vital when employing a CR for SAR calibration and/or InSAR analysis [3,13]. Assessing target visibility and phase stability is accomplished using the SCR, which is computed with Equation (18).
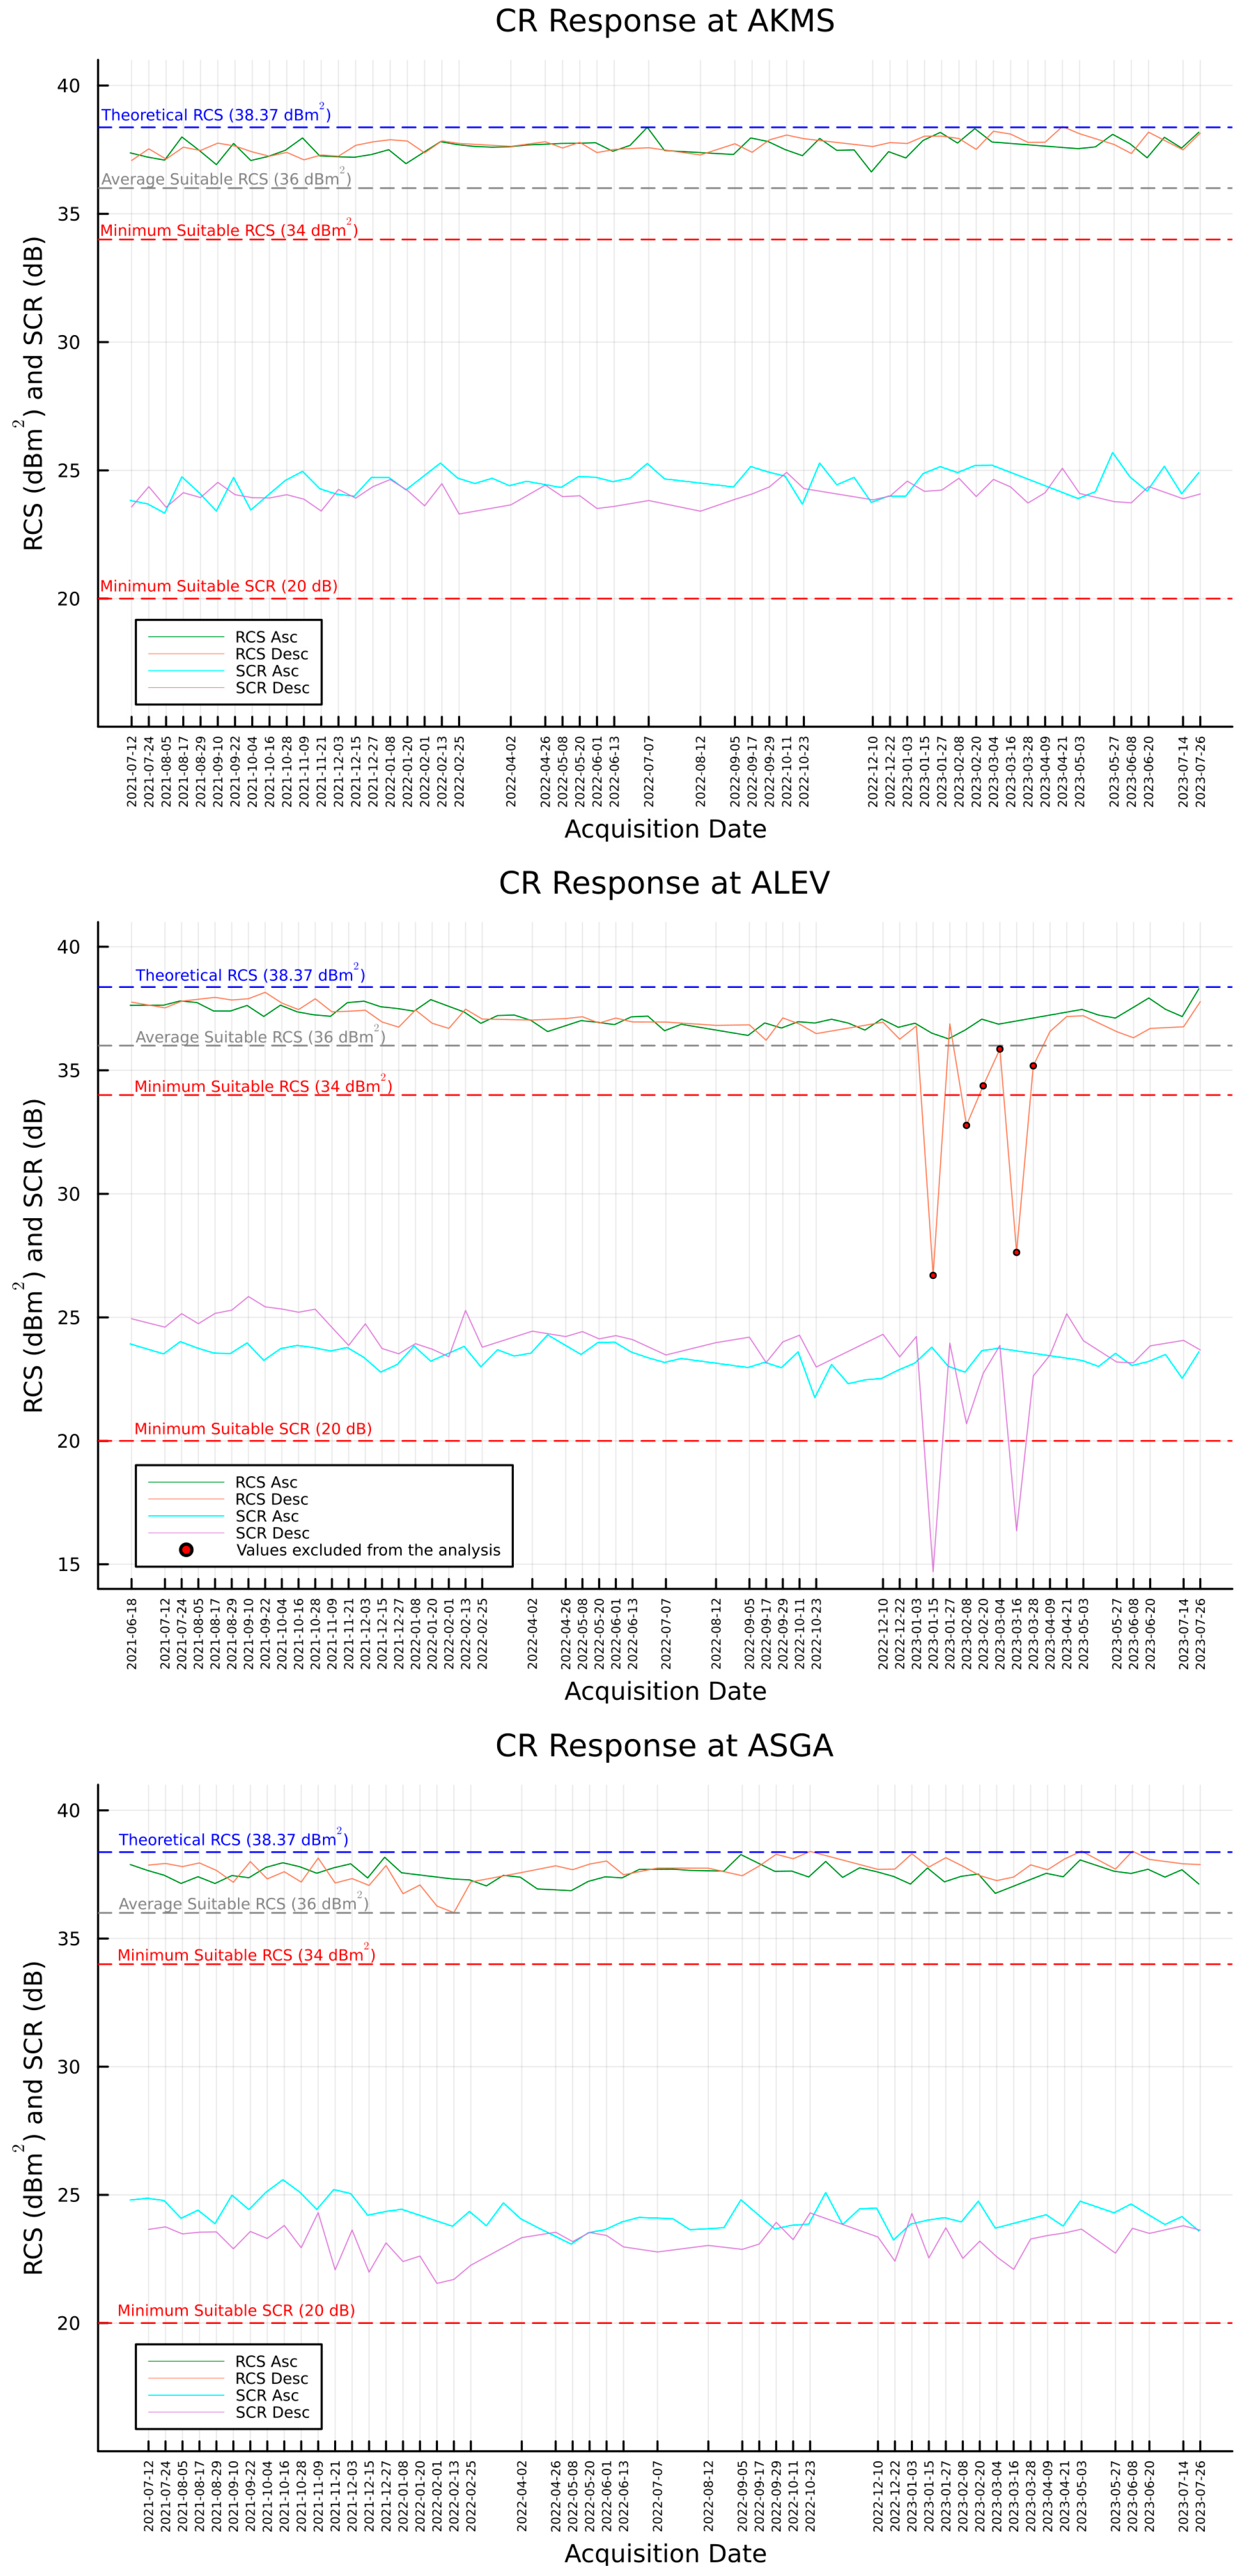
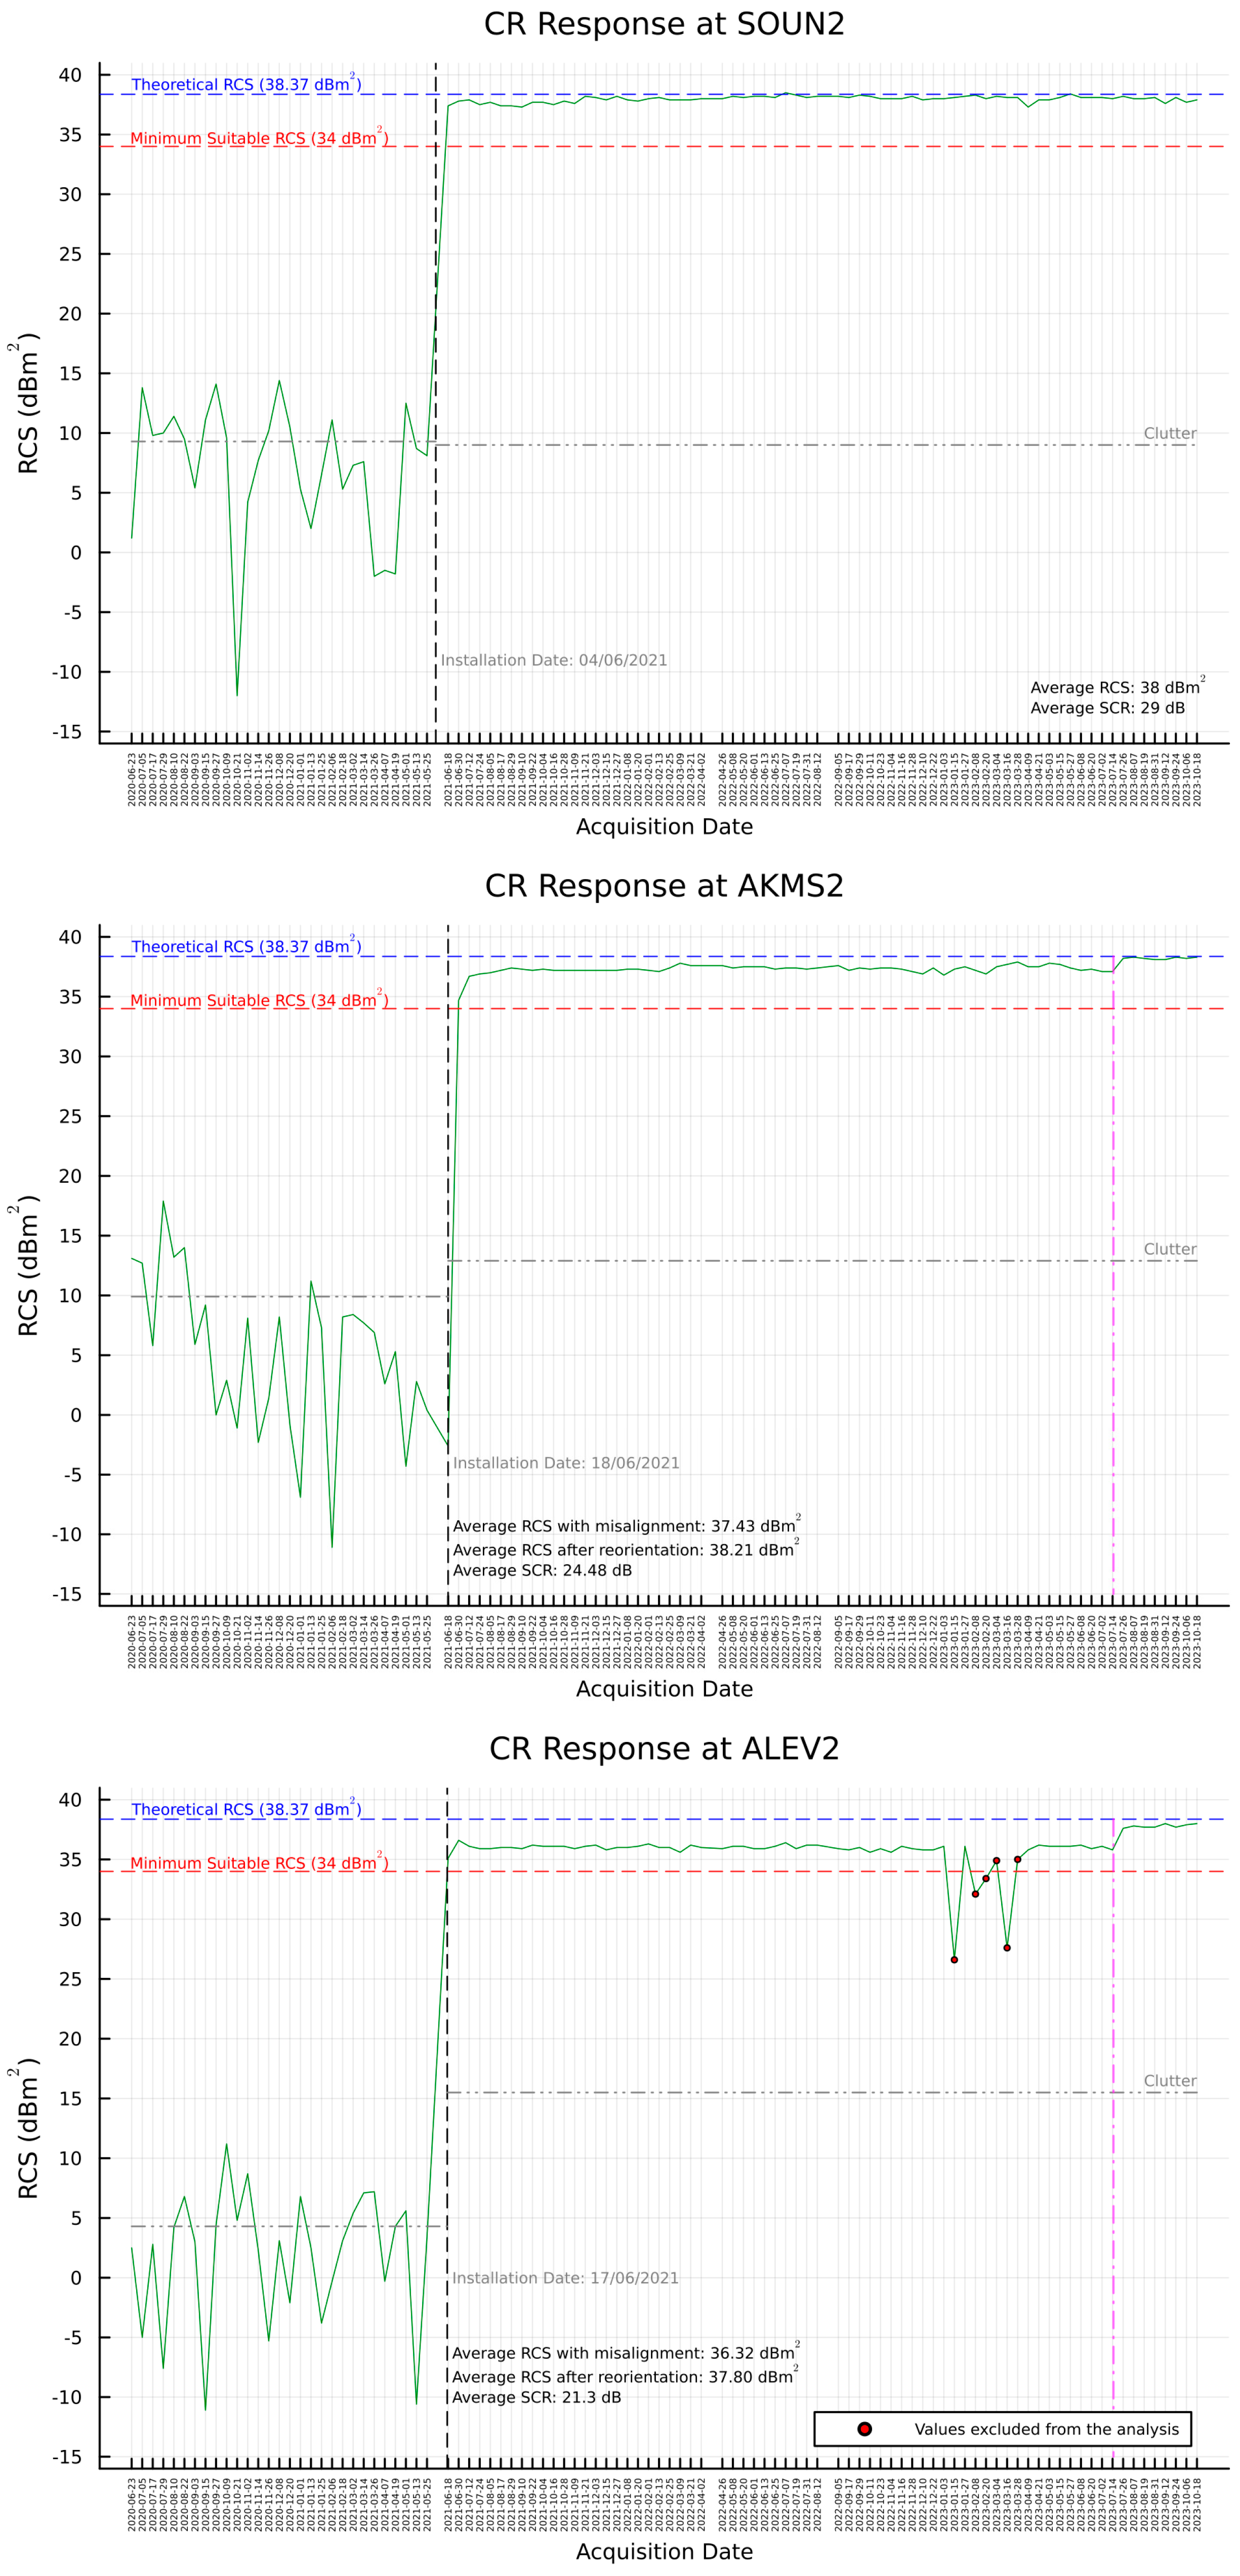
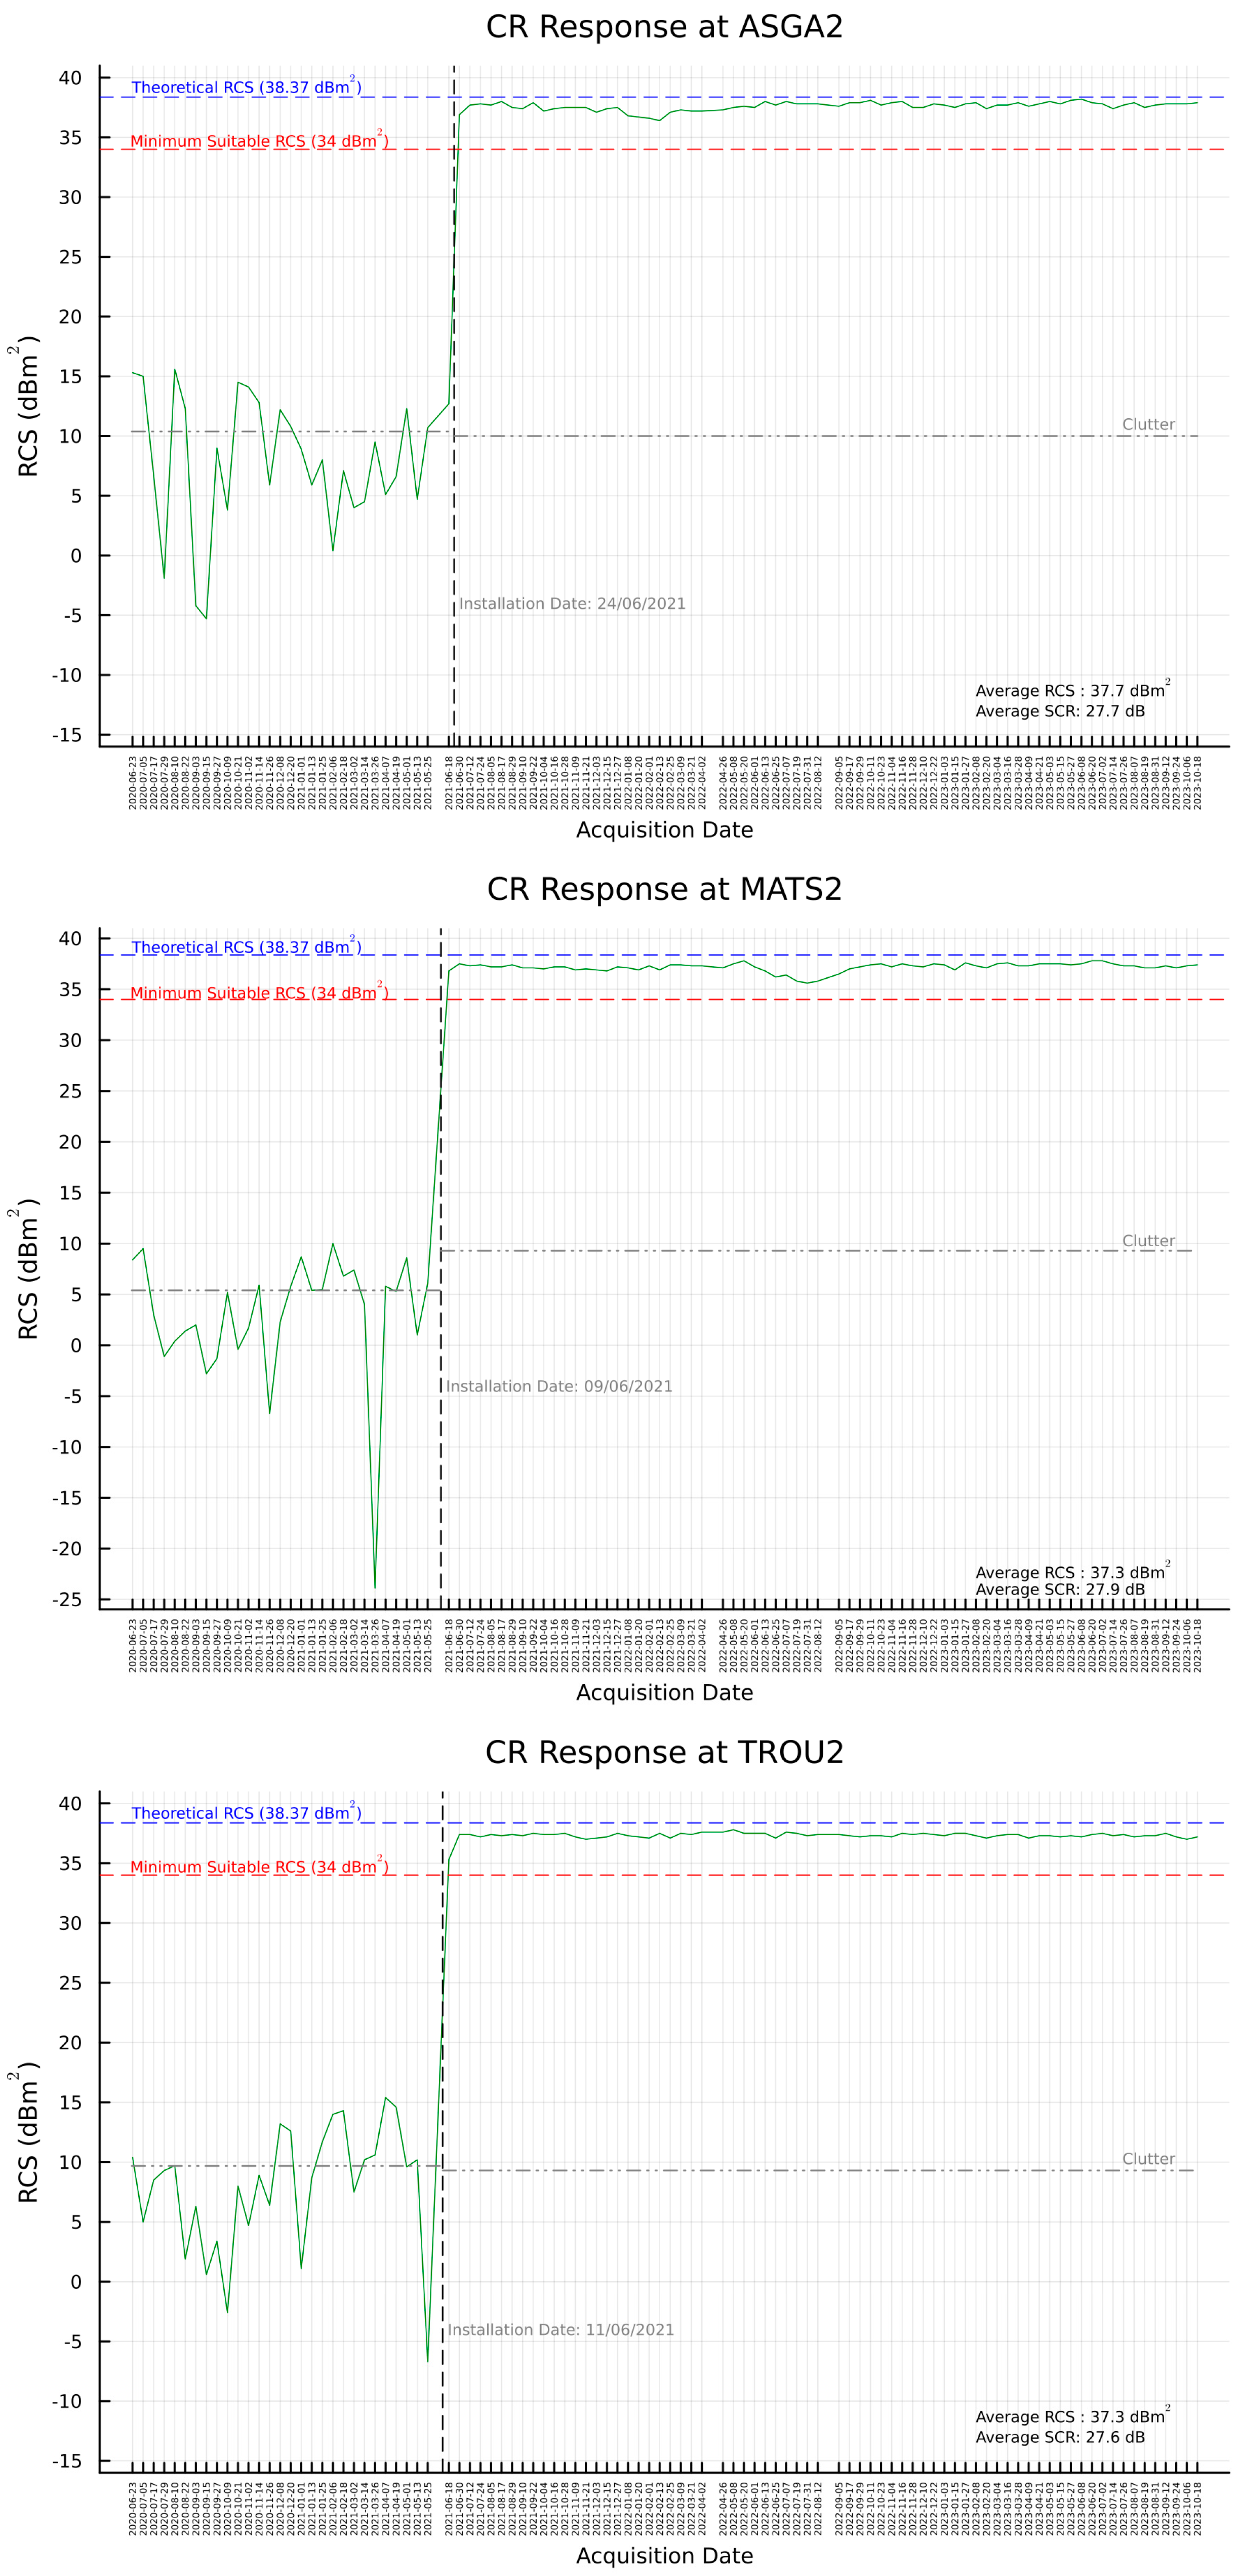
The examination reveals consistent readings across the installation dates of the TTCR. Some of the estimated RCS values were greater than theory, indicating calibration imperfections of the S-1 imagery [24]. Since it is not possible for the estimations to be greater than RCST, the values were excluded from the analysis. Furthermore, as can be seen in Figure A3, in the case of TROU01 and ALEV02, there was a notable drop in signal strength on certain dates, coinciding with periods of heavy rainfall, as detailed in the [58] reports. The poor signal quality is attributed to poor water drainage from the TTCRs due to significant soil and dust deposition (see Figure 13). Hence, the affected dates were excluded from further analysis.
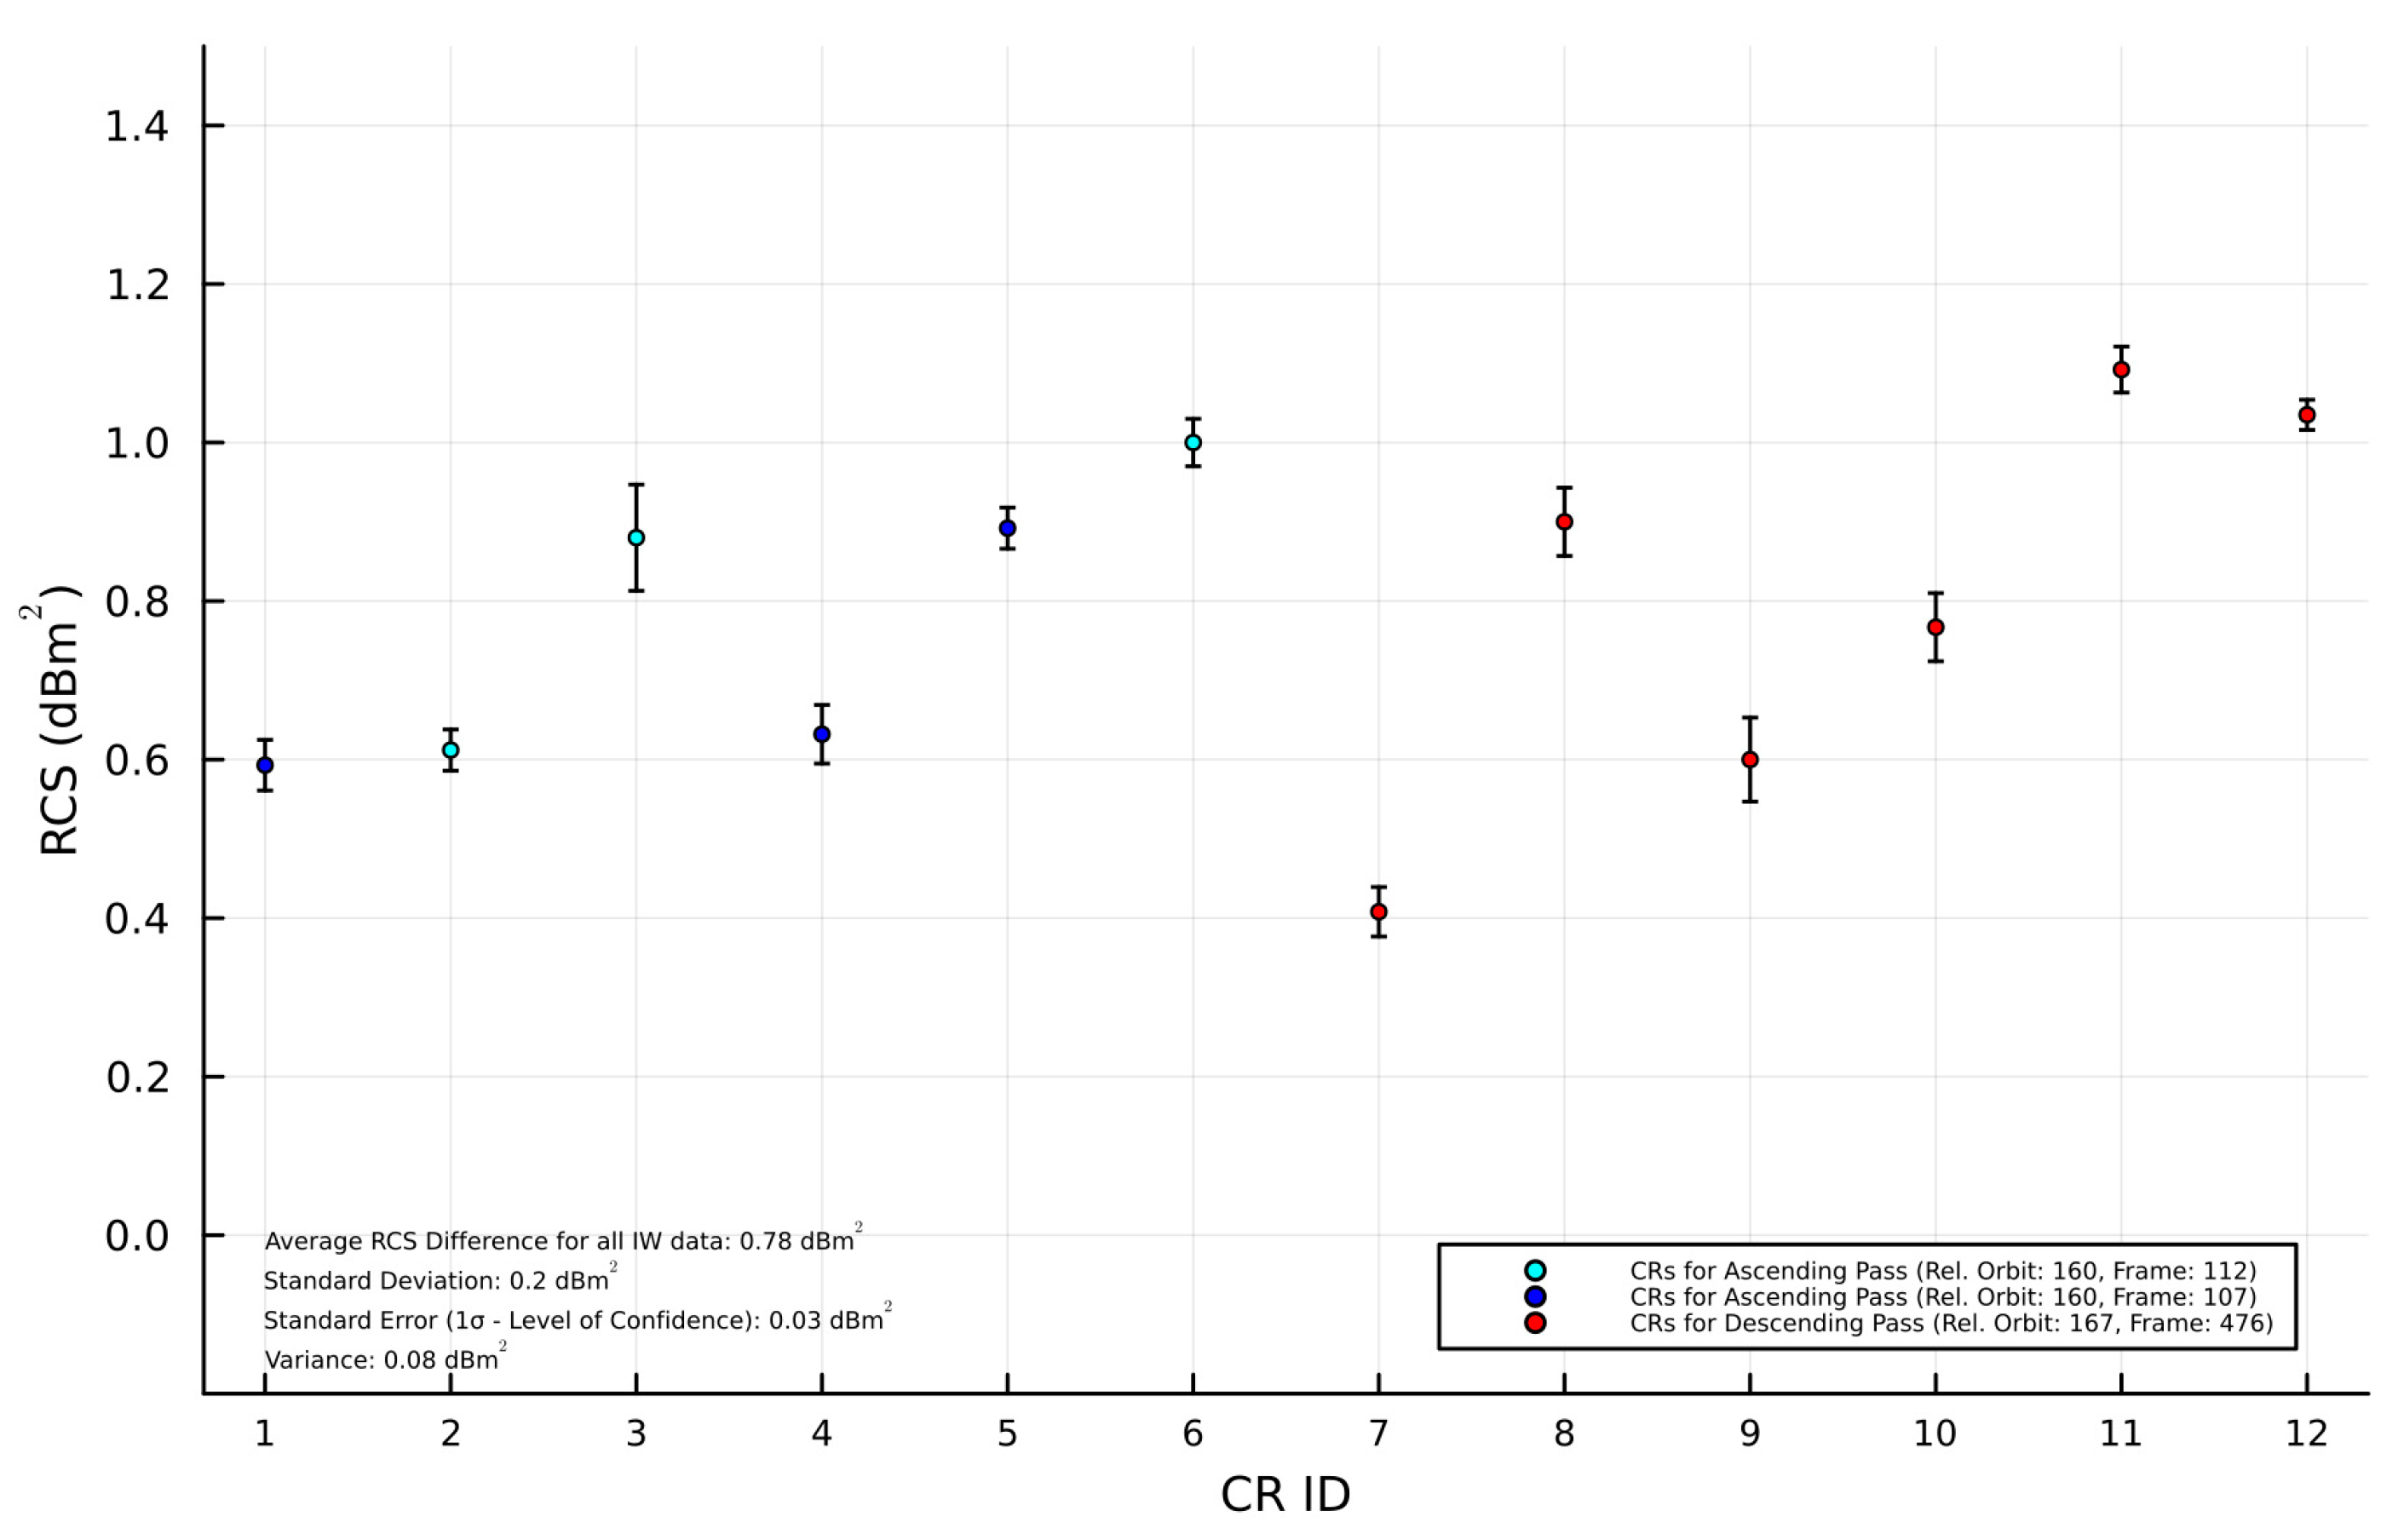
Subsequently, all the estimated values, excluding the aforementioned biases, are then compared against the theoretical RCS value, and the results are illustrated in Figure 14 below. Note that, since estimated values should not exceed the theoretical values, all results should be non-negative.
More details about the average values of each deployed TTCR are depicted in Table 5. All deployed TTCRs show consistency in terms of temporal RCS estimations in the observation period. Moreover, the average RCS for each TTCR exceeds 37 dBm2, which is identified as the minimum ideal value for an artificial persistent scatterer in medium-resolution C-band SAR images, as stated by [29].
The mean estimated RCS of all TTCRs is equal to 37.58 ± 0.05 (1σ) dBm2 (0.8 dBm2 less than theory). Regarding the SCR, the estimated mean value (assuming spatial ergodicity) is equal to 24.23 ± 0.08 (1σ) dB, which is 4.23 dB greater than the minimum required SCR.

3.2.2. Peak Method

For the peak calibration method, 297 SLC image products (IW swath, VV polarization), including both ascending and descending paths, from 22 June 2020 to 29 October 2023, were processed. The RCS and SCR estimation (assuming the temporal ergodicity of the clutter) were extracted (see Figure A4) using GECORIS open-source toolbox [26], following the methodology described in [26].
Level-1 SLC products were automatically downloaded from an ASF data search using a python script. For each TTCR, all the images were cropped in AoI with 20 × 20 resolution cells surrounding the position of the TTCR, thus retaining a full IRF and avoiding border effects during oversampling. The process involved performing oversampling using the FFT technique (oversampling factor = 16) on the demodulated and deramped SLC data which were produced by multiplying the azimuth time domain with the TOPS chirp signal. Within an area of a 1-by-1 resolution cell surrounding the initially identified position of the reflector in the data that were oversampled, a local peak was located. To ensure a peak detection accuracy of up to 1/1000th of a pixel, an elliptical paraboloid fit was applied within even smaller subsampled pixels, with an area of 9 by 9 centered on this identified maximum. Simultaneously, using Equation (7), the imagery was calibrated by converting the peak amplitude to radar brightness (β0) values. Finally, all the extracted AoI SLC bursts were stacked to be transformed to a common reference image frame by co-registering image stacks to the master image.
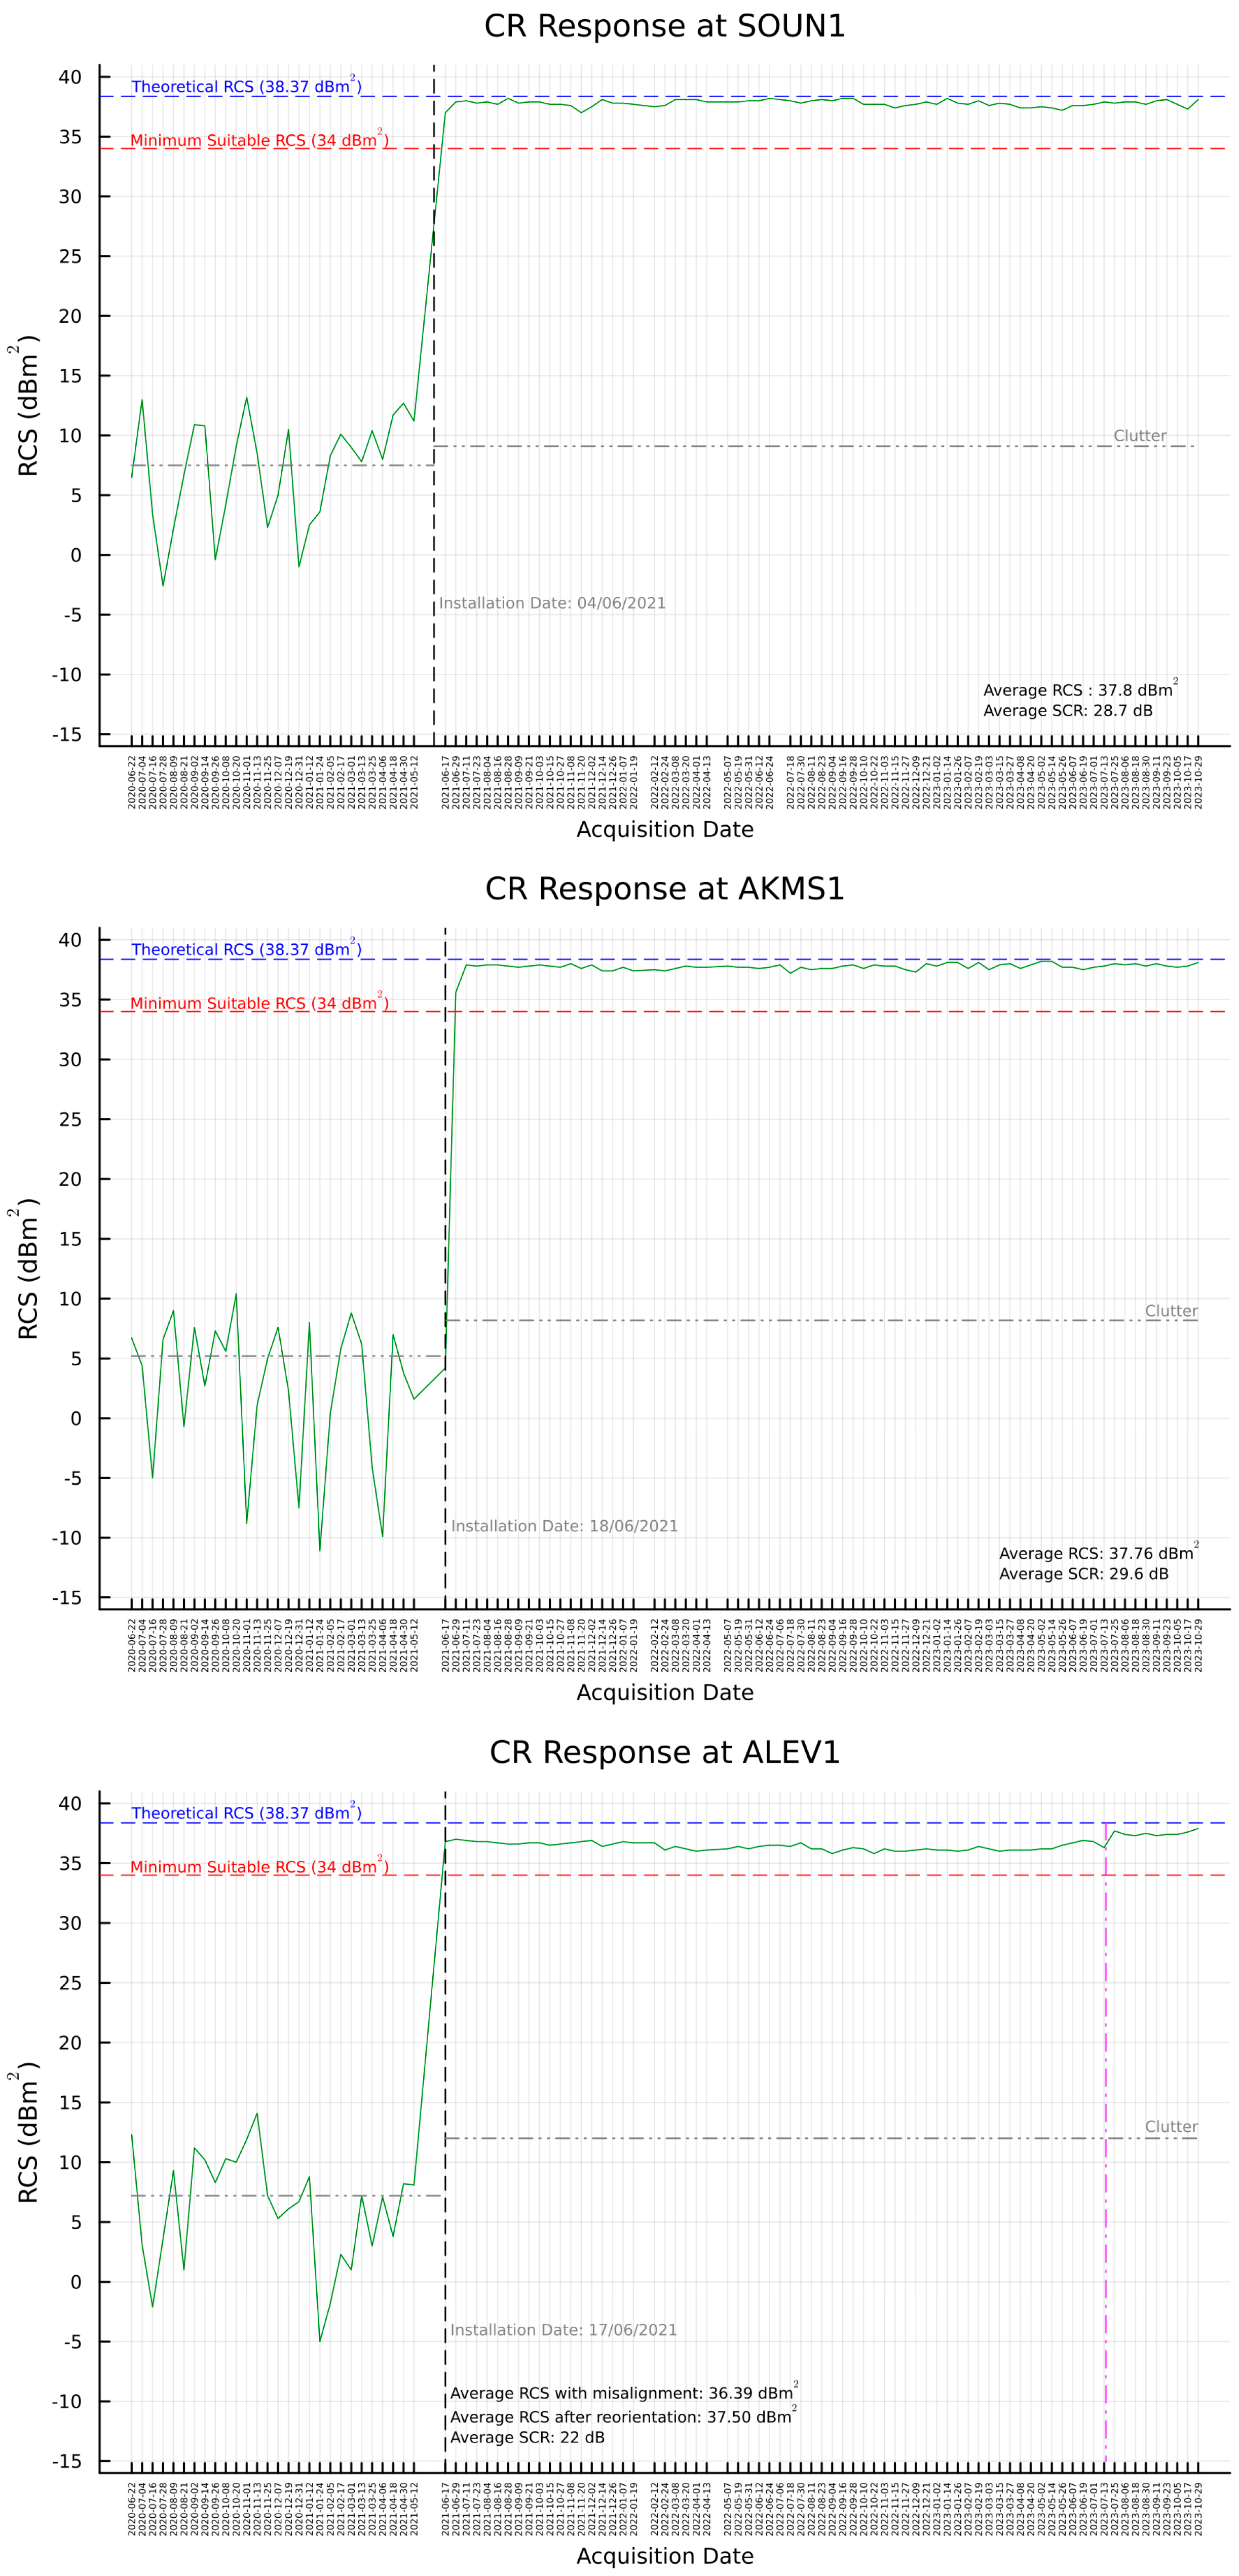
The examination (see Figure A4) reveals temporal consistency in terms of the RCS response. However, during maintenance, orientation misalignments of approximately 5 degrees were detected for ALEV01, AKMS02, and ALEV02. After realignment, their RCS responses increased by 1.2, 1.1, and 1.6 dBm2, respectively. The average RCS response of each reoriented TTCR is depicted in Table 6 below.
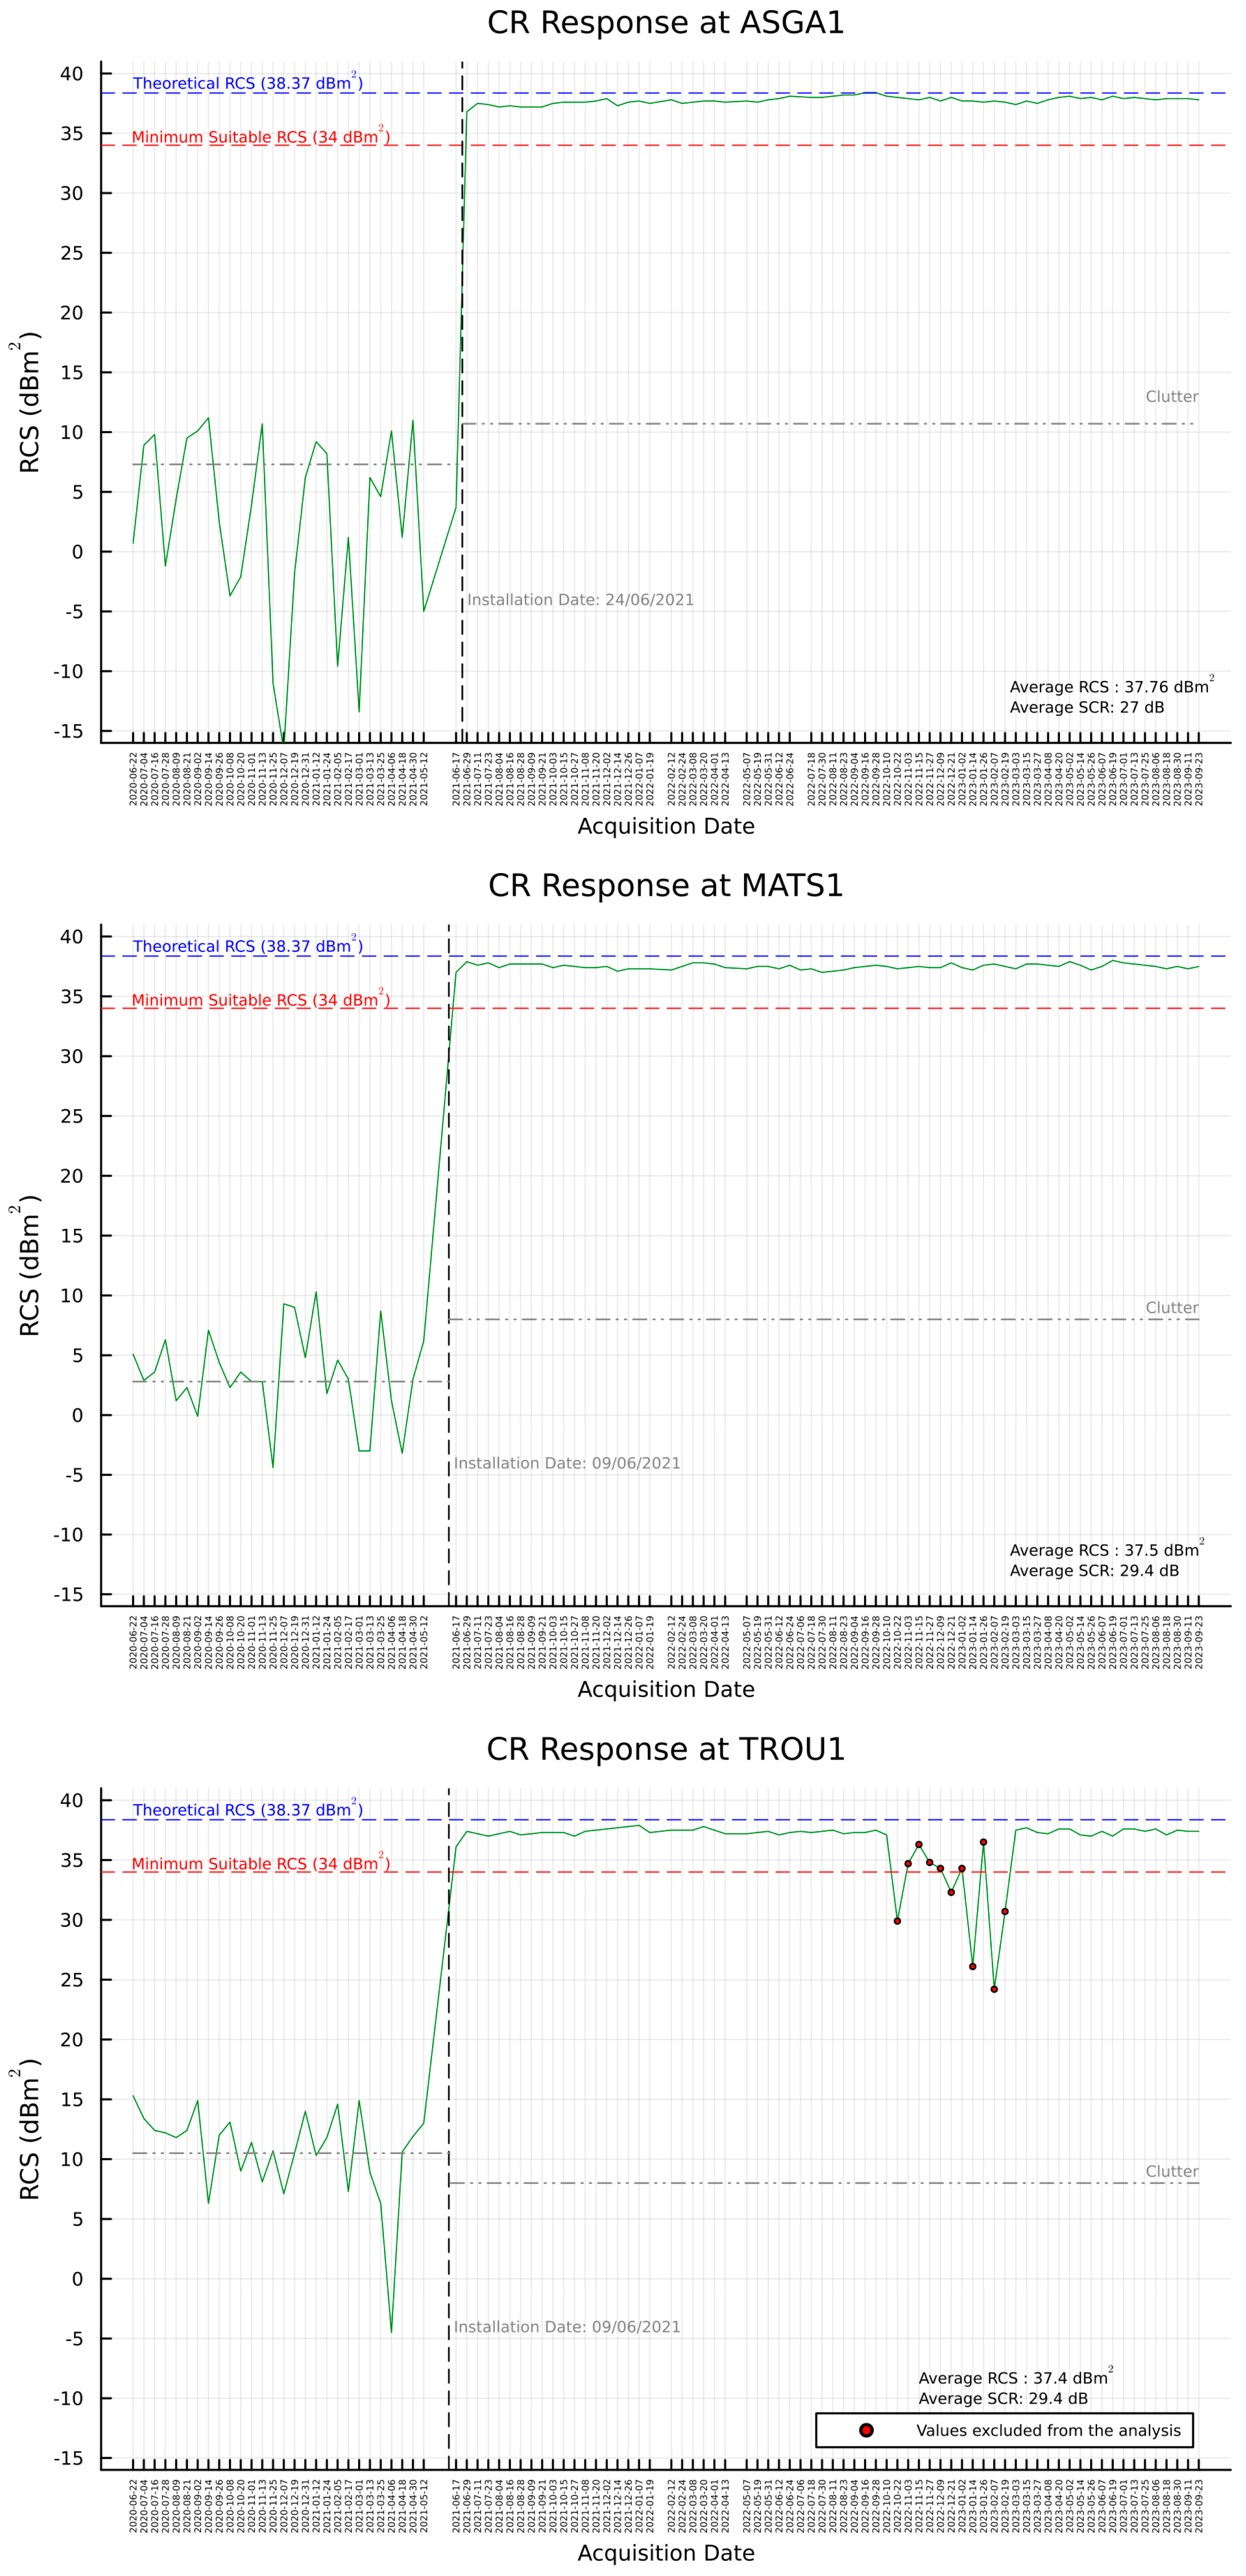
Moreover, similar to the findings from the integral method analysis, the poor RCS estimates for TROU01 and ALEV02 on certain dates, which were attributed to inadequate water drainage, were excluded from further analysis. Subsequently, the estimated RCS values were next evaluated against the RCST value, and the results are illustrated in Figure 15.
The temporal average SCR was estimated through three steps: initially, by performing a maximum likelihood fit of a Rice distribution as described in [59], the temporal average clutter energy was calculated, from the time series amplitude of the TTCRs’ location in the SLC images before the installation of the TTCRs; secondly, by using the same method to estimate the temporal average of the TTCRs’ RCS and clutter energy from the time series peak amplitude of the TTCRs after the installation date; and finally, by calculating the TTCRs’ temporal average SCR using Equation (19).
The average value and standard deviation of each deployed TTCR are depicted in Table 7. Concordantly, the average RCS for each TTCR exceeds 37 dBm2.
The mean RCS is equal to 37.6 ± 0.03 (1σ) dBm2 (0.78 dBm2 less than theory), while the temporal average SCR is equal to 27.0 dB, which is 7 dB greater than the minimum required SCR.
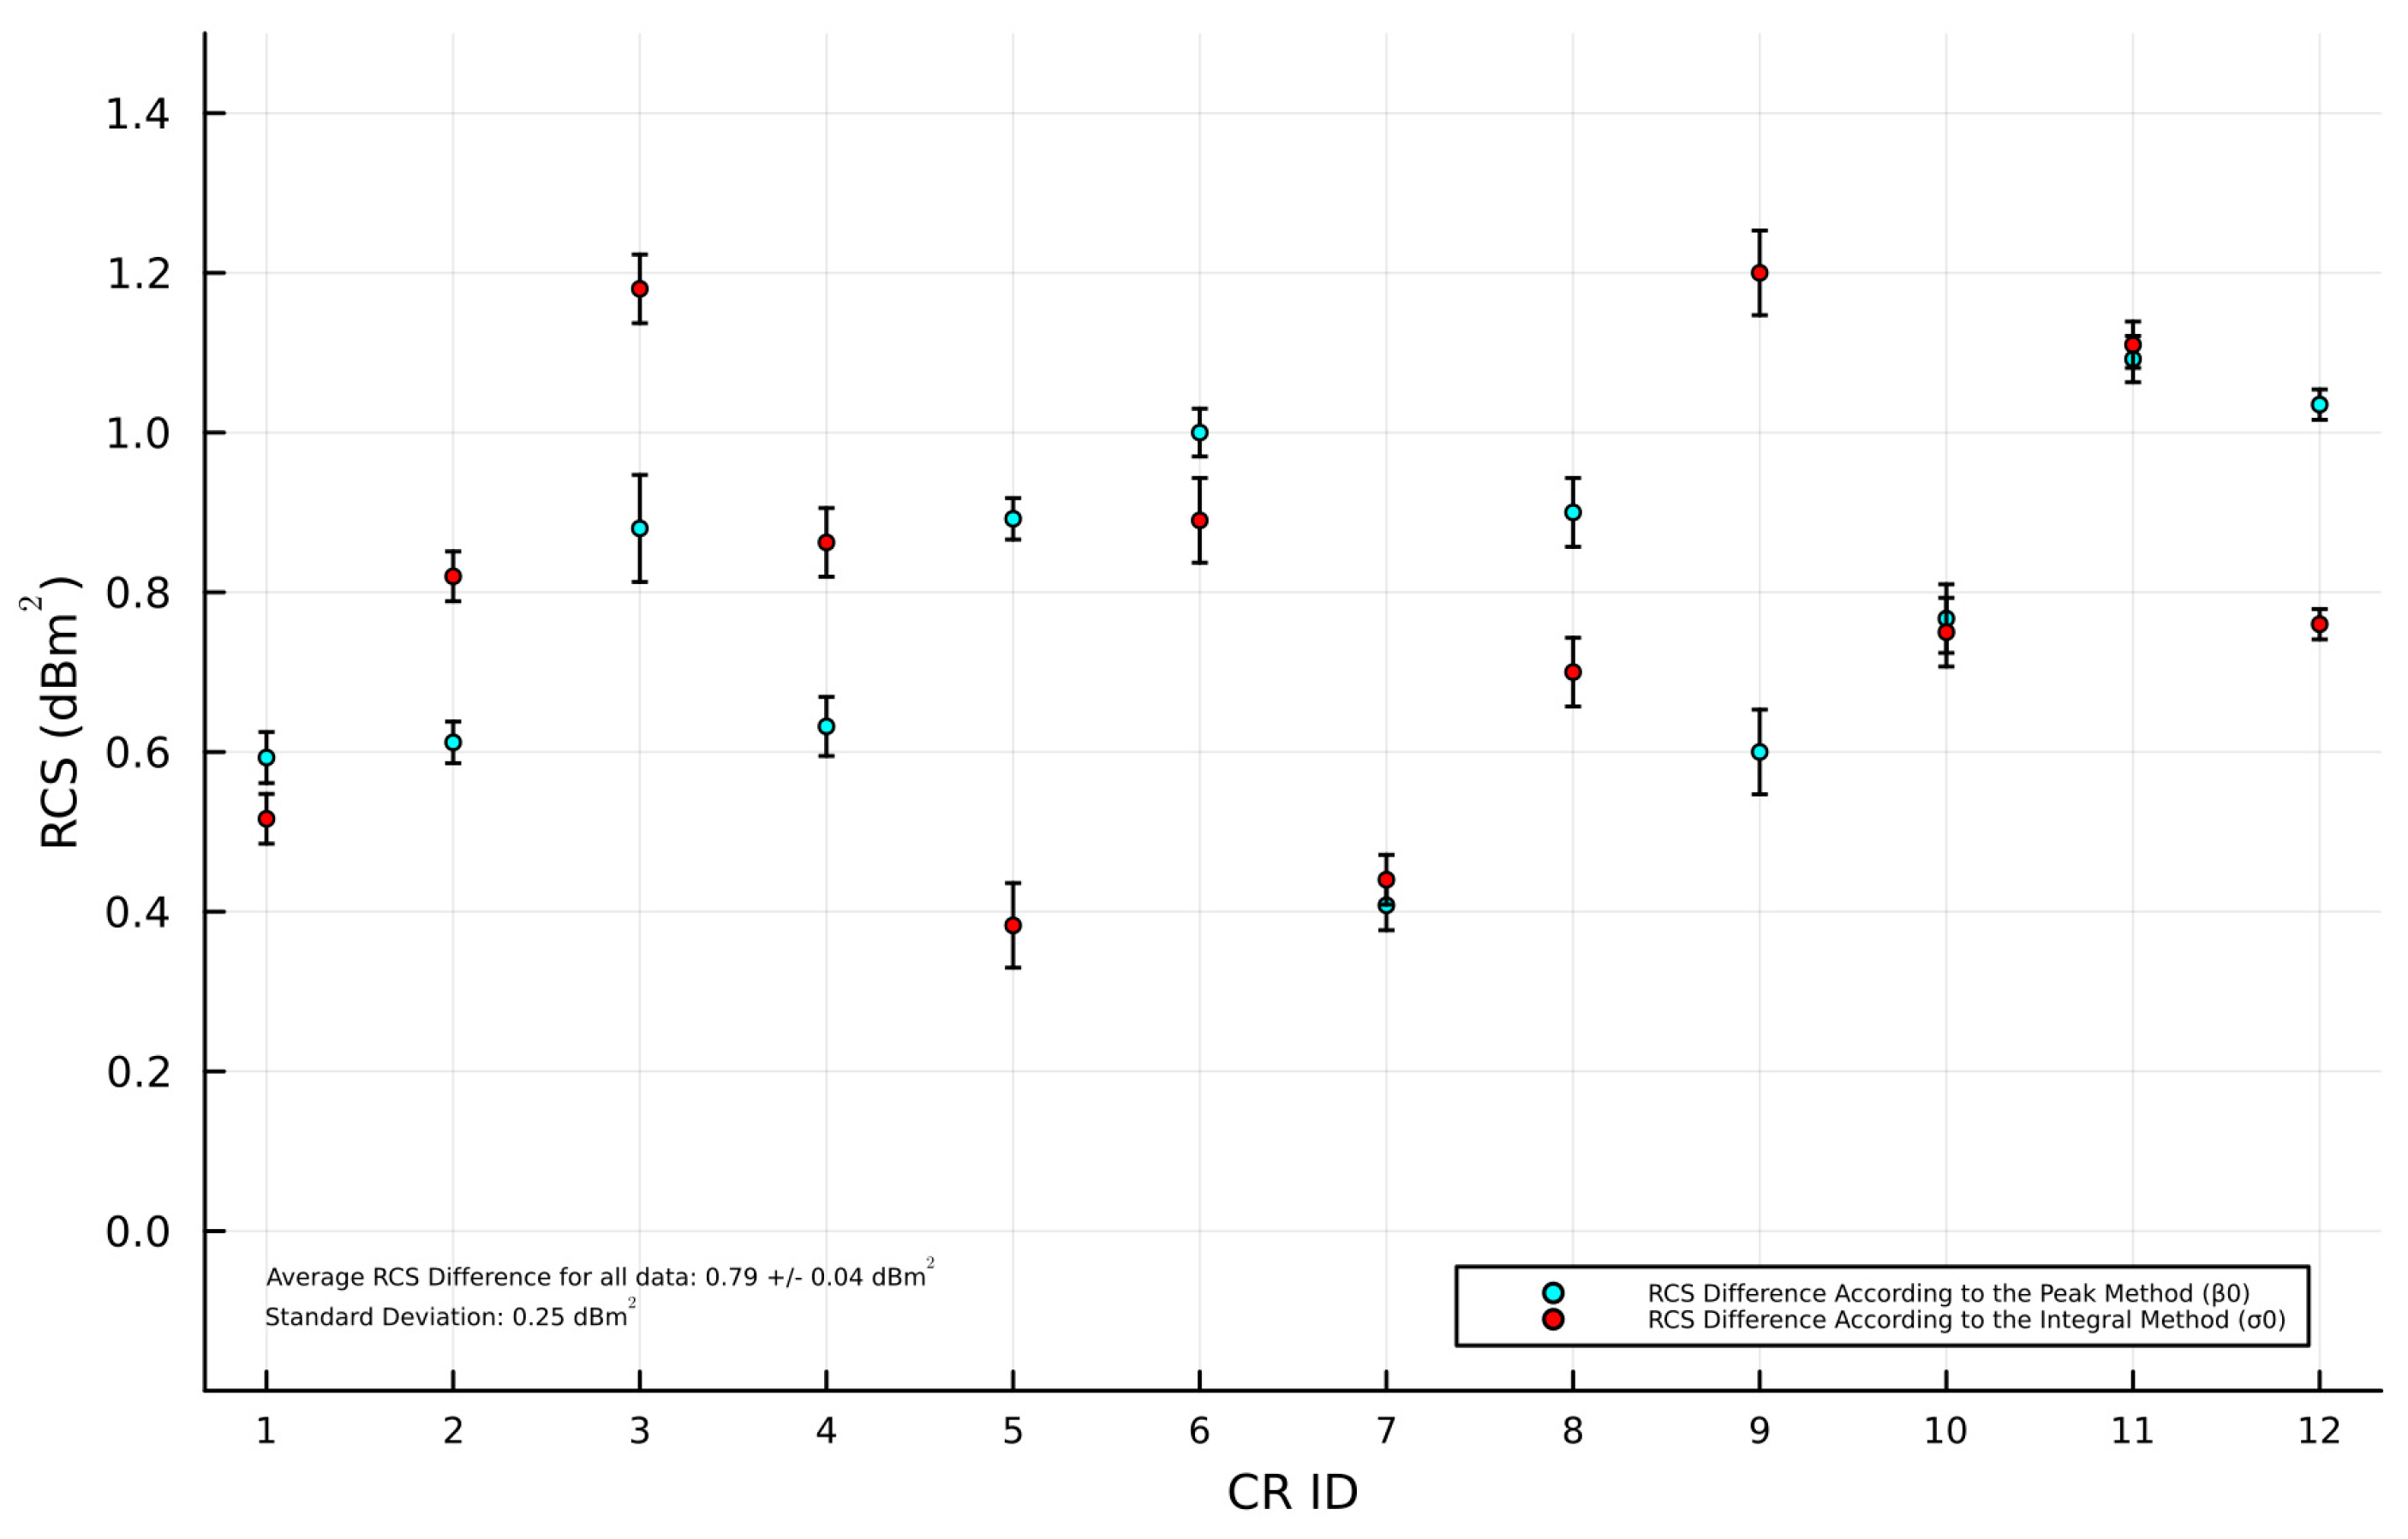
The results indicate that the average estimated difference in the RCS between the two methods (see Figure 16) is negligible (0.02 dBm2). Furthermore, the standard 1σ error and the standard deviation associated with the peak method are found to be lower than those observed in the integral method.
These results are in accordance with the literature, which suggests that the RMS errors associated with the peak method are invariably smaller than or at least equal to those of the integral method in systems that are well focused [45]. In conclusion, when considering both methods for estimating the absolute calibration factor, the average estimated RCS is equal to 37.59 ± 0.04 (1σ) dBm2. This indicates that the average difference of the RCS from theory, as derived from all datasets, is quantified as 0.79 dbm2.
When using a CR in SAR imaging, it is essential to have accurate measurements of its actual RCS for image calibration purposes. However, for deformation analysis applications, the primary focus is on maintaining the CR’s phase stability [29].

3.2.3. Displacement Error in LoS

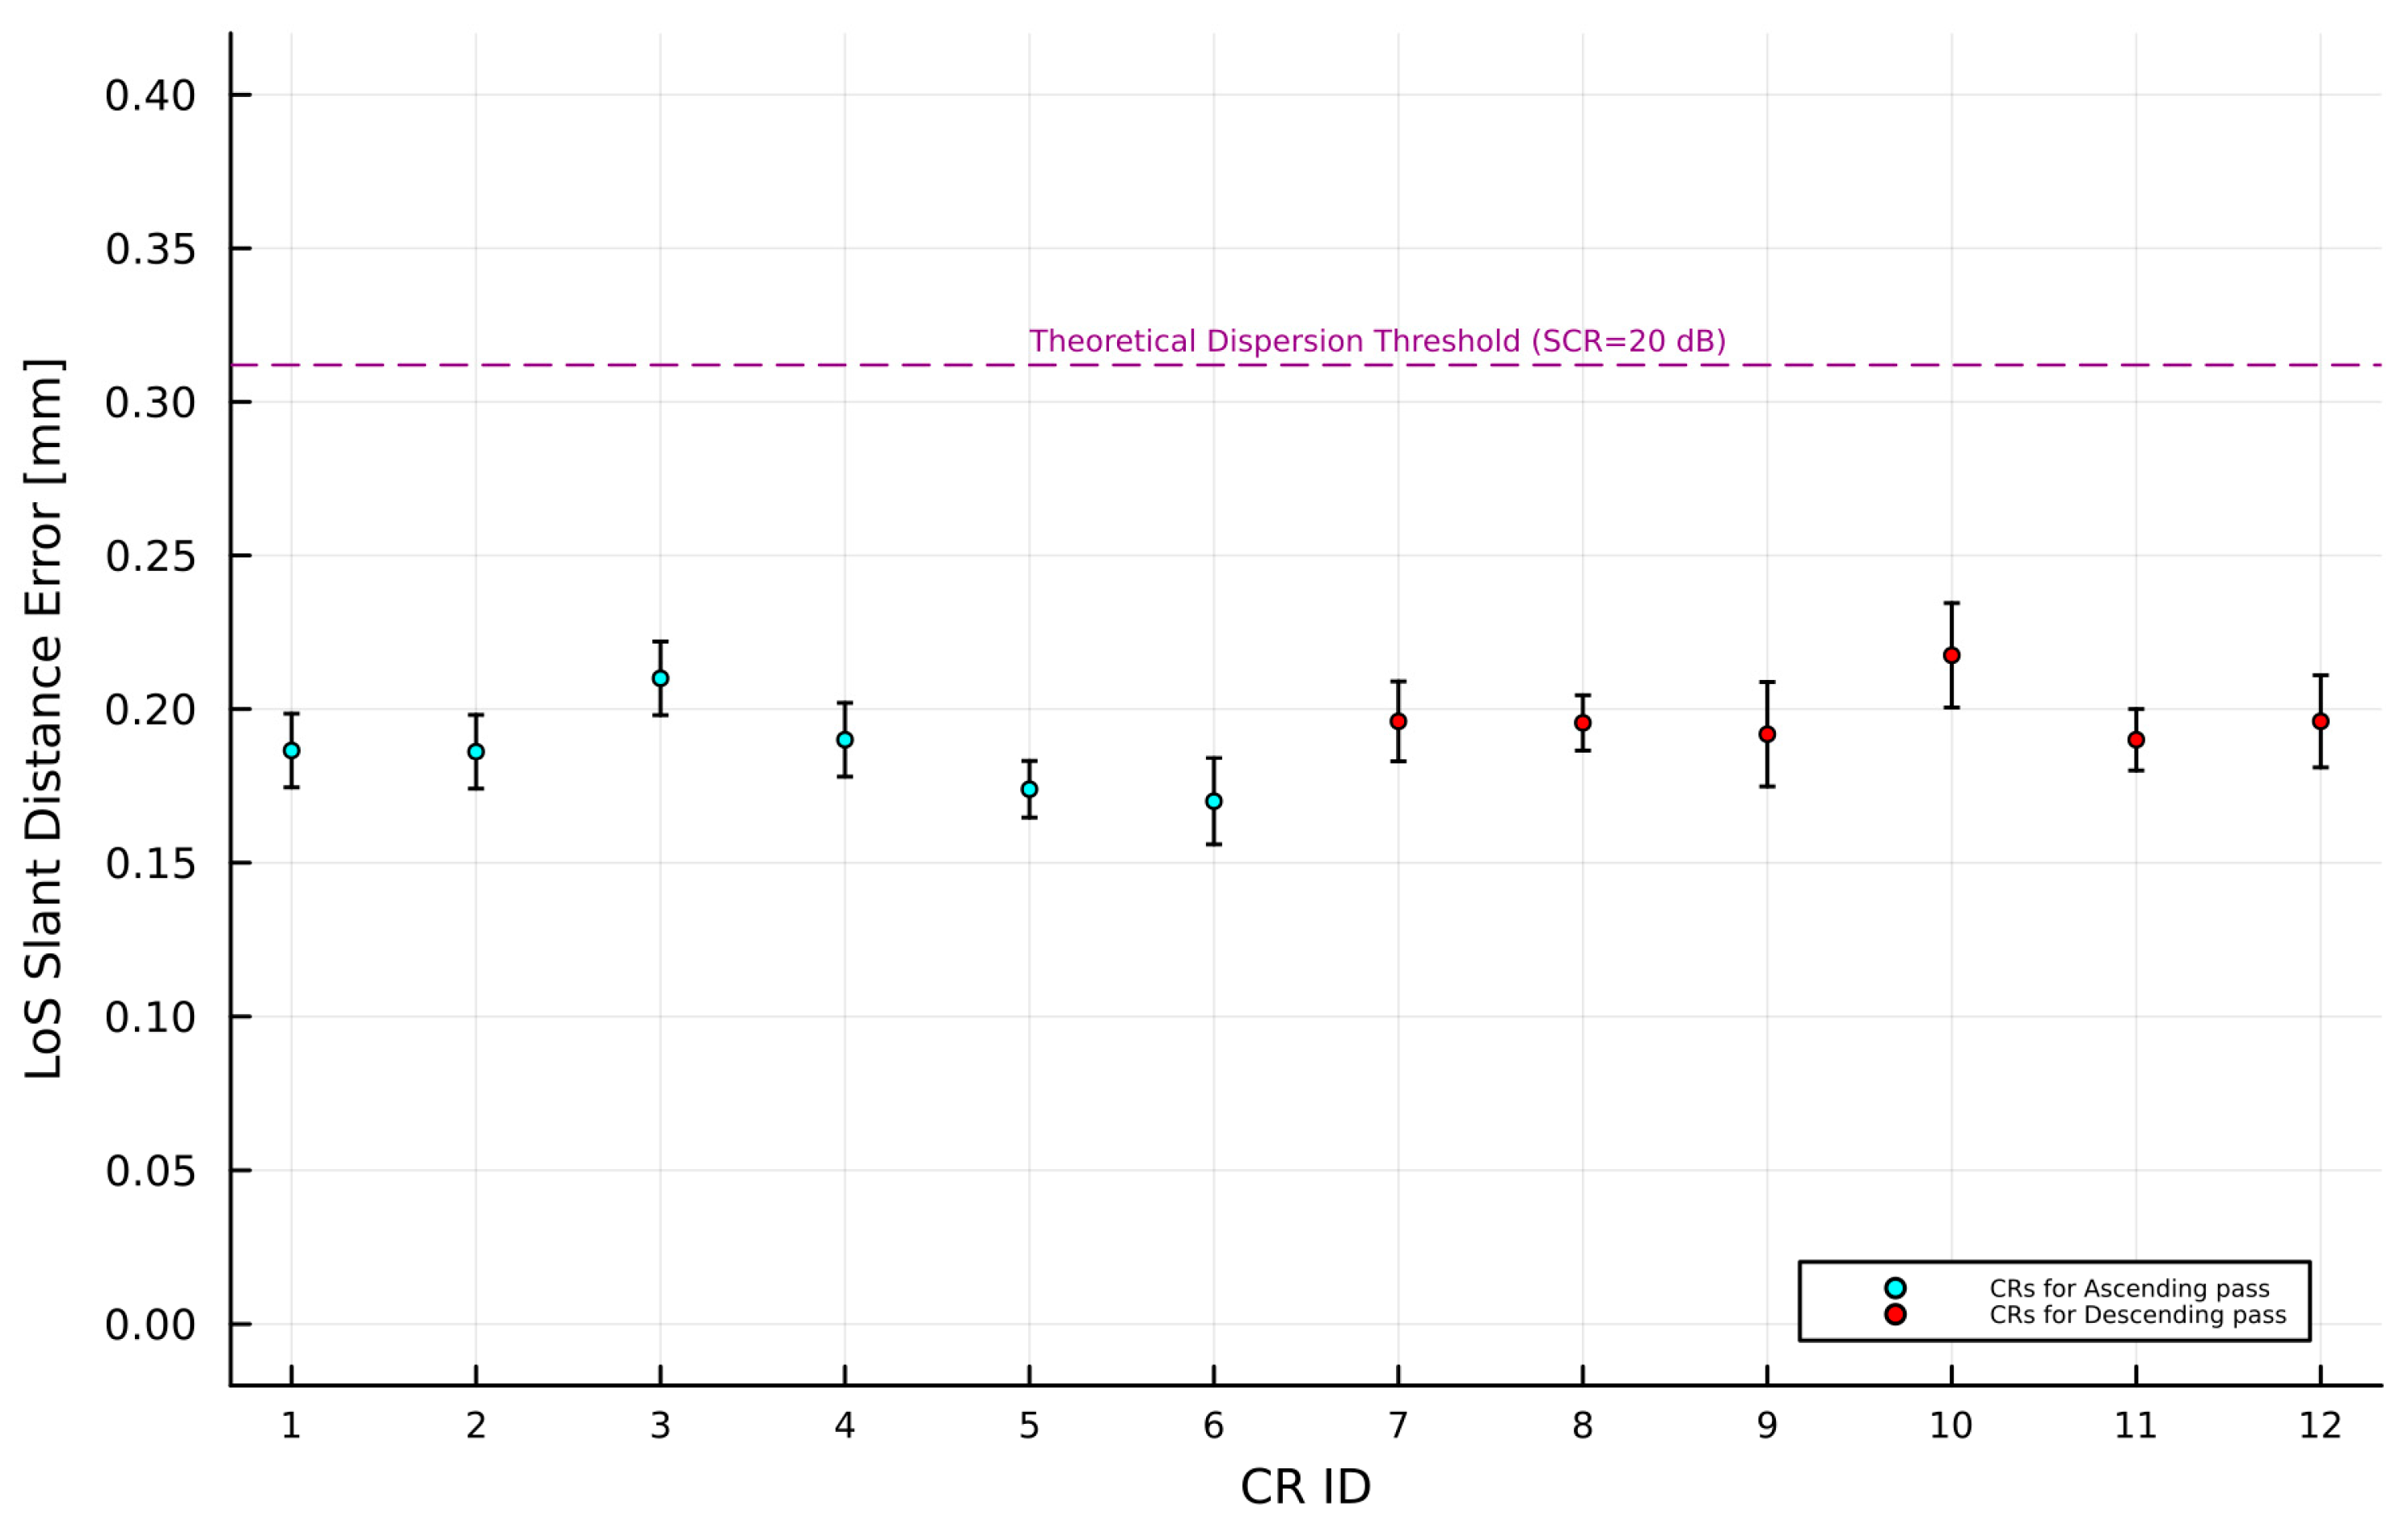
Using previously mentioned Equations (20) and (21) and exploiting the SCR responses derived from the integral method, the average displacement error for each TTCR was estimated, as illustrated in Figure 17.
The results reveal that the phase variance ranges from 0.04 to 0.05 radians, much lower than the threshold of 0.25 radians, and in addition, all values lie below the herror threshold of 0.31 mm, varying between 0.17 mm and 0.21 mm. These results indicate that the pixels containing the deployed TTCRs exhibit stable phase behaviour, having a low variance of the phase values.

3.2.4. Expected Localization Limits

As discussed earlier, for the estimation of expected accuracy limits in range and azimuth, many studies apply the general specifications of the S-1 IW swath in Equation (22). However, this study acknowledges that each sub-swath in S-1 IW mode has distinct product specifications (see Table 1), and using general specifications (e.g., 3 m × 22.5 m for S-1 IW) could lead to inaccuracies in estimating the accuracy limit of a CR peak intensity in a SAR image. Hence, this research utilizes spatial resolution quality estimations from the IRF assessment (see Table 2) to determine the actual expected location accuracy of the TTCRs’ peak intensity. Table 8 presents the calculated range and azimuth accuracy limits for each TTCR based on S-1A IW SLC products. For instance, to compute the expected azimuth accuracy for an SCR of 28.7 dB, the resolution cell value of 0.39 10 2.87 = 0.014 is multiplied by both the estimated mean azimuth and range resolution of 22.1 m and 3.1 m, respectively, for the IW2 sub-swath, as derived from the image quality assessment.

3.2.5. Absolute Location Error

The ALE estimation is performed individually for each image acquisition and is formed using the (a) observed image timing coordinates, (b) path delay corrections, and (c) predicted timing coordinates [53]. In Equations (23) and (24), subsample values are used within the GECORIS software. The peak intensity of the TTCRs is determined by individually analyzing each 297 S-1A SLC image that has been oversampled 32 times using FFT. All the timing corrections are applied in range and azimuth accordingly (see Table 9). In particular, atmospheric path delays are subtracted from range time to adjust for the reduced light velocity. Moreover, SAR processor-related timing corrections are applied. These corrections are performed in the operational S-1 Instrument Processing Facility (IPF) in the generation of SLC products. The corrections related to azimuth are (a) the bistatic residual and (b) FM rate mismatch, while a Doppler range shift is applied for range correction [26]. Implementing these corrections results in an average enhancement in positioning accuracy, yielding improvements of approximately 2.3 m in the azimuth for ascending passes and 3.3 m for descending passes, along with a range improvement of about 3.9 m for ascending and 2.8 m for descending passes [51,54]. Given that the process involves units of time (UTC), it is essential that all terms are standardized within the same unit system. According to [53], the correction process requires adherence to time units because the SAR processor must adjust the zero-Doppler time to rectify the timing grids. This adjustment enables the direct acquisition of calibration constants necessary for further use. Therefore, for the ALE estimation, it can be determined by subtracting the estimated timings from the measured image timings, as described in [53].
The final results are converted to metric units by using the appropriate velocities, which are the zero-Doppler velocity for azimuth and light velocity in vacuum for range [51]. A representative example of timing corrections, expressed in metres, for the TTCRs situated at the AKMS site is illustrated in Figure 18.
The remaining differences in the range and azimuth from each SAR acquisition estimation are summarized by the average ALE and its standard deviation, as depicted in Table 9 below.

4. Discussion

The average spatial resolution derived from the IRF (2.7 ± 0.09 m, 3.1 ± 0.09 m, and 3.5 ± 0.09 m for range, and 21.9 ± 0.5 m, 22.1 ± 0.6 m, and 21.81 ± 0.5 m for azimuth) is equal in range and better in azimuth from the specified value of S-1. Moreover, the mean ISLR estimates are notably lower than anticipated. This discrepancy is attributed to the less reflective and smoother characteristics of the target’s adjacent area, along with a superior SCR (greater than 20 dB). The image quality parameters estimated from the IRF of the TTCRs align with and even exceed the specified standards. These findings suggest that the image quality of S-1 in IW mode demonstrates temporal stability in both range and azimuth resolutions.
The shape of the IRF is influenced by the coherence levels in both the observed scene and the SAR system, including its correlator. For instance, a dynamic scene like the sea surface, when imaged by a SAR, tends to yield a more blurred output compared to a stable scene, such as flat land. Similarly, uncorrected movements of the SAR platform can reduce coherence, negatively impacting the impulse response. Additionally, the impulse response can be altered by the resampling methods employed in transforming SAR data from one coordinate system to another and by phase discrepancies caused by the ionosphere [3]. Consequently, the IRF’s appearance may differ across various scenes and even within different areas of the same scene.
The evaluation of the instruments’ performance resulted in low-variance RCS responses, with an average estimated RCS, based on both the integral and peak method, equal to 37.59 ± 0.04 (1σ) dBm2. The results indicate that the RCS responses are constant, having an average difference of the RCS from theory equal to 0.79 dbm2, as derived from all datasets. Moreover, the phase variance ranges from 0.04 to 0.05 radians, much lower than the threshold of 0.25 radians, and in addition, all values lie below the LoS displacement error threshold of 0.31 mm, varying between 0.17 mm and 0.21 mm.
These results indicate that the pixels containing the deployed CRs exhibit stable phase behaviour, having a low variance of the phase values. For CRs serving as SAR calibration targets, the accurate knowledge of their actual RCS is the only important consideration. On the other hand, when CRs serve as deformation targets, it is important to maintain a stable phase response.
Regarding the ALE analysis, the values obtained from the analysis underscore the high precision of the TTCRs’ positions post-correction. For instance, the range’s ALE for AKMS01 was exceptionally close to zero, indicating nearly perfect accuracy in the range measurement, with similarly low deviations observed across other sites. The azimuth ALE values, though slightly higher, still demonstrated considerable accuracy, with deviations remaining within a manageable range. The differences from the expected localization accuracy further highlight the effectiveness of the process. In nearly all cases, the ALE values were closer to the expected accuracy, indicating that the applied corrections successfully minimized the discrepancies between the measured and estimated positions of the TTCRs.
However, the analysis reveals notably high standard deviations in the ALE values for AKMS02, ALEV01, and particularly ALEV02. As can be seen in Figure A4, these discrepancies were attributed to misalignments in the orientation of the TTCRs, which led to lower RCS and SCR estimates than anticipated. Following the realignment of the TTCRs, the RCS responses aligned with expectations. Nevertheless, these sites were not resurveyed subsequently, resulting in persistently higher ALE values from the day of realignment onwards. This observation underscores the critical need for conducting resurveys of the TTCRs and recalculating the ALE after any realignment of the TTCRs to ensure the accuracy and reliability of the data.
Additionally, the presence of high standard deviations could also result from inaccuracies in the tropospheric data. While this study utilizes the ERA5 weather data from the European Centre for Medium-Range Weather Forecasts (ECMWF) [60], which provides high spatial resolution data for tropospheric delay corrections, it does not achieve the accuracy of in situ data collected from meteorological and GNSS stations co-located with TTCRs, in varying local weather conditions [61,62]. It is also important to note that tropospheric corrections were applied for each SAR acquisition to the slant range, affecting the range component more significantly than the azimuth component due to its higher sensitivity to these corrections [51].

5. Conclusions

This paper focuses on the SAR quality monitoring of Sentinel-1 using PTA to assess the quality characteristics of point targets, particularly using the corner reflectors of the CyCLOPS infrastructure unit in Cyprus, for accurate measurements within SAR imagery.
The IRF is discussed, illustrating how point scatterers are represented and the transformation processes involved in SAR imaging to correlate extended responses into points. This article emphasizes key metrics derived from the IRF, such as spatial resolution and the ISLR, for the evaluation of SAR instrument and processor performance.
Furthermore, radiometric analysis is conducted to ensure the calibration of the Sentinel-1 imagery, with detailed methodologies for measuring the RCS response of TTCRs. This includes comparisons to theoretical values and the application of both peak and integral methods for accurate RCS estimation, for the radiometric calibration of SAR data.
Additionally, the SCR is analyzed as a measure of a target’s visibility against background clutter, necessary for estimating the displacement error in LoS and the expected localization limits.
Finally, geolocation analysis is also performed emphasizing the importance of precise measurement and correction techniques to ensure the accuracy and reliability of SAR imagery for InSAR applications.

Author Contributions

Conceptualization, C.D., D.K. and M.E.; methodology, D.K.; validation, D.K., K.F., N.I.S., R.B. and C.D.; formal analysis, D.K. and N.I.S.; investigation, D.K., K.F., N.I.S. and C.D.; resources, C.D. and M.E.; data curation, D.K. and C.D.; writing—original draft preparation, D.K.; writing—review and editing, D.K. and C.D.; visualization, D.K.; supervision, C.D.; project administration, C.D.; funding acquisition, C.D. All authors have read and agreed to the published version of the manuscript.

Funding

This research was funded by the Cyprus University of Technology Open Access Author Fund.

Data Availability Statement

Copernicus Sentinel data 2023. Retrieved from ASF DAAC (https://search.asf.alaska.edu/#/) 26 November 2023, processed by the ESA.

Acknowledgments

The authors would like to acknowledge the ‘CyCLOPS+’ (RIF/SMALL SCALE INFRASTRUCTURES/1222/0082) project, which is funded by the European Regional and Development Fund and the Republic of Cyprus through the Research and Innovation Foundation. The authors would like to acknowledge the ‘CyCLOPS’ (RIF/INFRASTRUCTURES/1216/0050) project, which was funded by the European Regional and Development Fund and the Republic of Cyprus through the Research and Innovation Foundation in the framework of the RESTART 2016-2020 program.

Conflicts of Interest

The authors declare no conflicts of interest.

Appendix A. Image Quality Performance
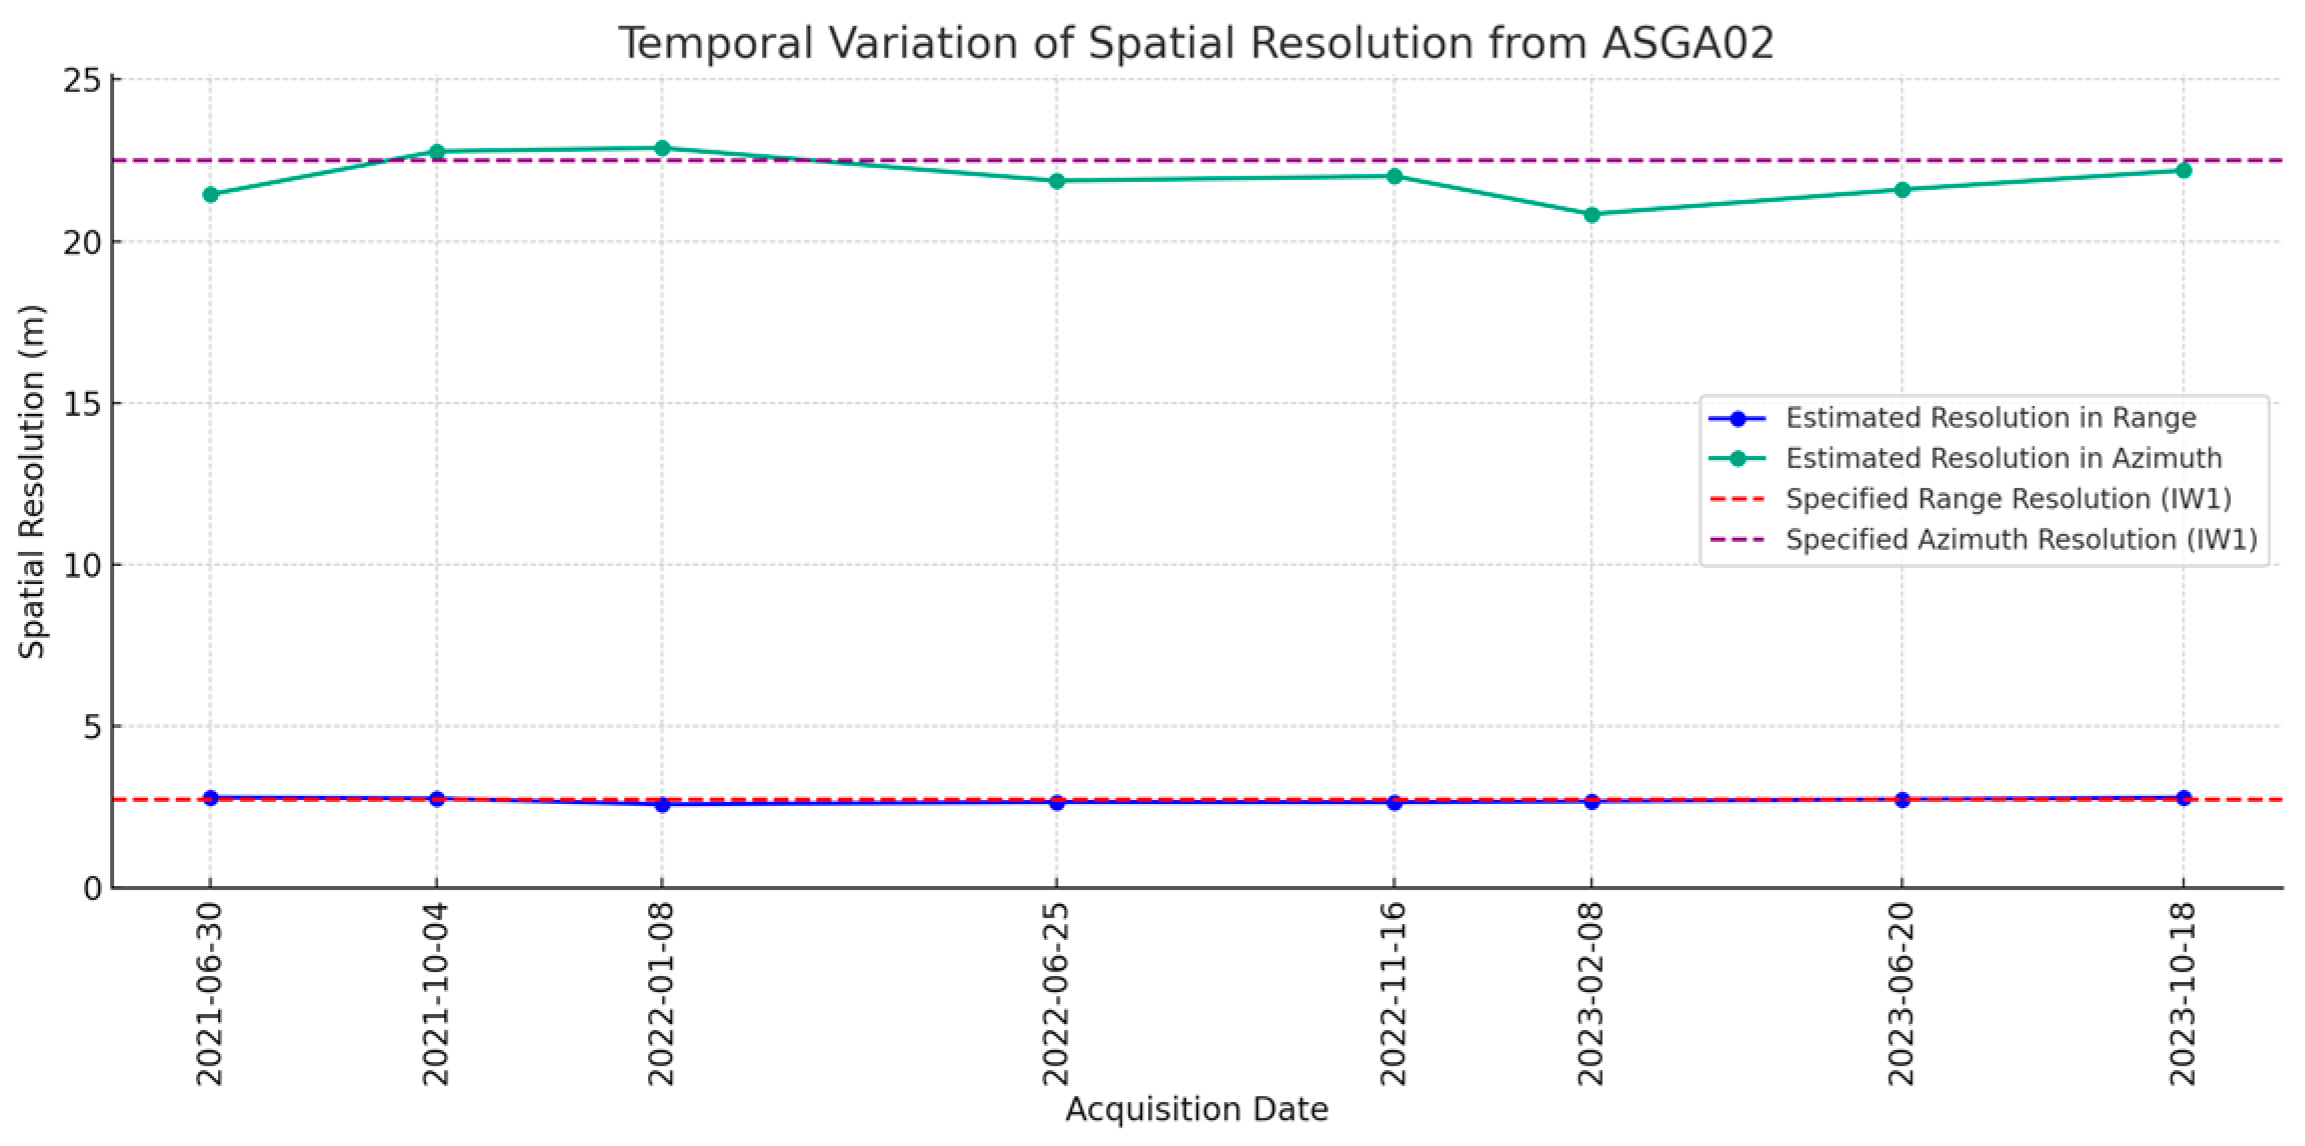
Figure A1. The TTCR response function of SOUN02, after interpolation, in the S-1A IW VV images of 18 October 2023, for the descending pass. (a,b) The plots represent a cut through the peak in the slant range and azimuth direction, respectively, while (c) illustrates the point target relative power in a 3D plot.
Remotesensing 16 01696 g0a1
Figure A2. The temporal variation in spatial resolution from the TTCR in ASGA corresponding to the descending pass, for the monitoring period.
Remotesensing 16 01696 g0a2

Appendix B. RCS and SCR Estimations
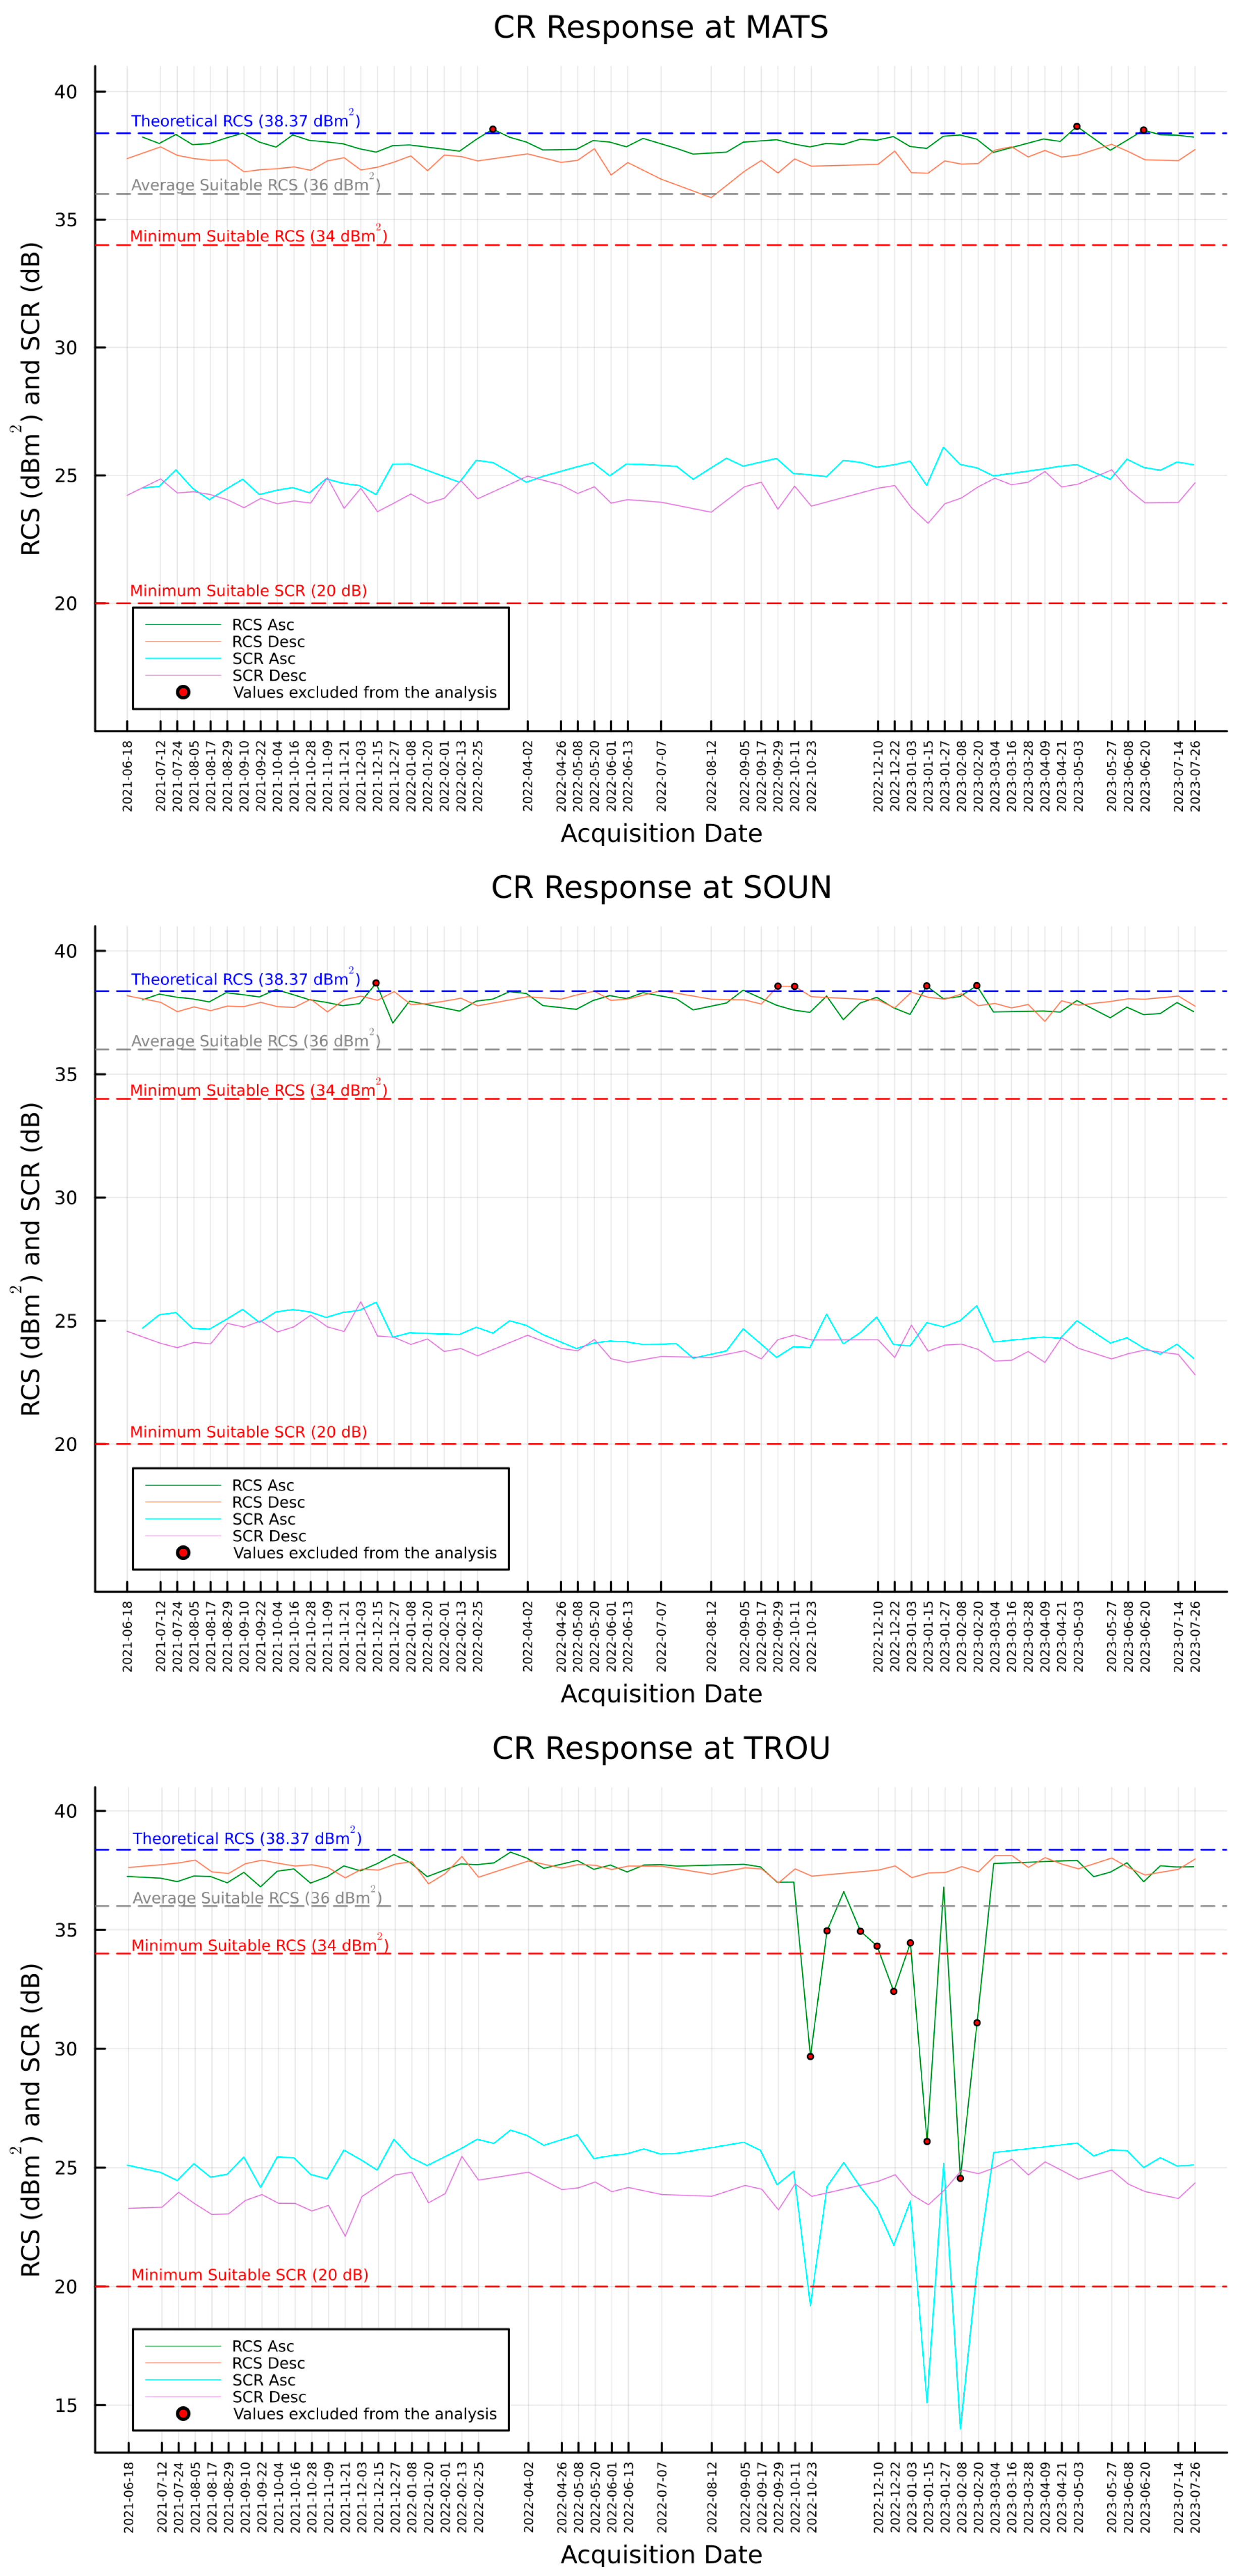
Figure A3. The time series of the TTCRs’ RCS and SCR responses, for the monitoring period, using the integral method.
Remotesensing 16 01696 g0a3aRemotesensing 16 01696 g0a3b
Figure A4. The time series of the TTCRs’ RCS and SCR responses, for the monitoring period, using the peak method. The black-coloured dashed vertical line represents the TTCR installation date. The magenta-coloured dashed vertical line, where applicable, represents the reorientation date.
Remotesensing 16 01696 g0a4aRemotesensing 16 01696 g0a4bRemotesensing 16 01696 g0a4cRemotesensing 16 01696 g0a4d

References

  1. Danezis, C.; Kakoullis, D.; Fotiou, K.; Pekri, M.; Chatzinikos, M.; Kotsakis, C.; Brcic, R.; Eineder, M.; Nikolaidis, M.; Ioannou, G.; et al. CyCLOPS: A National Integrated GNSS/InSAR Strategic Research Infrastructure for Monitoring Geohazards and Forming the Next Generation Datum of the Republic of Cyprus. In Geodesy for a Sustainable Earth. International Association of Geodesy Symposia; Freymueller, J.T., Sánchez, L., Eds.; Springer: Cham, Switzerland, 2022; Volume 154. [Google Scholar]
  2. Garthwaite, M.C.; Hazelwood, M.; Nancarrow, S.; Hislop, A.; Dawson, J.H. A Regional Geodetic Network to Monitor Ground Surface Response to Resource Extraction in the Northern Surat Basin, Queensland. Aust. J. Earth Sci. 2015, 62, 469–477. [Google Scholar] [CrossRef]
  3. Freeman, A. SAR Calibration: An Overview. IEEE Trans. Geosci. Remote Sens. 1992, 30, 1107–1121. [Google Scholar] [CrossRef]
  4. ESA External Calibration. Available online: https://sentinels.copernicus.eu/web/sentinel/technical-guides/sentinel-1-sar/cal-val-activities/calibration/external (accessed on 6 April 2023).
  5. Mahapatra, P.; Marel, H.; Van Leijen, F.; Samiei Esfahany, S.; Klees, R.; Hanssen, R. InSAR Datum Connection Using GNSS-Augmented Radar Transponders. J. Geod. 2017, 92, 21–32. [Google Scholar] [CrossRef]
  6. Kakoullis, D.; Fotiou, K.; Melillos, G.; Danezis, C. Considerations and Multi-Criteria Decision Analysis for the Installation of Collocated Permanent GNSS and SAR Infrastructures for Continuous Space-Based Monitoring of Natural Hazards. Remote Sens. 2022, 14, 1020. [Google Scholar] [CrossRef]
  7. IGS. IGS Site Guidelines; Infrastructure Commitee, Central Bureau: Pasadena, CA, USA, 2015.
  8. NGS. Guidelines for New and Existing Continuously Operating Reference Stations (CORS); NOAA: Washington, DC, USA; Silver Spring: Montgomery County, ML, USA, 2018; p. 21. [Google Scholar]
  9. EUREF Permanent GNSS Network Central Bureau Guidelines for EPN Stations and Operational Centres. 2022. Available online: https://www.epncb.oma.be/DOI/ROB-EUREF-Guidelines-Station.php (accessed on 4 July 2022).
  10. Garthwaite, M.C.; Lawrie, S.; Dawson, J.; Thankappan, M. Corner Reflectors as the Tie between InSAR and GNSS Measurements: Case Study of Resource Extraction in Australia. In Proceedings of the Fringe 2015: Advances in the Science and Applications of SAR Interferometry and Sentinel-1 InSAR Workshop, Frascati, Italy, 23–27 March 2015. [Google Scholar]
  11. Parker, A.L.; Featherstone, W.E.; Penna, N.T.; Filmer, M.S.; Garthwaite, M.C. Practical Considerations before Installing Ground-Based Geodetic Infrastructure for Integrated InSAR and cGNSS Monitoring of Vertical Land Motion. Sensors 2017, 17, 1753. [Google Scholar] [CrossRef]
  12. Thankappan, M.; Garthwaite, M.C.; Williams, M.L.; Hislop, A.; Nancarrow, S.; Dawson, J. Characterisation of Corner Reflectors for the Australian Geophysical Observing System to Support SAR Calibration. In Proceedings of the ResearchGate, Edinburgh, UK, 9 September 2013. [Google Scholar]
  13. Freeman, A. Radiometric calibration of SAR image data. ISPRS J. Photogramm. Remote Sens. 1993, XXIX, 212–222. [Google Scholar]
  14. Sharma, S.; Dadhich, G.; Rambhia, M.; Mathur, A.K.; Prajapati, R.P.; Patel, P.R.; Shukla, A. Radiometric Calibration Stability Assessment for the RISAT-1 SAR Sensor Using a Deployed Point Target Array at the Desalpar Site, Rann of Kutch, India. Int. J. Remote Sens. 2017, 38, 7242–7259. [Google Scholar] [CrossRef]
  15. Schubert, A.; Small, D.; Miranda, N.; Geudtner, D.; Meier, E. Sentinel-1A Product Geolocation Accuracy: Commissioning Phase Results. Remote Sens. 2015, 7, 9431–9449. [Google Scholar] [CrossRef]
  16. Gisinger, C.; Krieger, L.; Valentino, A.; Breit, H.; Albinet, C.; Eineder, M. ESA’s Extended Timing Annotation Dataset (ETAD) for Sentinel-1—Product Status and Case Studies. In Proceedings of the Living Planet Symposium 2022, Bonn, Germany, 23 May 2022. [Google Scholar]
  17. Schubert, A.; Small, D.; Meier, E.; Miranda, N.; Geudtner, D. Spaceborne SAR Product Geolocation Accuracy: A Sentinel-1 Update. In Proceedings of the 2014 IEEE Geoscience and Remote Sensing Symposium, Quebec City, QC, Canada, 13–18 July 2014; pp. 2675–2678. [Google Scholar]
  18. ESA Mission Ends for Copernicus Sentinel-1B Satellite. Available online: https://www.esa.int/Applications/Observing_the_Earth/Copernicus/Sentinel-1/Mission_ends_for_Copernicus_Sentinel-1B_satellite (accessed on 4 July 2022).
  19. ESA Sentinel-1 Data Products. Available online: https://www.esa.int/Applications/Observing_the_Earth/Copernicus/Sentinel-1/Data_products (accessed on 31 August 2023).
  20. ESA SAR Product Types. Available online: https://copernicus.eu/user-guides/sentinel-1-sar/product-types-processing-levels/level-1 (accessed on 31 August 2023).
  21. Facility Alaska Satellite Sentinel-1—Observation Plans. Available online: https://asf.alaska.edu/data-sets/sar-data-sets/sentinel-1/sentinel-1-observation-plans/ (accessed on 1 March 2024).
  22. De Zan, F.; Monti Guarnieri, A. TOPSAR: Terrain Observation by Progressive Scans. IEEE Trans. Geosci. Remote Sens. 2006, 44, 2352–2360. [Google Scholar] [CrossRef]
  23. Knott, E.F. Radar Cross Section Measurements; Springer Science and Business Media: Berlin/Heidelberg, Germany, 2012; ISBN 978-1-4684-9904-9. [Google Scholar]
  24. Garthwaite, M.C.; Nancarrow, S.; Hislop, A.; Thankappan, M.; Dawson, J.H.; Lawrie, S. The Design of Radar Corner Reflectors for the Australian Geophysical Observing System: A Single Design Suitable for InSAR Deformation Monitoring and SAR Calibration at Multiple Microwave Frequency Bands; Geoscience Australia: Canberra, Australia, 2015; ISBN 978-1-925124-57-6.
  25. Miranda, N.; Meadows, P.J. Radiometric Calibration of S-1 Level-1 Products Generated by the S-1 IPF 2015. Available online: https://sentinel.esa.int/documents/247904/685163/S1-Radiometric-Calibration-V1.0.pdf (accessed on 4 July 2022).
  26. Czikhardt, R.; Van Der Marel, H.; Papco, J. GECORIS: An Open-Source Toolbox for Analyzing Time Series of Corner Reflectors in InSAR Geodesy. Remote Sens. 2021, 13, 926. [Google Scholar] [CrossRef]
  27. Atwood, D.; Small, D.; Gens, R. Improving PolSAR Land Cover Classification With Radiometric Correction of the Coherency Matrix. IEEE J. Sel. Top. Appl. Earth Obs. Remote Sens. 2012, 5, 848–856. [Google Scholar] [CrossRef]
  28. Brock, B.; Doerry, A. Radar Cross Section of Triangular Trihedral Reflector with Extended Bottom Plate; U.S. Department of Commerce, National Techical Information Service: Springfield, VA, USA, 2009.
  29. Garthwaite, M.C. On the Design of Radar Corner Reflectors for Deformation Monitoring in Multi-Frequency InSAR. Remote Sens. 2017, 9, 648. [Google Scholar] [CrossRef]
  30. Qin, Y.; Perissin, D.; Lei, L. The Design and Experiments on Corner Reflectors for Urban Ground Deformation Monitoring in Hong Kong. Int. J. Antennas Propag. 2013, 2013, 191685. [Google Scholar] [CrossRef]
  31. Jauvin, M.; Yan, Y.; Trouvé, E.; Fruneau, B.; Gay, M.; Girard, B. Integration of Corner Reflectors for the Monitoring of Mountain Glacier Areas with Sentinel-1 Time Series. Remote Sens. 2019, 11, 988. [Google Scholar] [CrossRef]
  32. Bamler, R.; Hartl, P. Synthetic Aperture Radar Interferometry. Inverse Probl. 1998, 14, R1. [Google Scholar] [CrossRef]
  33. Czikhardt, R.; van der Marel, H.; van Leijen, F.J.; Hanssen, R.F. Estimating Signal-to-Clutter Ratio of InSAR Corner Reflectors From SAR Time Series. IEEE Geosci. Remote Sens. Lett. 2022, 19, 4012605. [Google Scholar] [CrossRef]
  34. Carsey, F.D. Microwave Remote Sensing of Sea Ice; American Geophysical Union: Washington, DC, USA, 1992; ISBN 978-0-87590-033-9. [Google Scholar]
  35. Bourbigot, M. Sentinel-1 Product Definition 2016. Available online: https://sentinels.copernicus.eu/documents/247904/1877131/Sentinel-1-Product-Definition.pdf/6049ee42-6dc7-4e76-9886-f7a72f5631f3?t=1461673251000 (accessed on 4 July 2022).
  36. Andersson, F.; Moses, R.; Natterer, F. Fast Fourier Methods for Synthetic Aperture Radar Imaging. IEEE Trans. Aerosp. Electron. Syst. 2012, 48, 215–229. [Google Scholar] [CrossRef]
  37. Tienda, C.; Bertl, N.; Younis, M.; Krieger, G. Characterization of the Cross-Talk SAR Image Produced by the Cross-Polarization in a Single Offset Parabolic Reflector. In Proceedings of the 2015 9th European Conference on Antennas and Propagation (EuCAP), Lisbon, Portugal, 13–17 April 2015; pp. 1–4. [Google Scholar]
  38. Dadhich, G.; Sharma, S.; Rambhia, M.; Mathur, A.K.; Patel, P.R.; Shukla, A. Image Quality Characterization of Fine Resolution RISAT-1 Data Using Impulse Response Function. Geocarto Int. 2019, 34, 586–596. [Google Scholar] [CrossRef]
  39. Small, D. Flattening Gamma: Radiometric Terrain Correction for SAR Imagery. IEEE Trans. Geosci. Remote Sens. 2011, 49, 3081–3093. [Google Scholar] [CrossRef]
  40. Vu, V.T.; Sjögren, T.K.; Pettersson, M.I.; Gustavsson, A. Definition on SAR Image Quality Measurements for UWB SAR. In Image and Signal Processing for Remote Sensing XIV; SPIE: Bellingham, WA, USA, 2008; Volume 7109, pp. 367–375. [Google Scholar]
  41. Martínez, A.; Marchand, J.L. SAR Image Quality Assessment. Rev. Teledetec. 1993, 2, 12–18. [Google Scholar]
  42. Schwerdt, M.; Schmidt, K.; Tous Ramon, N.; Klenk, P.; Yague-Martinez, N.; Prats-Iraola, P.; Zink, M.; Geudtner, D. Independent System Calibration of Sentinel-1B. Remote Sens. 2017, 9, 511. [Google Scholar] [CrossRef]
  43. Gray, A.L.; Vachon, P.W.; Livingstone, C.E.; Lukowski, T.I. Synthetic Aperture Radar Calibration Using Reference Reflectors. IEEE Trans. Geosci. Remote Sens. 1990, 28, 374–383. [Google Scholar] [CrossRef]
  44. Li, C.; Zhao, J.; Yin, J.; Zhang, G.; Shan, X. Analysis of RCS Characteristic of Dihedral Corner and Triangular Trihedral Corner Reflectors. In Proceedings of the 2010 5th International Conference on Computer Science Education, Hefei, China, 24–27 August 2010; pp. 40–43. [Google Scholar]
  45. Ulander, I.M.H. Accuracy of Using Point Targets for SAR Calibration. IEEE Trans. Aerosp. Electron. Syst. 1991, 27, 139–148. [Google Scholar] [CrossRef]
  46. Praveen, T.N.; Vinod Raju, M.; Vishwanath, B.D.; Meghana, P.; Manjula, T.R.; Raju, G. Absolute Radiometric Calibration of RISAT-1 SAR Image Using Peak Method. In Proceedings of the 2018 3rd IEEE International Conference on Recent Trends in Electronics, Information & Communication Technology (RTEICT), Bangalore, India, 18–19 May 2018; pp. 456–460. [Google Scholar]
  47. Ketelaar, G.; Marinkovic, P.; Hanssen, R. Validation of Point Scatterer Phase Statistics in Multi-Pass InSAR. In Envisat & ERS Symposium; ESA Special Publication; ESA: Salzburg, Austria, 2005; Volume 572, p. 72.1. [Google Scholar]
  48. Dawson, J. Satellite Radar Interferometry with Application to the Observation of Surface Deformation in Australia; The Australian National University: Canberra, Australia, 2008. [Google Scholar]
  49. Ferretti, A.; Savio, G.; Barzaghi, R.; Borghi, A.; Musazzi, S.; Novali, F.; Prati, C.; Rocca, F. Submillimeter Accuracy of InSAR Time Series: Experimental Validation. IEEE Trans. Geosci. Remote Sens. 2007, 45, 1142–1153. [Google Scholar] [CrossRef]
  50. Balss, U.; Gisinger, C.; Eineder, M. Measurements on the Absolute 2-D and 3-D Localization Accuracy of TerraSAR-X. Remote Sens. 2018, 10, 656. [Google Scholar] [CrossRef]
  51. Gisinger, C.; Schubert, A.; Breit, H.; Garthwaite, M.; Balss, U.; Willberg, M.; Small, D.; Eineder, M.; Miranda, N. In-Depth Verification of Sentinel-1 and TerraSAR-X Geolocation Accuracy Using the Australian Corner Reflector Array. IEEE Trans. Geosci. Remote Sens. 2021, 59, 1154–1181. [Google Scholar] [CrossRef]
  52. Gisinger, C.; Libert, L.; Marinkovic, P.; Krieger, L.; Larsen, Y.; Valentino, A.; Breit, H.; Balss, U.; Suchandt, S.; Nagler, T.; et al. The Extended Timing Annotation Dataset for Sentinel-1—Product Description and First Evaluation Results. IEEE Trans. Geosci. Remote Sens. 2022, 60, 5232622. [Google Scholar] [CrossRef]
  53. Balss, U.; Gisinger, C.; Eineder, M.; Breit, H.; Schubert, A.; Small, D. Survey Protocol for Geometric SAR Sensor Analysis; ESRIN: Frascati, Italy, 2018. [Google Scholar]
  54. Small, D.; Schubert, A. Guide to Sentinel-1 Geocoding; RSL, UZH, 2022; p. 42. Available online: https://sentinel.esa.int/documents/247904/1653442/Guide-to-Sentinel-1-Geocoding.pdf (accessed on 22 February 2024).
  55. Wegmuller, U.; Werner, C. GAMMA SAR Processor and Interferometry Software. In Proceedings of the 3rd ERS Scientific Symposium, Florencen, Italy, 17 March 1997. [Google Scholar]
  56. ASF ASF Data Search. Available online: https://search.asf.alaska.edu/#/ (accessed on 22 February 2024).
  57. Calabrese, D.; Episcopo, R. Derivation of the SAR Noise Equivalent Sigma Nought. In Proceedings of the EUSAR 2014: 10th European Conference on Synthetic Aperture Radar, Berlin, Germany, 3–5 June 2014; pp. 1–4. [Google Scholar]
  58. Department of Meteorology Climatological Information. Available online: https://www.moa.gov.cy/moa/dm/dm.nsf/home_en/home_en?openform (accessed on 19 January 2024).
  59. Hanssen, R.F. Radar Interferometry: Data Interpretation and Error Analysis; Springer Science and Business Media: Berlin/Heidelberg, Germany, 2001; ISBN 978-0-7923-6945-5. [Google Scholar]
  60. Hersbach, H.; Bell, B.; Berrisford, P.; Hirahara, S.; Horányi, A.; Muñoz-Sabater, J.; Nicolas, J.; Peubey, C.; Radu, R.; Schepers, D.; et al. The ERA5 Global Reanalysis. Q. J. R. Meteorol. Soc. 2020, 146, 1999–2049. [Google Scholar] [CrossRef]
  61. Eineder, M.; Minet, C.; Steigenberger, P.; Cong, X.; Fritz, T. Imaging Geodesy—Toward Centimeter-Level Ranging Accuracy With TerraSAR-X. IEEE Trans. Geosci. Remote Sens. 2011, 49, 661–671. [Google Scholar] [CrossRef]
  62. Cong, X.; Balss, U.; Eineder, M.; Fritz, T. Imaging Geodesy—Centimeter-Level Ranging Accuracy With TerraSAR-X: An Update. IEEE Geosci. Remote Sens. Lett. 2012, 9, 948–952. [Google Scholar] [CrossRef]
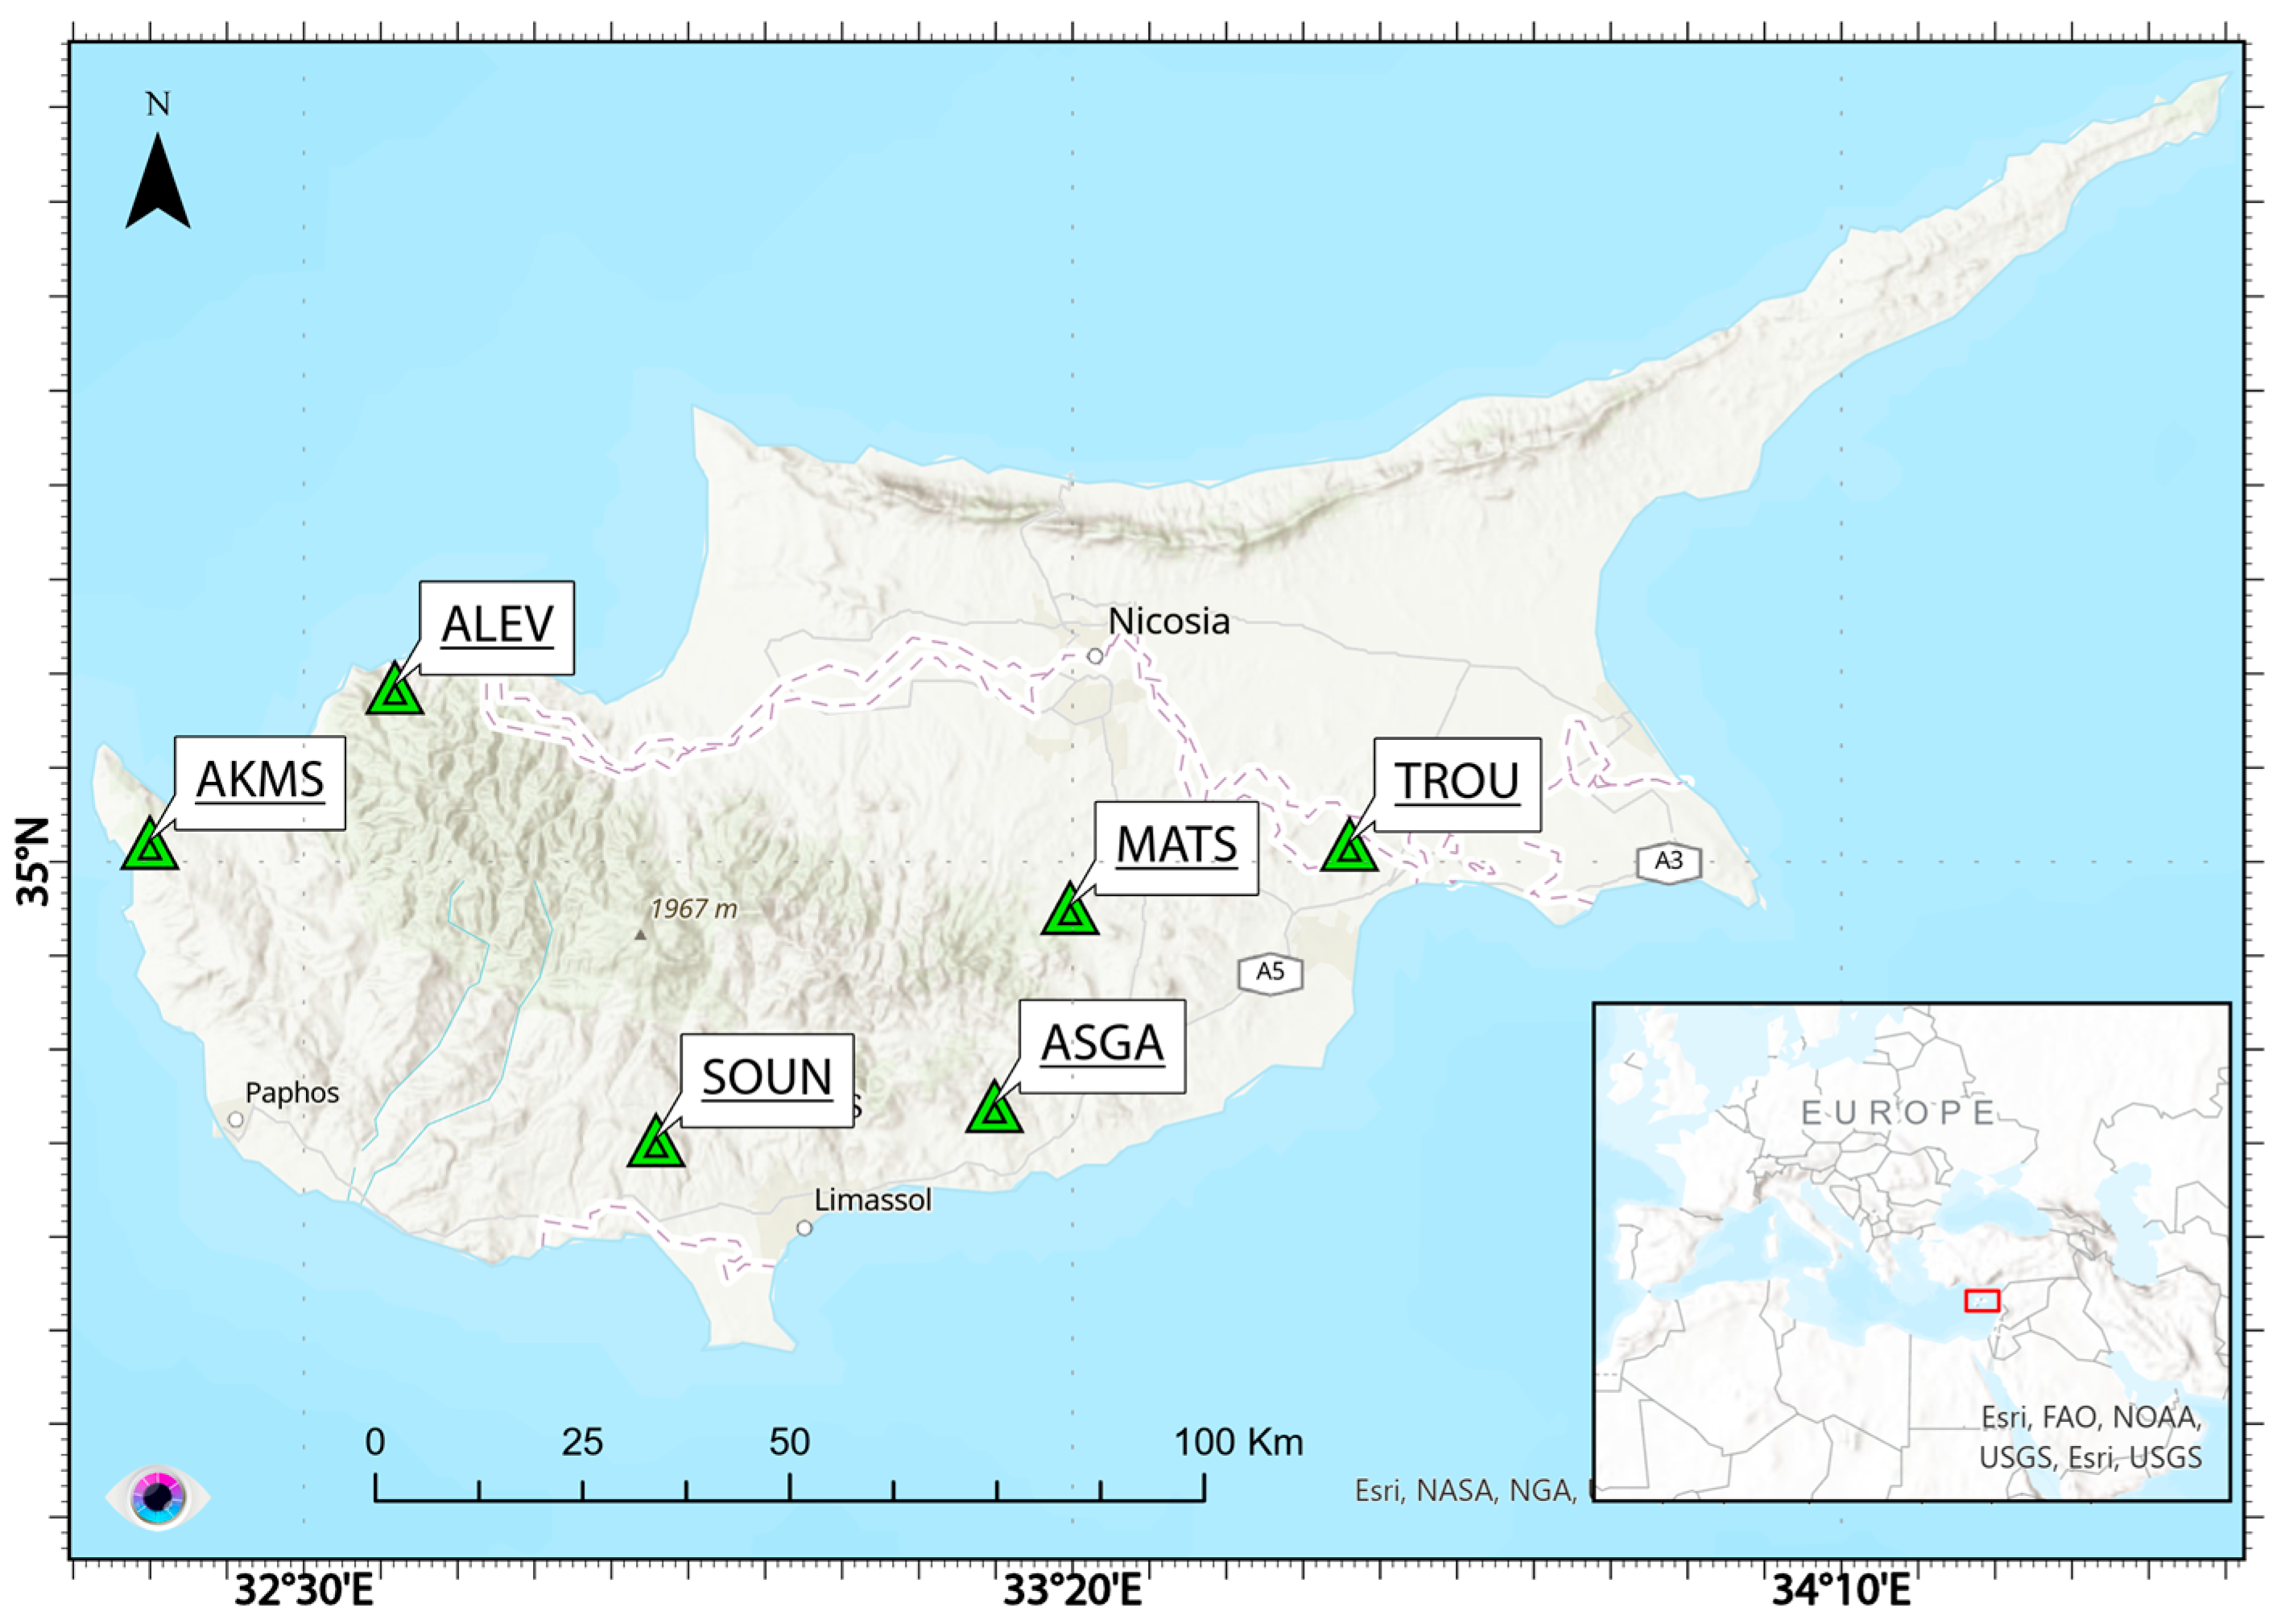
Figure 1. The CyCLOPS permanent network. Green triangles denote the co-located GNSS CORS and CRs sites [6].
Remotesensing 16 01696 g001
Figure 2. A representative example of a CyCLOPS permanent segment: (a) the site’s collocation in the Alevga area; (b) a CR with the ID ALEV02, oriented on the descending pass of Sentinel-1; (c) the GNSS CORS monumented based on the UNAVCO shallow drilled braced-type (SDBM) and equipped with a solar panel, tiltmeter, and weather station; and (d) a CR with the ID ALEV01, oriented on the ascending pass of Sentinel-1.
Remotesensing 16 01696 g002
Figure 3. An example of the relative orbits 160 and 167, S-1A acquisitions over Cyprus.
Remotesensing 16 01696 g003
Figure 4. The normalization areas of β0 and σ0. Aβ is the blue-coloured area, whereas the red-coloured area defines Aσ which is aligned with a ground plane as modelled by a reference ellipsoid. Redrawn from [27].
Remotesensing 16 01696 g004
Figure 5. The geometry of a triangular trihedral CR [6]. (a) θ represents the azimuth angle and ψ the elevation angle; (b) an adjustment of a triangular trihedral CR. ψ represents the elevation angle, Φ the off-nadir angle, and α the CR baseplate elevation angle.
Remotesensing 16 01696 g005
Figure 6. The sinc function magnitude of a point target as a cut through the peak in the slant range.
Remotesensing 16 01696 g006
Figure 7. Point target response area for IRF analysis. The blue-coloured point indicates the point target peak, the blue rectangle outlines the mainlobe area encompassing 2 × 2 resolution cells, and the outer area of the ISLR is defined as the green rectangle which equals 20 × 20 resolution cells.
Remotesensing 16 01696 g007
Figure 8. The IRF of a TTCR depicts the spatial resolution image quality parameter in slant range.
Remotesensing 16 01696 g008
Figure 9. The PSLR estimation in an IRF graph. Green dots highlight the maximum intensity in the peak and maximum sidelobe.
Remotesensing 16 01696 g009
Figure 10. The TTCR response function of SOUN01, after interpolation, in the S-1A IW VV images of 17.10.2023, for the ascending pass. (a,b) The plots represent a cut through the peak in the slant range and azimuth direction, respectively, while (c) illustrates the point target relative power in a 3D plot.
Remotesensing 16 01696 g010aRemotesensing 16 01696 g010b
Figure 11. The temporal variation in spatial resolution from the TTCR in ASGA corresponding to the ascending pass, for the monitoring period. (a) Spatial resolution in range, and (b) spatial resolution in azimuth.
Remotesensing 16 01696 g011aRemotesensing 16 01696 g011b
Figure 12. A representative example of the definition of the TROU02 point target response area. The yellow square target window outlines the outer area (20 × 20). Within it, the red window defines the mainlobe area. The green cross, encompassing the sidelobes of the CR’s response, separates this defined area from the clutter area, which consists of four quadrants.
Remotesensing 16 01696 g012
Figure 13. The soil and dust deposition at ALEV02 which led to the obstruction of the drainage hole, resulting in poor water drainage, and therefore a dramatic reduction in RCS response.
Remotesensing 16 01696 g013
Figure 14. The differences in the RCS for each TTCR compared to RCST (theoretical RCS–actual RCS). The estimates are derived by averaging the values measured in GRD images using the integral method. The error bars are the standard 1-sigma errors (1σ) of these observations.
Remotesensing 16 01696 g014
Figure 15. The results of the analysis derived from the peak method. The RCS difference for each TTCR, from theory. RCS estimates are derived by averaging the values measured in SLC images. The error bars are the standard 1-sigma errors (1σ) of these observations.
Remotesensing 16 01696 g015
Figure 16. Average estimated RCS difference for all TTCRs for both methods.
Remotesensing 16 01696 g016
Figure 17. The average estimations of the average displacement error in LoS, for each TTCR. Error bars are the standard deviations of these observations. The CR IDs are as defined in Table 5.
Remotesensing 16 01696 g017
Figure 18. The positioning corrections in range and azimuth performed individually for each SAR acquisition. Blue-coloured triangles represent the initial position in a single S-1A acquisition, whereas black-coloured triangles are the final positions after the analysis. (a) The ALE of the AKMS01 TTCR (ascending), and (b) the ALE of the AKMS02 TTCR (descending).
Remotesensing 16 01696 g018
Table 1. S-1 IW SLC product performance parameters [35].
ParametersIW1IW2IW3
* PSLR in range and azimuth [dB]<−21.2
* ISLR in range and azimuth [dB]<−16.1
Slant Range Resolution [m]2.73.13.5
Azimuth Resolution [m]22.522.722.6
* The PSLR and ISLR characteristics remain the same across all IW sub-swaths.
Table 2. Statistics of spatial resolution quality assessment.
Range [m]Azimuth [m]
IW1
Mean2.721.9
St. Deviation0.090.5
Max2.822.8
Min2.520.8
IW2
Mean3.122.1
St. Deviation0.090.6
Max3.323.5
Min2.921.2
IW3
Mean3.521.8
St. Deviation0.090.5
Max3.722.8
Min3.420.8
Table 3. Statistics of the ISLR quality measurements.
Range [dB]Azimuth [dB]
Mean−19.3−20.2
St. Deviation2.23.4
Max−15−13.6
Min−25.8−34.8
Table 4. Details of the S1A IW-VV products used for analysis.
ProductRel. Orbit No.FrameModePixel Spacing (rg × az) [m]Spatial Resolution (rg × az) [m]No. of LooksCoordinate System
SLC160, 167107, 112,
476
IW2.3 × 14.12.7 × 22 to 3.5 × 221Slant Range
×
Azimuth
GRD160, 167107, 112,
476
IWH
10 × 10
H
20 × 22
5 × 1Ground Range
×
Azimuth
Table 5. Mean RCS [dBm2] estimations for each TTCR. IDs ending in 01 correspond to measurements for the ascending pass, while IDs ending in 02 denote the descending pass.
Code No.IDMean RCS
± 1σ
Standard DeviationDiff. from RCST
1SOUN0137.9 ± 0.04±0.30.5
2AKMS0137.6 ± 0.05±0.30.8
3ALEV0137.3 ± 0.06±0.41.1
4ASGA0137.6 ± 0.04±0.30.8
5MATS0138 ± 0.03±0.20.4
6TROU0137.5 ± 0.06±0.40.9
7SOUN0238 ± 0.03±0.20.4
8AKMS0237.7 ± 0.04±0.30.7
9ALEV0237.2 ± 0.07±0.51.2
10ASGA0237.7 ± 0.06±0.50.7
11MATS0237.3 ± 0.05±0.41.1
12TROU0237.6 ± 0.04±0.30.7
Table 6. Mean RCS [dBm2] estimations before and after realignment of TTCRs.
Code No.IDMean RCS
before Realignment
Mean RCS
after Realignment
3ALEV0136.4 ± 0.0537.5 ± 0.06
8AKMS0237.4 ± 0.0438.2 ± 0.03
9ALEV0236.3 ± 0.0737.8 ± 0.05
Table 7. The mean RCS [dBm2] estimations of each TTCR using the peak method.
Code No.IDMean RCS
± 1σ
Standard DeviationDiff. from RCST
1SOUN0137.8 ± 0.03±0.30.6
2AKMS0137.8 ± 0.03±0.20.6
3ALEV0137.5 ± 0.06±0.50.9
4ASGA0137.8 ± 0.04±0.30.6
5MATS0137.5 ± 0.03±0.20.9
6TROU0137.4 ± 0.03±0.21.0
7SOUN0238.0 ± 0.03±0.20.4
8AKMS0237.5 ± 0.04±0.30.9
9ALEV0237.8 ± 0.05±0.60.6
10ASGA0237.6 ± 0.04±0.30.8
11MATS0237.3 ± 0.03±0.21.1
12TROU0237.3 ± 0.02±0.21.1
Table 8. Estimated range and azimuth accuracy limits for each TTCR in S-1A IW SLC products based on spatial resolution quality assessment.
TTCRSCR [dB]Location
Accuracy
[Res. Cells]
Expected Localization Accuracy
Range [m]Azimuth [m]
SOUN0128.70.0140.0440.298
AKMS0129.60.0130.0400.269
ALEV0122.00.0310.0960.644
ASGA0127.00.0170.0610.380
MATS0129.40.0130.0460.288
TROU0129.40.0130.0460.288
SOUN0229.00.0140.0430.288
AKMS0224.50.0230.0720.483
ALEV0221.30.0340.1040.698
ASGA0227.70.0160.0430.352
MATS0227.90.0160.0420.344
TROU0227.60.0160.0440.356
Table 9. The ALE estimates for each TTCR and the difference from the expected localization accuracy depicted in Table 8. The inequality signs indicate whether the expected accuracy is greater (>) or smaller (<) than the ALE.
TTCR IDRange ALE
[m]
Azimuth ALE [m]Difference from the Expected
Accuracy (Expected-|ALE|)
Range [m]Azimuth [m]
AKMS01−0.001 ± 0.0390.154 ± 0.277(>) 0.043(>) 0.144
AKMS02−0.051 ± 0.071−0.094 ± 0.509(>) 0.021(>) 0.389
ALEV010.006 ± 0.096−0.011 ± 0.682(>) 0.090(>) 0.633
ALEV02−0.029 ± 0.130−0.386 ± 0.925(>) 0.075(>) 0.312
ASGA010.016 ± 0.0600.134 ± 0.377(>) 0.045(>) 0.003
ASGA02−0.021 ± 0.042−0.273 ± 0.347(>) 0.051(>) 0.079
MATS010.025 ± 0.046−0.369 ± 0.286(>) 0.021(<) 0.081
MATS02−0.041 ± 0.041−0.181 ± 0.330(>) 0.001(>) 0.163
SOUN010.010 ± 0.0440.333 ± 0.313(>) 0.034(<) 0.035
SOUN020.009 ± 0.042−0.09 ± 0.304(>) 0.034(>) 0.193
TROU01−0.029 ± 0.046−0.198 ± 0.287(>) 0.017(>) 0.090
TROU02−0.043 ± 0.044−0.060 ± 0.194(>) 0.001(>) 0.296
Disclaimer/Publisher’s Note: The statements, opinions and data contained in all publications are solely those of the individual author(s) and contributor(s) and not of MDPI and/or the editor(s). MDPI and/or the editor(s) disclaim responsibility for any injury to people or property resulting from any ideas, methods, instructions or products referred to in the content.