Abstract
With the development of navigation satellite constellation systems, to improve navigation service and orbit determination performance, the accuracy requirements for maintaining temporal references have increased rapidly. Among the current navigation satellites, a dual one-way ranging (DOWR) approach based on intersatellite links (ISLs) is widely adopted in the BeiDou system and global positioning system (GPS) to transmit satellite time reference information. However, the accuracy of DOWR is restricted by the pseudonoise (PN) code rate. To improve the accuracy of DOWR, the PN code measurement must be replaced by the carrier phase measurement. This paper introduces an algorithm that utilizes frequency hopping to achieve carrier phase ranging. In addition to the high-precision advantages of carrier phase measurements, the anti-interference performance of the ranging signal is also improved due to the characteristics of the frequency hopping signal itself. Ultimately, at a carrier-to-noise ratio of 40 dB-Hz, the measurement accuracy is 9.54 μm, while the PN code measurement accuracy in the same environment is 0.13 m. As the carrier-to-noise ratio increases, the measurement accuracy further improves.
1. Introduction
A navigation satellite constellation can construct a high-precision, spatial–temporal reference that provides navigation and location services to users [1]. The spatial reference is obtained through orbit determination, and the temporal reference is transferred via a ground time reference [2]. In the Global Navigation Satellite System (GNSS), to enhance orbit determination and time synchronization accuracy, the BeiDou system and GPS adopt intersatellite links (ISLs) [3]. The ISLs refer to the effective expansion of the telemetry, tracking, and command (TT&C) and communications range of ground stations [4,5] by establishing communication and measurement links between satellites. On the one hand, measurements via ISLs can effectively improve orbit determination and time synchronization performance in GNSSs; on the other hand, ground stations can control satellites that cannot be directly linked to ground stations [6].
Improving the precision of the measurement method, reducing measurement errors, and employing an advanced data processing algorithm for ISLs can enhance orbit determination and time synchronization accuracy. In the GPS and BeiDou system (BDS), the ISLs adopt dual one-way ranging (DOWR) to measure the distance and time difference between different satellites [7]. The accuracy of satellite orbit determination and time synchronization is restricted by the precision of ISL measurements.
The radio ISL adopts pseudonoise (PN) code, a carrier phase, and a binary offset carrier (BOC) signal to measure the distance between different satellites [7,8]. The receiving satellite measures the PN code offset, carrier phase offset, and square wave offset, which represent the distance and time delay between the transmitter and receiver, respectively. The K-band ranging system (KBR) in the GRACE project of the U.S. calculates the orbit and range change rate of low-orbit satellites. At a distance of 200 km between satellites, the speed measurement accuracy is 1 μm/s, and the ranging variance is 1–2 mm [9]. In addition, Huang Fei et al. proposed a satellite dynamic DOWR algorithm that uses a combination of intersatellite pseudodistance fitting and time difference fitting to determine the relative temporal difference between satellites. The performance of the related method reached a time synchronization error within 5 ns [10]. Wang H.Y. et al. discussed a time synchronization algorithm based on single-point pseudorange conversion, which can be applied to DOWR between satellites in highly dynamic environments [11]. Pan Junyang combined the satellite ground clock deviation data collected using the bidirectional time–frequency transmission equipment of the BeiDou experiment and the relative clock deviation obtained from the intersatellite link to achieve in-orbit calibration of the transmission delay of the intersatellite link channel. The delay calculation accuracy is better than 0.3 ns [12]. Due to the accuracy improvement requirement, Shen adopted a laser DOWR whose accuracy was at the femtosecond level [13]. However, laser ISLs are limited by laser pointing, which cannot provide flexible access services to users. In addition, to improve the anti-interference performance and mitigate the autocorrelation function (ACF) ambiguity of dual-frequency multiplexing modulation, Ma J.G adopted a frequency hopping alternated binary offset carrier [14,15].
To achieve high-accuracy measurements and flexible access services, radio phase measurements are employed for ISL communication. The carrier phase ranging between the satellite and the ground mainly utilizes precise single-point positioning techniques and multifrequency carrier phase measurements. The former can obtain high-precision carrier phase positioning results via satellite orbit, messages, etc. [16,17]. Multifrequency carrier phase measurements transmit signals simultaneously at multiple frequency points via satellites. Cocard et al. [18] studied and analyzed the dual and triple frequencies of GPS signals and analyzed the integer linear combination of the GPS triple frequency [18]. Zhang et al. analyzed the BDS triple-frequency carrier phase combination in detail [19]. In addition to the linear combination method, researchers solve for integer ambiguity by means of search methods, such as the Lambda algorithm [20,21]. This approach reduces the correlation between variance components via the integer Gauss transform to improve the search efficiency. Based on the traditional Lambda algorithm, researchers have adopted prior information such as multiantenna attitude and antenna baseline length to improve the probability of success with regard to ambiguity resolution [21,22].
In this paper, an improved time synchronization method based on the original DOWR synchronization method is proposed for the ISL application environment. We adopt a frequency hopping (FH) signal to achieve carrier phase DOWR. Frequency hopping signals receive/transmit signals at multiple frequencies through the same radio frequency channel, reducing resource consumption. Furthermore, the frequency hopping signal exhibits superior anti-jamming performance compared to the BPSK signal, thereby effectively enhancing the anti-jamming performance of the ISL.
The structure of the paper is as follows. First, we describe the basic principle of the ISL measurement and transmit/receive signal model. Second, we introduce the frequency hopping carrier phase measurement system. At the receiving end, we adopt signal extrapolation and phase fitting to improve the continuity of the signal and implement the correct rate for the carrier phase integer ambiguity solution. Finally, the period of frequency hopping, frequency hopping performance, and continuous signal performance are analyzed theoretically and simulated.
2. FH Dual One-Way Ranging in ISL
2.1. The Theory of Dual One-Way Ranging
The structure of the DOWR model is as follows (Figure 1).
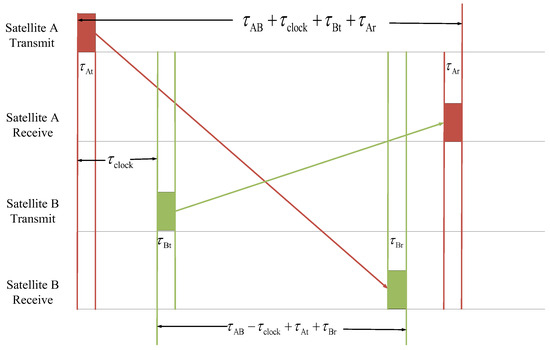
Figure 1.
The structure of the DOWR model.
Two satellites are equipped with ISL transmitters and receivers and measure the pseudorange through a local receiver. The time synchronization, clock difference calibration, true range calculation, and data transmission calculations are achieved by exchanging the pseudorange. Each satellite is capable of independently modulating, transmitting, receiving, and demodulating data and can achieve a single-channel pseudorange measurement function through the transmitted spread spectrum code [23,24]. The signal delays measured using satellite A and satellite B are shown in (1):
and are the time delays measured using satellite A and satellite B, respectively. is the true time delay, is the clock difference between satellites A and B, and and are the transmit channel delays. and are the receive channel delays. To calculate , (1) can be expressed as (2).
Because , , , and are measured via channel calibration, we assume that they are known. Therefore, each satellite can calculate the true distance and clock difference .
2.2. FH-DOWR Signal Mode
The accuracy of carrier phase ranging is greater than that of the PN code by many orders of magnitude, but the ambiguity of the carrier phase is difficult to solve. Currently, carrier phase ranging is achieved using multiple frequency carrier phase measurements. In a GNSS carrier phase measurement, since one satellite transmits and receives dual-frequency signals simultaneously, the carrier phase integer ambiguity can be resolved using the dual frequency.
The signal model is shown in (3).
where is the transmit signal. is the PN code sequence. is the transmitted data. Based on the PN code offset, we calculate the transmit delay and the pseudoranging result . Based on the carrier phase measurement, we can obtain the carrier phase decimal cycle measurement results of and . The relationships between and are given in (4).
In the ISL receiver, the code tracking loop can output and the carrier tracking loop can output . However, are the carrier phase integer cycle measurement results, which are unknown. is the light speed. is the clock difference between the transmitting satellite and receiving satellite. is the pseudoranging error. is the carrier phase measurement error. Converting (4) and (5) to (6) and (7), the following are obtained:
Thus, the integer ambiguity of and is and , respectively. However, the probability of the correct integer ambiguity is determined by the second item on the right side, which encompasses the measurement error associated with the PN code ranging and carrier phase measurement [25,26]. This error can manifest in decimeters or even meters without processing. If the carrier frequency exceeds a certain threshold, then the method cannot be used to obtain the correct integer ambiguity resolution result.
In this paper, we design the carrier phase ranging in the ISL, as shown in Figure 2.
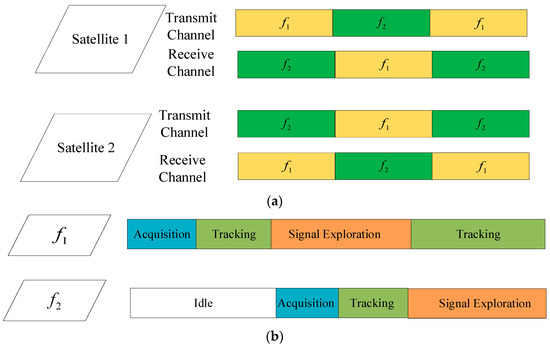
Figure 2.
Dual-frequency DOWR with time division: (a) transmitting and receiving time slot and (b) receiving channel.
The transmit signal can be expressed as (8):
where is the transmitting signal. is the PN code sequence. Its code length is 1023, and its code frequency is 5.115 MHz. is the signal switching time.
This method employs the same transmission and reception channels for both sending and receiving signals, thereby minimizing the utilization of hardware resources. However, the ranging performance is inevitably affected by discontinuous signals due to the utilization of the time division duplex (TDD) mode for transmission and reception.
To enhance the anti-interference capabilities, we propose the utilization of frequency hopping (FH) signals. FH signals are known for their ability to mitigate interference by rapidly changing their carrier frequencies. Building upon the foundation of Figure 2, the integration of FH signals into our system significantly improves its resilience against interference. The structure of the FH DOWR is depicted in Figure 3, and the transmitting signal is represented in (9).
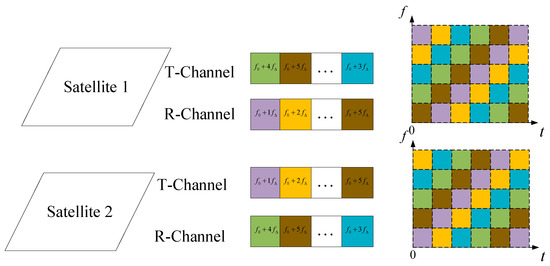
Figure 3.
FH DOWR.
Here, is the FH reference frequency and is the FH frequency interval. In this mode, carrier phase measurements can be guaranteed as long as two frequency point signals can be properly received.
Frequency hopping signal is a multicarrier transmission technology that can switch between multiple frequencies to achieve signal transmission. Its working principle is that when a signal is received it will switch from the received frequency to another frequency and transmit the signal between the different frequencies. Frequency hopping signals can provide faster transmission rates and higher efficiency bandwidth. In Figure 3, we show the hopping sequence of an FH signal.
The advantages of this method are as follows:
- When multiple frequency signals exist simultaneously, the satellite can obtain unambiguous carrier phase measurements via integer ambiguity resolving, providing a DOWR accuracy of one tenth of a wavelength;
- If there exists two frequency point signals without interference, then the carrier phase measurement accuracy of the signal can be guaranteed;
- The addition of signal frequency points effectively improves the anti-jamming and anti-intercept performance of the signal.
3. The FH Dual One-Way Ranging System
3.1. The Concept of Modulation and Demodulation
Figure 4a shows the design of a transmitter for an FH DOWR system. A pseudorandom sequence generator provides a frequency control sequence. The frequency selector selects a specific frequency modulation frequency based on the control sequence. The spread-spectrum signal is mixed with the FH signal using a multiplier. After filtering, the FH DOWR signal is output.
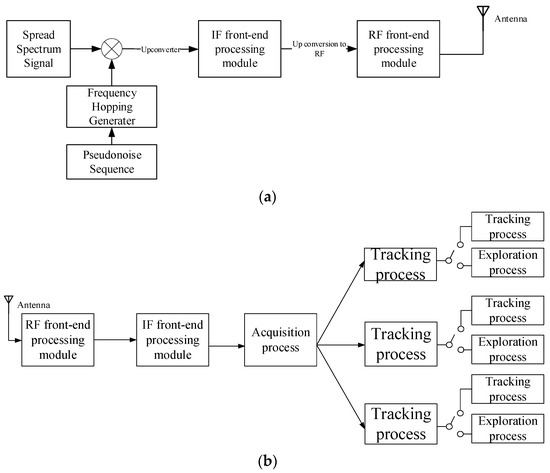
Figure 4.
FH DOWR system: (a) transmitter and (b) receiver.
Figure 4b shows the receiver of the FH DOWR system. At the receiving end, the filtered signal selects the frequency point at which there is signal input according to the hopping pattern. Then, the receiver acquires and tracks the signal and extrapolates it using the frequency results and orbital elements obtained from previous tracking results. In this way, we can obtain multiple frequency carrier phase measurements using only one transmission signal.
3.2. The Acquisition Algorithm of the FH DOWR Model
For satellites in TDD mode, the transmitting and receiving process is accompanied by signal reacquisition and retracking. The acquisition process obtains Doppler and code phase coarse estimate results for the receiving system. The steps are as follows:
Step 1. Downconverting the received radio frequency (RF) signal to the intermediate frequency (IF). The receiver generates the local IF carrier according to the hopping pattern and downconverts the signal to the baseband;
Step 2. Multiplying the fast Fourier transform (FFT) result of the local PN code by the FFT result of the baseband signal. The results were processed using the inverse fast Fourier transform (IFFT) [27].
Step 3. Recording the maximum position and maximum value of the IFFT value [27].
Step 4. Setting the local intermediate frequency as the center frequency point, recording the IFFT results at a Doppler frequency offset of −12 kHz~12 kHz [27].
Step 5. Outputting the code offset and Doppler frequency offset with the maximum correlation peak to the tracking stage.
Step 6. Switching to the next FH frequency point, after which the acquisition starts based on the hopping pattern.
Step 7. Since we have pre-estimated the Doppler frequency offset at the first frequency point, the Doppler offset value at the second frequency point can be estimated according to (10).
and are the first FH frequency point and Doppler frequency, respectively. and are the next FH frequency point and Doppler frequency, respectively. The acquisition process is shown in Figure 5.
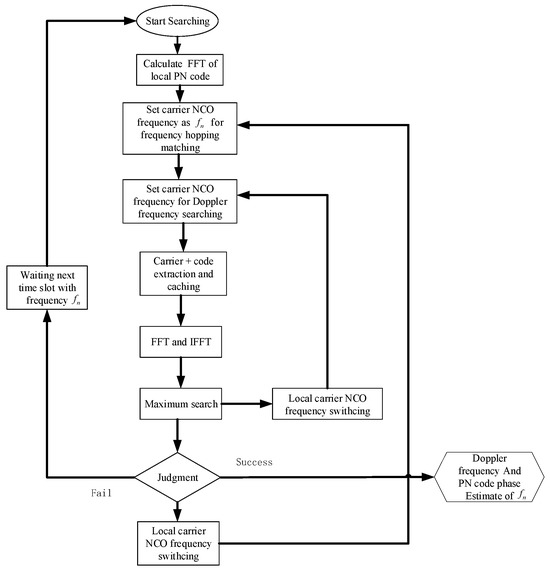
Figure 5.
FH DOWR signal acquisition process.
However, because the Doppler frequency searching step is 500 Hz, the FH Doppler frequency estimation error is −250 Hz~250 Hz. Therefore, it is necessary to detect the Doppler frequency of the next FH frequency point. The steps are listed as follows.
Step 1. The initial frequency is calculated as .
Step 2. The Doppler frequency was searched for at both sides of . The frequency searching order is shown in (11). The maximum correlation peak is calculated as (12):
Step 3. When the searching range exceeds −12 kHz~12 kHz, the is recorded as the Doppler frequency estimation result with . When the correlation peak at different frequencies satisfies , the search is stopped, and is recorded as the Doppler frequency estimation result with .
3.3. The Tracking Algorithm of the FH DOWR
The tracking loop adopts a frequency locked loop (FLL) and a phase locked loop (PLL) into track the carrier phase. In addition, a delay locked loop (DLL) is adopted for PN code tracking [28]. In carrier phase measurements, it is necessary to output the carrier phase from the carrier tracking loop [29,30]. However, for the TDD mode in the ISL, the DOWR needs to convert two time measurements into equivalent instantaneous observations; that is, the influence of propagation delay on the measurement must be corrected [31]. Because each satellite needs to transmit signals from multiple frequency points over time, the tracking loop of the satellite segment for multiple frequency points will frequently lose lock and reconnect, resulting in unstable carrier phase tracking and ultimately leading to an incorrect calculation of the integer ambiguity. Therefore, extrapolation methods are adopted for PLL and DLL to ensure the stability of carrier phase tracking. The structure is shown in Figure 6.

Figure 6.
Carrier phase output structure.
The extrapolation yields two values: the radial velocity and the distance . The calculation methods are shown in (13) and (14):
where and are the velocity and distance of the measurement time, respectively. and are the velocity and distance of the extrapolation time, respectively. is the radial acceleration, which is calculated based on orbital elements.
Considering that the switching time of the ISLs is , the radial acceleration error obtained through orbital elements is , and the radial velocity error obtained through orbital elements is . The radial velocity correction error obtained by integrating (11) is , and the radial distance measurement correction error obtained via (12) is . Assuming , , and , the velocity correction error is less than , and the Doppler correction error in the Ka frequency band is less than 0.02 Hz. The distance correction error is less than 0.1 m. Therefore, the distance correct error, CNR, and systematic error determine the ranging error totally.
3.4. The Carrier Phase Integer Ambiguity Resolution Algorithm
To obtain the carrier phase ranging result, it is necessary to solve the integer ambiguity of the carrier phase. In the carrier phase of the ISL, we should constrain the range of integer ambiguity through pseudorange rounding. By measuring the pseudorange of the interstellar link, a rough estimate of the overall ambiguity can be obtained as follows:
where is the ISL mark, is the frequency mark, and is the rounded-down mark. In the ISL measurements, the ranging accuracy without processing is 1~5 m. Thus, for signals with an RF frequency of 23 GHz, the residual integer ambiguity is within . We adopt the residual integer ambiguity resolution algorithm as follows.
Step 1: Obtain the ranging difference of the ISL. The ranging difference measured using the carrier phase should be roughly equal to the distance measured using the PN code, as shown in (16) and Figure 7.
where is the PN code ranging result. is the PN code ranging error. is the integer ambiguity of the frequency signal. is the wavelength of . is the phase difference of the signal between the transmitter and receiver; the value is less than . In addition, , , and are the parameters of .
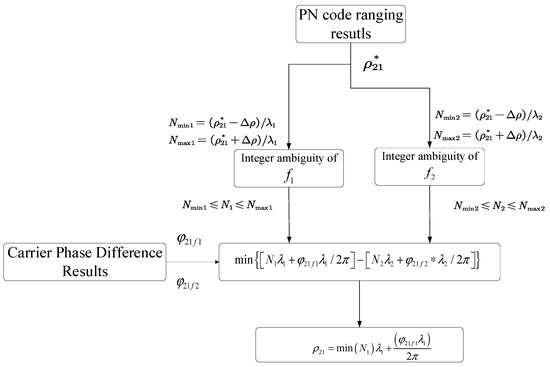
Figure 7.
Dual-frequency integer ambiguity resolution algorithm.
Step 2: Convert (16) to (17).
In (17), the unknown parameters on right side of the equation can be output by the tracking loop of Section 3.3.
Step 3: Search for and in the range of . The minimum value of is calculated, and is stored.
Step 4: Calculate the distance difference as (19)
When the SNR is low enough, it is necessary to improve the phase measurement accuracy of the carrier tracking loop through fitting. Due to the time-division method used in this article to receive signals from multiple frequency points, not all the carrier phase measurements are available. In this paper, we chose third-order polynomials to fit the measurement data. In Figure 8, the direct carrier phase output of PLL is shown in Figure 8a. The carrier phase measurement has significant jitter and cannot perform full cycle ambiguity resolution.
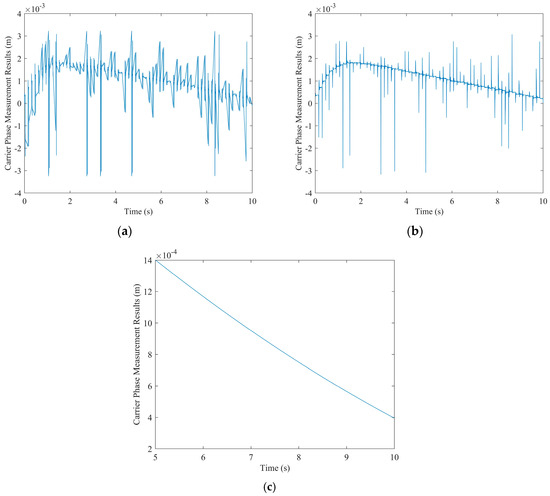
Figure 8.
Carrier phase output. (a) The carrier phase output of the PLL. (b) Carrier phase extraction. (c) Polynomial Fit.
4. Performance Analysis of the FH-DOWR Model
In this section, we investigate the performance of the FH-DOWR model in terms of the acquisition time, tracking performance, and carrier phase ranging error. In addition, we provide the simulation results via a software receiver.
4.1. Design of the Simulation Scenario
The design of the simulation scenario comes from the GPS ISLs. For intersatellite links, the radio frequency (RF) was set as and . The GPS orbit is shown in Figure 9a. The relative distance and velocity between Satellite-GPS-01 and other GPS satellites are given in Figure 9b,c. According to the simulation, the maximum distance between satellites is 52,000 km, and the minimum distance is 400 km. If a 23 GHz radio frequency is used for the ISL measurement, then the signal path loss is approximately 214 dB. We chose the EIRP of the transmitting satellite as 40 dBW and the G/T of the receiving satellite as 6 dB. In addition, the PN code length was 1023, and the PN code frequency was 10.23 MHz. Therefore, the carrier-to-noise ratio (CNR) at the receiving end ranged from 57 dB-Hz to 80 dB-Hz.
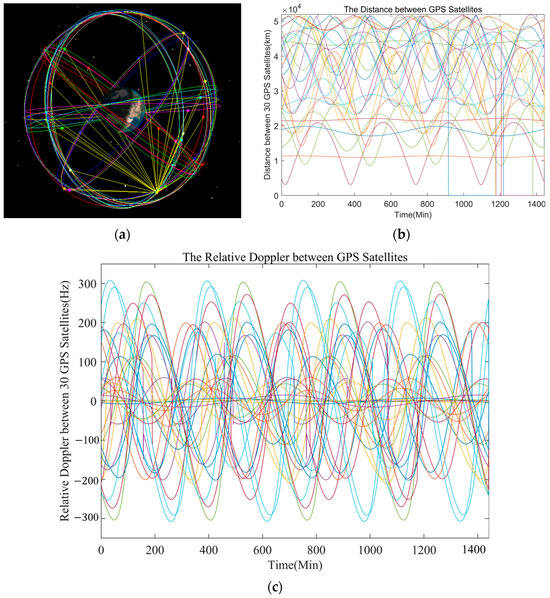
Figure 9.
Simulation scenario design. (a) GPS orbit. (b) Relative distance. (c) The relative Doppler.
4.2. Acquisition and Tracking Process Performance
The receiving process is accompanied by signal reacquisition and retracking. For FH-DOWR, the hopping patterns are the same at the transmitter and receiver. Thus, the FH characteristics of the signal are eliminated before the acquisition process. The time requirements of different processes in signal acquisition are shown in Figure 10. The total number of clock cycles required for one acquisition process is as follows
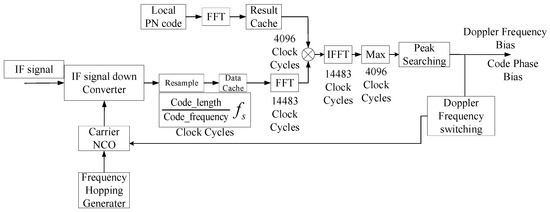
Figure 10.
The time consumption of the acquisition process.
is the PN code period. and are the time costs of the 4096-point FFT and IFFT, respectively. represents the time consumption of the local FFT receiving signal. is the time consumption required to reach the maximum IFFT. is the other clock cycle cost, which is approximately 100 clock cycles. In the system, the system sampling frequency is 81.84 MHz. Thus, the acquisition time of each Doppler frequency is 0.6 ms.
A single acquisition increases the probability of false alarms and missed alarms. The system uses a Tong detector to reduce them [32]. For the ISLs, the residual Doppler frequency search range is −12 kHz to 12 kHz, and the Doppler frequency search interval is 500 Hz. Based on the above parameters, the total time for achieving reacquisition of FH DOWR signals in ISL systems can be given as (21):
The tracking loop is composed of a DLL and PLL. The former tracks the PN code and outputs the pseudoranging results. The latter tracks the carrier phase and outputs the decimal cycle carrier phase measurement value.
The PN code frequency of the ISL is 10.23 MHz. The ranging accuracy of the receiver is dependent mainly on the thermal noise error of the DLL and the dynamic stress error caused by relative motion. The former is reflected in the random jitter of the DLL, while the latter is influenced by the code Doppler variation. The code Doppler variation has a strict coupling relationship with the carrier Doppler, and errors can be suppressed through the Doppler offset provided by the carrier loop. Therefore, the dynamic stress error can be ignored, and only the ranging error caused by thermal noise is considered [33]. The PN code ranging error is (22).
is the PN code length width. is the code interval of the DLL. is the bandwidth of the DLL. is the integration time. is the DLL correlator factor, which we chose to be 0.5. is the DLL discriminator factor, which we chose to be 1. An increase in , , and can improve the ranging accuracy.
The thermal noise error of the PLL is shown in (23) [34]:
The Doppler frequency error is expressed as (24):
is the PLL bandwidth, chosen as 10 Hz. The integration time is 2 ms. is the Doppler frequency measurement interval, which is 0.1 s. When the CNR is 53 dB-Hz, and .
4.3. The Combinational Error of FH-DOWR
- Error caused by the clock drift error
In the transmitter and receiver of the FH-DOWR system, high-precision and high-stability atomic clocks are equipped on satellites. However, there are still clock reference deviations (clock offsets) and clock frequency deviations (frequency offsets) between multiple satellites. Clock bias will result in different local pseudorange measurement times for satellite B and satellite A. This leads to ranging and time comparison errors. Taking the measurement of the relative distance between satellite B and satellite A as an example, we assume that the nominal value of the clock reference frequency between satellite B and satellite A is , the difference in frequency is , and the clock difference between satellite B and satellite A is . Equation (25) calculates the distance error caused by this deviation:
If the clock reference frequency is 10.23 MHz and if multiple satellites adopt FH-DOWR for time synchronization and calibration clock differences, then Δt can be restricted to less than 1 ms. However, if the desired ranging deviation caused by this term is less than 0.1 mm, then the requirement for the relative frequency difference between satellite B and satellite A is
Adopting an atomic clock with an accuracy and stability better than 5.0 × 10⁻¹⁰ as the reference frequency for satellite A and satellite B can meet the above requirements.
- 2.
- Error caused by the relative motion of satellites
The ranging error caused by clock bias drift is similar to that caused by relative motion between satellites during the clock deviation period Δt, and a change in relative distance will also lead to distance measurement deviation and time comparison error. The relative radial velocity between satellite B and satellite A is assumed to be . The distance measurement error caused by the relative motion between satellites during the clock deviation period is calculated as (27)
is the average of at . Due to the clock difference between satellite B and satellite A, we modify (2) to (28).
where . is the distance between satellite B and satellite A at the time when satellite B sends the ranging synchronization frame. It is contained in the local pseudoranging results of satellite A. is the distance between satellite A and satellite B at the time when satellite A sends the ranging synchronization frame. This is contained in the local pseudoranging results of satellite B. Therefore, the relative distance and clock difference calculated using satellites A and B are given by (29) and (30), respectively.
Equations (29) and (30) show that the relative motion between satellites A and B can cause clock correction errors. Consider that the clock difference is 0.1 s and . Taking satellite B as an example, when the clock difference is not adjusted, the distance measurement error and clock correction error are shown in (31):
According to (29), due to the unadjusted clock difference between satellite B and satellite A, the relative motion can cause significant distance measurement and time synchronization errors. If clock bias adjustment is implemented after each time comparison is completed, then the distance measurement error and clock correction error are shown in (30):
The residual clock difference is . From (30), after adjusting the clock difference between two satellites to within 0.1 μs, the distance and time synchronization errors between satellites caused by relative motion are extremely small and can be ignored.
5. Simulation Results of the FH-DOWR System
For the FH-DOWR system, the searching range for carrier phase integer ambiguity resolution is constrained by the PN code ranging accuracy. Based on (20), the relationship between the ranging accuracy and the CNR is shown in Figure 11. The results show that the code ranging accuracy is approximately 1.2~130 mm.
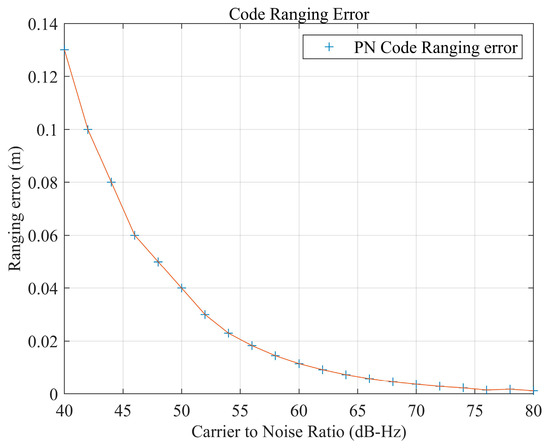
Figure 11.
The code ranging accuracy influenced by the CNR.
Importing the motion data from Figure 9 into the software transmitter and receiver, the Doppler frequency tracking error is shown in Figure 12.
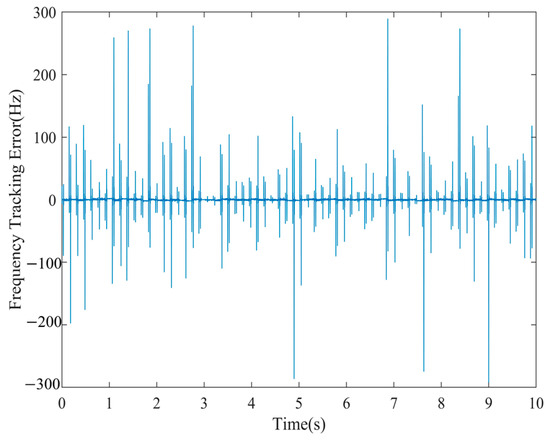
Figure 12.
Doppler frequency tracking error at CNR = 40 dB-Hz.
In the simulation of integer ambiguity resolution, the hopping frequency is 100/3 Hz, and the frequency is . The results of the Monte Carlo simulation are shown in Figure 13.
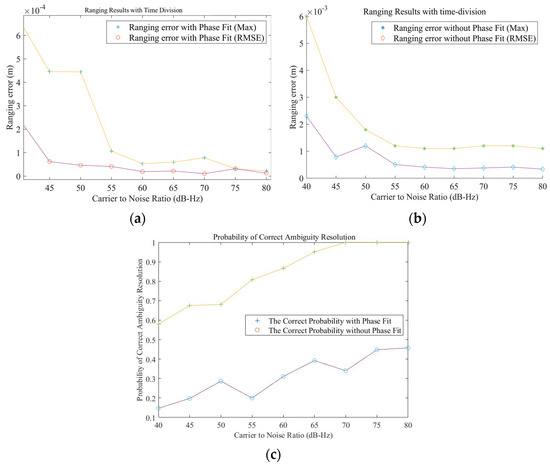
Figure 13.
Performance analysis of the carrier phase ranging of the FH-DOWR system: (a) measurement accuracy with carrier phase measurement value fitting; (b) measurement accuracy without measurement value fitting; and (c) probability of a successful calculation with and without fitting.
By analyzing the maximum and RMSE distance measurements, the simulation results at CNR = 40 dB-Hz show that if polynomial fitting is applied to the measured phase, then the accuracy probability of ambiguity resolution in the measurement results is greater than 58%. The maximum error in the carrier phase range under FH-DOWR is better than 0.6 mm (2.23 ps), and the RMSE is better than 0.247 mm (time synchronization accuracy is 0.824 ps). As the CNR increases, exceeding 60 dB-Hz, the probability of ambiguity resolution is 95.1%. Under these conditions, the maximum error in the carrier phase range is better than 0.0597 mm (the time synchronization accuracy is 0.199 ps), and the RMSE is better than 0.0217 mm (the time synchronization accuracy is 0.0728 ps). In this situation, with the increase in the CNR, the accuracy of the FH-DOWR system will remain at the level of 0.02 mm.
If the time division measurement values are not fitted, then the probability of correct ambiguity resolution will decrease, as shown in Figure 13c. For a 40 dB Hz carrier wave, the probability of successful calculation is only 0.147, and the accuracy of the carrier phase measurement also decreases. The maximum distance measurement error is better than 6 mm (the time synchronization accuracy is 0.02 ns), and the RMSE is better than 2.37 mm (the time synchronization accuracy is 7.91 ps). As the carrier-to-noise ratio increases, the probability of accuracy in ambiguity resolution increases; however, even under high carrier-to-noise ratio conditions such as 80 dB Hz, the probability of accuracy does not exceed 0.458. The maximum measurement accuracy error decreases to 1.1 mm and increases to 1.1 mm (the time synchronization accuracy is 3.67 ps) and 0.337 mm (the time synchronization accuracy is 1.13 ps).
If the transmitter and receiver can simultaneously transmit and receive signals from two frequency points, then more accurate carrier phase measurement results can be obtained. The frequencies are and . The Monte Carlo simulation results are shown in Figure 14.
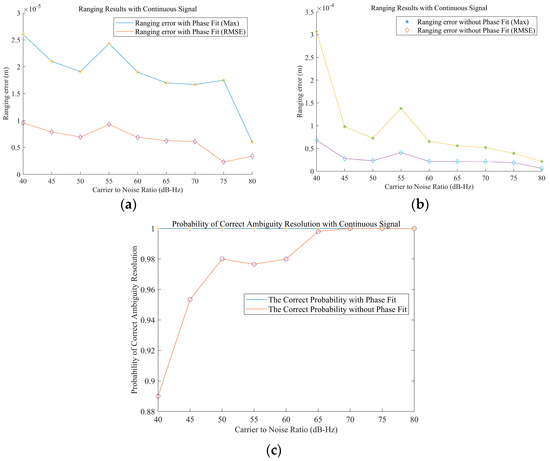
Figure 14.
Analysis of the carrier phase ranging performance in the case of dual-frequency continuous signals: (a) measurement accuracy with carrier phase measurement fitting; (b) measurement accuracy without measurement value fitting; and (c) probability of a successful calculation with and without fitting.
By analyzing the maximum and RMSE distance measurements, the simulation results under a CNR of 40 dB-Hz show that if polynomial fitting is applied to the carrier phase, then the accuracy probability of ambiguity resolution is 100% and the maximum error in the carrier phase range is 25.9 μm. The RMSE is superior to 9.54 μm. As the CNR increases, the measurement accuracy further improves. At a CNR of 80 dB-Hz, the maximum ranging is 5.99 μm and the RMSE is 3.35 μm.
If the carrier phase measurement results are not fitted, then the probability of correct ambiguity resolution decreases, as shown in Figure 14c. When the CNR is 40 dB-Hz, the probability of correct integer ambiguity resolution is 89.2% and the accuracy of the carrier phase measurement also decreases. However, it still has a ranging accuracy smaller than the 1% wavelength level, with a maximum ranging error of 0.307 mm and an RMSE better than 0.0679 mm. As the CNR increases, the probability of correct ambiguity resolution reaches 100% at 70 dB-Hz, the maximum measurement accuracy error decreases to 17.5 μm, and the RMSE is 2.28 μm.
However, under frequency division conditions, there is a difference in the hardware time delay between the two frequency channels. The parts that have the greatest impact on the consistency of the channel delay and the variation in the channel group delay are the RF and IF receiving and transmitting units. In the RF channel, all devices used are analog devices; therefore, the RF channels in different devices have different group delay characteristics. However, in actual environments, changes in environmental temperature and signal level can affect the characteristics of the entire channel, ultimately leading to changes in the results of high-precision ranging.
Considering that the delay deviation between two channels under frequency division conditions is 1 ps, a ranging error of 0.29 mm occurs. Therefore, how can the consistency of multiple RF channels be ensured under frequency division conditions?
For carrier phase measurements in an FH-DOWR system, as the signal switching time increases, the carrier phase ranging performance improves. Figure 15 shows the ranging performance under a CNR of 60 dB-Hz, with a signal switching time of 10 ms~210 ms during the frequency hopping period.
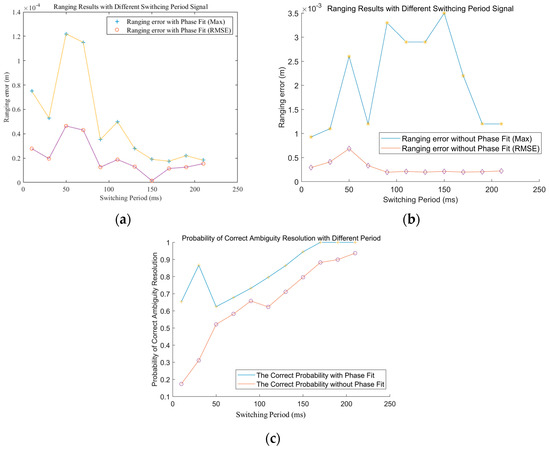
Figure 15.
Analysis of the carrier phase ranging performance in different hopping periods: (a) measurement accuracy with carrier phase measurement fitting; (b) measurement accuracy without measurement value fitting; and (c) probability of a successful calculation with and without fitting.
Even if the switching time increases, fitting is still an effective method for improving the system’s ranging accuracy and success rate of ambiguity resolution. An increase in the frequency hopping period will improve the accuracy of the frequency hopping carrier phase ranging. For a CNR = 60 dB-Hz, when the hopping period at each frequency point is increased from 10 ms to 210 ms, the ranging accuracy decreases from 0.0278 mm to approximately 0.00126 mm.
6. Discussion
As shown in Section 3 and Section 4, for ISLs, the multifrequency carrier phase ranging method can achieve ranging accuracy exceeding that of PN codes. For continuous signal carrier phase measurements with multiple frequency points, even at a CNR of 40 dB-Hz, distance measurement accuracy can be achieved, which is significantly improved compared to the PN code ranging accuracy of 0.13 m. However, in this case, compared to the measurement algorithm itself, the hardware equipment used for measurement will have a greater influence on carrier phase measurement. Even if there is only a 1 ps delay measurement error between multiple channels, this will result in a ranging error of 0.29 mm for ranging accuracy. When the FH-DOWR is used, the ranging accuracy is only 0.247 mm at 40 dB-Hz. Although the measurement accuracy is reduced by two orders of magnitude compared to that of multiple frequency signals, the error impact caused by channel asynchrony is effectively reduced because multiple frequency points share the same RF channel. In addition, compared to the pseudocode ranging accuracy of 0.13 m, its performance improvement is also quite significant.
7. Conclusions
This paper provides an FH-DOWR method to improve the ranging and time synchronization accuracy between satellites. To ensure the continuity of carrier phase measurement values as much as possible, we adopt distance and speed extrapolation to extrapolate the tracking loops of multiple frequency points. In this case, the signal can remain in a tracking state for a long time without going through the acquisition process, which effectively improves the tracking stable time and loop stability. In addition, polynomial fitting is applied to the carrier phase measurement results to reduce carrier phase measurement errors caused by frequency hopping.
The FH-DOWR system provides coarse ranging results based on PN codes and removes larger carrier phase integer ambiguity. Then, the integer ambiguity resolution method is used to provide carrier phase ranging results without integer ambiguity. Finally, at a CNR of 40 dB-Hz, the ranging error in the Ka frequency band is better than 0.247 mm. As the CNR increases, the measurement accuracy further improves. The FH-DOWR model achieves a high measurement accuracy 21.7 μm at 70 dB-Hz with a 95% probability of successful deblurring. The PN code ranging accuracy at 70 dB-Hz is 3.7 mm, which is an improvement of two orders of magnitude. Although the FH-DOWR method has high ranging accuracy, reaching the micrometer level, it requires additional hardware resources for multiple frequency tracking. Therefore, we will further increase resource consumption in the future. In addition, we will increase the frequency points of FH-DOWR signals and analyze their anti-interference performance. We will also comprehensively consider the impact of increasing frequency points on ranging performance.
Author Contributions
Conceptualization, W.F. and H.W.; methodology, J.Z.; software, J.Z.; validation, J.Z. and H.W.; formal analysis, J.Z.; investigation, Z.J.; resources, W.F.; data curation, J.Z.; writing—original draft preparation, J.Z.; writing—review and editing, J.Z. and H.W. visualization, Z.J.; supervision, Z.J.; project administration, W.F. All authors have read and agreed to the published version of the manuscript.
Funding
This research was funded by the National Key Research and Development Program of China (No. 2022YFB3904402).
Data Availability Statement
Data are contained within the article.
Conflicts of Interest
The authors declare no conflict of interest.
References
- Zhang, L.; Xu, B. Navigation Performance of the Libration Point Satellite Navigation System in Cislunar Space. J. Navig. 2015, 68, 367–382. [Google Scholar] [CrossRef]
- Ma, X.; Dong, X.; Hu, Y. Analysis on navigation accuracy of high orbit spacecraft based on BDS GEO and IGSO satellites. Adv. Space Res. 2023, 71, 2481–2492. [Google Scholar] [CrossRef]
- Zhao, L.; Hu, X.; Tang, C.; Zhou, S.; Cao, Y.; Wang, Q.; Su, R. Inter-satellite link augmented BeiDou-3 orbit determination for precise point positioning. Chin. J. Aeronaut. 2022, 35, 332–343. [Google Scholar] [CrossRef]
- Yang, Y.; Yang, Y.; Hu, X.; Chen, J.; Guo, R.; Tang, C.; Zhou, S.; Zhao, L.; Xu, J. Inter-Satellite Link Enhanced Orbit Determination for BeiDou-3. J. Navig. 2020, 73, 115–130. [Google Scholar] [CrossRef]
- Ren, X.; Yang, Y.; Zhu, J.; Xu, T. Comparing satellite orbit determination by batch processing and extended Kalman filtering using inter-satellite link measurements of the next-generation BeiDou satellites. GPS Solution 2019, 23, 25. [Google Scholar] [CrossRef]
- Tang, C.; Guo, R.; Hu, X.; Zhu, L.; Li, R.; Pan, J.; Zhou, S.; Chen, J. Orbit determination and time synchronization for new-generation Beidou satellites: Preliminary results. SCIENTIA SINICA Phys. Mech. Astron. 2016, 45, 119502. [Google Scholar] [CrossRef]
- Xue, L.; Li, X.; Wu, W.; Yang, Y. Design of Tracking, Telemetry, Command (TT&C) and Data Transmission Integrated Signal in TDD Mode. Remote Sens. 2020, 12, 3340. [Google Scholar] [CrossRef]
- Gao, Z.; Yang, W.; Ma, H.; Teng, F.; Li, C.; Li, X.; Wang, Y.; Jiao, Y. A Measurement Method for Cislunar Spacecraft Based on Connected Element Interferometry and BeiDou-3 Interplanetary Link in Future Lunar Exploration. Remote Sens. 2023, 15, 3744. [Google Scholar] [CrossRef]
- Kim, J.; Lee, S.W. Flight performance analysis of GRACE K-band ranging instrument with simulation data. Acta Astronaut. 2009, 65, 1571–1581. [Google Scholar] [CrossRef]
- Wang, F.; Liu, D.; Nie, Z. A Pseudo-Code-Aided Carrier Synchronization Method for THz Communication System. In Proceedings of the 2018 10th International Conference on Communication Software and Networks (ICCSN), Chengdu, China, 6–9 July 2018; pp. 140–145. [Google Scholar]
- Wang, H.Y.; Juang, J.C. An Improved Precise Point Positioning Method Based on Between-Satellite Single-Difference and Carrier Smoothing. J. Aeronaut. Astronaut. Aviat. 2020, 52, 387–402. [Google Scholar]
- Pan, J.Y.; Hu, X.G.; Tang, C.P.; Pan, S.S.; Li, R.; Zhu, L.F.; Tang, G.F.; Hu, G.M.; Chang, Z.Q.; Wu, B.; et al. System error calibration for time division multiple access inter-satellite payload of new-generation Beidou satellites. Chin. Sci. Bull. 2017, 62, 2671–2679. (In Chinese) [Google Scholar] [CrossRef][Green Version]
- Shen, Q.; Guan, J.-Y.; Ren, J.-G.; Zeng, T.; Hou, L.; Li, M.; Cao, Y.; Han, J.-J.; Lian, M.-Z.; Chen, Y.-W.; et al. Free-space dissemination of time and frequency with 10–19 instability over 113 km. Nature 2022, 610, 661–666. [Google Scholar] [CrossRef] [PubMed]
- Ma, J.; Yang, Y.; Li, H.; Li, J. FH-BOC: Generalized low-ambiguity anti-interference spread spectrum modulation based on frequency-hopping binary offset carrier. GPS Solut. 2020, 24, 70. [Google Scholar] [CrossRef]
- Ma, J.; Yang, Y. A Generalized Anti-Interference Low-Ambiguity Dual-Frequency Multiplexing Modulation Based on the Frequency-Hopping Technique. IEEE Access 2020, 8, 95288–95300. [Google Scholar] [CrossRef]
- Rabbou, M.A.; Abdelazeem, M.; Morsy, S. Performance Evaluation of Triple-Frequency GPS/Galileo Techniques for Precise Static and Kinematic Applications. Sensors 2021, 21, 3396. [Google Scholar] [CrossRef] [PubMed]
- Zhang, Z.; Kang, S.; Zhang, X. High precision positioning algorithm based on carrier phase and time of arrival. IET Commun. 2021, 15, 2575–2585. [Google Scholar] [CrossRef]
- Cocard, M.; Bourgon, S.; Kamali, O.; Collins, P. A systematic investigation of optimal carrier-phase combination for modernized triple-frequency GPS. J. Geod. 2008, 82, 555–564. [Google Scholar] [CrossRef]
- Zhang, X.; He, X. BDS triple-frequency carrier-phase linear combination models and their characteristics. Sci. China Earth Sci. 2015, 58, 896–905. [Google Scholar] [CrossRef]
- Li, B. Review of triple-frequency GNSS: Ambiguity resolution, benefits and challenges. J. Glob. Position Syst. 2018, 16, 1. [Google Scholar] [CrossRef]
- Giorgi, G.; Teunissen, P.J.G. Carrier phase GNSS attitude determination with the Multivariate Constrained LAMBDA method. In Proceedings of the 2010 IEEE Aerospace Conference, Big Sky, MT, USA, 6–13 March 2010; pp. 1–12. [Google Scholar]
- Tang, W.; Shen, M.; Deng, C.; Cui, J.; Yang, J. Network-based triple-frequency carrier phase ambiguity resolution between reference stations using BDS data for long baselines. GPS Solut. 2018, 22, 73. [Google Scholar] [CrossRef]
- Zhou, L.; Wang, Z.; Dong, W.; Yan, J. Design of Inter-satellite Ranging and Clock Synchronization of Formation Satellites. In Proceedings of the 2023 XXXVth General Assembly and Scientific Symposium of the International Union of Radio Science (URSI GASS), Sapporo, Japan, 19–26 August 2023; pp. 1–4. [Google Scholar]
- Kim, J.; Tapley, B.D. Simulation of Dual One-Way Ranging Measurements. J. Spacecr. Rocket. 2003, 40, 419–425. [Google Scholar] [CrossRef]
- Neirynck, D.; Luk, E.; McLaughlin, M. An alternative double-sided two-way ranging method. In Proceedings of the 2016 13th Workshop on Positioning, Navigation and Communications (WPNC), Bremen, Germany, 19–20 October 2016; pp. 1–4. [Google Scholar]
- Liang, X.; Huang, Z.; Qin, H. A New Rapid Integer Ambiguity Resolution of GNSS Phase-Only Dynamic Differential Positioning. IEEE Geosci. Remote Sens. Lett. 2022, 19, 1–5. [Google Scholar] [CrossRef]
- Wei, Z.; Lan, C.; Xu, Q.; Wang, L.; Gao, T.; Yao, F.; Hou, H. SatellStitch: Satellite Imagery-Assisted UAV Image Seamless Stitching for Emergency Response without GCP and GNSS. Remote Sens. 2024, 16, 309. [Google Scholar] [CrossRef]
- Li, S.; Lin, H.; Tang, X.; Ma, C.; Wang, F. Noncoherent Channel Combining for GNSS Signal Tracking with an Adaptive Antenna Array. Remote Sens. 2024, 16, 213. [Google Scholar] [CrossRef]
- Khalife, J.; Neinavaie, M.; Kassas, Z.M. The First Carrier Phase Tracking and Positioning Results With Starlink LEO Satellite Signals. IEEE Trans. Aerosp. Electron. Syst. 2022, 58, 1487–1491. [Google Scholar] [CrossRef]
- Qi, L.; Guo, J.; Xia, Y.; Yang, Z. Effect of Higher-Order Ionospheric Delay on Precise Orbit Determination of GRACE-FO Based on Satellite-Borne GPS Technique. IEEE Access 2021, 9, 29841–29849. [Google Scholar] [CrossRef]
- Xue, L.; Li, X.; Wu, W.; Zhang, Z.; Li, H. A Parallel Composite Pseudo-Noise Code for Deep Space Ranging. IEEE Commun. Lett. 2022, 26, 872–876. [Google Scholar] [CrossRef]
- Zhu, Y.; Chou, W.; Yang, D. Performance analysis and parameter setting for Tong detection algorithm. J. Beijing Univ. Aeronaut. Astronaut. 2015, 41, 418–423. [Google Scholar]
- Park, K.W.; Suh, J.-W.; Seo, B.-S.; Lee, M.J.; Park, C. Design of signal acquisition and tracking process based on multi-thread for real-time GNSS software receiver. In Proceedings of the 2016 International Conference on Localization and GNSS (ICL-GNSS), Barcelona, Spain, 28–30 June 2016; pp. 1–4. [Google Scholar]
- Feng, T. Decimation Double-Phase Estimator: An Efficient and Unambiguous High-Order Binary Offset Carrier Tracking Algorithm. IEEE Signal Process. Lett. 2016, 23, 905–909. [Google Scholar] [CrossRef]
Disclaimer/Publisher’s Note: The statements, opinions and data contained in all publications are solely those of the individual author(s) and contributor(s) and not of MDPI and/or the editor(s). MDPI and/or the editor(s) disclaim responsibility for any injury to people or property resulting from any ideas, methods, instructions or products referred to in the content. |
© 2024 by the authors. Licensee MDPI, Basel, Switzerland. This article is an open access article distributed under the terms and conditions of the Creative Commons Attribution (CC BY) license (https://creativecommons.org/licenses/by/4.0/).