Article

Machine Learning-Based Fine Classification of Agricultural Crops in the Cross-Border Basin of the Heilongjiang River between China and Russia

1
School of Marine Technology and Geomatics, Jiangsu Ocean University, Lianyungang 222005, China
2
State Key Laboratory of Resources and Environmental Information System, Institute of Geographic Sciences and Natural Resources Research, Chinese Academy of Sciences, Beijing 100101, China
3
College of Resources and Environment, University of Chinese Academy of Sciences, Beijing 100049, China
4
Jiangsu Centre for Collaborative Innovation in Geographical Information Resource Development and Application, Nanjing 210023, China
5
Institute for Complex Analysis of Regional Problems, Far Eastern Branch Russian Academy of Sciences, Birobizhan 679016, Russia
6
School of Geoscience and Surveying Engineering, China University of Mining and Technology, Beijing 100083, China
*
Author to whom correspondence should be addressed.
Remote Sens. 2024, 16(10), 1670; https://doi.org/10.3390/rs16101670
Submission received: 8 March 2024 / Revised: 6 May 2024 / Accepted: 7 May 2024 / Published: 8 May 2024

Abstract

:
The transboundary region along the Heilongjiang River, encompassing the Russian Far East and Northeast China, possesses abundant agricultural natural resources crucial for global food security. In the face of the challenge of disruptions in the global food supply chain, the precise monitoring and exploitation of agricultural resources in the Heilongjiang Basin becomes imperative. This study employed deep learning to classify crop status in 2023 in the Heilongjiang Basin using Sentinel-2 satellite remote sensing images at a 10 m resolution. Various vegetation indices, including the Normalized Difference Vegetation Index (NDVI), the Normalized Difference Water Index (NDWI), the Enhanced Vegetation Index (EVI), the Modified Soil Adjusted Vegetation Index (MSAVI), and others, were computed and analyzed for different crops. The Google Earth Engine (GEE) platform was utilized for validation point sampling based on plot objects. The random forest (RF) classification method was successfully employed to classify and identify major crops in the study area (wheat, maize, rice, and soybean), as well as wetlands, tree cover, grassland, water, and constructed land, with an overall classification accuracy of 86%. Tree cover dominated the land cover, constituting 62%, while wheat, maize, rice, and soybeans accounted for 7% of the total area. Of these, soybeans occupied the largest area (57,646.60 hectares), followed by rice (53,209.53 hectares), maize (39,998.37 hectares), and wheat (8782.31 hectares). This study demonstrated that sample selection based on plot objects facilitates efficient sample labeling, providing insights into crop classification in other, potentially larger, areas. This method simultaneously distinguishes wetland, cultivated land, and forest features, supporting further integrated investigations for more natural resources.

1. Introduction

Food security features as a priority goal within the United Nations’ Sustainable Development Goals (SDG2). Eurasia, serving as an important producer and exporter of global food, energy, fertilizers, and other commodities, plays a crucial role in maintaining the stability of international food prices and ensuring global food supply. The Heilongjiang River Basin, located in Northeast Asia and far from Europe, holds significant potential as a crucial grain-producing region. The basin benefits from convenient water transportation and abundant water resources, with a geographic environment and climate conducive to crop growth. It is rich in agricultural resources, with flat and contiguous arable land, deep topsoil, fertile soil, and abundant species resources [1]. The Northeast China region in this basin is one of the world’s four major black soil belts, covering an area of 1.09 million square kilometers, with a cultivated black soil area of 185.33 million hectares [2]. Therefore, in the face of the disruptions present in the global food supply chain, the precise monitoring and exploitation of agricultural resources in the Heilongjiang Basin have become imperative [3].
Remote sensing is a useful tool for monitoring agricultural development in vast regions, especially in cross-boundary areas [4,5]. Numerous studies indicate that the utilization of time-series satellite imagery data, leveraging their temporal characteristics, has been successful in remote sensing classification and crop identification [6,7,8]. Du et al. [9] utilized Sentinel-2A multispectral data to construct Normalized Difference Vegetation Index (NDVI) time-series datasets. Using an object-oriented classification approach, they extracted spatial information from crops in Beian City, Heilongjiang Province, China, achieving an overall accuracy of 96.2%. Jie et al. [10], relying on multi-temporal GF-I WFV remote sensing data, employed a semi-automatic approach combining supervised classification and visual interpretation. They extracted spatial information on crops in Tongjiang City, Heilongjiang Province, for the year 2017, achieving an overall accuracy of 90% through ground point measurements with GPS. Song [11] focused on Beian City, Heilongjiang Province, utilizing the “backward exclusion” method to select GF-1A/WFV multi-temporal spectral and spatial texture features. By employing Support Vector Machines (SVMs), she identified soybeans, maize, wheat, and rice in the study area. This method effectively addressed the constraints associated with limited temporal coverage in remote sensing images, ensuring the comprehensive identification of the “optimal phenological window” for crops. Han [12] utilized multi-temporal Landsat 8, Sentinel-2, and Sentinel-1 data from May to October. Using the minimum distance method, the Classification and Regression Tree (CART) classifier, and the random forest (RF) classifier, he extracted spatial information for soybeans, maize, and rice in Jilin Province. Zhang et al. [13], employing the NDVI, the time-series coefficient of variation (NDVI_COVfp), and the Peak Slope Difference Index (PSDI), proposed a new rapid mapping model for winter wheat in Heilonggang, Hebei Province.
As a powerful cloud computing platform, Google Earth Engine (GEE) is widely utilized for crop mapping and dynamic monitoring [14,15]. GEE allows users to access various satellite data freely and utilize numerous built-in remote sensing image-processing tools [16,17]. For example, Shelestov et al. [18] explored the efficiency of employing multi-temporal remote sensing images in the GEE cloud platform for large-scale crop classification, comparing and evaluating the extraction results and merits of various classifiers. Wang et al. [19], utilizing all available historical images from Landsat, trained an RF classifier in GEE to create maps of maize and soybeans in 13 states in the Midwest United States. The overall error in the crop planting area, compared with statistics from the National Agricultural Statistics Service, was less than 10%. Ning et al. [20] combined GEE with multisource remote sensing data and, using the RF machine learning method, rapidly, accurately, and efficiently extracted information on large-scale marsh wetlands in the Heilongjiang River Basin in 2018. The overall accuracy in their study reached 91.54%, indicating that GEE holds significant potential for applications in large-scale wetland information extraction.
Classification methods commonly employed in the field of remote sensing frequently fall short of achieving satisfactory accuracy in classification problems. Those based on multi-temporal features typically utilize machine learning techniques, such as the SVM and RF methods, or non-supervised non-linear classifiers like deep learning. These classifiers often interpret the various dimensions of input feature vectors as linearly independent variables, leading to poor model interpretability. Additionally, such classifiers usually require a large number of ground samples for model training, and the quantity and quality of these samples directly impact the reliability of the final classification results [21]. Richard et al. [22] used time-series MODIS (250 m) NDVI products as data sources. By analyzing the time-series phenological characteristics of various crops, they developed two automated decision tree (DT) classification methods that successfully extracted information on soybeans, maize, rice, cotton, and potatoes in the United States. Zhao et al. [23] employed the RF method based on Sentinel-1 radar data to accurately obtain information on vegetation species and spatial dynamics in coastal salt marsh wetlands. Zhang et al. [24] utilized the RF algorithm and feature selection to extract information on the Yellow River Delta wetlands. Their results indicated that the RF algorithm can effectively perform feature selection and wetland information extraction, achieving an overall accuracy of 90.93%.
However, most of these studies primarily focused on the singular classification of small regions and did not extensively utilize high-resolution remote sensing imagery for crop identification. Therefore, there is a need to further enhance methods for large-scale crop classification based on high-resolution remote sensing imagery to improve classification accuracy. In this study, the Heilongjiang River Basin was selected as the research area, and by leveraging the GEE cloud platform, Sentinel-2 satellite imagery was utilized as the data source. This study employed the RF classification method to identify various crops in the research area and extract the spatial distribution of major crops in the Heilongjiang River Basin, including wheat, maize, rice, and soybeans, as well as wetlands, tree cover, grassland, water, and constructed land.

2. Study Area and Data Sources

2.1. Study Area

The Heilongjiang River, as an international river, spans three countries: China, Russia, and Mongolia. Originating from the Kherlen River in Mongolia, the Heilongjiang River spans a total length of 5498 km, ranking as the sixth-longest river globally. The Heilongjiang River Basin (41.72°–55.903°N, 108.051°–141.128°E) encompasses the northeastern region of China, a significant part of the Russian Far East, and a small portion of eastern Mongolia, with the majority located within the borders of China and Russia. Covering an area of approximately 1.843 million square kilometers, the basin ranks tenth in the world in terms of geographical size. The climate in the Heilongjiang River Basin spans two climatic zones: temperate and cold-temperate. The basin exhibits a noticeable monsoon climate, with an average annual temperature ranging from −8 to 6 °C, while the average annual precipitation is between 250 and 800 mm. The region boasts abundant natural resources, favorable climatic conditions, and significant potential for agricultural development, making it suitable for cultivating crops such as wheat, soybeans, rice, and maize, among others. An overview of the research area and sample point distribution is illustrated in Figure 1.
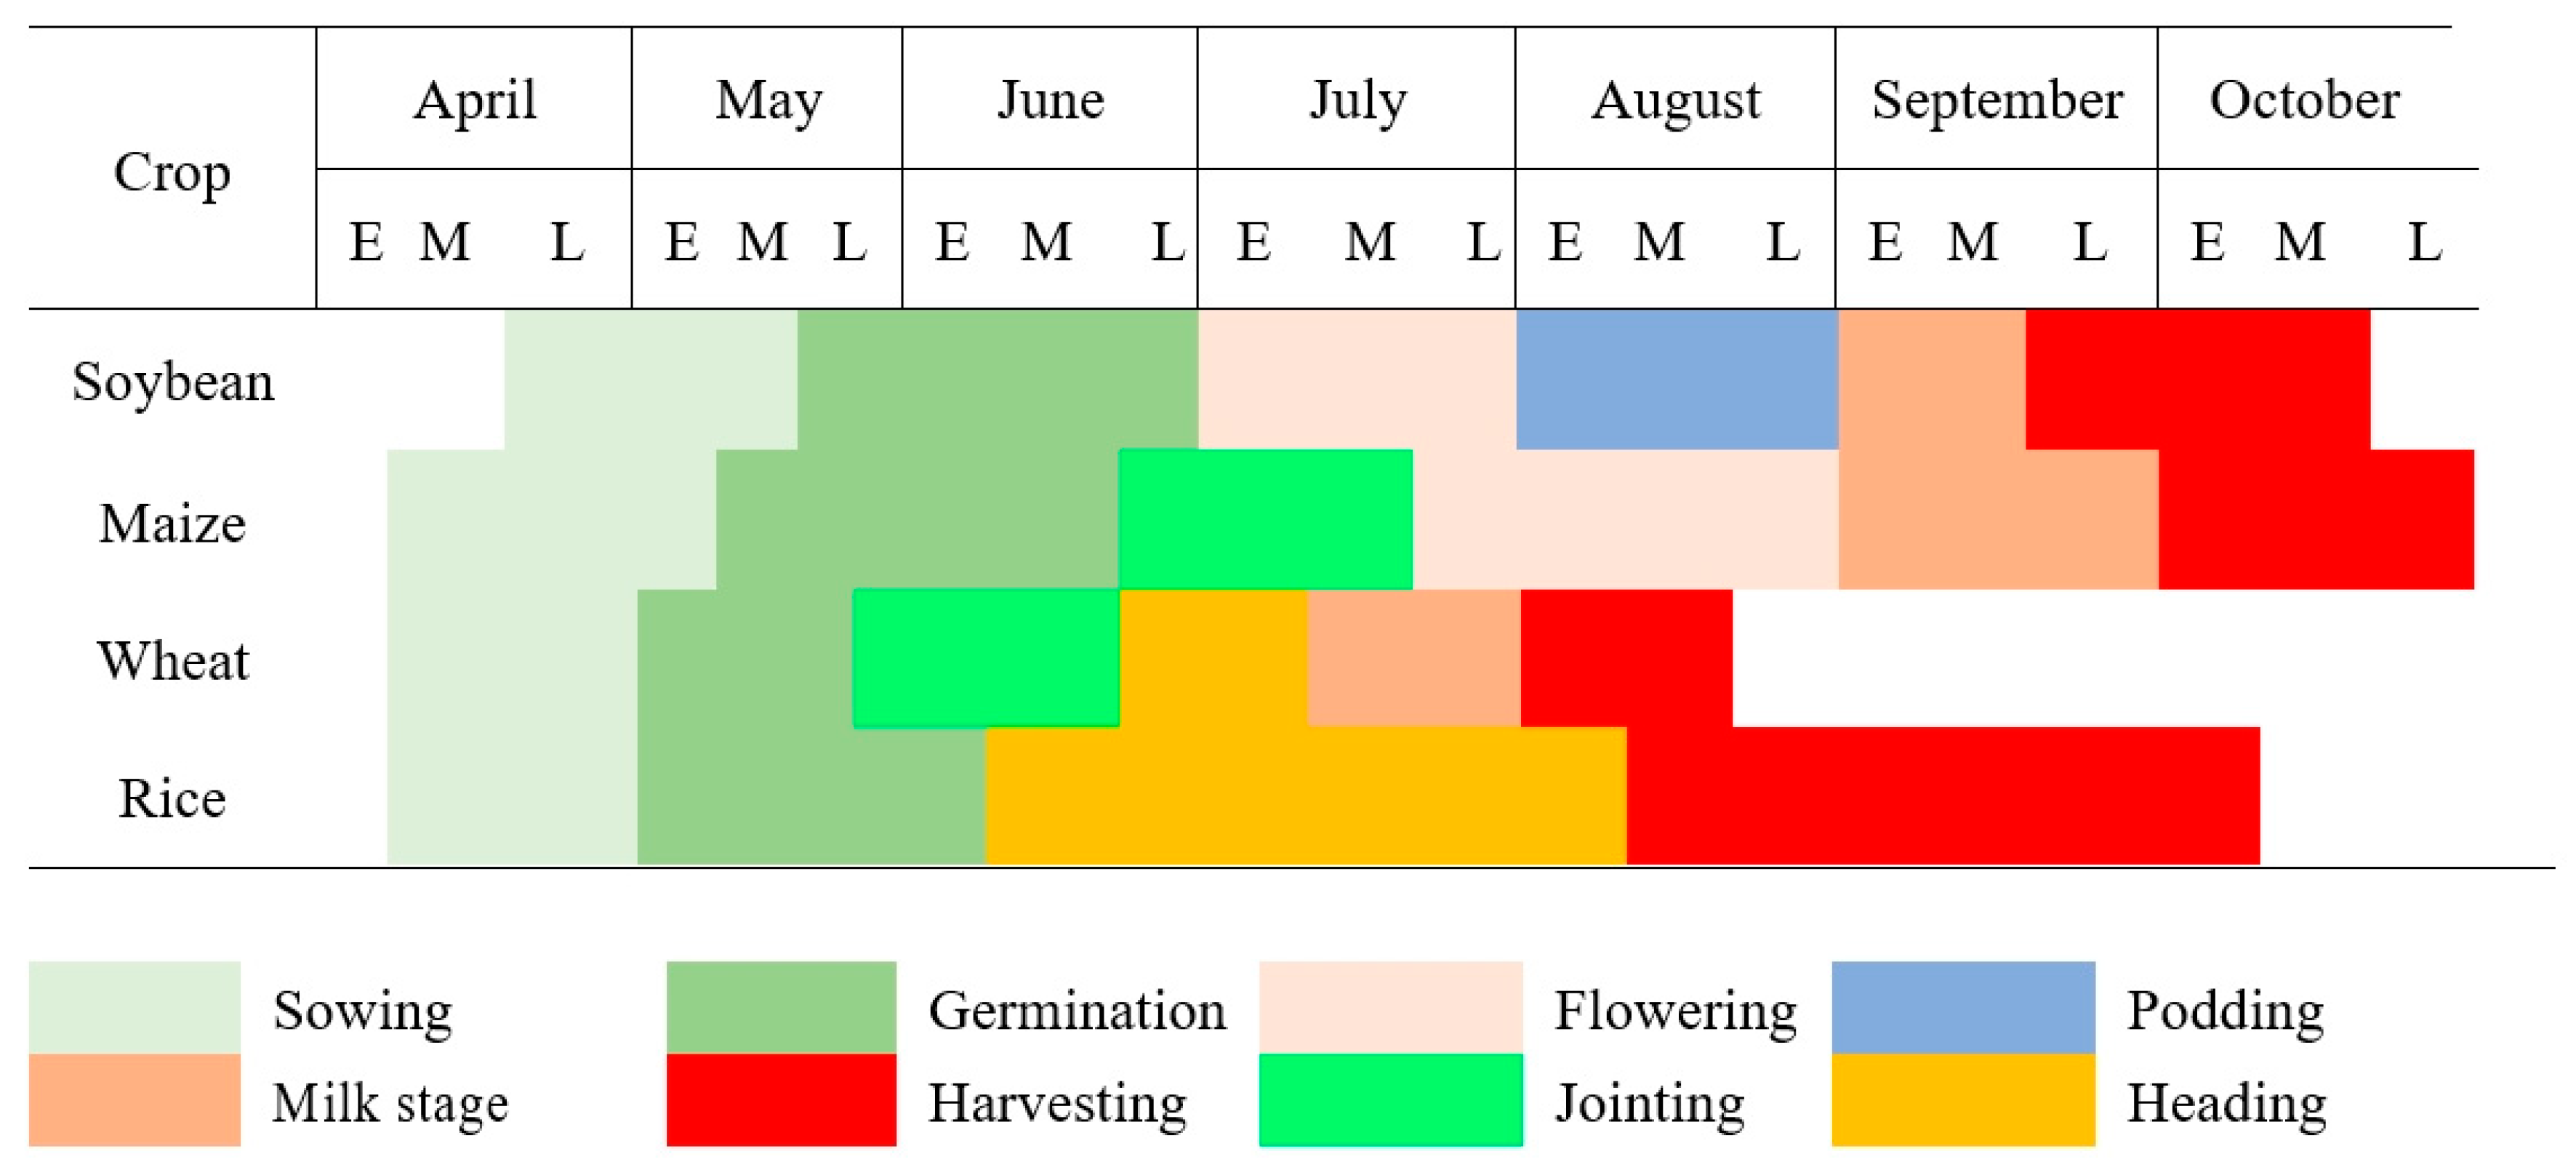
The main types of crops in the Heilongjiang Basin include soybeans, maize, rice, and wheat, among others. Figure 2 delineates the growing conditions of crops within the Heilongjiang Basin.

2.2. Data Sources

This study utilized Sentinel series satellite remote sensing images, captured from 1 July 2023 to 30 September 2023 (totaling eight scenes) at a spatial resolution of 10 m. The images were overlaid with vector generations, which were uploaded to the GEE cloud platform first. The Sentinel-2 satellite comprises 13 multispectral bands, including 4 bands with a 10 m resolution, 6 bands with a 20 m resolution, and 3 bands with a 60 m resolution, as shown in Table 1. The satellite’s orbital width is 290 km. The reflectance dataset from Sentinel-2 was obtained from the GEE cloud platform. The provided product underwent pre-processing steps such as radiometric calibration, geometric correction, and atmospheric correction.

2.3. Data Collection

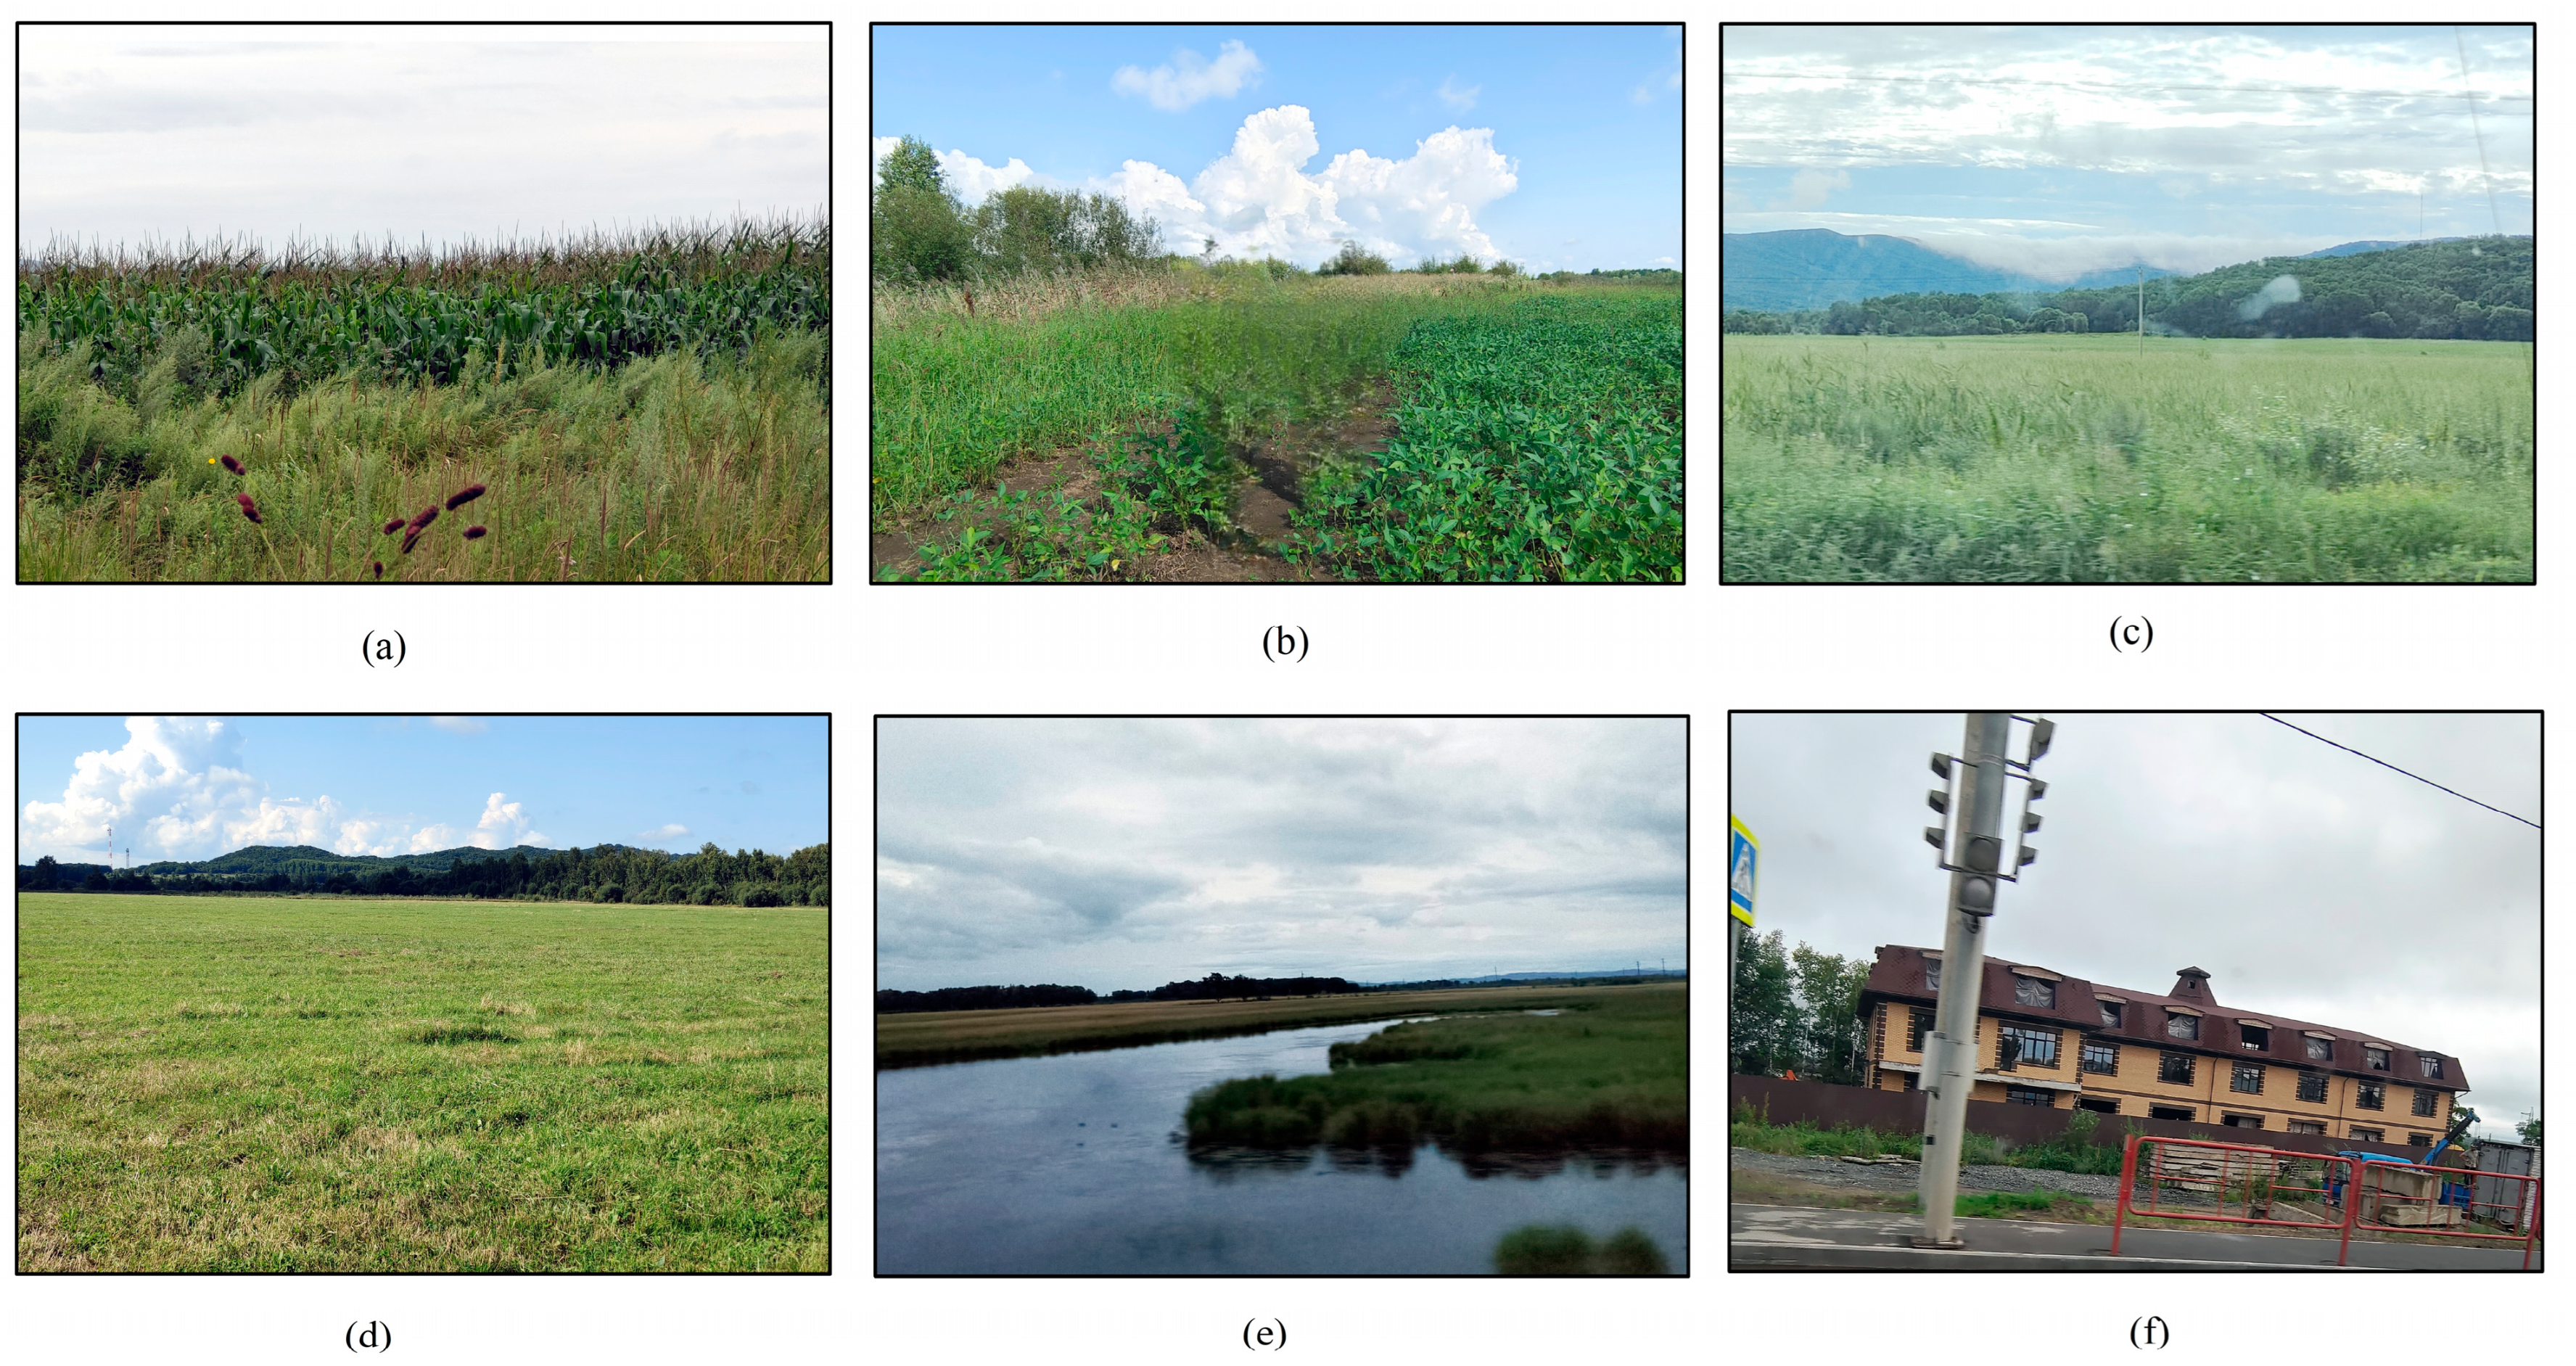
For the domestic side in China, we used a Chinese crop cultivation dataset, which served as a good reference for our experiments. Compared with the rich reference data in China, we needed more field survey data from the Russian side. In August 2023, a field survey was conducted in the research area, utilizing handheld GPS devices to collect the coordinates of sample points for the main crops. Following the classification system of the Heilongjiang River Basin, sample points were generated in the study area using a random sampling approach. High-resolution images from sources such as Google Earth (in 2023) were visually interpreted to identify the crops at the sample points. A total of 4197 samples were obtained, with a training-to-validation ratio of 7:3. There was no overlap between the training and validation samples. Field sampling photos for different crops are illustrated in Figure 3.

3. Materials and Methods

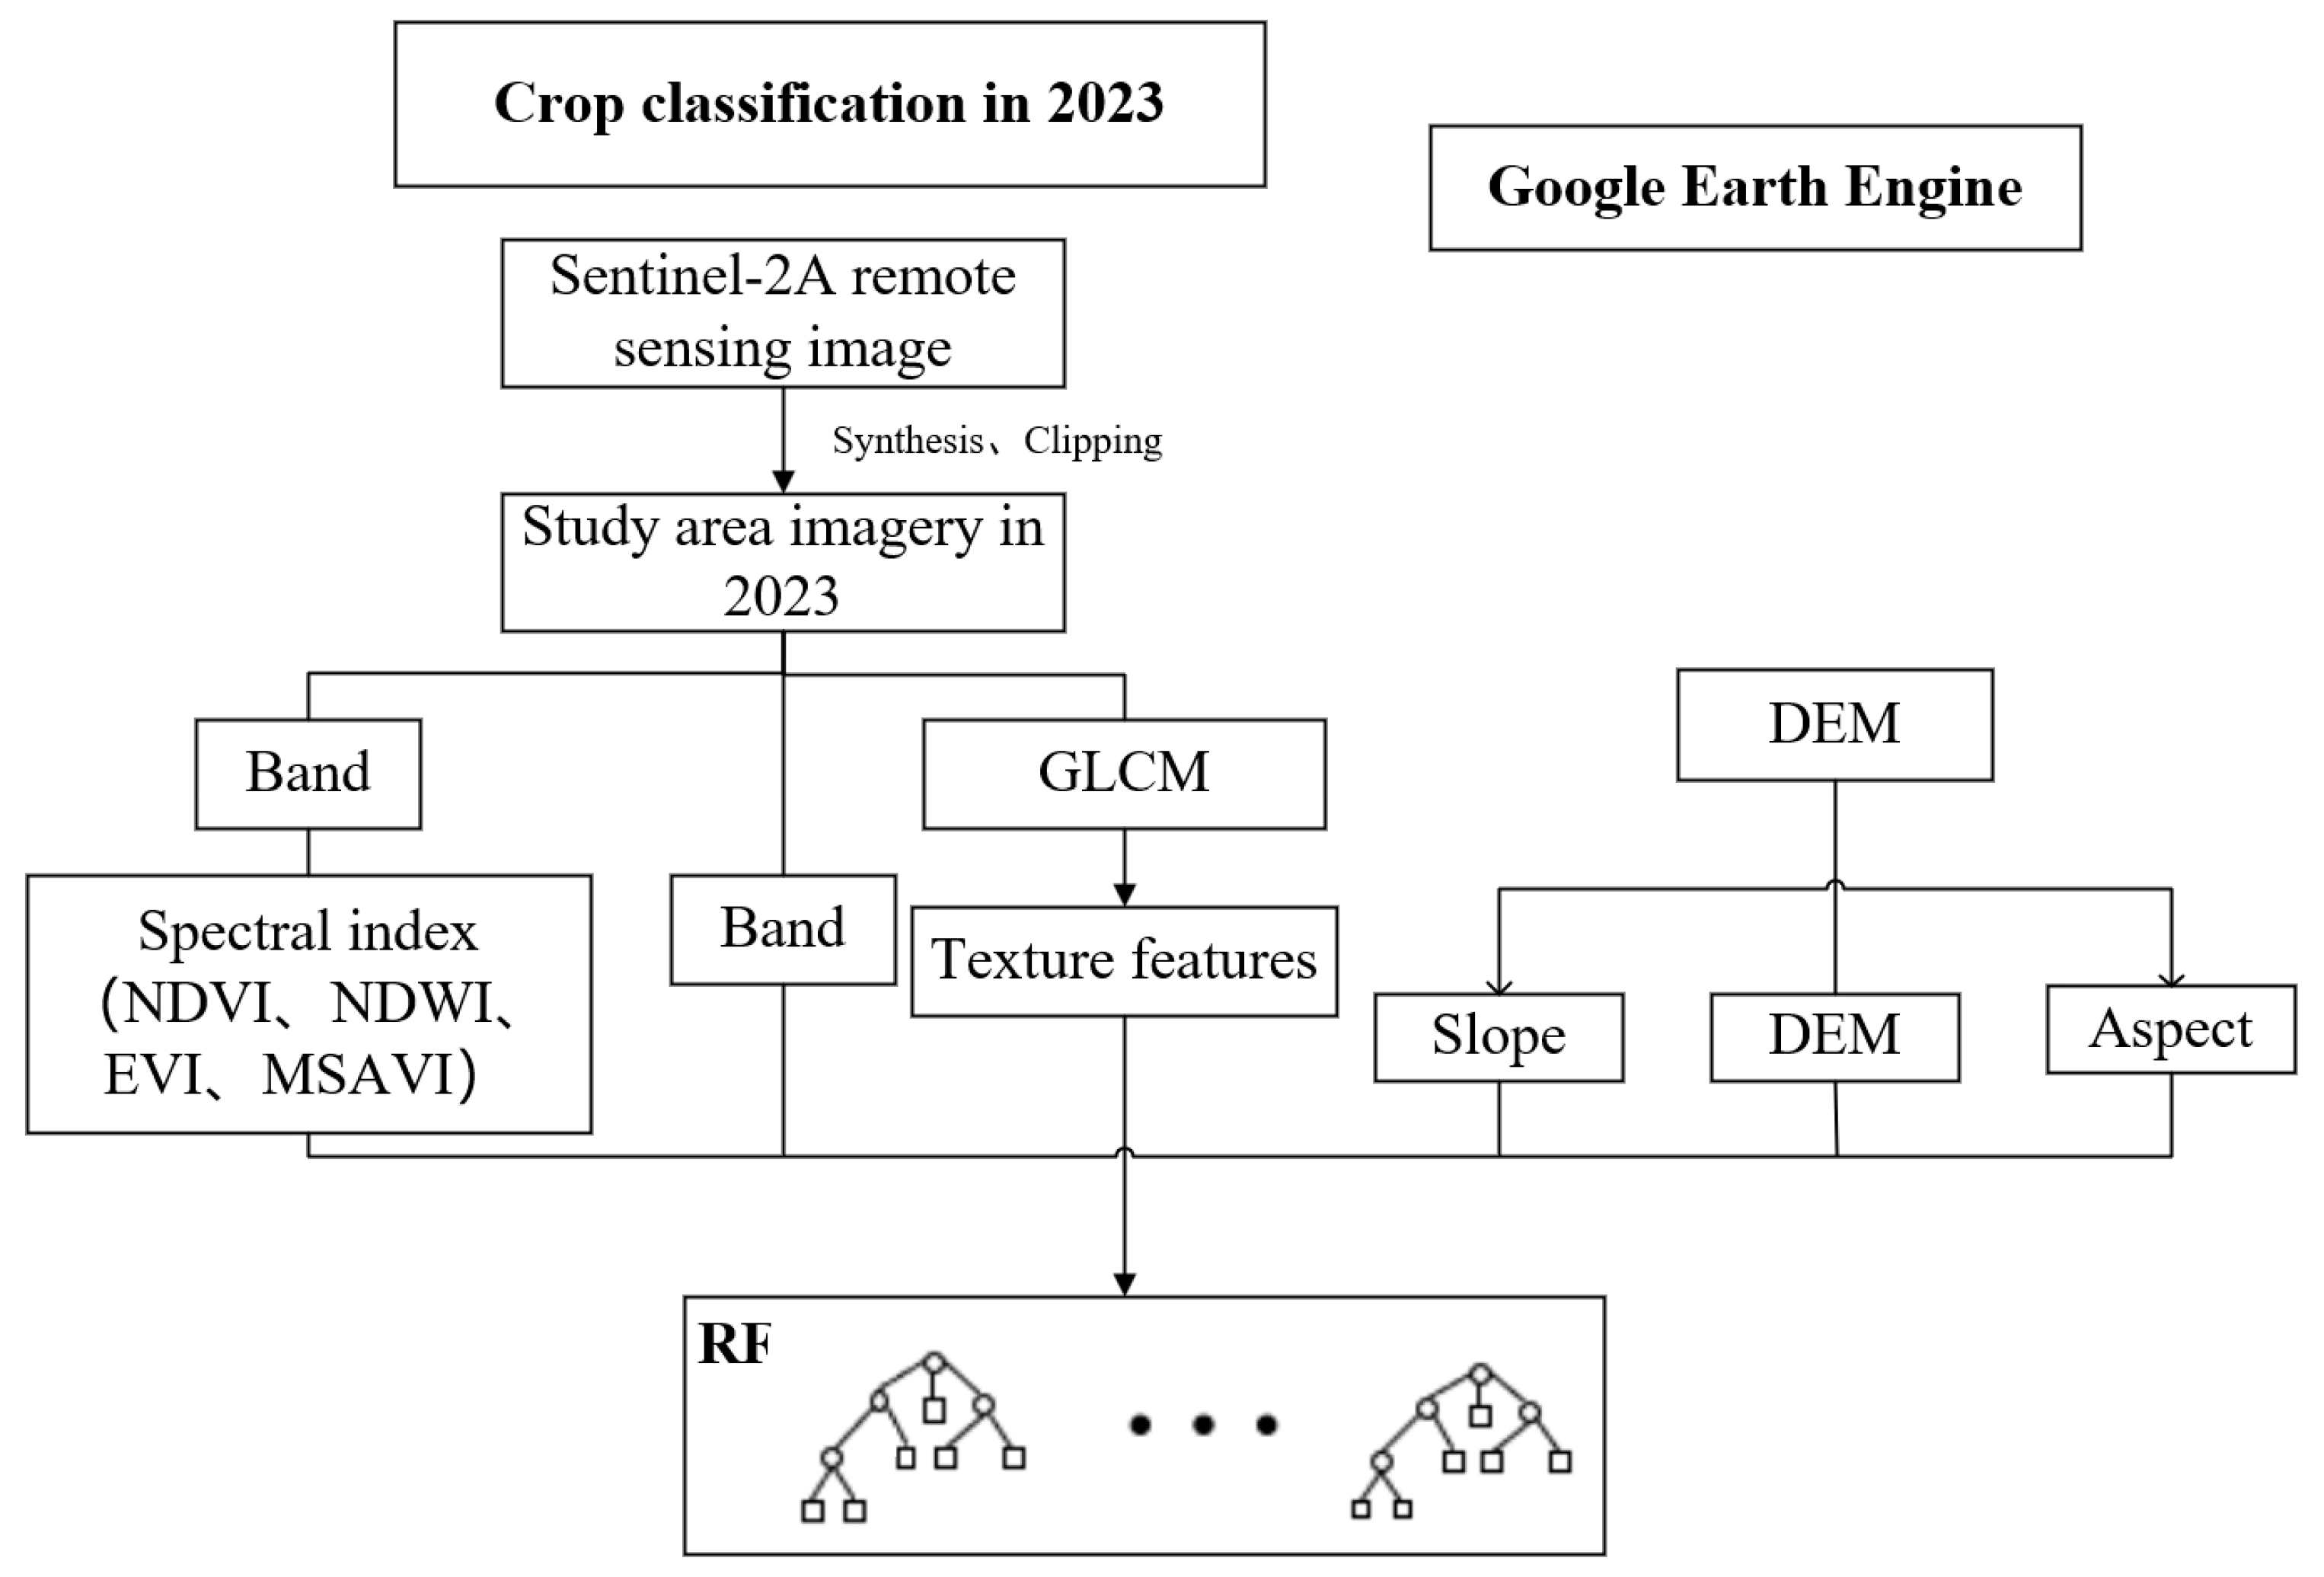
The overall technical workflow of this study is illustrated in Figure 4 and can be broadly divided into the following three parts. (1) The research focused on rapidly acquiring Sentinel-2A multisource remote sensing images for the Heilongjiang River Basin from July to September 2023 using the GEE cloud computing platform. Synthetic and clipping operations were performed, along with the generation of training and validation sample points, using various thematic data sources. (2) Multiple remote sensing datasets were utilized to create various sets of classification feature variables, including spectral indices, terrain, and texture features. Feature set selection was carried out to obtain an optimal remote sensing classification feature set. (3) Using the selected remote sensing classification feature set, an RF classification algorithm was employed for land cover classification. This resulted in the identification of land cover types such as wheat, maize, soybeans, rice, wetlands, tree cover, grassland, water, and constructed land. Simultaneously, an accuracy assessment was conducted using validation sample points, and a brief analysis of the spatial distribution pattern of crops in the Heilongjiang River Basin was performed.

3.1. Feature Set Construction

For this study, Sentinel-2A spectral features, vegetation indices, water body indices, and topographic features were selected to construct the feature set. A detailed description of each feature is provided in Table 2.

3.2. Random Forest Algorithm

After obtaining the optimal feature set through the selection of the crop classification features, it was input into a random forest classifier for remote sensing crop classification in the Heilongjiang River Basin. The random forest algorithm, proposed by Breiman [26], is an ensemble learning model based on a Classification and Regression Tree (CART). It comprises a large number of decision trees constructed independently of each other. The random forest classification algorithm exhibits excellent accuracy, and it can efficiently operate on large datasets and handle samples with high-dimensional features.
This study employed the RF algorithm for crop classification in the Heilongjiang River Basin. In comparison with other machine learning algorithms such as DT and SVM, RF is more robust and user-friendly [27]. The construction process of the RF algorithm involves the following steps. First, bootstrap non-parametric sampling is used to randomly extract samples with replacement from the original training sample set, thereby generating a training sample set for training a DT model. Assuming each sample has M features, at each node of the DT, m (m < M) features are randomly selected from the M features for node splitting. As RF is an ensemble learning method less prone to overfitting, pruning is not required during the DT construction process [28]. These steps are repeated k times to obtain an RF composed of DT models. The classification result for each sample is determined by a majority vote from multiple DTs, as illustrated in Figure 5.
The effectiveness of the RF is fine-tuned through two parameters: the number of DTs and the number of features used per node (m). Drawing from previous research, when the number of features is set to the following values (with a fixed number of trees at 500) [29], the change in classification accuracy is minimal: (1) one-third of the total features, (2) the square root of the total features, (3) half of the total features, (4) two-thirds of the total features, and (5) using all features. Therefore, following recommendations from the literature, the number of features per node was set to the square root of the total features. In this study, the RF algorithm provided by the GEE platform was employed, and adjustments were made to the number of DTs.

3.3. Accuracy Evaluation

The error matrix is a commonly used tool for evaluating the accuracy of remote sensing image classification [30]. This tool reflects the degree of proximity between the remote sensing classification results and the actual land cover types on the ground. Reference indicators in the confusion matrix include overall accuracy, Kappa coefficient, user accuracy, and mapping accuracy (producer accuracy).
The classification and accuracy validation of crops in the Heilongjiang River Basin were conducted using a confusion matrix and sample points collected from high-resolution images, including those from Google Earth. Computed metrics included overall accuracy, the Kappa coefficient, mapping accuracy, and user accuracy. Overall accuracy reflects the algorithm’s overall performance, measuring the proportion of correctly classified samples to the total number of validation samples [31]. The Kappa coefficient indicates the degree of consistency between ground-truth data and predicted values, remaining unchanged regardless of the size of the sampled data to ensure that smaller categories are not overlooked [32]. Mapping accuracy represents the probability of correctly classifying ground-truth reference data (validation samples) for a specific category [33]. User accuracy signifies the rate at which validation points falling into a particular category on the classification map are correctly classified [34].
P A = x i i x + i × 100 %
U A = x i i x i + × 100 %
O A = i = 1 r x i i N × 100 %
K a p p a = N i = 1 r x i i i = 1 r ( x i + x + i ) N 2 i = 1 r ( x i + x + i )
where xii is the number of correctly categorized pixels, x+i is the total number of pixels of class i in the reference data, xi+ is the total number of pixels of class i in the land cover data product in the verification, r is the number of types, and N corresponds to the total number of pixels.

4. Results

4.1. Object-Level Plot Construction

When addressing the challenges of high confusion and low accuracy among crops, sample selection for the Heilongjiang River Basin was facilitated using GEE. A crop classification method was proposed, employing an object-level parcel construction approach. The fundamental concept of crop classification based on parcels involves segmenting medium-resolution current satellite imagery into numerous basic parcel units defined by parcel boundaries. This method allows all pixels within a parcel to be collectively involved in the classification process, maximizes the utilization of pixel space, and overcomes misclassification issues caused by spectral variations within parcels. Additionally, vector data representing parcel boundaries enable the correct spatial positioning, geometric shape, and landscape features of parcels on the imagery to correspond to actual ground parcels. Therefore, parcel-oriented classification effectively addresses spectral variations within parcels and spectral mixing at parcel boundaries, commonly referred to as the “salt and pepper” phenomenon in pixel classification. Simultaneously, this method significantly reduces the difficulty of sample labeling, enhancing the speed of sample annotation. This approach serves as a valuable reference for extending crop classification to larger or different regions, as illustrated in Figure 6. Numerous studies also indicate that parcel-oriented land cover classification methods can provide more accurate results compared with traditional pixel-based classification methods. The concept of parcel-oriented remote sensing classification has not only been a subject of theoretical research but has also found practical application in China. For instance, Cheng et al. [35], utilizing GIS parcel boundary information, proposed a DT classification method based on grayscale features, texture features, and morphological features within parcel boundaries for standard land use types, achieving high identification accuracy. Wu et al. [36] employed a classification method based on segmented patches to classify dynamically changing and complex coastal zones, leading to an improvement in classification accuracy and demonstrating robust noise resistance. However, this method tends to exhibit a higher probability of misclassification in road classification due to the complexity of adjacent land features.
Figure 6 illustrates that Sentinel-2 delivered favorable recognition results, highlighting the potential of Sentinel-2 imagery in identifying crops. However, a certain degree of misclassification and omission is also evident. The selected samples include other substances that contribute to confusion. To address this, crops such as soybeans and maize were divided at the parcel level, followed by the application of an RF algorithm on the GEE platform for further refinement. This not only enhanced precision but also significantly improved the speed of sample selection.

4.2. Crop Classification

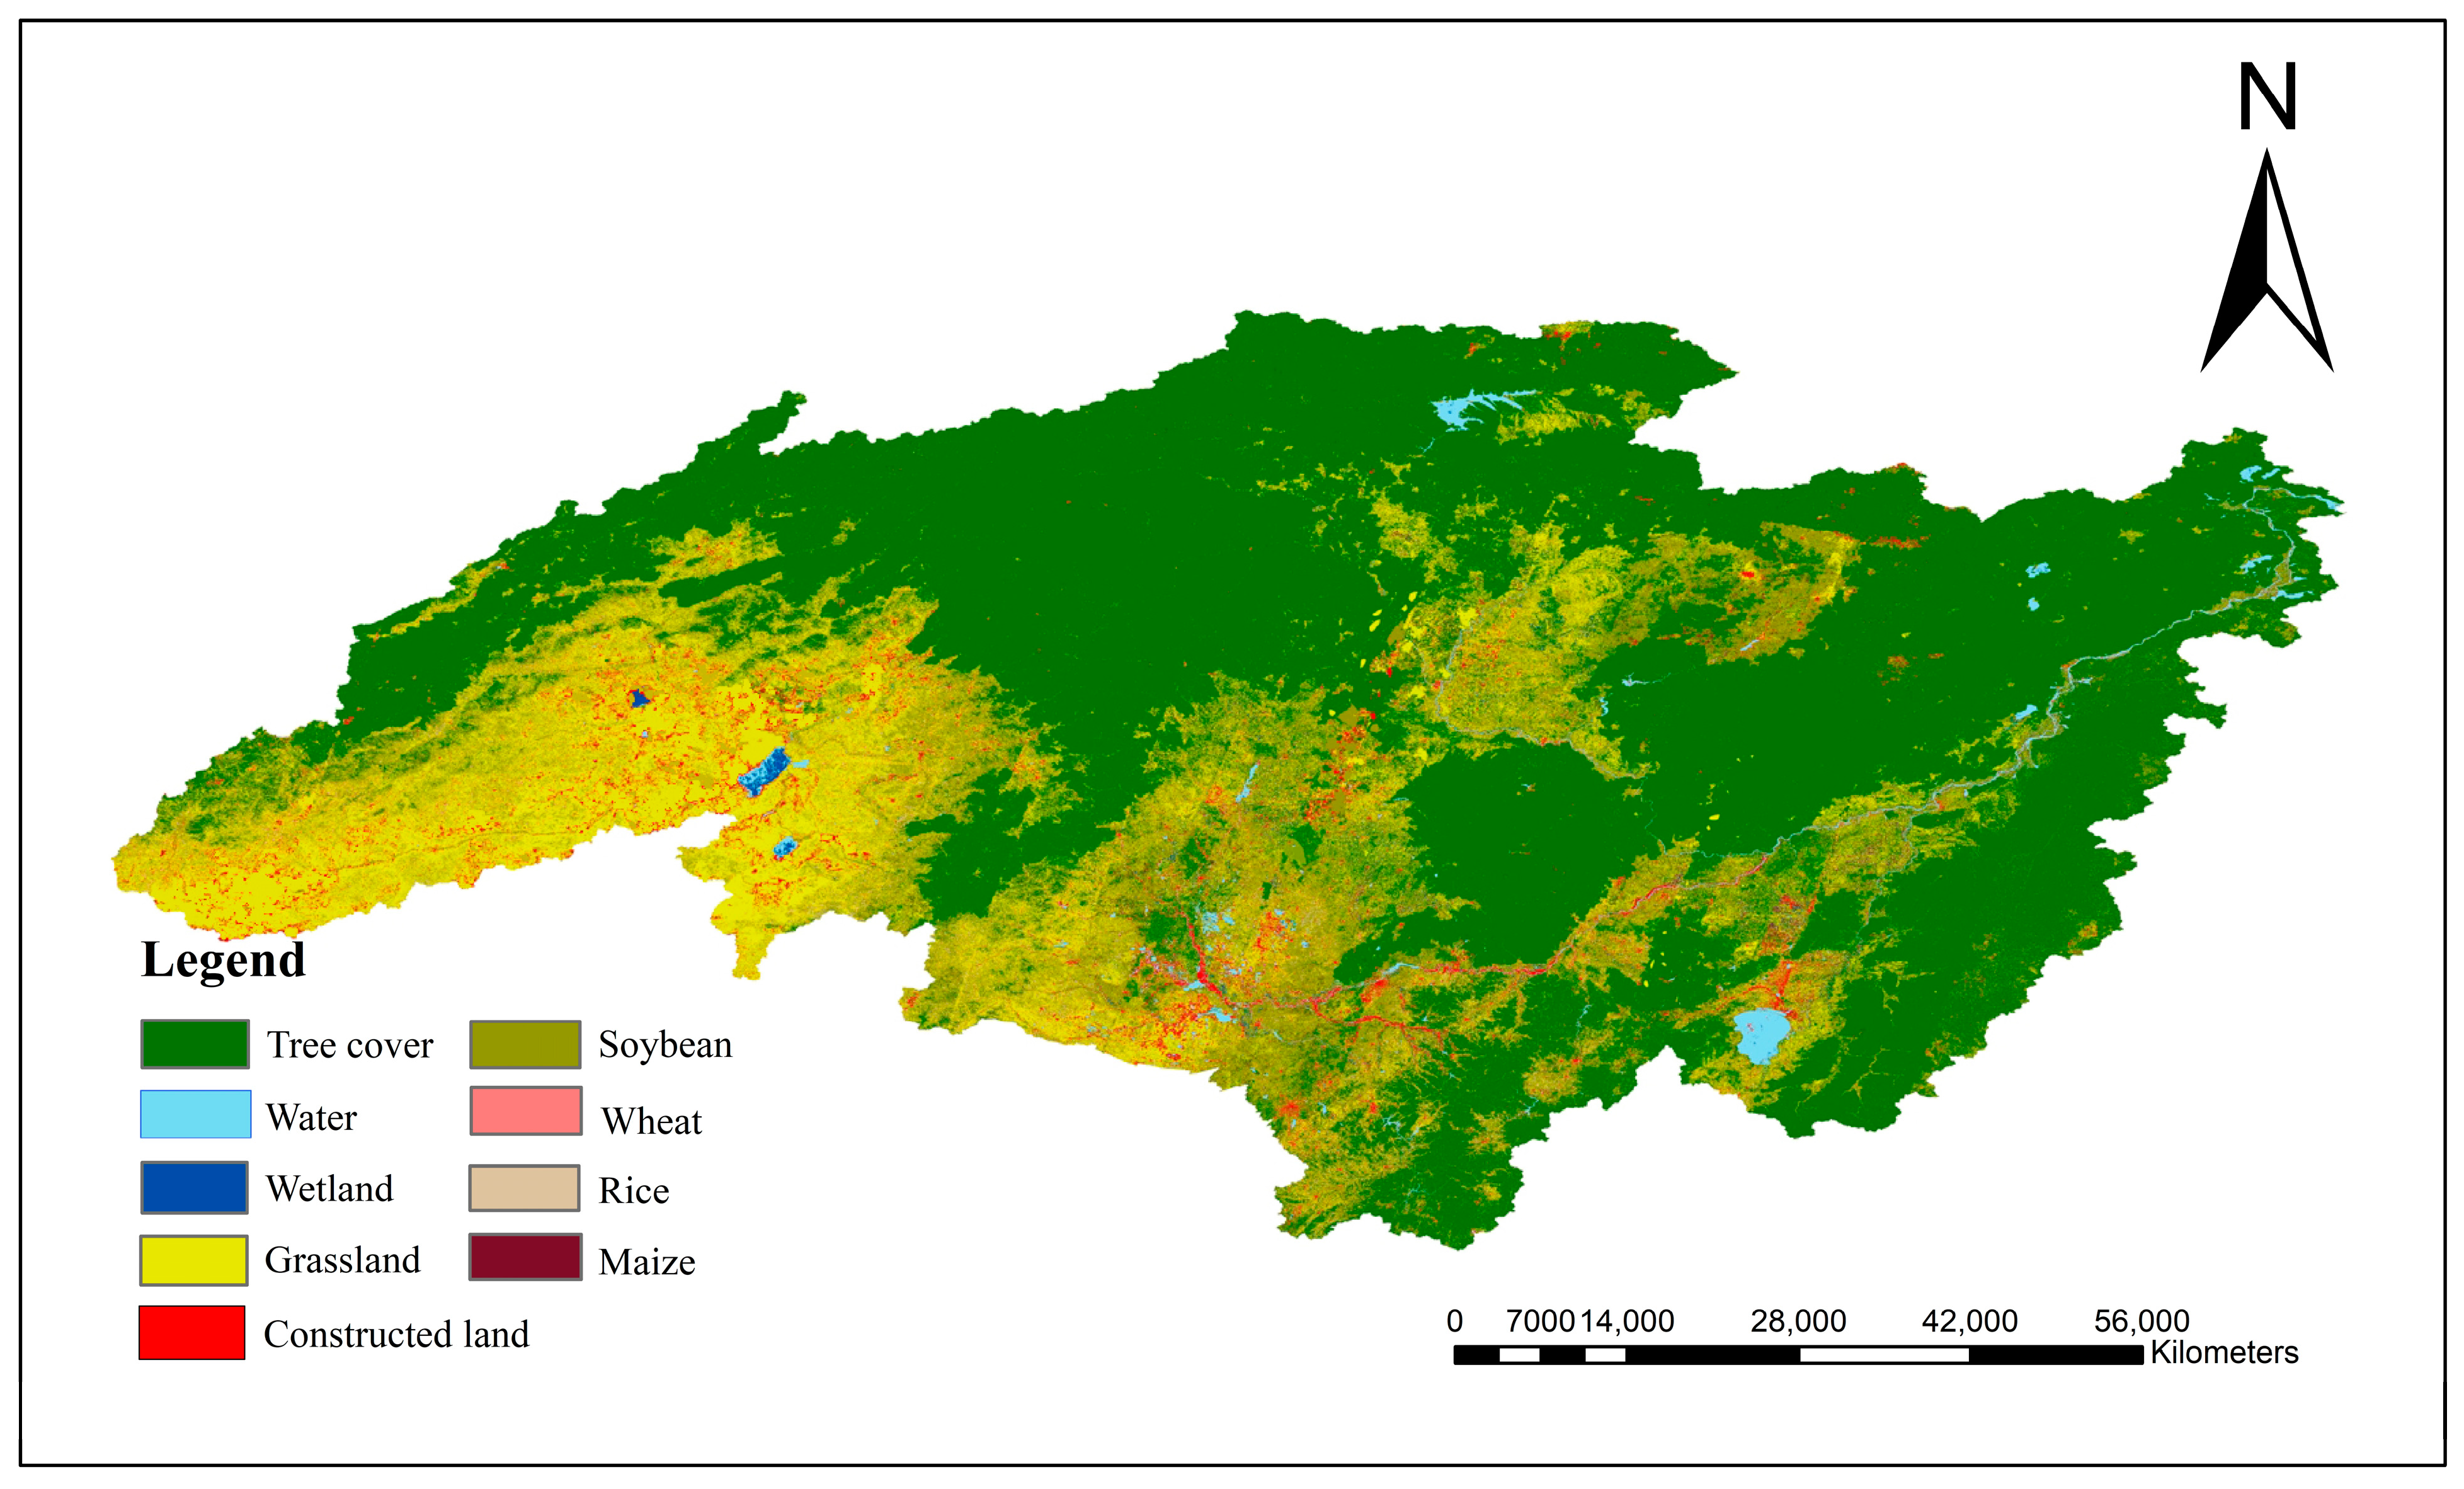
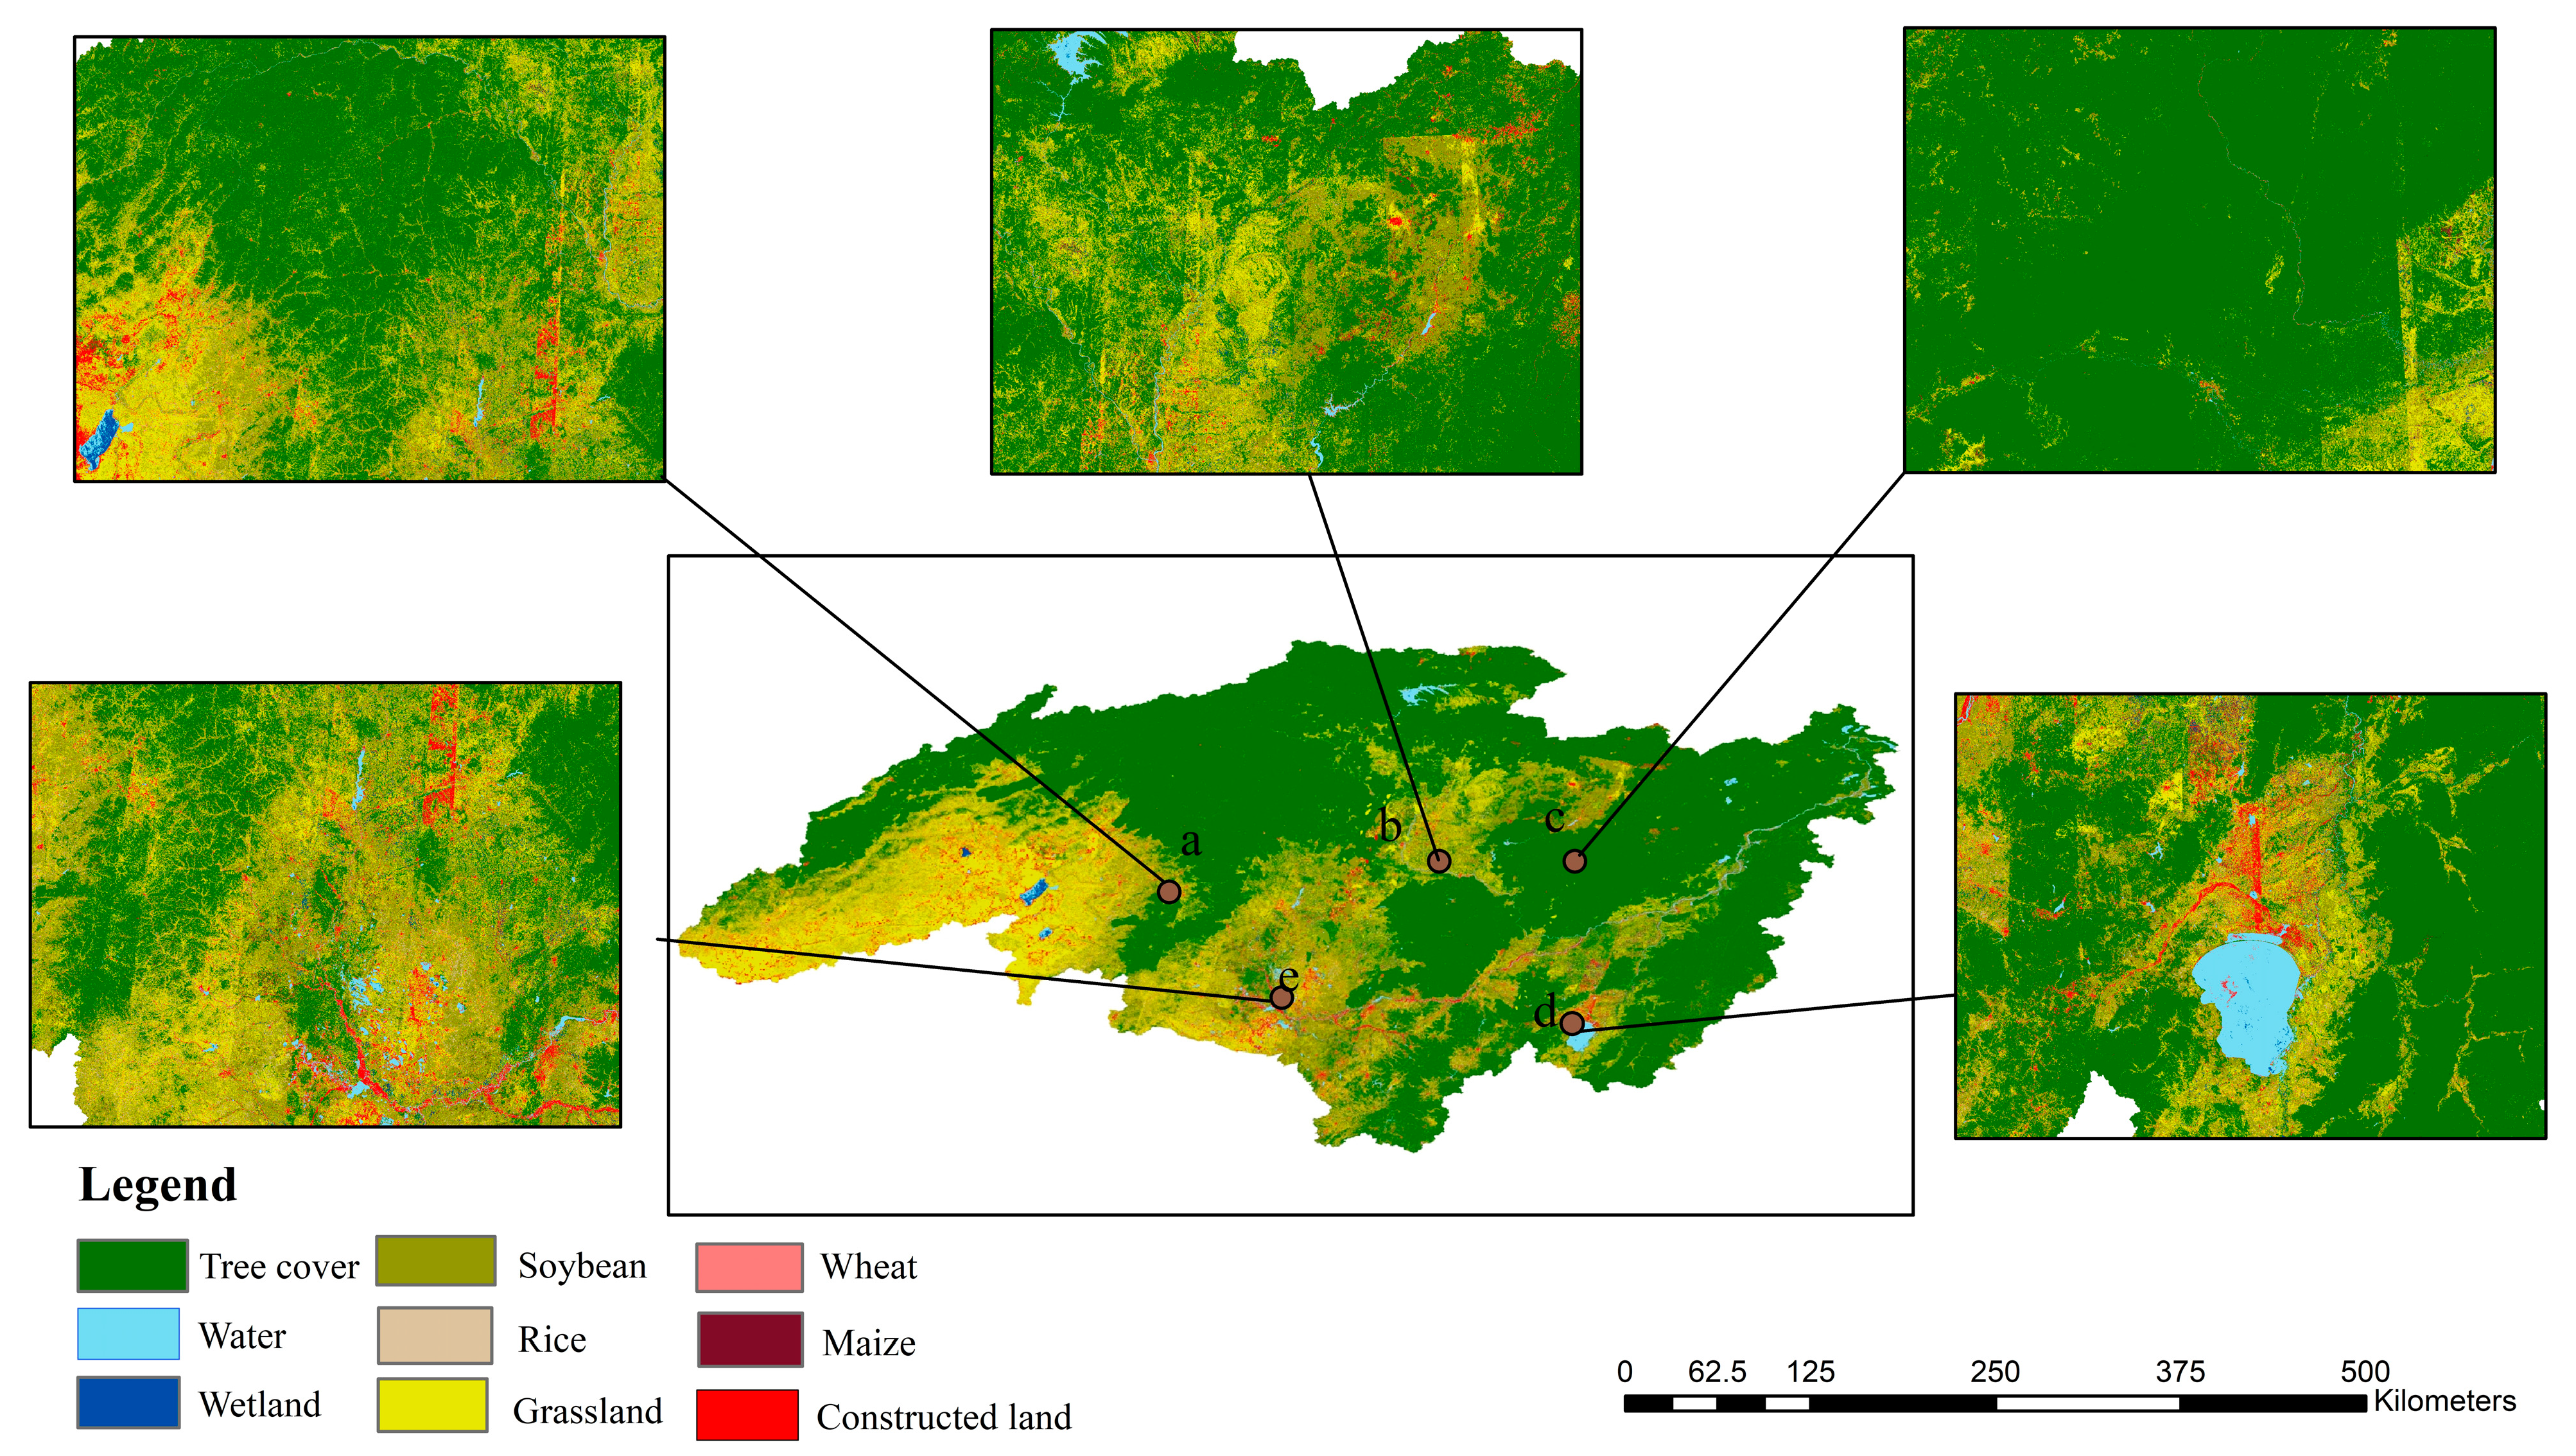
With the assistance of GEE, preprocessing was conducted on multi-temporal Sentinel-2 satellite remote sensing imagery from 2023. Various typical vegetation indices, including the NDVI, the Normalized Difference Water Index (NDWI), the Enhanced Vegetation Index (EVI), and the Modified Soil-Adjusted Vegetation Index (MSAVI), were calculated and analyzed for different crops. An RF classification method was employed to classify and identify multiple crops in the study area. This process successfully extracted information on the spatial distribution of major crops in the Heilongjiang River Basin, including wheat, maize, rice, and soybeans, as well as wetlands, tree cover, grassland, water, and constructed land. The final step involved using ArcGIS for mapping. Figure 7 and Figure 8 illustrate the crop classification results for the year 2023; the area occupied by each land class is presented in Table 3, while Figure 9 provides visual representations.
As shown in Table 3, overall, in 2023, the most extensive land cover type in the Heilongjiang River Basin was tree cover, which was predominantly located in the northeast region of the basin. This tree cover spanned 1,426,354.90 km2 and constituted 62% of the total area of the river basin. Among several crop types, soybeans dominated, occupying the largest area, followed by rice, wheat, and maize, covering 57,646.60 km2, 53,209.53 km2, 39,998.37 km2, and 8782.31 km2, respectively, contributing to 8% of the total basin area. These crops were predominantly found to be distributed in the southeastern region of the Heilongjiang River Basin.
This analysis involved visual interpretation combined with the on-site inspection of selected validation samples and vegetation classification results derived from Sentinel-2 imagery. A confusion matrix was computed to evaluate the accuracy of vegetation classification, yielding an overall accuracy of 86% and a Kappa coefficient of 0.83. Given the relatively small proportion of wheat in the region, although the accuracy of wheat classification was lower, its impact on the subsequent analysis of the study area was minimal.

4.3. Wetland Feature Differentiation

In the Heilongjiang River basin, the terrain is flat, with abundant wetlands, posing a potential challenge in distinguishing them from crops. Figure 9 illustrates the classification results for specific details: (a) represents cultivated land, (b) represents forests, and (c) represents wetlands. The final classification results exhibit clear boundaries with minimal fragmentation. Compared with optical imagery, the majority of land cover types are accurately distinguished. In Figure 9a, the predominant land cover type is cultivated land, encompassing crops such as rice, wheat, maize, and soybeans. Cultivated land is utilized for food production and may undergo extensive agricultural practices. Figure 9b highlights forests as the main land cover type. Forests may have humid conditions, but unlike wetlands, they do not emphasize water saturation, and water flow is less significant. Upon on-site inspection, the classification aligns well with the actual conditions, yielding satisfactory extraction results. In Figure 9c, the principal land cover type is wetlands, characterized by high water levels and typically featuring soil that is consistently moist or flooded. In this study, most areas were correctly identified, and the distribution of rivers, forestry, and cultivated land within wetlands was also clearly visible. The on-site inspection confirmed that the extraction results are consistent with the actual conditions and are deemed satisfactory.
Preserving the ecological structure and functionality of wetlands and implementing scientifically informed management of tidal flats are of paramount importance. These measures contribute to achieving the harmonious development of regional socio-economic and ecological environments [37].

5. Discussion

This study adopted a sample-point selection approach based on land parcels and utilized the RF classification method to identify various crops in the study area. Simultaneously, the study distinguished land features such as wetlands, cultivated land, and forests within the research area. This map is likely one of the higher-resolution crop classification datasets covering the entire Heilongjiang River Basin. In contrast to research endeavors that often focus on a specific crop type or localized area or, indeed, those that employ similar types of research methods, this study offers several advantages.
Firstly, it was possible to obtain a fine-resolution crop classification map of the Heilongjiang River Basin using Sentinel-2A imagery with high spatiotemporal resolution. Previous large-scale crop type recognition studies have predominantly employed medium to low spatial resolution imagery, which has been shown to struggle to capture the subtle features of various crops, often resulting in a single pixel encompassing multiple vegetation types, thereby severely constraining the accuracy of crop type recognition [38]. This study investigated the extensive multispectral and multi-temporal data provided by Sentinel-2 to construct a robust set of classification features. The importance of each feature was evaluated using a feature selection method. Previous studies have employed Landsat data for crop mapping in Heilongjiang Province [39]. When compared with Landsat data, Sentinel-2 data included additional red-edge bands, shortened revisit periods, and enhanced spatial resolution.
Secondly, in large-scale classification, a “zone classification” strategy is employed to alleviate the adverse effects of heterogeneity in crop spectral and phenological feature spaces on classification accuracy. The phenomena of “same object, different spectrum” and “different object, same spectrum”, resulting from spatial heterogeneity, present a considerable challenge in constructing classification models (specifically, rules). The study area spanned two climate zones, temperate and cold-temperate, where differences in climate background and management practices lead to noticeable intra-class differences in certain classification features, thereby affecting model training and accuracy improvement. Therefore, it is necessary to divide the study area into relatively homogeneous subregions. We utilized the “Agricultural Climate Zoning Scheme” for zoning, conducting separate feature selection and classification model training in each agricultural climate subregion. Similar strategies have proven successful in identifying large-scale croplands and grasslands. These approaches demonstrate that independent modeling based on homogeneous subregions can effectively enhance the reliability of classification results.
However, this study has some limitations. Firstly, because of factors such as weather conditions or satellite revisit cycles, it was often challenging to obtain continuous multi-year coverage of large areas using medium to high-resolution remote sensing images. Secondly, crop growth tends to be highly variable over a short period, and the selection of sampling points and parameters at a single stage can lead to large uncertainties in mapping accuracy. In future studies, we will consider the fusion of Sentinel-2 imagery with other remote sensing data sources in order to fully explore the spectral, textural, and phenological characteristics of land features, thereby further enhancing the accuracy of crop identification. We plan to retrieve and analyze multi-period cropland spatial distribution and temporal dynamic changes to provide a basis for the optimal allocation of cropland natural resources in the transboundary basin of the Heilongjiang River.

6. Conclusions

This study leveraged the powerful computational capabilities of GEE and high-spatial-resolution remote sensing data collected by Sentinel satellites. The study focused on the Heilongjiang River Basin, and various typical vegetation indices, including the NDVI, the NDWI, the EVI, and the MSAVI, were computed and analyzed. Sampling was conducted on the GEE platform using parcels as unit samples. The RF classification method was employed to identify various crops in the study area, successfully extracting the spatial distribution of major crops (wheat, maize, rice, and soybean), as well as wetlands, tree cover, grasslands, water, and constructed land, in the Heilongjiang River Basin. The results indicate the following: (1) The overall classification accuracy of RF reaches 86%, with a Kappa coefficient of 0.83. (2) In 2023, the primary land cover type in the Heilongjiang River Basin was tree land, predominantly distributed in the northeast region, covering an extensive area of 1,426,354.90 km2. Among several crops, soybeans occupied the largest land area, followed by rice, wheat, and maize, totaling 8%, with land areas of 57,646.60 km2, 53,209.53 km2, 39,998.37 km2, and 8782.31 km2, respectively. These crops were mainly distributed in the southeast region of the Heilongjiang River Basin. (3) Concerning sample selection, the study adopted a parcel-based approach, significantly reducing the difficulty of sample annotation and accelerating the sample labeling process. The parcel-level sample annotation strategy facilitates more convenient sample creation. (4) The differentiation of wetland, forestry, and cultivated land results in clear boundaries in the final classification results, with minimal fragmentation. Compared with optical imagery, most land cover types were accurately distinguished. Protecting the ecological structure and functionality of wetlands has positive implications for achieving coordinated development between regional socio-economic and ecological environments.

Author Contributions

Conceptualization, M.L. and J.W.; methodology, M.L.; software, D.F. and M.L.; validation, M.L., J.W. and K.L.; formal analysis, C.X.; investigation, J.J.; resources, M.L.; data curation, C.X. and M.L.; writing—original draft preparation, M.L.; writing—review and editing, J.W.; visualization, K.L.; supervision, D.F.; project administration, C.X.; funding acquisition, J.W. All authors have read and agreed to the published version of the manuscript.

Funding

This research was funded by the ANSO “Belt and Road” International Alliance of Scientific Organizations (Grant No. ANSO-CR-KP-2022-06), the China Science and Technology Basic Resource Survey Program (Grant No. 2022FY101902), the Construction Project of China Knowledge Center for Engineering Sciences and Technology (Grant No. CKCEST-2023-1-5), and the Jiangsu Postgraduate Practice and Innovation Program Project (CX116410859).

Data Availability Statement

Data for this article can be obtained by contacting the author.

Acknowledgments

The authors sincerely offer their sincere gratitude to the Chinese Academy of Sciences for the help of its Special Exchange Program.

Conflicts of Interest

The authors declare no conflicts of interest.

References

  1. Guo, Z. Effectively curbing black land degradation. Economic Daily News, 17 April 2024. [Google Scholar]
  2. Jiang, H.; Li, P.; Ren, A.; He, D.; Zhao, T. Problems, Dilemmas, and Policy Recommendations for the Protection and Utilization of Blackland in Heilongjiang Reclamation Area. Mod. Agric. 2024, 8, 75–77. [Google Scholar]
  3. Wei, S.; Wang, J.; Gu, W. China granary—Grain production analysis and resolving strategies in Heilongjiang Province. J. Northeast. Agric. Univ. 2011, 42, 1–8. [Google Scholar] [CrossRef]
  4. Liu, X.; Yan, B. Soil erosion and food security in the black soil region of Northeast China. Soil Water Conserv. China 2009, 30, 17–19. [Google Scholar] [CrossRef]
  5. Lin, T.; Xie, Y.; Liu, G.; Chen, D.L.; Duan, X.W. Impact of Climate Change on Crop Yields in Heilongjiang Province. J. Nat. Resour. 2008, 23, 307–318. [Google Scholar]
  6. Wang, Y.; Zang, S.; Tian, Y. Mapping paddy rice with the random forest algorithm using MODIS and SMAP time series. Chaos Solitons Fractals 2020, 140, 110116. [Google Scholar] [CrossRef]
  7. Chen, Y.; Lu, D.; Moran, E.; Batistella, M.; Dutra, L.V.; Sanches, I.D.A.; da Silva, R.F.B.; Huang, J.; Luiz, A.J.B.; de Oliveira, M.A.F. Mapping croplands, cropping patterns, and crop types using MODIS time-series data. Int. J. Appl. Earth Obs. Geoinf. 2018, 69, 133–147. [Google Scholar] [CrossRef]
  8. Li, R.; Xu, M.; Chen, Z.; Gao, B.; Cai, J.; Shen, F.; He, X.; Zhuang, Y.; Chen, D. Phenology-based classification of crop species and rotation types using fused MODIS and Landsat data: The comparison of a random-forest-based model and a decision-rule-based model. Soil Tillage Res. 2021, 206, 104838. [Google Scholar] [CrossRef]
  9. Du, B.; Zhang, J.; Wang, Z.; Mao, D.; Zhang, M.; Wu, B. Crop mapping based on Sentinel-2A NDVI time series using object-oriented classification and de-cision tree model. J. Geo-Inf. Sci. 2019, 21, 740–751. [Google Scholar] [CrossRef]
  10. Jie, W.; Zhang, Y.; Zhang, H.; Wu, N.; Zhang, Y. Remote Sensing Mapping of Spatial Distribution of Major Crops at County Level—Taking Tongjiang City as an Example. Mod. Agric. Mach. 2022, 03, 67–68. [Google Scholar]
  11. Song, Q. Study on the Extraction of Spatial Distribution Information of Agricultural Crops and the Analysis of Changes in Their Spatial and Temporal Patterns. Master’s Thesis, Chinese Academy of Agricultural Sciences (CASA), Beijing, China, 2018. [Google Scholar]
  12. Han, B. Remote Sensing Mapping of Bulk Crop Distribution in Jilin Province. Master’s Thesis, Jilin University, Changchun, China, 2020. [Google Scholar]
  13. Zhang, X.; Liu, K.; Wang, S.; Long, X.; Li, X. A Rapid Model (COV_PSDI) for Winter Wheat Mapping in Fallow Rotation Area Using MODIS NDVI Time-Series Satellite Observations: The Case of the Heilonggang Region. Remote Sens. 2021, 13, 4870. [Google Scholar] [CrossRef]
  14. Amani, M.; Brisco, B.; Afshar, M.; Mirmazloumi, S.M.; Mahdavi, S.; Mirzadeh, S.M.J.; Huang, W.; Granger, J. A generalized super-vised classification scheme to produce provincial wetland inventory maps: An appli-cation of Google Earth Engine for big geo data pro-cessing. Big Earth Data 2019, 3, 378–394. [Google Scholar] [CrossRef]
  15. Hird, J.N.; DeLancey, E.R.; McDermid, G.J.; Kariyeva, J. Google Earth Engine, open-access satellite data, and machine learning in support of large-area probabilistic wetland mapping. Remote Sens. 2017, 9, 1315. [Google Scholar] [CrossRef]
  16. Amani, M.; Ghorbanian, A.; Ahmadi, S.A.; Kakooei, M.; Moghimi, A.; Mirmazloumi, S.M.; Moghaddam, S.H.A.; Mahdavi, S.; Ghahremanloo, M.; Parsian, S.; et al. Google Earth Engine cloud computing platform for remote sensing big data applications: A comprehensive review. IEEE J. Sel. Top. Ap-Plied Earth Obs. Remote Sens. 2020, 13, 5326–5350. [Google Scholar] [CrossRef]
  17. Gorelick, N.; Hancher, M.; Dixon, M.; Ilyushchenko, S.; Thau, D.; Moore, R. Google Earth Engine: Plane-tary-scale geospatial analysis for everyone. Remote Sens. Environ. 2017, 2, 18–27. [Google Scholar] [CrossRef]
  18. Shelestov, A.; Lavreniuk, M.; Kussul, N.; Novikov, A.; Skakun, S. Exploring Google Earth Engine platform for big data processing: Classification of multi-temporal satellite imagery for crop mapping. Front. Earth Sci. 2017, 5, 17. [Google Scholar] [CrossRef]
  19. Wang, S.; Di Tommaso, S.; Deines, J.M.; Lobell, D.B. Mapping twenty years of maize and soybean across the US Midwest using the Landsat archive. Sci. Data 2020, 7, 307. [Google Scholar] [CrossRef]
  20. Ning, X.G.; Chang, W.T.; Wang, H.; Zhang, H.; Zhu, Q. Extraction of marsh wet-land in Heilongjiang Basin based on GEE and multi-source re-mote sensing data. Natl. Remote Sens. Bull. 2022, 26, 386–396. [Google Scholar] [CrossRef]
  21. Pluto-Kossakowska, J. Review on Multitemporal Classification Methods of Satellite Images for Crop and Arable Land Recognition. Agriculture 2021, 11, 999. [Google Scholar] [CrossRef]
  22. Massey, R.; Sankey, T.T.; Congalton, R.G.; Yadav, K.; Thenkabail, P.S.; Ozdogan, M.; Sánchez Meador, A.J. MODIS phenology-derived, multi-year distribution of conterminous U.S. crop types. Remote Sens. Environ. 2017, 198, 490–503. [Google Scholar] [CrossRef]
  23. Zhao, X.; Tian, B.; Niu, Y.; Chen, C.; Zhou, Y. Classification of coastal salt marsh based on Sentinel-1ime series backscattering characteristics: The case of the Yangtze River delta. Natl. Remote Sens. Bull. 2022, 26, 672–682. [Google Scholar] [CrossRef]
  24. Zhang, L.; Gong, Z.N.; Wang, Q.W.; Jin, D.; Wang, X. Wetland mapping of Yellow River Delta wetlands based on multi-feature optimization of Sentinel-2 images. J. Remote Sens. 2019, 23, 313–326. [Google Scholar] [CrossRef]
  25. Wu, H. Identification of Typical Crops in Northeast China Using MODIS and Landsat Time Series Data. Master’s Thesis, Liaoning University of Science and Technology, Anshan, China, 2022. [Google Scholar] [CrossRef]
  26. He, Y.; Huang, C.; Li, H.; Liu, Q.S.; Liu, G.H.; Zhou, Z.C.; Zhang, C.C. Land-cover classification of random forest based on Senti-nel-2A image feature optimization. Resour. Sci. 2019, 41, 992–1001. [Google Scholar]
  27. Whitcraft, A.K.; Vermote, E.F.; Becker-Reshef, I.; Justice, C.O. Cloud cover throughout the agricultural growing season: Impacts on passive optical earth observations. Remote Sens. 2015, 156, 438–447. [Google Scholar] [CrossRef]
  28. Tao, J.; Wu, W.; Zhou, Y.; Wang, Y.; Jiang, Y. Mapping winter wheat using phenological feature of peak before winter on the North China Plain based on time-series MODIS data. J. Integr. Agric. 2017, 16, 348–359. [Google Scholar] [CrossRef]
  29. Defourny, P.; Bontemps, S.; Bellemans, N.; Cara, C.; Dedieu, G.; Guzzonato, E.; Hagolle, O.; Inglada, J.; Nicola, L.; Rabaute, T.; et al. Near real-time agriculture monitoring at national scale at parcel resolution: Performance assessment of the Sen2-Agri automated system in various cropping systems around the world. Remote Sens. Environ. 2019, 221, 551–568. [Google Scholar] [CrossRef]
  30. Teluguntla, P.; Thenkabail, P.S.; Oliphant, A.; Xiong, J.; Gumma, M.K.; Congalton, R.G.; Yadav, K.; Huete, A. Mapping cropland extent of Southeast and Northeast Asia using multi-year time-series Landsat 30-m data using a random forest classifier on the Google Earth Engine Cloud. Int. J. Appl. Earth Obs. Geoinf. 2019, 81, 110–124. [Google Scholar] [CrossRef]
  31. Li, X.; Liu, K.; Tian, J. Variability, predictability, and uncertainty in global aerosols inferred from gap-filled satellite observations and an econometric modeling approach. Remote Sens. 2021, 261, 112501. [Google Scholar] [CrossRef]
  32. Zhang, D.; Fang, S.; She, B.; Zhang, H.; Jin, N.; Xia, H.; Yang, Y.; Ding, Y. Winter Wheat Mapping Based on Sentinel-2 Data in Heterogeneous Planting Conditions. Remote Sens. 2019, 11, 2647. [Google Scholar] [CrossRef]
  33. Guo, J.; Zhu, L.; Jin, B. Crop classification based on data fusion of Sentinel-1 and Sentinel-2. Trans. Chin. Soc. Agric. Mach. 2018, 49, 192–198. [Google Scholar]
  34. Yang, L.; Wang, L.; Huang, J.; Mansaray, L.R.; Mijiti, R. Monitoring policy-driven crop area adjustments in northeast China using Landsat-8 imagery. Int. J. Appl. Earth Obs. Geoinf. 2019, 82, 101892. [Google Scholar] [CrossRef]
  35. Changxiu, C.; Taili, Y. The Method of Polygon Land Use Identify Supported by GIS-A Case Study for Dynamic Monitoring Land Using. J. China Agric. Univ. 2001, 6, 55–59. [Google Scholar]
  36. Wu, J.P.; Mao, Z.H.; Chen, J.Y.; Bai, Y.; Pan, D.L. A new classification method for coast remote sensing image. J. Mar. Sci. 2006, 24, 70–78. [Google Scholar]
  37. Yu, X.; Ji, Y.; Wang, L.; Xu, M. Research on Landscape Pattern Change and Driving Mechanism in Tiaozi Mud Reclamation Area in Jiangsu. J. Nanjing Norm. Univ. 2022, 45, 55–63. [Google Scholar]
  38. Yang, N.; Liu, D.; Feng, Q.; Xiong, Q.; Zhang, L.; Ren, T.; Zhao, Y.; Zhu, D.; Huang, J. Large-Scale Crop Mapping Based on Machine Learning and Parallel Computation with Grids. Remote Sens. 2019, 11, 1500. [Google Scholar] [CrossRef]
  39. Xue, Z.; Qian, S. Fusion of Landsat 8 and Sentinel-2 data for mangrove phenology information extraction and classification. J. Remote Sens. 2022, 26, 1121–1142. [Google Scholar] [CrossRef]
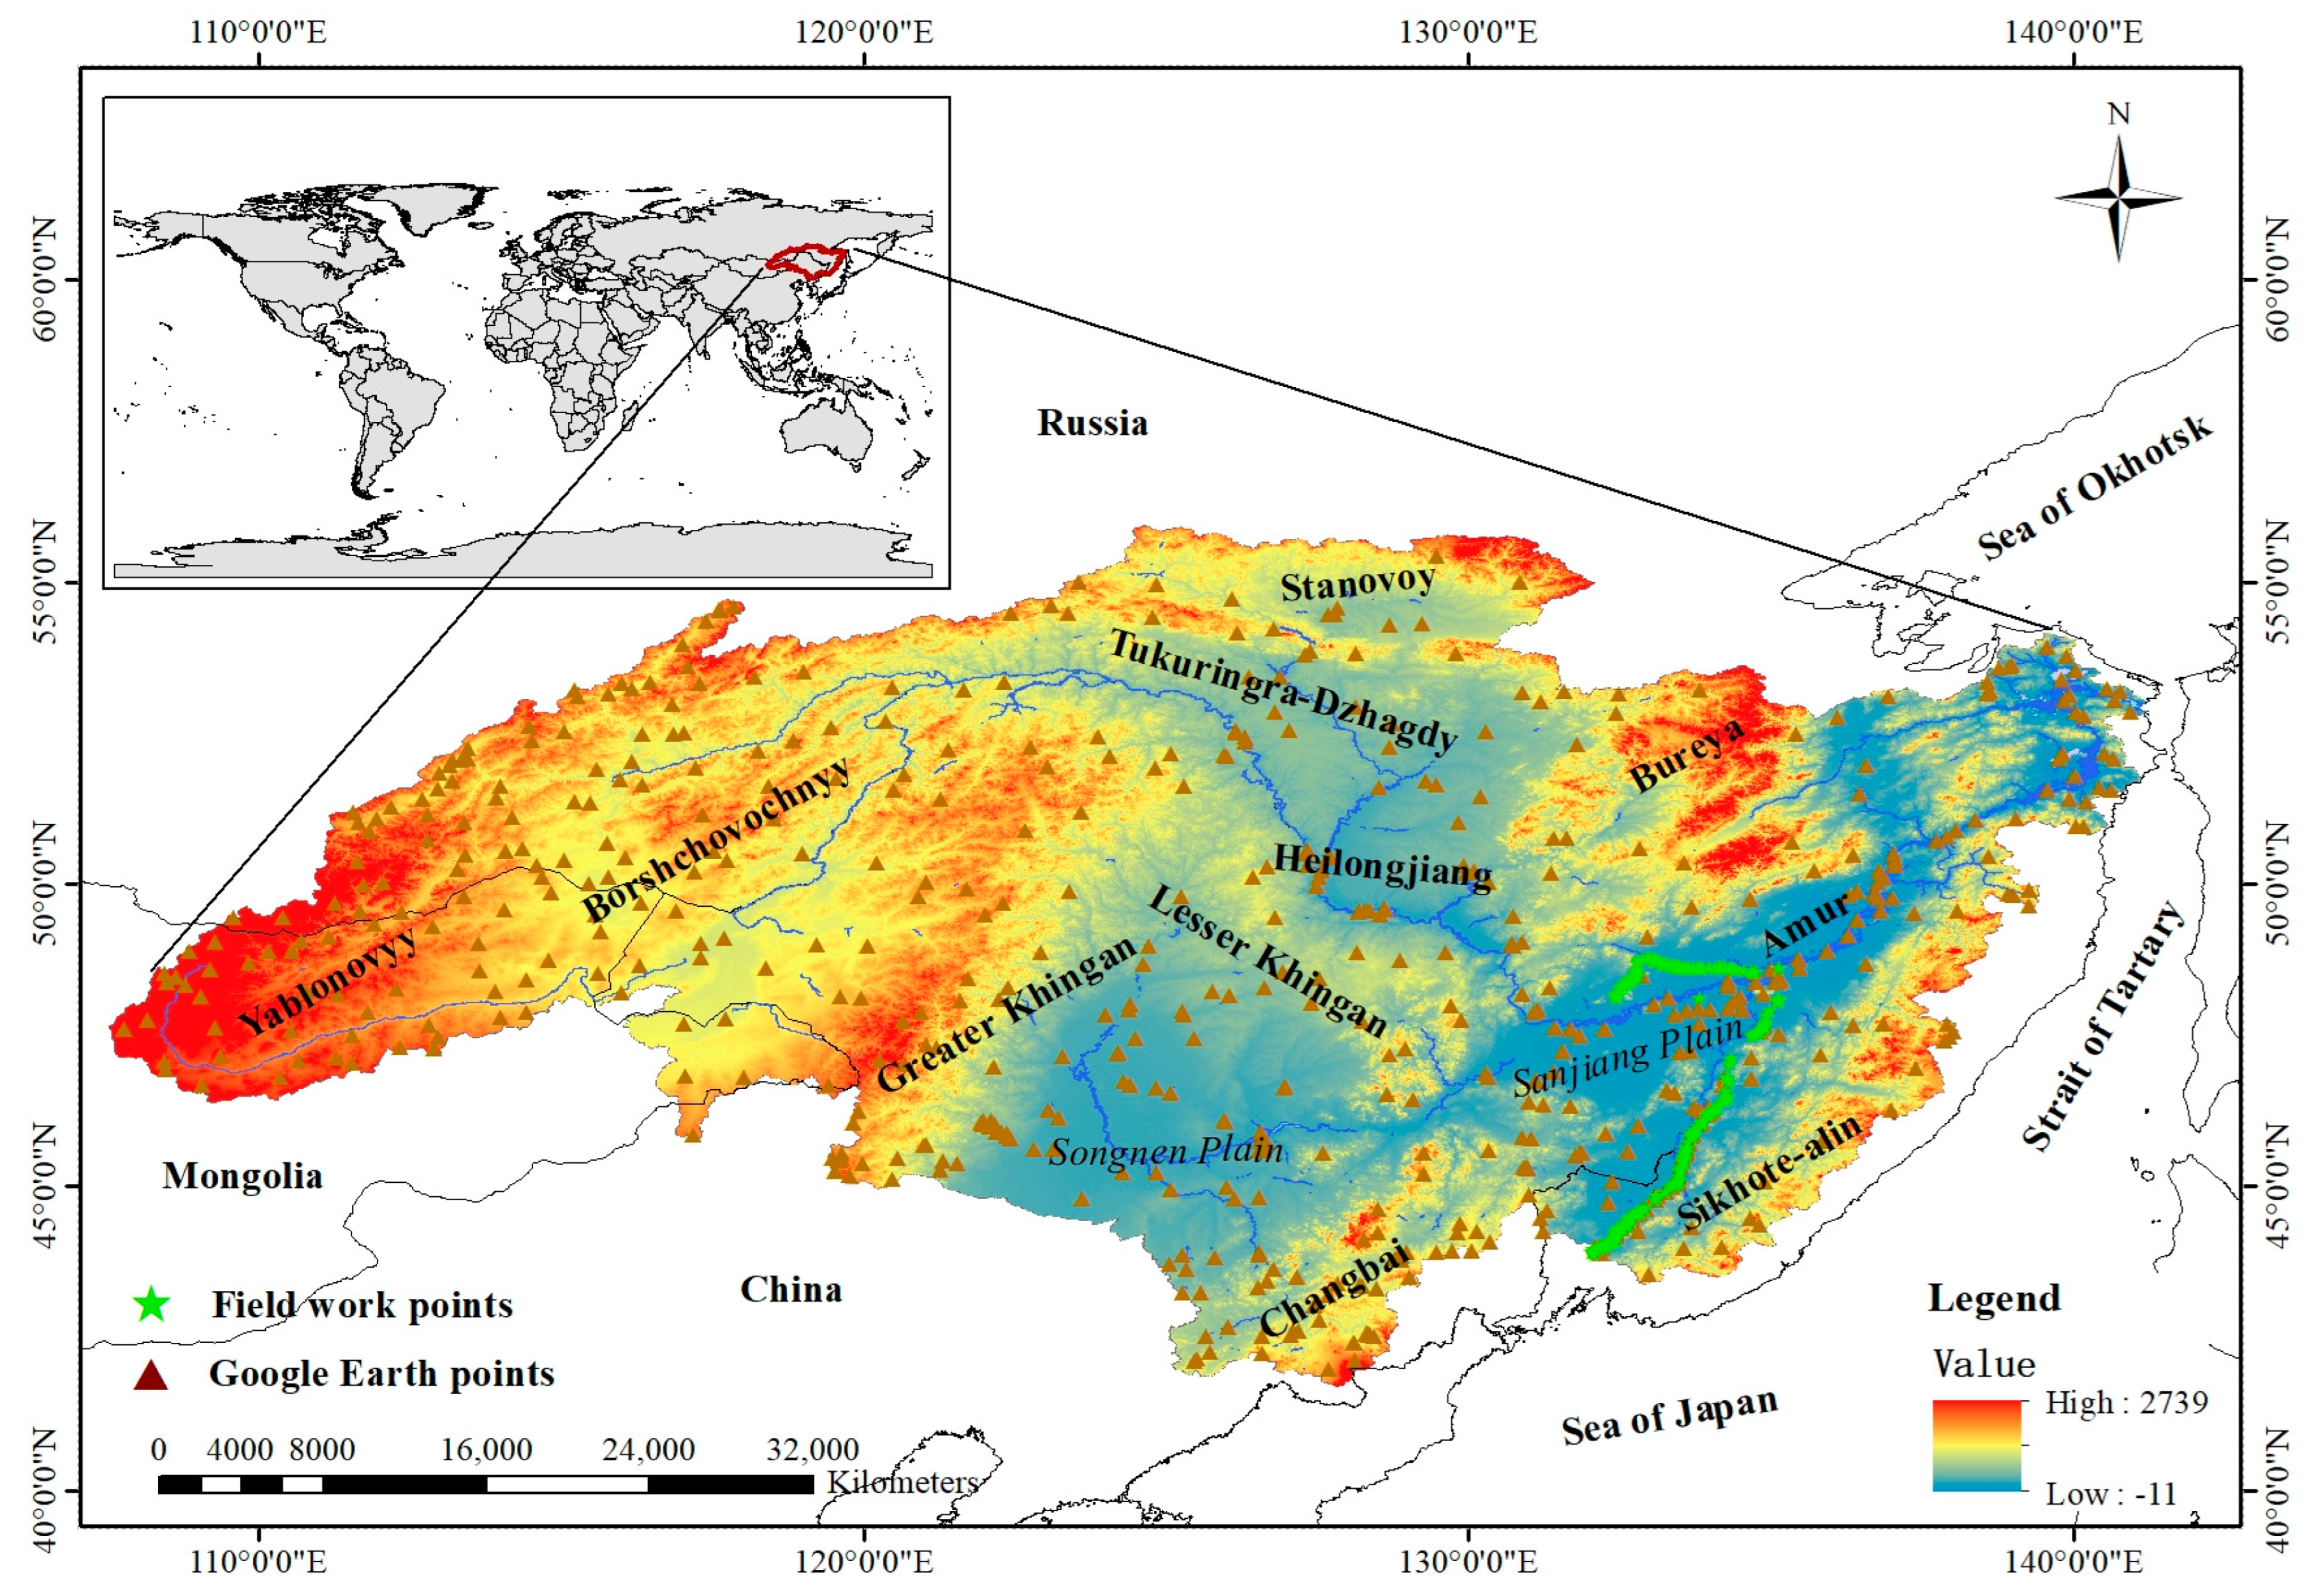
Figure 1. Study area and sample point distribution.
Remotesensing 16 01670 g001
Figure 2. The phenological features of the main crops in the Heilongjiang Basin [25].
Remotesensing 16 01670 g002
Figure 3. Field-sampling photos of different crops, collected during the August 2023 field survey: (a) Corn (b) Soybean (c) Wheat (d) Grassland (e) Wetland (f) Constructed land.
Remotesensing 16 01670 g003
Figure 4. Overall technical process.
Remotesensing 16 01670 g004
Figure 5. Schematic diagram of the random forest algorithm.
Remotesensing 16 01670 g005
Figure 6. Sample identification results.
Remotesensing 16 01670 g006
Figure 7. Map showing crop classification results for the Heilongjiang River Basin in 2023.
Remotesensing 16 01670 g007
Figure 8. Spatial details of crop classification in the Heilongjiang River Basin in 2023: (a) Grassland (b) Constructed land (c) Tree cover (d) Water (e) Soybean.
Remotesensing 16 01670 g008
Figure 9. Local classification results and their corresponding Sentinel-2 images: (a) cultivated land (b) forest (c) wetland.
Remotesensing 16 01670 g009
Table 1. Sentinel-2 sensor spectral bands.
Sentinel-2 BandsWavelength (μm)Reflection (m)
Band 1: Coastal aerosol0.44360
Band 2: Blue0.49010
Band 3: Green0.56010
Band 4: Red0.66510
Band 5: Vegetation red edge0.70520
Band 6: Vegetation red edge0.74020
Band 7: Vegetation red edge0.78320
Band 8: NIR0.84210
Band 8A: Vegetation red edge0.86520
Band 9: Water vapor0.94560
Band 10: SWIR-Cirrus1.37560
Band 11: SWIR11.61020
Band 12: SWIR22.19020
Table 2. Feature descriptions.
Feature VariableAcronymFeature Description
Spectral characteristicsBB1–B4, B8, B8a, B9–B12
Vegetation indexNDVI(B8a − B4)/(B8a + B4)
EVI2.5 × (B8a − B4)/(B8a + 6 × B4 − 7.5×B2 + 1)
MSAVI0.5 × (2 × B8a + 1 − sqrt((2 × B8a + 1) × (2 × B8a + 1) – 8 × (B8a − B4)))
Water indexNDWI(B3 − B8a)/(B3 + B8a)
Terrain indexElevationElevation
SlopeSlope
Table 3. Area of the Heilongjiang River Basin occupied by each category in 2023.
Land Cover TypeArea (km2)Proportion
Grassland557,706.1124.4%
Tree cover1,426,354.9062.3%
Soybeans57,646.602.5%
Water35,620.781.6%
Wetland18,098.080.8%
Constructed land92,187.464.0%
Wheat8782.310.4%
Rice53,209.532.3%
Maize39,998.371.7%
Disclaimer/Publisher’s Note: The statements, opinions and data contained in all publications are solely those of the individual author(s) and contributor(s) and not of MDPI and/or the editor(s). MDPI and/or the editor(s) disclaim responsibility for any injury to people or property resulting from any ideas, methods, instructions or products referred to in the content.