2.1. SFIM
SFIM [
14] is a high-fidelity image fusion method for processing optical remote sensing images, which can divide the image to be processed into multiple blocks for parallel computation and is suitable for data processing on satellites. The classic SFIM model is defined in Equation (1):
where
is the
DN value of a low-resolution image with a wavelength of
, and
is the DN value of a high-resolution image with a wavelength of
.
is the simulated high-resolution pixel corresponding to
, and
is the local average value of
in a neighborhood, which is equivalent to the resolution of
. If solar radiation is given and constant, then the surface reflectance only depends on the terrain. If two images are quantized to the same
DN value range and have the same resolution, then it is assumed that
[
28], so that
can cancel each other out. Meanwhile, because the surface reflectance of images with different resolutions does not change much, it is assumed that
, so that
can cancel each other out. Equation (1) is transformed into Equation (2):
For panchromatic multispectral fusion, Equation (2) is simplified as Equation (3):
In the above formula, is a multispectral image, is a panchromatic image, image is the image upsampled to the resolution size of the image, is a low-resolution panchromatic image, and is the fusion result. The ratio between and only preserves the edge details of high-resolution images while essentially eliminating spectral and contrast information.
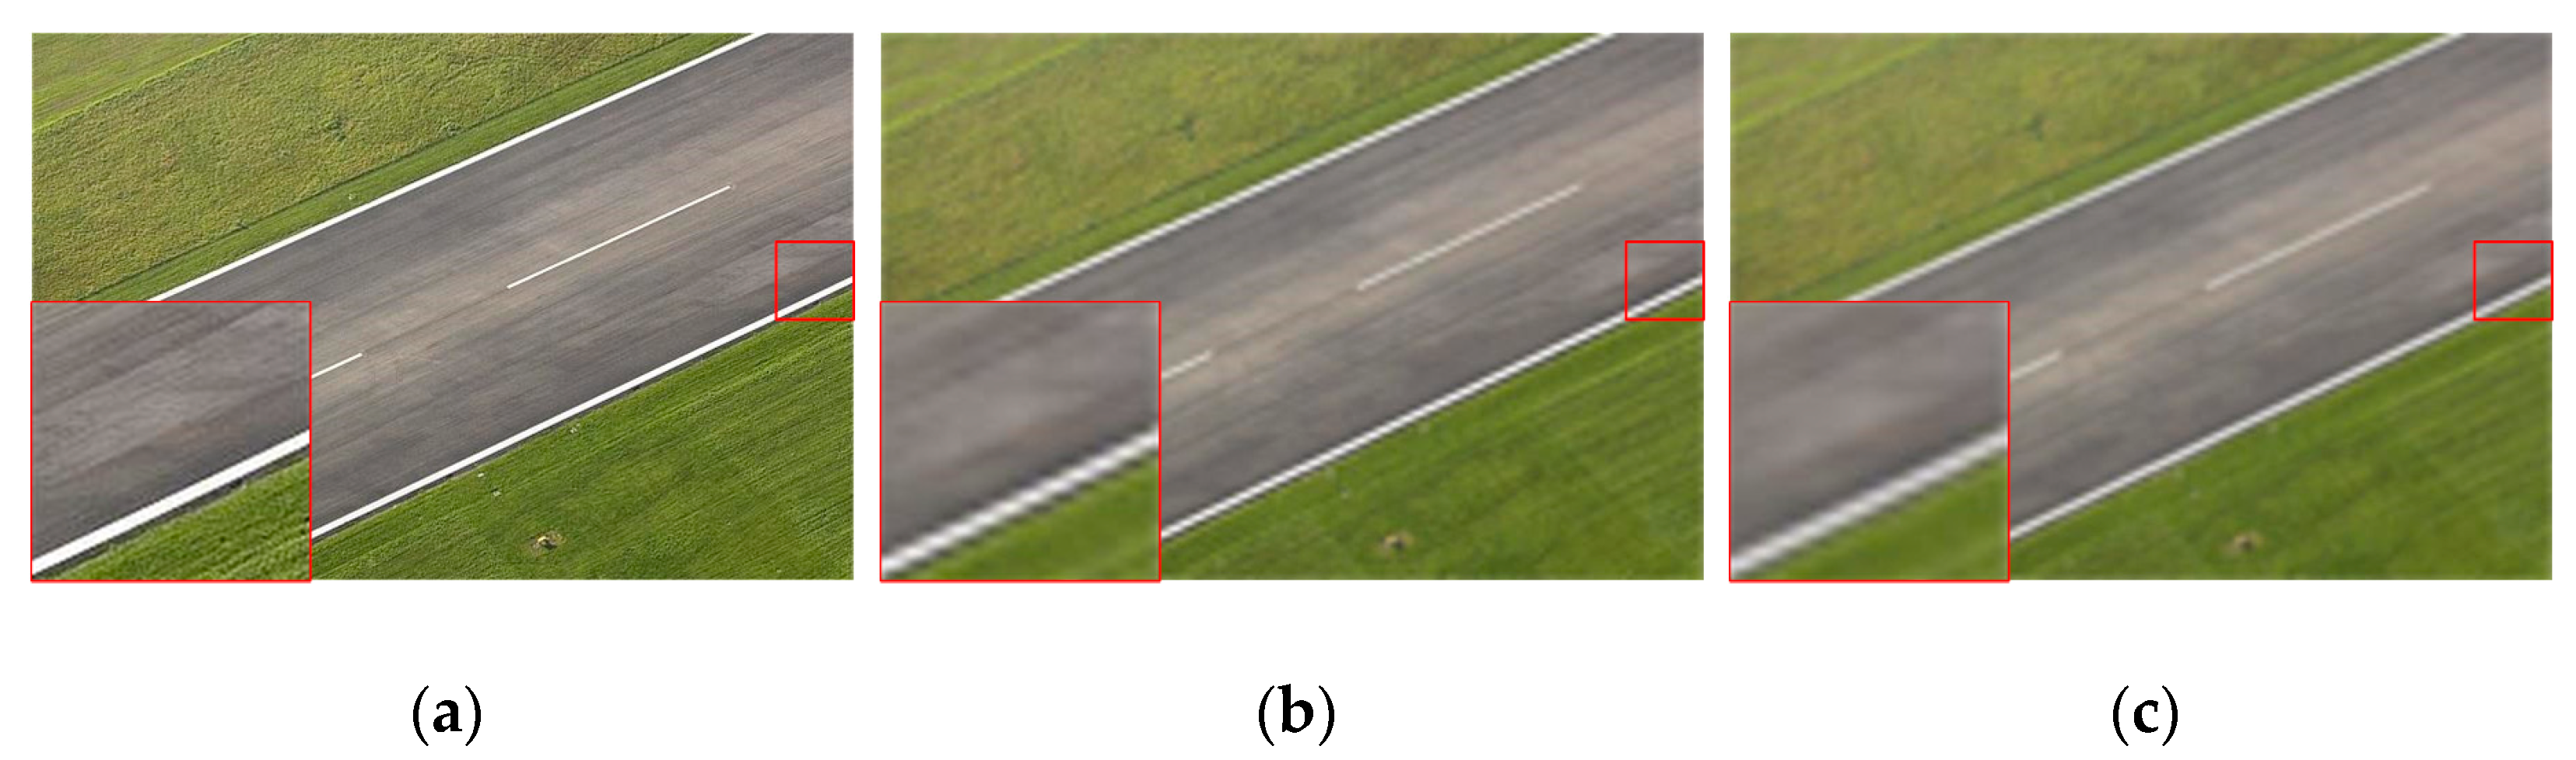
The reason why the classic SFIM method performs poorly on the fusion of panchromatic and multispectral images of different scales is that, in the degradation process, the average convolution kernel processing or the improved Gaussian convolution kernel processing needs to provide the relevant convolution kernel in advance. In this way, different convolution kernels need to be set for different satellites. Therefore, a single convolution kernel cannot filter out the spatial information of remote sensing images of different scales well, which leads to blurring of the fused image.
2.2. Method
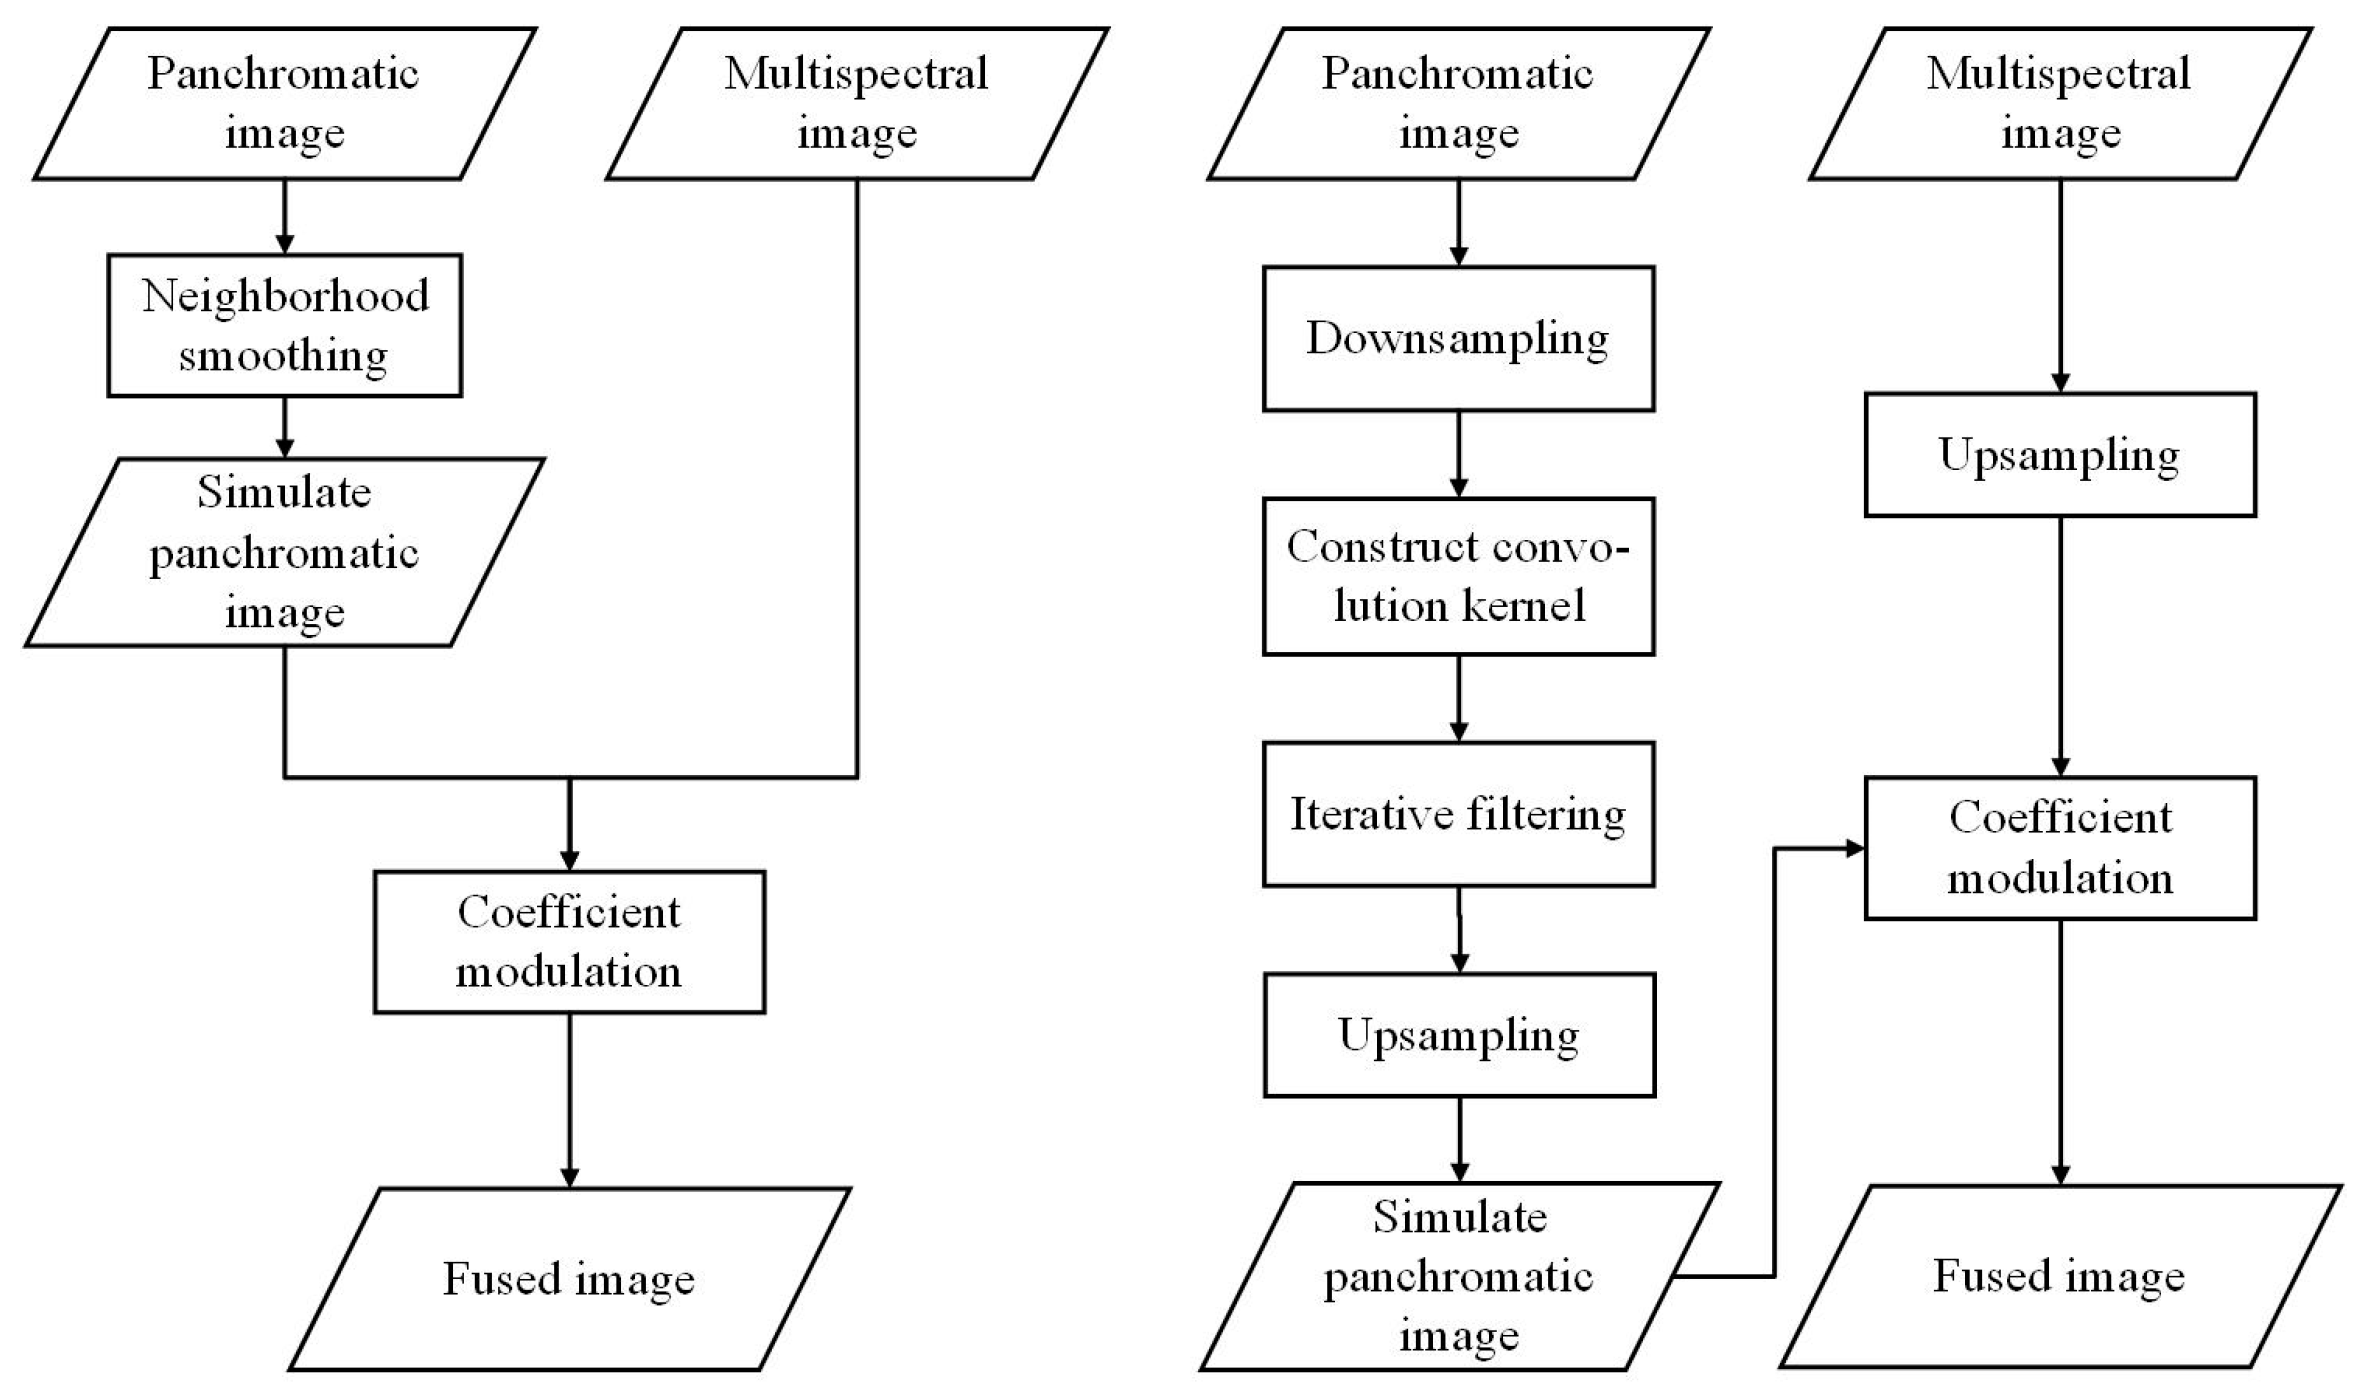
The aim of the method in this paper is to generate a high-quality fusion result by obtaining a low-resolution panchromatic image that is consistent with the spatial and spectral characteristics of the multispectral image. The improvement of the method in this paper focuses on obtaining a downscaled panchromatic image () that maintains both the spatial information and spectral features of the multispectral image. During the fusion process, the multispectral image and the low-resolution panchromatic image have to be resampled to maintain consistent sizes. As such, the ideal low-resolution panchromatic image, (where downsampling is denoted by the subscript ds), should possess a similar image space characteristic to the multispectral image. To achieve a similar spatial structure for the downscaled image to the MS image, a low-pass filter is necessary to eliminate some of the high-frequency information present. Gaussian filtering is selected as the tool to adjust the sharpness by controlling the kernel sharpness through parameter adjustments. Based on these improvements, this paper proposes an adaptive iterative filtering fusion method for panchromatic multispectral images of varying scales. The algorithm can be summarized in the following steps:
Step 1. Calculate the scale ratio of the panchromatic and multispectral images to be fused;
Step 2. Adaptively construct convolution kernels of various scales based on the scale ratio proportion;
Step 3. Use the constructed convolution kernels to iteratively degrade the panchromatic image;
Step 4. Upscale the multispectral and degraded panchromatic images to match the panchromatic scale;
Step 5. Fuse the panchromatic and multispectral images using a ratio-based method.
The algorithm flow of this paper is shown in
Figure 1.
In Step 1, the scale ratio is determined by examining whether there is geographic information on the input panchromatic and multispectral images. If geographic information is present, the overlapping range of the panchromatic and multispectral images in the geographic space is calculated. The overlapping range can then be back-calculated to obtain the pixel coordinates of the panchromatic and multispectral images, and their corresponding overlapping areas.
Here,
and
are the pixel coordinates of the overlapping region between the two images.
corresponds to the upper left corner of the overlapping area, and
corresponds to the lower right corner. Additionally, the scale ratio of the panchromatic image and the multispectral image can be expressed by the following formula:
The goal of the second step is to create convolution kernels, σ, with differing scales. To do this, we adapt the construction process from the Gaussian pyramid. By doing so, we can construct convolution kernels based on the Gaussian pyramid transformation.
The first step in the process of constructing these kernels is to calculate the number of convolution kernels,
, needed based on the target scale. This value should be an integer.
Following the calculation of the integer value for the number of convolution kernels,
, we can now construct the floating-point quantity,
, for the convolution kernel scale.
If , this indicates that the difference between scales is exactly a power of 2. In such cases, we can easily construct a multiscale convolution kernel using a traditional Gaussian pyramid.
However, if and are not equal, this implies that the scale difference is not a power of 2. In such cases, to construct a multiscale convolution kernel, we need to add one more layer resulting in scale layers.
To represent the Gaussian convolution kernel, we use the following equation:
In the above formula,
represents the coordinates of any point in the convolution kernel, while
represents the coordinates of the kernel’s center point. In layer
, Gaussian convolution kernels with a standard deviation of
[
29] are used. According to the suggestion of SIFT,
achieves optimal results when performing 2-fold downsampling, so the value of 1.6 is chosen in this paper. However, if
, different standard deviations must be estimated for the
layer. The estimation method is as follows:
If and are equal, then the layer uses a standard deviation of . The construction method of the convolutional kernels used in the last layer is identical to that used in previous layers, which involves using Gaussian convolutional kernels.
The third step requires iterative degradation based on the number of convolutional layers being constructed and the corresponding convolutional kernels calculated in the second step. Each layer uses the corresponding convolutional kernels for convolution, and after the convolution process is complete, downsampling is performed to obtain an ideal low-resolution panchromatic image,
. Based on a consideration of computational efficiency and the downsampling effect, the bilinear resampling method is adopted as the downsampling method, and the formula is shown as follows:
where
,
,
,
, and these four points are the points around the downsampling target point
. In this way, it is possible to resample images when the scale is not integer.
Next, in the fourth step, the original MS and low-resolution panchromatic image, , are upsampled to the panchromatic PAN scale to obtain and . The resampling method for upsampling is based on a consideration of computational efficiency and the effect of resampling, and the same bilinear resampling model mentioned in the previous step is selected. By building a Gaussian pyramid in this way, it is possible to obtain a degraded panchromatic image of the corresponding scale.
Finally, the fifth step involves obtaining the fusion image,
, using the ratio method:
This estimation method ensures a smooth transition between convolution layers with different numbers of output channels, which helps maintain the method’s overall performance.
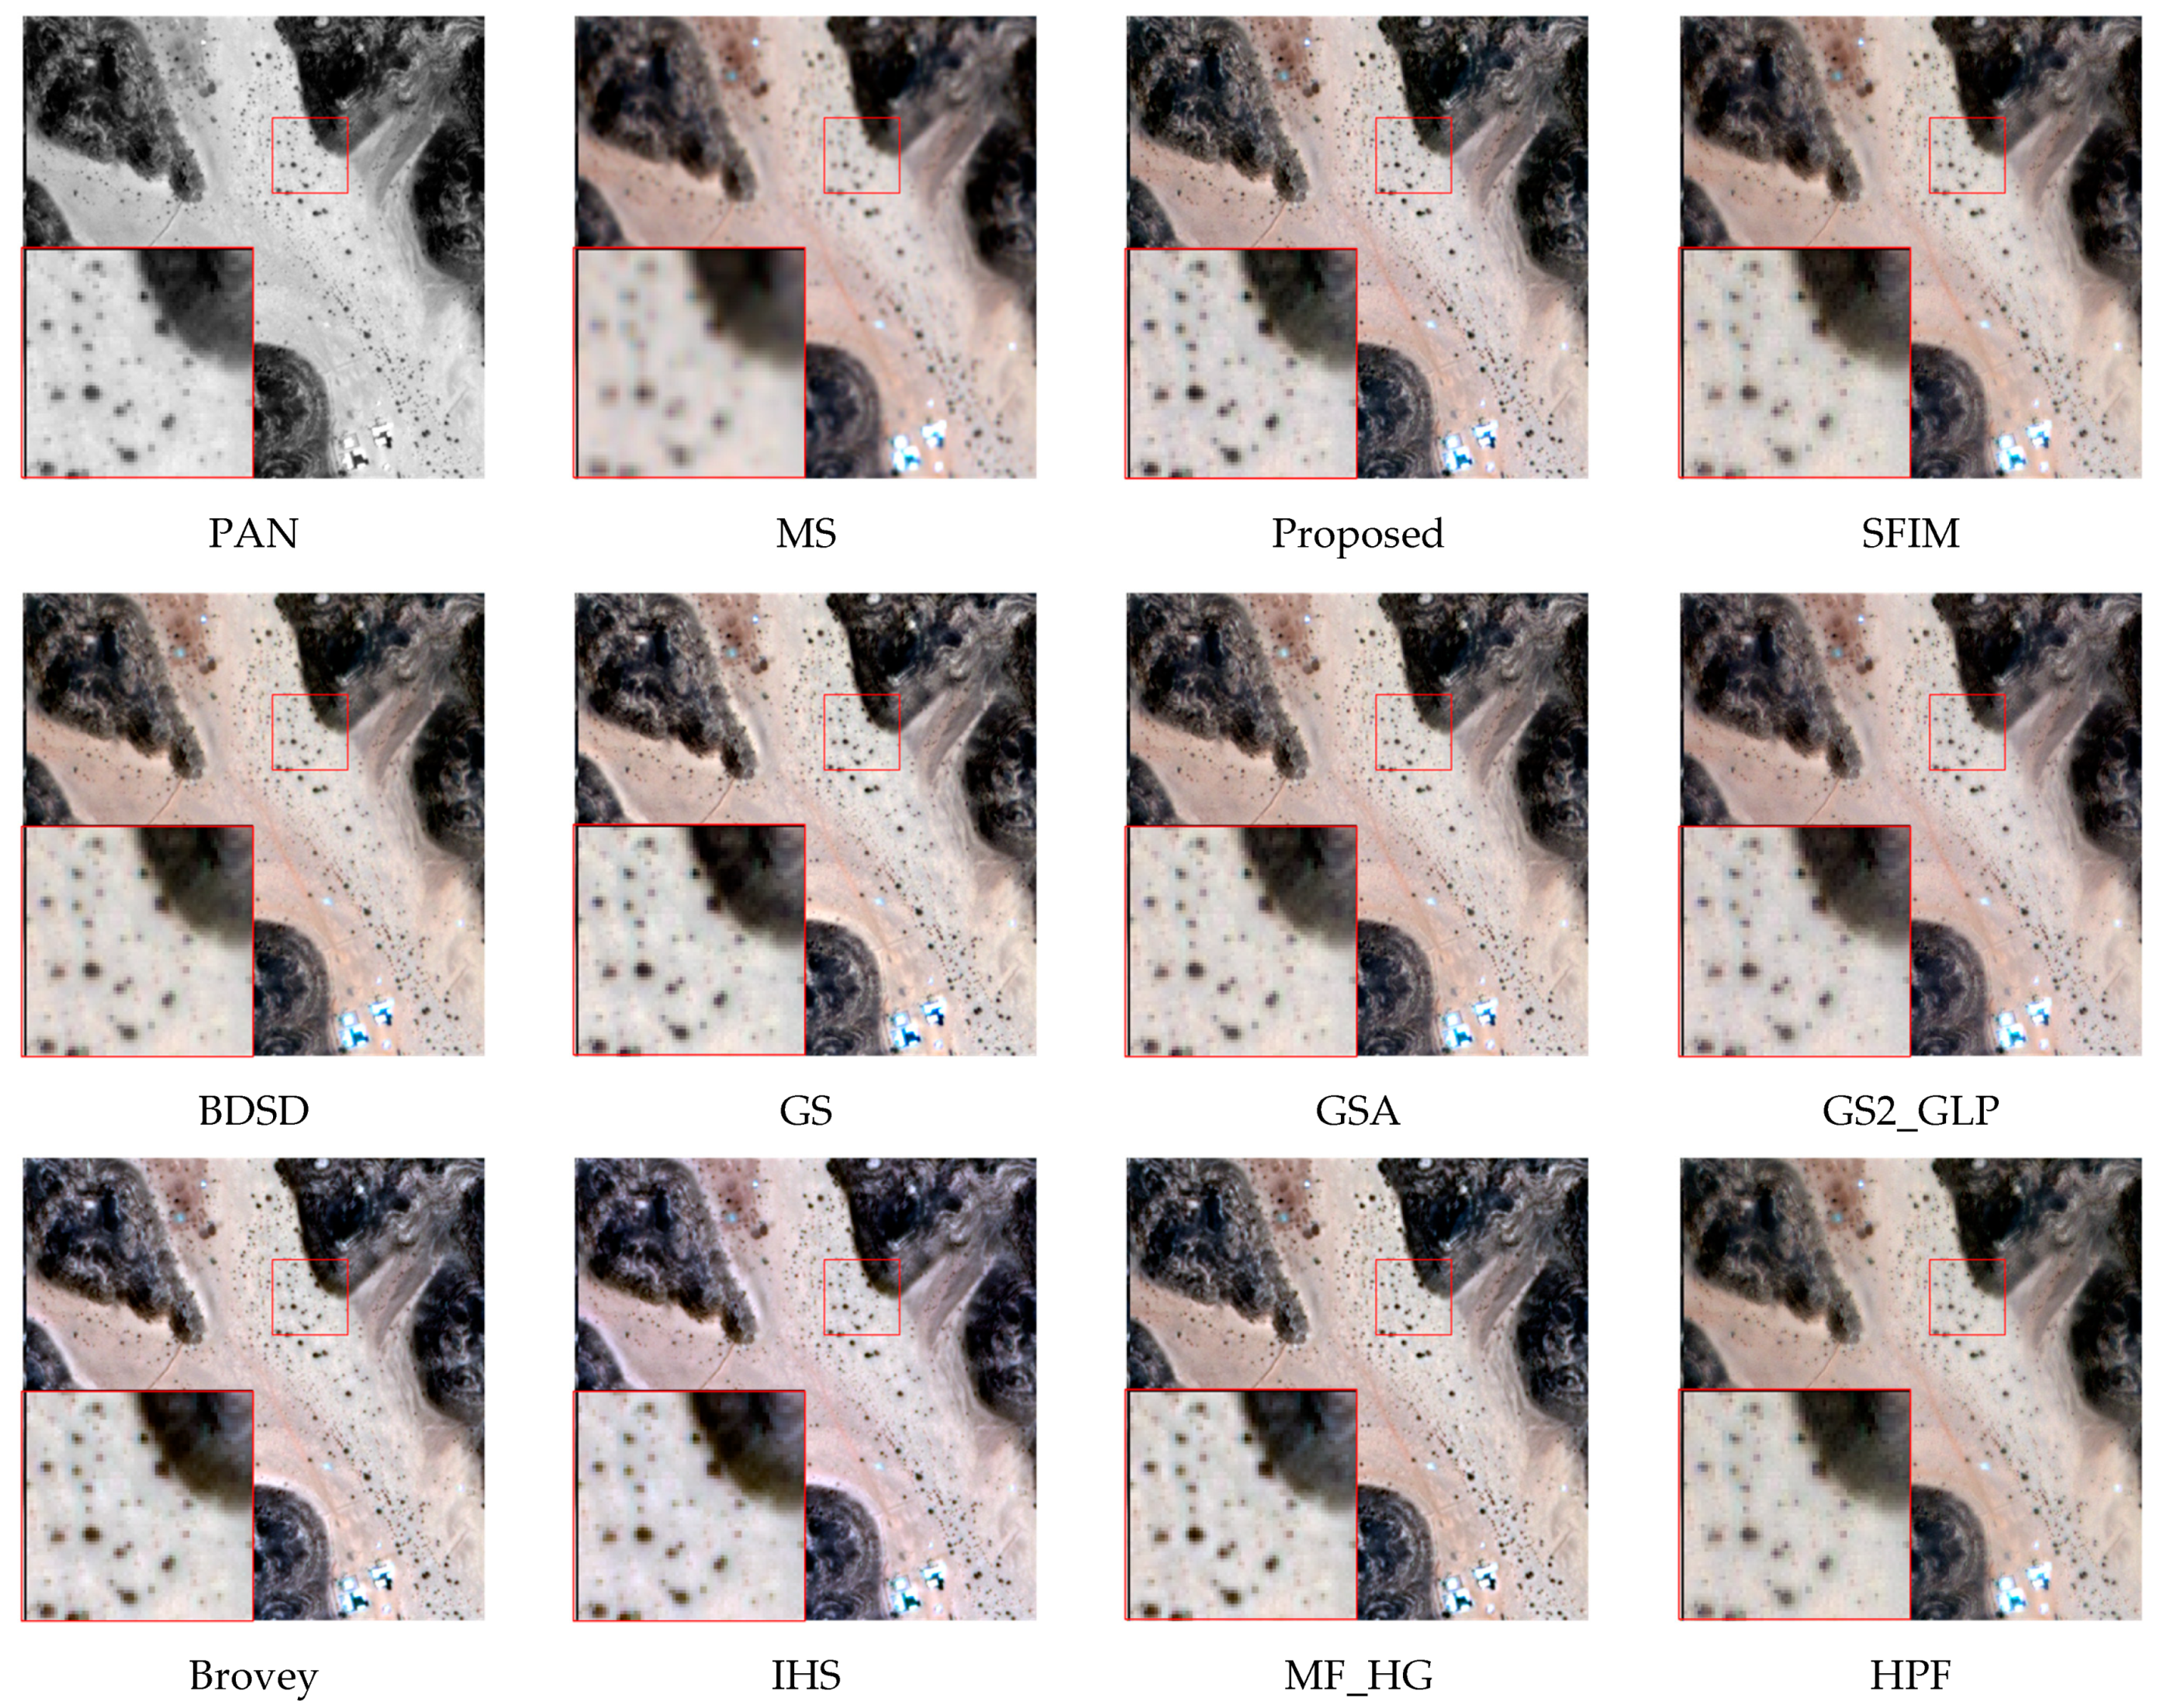
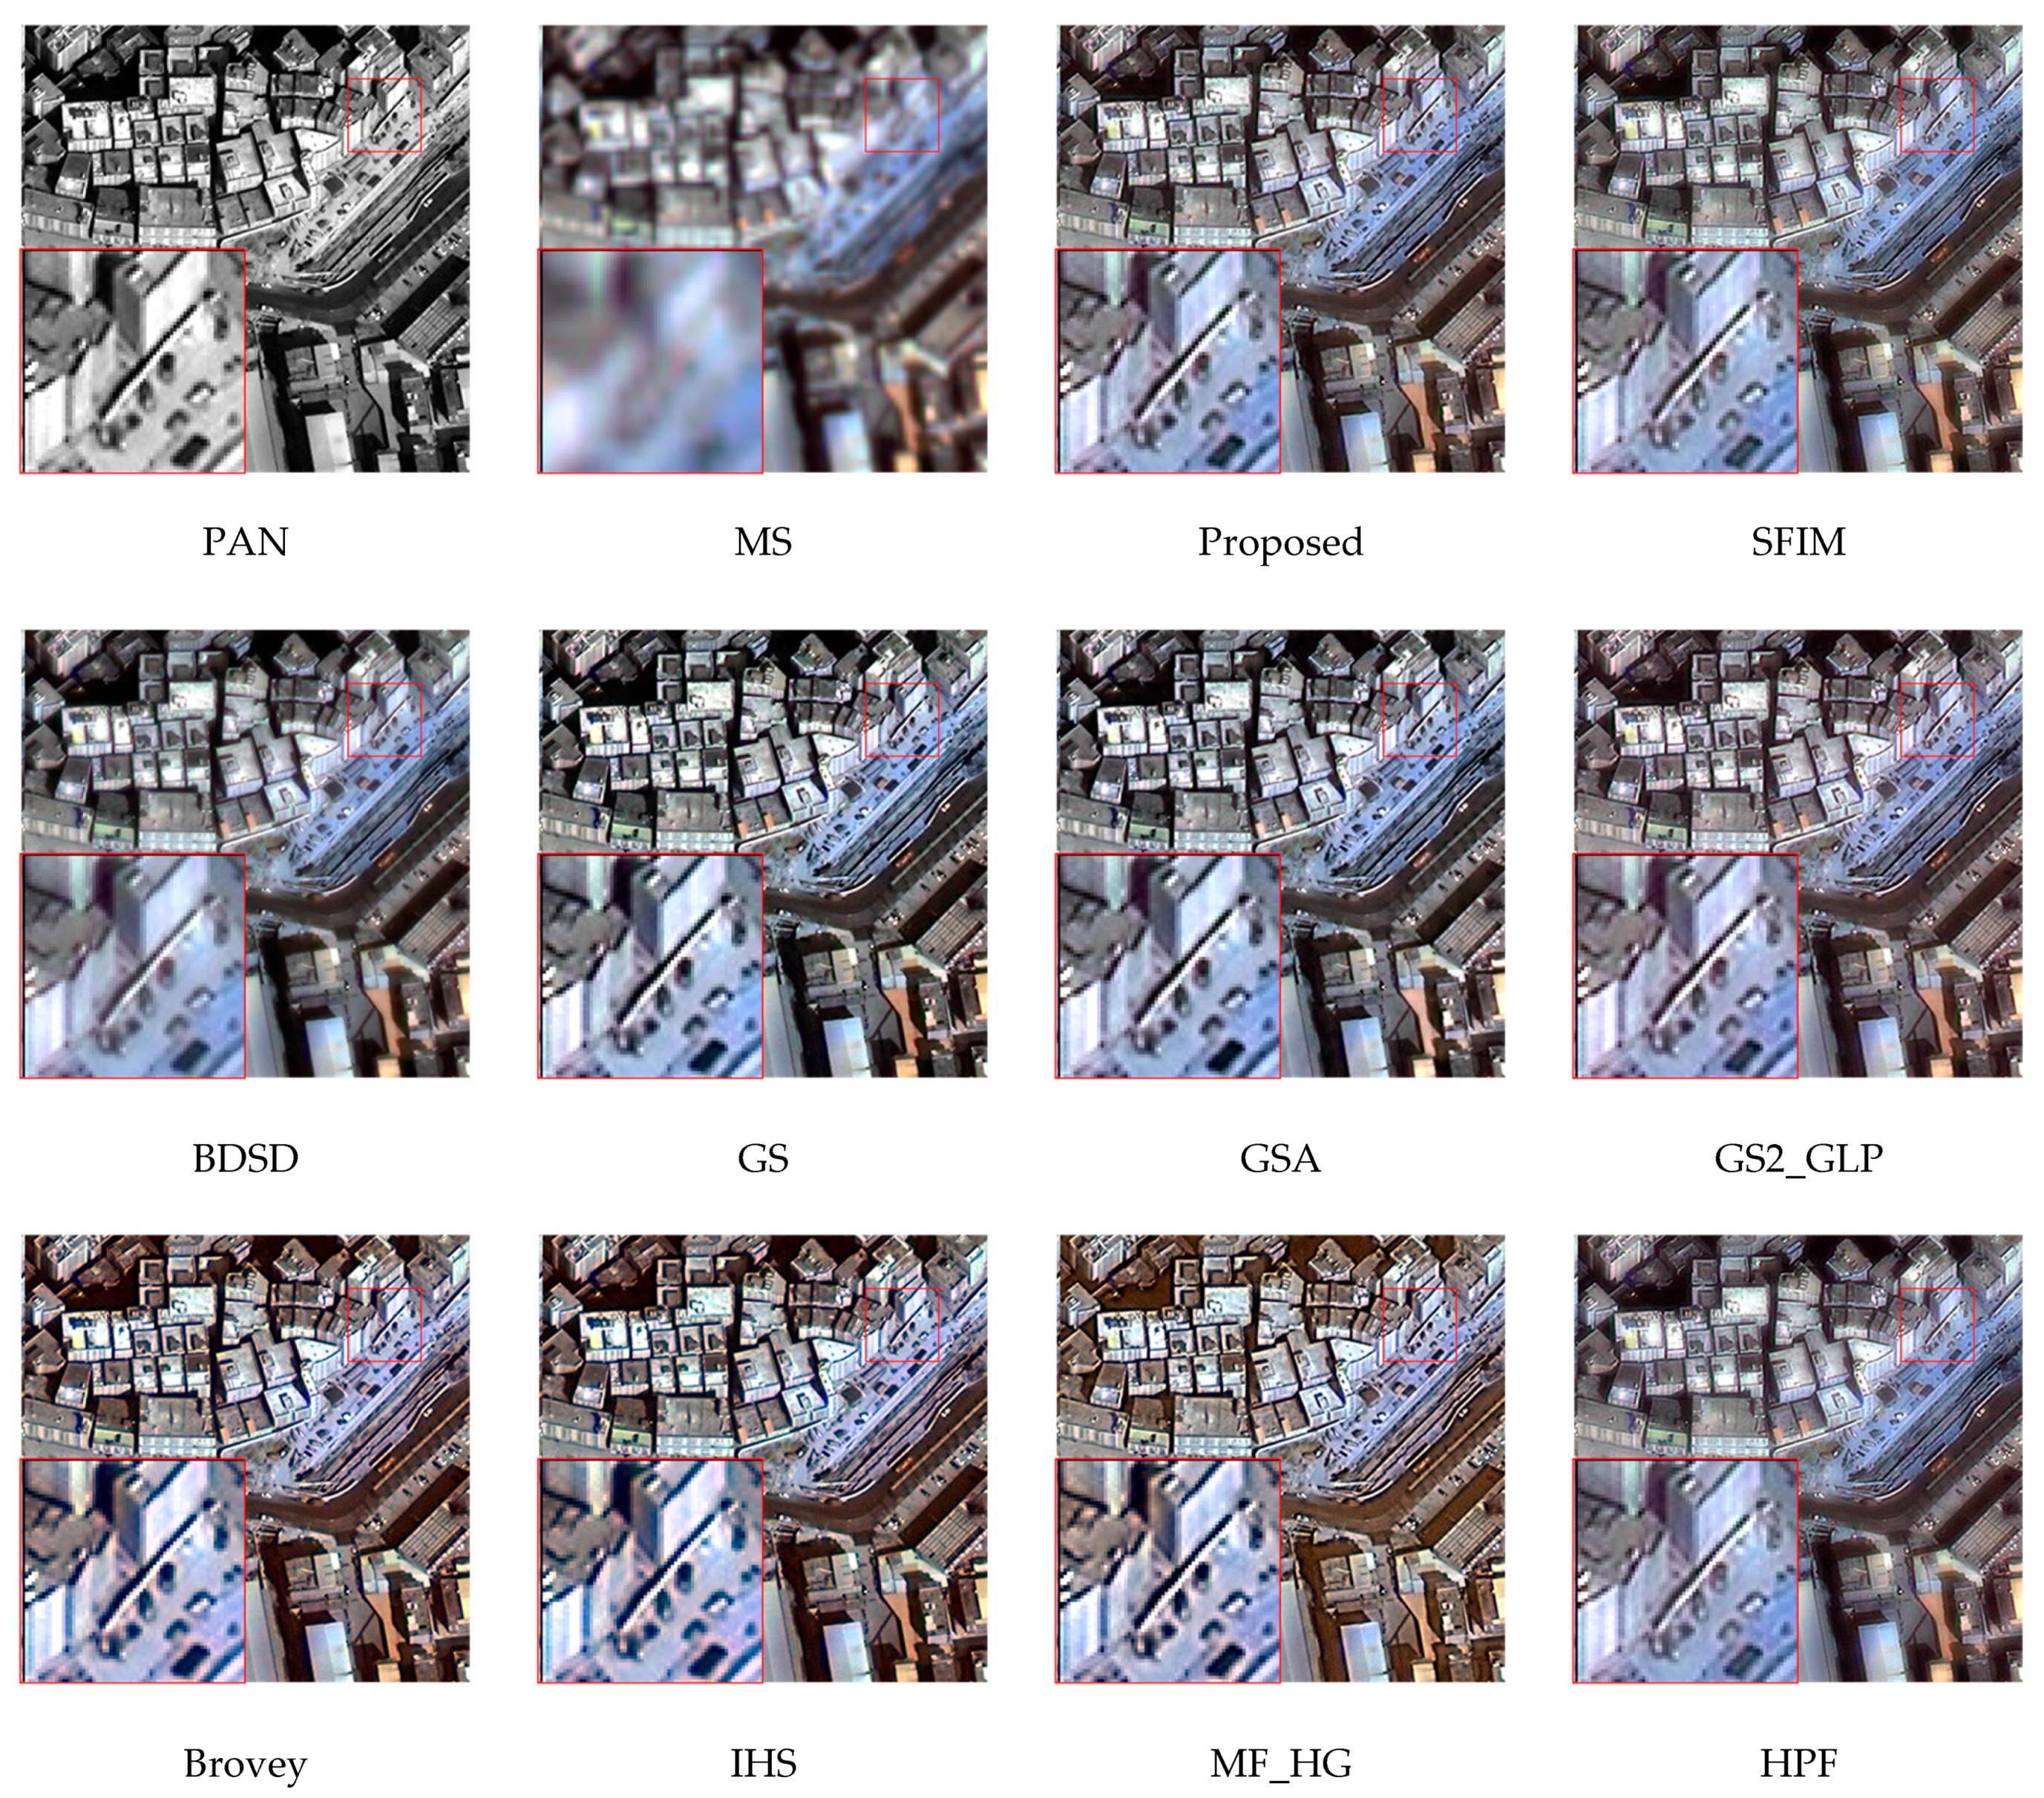
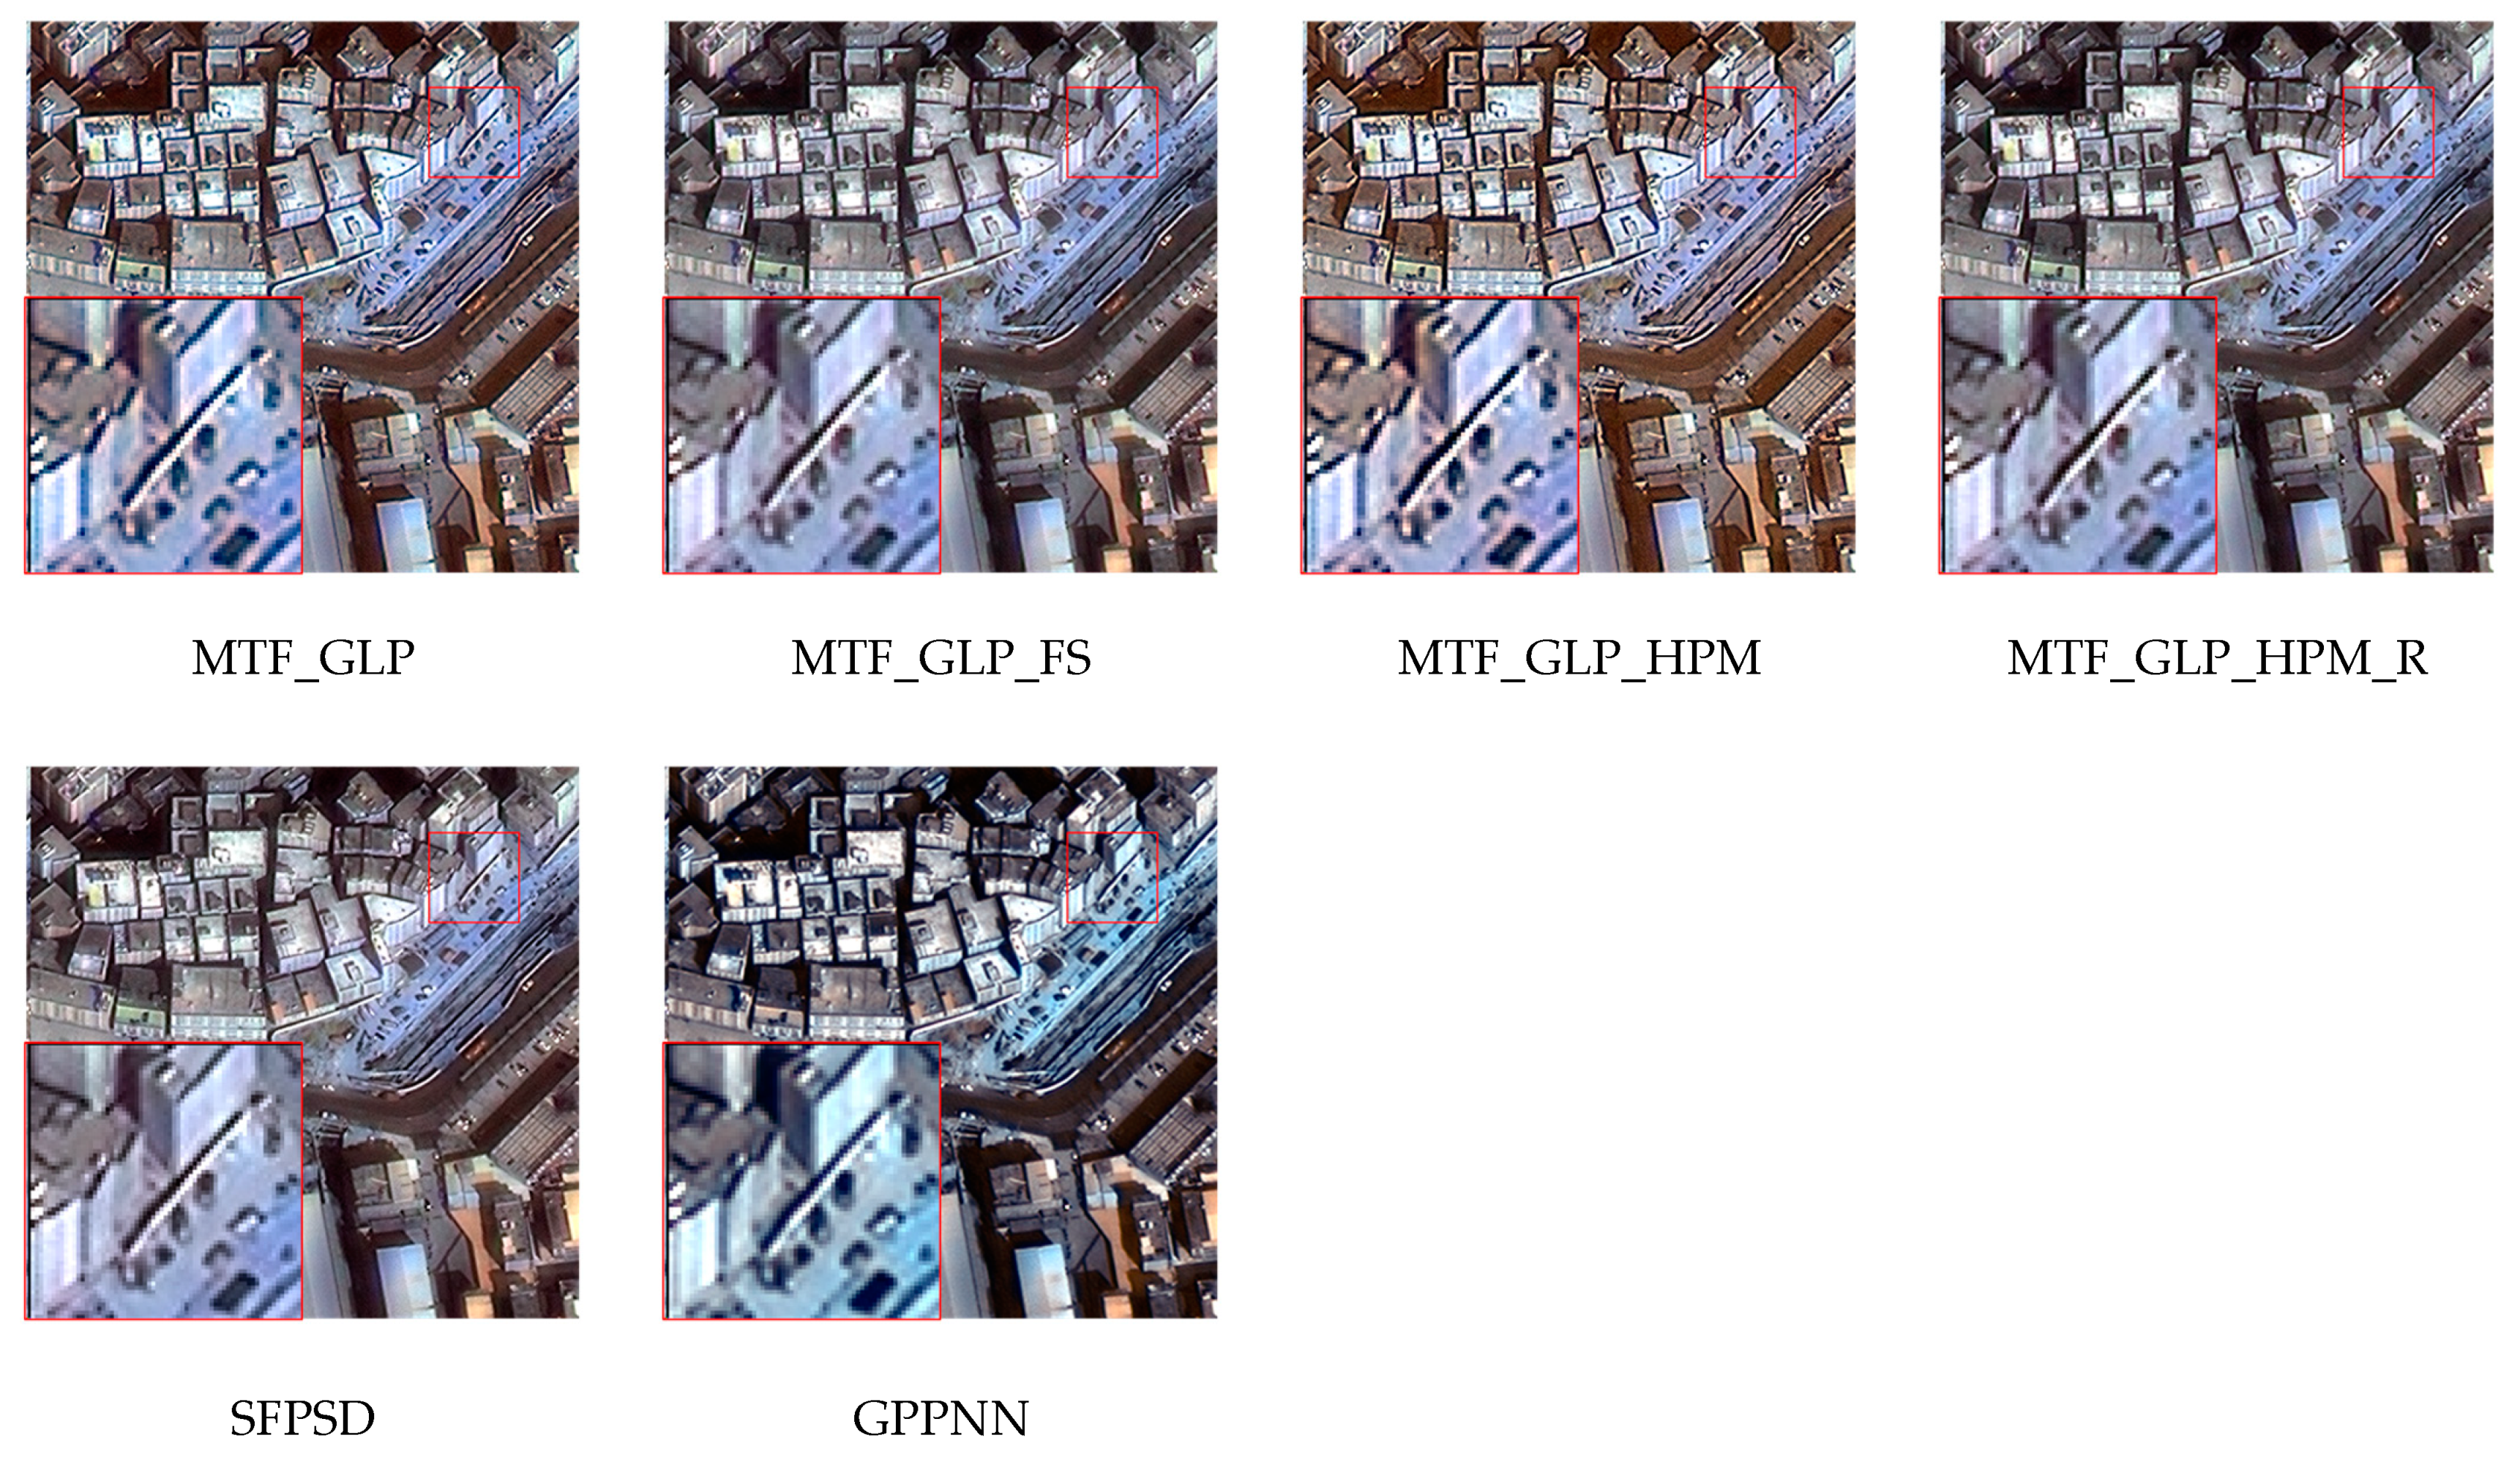
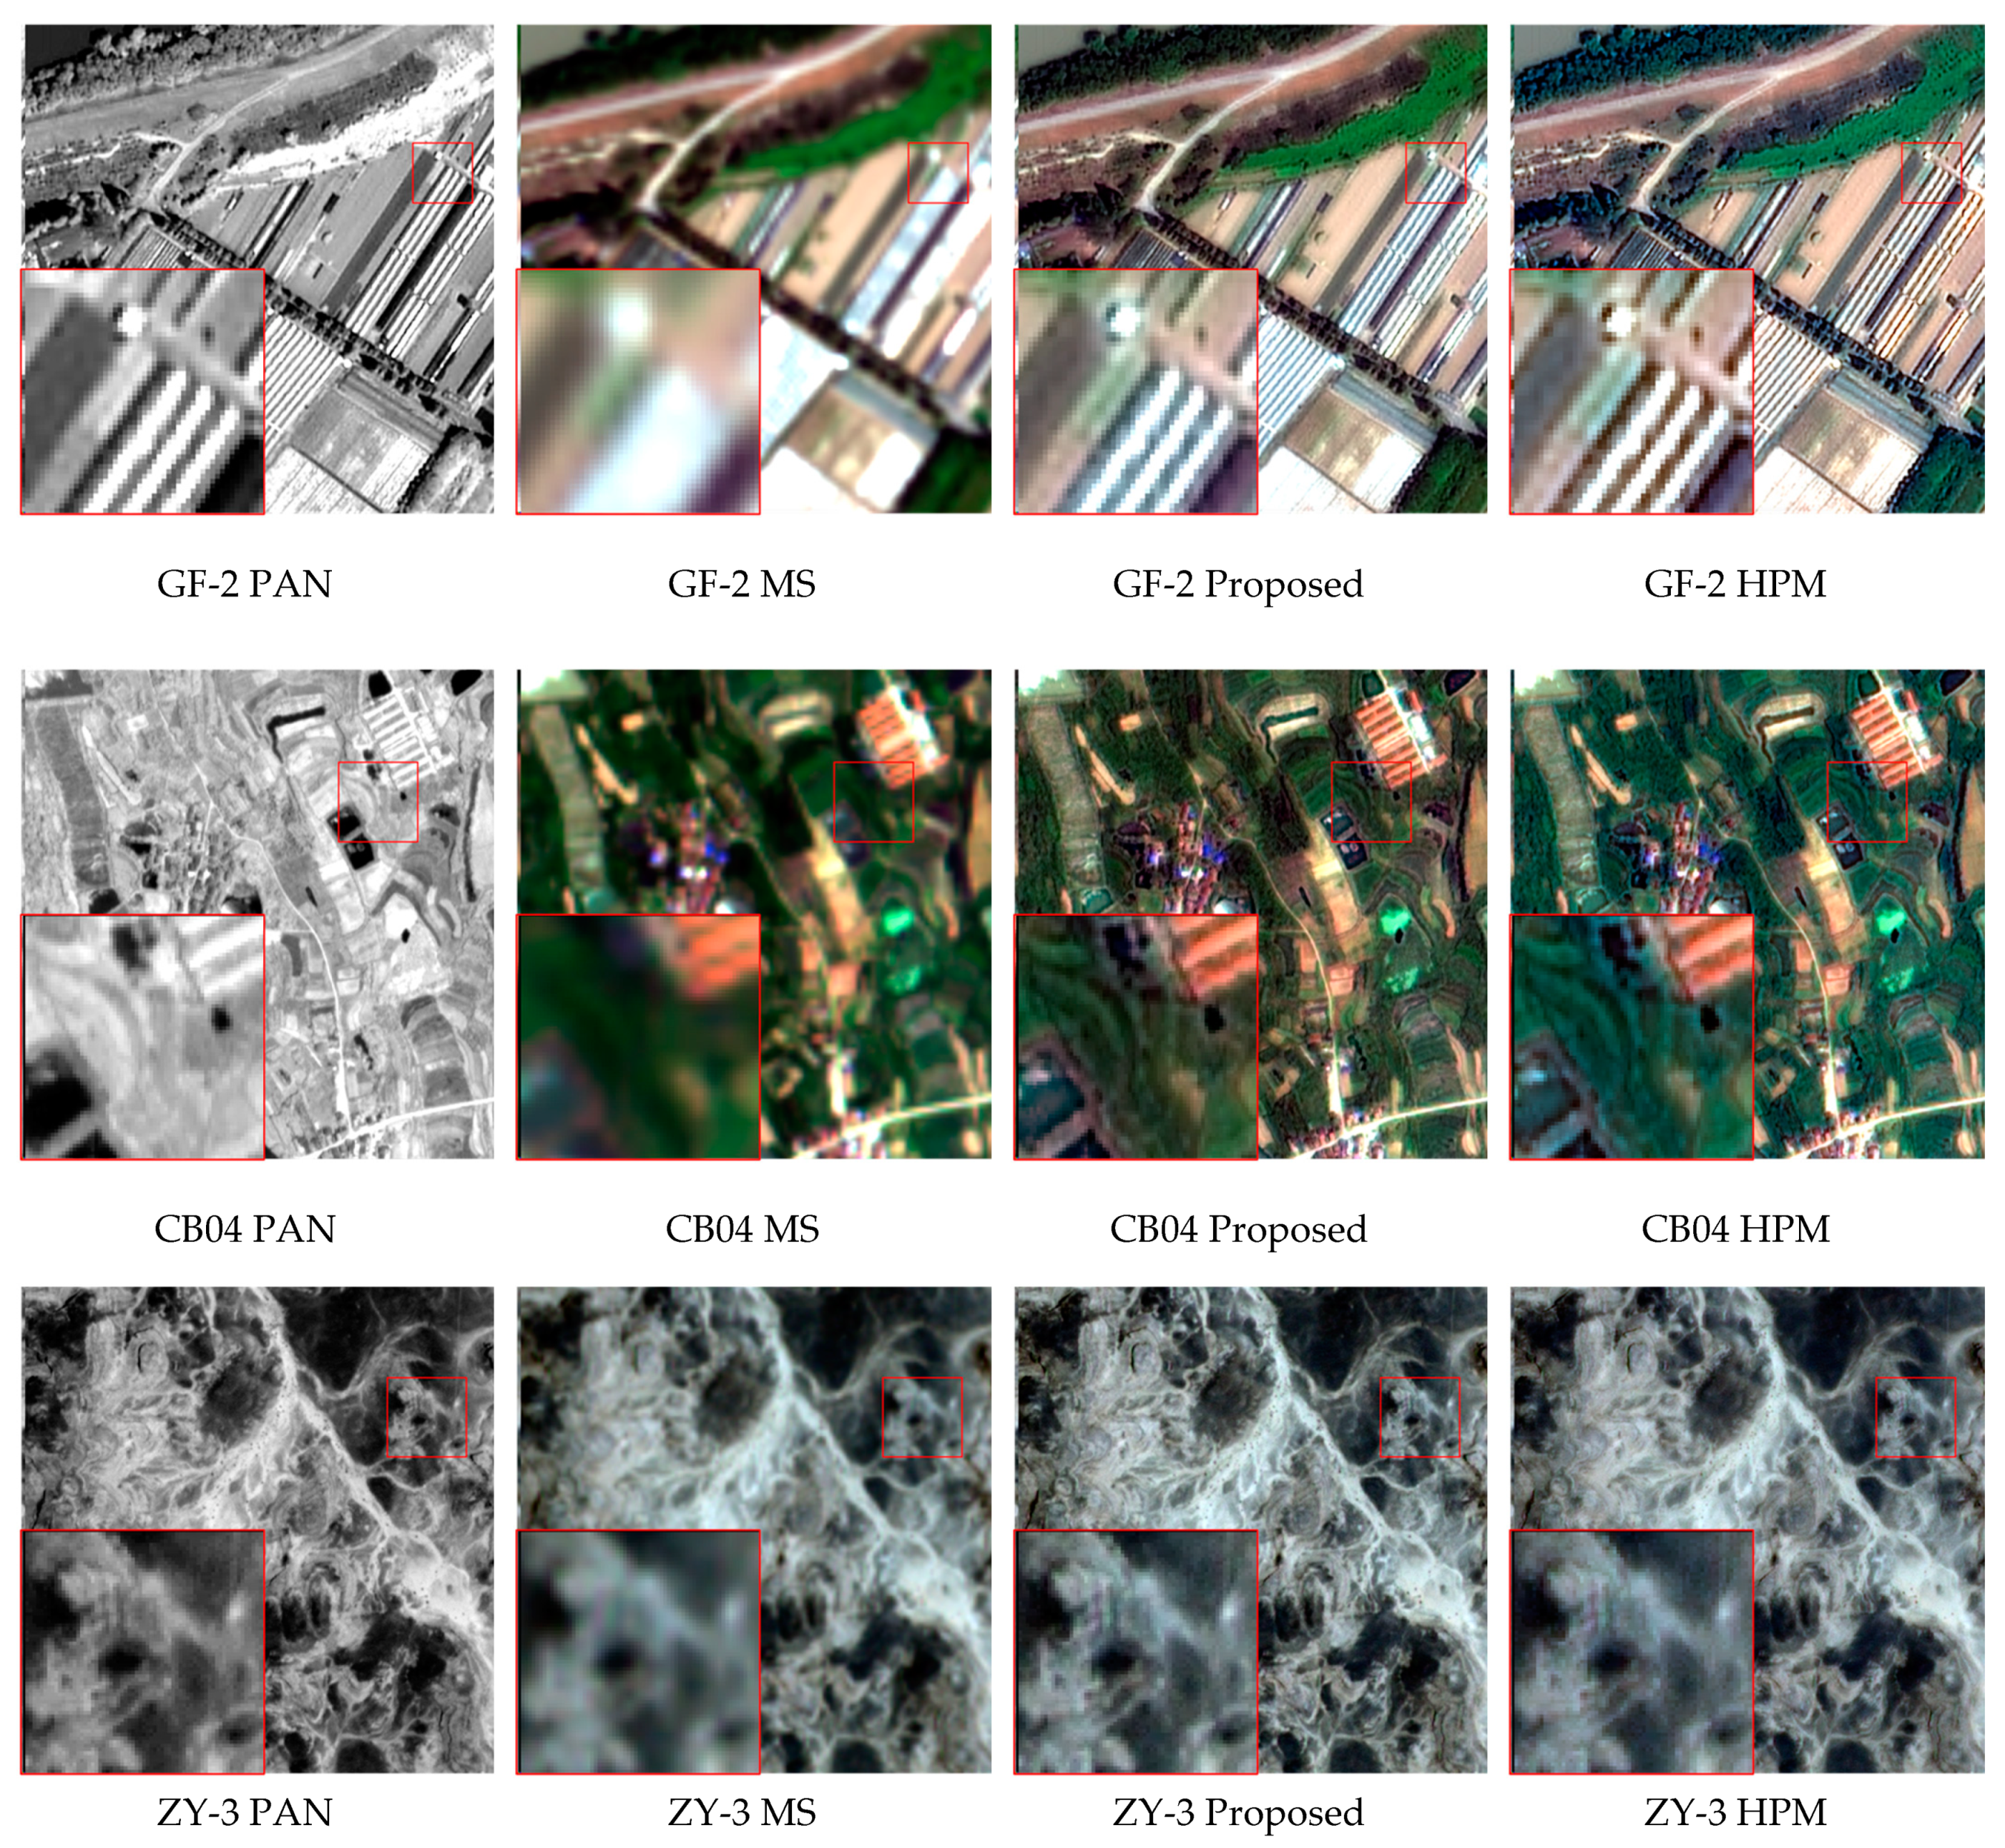
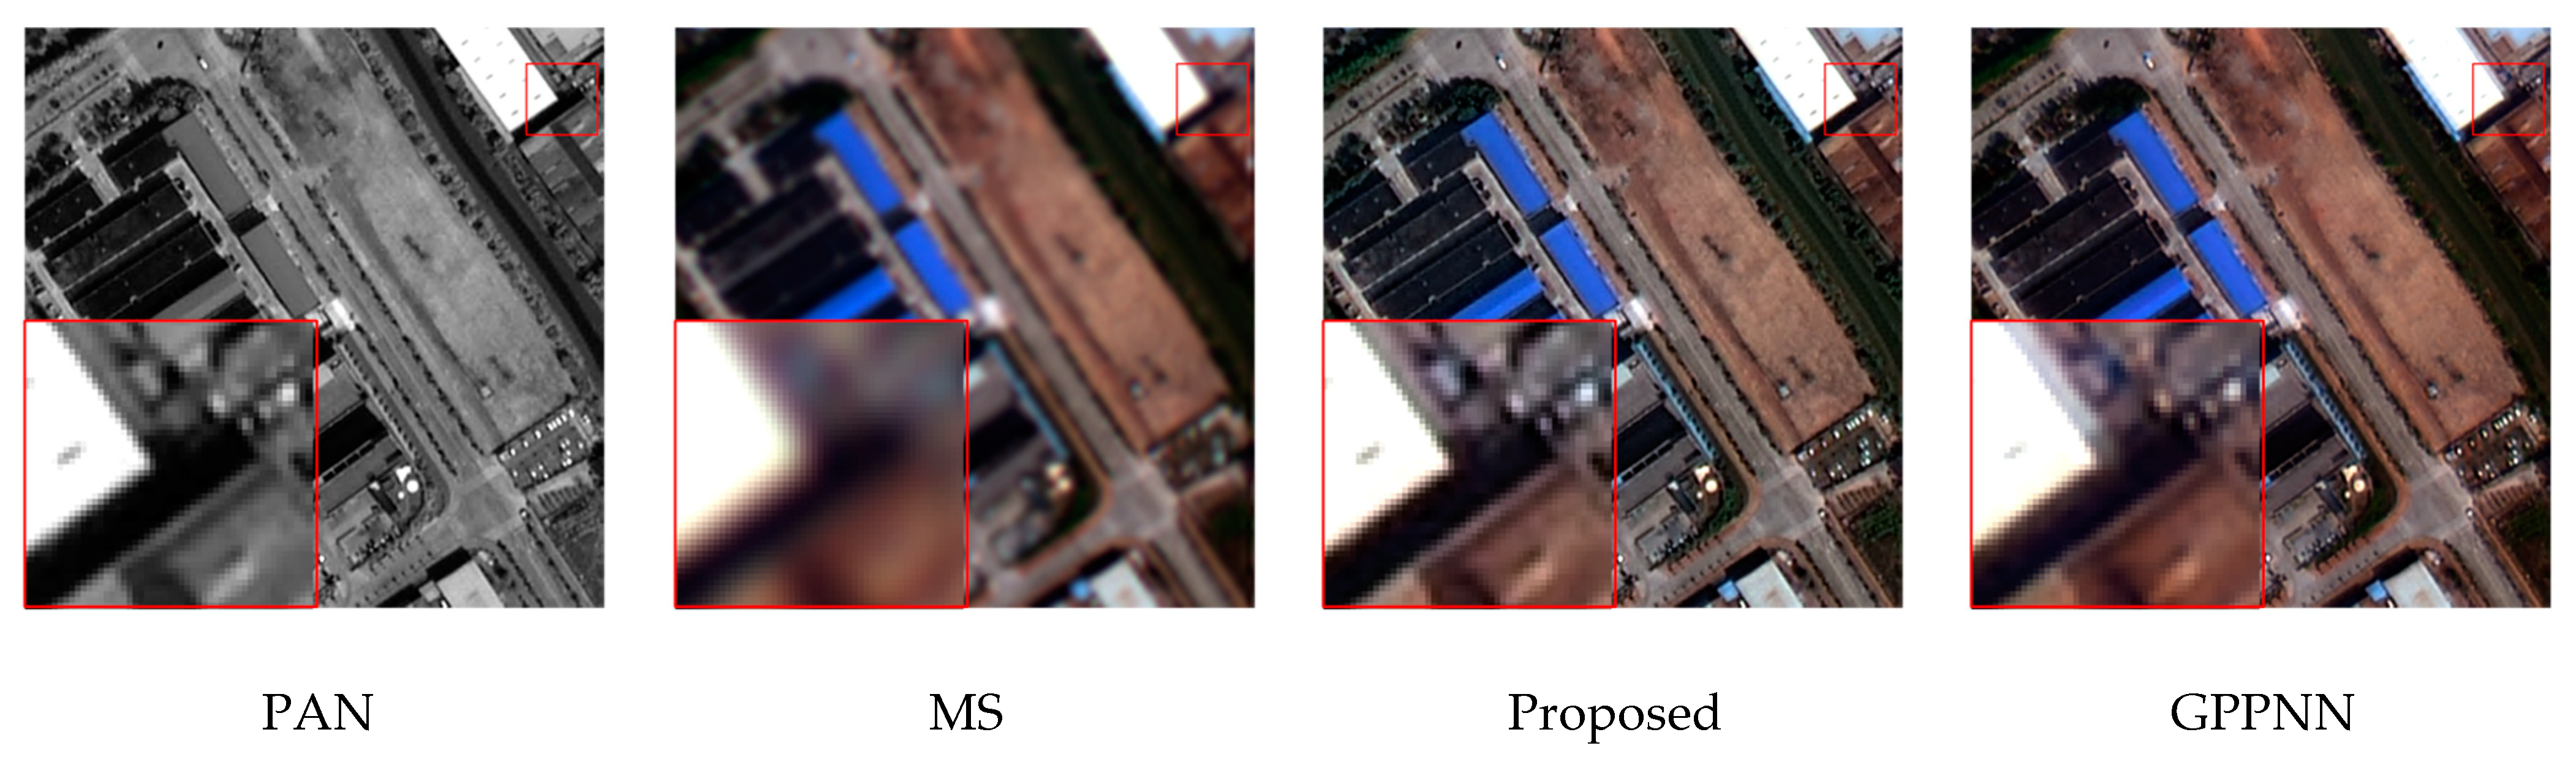
2.3. Quality Indices
To conduct an objective evaluation of the algorithm’s performance, this study has adopted a reduced-resolution assessment and a full-resolution assessment without reference. The reduced-resolution assessment includes the following four indicators: cross correlation (CC), structural similarity index measure (SSIM), spectral angle mapper (SAM) and erreur relative globale adimensionnelle de synthese (ERGAS). The full-resolution assessment without reference comprises three evaluation metrics: spectral distortion index (), spatial distortion index (), and hybrid quality with no reference (HQNR).
CC represents the spectral similarity between the computed
and fused images, with larger values indicating greater similarity between the
MS and Fused images.
CC is defined in Equation (12), where the subscript
specifies the position of the pixel. The ideal value of
CC is 1.
- (2)
Structural Similarity Index Measure
Structural similarity
[
30] is used to evaluate the degree of similarity between two images,
and
, which has strong spatial interdependence and can reflect the degree of correlation between the structural information of two images well.
is defined as follows:
where
and
are the means of
and
, respectively,
and
are the variances of
and
, respectively,
is the covariance of
and
, and
and
are constants used to maintain stability, where
L is the dynamic range of the pixel value, and by default,
and
. The ideal value of
is 1.
Spectral angle mapper (
) [
31] is a spectral measure that represents the angle between the reference vector and the processing vector of a given pixel in the spectral feature space of an image, which is defined as
where
is the inner product between the fused image and
MS at the
th pixel.
is calculated as the spectral angle between the
MS and fusion vectors of a given pixel, and smaller values of
indicate greater similarity between the multispectral and fusion vectors [
32]. The ideal value of
SAM is 0.
- (4)
Erreur Relative Globale Adimensionnelle de Synthese
The erreur relative globale adimensionnelle de synthese (
) [
33] provides a global indication of the reference distortion of the test multiband image. It is defined as
where
is the ratio between the pixel sizes of
MS and
PAN images.
is the number of digits in the band, and
is the average of the
th band of the reference.
- 2.
The full-resolution assessment without reference evaluates the quality of pansharpened images at the resolution of PAN images without relying on a single reference image. The evaluation will be performed using actual observed images.
- (1)
Spectral Distortion Index
The spectral distortion index
[
34] of the Khan protocol is defined as
is a multiband extension of the general image quality index, which is used for the quality assessment of pansharpened
MS images, first for 4 bands and later extended to
bands [
35,
36,
37]. Each pixel of an image with
N spectral bands is placed into a hypercomplex (
HC) number with one real part and
N − 1 imaginary parts.
and
denote the HC representations of the reference and test spectral vectors at pixel (c, r).
can be written as a product of three components.
The first part represents the modulus of the HC correlation coefficient between
and
, which measures the degree of linear correlation. The second and third terms measure luminance distortion and contrast distortion on all bands simultaneously, respectively [
35]. The value of
ranges from 0 to 1, and
is equal to 1 if, and only if,
.
- (2)
Spatial Distortion Index
Spatial distortion index
[
38] is defined as
where
and
and
are the intensities of
and
, respectively, which are defined as
- (3)
Hybrid Quality with no Reference
Hybrid quality with no reference (
) [
39] borrows the spatial distortion index
from QNR and the spectral distortion index
from the Khan protocol. It is defined as
where usually
.


