Abstract
This paper proposes an efficient and high-fidelity image fusion method based on adaptive smoothing filtering for panchromatic (PAN) and multispectral (MS) image fusion. The scale ratio reflects the ratio of spatial resolution between the panchromatic image and the multispectral image. When facing a multiscale fusion task, traditional methods are unable to simultaneously handle the problems of spectral resolution loss resulting from high scale ratios and the issue of reduced spatial resolution due to low scale ratios. To adapt to the fusion of panchromatic and multispectral satellite images of different scales, this paper improves the problem of the insufficient filtering of high-frequency information of remote sensing images of different scales by the classic filter-based intensity modulation (SFIM) model. It uses Gaussian convolution kernels instead of traditional mean convolution kernels and builds a Gaussian pyramid to adaptively construct convolution kernels of different scales to filter out high-frequency information of high-resolution images. It can adaptively process panchromatic multispectral images of different scales, iteratively filter the spatial information in panchromatic images, and ensure that the scale transformation is consistent with the definition of multispectral images. Using 15 common fusion methods, this paper compares the experimental results of ZY-3 with scale ratio 2.7 and SV-1 with scale ratio 4 data. The results show that the method proposed in this paper retains good spatial information for image fusion at different scales and has good spectral preservation.
1. Introduction
Due to the limitations of hardware conditions, optical remote sensing cameras cannot acquire remote sensing images with both high spatial resolution and high spectral resolution. The current mainstream satellite design uses spectral separation, where the panchromatic image primarily stores spatial information and the multispectral image primarily stores spectral information [1,2,3]. With the launch of the ZiYuan-3 (ZY-3) series of satellites equipped with panchromatic and multispectral image sensors, the resolution scale differences in panchromatic and multispectral scales of remote sensing satellites have become more abundant. Facing future on-board processing requirements, constrained by the limitations of on-board processing on the satellite and the requirements of real-time, the newly designed algorithms should be characterized by a small computational volume, not relying on external memory, and suitable for block independent processing. Furthermore, due to the constraints imposed by on-board satellite processing capabilities and the need for real-time operations, it is crucial to develop algorithms with a reduced computational workload, independent processing of data blocks, and minimal reliance on external memory [4]. For the on-board multiscale remote sensing image fusion problem, the deep learning approach has higher computational complexity and greater computational power requirements, while the traditional approach simply adds the detail information of the panchromatic image to the multispectral image without considering the difference in spatial resolution of the two images, which has lower hardware requirements and is easier to achieve real-time processing. Therefore, it is necessary to introduce a new conventional method for the fusion of panchromatic multispectral images at different scales in order to meet the needs of the constrained equipment requirements of on-board satellites as well as the increasing number of newly launched satellites with rich differences in scales.
Classical image fusion methods fall into two main categories: multi-resolution analysis (MRA) and the component substitution method (CS) [1,3,5]. CS-based methods replace the components of a multispectral image with those of a PAN image, such as principal component analysis (PCA) [6,7], Brovey transform [8,9], and Gram–Schmidt transform (GS) [10,11]. These methods typically improve spatial quality at the expense of spectral quality. MRA-based methods sharpen multispectral images using panchromatic images via multiscale decomposition. This category includes wavelet transform [12,13], smoothing filter-based intensity modulation (SFIM) [14,15], high-pass filtering (HPF) [16], morphological filtering [17], and the Laplacian pyramid [18,19]. MRA-based methods typically retain spectral information well but may not perform as well in the spatial domain [1].
In recent years, deep learning (DL)-based methods have become more and more common in image fusion and have also achieved good fusion results, such as MHF-net [20] and HyperTransformer [21]. DL can learn features hierarchically, leading to diverse feature expression, stronger judgment performance, and better generalization [22]. DL techniques for image fusion can be divided into two categories: minimizing a cost function to simulate image sharpening [23,24] and simulating image sharpening using generative adversarial networks (GANs) [25,26]. However, both methods face the challenge of not having real training data, using only simulated data for training. In real-world situations, their effects and versatility may be limited. Additionally, remote sensing image data volumes are large, and traditional methods may be more efficient than DL methods in some specific scenarios [2,27].
Given the fact that deep learning techniques necessitate substantial amounts of data for pre-training and demand significant computational resources, which are not readily available on satellites, their applicability is limited. Moreover, in the context of multisource multiscale fusion tasks, employing a single training set in deep learning models may not produce satisfactory fusion results. Consequently, this study chose to adopt the traditional method as the primary research approach. Among the existing conventional methods, most of them cause serious spectral distortion, while SFIM has been favored for its high computational efficiency and good fusion effect. However, considering the huge scale differences between the panchromatic and multispectral data from newly launched remote sensing satellites, the spatial information fusion effect of the SFIM algorithm in performing multiscale fusion is not satisfactory. When using SFIM for fusion, a single convolution kernel may not sufficiently filter out high-frequency information of remote sensing images with different scales, resulting in unsatisfactory fusion results, such as color cast and blurred distortion.
To address the multiscale difference fusion of panchromatic and multispectral images, this paper proposes a scale-adaptive iterative filtering algorithm. This method dynamically constructs a convolution kernel by constructing a pyramid to filter out the spatial information in panchromatic images by iterative filtering. The high-frequency information of the panchromatic image is extracted and injected into the multispectral image using the ratio transform to obtain the fused image. The main contributions of this paper can be summarized as follows: (1) by improving the filtering kernel of traditional SFIM, the processing effect is improved; and (2) adaptive calculations are performed for different scales of filter kernel parameters to adapt to diverse situations in real-world situations.
2. Methodology
2.1. SFIM
SFIM [14] is a high-fidelity image fusion method for processing optical remote sensing images, which can divide the image to be processed into multiple blocks for parallel computation and is suitable for data processing on satellites. The classic SFIM model is defined in Equation (1):
where is the DN value of a low-resolution image with a wavelength of , and is the DN value of a high-resolution image with a wavelength of . is the simulated high-resolution pixel corresponding to , and is the local average value of in a neighborhood, which is equivalent to the resolution of . If solar radiation is given and constant, then the surface reflectance only depends on the terrain. If two images are quantized to the same DN value range and have the same resolution, then it is assumed that [28], so that can cancel each other out. Meanwhile, because the surface reflectance of images with different resolutions does not change much, it is assumed that , so that can cancel each other out. Equation (1) is transformed into Equation (2):
For panchromatic multispectral fusion, Equation (2) is simplified as Equation (3):
In the above formula, is a multispectral image, is a panchromatic image, image is the image upsampled to the resolution size of the image, is a low-resolution panchromatic image, and is the fusion result. The ratio between and only preserves the edge details of high-resolution images while essentially eliminating spectral and contrast information.
The reason why the classic SFIM method performs poorly on the fusion of panchromatic and multispectral images of different scales is that, in the degradation process, the average convolution kernel processing or the improved Gaussian convolution kernel processing needs to provide the relevant convolution kernel in advance. In this way, different convolution kernels need to be set for different satellites. Therefore, a single convolution kernel cannot filter out the spatial information of remote sensing images of different scales well, which leads to blurring of the fused image.
2.2. Method
The aim of the method in this paper is to generate a high-quality fusion result by obtaining a low-resolution panchromatic image that is consistent with the spatial and spectral characteristics of the multispectral image. The improvement of the method in this paper focuses on obtaining a downscaled panchromatic image () that maintains both the spatial information and spectral features of the multispectral image. During the fusion process, the multispectral image and the low-resolution panchromatic image have to be resampled to maintain consistent sizes. As such, the ideal low-resolution panchromatic image, (where downsampling is denoted by the subscript ds), should possess a similar image space characteristic to the multispectral image. To achieve a similar spatial structure for the downscaled image to the MS image, a low-pass filter is necessary to eliminate some of the high-frequency information present. Gaussian filtering is selected as the tool to adjust the sharpness by controlling the kernel sharpness through parameter adjustments. Based on these improvements, this paper proposes an adaptive iterative filtering fusion method for panchromatic multispectral images of varying scales. The algorithm can be summarized in the following steps:
- Step 1. Calculate the scale ratio of the panchromatic and multispectral images to be fused;
- Step 2. Adaptively construct convolution kernels of various scales based on the scale ratio proportion;
- Step 3. Use the constructed convolution kernels to iteratively degrade the panchromatic image;
- Step 4. Upscale the multispectral and degraded panchromatic images to match the panchromatic scale;
- Step 5. Fuse the panchromatic and multispectral images using a ratio-based method.
The algorithm flow of this paper is shown in Figure 1.
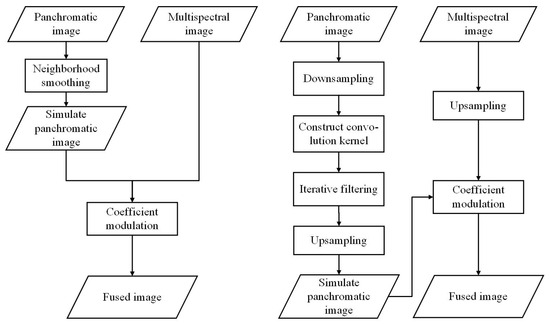
Figure 1.
Process flows comparison between SFIM and proposed algorithm.
In Step 1, the scale ratio is determined by examining whether there is geographic information on the input panchromatic and multispectral images. If geographic information is present, the overlapping range of the panchromatic and multispectral images in the geographic space is calculated. The overlapping range can then be back-calculated to obtain the pixel coordinates of the panchromatic and multispectral images, and their corresponding overlapping areas.
Here, and are the pixel coordinates of the overlapping region between the two images. corresponds to the upper left corner of the overlapping area, and corresponds to the lower right corner. Additionally, the scale ratio of the panchromatic image and the multispectral image can be expressed by the following formula:
The goal of the second step is to create convolution kernels, σ, with differing scales. To do this, we adapt the construction process from the Gaussian pyramid. By doing so, we can construct convolution kernels based on the Gaussian pyramid transformation.
The first step in the process of constructing these kernels is to calculate the number of convolution kernels, , needed based on the target scale. This value should be an integer.
Following the calculation of the integer value for the number of convolution kernels, , we can now construct the floating-point quantity, , for the convolution kernel scale.
If , this indicates that the difference between scales is exactly a power of 2. In such cases, we can easily construct a multiscale convolution kernel using a traditional Gaussian pyramid.
However, if and are not equal, this implies that the scale difference is not a power of 2. In such cases, to construct a multiscale convolution kernel, we need to add one more layer resulting in scale layers.
To represent the Gaussian convolution kernel, we use the following equation:
In the above formula, represents the coordinates of any point in the convolution kernel, while represents the coordinates of the kernel’s center point. In layer , Gaussian convolution kernels with a standard deviation of [29] are used. According to the suggestion of SIFT, achieves optimal results when performing 2-fold downsampling, so the value of 1.6 is chosen in this paper. However, if , different standard deviations must be estimated for the layer. The estimation method is as follows:
If and are equal, then the layer uses a standard deviation of . The construction method of the convolutional kernels used in the last layer is identical to that used in previous layers, which involves using Gaussian convolutional kernels.
The third step requires iterative degradation based on the number of convolutional layers being constructed and the corresponding convolutional kernels calculated in the second step. Each layer uses the corresponding convolutional kernels for convolution, and after the convolution process is complete, downsampling is performed to obtain an ideal low-resolution panchromatic image, . Based on a consideration of computational efficiency and the downsampling effect, the bilinear resampling method is adopted as the downsampling method, and the formula is shown as follows:
where , , , , and these four points are the points around the downsampling target point . In this way, it is possible to resample images when the scale is not integer.
Next, in the fourth step, the original MS and low-resolution panchromatic image, , are upsampled to the panchromatic PAN scale to obtain and . The resampling method for upsampling is based on a consideration of computational efficiency and the effect of resampling, and the same bilinear resampling model mentioned in the previous step is selected. By building a Gaussian pyramid in this way, it is possible to obtain a degraded panchromatic image of the corresponding scale.
Finally, the fifth step involves obtaining the fusion image, , using the ratio method:
This estimation method ensures a smooth transition between convolution layers with different numbers of output channels, which helps maintain the method’s overall performance.
2.3. Quality Indices
To conduct an objective evaluation of the algorithm’s performance, this study has adopted a reduced-resolution assessment and a full-resolution assessment without reference. The reduced-resolution assessment includes the following four indicators: cross correlation (CC), structural similarity index measure (SSIM), spectral angle mapper (SAM) and erreur relative globale adimensionnelle de synthese (ERGAS). The full-resolution assessment without reference comprises three evaluation metrics: spectral distortion index (), spatial distortion index (), and hybrid quality with no reference (HQNR).
- Reduced-resolution assessment: The reduced resolution evaluation synthesizes a simulated image from a reference MS image and then evaluates the performance of the method against the reference image.
- (1)
- Cross Correlation
CC represents the spectral similarity between the computed and fused images, with larger values indicating greater similarity between the MS and Fused images. CC is defined in Equation (12), where the subscript specifies the position of the pixel. The ideal value of CC is 1.
- (2)
- Structural Similarity Index Measure
Structural similarity [30] is used to evaluate the degree of similarity between two images, and , which has strong spatial interdependence and can reflect the degree of correlation between the structural information of two images well. is defined as follows:
where and are the means of and , respectively, and are the variances of and , respectively, is the covariance of and , and and are constants used to maintain stability, where L is the dynamic range of the pixel value, and by default, and . The ideal value of is 1.
- (3)
- Spectral Angle Mapper
Spectral angle mapper () [31] is a spectral measure that represents the angle between the reference vector and the processing vector of a given pixel in the spectral feature space of an image, which is defined as
where is the inner product between the fused image and MS at the th pixel. is calculated as the spectral angle between the MS and fusion vectors of a given pixel, and smaller values of indicate greater similarity between the multispectral and fusion vectors [32]. The ideal value of SAM is 0.
- (4)
- Erreur Relative Globale Adimensionnelle de Synthese
The erreur relative globale adimensionnelle de synthese () [33] provides a global indication of the reference distortion of the test multiband image. It is defined as
where is the ratio between the pixel sizes of MS and PAN images. is the number of digits in the band, and is the average of the th band of the reference.
- 2.
- The full-resolution assessment without reference evaluates the quality of pansharpened images at the resolution of PAN images without relying on a single reference image. The evaluation will be performed using actual observed images.
- (1)
- Spectral Distortion Index
The spectral distortion index [34] of the Khan protocol is defined as
is a multiband extension of the general image quality index, which is used for the quality assessment of pansharpened MS images, first for 4 bands and later extended to bands [35,36,37]. Each pixel of an image with N spectral bands is placed into a hypercomplex (HC) number with one real part and N − 1 imaginary parts.
and denote the HC representations of the reference and test spectral vectors at pixel (c, r). can be written as a product of three components.
The first part represents the modulus of the HC correlation coefficient between and , which measures the degree of linear correlation. The second and third terms measure luminance distortion and contrast distortion on all bands simultaneously, respectively [35]. The value of ranges from 0 to 1, and is equal to 1 if, and only if, .
- (2)
- Spatial Distortion Index
Spatial distortion index [38] is defined as
where and and are the intensities of and , respectively, which are defined as
- (3)
- Hybrid Quality with no Reference
Hybrid quality with no reference () [39] borrows the spatial distortion index from QNR and the spectral distortion index from the Khan protocol. It is defined as
where usually .
3. Data Introduction
The data utilized in this study is sourced from the ZiYuan-3 (ZY-3) satellite and SuperView-1 (SV-1) of the National Land Satellite Remote Sensing Application Center, which comes under the jurisdiction of the Ministry of Natural Resources in the “China High-Resolution Earth Observation System”. The chosen images have a variety of terrain features such as mountains, forests, roads, and cities. A detailed breakdown of the data usage can be found in Table 1.

Table 1.
The introduction of data.
4. Results
In this study, a reference performance test is conducted on the fused image to verify the effectiveness of the proposed algorithm. The comparison algorithm used in this paper is the MATLAB toolbox [1] with version MATLAB 2021a, and the comparison method is as follows:
- SFIM: Smoothing filter-based intensity modulation [14];
- BDSD-PC: Band-dependent spatial-detail (BDSD) model solving an optimization constrained problem [40];
- GS: Gram–Schmidt [9,10];
- GSA: Gram–Schmidt adaptive [41];
- GS2-GLP: Segmentation-based version of the Gram–Schmidt algorithm with GLP [42];
- Brovey: Brovey transform for image fusion [8,9];
- IHS: Intensity–hue–saturation transformation [43];
- MF_HG_Pansharpen: Morphological pyramid decomposition using half gradient [17];
- HPF: High-pass filtering for image fusion [16];
- MTF-GLP: Generalized Laplacian pyramid (GLP) [37] with MTF-matched filter with unitary injection model [44];
- MTF-GLP-FS: GLP with MTF-matched filter and a new full-resolution regression-based injection model [45];
- MTF-GLP-HPM: GLP with MTF-matched filter and multiplicative injection model [46];
- MTF-GLP-HPM-R: A regression-based high-pass modulation pansharpening approach [47];
- SFPSD: Smoothing filter-based panchromatic spectral decomposition (SFPSD) for MS and HS image pansharpening [15];
- GPPNN: Gradient projection-based pansharpening neural network [48].
The ZY-3 multispectral (MS) data with a spatial size of 1000 × 1000 and the panchromatic (PAN) data with a spatial size of 2700 × 2700 from the dataset in Section 3 are selected, with a scale ratio of ratio = 2.7. Image registration is preprocessed using the method described in [49], as the registration accuracy of PAN images and MS images can greatly affect the fusion effect [42,50]. The proposed algorithm is compared against the 15 common image fusion algorithms mentioned above. The traditional method experiments were conducted on an Intel i7-10700 CPU server at 2.90 GHz using MATLAB 2021a, and the comparison experiments for deep learning were implemented in Python 3.7 and Pytorch frameworks on the Ubuntu 20.04 platform with two NVIDIA GPUs GeForce GTX 3060 for training and testing (NVIDIA, Santa Clara, CA, USA). The training sets for deep learning are a self-made dataset corresponding to the image and a publicly available training set. The code for creating the dataset and publicly available training sets come from [51]. Non-deep learning methods do not require training. Only deep learning methods require training.
Figure 2 shows a magnified image of a portion of the region for all fusion methods under the ZY-3 data, where the level of spatial detail and spectral retention can be clearly seen. The red frame in the bottom left corner is an enlarged image of the small red frame in the main picture. The subsequent images in the paper follow the same format. As evidenced by Figure 2, it is apparent through visual analysis that certain methodologies, such as the BDSD, SFPSD and MTF series methods, impart desirable visual effects. On the contrary, methods such as IHS, SFIM, MF_HG and other methods have significant information loss. Also, the deep learning approach has better spatial information retention but suffers from some spectral distortions. Notably, the proposed methodology yields results that exhibit visual fidelity closest to that of the ground truth image. This method is able to preserve both spatial and spectral information, so it has an advantage over other methods.
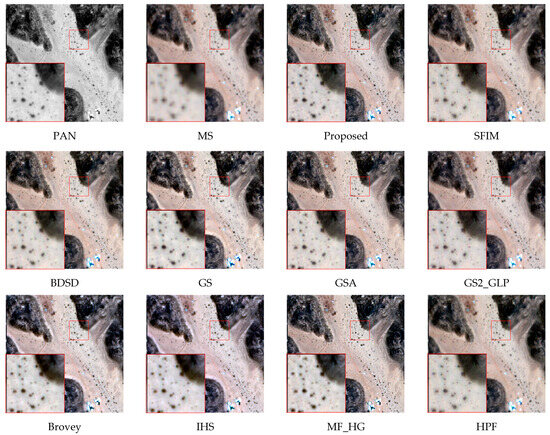
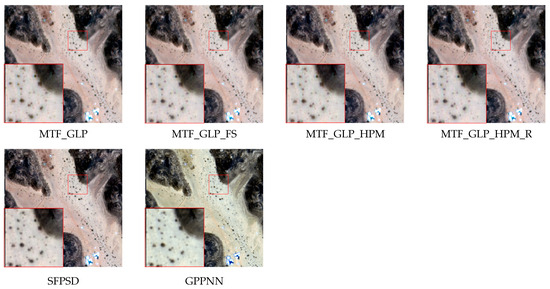
Figure 2.
Data1 of ZY-3 in ratio = 2.7 for 15 methods.
In this study, the full-resolution evaluation index without reference and the reduced-resolution evaluation index with reference were used to objectively assess the quality of the fusion results. The evaluation indices without reference are , , and HNQR, and those with reference are CC, SSIM, SAM and ERGAS, which were introduced in Section 2. The best-performing result among the evaluated algorithms is highlighted using bold format. The subsequent tables in the paper follow the same format. Table 2 presents detailed results of the evaluation indices of the different methods. The time metric in the table encompasses the entire process of reading and fusing the image.

Table 2.
The evaluation in ratio = 2.7 for ZY-3 image sharpening.
As can be seen from the Table 2, the proposed method achieves the best results in terms of HQNR among the evaluation index without reference. Meanwhile, the gap between the spectral distortion index and the spatial distortion index and the optimal results is not significant. These evaluation indicators reflect the proposed method’s effectiveness in image fusion and its ability to maintain spectral and spatial information simultaneously. The reason that the deep learning method achieves better values in the reduced-resolution evaluation but lower values in the full-resolution evaluation is that the training set of the deep learning method is trained using reduced-resolution data. At the same time, the GPPNN method mainly fuses images with a 4-fold difference between the panchromatic and multispectral scales, and the generalization ability may not be as good for the ZY-3 data with a scale ratio of 2.7-fold. For the evaluation metric of reduced resolution, the method in this paper did not achieve the best results, but the gap with the best results is not particularly significant. In addition, the method in this paper has high computational efficiency and consumes less time compared to all the above methods and is suitable for business operations.
In order to eliminate randomness, we selected data with a size space of 2700 × 2700 on other ZY-3 data for comparison experiments. Figure 3 shows the fusion results of all the compared methods. From this figure, we can see that methods such as SFPSD and MTF series have good visual results with clear feature outlines and good spectral preservation. The fusion results of GPPNN methods have better spatial results but poor spectral preservation. The method in this paper has good performance regarding both spatial information and spectral preservation and has a significant improvement compared to the SFIM method. The results of the measured fusion image evaluation indicators can be found in Table 3. From the objective metrics noted in Table 3, it can be seen that the HQNR index and the spatial distortion index of the method proposed in this paper are the highest among all the compared methods. Compared with the current mainstream PAN and MS fusion methods, this method has better results regarding both spatial and spectral information.
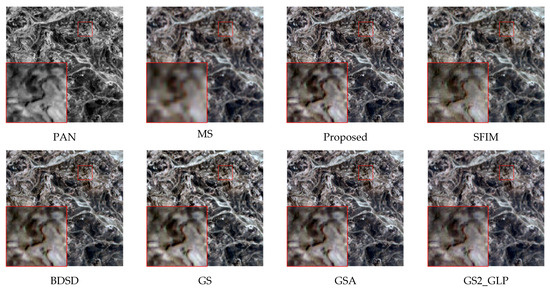
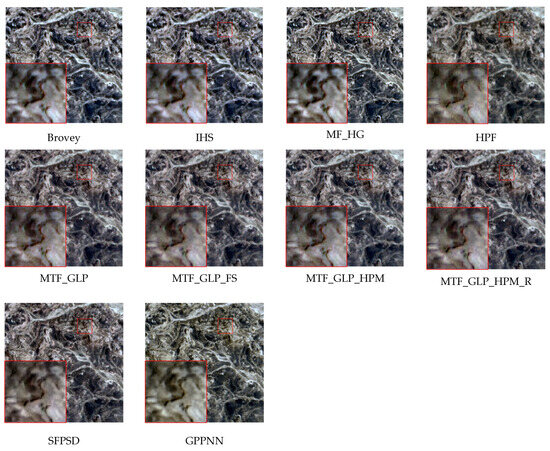
Figure 3.
Data2 of ZY-3 in ratio = 2.7 for 15 methods.

Table 3.
The evaluation in ratio = 2.7 for ZY-3 image sharpening.
The paper also conducted a set of comparative experiments under the conventional scale ratio = 4 using SV-1 data, as introduced in Section 3. Figure 4 presents a comparison of the fusion results of the different methods, pointing out the advantages and disadvantages of each method in terms of preserving spatial details and spectral fidelity. Some methods, such as Brovey, IHS, MF_HG, and MTF_GLP_HPM, lose spectral information significantly, while others, such as GS2_GLP, MTF_GLP_FS, and MTF_GLP_HPM_R, maintain good spatial details and spectral fidelity. Evidently, the proposed method preserves spatial and spectral information well compared to SFIM, and it has more spatial information. Finally, the GPPNN method has some spectral distortion, as seen in Figure 4, but still has a strong ability to characterize spatial details.
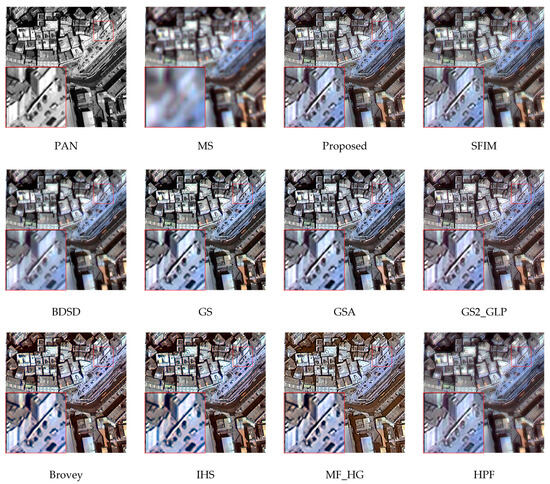
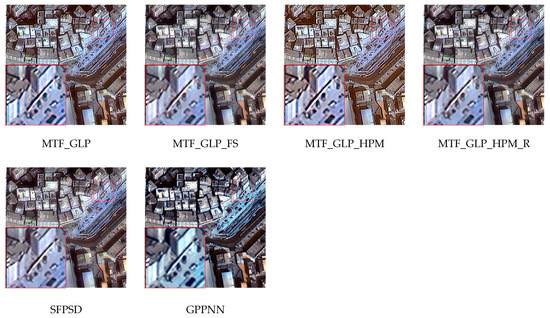
Figure 4.
SV-1 in ratio = 4 for 15 methods.
Table 4 provides detailed results of the evaluation metrics for the different methods. Although the indicators in the proposed method are not the highest, the difference between them and the best results is not significant. The difference between the fusion effect of the proposed method and some of the best fusion algorithms on SV-1 PAN and MS images is also not apparent, as can be inferred from Figure 4. Additionally, the proposed method shows a more substantial improvement in the HQNR index than the classic SFIM fused image.

Table 4.
The evaluation in ratio = 4 for SV-1 image sharpening.
In conclusion, the proposed method performs better in preserving both spatial and spectral information in multiscale panchromatic multispectral image fusion compared with the current mainstream PAN and MS fusion methods. At the same time, deep learning methods may not achieve the fusion effect of traditional methods when dealing with different source data, such as when facing highly dynamic data combinations or the fusion of heterogeneous data combinations. Therefore, the method in this paper is simple and efficient while having a better fusion effect, which is more advantageous on satellites lacking a large number of computing conditions or when facing a multiscale fusion task.
5. Discussion
The proposed method falls under the category of MRA, but it possesses certain distinguishing features in comparison to traditional fusion methods. First, it performs well, even in cases where there are significant differences in resolution. Additionally, it is highly adaptable to fusing images of various scales. The following sections will delve into these aspects in greater detail.
5.1. Effective Filtering of High-Frequency Information
An optical image can be regarded as comprising high-frequency spatial information and low-frequency spectral information [52]. High-frequency spatial information is responsible for capturing grayscale images with significant changes within them and primarily represents the details of the image. On the other end of the spectrum, low-frequency spectral information corresponds to slowly changing grayscale components present in the image and mainly represents the overall image context. This can be mathematically expressed as
In the above equation, represents the input image, represents the high-frequency component of the image, and represents the low-frequency component of the image. Additionally, for images of different spatial resolutions, two images of varying band ranges can be expressed as
In the above equation, the variable represents the high-resolution image, while represents the high-frequency component of the high-resolution image, and represents the low-frequency component of the high-resolution image. Similarly, represents the low-resolution image, with representing its low-frequency component.
Additionally, it is assumed that the low-frequency components for different resolutions of the same image are approximately the same. Therefore, the low-frequency components of the low-resolution image may be used to replace the low-frequency components of the high-resolution image to generate a fused image [1,2]. The fused image can be mathematically expressed as
Certainly, the proposed Formula (23) demonstrates that the fusion process aims to retain both high-frequency spatial details and low-frequency spectral information in the resultant image. More specifically, the high-frequency spatial details are obtained from the high-resolution image, whereas the low-frequency spectral information is extracted from the low-resolution image. This fusion approach can be viewed as a means of replacing the complementary information between the two input images, thereby allowing for improved visual quality and greater accuracy in the fused image. It is a widely accepted method in image processing and has been extensively used in research and practical applications. In order to achieve image fusion, it is necessary to separate the high-frequency component of the high-resolution image from the low-resolution image and perform corresponding processing accurately. The fused image can be obtained by “simulating” directly from the high-resolution image, since the low-resolution image is already known. However, when the high-resolution image is downsampled to the low-resolution image scale, the resulting degraded image is often accompanied by a “sawtooth” phenomenon, as shown in Figure 5b above. Traditional methods cannot always completely filter out this high-frequency information for multiscale images, resulting in blurred results during fusion.

Figure 5.
“Aliasing” and filtered images that simulate degraded images. (a) Original image; (b) Stimulated image; (c) Filtered image.
In this paper, an iterative filtering method is performed before each downsampling by establishing a Gaussian pyramid, which can effectively filter out high-frequency components in high-resolution images. As shown in Figure 5c, the “sawtooth” shape of the road in the figure is significantly improved, and high-frequency information is effectively filtered out. This is an important factor for the method in this paper to adapt to the fusion of different scales and still obtain better results.
5.2. Significant Adaptive Fusion Effect
The HPM (high-pass modulation) framework [53,54] is a widely known technique that extracts high-frequency information from PAN images and introduces it to MS images. In this framework, the high-frequency components of the PAN image are first filtered out, and subsequently, the high-frequency information is extracted and injected into the low-resolution image using the ratio of the original PAN image and the filtered PAN images. This process is expressed by the following formula:
In the formula above, represents the sharpened image, represents the PAN image, stands for the pre-filtered and downsampled PAN image on the MS scale, M represents the MS image, and the ↑ symbol indicates upsampling.
A comparison between the above formula and the formula used in the HPM framework reveals that the main difference between our approach and the HPM framework lies in where the ratio operation is applied, whether on the PAN scale or the MS scale. In this study, we assume that all redundant high-frequency information in the PAN image is filtered out and downsampled and that the downsampled PAN image possesses the same spatial information as the MS image. At this point, the differences between the two images are mainly in their spectral information, which can be decomposed without altering the spatial information by utilizing the ratio method.
To validate the efficacy of the method described in this paper, and to compare it with the HPM framework, data from various satellites were selected for a no-reference full-resolution evaluation. From Figure 6, it can be seen that the visual effect of image fusion obtained using our method is better than that obtained by the HPM method. As shown in Table 5, the HQNR achieved by our method surpasses that of the HPM framework, with better spatial resolution and spectral quality. Our method outperforms the HPM architecture, with more substantial advantages observable in images containing richer spatial details, where spatial details are preserved to a greater extent. Examples include the 4-fold scale difference GF-2 and CB04 and the 2.7-fold scale difference ZY-3 data presented in Table 5, which showcase urban and mountainous scenes with a high degree of spatial complexity and detail. The HQNR index obtained using our method in these cases is significantly higher than that of the HPM method.
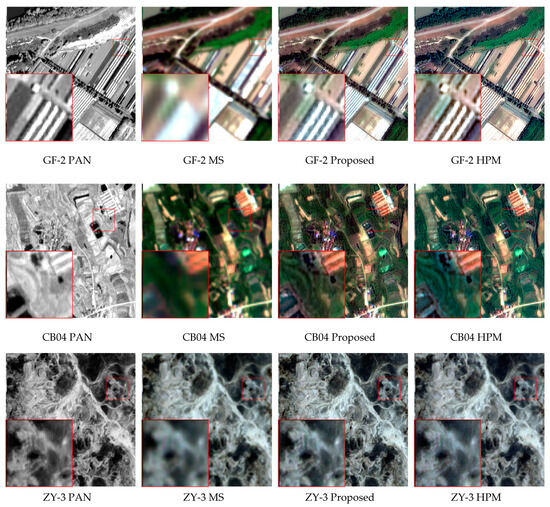
Figure 6.
Comparison with HPM under different satellite data.

Table 5.
Comparison between HPM framework and the proposed method.
5.3. Embedded Device Performance Testing
In order to verify the ability of the algorithms in this paper to run on-board, this paper uses an embedded device, Jeston AGX Orin, which is the latest AI embedded development board at the edge of NVIDIA for testing. The NVIDIA Jeston series has been successfully applied to satellite on-board processing. For example, Luo Jia-3 carries Jeston TX2 to realize on-board processing. The specific performance and power consumption of the Jeston AGX Orin is shown in Table 6 below:

Table 6.
The introduction of Jeston AGX Orin.
EDP represents no power consumption limit. In this paper, we use the method in Zhang’s article [4] for the on-board ROI (Region of Interest) preprocessing of the data, where the ROI is 4000 pixel for the panchromatic color, and then the panchromatic and multispectral data are acquired in memory for fusion processing, respectively. This process is repeated three times, and the fusion time is averaged. The times are shown in Table 7 below:

Table 7.
Fusion time consumption.
As shown in Table 7, when processing ROI of 4000 × 4000 size in Orin, it can basically reach the seconds level processing level. Especially when there is no power limit, it can achieve a processing time of about one second, which has the potential for practical on-board processing applications.
In order to verify the difference between the processing results of embedded arm devices and those of x86 devices, this article conducted relevant comparisons. As shown in Figure 7 below, Figure 7a shows the processing results for x86 devices, Figure 7b shows the processing results for embedded arm devices, and Figure 7c shows the difference between the two. From these, it can be clearly seen that the processing results of different platform devices are completely consistent, and there is no error, which also shows the reliability of the algorithm in this paper.
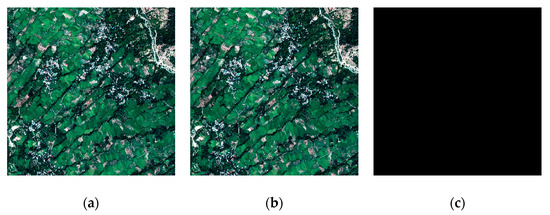
Figure 7.
Comparison between x86 devices and embedded devices. (a) Fused image for x86 devices; (b) fusion result for embedded arm devices; (c) difference between the two.
5.4. Effectiveness on Public Datasets
In order to validate the effectiveness of the method proposed in this paper on a publicly available dataset, this paper chooses to use images from the GF-2 satellite as the dataset, which is taken from [51]. This dataset contains a wealth of information about ground objects such as city roads, geographic buildings, parked vehicles and rivers and bridges. The experimental metric chosen is the full-resolution assessment without reference.
Figure 8, Figure 9, Figure 10, Figure 11 and Figure 12 show the fusion results of this paper’s method and GPPNN for five different scenarios. It is clear from the figure that both methods perform well on the GF-2 dataset, with significant improvements regarding spatial details while maintaining good spectral quality. In order to compare the advantages and disadvantages of the method proposed in this paper and GPPNN in more detail, this paper enlarges some details in the figures. It can be seen from Figure 8 that the GPPNN method has lost some information, and the overall look is blurrier than proposed method. It can be seen from Figure 9 that the GPPNN method is not clear enough for the trees on both sides of the road, showing a dark area. By contrast, the details such as the road outline is clearer in the proposed method. As can be seen from Figure 10 and Figure 11, the vegetation area of the image fused by the GPPNN method is blurred, and the fused image obtained by the proposed method is clearer and more detailed in terms of features. In Figure 12, the proposed method in this paper is also blatantly clearer but slightly worse than the GPPNN method in terms of spectrum preservation.

Figure 8.
Comparison of the first scenario of experimental results.

Figure 9.
Comparison of the second scenario of experimental results.

Figure 10.
Comparison of the third scenario of experimental results.

Figure 11.
Comparison of the fourth scenario of experimental results.

Figure 12.
Comparison of the fifth scenario of experimental results.
Table 8 shows the comparison of experimental results for each scenario. The HQNR and achieved by the proposed method used on the GF-2 dataset are higher than the GPPNN, but the Dλ is lower than the GPPNN. This means the proposed method is better regarding spatial information retention, and the GPPNN method is better regarding spectral retention. Overall, the proposed method has a better comprehensive performance, since it performs better in HQNR in these scenarios.

Table 8.
Comparison between GPPNN and the proposed method.
6. Conclusions
With the successive launches and rapid development of new satellites, the scale differences between panchromatic and multispectral images is becoming richer and richer. Traditional fusion strategies are difficult to adapt to a large amount of data from new satellites, resulting in more significant spectral distortion or the loss of spatial information during fusion. At the same time, the purpose of our research is to explore the on-board processing of future satellites under limited environmental conditions, to be able to perform fast and efficient multiscale fusion, which we expect to be applicable to the dynamic on-board real-time fusion of heterogeneous data from different satellites based on embedded devices. Algorithm efficiency and applicability are the primary factors considered in this work. For different scale remote sensing image fusions, this paper proposes a standard adaptive fusion method. This method is widely applicable and computationally efficient. It not only performs well in fusing multispectral images with a scale difference of 4 times, but also outperforms other methods in fusing panchromatic and multispectral images with a scale difference of 2.7 times. Also, according to the experimental results of the performance, the proposed method performs well on embedded devices, so it is more suitable for the future requirements of on-board real-time fusion processing with multi-source data.
The proposed method constructs convolution kernels adaptively based on the scale of images. By constructing a Gaussian pyramid, an optimal degraded panchromatic image is obtained for high spatial and spectral resolution image fusion. This study reports a full-resolution assessment without reference. The results show that, compared with the other 15 methods, the methods proposed in this article have achieved good results in subjective and objective assessments. For ZY-3 images, the proposed method outperforms other traditional methods with an HQNR index of 0.9589 in the no-reference full-resolution evaluation. Moreover, this method is capable of fusing panchromatic and multispectral images of different scales while achieving satisfactory results in sharpening multispectral images from various Chinese satellites. Finally, the method proposed in this paper is computationally efficient, and the algorithm will be more advantageous regarding future applications of dynamic onboard real-time fusion of heterogeneous data from different satellites based on embedded devices.
Author Contributions
Conceptualization, G.X., J.X. and Z.Z.; methodology, G.X., J.X. and Z.Z.; software, G.X., J.X. and X.W.; validation, L.W. and Z.Z.; writing—original draft preparation, G.X. and J.X.; writing—review and editing, G.X. and Z.Z. All authors have read and agreed to the published version of the manuscript.
Funding
This research was funded by the National Natural Science Foundation of China (62301214, 61901307), the National Key R&D Program of China (2022YFB3902800), and the Scientific Research Foundation for Doctoral Program of Hubei University of Technology (XJ2022005901).
Data Availability Statement
The GF-2, CB04 and ZY-3 data used in this article were purchased and the author has not been allowed to disclose them.
Acknowledgments
The authors would like to thank the anonymous reviewers and members of the editorial team for their comments and suggestions.
Conflicts of Interest
Author Xinhui Wang was employed by the company Beijing North-Star Technology Development Co., Ltd. The remaining authors declare that the research was conducted in the absence of any commercial or financial relationships that could be construed as a potential conflict of interest. The funders had no role in the design of the study; in the collection, analyses, or interpretation of data; in the writing of the manuscript; or in the decision to publish the results.
References
- Vivone, G.; Mura, M.D.; Garzelli, A.; Restaino, R.; Scarpa, G.; Ulfarsson, M.O.; Alparone, L.; Chanussot, J. A New Benchmark Based on Recent Advances in Multispectral Pansharpening. IEEE Geosci. Remote Sens. Mag. 2021, 9, 53–81. [Google Scholar] [CrossRef]
- Javan, F.D.; Samadzadegan, F.; Mehravar, S.; Toosi, A.; Khatami, R.; Stein, A. A review of image fusion techniques for pan-sharpening of high-resolution satellite imagery. ISPRS J. Photogramm. Remote Sens. 2021, 171, 101–117. [Google Scholar] [CrossRef]
- Ghassemian, H. A review of remote sensing image fusion methods. Inf. Fusion 2016, 32, 75–89. [Google Scholar] [CrossRef]
- Zhang, Z.; Wei, L.; Xiang, S.; Xie, G.; Liu, C.; Xu, M. Task-driven on-Board Real-Time Panchromatic Multispectral Fusion Processing Approach for High-Resolution Optical Remote Sensing Satellite. IEEE J. Sel. Top. Appl. Earth Obs. Remote Sens. 2023, 16, 7636–7661. [Google Scholar] [CrossRef]
- Vivone, G.; Alparone, L.; Chanussot, J.; Mura, M.D.; Garzelli, A.; Licciardi, G.; Restaino, R.; Wald, L. A critical comparison of pansharpening algorithms. In Proceedings of the IEEE Geoscience and Remote Sensing Symposium, Quebec City, QC, Canada, 13–18 July 2014; pp. 191–194. [Google Scholar]
- Chavez, P., Jr.; Kwarteng, A. Extracting spectral contrast in Landsat Thematic Mapper image data using selective principal component analysis. Photogramm. Eng. Remote Sens. 1989, 55, 339–348. [Google Scholar]
- Shettigara, V.K. A generalized component substitution technique for spatial enhancement of multispectral images using a higher resolution data set. Photogramm. Eng. Remote Sens. 1992, 58, 561–567. [Google Scholar]
- Gillespie, A.R.; Kahle, A.B.; Walker, R.E. Color enhancement of highly correlated images. II. Channel ratio and “chromaticity” transformation techniques. Remote Sens. Environ. 1987, 22, 343–365. [Google Scholar] [CrossRef]
- Lu, H.; Qiao, D.; Li, Y.; Wu, S.; Deng, L. Fusion of China ZY-1 02D Hyperspectral Data and Multispectral Data: Which Methods Should Be Used? Remote Sens. 2021, 13, 2354. [Google Scholar] [CrossRef]
- Aiazzi, B. Enhanced Gram-Schmidt Spectral Sharpening Based on Multivariate Regression of MS and Pan Data. In Proceedings of the 2006 IEEE International Symposium on Geoscience and Remote Sensing, Denver, CO, USA, 31 July–4 August 2006; pp. 3806–3809. [Google Scholar]
- Zhang, K.; Zhang, F.; Feng, Z.; Sun, J.; Wu, Q. Fusion of Panchromatic and Multispectral Images Using Multiscale Convolution Sparse Decomposition. IEEE J. Sel. Top. Appl. Earth Obs. Remote Sens. 2021, 14, 426–439. [Google Scholar] [CrossRef]
- Khan, M.M.; Chanussot, J.; Condat, L.; Montanvert, A. Indusion: Fusion of Multispectral and Panchromatic Images Using the Induction Scaling Technique. IEEE Geosci. Remote Sens. Lett. 2008, 5, 98–102. [Google Scholar] [CrossRef]
- He, X.; Zhou, C.; Zhang, J.; Yuan, X. Using Wavelet Transforms to Fuse Nighttime Light Data and POI Big Data to Extract Urban Built-Up Areas. Remote Sens. 2020, 12, 3887. [Google Scholar] [CrossRef]
- Liu, J.G. Smoothing Filter-based Intensity Modulation: A spectral preserve image fusion technique for improving spatial details. Int. J. Remote Sens. 2000, 21, 3461–3472. [Google Scholar] [CrossRef]
- Wang, M.; Xie, G.; Zhang, Z.; Wang, Y.; Xiang, S.; Pi, Y. Smoothing Filter-Based Panchromatic Spectral Decomposition for Multispectral and Hyperspectral Image Pansharpening. IEEE J. Sel. Top. Appl. Earth Obs. Remote Sens. 2022, 15, 3612–3625. [Google Scholar] [CrossRef]
- Chavez, P.S.; Sides, S.C.; Anderson, J.A. Comparison of three different methods to merge multiresolution and multispectral data: Landsat TM and SPOT panchromatic. Photogramm. Eng. Remote Sens. 1991, 57, 295–303. [Google Scholar]
- Restaino, R.; Vivone, G.; Dalla Mura, M.; Chanussot, J. Fusion of Multispectral and Panchromatic Images Based on Morphological Operators. IEEE Trans. Image Process. 2016, 25, 2882–2895. [Google Scholar] [CrossRef] [PubMed]
- Wilson, T.A.; Rogers, S.K.; Kabrisky, M. Perceptual-based image fusion for hyperspectral data. IEEE Trans. Geosci. Remote Sens. 1997, 35, 1007–1017. [Google Scholar] [CrossRef]
- Alparone, L.; Cappellini, V.; Mortelli, L.; Aiazzi, B.; Baronti, S.; Carlà, R. A pyramid-based approach to multisensor image data fusion with preservation of spectral signatures. In Proceedings of the 17th EARSeL Symposium on Future Trends in Remote Sensing, Lyngby, Denmark, 17–19 June 1997; pp. 419–426. [Google Scholar]
- Xie, Q.; Zhou, M.; Zhao, Q.; Meng, D.; Zuo, W.; Xu, Z. Multispectral and Hyperspectral Image Fusion by MS/HS Fusion Net. In Proceedings of the 2019 IEEE/CVF Conference on Computer Vision and Pattern Recognition (CVPR), Long Beach, CA, USA, 15–20 June 2019; pp. 1585–1594. [Google Scholar]
- Bandara, W.G.C.; Patel, V.M. HyperTransformer: A Textural and Spectral Feature Fusion Transformer for Pansharpening. In Proceedings of the 2022 IEEE/CVF Conference on Computer Vision and Pattern Recognition (CVPR), New Orleans, LA, USA, 18–24 June 2022; pp. 1757–1767. [Google Scholar]
- Sun, K.; Zhang, J.; Liu, J.; Xu, S.; Cao, X.; Fei, R. Modified Dynamic Routing Convolutional Neural Network for Pan-Sharpening. Remote Sens. 2023, 15, 2869. [Google Scholar] [CrossRef]
- He, L.; Zhu, J.; Li, J.; Meng, D.; Chanussot, J.; Plaza, A. Spectral-Fidelity Convolutional Neural Networks for Hyperspectral Pansharpening. IEEE J. Sel. Top. Appl. Earth Obs. Remote Sens. 2020, 13, 5898–5914. [Google Scholar] [CrossRef]
- Liu, L.; Wang, J.; Zhang, E.; Li, B.; Zhu, X.; Zhang, Y.; Peng, J. Shallow–Deep Convolutional Network and Spectral-Discrimination-Based Detail Injection for Multispectral Imagery Pan-Sharpening. IEEE J. Sel. Top. Appl. Earth Obs. Remote Sens. 2020, 13, 1772–1783. [Google Scholar] [CrossRef]
- Yang, D.; Zheng, Y.; Xu, W.; Sun, P.; Zhu, D. LPGAN: A LBP-Based Proportional Input Generative Adversarial Network for Image Fusion. Remote Sens. 2023, 15, 2440. [Google Scholar] [CrossRef]
- Ma, J.; Yu, W.; Chen, C.; Liang, P.; Guo, X.; Jiang, J. Pan-GAN: An unsupervised pan-sharpening method for remote sensing image fusion. Inf. Fusion 2020, 62, 110–120. [Google Scholar] [CrossRef]
- Xing, Y.; Yang, S.; Feng, Z.; Jiao, L. Dual-Collaborative Fusion Model for Multispectral and Panchromatic Image Fusion. IEEE Trans. Geosci. Remote Sens. 2022, 60, 1–15. [Google Scholar] [CrossRef]
- Guo, L.J.; Moore, J.M.; Haigh, J.D. Simulated reflectance technique for ATM image enhancement. Int. J. Remote Sens. 1997, 18, 243–254. [Google Scholar] [CrossRef]
- Lowe, D.G. Distinctive Image Features from Scale-Invariant Keypoints. Int. J. Comput. Vis. 2004, 60, 91–110. [Google Scholar] [CrossRef]
- Wang, Z.; Bovik, A.C.; Sheikh, H.R.; Simoncelli, E.P. Image quality assessment: From error visibility to structural similarity. IEEE Trans. Image Process. 2004, 13, 600–612. [Google Scholar] [CrossRef]
- Yuhas, R.H.; Goetz AF, H.; Boardman, J.W. Discrimination among semi-arid landscape endmembers using the Spectral Angle Mapper (SAM) algorithm. In Proceedings of the Summaries of the Third Annual JPL Airborne Geoscience Workshop, AVIRIS Workshop, Pasadena, CA, USA, 1 June 1992; Volume 1. [Google Scholar]
- Lau, W.; King, B.; Vohora, V. Comparison of image data fusion techniques using entropy and INI. In Proceedings of the 22nd Asian Conference on Remote Sensing, Singapore, 5–9 November 2001. [Google Scholar]
- Wald, L. Data Fusion. Definitions and Architectures—Fusion of Images of Different Spatial Resolutions; Ecole des Mines de Paris: Paris, France, 2002. [Google Scholar]
- Khan, M.M.; Alparone, L.; Chanussot, J. Pansharpening Quality Assessment Using the Modulation Transfer Functions of Instruments. IEEE Trans. Geosci. Remote Sens. 2009, 47, 3880–3891. [Google Scholar] [CrossRef]
- Wang, Z.; Bovik, A.C. A universal image quality index. IEEE Signal Process. Lett. 2002, 9, 81–84. [Google Scholar] [CrossRef]
- Alparone, L.; Baronti, S.; Garzelli, A.; Nencini, F. A global quality measurement of pan-sharpened multispectral imagery. IEEE Geosci. Remote Sens. Lett. 2004, 1, 313–317. [Google Scholar] [CrossRef]
- Garzelli, A.; Nencini, F. Hypercomplex Quality Assessment of Multi/Hyperspectral Images. IEEE Geosci. Remote Sens. Lett. 2009, 6, 662–665. [Google Scholar] [CrossRef]
- Alparone, L.; Aiazzi, B.; Baronti, S.; Garzelli, A.; Nencini, F.; Selva, M. Multispectral and panchromatic data fusion assessment without reference. Photogramm. Eng. Remote Sens. 2008, 74, 193–200. [Google Scholar] [CrossRef]
- Aiazzi, B.; Alparone, L.; Baronti, S. Full-scale assessment of pansharpening methods and data products. Image Signal Process. Remote Sens. XX 2014, 9244, 924402. [Google Scholar]
- Vivone, G. Robust Band-Dependent Spatial-Detail Approaches for Panchromatic Sharpening. IEEE Trans. Geosci. Remote Sens. 2019, 57, 6421–6433. [Google Scholar] [CrossRef]
- Aiazzi, B.; Baronti, S.; Selva, M. Improving Component Substitution Pansharpening Through Multivariate Regression of MS +Pan Data. IEEE Trans. Geosci. Remote Sens. 2007, 45, 3230–3239. [Google Scholar] [CrossRef]
- Aiazzi, B.; Alparone, L.; Baronti, S.; Garzelli, A.; Selva, M. MTF-tailored Multiscale Fusion of High-resolution MS and Pan Imagery. Photogramm. Eng. Remote Sens. 2006, 72, 591–596. [Google Scholar]
- Carper, W.J. The use of intensity-hue-saturation transformations for merging SPOT panchromatic and multispectral image data. Photogramm. Eng. Remote Sens. 1990, 56, 457–467. [Google Scholar]
- Restaino, R.; Mura, M.D.; Vivone, G.; Chanussot, J. Context-Adaptive Pansharpening Based on Image Segmentation. IEEE Trans. Geosci. Remote Sens. 2017, 55, 753–766. [Google Scholar] [CrossRef]
- Vivone, G.; Restaino, R.; Chanussot, J. Full Scale Regression-Based Injection Coefficients for Panchromatic Sharpening. IEEE Trans. Image Process. 2018, 27, 3418–3431. [Google Scholar] [CrossRef]
- Aiazzi, B.; Alparone, L.; Baronti, S.; Garzelli, A.; Selva, M. An MTF-based spectral distortion minimizing model for pan-sharpening of very high resolution multispectral images of urban areas. In Proceedings of the 2003 2nd GRSS/ISPRS Joint Workshop on Remote Sensing and Data Fusion over Urban Areas, Berlin, Germany, 22–23 May 2003; pp. 90–94. [Google Scholar]
- Vivone, G.; Restaino, R.; Chanussot, J. A Regression-Based High-Pass Modulation Pansharpening Approach. IEEE Trans. Geosci. Remote Sens. 2018, 56, 984–996. [Google Scholar] [CrossRef]
- Xu, S.; Zhang, J.; Zhao, Z.; Sun, K.; Liu, J.; Zhang, C. Deep Gradient Projection Networks for Pan-sharpening. In Proceedings of the 2021 IEEE/CVF Conference on Computer Vision and Pattern Recognition (CVPR), Nashville, TN, USA, 20–25 June 2021; pp. 1366–1375. [Google Scholar]
- Xie, G.; Wang, M.; Zhang, Z.; Xiang, S.; He, L. Near Real-Time Automatic Sub-Pixel Registration of Panchromatic and Multispectral Images for Pan-Sharpening. Remote Sens. 2021, 13, 3674. [Google Scholar] [CrossRef]
- Yang, S.; Zhang, K.; Wang, M. Learning Low-Rank Decomposition for Pan-Sharpening with Spatial-Spectral Offsets. IEEE Trans. Neural Netw. Learn. Syst. 2018, 29, 3647–3657. [Google Scholar] [PubMed]
- Deng, L.-J.; Vivone, G.; Paoletti, M.E.; Scarpa, G.; He, J.; Zhang, Y.; Chanussot, J. Machine Learning in Pansharpening: A benchmark, from shallow to deep networks. IEEE Geosci. Remote Sens. Mag. 2022, 10, 279–315. [Google Scholar] [CrossRef]
- Masters, B.R.; Gonzalez, R.C.; Woods, R.E. Digital image processing. J. Biomed. Opt. 2009, 14, 029901. [Google Scholar]
- Lee, J.; Lee, C. Fast and Efficient Panchromatic Sharpening. IEEE Trans. Geosci. Remote Sens. 2010, 48, 155–163. [Google Scholar]
- Vivone, G.; Restaino, R.; Dalla Mura, M.; Licciardi, G.; Chanussot, J. Contrast and Error-Based Fusion Schemes for Multispectral Image Pansharpening. IEEE Geosci. Remote Sens. Lett. 2014, 11, 930–934. [Google Scholar] [CrossRef]
Disclaimer/Publisher’s Note: The statements, opinions and data contained in all publications are solely those of the individual author(s) and contributor(s) and not of MDPI and/or the editor(s). MDPI and/or the editor(s) disclaim responsibility for any injury to people or property resulting from any ideas, methods, instructions or products referred to in the content. |
© 2023 by the authors. Licensee MDPI, Basel, Switzerland. This article is an open access article distributed under the terms and conditions of the Creative Commons Attribution (CC BY) license (https://creativecommons.org/licenses/by/4.0/).