Technical Note

Three-Dimensional Resistivity and Chargeability Tomography with Expanding Gradient and Pole–Dipole Arrays in a Polymetallic Mine, China

1
School of Geophysics and Information Technology, China University of Geosciences, Beijing 100083, China
2
China Aero Geophysical Survey and Remote Sensing Center for Natural Resources, Beijing 100083, China
3
National Engineering Research Center of Offshore Oil and Gas Exploration, Beijing 100028, China
4
Development and Research Center, China Geology Survey, Beijing 100037, China
5
Institute of Geophysical and Geochemical Exploration, Chinese Academy of Geological Sciences, Langfang 065000, China
*
Author to whom correspondence should be addressed.
Remote Sens. 2024, 16(1), 186; https://doi.org/10.3390/rs16010186
Submission received: 1 November 2023 / Revised: 17 December 2023 / Accepted: 26 December 2023 / Published: 1 January 2024
(This article belongs to the Topic Green Mining)

Abstract

:
Three-dimensional resistivity/chargeability tomography based on distributed data acquisition technology is likely to provide abundant information for mineral exploration. To realize true 3D tomography, establishing transmitter sources with different injection directions and collecting vector signals at receiver points is necessary. We implemented 3D resistivity/ chargeability tomography to search for new ore bodies in the deep and peripheral areas of Huaniushan, China. A distributed data acquisition system was used to form a vector receiver array in the survey area. First, by using the expanding gradient array composed of 11 pairs of transmitter electrodes, we quickly obtained the 3D distributions of the resistivity and chargeability of the whole area. Based on the electrical structure and geological setting, a NE-striking potential area for mineral exploration was determined. Next, a pole–dipole array was employed to depict the locations and shapes of the potential ore bodies in detail. The results showed that the inversion data for the two arrays corresponded well with the known geological setting and that the ore veins controlled by boreholes were located in the low-resistivity and high-chargeability zone. These results provided data for future mineral evaluation. Further research showed that true 3D tomography has obvious advantages over quasi-3D tomography. The expanding gradient array, characterized by a good signal strength and field efficiency, was suitable for the target determination in the early exploration stage. The pole–dipole array with high spatial resolution can be used for detailed investigations. Choosing a reasonable data acquisition scheme is helpful to improve the spatial resolution and economic efficiency.

1. Introduction

Direct current (DC) resistivity and induced polarization (IP) methods have been increasingly used in mineral exploration [1,2,3,4], hydrocarbon surveys [5,6], engineering investigations [7,8] and hydrogeophysical prospecting [9,10]. The resistivity and chargeability parameters, which reflect the resistive and capacitive characteristics of subsurface media, respectively, can be obtained by observing the time-domain responses of the Earth to the injected current signals. Compared with the DC resistivity method, the IP method is especially effective at mapping sulfide minerals [11,12]. With the increasing demand for mineral resources, exploration directions are developing towards complex geological and topographic conditions. Greater demands are being placed on data acquisition and interpretation technology as the exploration environments are more challenging.
In traditional two-dimensional (2D) data acquisition, the transmitter electrodes and receiver electrodes lie along the same line. This method has been successfully applied in relatively simple geological settings [13,14]. However, in areas with complex geological settings, such as complex changes in electrical parameters and target shapes caused by folds or magma intrusions, the information obtained by 2D data acquisition technology is insufficient [15]. Interpreting the real three-dimensional (3D) electrical structure is difficult and can result in drawing the wrong conclusions when using these data for interpretation in 2D inversion algorithms [16]. In addition, due to the non-uniform arrangement of particle pores and fractures in the rock, electrical anisotropy is possible [17]. The currents flowing through an anisotropic body deviate from the original injection direction, which leads to interpretation deviation for the observational data [18]. With the development of instruments and 3D inversion technology [19,20,21], the DC/IP method has developed from 2D profile acquisition to 3D acquisition.
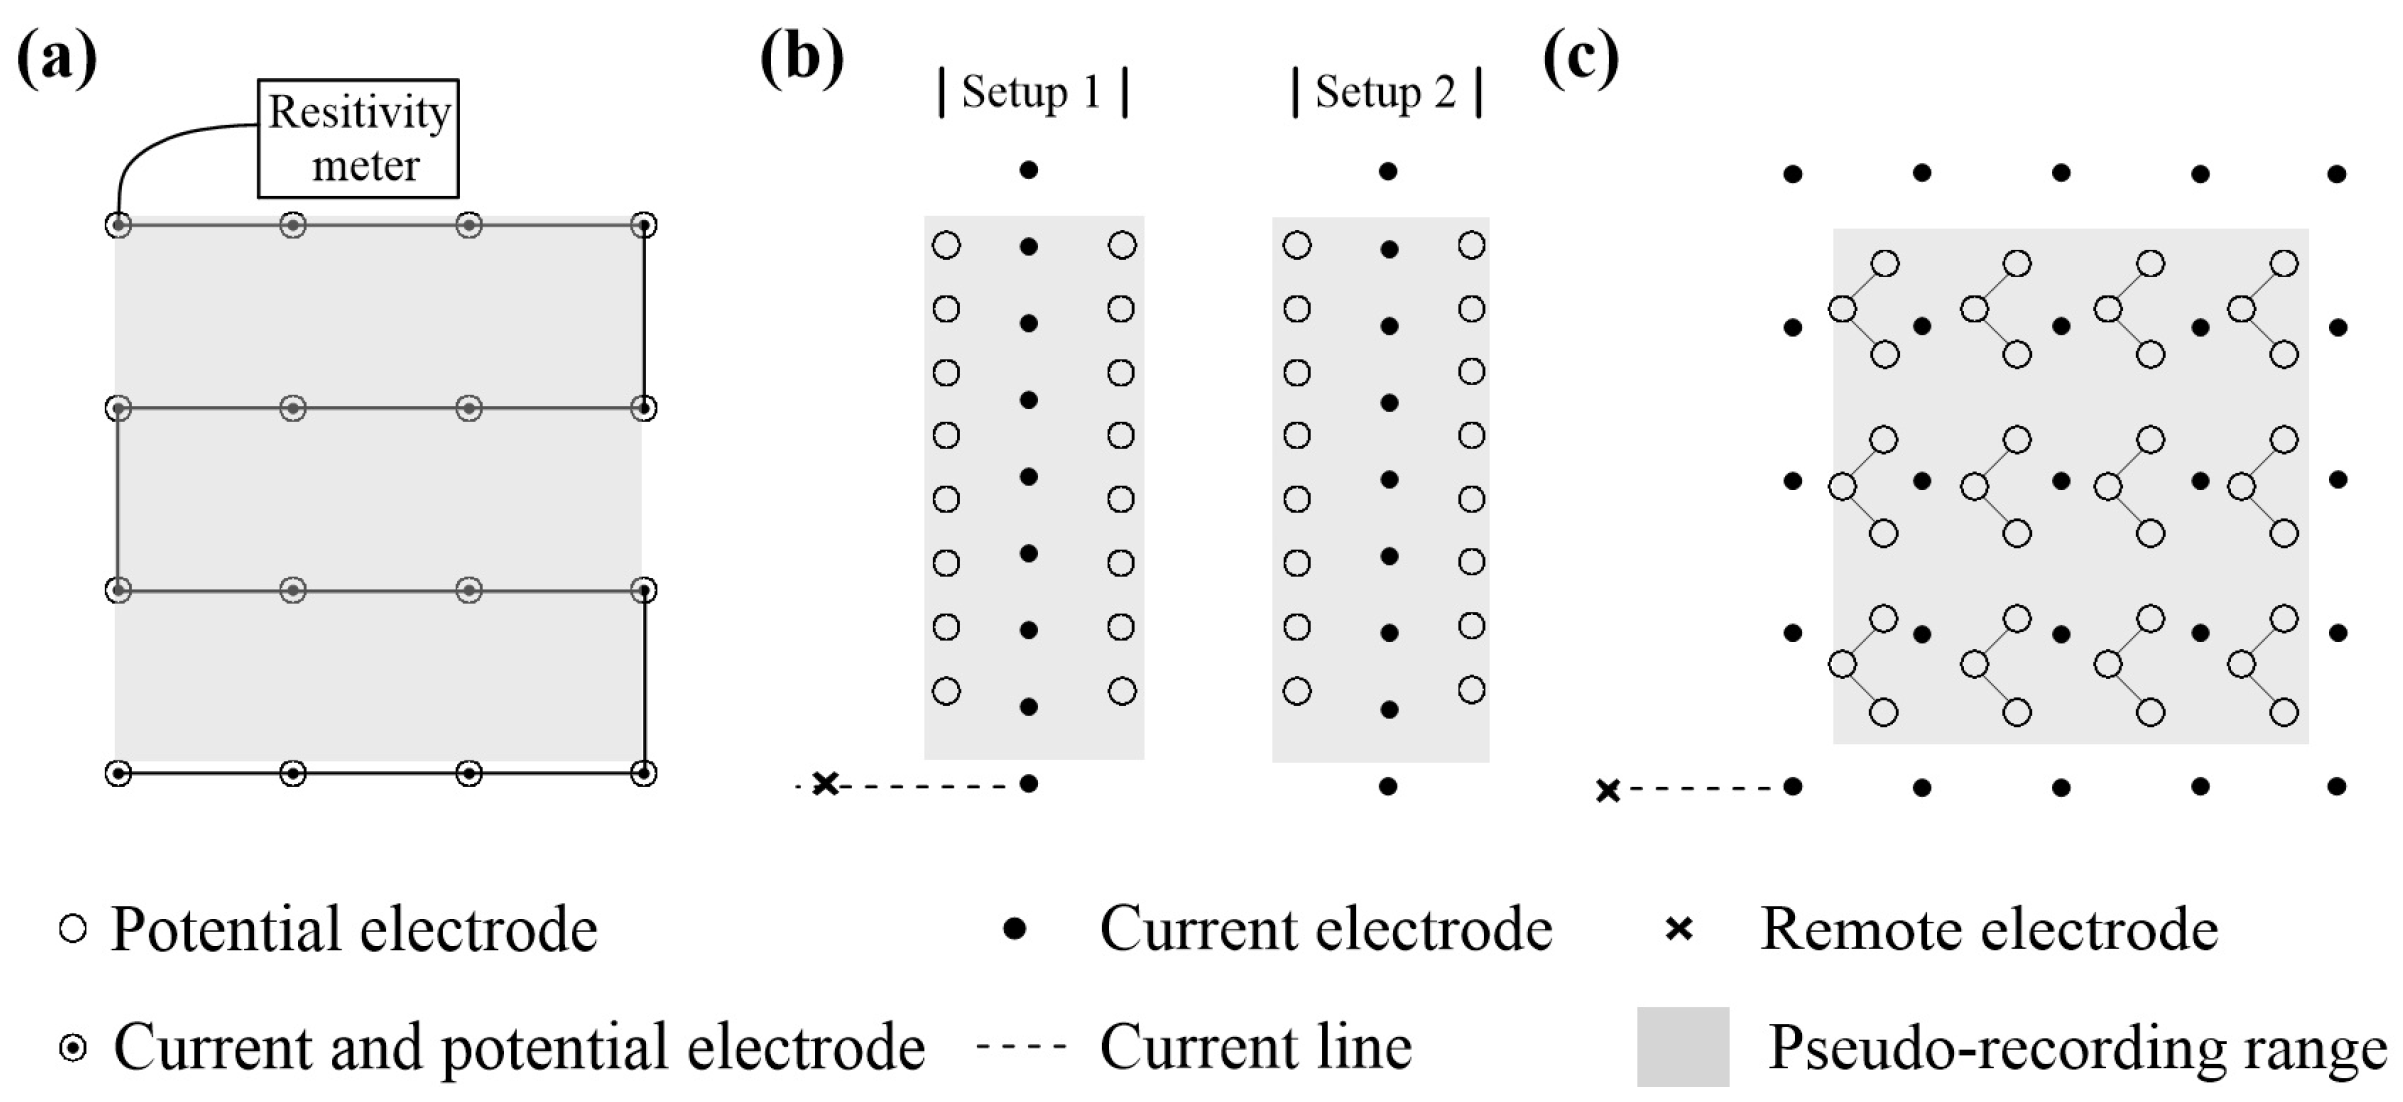
Early 3D cases have been mostly realized using 2D multi-electrode systems. The first approach is to a use multi-branch layout of multicore cables to implement the 3D electrode array (Figure 1a) [7,20]. However, the 3D layout of the 2D instrument is not always suitable for high-precision and deep, large-scale surveys. The second approach is to combine several common 2D profiles and use a 3D inversion algorithm to investigate a large area [2,22,23,24]. Some classical 2D arrays were specially modified for 3D data acquisition, such as double offset pole–dipole array (Figure 1b) [25,26]. However, the 2D combination method mainly reflects the electrical structure along the receiver lines, which is a quasi-3D technique [27]. Webb et al. [28] collected not only the electric field component in the line direction but also the transverse direction when using a pole–dipole array to implement 3D data acquisition. His experiment showed that collecting ‘between the lines’ provided critical information.
Obtaining true 3D tomography of complex geological bodies requires using a series of current sources with different injection locations and collecting potential signals in two orthogonal directions at the receiver points [29]. With the development of distributed acquisition systems, we can set up many independent two-channel receivers into a bi-directional receiver array [1,30,31]. Bournas et al. [32] and Sun et al. [33] carried out 3D data acquisition using a pole–L-shaped-dipole array (Figure 1c). Wang et al. [4] and Gong et al. [34] proposed using an expanding gradient–L-shaped-dipole array. Distributed true 3D acquisition technology is suitable for large-scale and high-precision mineral exploration. As the receiver array covers a large area and n-spacing could be set very large, distributed true 3D acquisition technology can detect the deep buried target body. As there are a large number of receiver electrode locations, it can improve the horizontal resolution. Common electrode array configurations include pole–pole, pole–dipole, dipole–dipole and gradient array configurations, which have different signal strengths, detection depths, spatial resolutions and operating complexities [27,30]. The spatial resolution of the pole–pole array is poor. The dipole-dipole array has a good spatial resolution, but its signal strength is small, especially when the n-spacing is too large, which limits the exploration depth [29,35]. The vertical resolution of the gradient array is poor, but it has a good signal strength and the electrical structure of the subsurface media can be quickly obtained through a small number of transmitter sources [4,30]. The spatial resolution and signal strength of the pole–dipole array are between those of the dipole–dipole and gradient arrays [25]. Therefore, the trade-offs among the signal-to-noise ratio, exploration depth, spatial resolution and work efficiency must be considered when selecting the array type [36].
Figure 1. Schematic diagram of the different 3D observation configurations. (a) The S-shaped electrodes arrangement using a multi-branch layout of multicore cables (after Loke, et al. [20]). (b) The double offset pole–dipole array (after White et al. [22]). (c) The pole–L-shaped-dipole array using distributed acquisition systems (after Sun, et al. [33]).
Remotesensing 16 00186 g001
In this paper, we describe the 3D resistivity and chargeability tomography obtained in Huaniushan, Gansu Province, China. By using a distributed electromagnetic (DEM) system, a vector receiver array was deployed. We used expanding gradient and pole–dipole arrays to implement 3D data acquisition. Then, the 3D resistivity and chargeability data were inverted to generate a 3D geoelectric model. Our work had two purposes. One goal was to search for continuous resources in the deep and peripheral parts of a mining area. The other aim was to compare the quality and efficiency of these arrays (including the combinations of partial data) to seek a reasonable acquisition scheme.

2. Tectonic and Geological Setting

2.1. Tectonic Setting

The Beishan area, situated at the convergence of the Tarim plate, North China plate and Central Asia orogenic belt, represents a multi-cycle composite orogenic belt and is a multi-cycle composite orogenic belt [37]. The Huaniushan Au–Ag–Pb–Zn deposit is located in the western part of the Beishan area. Its geotectonic location belongs to the Dunhuang landmass in the northeast of the Tarim plate (Figure 2). The Dunhuang landmass is mainly composed of the hypo-metamorphic rocks of the Archaean Dunhuang Group. In the Mesoproterozoic period, the ancient land began to break apart and developed a set of shallow marine carbonaceous clastic and carbonate rock formations with a small number of intermediate basic volcanic rocks. The regional structure is controlled by an ENE-trending deep fault.
The laser ablation inductively coupled plasma mass spectrometry (LA-ICP-MS) zircon dating of basalt showed that the crystallization age was 1071 Ma ± 5 Ma, and the strata related to mineralization mainly composed the Pingtoushan Formation of Jixianian System [40]. As shown in Figure 3, the third and fourth lithologic members of the Pingtoushan Formation were exposed in the NE-trending study area. The third lithologic member (Jxpc) was a set of shallow marine carbonate and argillaceous rock formations and was mainly composed of marble and phyllite, which were divided into three sections. The upper part of the third lithologic member was the main ore-bearing horizon of the Pb–Zn mine. The fourth lithologic member (Jxpd) was a set of shallow marine carbonaceous argillaceous rock formations, which mainly consisted of phyllite, slate and hornfels. The magmatic activity in the study area was intense and frequent, including late Mesoproterozoic submarine volcanic eruptions and early to middle Indosinian and Variscan magmatic intrusions [41].
Since the 1960s, 221 ore bodies have been delineated, eight of which have reserves of more than 10,000 tons. Ninety percent of ore bodies are located in the contact zone between clastic rocks and carbonate rocks of the Pingtoushan Formation. The thicknesses of the ore veins typically range from 0.5 to 0.9 m, but the larger veins reach up to 16.5 m [41]. Despite the significant mineral resource potential in this area, the current reserves are insufficient, necessitating the discovery of new ore bodies in deep or peripheral areas. Therefore, finding new ore bodies in deep or peripheral areas is urgent.

2.2. Geophysical Setting

A total of 1098 rock (ore) specimens were collected from the boreholes and surface of the study area. In the laboratory, the resistivity and chargeability of these samples were measured using the four-electrode measuring method. Table 1 shows that the range of the resistivity values within the different samples of the same kind of rock was very large. The average resistivity of magmatic rock was higher than that of metamorphic rock. The resistivity of carbonaceous rock was, as expected, lower than that of non-carbonaceous rock. Mineralization led to a decrease in resistivity. The average resistivity of lead–zinc ore was lower than the resistivity of marble and quartzite. Based on the chargeability of these samples, it was evident that lead–zinc ore demonstrated a high chargeability. This established a foundation of physical properties for utilizing resistivity and chargeability imaging methods to investigate lead–zinc deposits. Carbon-bearing rocks, which are characterized by a high chargeability and low resistivity, had similar characteristics to lead–zinc ore and was an interference factor in our study. In practical situations, due to factors such as the ore body size and grade, the apparent chargeability observed in lead–zinc mines is often smaller than the apparent chargeability observed in carbon-bearing rocks. Based on this characteristic, combined with the actual geological conditions, it is often possible to distinguish to some extent between ore bodies and carbon-bearing rocks.

3. Data Acquisition and Processing

A distributed electromagnetic (DEM) system was used to collect 3D data. The DEM consisted of a transmitter (1600 V, 100 Amp) and many multi-channel receivers (two, three and eight channels) (Figure 4). The DEM can be used to collect full waveform data. Some authors argue that this system is capable of detection at a great depth [4,31].

3.1. Expanding Central Gradient Array

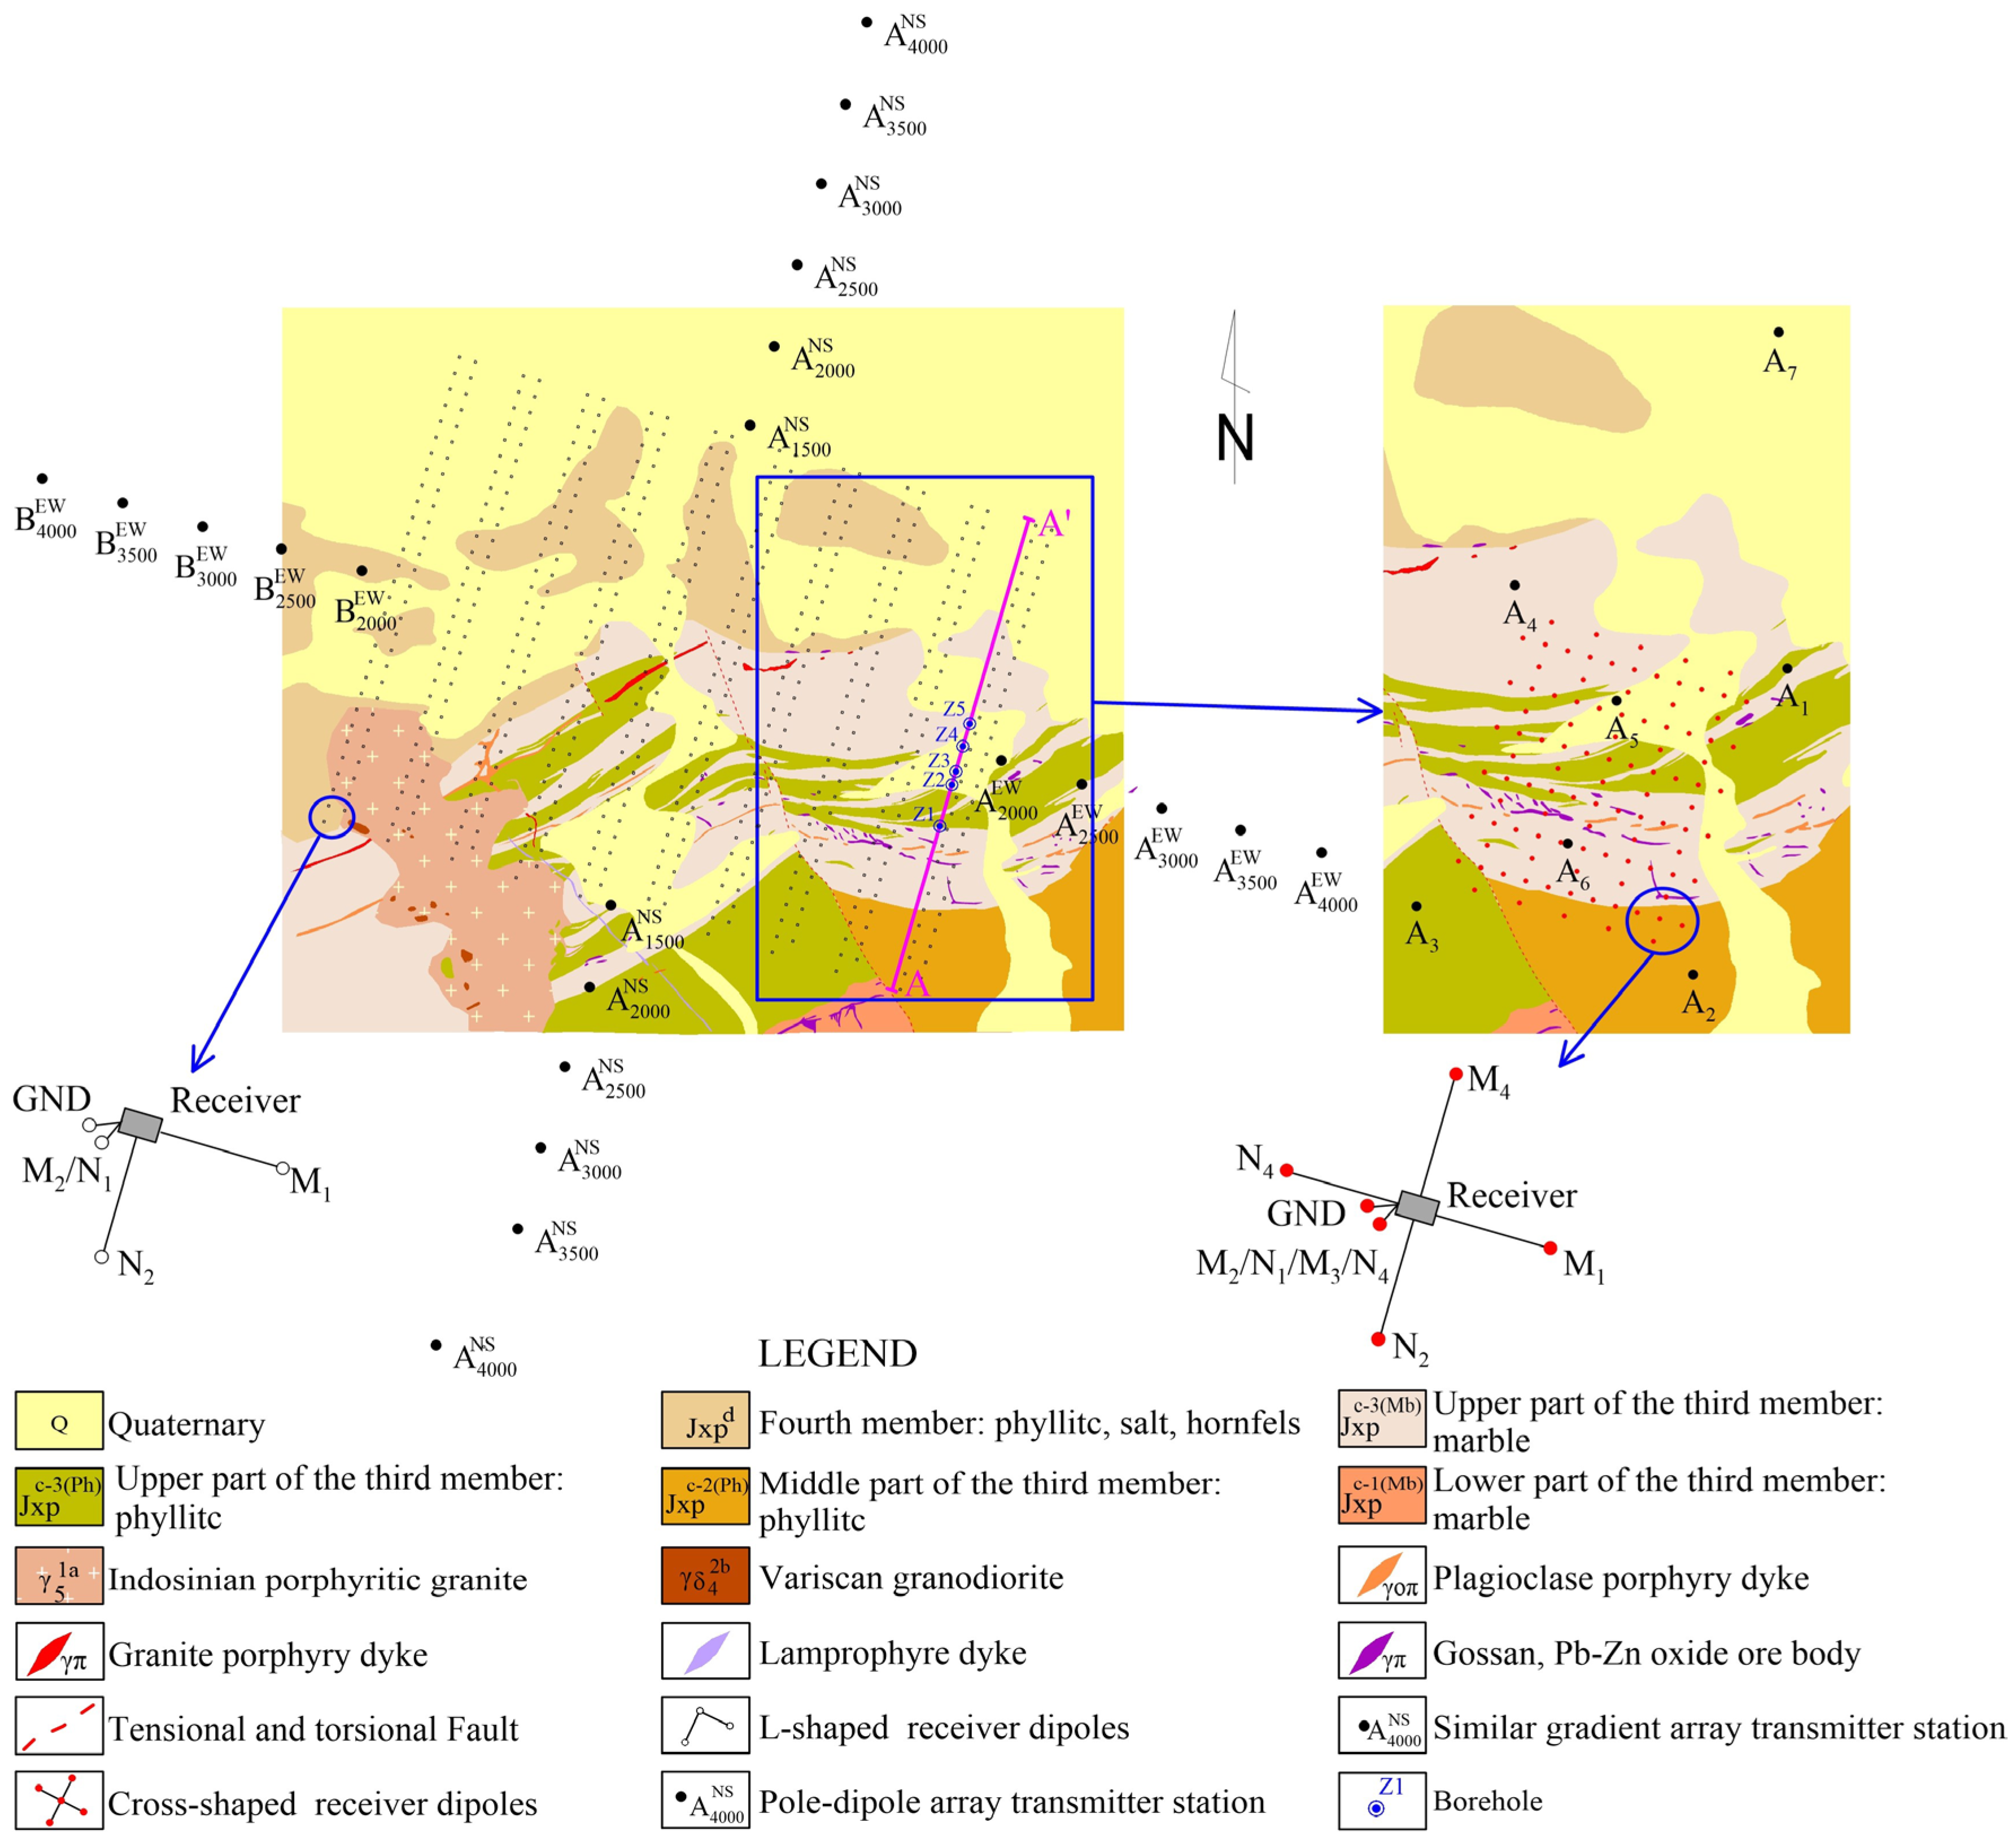
To quickly obtain the underground electrical characteristics of the whole study area, an expanding gradient array, which was characterized by a good signal strength and an efficient operational approach, was used first. Using the adjoint equation method, the sensitivity distribution of the gradient array was calculated [42]. Figure 5a shows that the observed signals contained more deep electrical information with the increase in the transmitting electrodes distance. In the study area, the 3D receiving array was arranged with a 200 m line spacing and 50 m station interval. At each receiver point, two channels of receivers were used to form L-shaped receiver dipoles (Figure 3), and the time-domain full waveform potential difference signals in two orthogonal directions were recorded. A total of eleven pairs of transmitter electrodes were arranged, six of which were nearly in the N–S direction, with electrode distances (AB) of 1500 m, 2000 m, 2500 m, 3000 m, 3500 m and 4000 m. Five pairs were nearly in the E–W direction, with AB values of 2000 m, 2500 m, 3000 m, 3500 m and 4000 m. The transmitter cycle was 16 s. Before data acquisition, all the transmitter electrodes were buried in deep pits and sprinkled with salty water to reduce the grounding resistivity. During the survey, we first deployed 4000 m transmitter wires in each direction and gradually shortened the wires to achieve other layouts for the transmitter dipoles. Compared with the pole–dipole array, moving the transmitter wires required less time with the expanding gradient array, and every group of vector receiver dipoles could record signals with a greater amplitude strength. Another advantage of the expanding gradient array was that the high-sensitivity zone below the receiver electrodes did not indicate an obvious offset. Therefore, in the field, we could draw apparent resistivity and chargeability maps to quickly analyze the electrical characteristics of the study area.
In the conventional time-domain DC/IP method, the apparent resistivity is computed by employing the geometric factor, and the apparent chargeability is determined as the ratio of the secondary voltage to the primary voltage [43]. Based on the full waveform data, it was possible to calculate the decoupled percent frequency effect (PFE) coefficients and decoupled phases using a multi-parameter extraction algorithm [44]. Another advantage of utilizing full waveform data was the ability to suppress noise by excluding individual erroneous data points and addressing multiple superpositions [45].
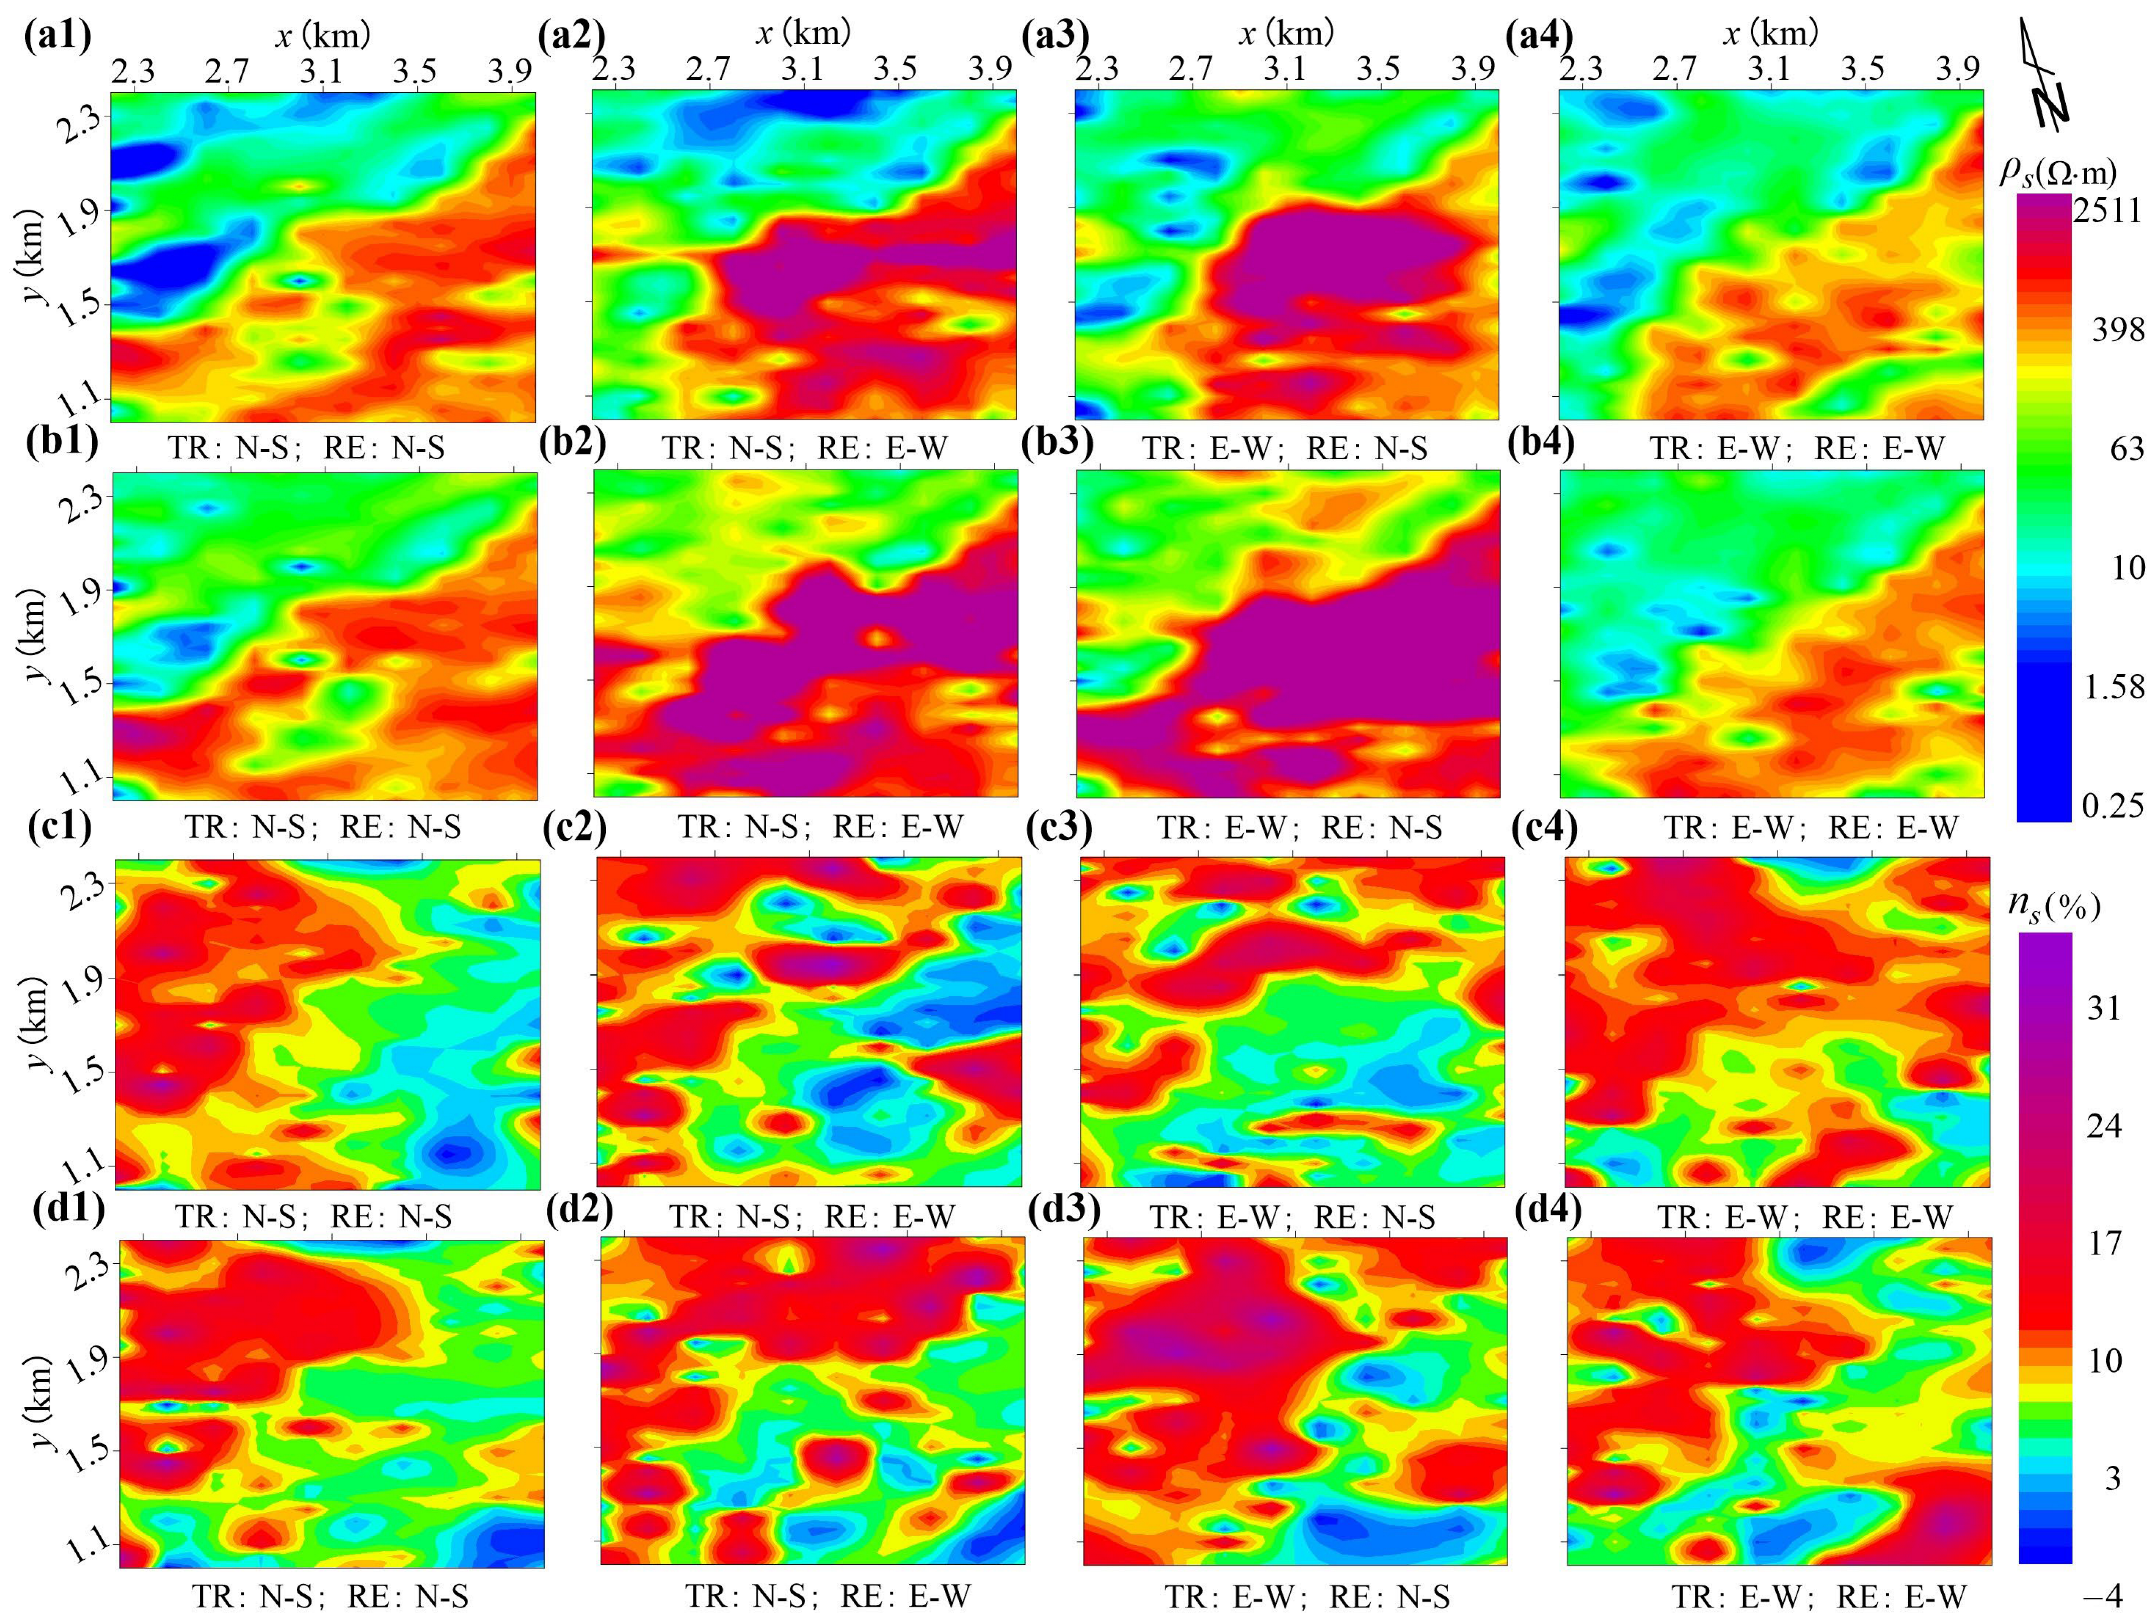
Figure 6 shows the apparent resistivity and chargeability data of the expanding gradient array with different transmitter electrode distances. Longitudinally, the apparent resistivity characteristics of the 2 km transmitter electrode distances were similar to those of 4 km, but there were obvious differences in the local positions. Two main factors contributed to these differences. First, the positions of the transmitter electrodes differed, which meant that the data of the expanding gradient array contained the electrical information of the transmitter electrode locations. Second, the data with longer transmitter electrode distances contained more information about the deep electric structure. Horizontally, there were some variations in the apparent resistivity measured in different observation directions from the diverse current injection directions. These variations reflected the electrical differences between ‘along the lines’ and ‘between the lines’. As the nearly N–S direction was more perpendicular to the strike of the geology, the apparent resistivity data obtained from the nearly N–S-trending transmitter and receiver was more consistent with the distribution of the lithologies and stratigraphy in the area. As shown in Figure 6, the low-resistivity zone in the northwestern part of the survey area corresponded to the carbonaceous argillaceous rock formations of the fourth lithologic member. The high-resistivity zone was attributed to the carbonate and argillaceous rock formations of the third lithologic member.

3.2. Pole–Dipole Array

According to the 3D inversion results of the expanding gradient array, the zone of interest with the characteristics of low resistivity and high chargeability was selected for the 3D tomography with the pole–dipole array (blue frame in Figure 3). The 3D receiver array was arranged with a 50 m line spacing and a 50 m station interval. Four-channel receivers at each location were used to form cross-shaped receiver dipoles (Figure 3). There were seven transmitting sources inside and outside the potential zone, among which electrodes A1 through A4 were located near the four corners outside the receiver array. Electrodes A5 and A6 were placed in the middle of the receiver array to increase the shallow spatial resolution, and electrode A7 was located in the north, 550 m from the nearest receiver electrode, to improve the deep spatial resolution. The infinite transmitter electrode for all seven sources was placed 5 km from the receiver array.
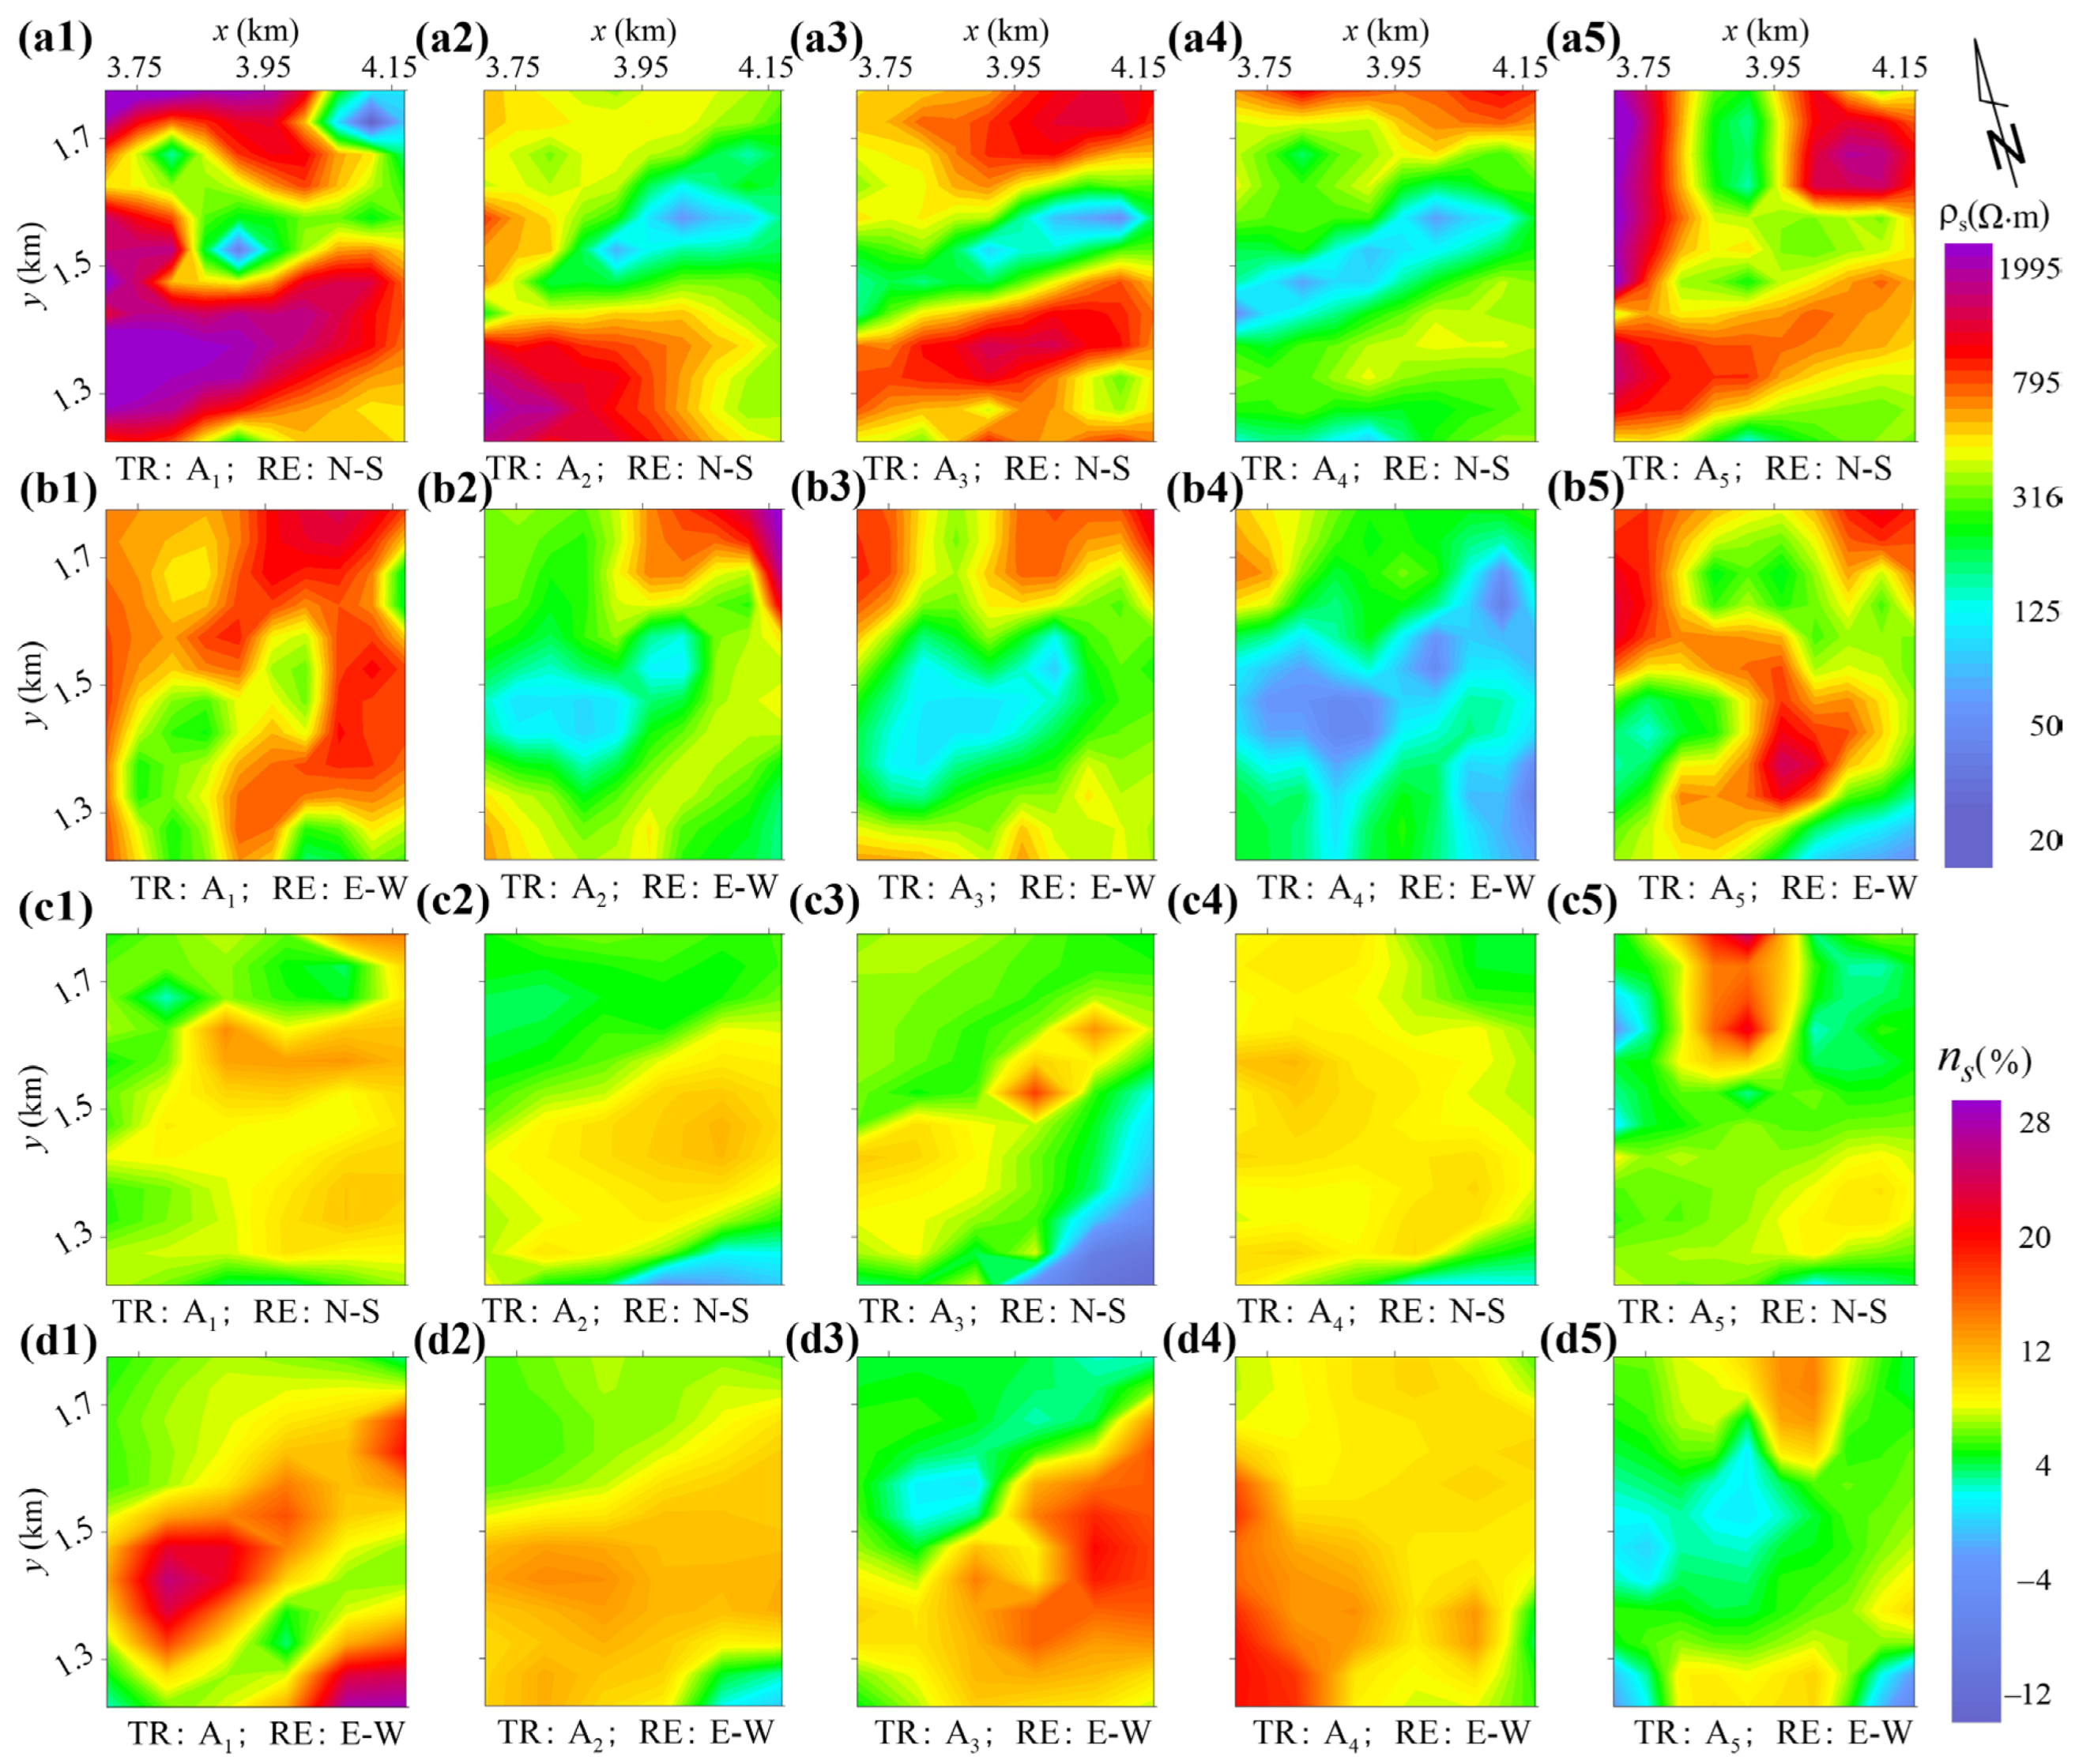
As shown in Figure 7, the apparent resistivity and chargeability values of the stations were set at the midpoint of receiver electrodes M and N. However, in theory, the high-sensitivity zone below the receiver electrodes was offset to the transmitter electrode, as illustrated in Figure 5b. In addition, the apparent resistivity map of the pole–dipole array did not reflect information from the same depth. The above reasons led to the difference between the panels shown in Figure 6. Although there were differences, all of them could reflect the NE-trending banded anomaly in the eastern area.

3.3. D Inversion

The finite element method (FEM) was used to implement forward modeling [46]. Since the maximum elevation difference of the survey area was less than 20 m, the influence of the surface topography was not considered in the mesh generation. The investigated domain was discretized into a set of hexahedral elements. We used the incomplete Cholesky conjugate gradient (ICCG) algorithm to solve a large sparse linear equation [47].
For the resistivity inversion problem, we minimized the following target functional based on the regularization method.
Θ m = Θ d + λ Θ m = d m d o b s 2 + λ W m m m r e f 2 ,
where Θ d and Θ m are the data constraint item and model constraint item, respectively, λ is the regularization factor, m is the forward response of the current model, d o b s is the observed data and W m is the model weighting matrix containing the derivatives of the model in three orthogonal directions. The iteration format of Equation (1) is as follows.
( J T J + λ W T W ) Δ m k + 1 = J T ( d o b s d ( m k ) ) λ W T W ( m k m r e f ) ,
m k + 1 = m k + Δ m k + 1 ,
where J is the Jacobian matrix. The regularization factor λ was updated by decreasing it step by step. The natural logarithm conductivity method was used to avoid negative resistivity values [48]. The conjugate gradient method was employed for the rapid inversion of the resistivity.
For the chargeability inversion problem, the linearization of the data equations was used in our algorithm. The approximate relationship between the apparent chargeability of the sounding point and the model chargeability is shown as follows [48,49].
η a i = j = 1 M J i j η j = j = i M l n ( φ ) l n ( σ j ) η j ,
where J is the negative value of the Jacobian matrix in the resistivity inversion, which was calculated; φ is the apparent resistivity; and η j is the model chargeability. Since Equation (4) was similar to Equations (2) and (3), we could easily implement the chargeability inversion. Instead of the natural logarithm chargeability method, a hard constraint was used to keep the chargeability within a reasonable range.
Mesh generation is a trade-off between the inversion accuracy and speed. In the horizontal direction, the actual electrode coordinates were used for the grid generation, and a node was inserted between two adjacent electrodes. In the vertical direction, the layer thickness increased with the number of layers at a specific scale factor. The thickness of the first layer was one-third of the minimum electrode distance and the scale factor was 1.12. The maximum depth of the inversion model was approximately 540 m. To suppress the boundary effect, we expanded the mesh by 10 elements. A uniform half-space with the average value of the observed apparent resistivity was used as the initial model. The initial regularization parameter was 0.1 and decreased with the number of iterations.

4. Results and Interpretation

4.1. Expanding Gradient Array

In the inversion of expanding the gradient array data, the total number of model grids was 105,222. The 3D inversion was performed using the L-shaped dipoles array data of all 11 transmitters. After five iterations, the fitting error of the inverted resistivity was 16.4% and that of chargeability was 7.2%. The effective depth was 500 m.
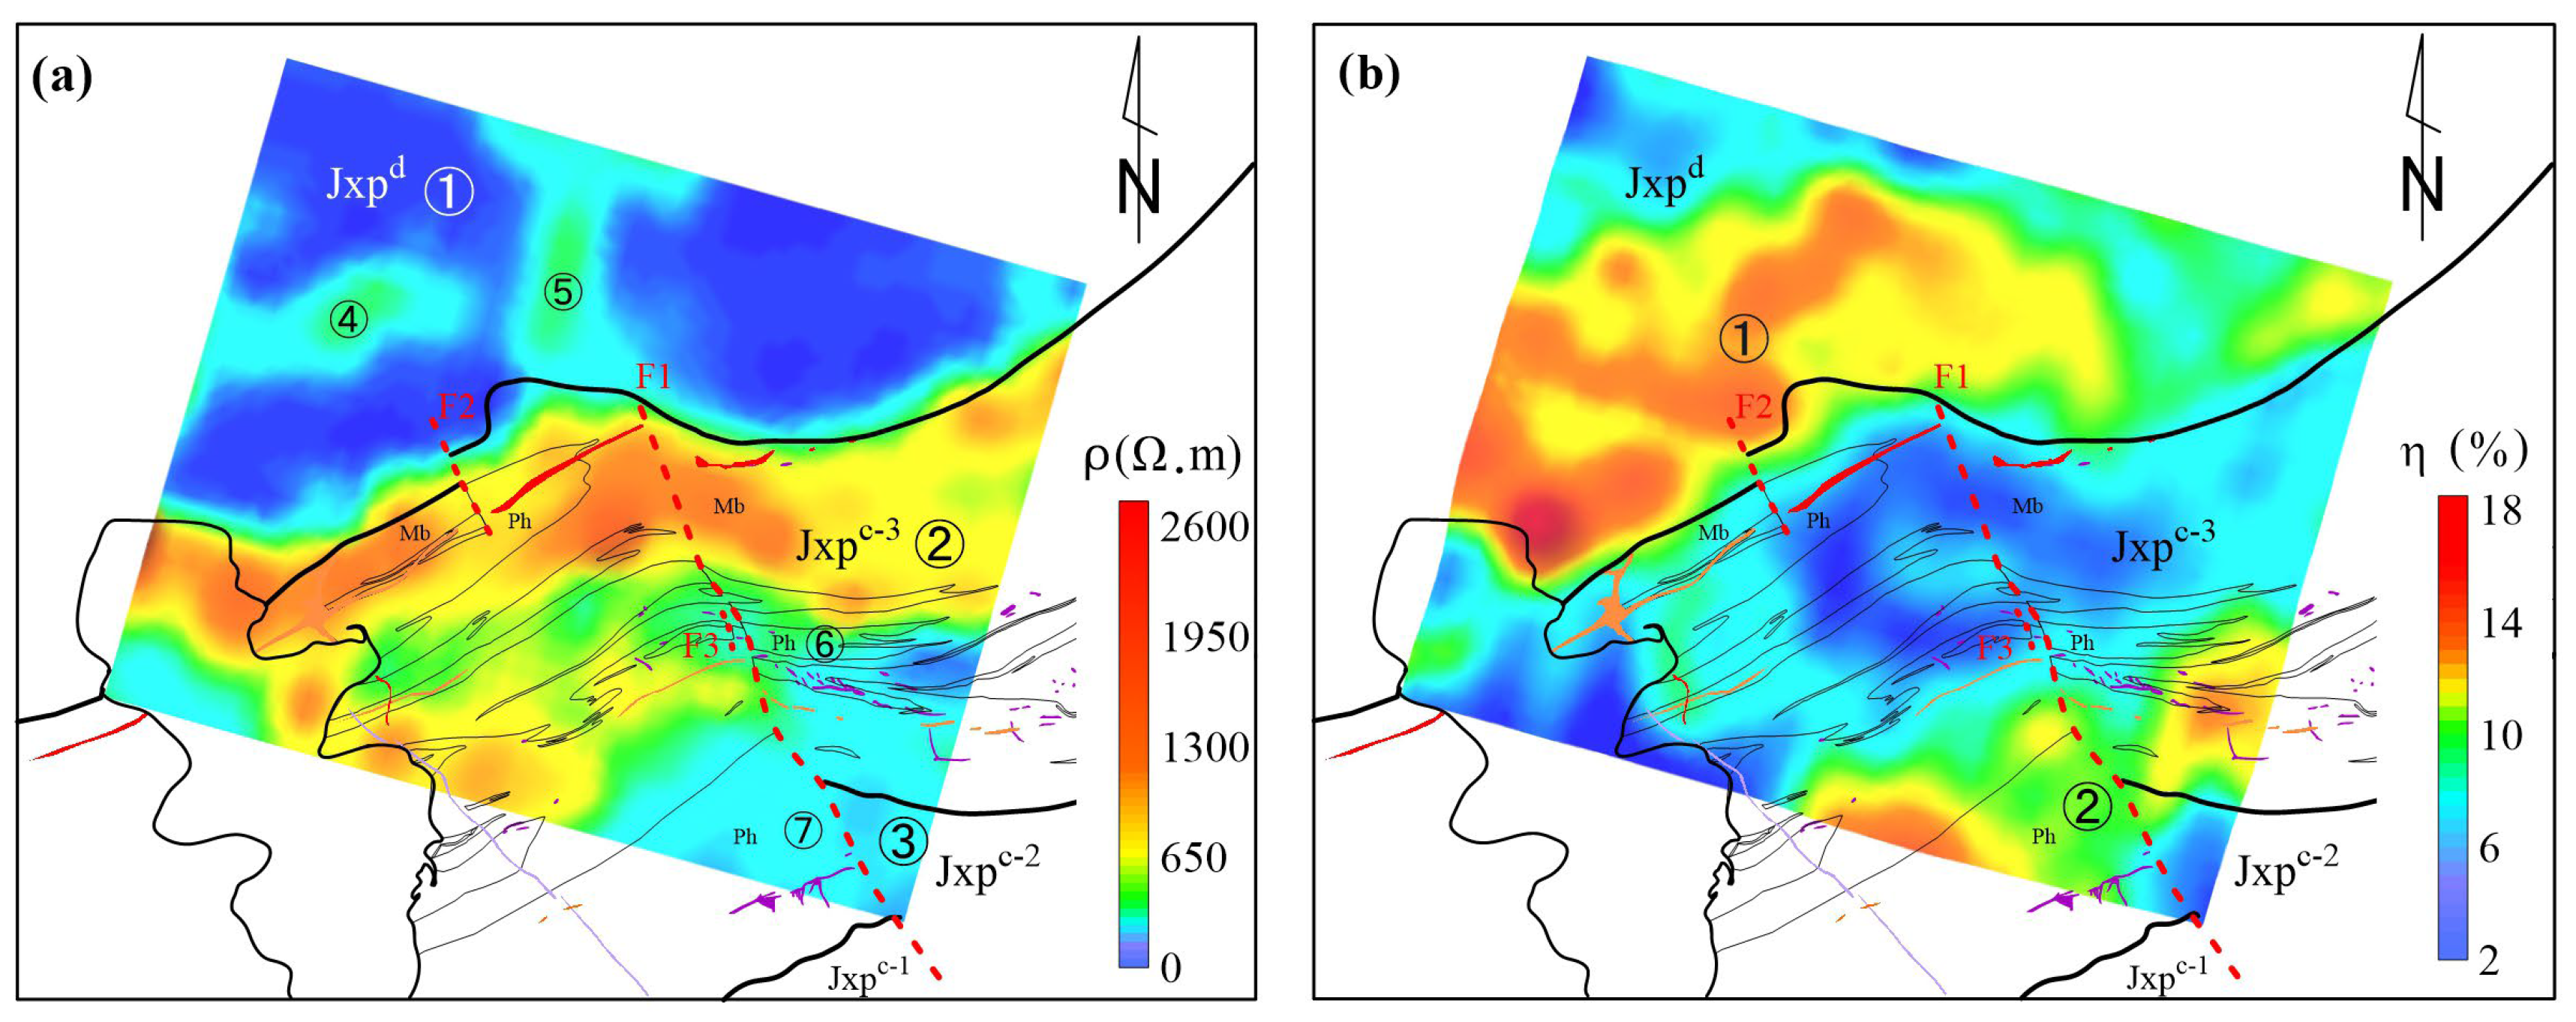
Figure 8 shows the 3D models of the inversion results. The shallow inversion results agreed well with the distributions of the lithologies. To further analyze the results, deep slices were extracted at 80 m (Figure 9). As shown in Figure 8a and Figure 9a, a NE-striking border between the third (Jxpc) and fourth lithologic members (Jxpd) cut through the whole survey area. The carbonaceous rocks of the Jxpd, which were covered by the Quaternary system, were characterized by low resistivity (zone ①). The local high-resistivity zones ④ and ⑤ were related to exposed slate. The carbonate rock formation of the Jxpc showed a moderate- to high-resistivity area overall (zone ②). The local high- and low-resistivity anomalies were related to lithological changes, such as the NE-trending low-resistivity belt (zone ⑥ and ⑦) in the Jxpc−3, which roughly coincided with phyllite. The argillaceous rock formations in the Jxpc−2 showed a low-resistance zone (zone ③). A change in the orientation of the high-resistivity belt occurred near the F1 fault. As shown in Figure 8b and Figure 9b, two high-chargeability belts (zone ① and ②) were clear. Figure 8c shows the 3D morphology of the low-resistance and high-chargeability bodies. The anomaly in the northwestern area represented the reaction of carbonaceous rocks in the fourth lithologic member. The anomaly in the southeastern area was related to mineralization.
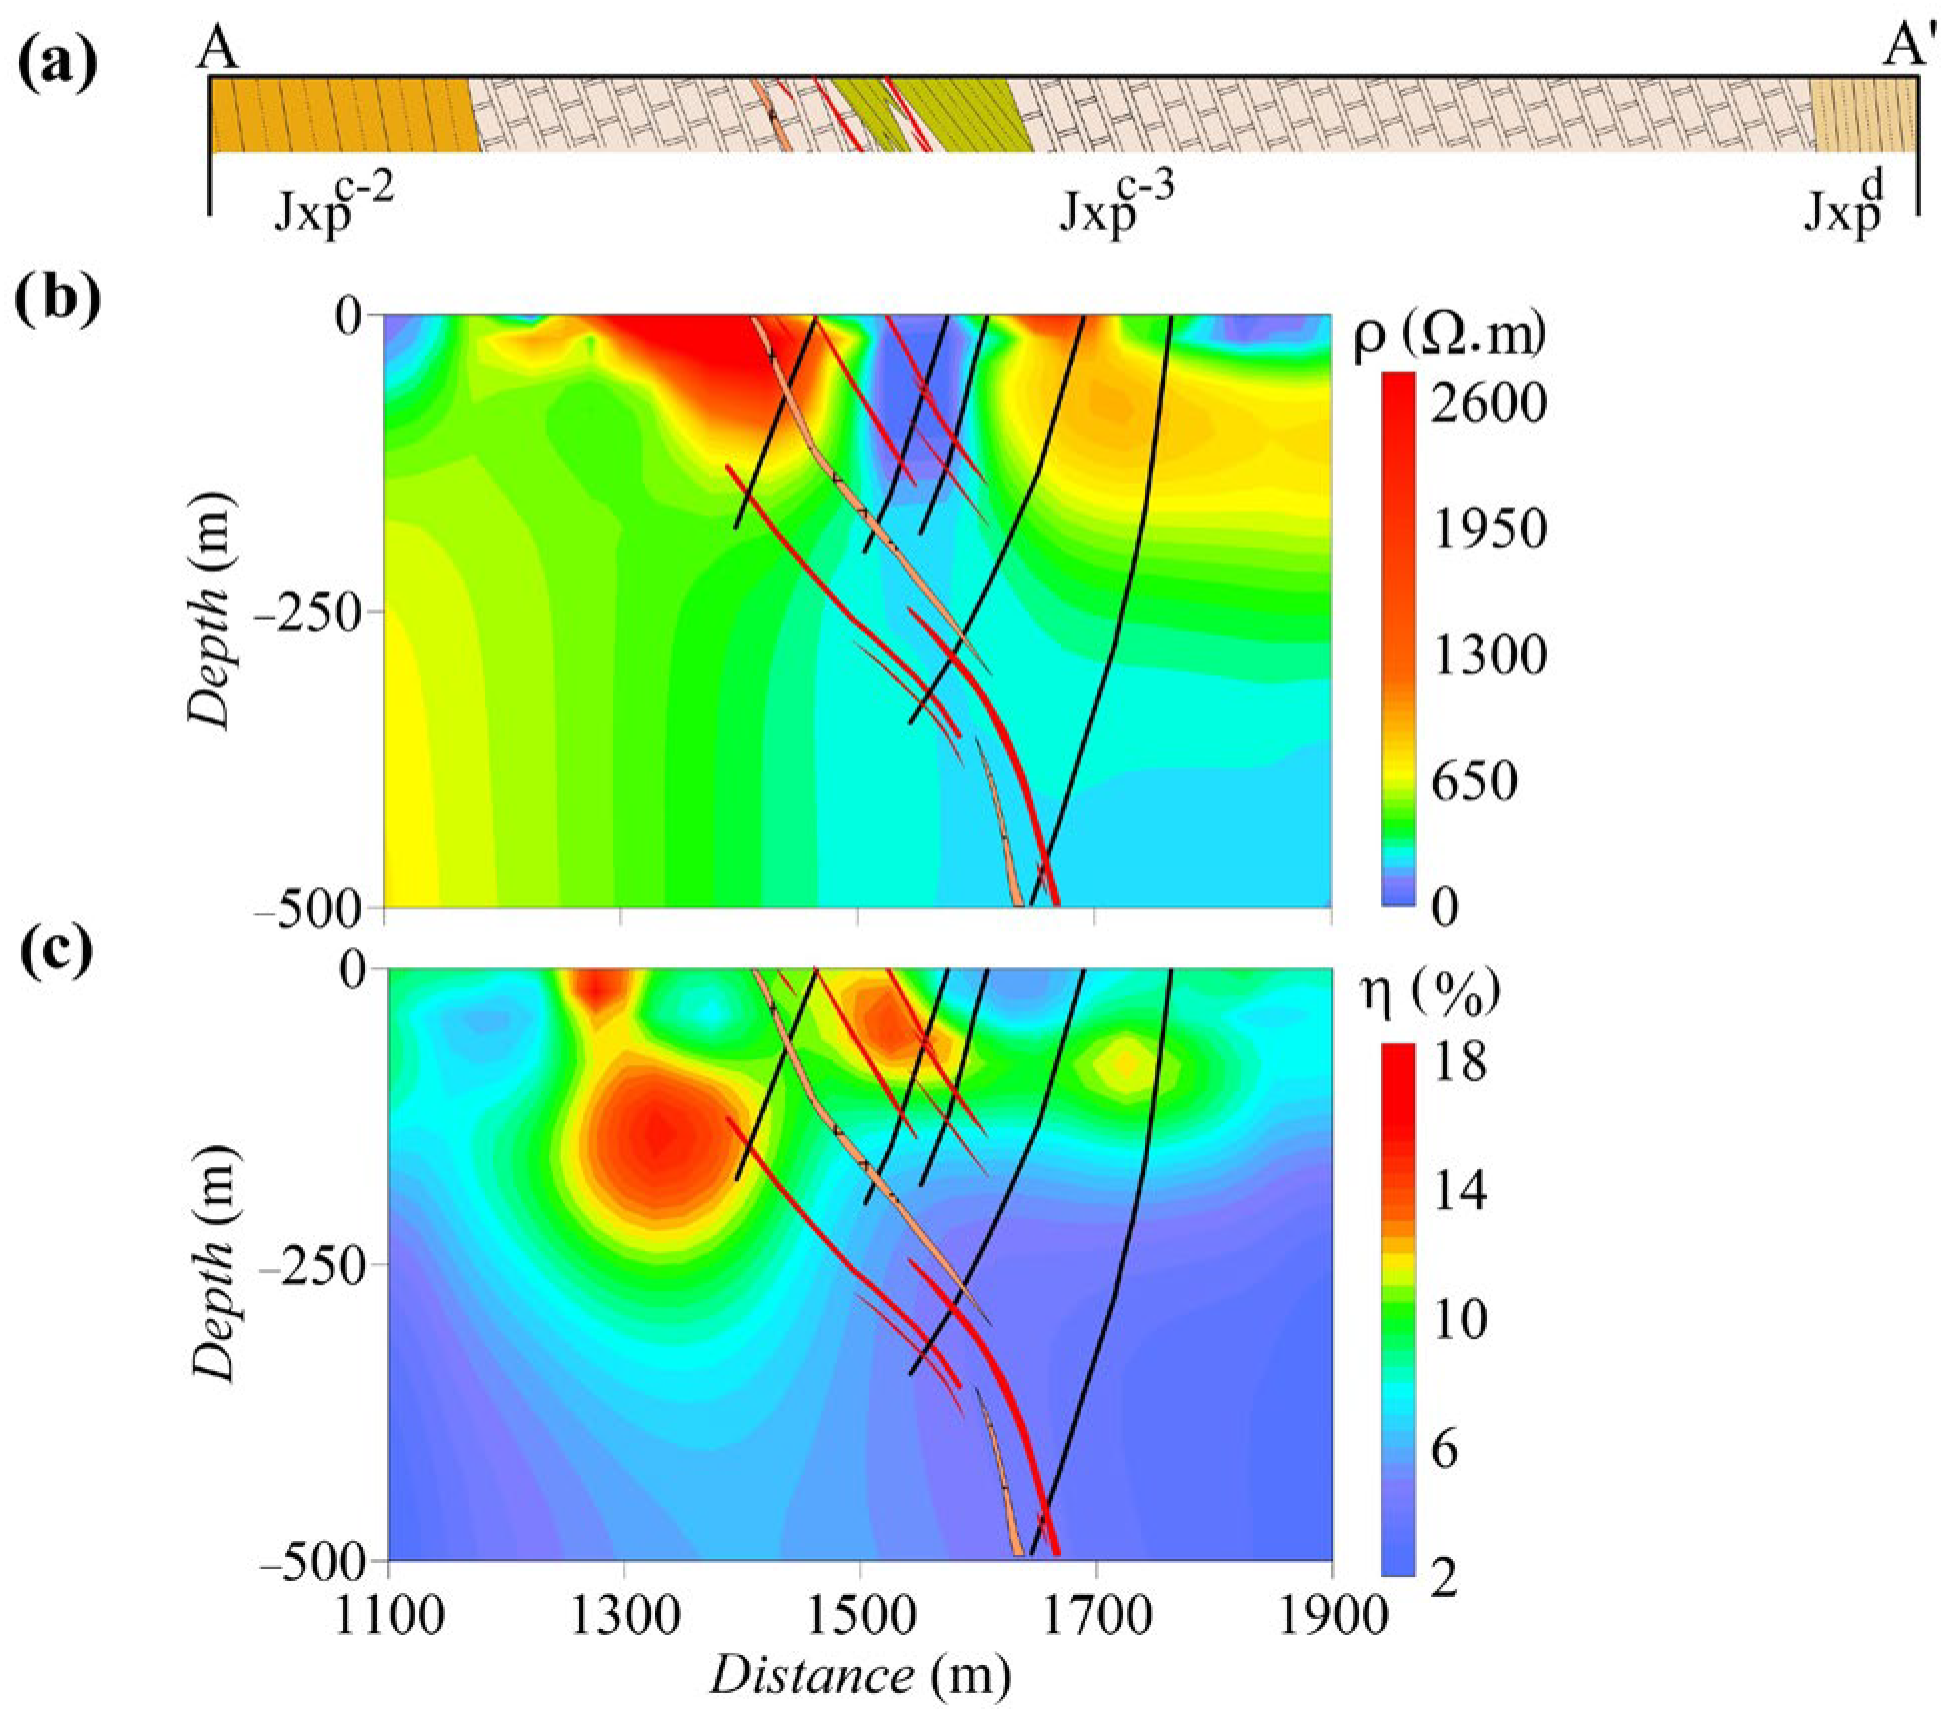
Figure 10a shows the geological structure along line AA′, in which the black lines and the red polygons represent the drilling paths and ore bodies, respectively. An ore vein with a thickness of 4.41 m was revealed at 506.59 m in the Z6 borehole. Figure 8b,c shows the inversion results for line AA′. The 3D DC inversion results largely agreed with the geological profile. The shape of the low-resistivity zone at 950 to 1200 m was interpreted as the middle part of the third lithologic member. The range of the fourth lithologic member exposed on the surface at 2300 to 2400 m was consistent with the shallow low-resistivity zone in the resistivity profile, which extended deeper towards the south. The locations of the low-resistivity and high-chargeability bodies were consistent with those of the known ore veins.

4.2. Pole–Dipole Array

In the inversion of the pole–dipole array data, the total number of model grids was 30,420. The 3D inversion was performed using the cross-shaped dipoles array data of all seven transmitters. After six iterations, the fitting error of the inverted resistivity was 15.8% and that of the chargeability was 8.6%. Figure 11 and Figure 12 show the 3D electrical structure and slices along line AA′, respectively. As shown in Figure 12c, the chargeability profile revealed three anomalies. At 1450 to 1600 m, the known ore veins showed an anomalous low-resistivity and high-chargeability zone, which was similar to those shown in Figure 10. The high-chargeability zone at 1250 to 1450 m also showed relatively low-resistivity characteristics and was located in the extension direction of the known veins. Therefore, this area was inferred to be favorable for mineralization, which could be used for drilling verification. The high-resistivity and high-polarization zone at 1650 to 1800 m may have been caused by wall rock alteration.

5. Discussion

5.1. Comparison between the Expanding Gradient Array and Pole–Dipole Array

Although the inversion results from the expanding gradient array data showed electrical structures similar to those from the pole–dipole array data, the details differed obviously. As shown in Figure 10c, the high-chargeability zones at 1250 to 1450 m and 1650 to 1800 m extended to the surface, which was different from the result in Figure 12c. As shown in Figure 5, when the transmitter–receiver separation was small, the high-sensitivity zone was concentrated in the shallow part. With the increase in the separation, the sensitivity of the deep part increased. For the expanding gradient array, since the minimum AB reached 1000 m, the shallow resistivity in the inversion results was affected by the depth. Accordingly, the pole–dipole array with the smaller separation had the higher resolution in the shallow part. In addition, with the same separation, the pole–dipole array was more sensitive to the deep part, as shown in Figure 5. Figure 12b describes the more detailed resistivity characteristics in the deep part than Figure 10b, which indicated that the former had a greater detection depth.
However, the disadvantages of pole–dipole arrays are also obvious. In our work, seven transmitter electrodes were used to cover an area of only 0.3 km2. Therefore, many transmitter sources were needed to achieve the larger-scale high-resolution survey. In addition, the signal level was very small for a large transmitter–receiver separation, which reduced the signal-to-noise ratio of the observed data and may not have even yielded effective data. In our work, when the transmitter electrode A7 was used to inject the current, the amplitudes of the signals recorded at several points in the southern area were less than the minimum detectable value for the DEM receiver.
Although the vertical resolution of the expanding gradient array was poor, a small number of transmitter sources could be used to investigate a large area. Therefore, the expanding gradient array was suitable for seeking targets in the early exploration stage. In the target zone, a pole–dipole array could be used for detailed investigation. In this stage, by moving the receivers outside into the target area, arranging a denser receiver array was easy.

5.2. Comparison between True 3D and Quasi-3D

Theoretically, when the transmitter sources are dense enough, a high-resolution geoelectric model can be obtained. Any combination of arrays can be used for joint inversion. However, a reasonable work layout is the trade-off among spatial resolution, detection depth and work efficiency. The results shown in Figure 8, Figure 9, Figure 10, Figure 11 and Figure 12 were calculated using all the vector observational data generated by all the transmitters. To compare the results of true 3D tomography and quasi-3D tomography, the data for the different transmitter–receiver relations were combined for inversion, which contributed to the design of a reasonable and efficient acquisition scheme. Taking the resistivity as an example, we performed a comparative analysis of the 3D model and line AA′ slices. The model grid and inversion parameters shown in Figure 13 and Figure 14 were the same as those shown in Figure 8, Figure 9, Figure 10 and Figure 11, respectively.
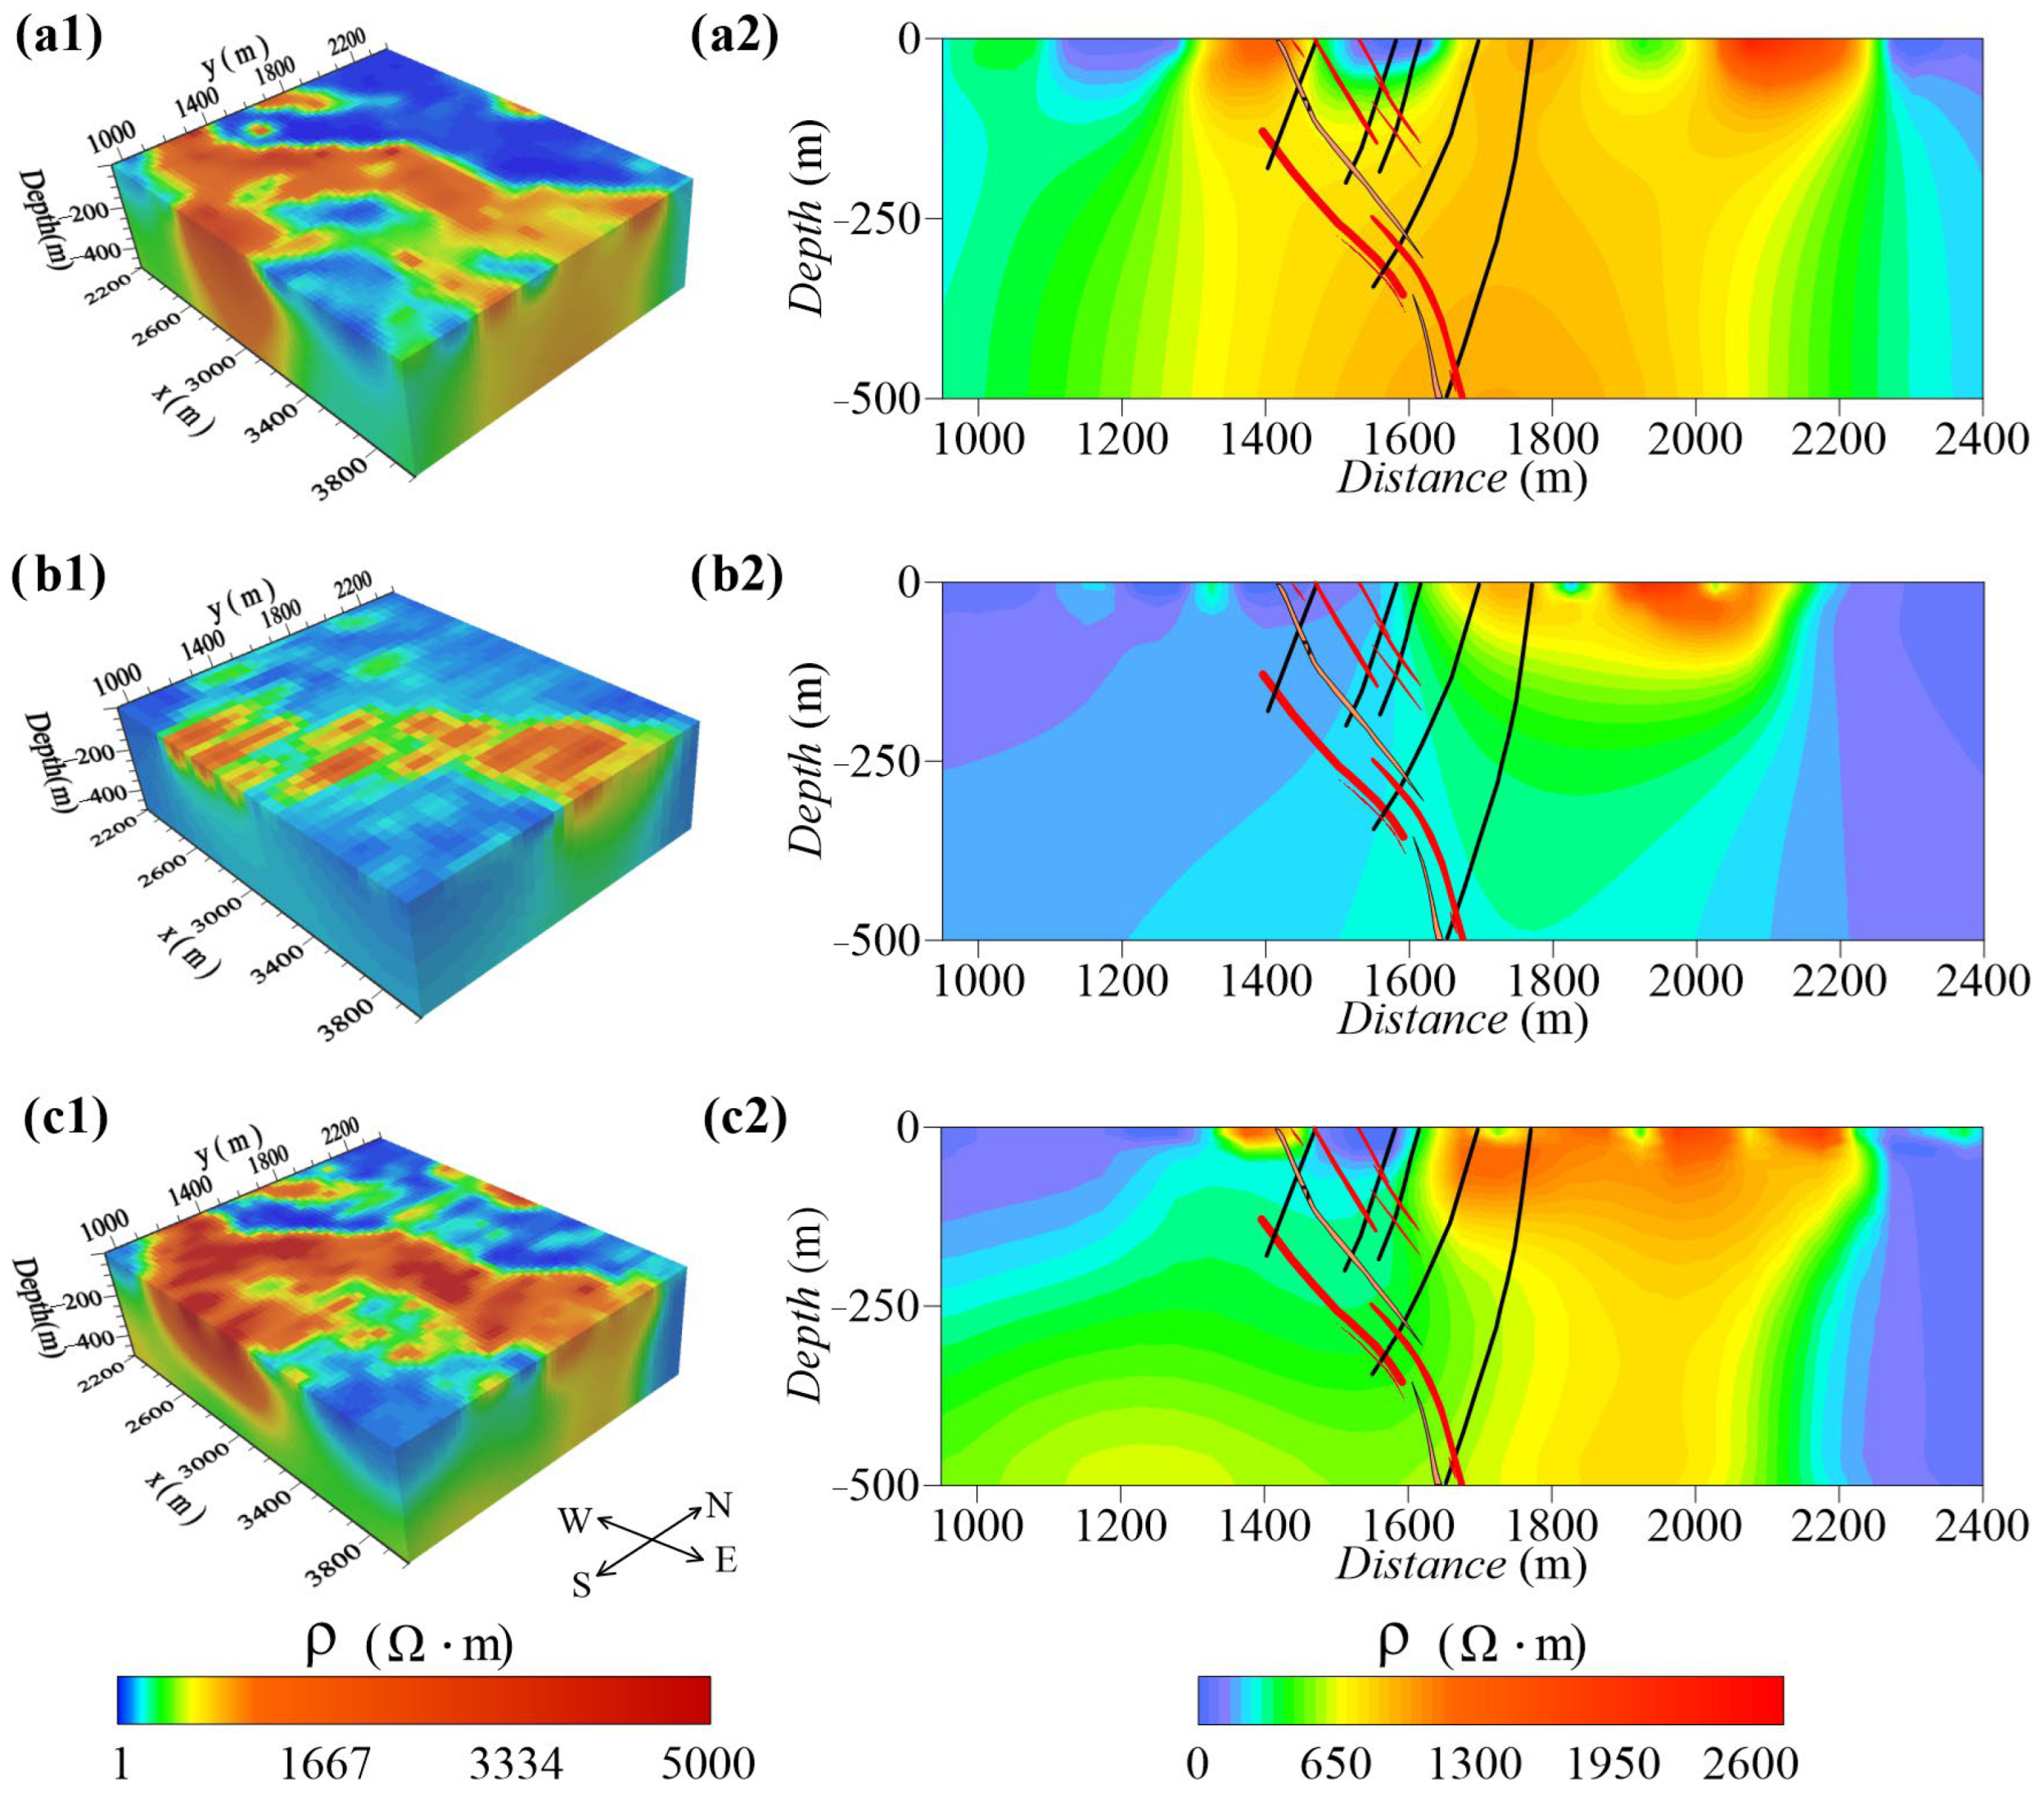
For the expanding gradient array, we mainly focused on the difference in the current injection direction. As shown in Figure 13a, the inversion results with the nearly N–S-trending transmitter and nearly N–S-trending receiver mostly reflected the longitudinal information and a lack the transverse information. Although the shallow resistivity characteristics shown in left panel of Figure 13a agreed well with the geological structure, the slice (right panel of Figure 13a) showed a lower vertical resolution, with only the features in the top 150 m being imaged. The inversion results with the nearly E–W-trending transmitter and nearly E–W-trending receiver mainly reflected the transverse information. Figure 13a,b displays the resistivity characteristics along a single direction, that is, quasi-3D tomography (Figure 13c). The data used in Figure 13a,b were combined to invert the resistivity model, including ‘along the lines’ and ‘between the lines’ information. Compared with those shown in Figure 13a,b, the resistivity model shown in Figure 13c was more consistent with the geological structure. In the profile, the low-resistivity anomaly caused by the ore veins showed further downward stretching. The vertical and horizontal resolutions were further improved by using the inversion of all the sounding points from all the transmitter sources (Figure 8).
For the pole–dipole array, the differences caused by the receiver direction were analyzed. We inverted the data received along the nearly N–S and E–W directions independently (Figure 14). The inversion results using the data measured along the nearly N–S-trend were more consistent with the geological setting than those of the nearly E–W-trend. At depths of 1700 to 1900 m, the inversion results of the nearly E–W-trending data did not well depict the low-resistivity anomaly caused by the fourth lithologic member. Compared with the inversion results from single-direction data, the electrical structure described by the vector data was more detailed and better corresponded to the geological structure.
The inversion results of both arrays showed that true 3D acquisition had obvious advantages over quasi-3D acquisition. The vector observation data based on multi-directional transmitters can be used for the high-resolution tomography of real geoelectric models. Arranging L-shaped or cross-shaped vector receiver arrays to record data is advisable. In addition, because the data of the vertical trend showed a better detection effect, larger density dipoles can be arranged in this direction.

6. Conclusions

In our case, a distributed acquisition system was used to implement 3D resistivity and chargeability tomography to search for new deep and peripheral ore bodies of Huaniushan, China. We used expanding gradient and pole–dipole arrays to implement 3D data acquisition. Based on the Gauss–Newton algorithm, the 3D resistivity and chargeability data were inverted to generate a 3D geoelectric model. The conclusions are as follows.
(1)
By using DC/IP 3D tomography technology, we obtained a high-resolution geoelectric model of underground media. The inversion results from the two arrays showed good agreement with the distribution of the geological formations, fault locations and borehole data. The NE-striking low-resistivity and high-chargeability body delineated in the southeast was related to mineralization, which provided data for further mineral evaluation.
(2)
The true 3D data acquisition technology had obvious advantages over the quasi-3D approach. To realize true 3D tomography, establishing transmitter sources with different injection directions and collecting vector signals at sounding points was necessary. Using L-shaped or cross-shaped dipole arrays for data acquisition was reasonable.
(3)
While the true 3D inversion in this study demonstrated better results compared to the pseudo 3D inversion, isotropic inversion algorithms may not be suitable for situations with pronounced anisotropy, leading to the inversion of data misfit. The next step involves the development of a 3D inversion algorithm that incorporates anisotropic resistivity to obtain a more accurate 3D resistivity model reflective of the actual geological conditions.
(4)
When designing an acquisition scheme, the spatial resolution, signal-to-noise ratio, maximum detection depth and field efficiency should be considered comprehensively. Although the vertical resolution of the expanding array was poor, its signal strength and field efficiency were good, and this method could be used to determine the target in the early exploration stage. The pole–dipole array had a high spatial resolution, but it needed densely spaced transmitters, which was more suitable for detailed investigation. To improve the cost/benefit ratio, a large spacing could be used along the strike of the geological structures.

Author Contributions

All of the authors were involved in the various aspects of data collection and/or analysis during the period of this work. Conceptualization, M.W. and X.M.; methodology, J.W. and P.L.; software, J.W.; validation, M.W. and P.L.; formal analysis, M.W.; investigation, J.W.; resources, J.W.; data curation, J.W.; writing—original draft preparation, M.W.; writing—review and editing, visualization, M.W. and J.W.; supervision, P.L. and X.M.; project administration, P.L.; funding acquisition, P.L. All authors have read and agreed to the published version of the manuscript.

Funding

This research was funded by the National Key R&D Program of China (serial number: 2021YFB3900201).

Conflicts of Interest

The authors declare no conflicts of interest.

References

  1. Gharibi, M.; Killin, K.; Mcgill, D.; Henderson, W.B.; Retallick, T. Full 3D acquisition and modelling with the Quantec 3D system The Hidden Hill Deposit Case Study. ASEG Ext. Abstr. 2012, 1, 1–4. [Google Scholar] [CrossRef]
  2. Ali, M.A.; Mewafy, F.M.; Qian, W.; Alshehri, F.; Ahmed, M.S.; Saleem, H.A. Saleem. Integration of electrical resistivity tomography and induced polarization for characterization and mapping of (Pb-Zn-Ag) sulfide deposits. Minerals 2023, 13, 986. [Google Scholar] [CrossRef]
  3. Han, M.H.; Shin, S.W.; Park, S.; Cho, S.J.; Kim, J.H. Induced polarization imaging applied to exploration for low-sulfidation epithermal Au-Ag deposits, Seongsan mineralized district, South Korea. J. Geophys. Eng. 2016, 13, 817–823. [Google Scholar] [CrossRef]
  4. Wang, J.L.; Lin, P.R.; Wang, M.; Li, D.; Li, J.H. Three-dimensional tomography using high-power induced polarization with the similar central gradient array. Appl. Geophys. 2017, 14, 291–300. [Google Scholar] [CrossRef]
  5. Burtman, V.; Gribenko, A.; Zhdanov, M.S. Induced polarization in hydrocarbon-saturated sands and sandstones: Experimental study and general effective medium modelling. In Proceedings of the 79th SEG Annual Meeting Expanded Abstracts, Houston, TX, USA, 25–30 October 2009; pp. 774–778. [Google Scholar]
  6. Veeken, P.; Legeydo, P.J.; Davidenko, Y.; Kudryavceva, E.; Ivanov, S.; Chuvaev, A. Benefits of the induced polarization geoelectric method to hydrocarbon exploration. Geophysics 2009, 74, B47–B59. [Google Scholar] [CrossRef]
  7. Santarato, G.; Ranieri, G.; Occhi, M.; Morelli, G.; Fischanger, F.; Gualerzi, D. Three-dimensional electrical resistivity tomography to control the injection of expanding resins for the treatment and stabilization of foundation soils. Eng. Geol. 2011, 119, 18–30. [Google Scholar] [CrossRef]
  8. Rossi, M.; Olsson, P.I.; Johanson, S.; Fiandaca, G.; Bergdahl, D.P.; Dahlin, T. Mapping geological structures in bedrock via large-scale direct current resistivity and time-domain induced polarization tomography. Near Surf. Geophys. 2017, 15, 657–667. [Google Scholar] [CrossRef]
  9. Vacquier, V.; Holmes, C.R.; Kintzinger, P.R.; Lavergne, M. Prospecting for ground water by induced electrical polarization. Geophysics 1957, 22, 660–687. [Google Scholar] [CrossRef]
  10. Johnson, T.C.; Versteeg, R.J.; Ward, A.; Day-Lewis, F.D.; André, R. Improved hydrogeophysical characterization and monitoring through parallel modeling and inversion of time-domain resistivity and induced-polarization data. Geophysics 2010, 75, WA27–WA41. [Google Scholar] [CrossRef]
  11. Bleil, D.F. Induced Polarization: A Method of Geophysical Prospecting. Geophysics 1953, 18, 636–661. [Google Scholar] [CrossRef]
  12. James, R. Overvoltage Research and Geophysical Applications; Pergamon Press: London, UK, 1959. [Google Scholar]
  13. Santos, F.A.M.; Afonso, A.R.A. Detection and 2D modelling of cavities using pole-dipole array. Environ. Geol. 2005, 48, 108–116. [Google Scholar] [CrossRef]
  14. Nyquist, J.E.; Peake, J.S.; Roth, M.J.S. Comparison of an optimized resistivity array with dipole-dipole soundings in karst terrain. Geophysics 2007, 72, F139–F144. [Google Scholar] [CrossRef]
  15. Spitzer, K. The three-dimensional DC sensitivity for surface and subsurface sources. Geophys. J. Int. 1998, 134, 736–746. [Google Scholar] [CrossRef]
  16. Rutley, A.; Oldenburg, D.W.; Shekhtman, R. 2D and 3D IP/Resistivity inversion for the interpretation of Isa-Style Targets. Explor. Geophys. 2001, 32, 156–159. [Google Scholar] [CrossRef]
  17. Mir, R.; Perrouty, S.; Astic, T.; Bérubé, C.L.; Smith, R.S. Structural complexity inferred from anisotropic resistivity: Example from airborne EM and compilation of historical resistivity/IP data from the gold-rich Canadian Malartic district, Québec, Canada. Geophysics 2019, 84, B153–B167. [Google Scholar] [CrossRef]
  18. Asten, M.W. The influence of electrical anisotropy on Mise A La Masse surveys. Geophys. Prospect. 1974, 22, 238–245. [Google Scholar] [CrossRef]
  19. Sasaki, Y. 3D resistivity inversion using the finite-element method. Geophysics 1994, 59, 1839–1848. [Google Scholar] [CrossRef]
  20. Loke, M.H.; Barker, R.D. Practical techniques for 3D resistivity surveys and data inversion. Geophys. Prospect. 1996, 44, 499–523. [Google Scholar] [CrossRef]
  21. Li, Y.; Oldenburg, D.W. 3D inversion of induced polarization data. Geophysics 2000, 65, 1931–1945. [Google Scholar] [CrossRef]
  22. White, R.M.S.; Collins, S.; Denne, R.; Hee, R.; Brown, P. A new survey design for 3D IP inversion modelling at copper hill. Explor. Geophys. 2001, 32, 152–155. [Google Scholar] [CrossRef]
  23. Neyamadpour, A.; Taib, S.; Wan Abdullah, W.A.T. An application of three-dimensional electrical resistivity imaging for the detection of an underground waste-water system. Stud. Geophys. Geod. 2009, 53, 389–402. [Google Scholar] [CrossRef]
  24. Power, C.; Tsourlos, P.; Ramasamy, M.; Nivorlis, A.; Mkandawire, M. Combined dc resistivity and induced polarization (DC-IP) for mapping the internal composition of a mine waste rock pile in nova scotia, Canada. J. Appl. Geophys. 2018, 150, 40–51. [Google Scholar] [CrossRef]
  25. White, R.; Collins, S.; Loke, M. Resistivity and IP arrays, optimized for data collection and inversion. Explor. Geophys. 2003, 34, 229–232. [Google Scholar] [CrossRef]
  26. Collins, S.; White, R. Case histories in the use of three-dimensional inversion of induced polarization and resistivity surveys. ASEG Ext. Abstr. 2003, 2, 1–4. [Google Scholar]
  27. Neyamadpour, A. Field test to compare 3D imaging capabilities of three arrays in a site with high resistivity contrast regions. Stud. Geophys. Geod. 2011, 55, 755–769. [Google Scholar] [CrossRef]
  28. Webb, D.; Rowston, P.; McNeill, G. A Comparison of 2D and 3D IP from Copper Hill NSW. In Proceedings of the ASEG 16th Geophysical Conference and Exhibition, Adelaide, Australia, 16–19 February 2003. [Google Scholar]
  29. Eaton, P.; Anderson, B.; Queen, S.; Mackenzie, I.; Wynn, D. NEWDAS-the Newmont distributed IP data acquisition system. In Proceedings of the SEG International Exposition and Annual Meeting, SEG, Denver, CO, USA, 17–22 October 2010. [Google Scholar]
  30. Goldie, M.A. A comparison between conventional and distributed acquisition induced polarization surveys for gold exploration in Nevada. Lead. Edge 2007, 26, 180–183. [Google Scholar] [CrossRef]
  31. Zheng, C.L.; Liu, X.Z.; Lin, P.R.; Sun, F.W.; Li, Y.; Li, J.H.; Wang, J.L. Design and realization of the distributed electromagnetic instrument system. Chin. J. Geophys. 2019, 62, 3772–3784. [Google Scholar]
  32. Bournas, N.; Hearst, R.; Clements, E.; Clements, E. Silver Queen, a new stockwork porphyry discovery using the Titan24 DCIP and MT. In Proceedings of the 2012 SEG Annual Meeting, Las Vegas, NV, USA, 4–9 November 2012. [Google Scholar]
  33. Sun, J.J.; Li, Y.G.; Nabighian, M. Lithology differentiation based on inversion of full waveform induced polarization data from Newmont Distributed IP Data Acquisition System (NEWDAS). In Proceedings of the SEG International Exposition and Annual Meeting, Las Vegas, NV, USA, 4–9 November 2012. [Google Scholar]
  34. Gong, S.P.; Yang, Y.B.; Lin, P.R.; Wu, W.L.; Zheng, C.J.; Shi, F.S.; Wu, X.P.; Weng, A.H.; Zhang, G.Z.; Gu, G.W.; et al. Three-dimensional electrical exploration methods for the mapping of polymetallic targets in gansu province, China. Geophys. Prospect. 2019, 67, 1929–1947. [Google Scholar] [CrossRef]
  35. Zhang, G.; Lyu, Q.T.; Lin, P.R.; Zhang, G.B. Electrode array and data density effects in 3d induced polarization tomography and applications for mineral exploration. Arab. J. Geosci. 2019, 12, 221. [Google Scholar] [CrossRef]
  36. Friedel, S. Resolution, stability and efficiency of resistivity tomography estimated from a generalized inverse approach. Geophys. J. R. Astron. Soc. 2010, 153, 305–316. [Google Scholar] [CrossRef]
  37. Qi, Q.I.; Wang, Y.H.; Feng, M.X.; Yang, J.G.; Yu, J.Y.; Wang, L.; Wang, X.H. Geochronology, geochemistry and tectonic significance of dike swarms in Beishan, Gansu. Acta Geol. Sin. 2016, 90, 131–132. [Google Scholar] [CrossRef]
  38. Liu, D.C.; Qiu, J.T.; Tian, F.; Sun, Y. Application of airborne hyper-spectrum remote sensing to mapping of ore-control faults: A case study of the Heishishan-Huaniushan fault. Geol. Explor. 2015, 51, 0366–0375. [Google Scholar]
  39. Yang, J.G.; Zhai, J.Y.; Yang, H.W.; Wang, X.H.; Xie, C.L.; Wang, X.A.; Ren, B.C. Metallotectonics and Prospection of the Huaniushan Exhalogene Gold Silver Lead Zinc Deposit in Beishan, Gansu Province. Geotecton. Metallog. 2010, 34, 246–254. [Google Scholar]
  40. Yang, J.G.; Zhai, J.Y.; Yang, H.W.; Wang, C.F.; Xie, C.L.; Wang, X.H.; Lei, Y.X. LA-ICP-MS zircon U-Pb dating of basalt and its geological significance in Huaniushan Pb-Zn deposit, Beishan area, Gansu, China. Geol. Bull. China 2010, 29, 1017–1023. [Google Scholar]
  41. Yang, J.G.; Ren, Y.X.; Wang, X.H.; Ren, B.C.; Zhai, J.Y.; Wang, X.A. Metallogenic Regularity and Prospecting Prediction of Huaniushan Gold Silver Polymetallic Ore Field, Beishan; Geological Press: Beijing, China, 2011. [Google Scholar]
  42. McGillivray, P.R.; Oldenburg, D.W. Methods for calculating Frechet derivatives and sensitivities for the non-linear inverse problem: A comparative study. Geophys. Prospect. 1990, 38, 499–524. [Google Scholar] [CrossRef]
  43. Sumner, J.S. Principles of Induced Polarization for Geophysical Exploration; Elsevier Scientific Publishing Company: Amsterdam, The Netherlands, 1976. [Google Scholar]
  44. Wang, J.L.; Lin, P.R.; Wang, M.; Li, J.H. A multiple parameter extraction and electromagnetic coupling correction technique for time domain induced polarisation full waveform data. Explor. Geophys. 2019, 50, 113–123. [Google Scholar] [CrossRef]
  45. Paine, J.; Copeland, A. Reduction of noise in induced polarization data using full time-series data. Explor. Geophys. 2003, 34, 225–228. [Google Scholar] [CrossRef]
  46. Karaoulis, M.; Revil, A.; Tsourlos, P.; Werkema, D.D.; Minsley, B.J. IP4DI: A software for time-lapse 2D/3D DC-resistivity and induced polarization tomography. Comput. Geosci. 2013, 54, 164–170. [Google Scholar] [CrossRef]
  47. Poole, E.L.; Ortega, J.M. Multicolor iccg methods for vector computers. SIAM J. Numer. Anal. 1987, 24, 1394–1418. [Google Scholar] [CrossRef]
  48. Oldenburg, D.W.; Li, Y. Inversion of induced polarization data. Geophysics 1994, 59, 1327. [Google Scholar] [CrossRef]
  49. Seigel, H.O. Mathematical formulation and type curves for induced polarization. Geophysics 1959, 24, 547–565. [Google Scholar] [CrossRef]
Figure 2. The regional geological map of Huaniushan in the Beishan area. The tectonic setting of the Beishan area is located at the junction of the Tarim plate, North China plate and the Central Asia orogenic belt [38,39].
Remotesensing 16 00186 g002
Figure 3. Geological and array arrangement map [39]. Data collection in the study area was conducted using the expanding gradient array (the left image). Data collection in the blue-boxed area was carried out using the pole–dipole array (the right image).
Remotesensing 16 00186 g003
Figure 4. The receivers of the DEM system.
Remotesensing 16 00186 g004
Figure 5. Sensitivity distribution of the different arrays. (a) Gradient array with AB = 1 km (a1) and AB = 3 km (a2); (b) pole–dipole array with AM = 0.2 km (b1) and AM = 1.5 km (b2).
Remotesensing 16 00186 g005
Figure 6. Apparent resistivity data from the expanding gradient array with AB = 2 km (a1a4) and 4 km (b1b4). Subfigures (c1c4) and (d1d4) display the apparent chargeability data for AB = 2 km and AB = 4 km, respectively. The transmitter–receiver directions are marked at the bottom of the figure panels. TR: current injection direction. RE: receiving direction.
Remotesensing 16 00186 g006
Figure 7. Apparent resistivity and apparent chargeability data from the pole–dipole array for five transmitter electrodes: A1 (a1,b1,c1,d1); A2 (a2,b2,c2,d2); A3 (a3,b3,c3,d3); A4 (a4,b4,c4,d4); and A5 (a5,b5,c5,d5). TR: transmitter electrode. RE: receiving direction.
Remotesensing 16 00186 g007
Figure 8. 3D inversion results from the expanding gradient array. (a) 3D distribution of the resistivity; (b) 3D distribution of the chargeability; (c) 3D morphology of the low-resistivity and high-chargeability bodies. In panel c, the low-resistivity bodies (less than 225 Ω·m) are displayed in cool colors, consistent with the color bar in panel a. The high-chargeability bodies (greater than 12%) are displayed in warm colors, consistent with the color bar in panel b. Zone ①–⑦ represent resistivity anomalies.
Remotesensing 16 00186 g008
Figure 9. The inversion results of the expanding gradient array presented as a horizontal slice along the depth of 80 m, where (a) represents the resistivity and (b) represents the chargeability deep slices along z = 80 m. Zone ①–⑦ represent chargeability anomalies.
Remotesensing 16 00186 g009
Figure 10. Slices of the 3D inversion results from the expanding gradient array along line AA′. (a) Geological profile of line AA′ (after Yang et al., 2010a [39]); (b) resistivity profile; (c) chargeability profile. The section along line AA′ (magenta line) is shown in Figure 3.
Remotesensing 16 00186 g010
Figure 11. 3D inversion results from the pole–dipole array. (a) 3D distribution of the resistivity; (b) 3D distribution of the chargeability; (c) 3D morphology of the low-resistance and high-chargeability bodies. In panel c, the low-resistivity bodies (less than 225 Ω·m) are displayed in cool colors, consistent with the color bar in panel a. The high-chargeability bodies (greater than 12%) are displayed in warm colors, consistent with the color bar in panel b.
Remotesensing 16 00186 g011
Figure 12. Slices of the 3D inversion results with a pole–dipole array along line AA′. (a) Geological profile; (b) resistivity profile; (c) chargeability profile.
Remotesensing 16 00186 g012
Figure 13. Inversion results using different data combinations with an expanding gradient array. (a1) is the 3D distribution of the resistivity with the nearly N–S-trending transmitter and nearly N–S-trending receiver. (b1) is the 3D distribution of the resistivity with the nearly E–W-trending transmitter and nearly E–W-trending receiver. (c1) is a 3D resistivity model obtained by combining the data used in Figure 13a and Figure 13b for inversion. (a2), (b2) and (c2) are the slices of (a1), (b1) and (c1) along line AA′, respectively.
Remotesensing 16 00186 g013
Figure 14. Inversion results using different data combinations with the pole–dipole array. (a1) and (b1) are the resistivity inversion results of the nearly S–N-trending and E–W-trending data, respectively. (a2) and (b2) are the slices of (a1) and (b1) along line AA′, respectively.
Remotesensing 16 00186 g014
Table 1. Electrical parameters of the rock samples in the survey area.
LithologyNumberResistivity (Ω·m)Chargeability (%)
MaximumMinimumAverageMaximumMinimumAverage
Marble27215,6491147876.40.11.8
Phyllite11211,08333144347.40.11.9
Granite10338,24310339471.80.11.1
Carbonaceous marble21658411854.424.936.8
Carbonaceous phyllite1051550167992.429.868.9
Mineralized marble1666284183100.00.13.6
Mineralized phyllite1619750845391.60.18.1
Mineralized granite5315073616843.10.41.2
Hornstone476129471288458.30.10.7
Phyllitic slate1034,456348312,4178.961.265.49
Gray-black limestone1523342311963257.542.7
Pb–Zn ore100414512594.80.368.4
Disclaimer/Publisher’s Note: The statements, opinions and data contained in all publications are solely those of the individual author(s) and contributor(s) and not of MDPI and/or the editor(s). MDPI and/or the editor(s) disclaim responsibility for any injury to people or property resulting from any ideas, methods, instructions or products referred to in the content.