Article

Evaluation of Open Geotechnical Knowledge in Urban Environments for 3D Modelling of the City of Seville (Spain)

by
Cristina Soriano-Cuesta
1,
Rocío Romero-Hernández
1,
Emilio J. Mascort-Albea
1,*,
Martin Kada
2,
Andreas Fuls
2 and
Antonio Jaramillo-Morilla
1
1
Departamento de Estructuras de Edificación e Ingeniería del Terreno, Escuela Técnica Superior de Arquitectura, Instituto Universitario de Arquitectura y Ciencias de la Construcción, Universidad de Sevilla, 41012 Sevilla, Spain
2
Institut für Geodäsie und Geoinformationstechnik, Methodik der Geoinformationstechnik, Fakultät VI Planen Bauen Umwelt, Technische Universität Berlin, 10553 Berlin, Germany
*
Author to whom correspondence should be addressed.
Remote Sens. 2024, 16(1), 141; https://doi.org/10.3390/rs16010141
Submission received: 27 September 2023 / Revised: 22 December 2023 / Accepted: 26 December 2023 / Published: 28 December 2023
(This article belongs to the Special Issue New Perspectives on 3D Point Cloud II)

Abstract

:
The need for sustainable urban growth management and preventive conservation of built elements constitute the key factors in today’s increasing demand for the better understanding of subsoil. This information, mainly available from geotechnical surveys, can be integrated into spatial databases to produce operational models. Aiming to generate strategies that enable the visualisation of underground properties in highly anthropised environments, the following four-phase methodology has been proposed: (a) Gathering of geotechnical data; (b) Spatial and statistical analysis; (c) Database design; (d) Generation of 2D and 3D models. Following the aforementioned criteria and using open sources, a spatial dataset of 650 points located within the historical centre of Seville (Spain) has been developed. This urban area is characterised by the heterogeneous distribution of its soil layers and their geotechnical properties. The results show that the application of this method enables a prompt and efficient display of the distribution of geotechnical layers in urban and metropolitan environments, by considering the variations in their mechanical properties. This simplified approach therefore establishes a new starting point for the development of predictive strategies based on approaches of a more complex nature that facilitate the analysis of the interactions between subsoil, buildings, and infrastructures.

1. Introduction

Due to the current circumstances of uncontrolled urban growth and climatic emergency [1,2], the demand for a more accurate understanding of underground reality in urban environments has become a major challenge [3]. Not only does this challenge require the provision of useful tools for the design of new constructions, but it also needs to focus on certain major issues such as sustainability, metropolitan planning, and preventive conservation of built heritage.
From the perspective of sustainable land use management in urban environments, the potential of underground knowledge has yet to be exploited. This problem displays itself both on the architectural scale through the use of geothermal energies [4], and also in more extensive situations through the creation of Urban Underground Spaces (UUS) that allow the infrastructural use of subsoil [5]. Similarly, an in-depth understanding of this reality is essential for the design of new growth in favourable environments while considering environmental and anthropogenic hazards [4] such as earthquakes [6], landslides [7], and subsidence [8]. Furthermore, this information contributes to the support of preventive conservation strategies that take into account the effects of climate change [9]. Nevertheless, there are currently no global digital models of cities that enable a comprehensive analysis of both the subsoil and the urban environment.
For a better understanding of the situation underground, different methodologies are currently helping to generate new ways of visualisation through Digital Soil Modelling. Consequently, the concept of zoning is a key in this regard, as it is of great importance to know the level of accuracy of the available information and the extent of the selected working area [10]. The macrozoning concept applied to soil characterisation is based on the determination of basic geological and geotechnical units, which are essential for the operation of territorial approaches [11]. Interesting results have been achieved with these strategies through the use of information from satellites [12], Light Detection And Ranging (LIDAR), remote sensors [13], and Unmanned Aerial Vehicle (UAV) photogrammetric flights [14]. Nevertheless, such techniques are based on the determination of natural land cover and are not as effective in highly anthropised environments.
Through microzonation strategies, a more accurate underground assessment can be obtained. This level of detail enables not only a greater number of parameters and properties to be determined, but also the variation of their value ranges. In this case, the information usually comes from the use of geotechnical surveys that have a smaller territorial scope. These surveys include the use of linear inspections using specialised equipment such as Ground Penetrating Radar [15], punctual information from seismic acceleration records [16], in situ resistance tests [17], and data from samples collected in pits and boreholes [18]. This type of approach is even more necessary in urban areas, where the complexity of the layers of existing land information is very high [19]. However, the main problem resides in the need for a large number of surveys to reach urban extensions, the heterogeneity of the data collected, and the need for interpolation methods to complete the gaps in information.

Geostatistical Interpolation and Digital Soil Modelling

Among the various interpolation methods provided by traditional geostatistics, the Kriging method is one of the main references in the field of research. From the Ordinary Kriging (OK) formulation, numerous variants have been derived, including Simple Kriging (SK), Universal Kriging (UK), Fixed Rank Kriging, and Inverse Distance Weight (IDW) [20]. Consequently, a review of the scientific literature allows us to state that the OK, SK, and IDW methods have been the most commonly used for the development of interpolation related to the configuration of subsurface models [4,7,21,22].
In recent years, the development of new algorithms based on the use of Artificial Intelligence (AI) has triggered a new evolution in possibilities related to data interpolation. In terms of Digital Soil Modelling, the most common are Multiple Linear Regression (MLR), Support Vector Machine (SVR), Random Forest (RF), Gaussian Process Regression (GPR), and Artificial Neural Network (ANN), among others [23]. Likewise, the main applications to subsurface knowledge are related to parameter estimation, uncertainty assessment, and crop yield prediction [19]. In this way, the possibilities of AI are undeniable, not only for data interpolation, but also for the generation of predictive strategies and decision making [24]
For this reason, many researchers today strive to generate 3D models that, by means of complex interpolation strategies, attempt to overcome the uncertainties involved in understanding the situation underground. [25]. These models can complement traditional 2D cartographies and facilitate the visualisation of a generally unknown reality. Unfortunately, the availability of geotechnical information on urban areas is often unorganised, heterogeneous, scattered, and fragmented. Thus, there is still a need for strategies to enable the management of and access to this essential information. To this end, the design of spatial databases presents a challenge in addressing this issue.
This investigation assumes the relevance and innovation of this type of strategy to create proposals of a more exhaustive and complete nature for the subsoil of cities, which, due to their extension, leads to the achievement of acceptable results with a limited number of points. Therefore, this article focuses on the central area of Seville, a Spanish city of 750,000 inhabitants located in the southwest of Andalusia [26], with a heterogeneous distribution of soil layers and variable geotechnical properties, and proposes a methodology that can be easily replicated in other cities.
The main goal of this research involves the automatic modelling of the most important subsoil characteristics in historical urban areas, based on microzoning strategies using open data at a high level of detail. This paper is therefore divided into a presentation of the interest and characteristics of the study area (Section 2), a detailed development of the proposed methodology (Section 3), and a comprehensive geostatistical interpretation of the results obtained (Section 4). Finally, the main conclusions are detailed, as are future research lines (Section 5).

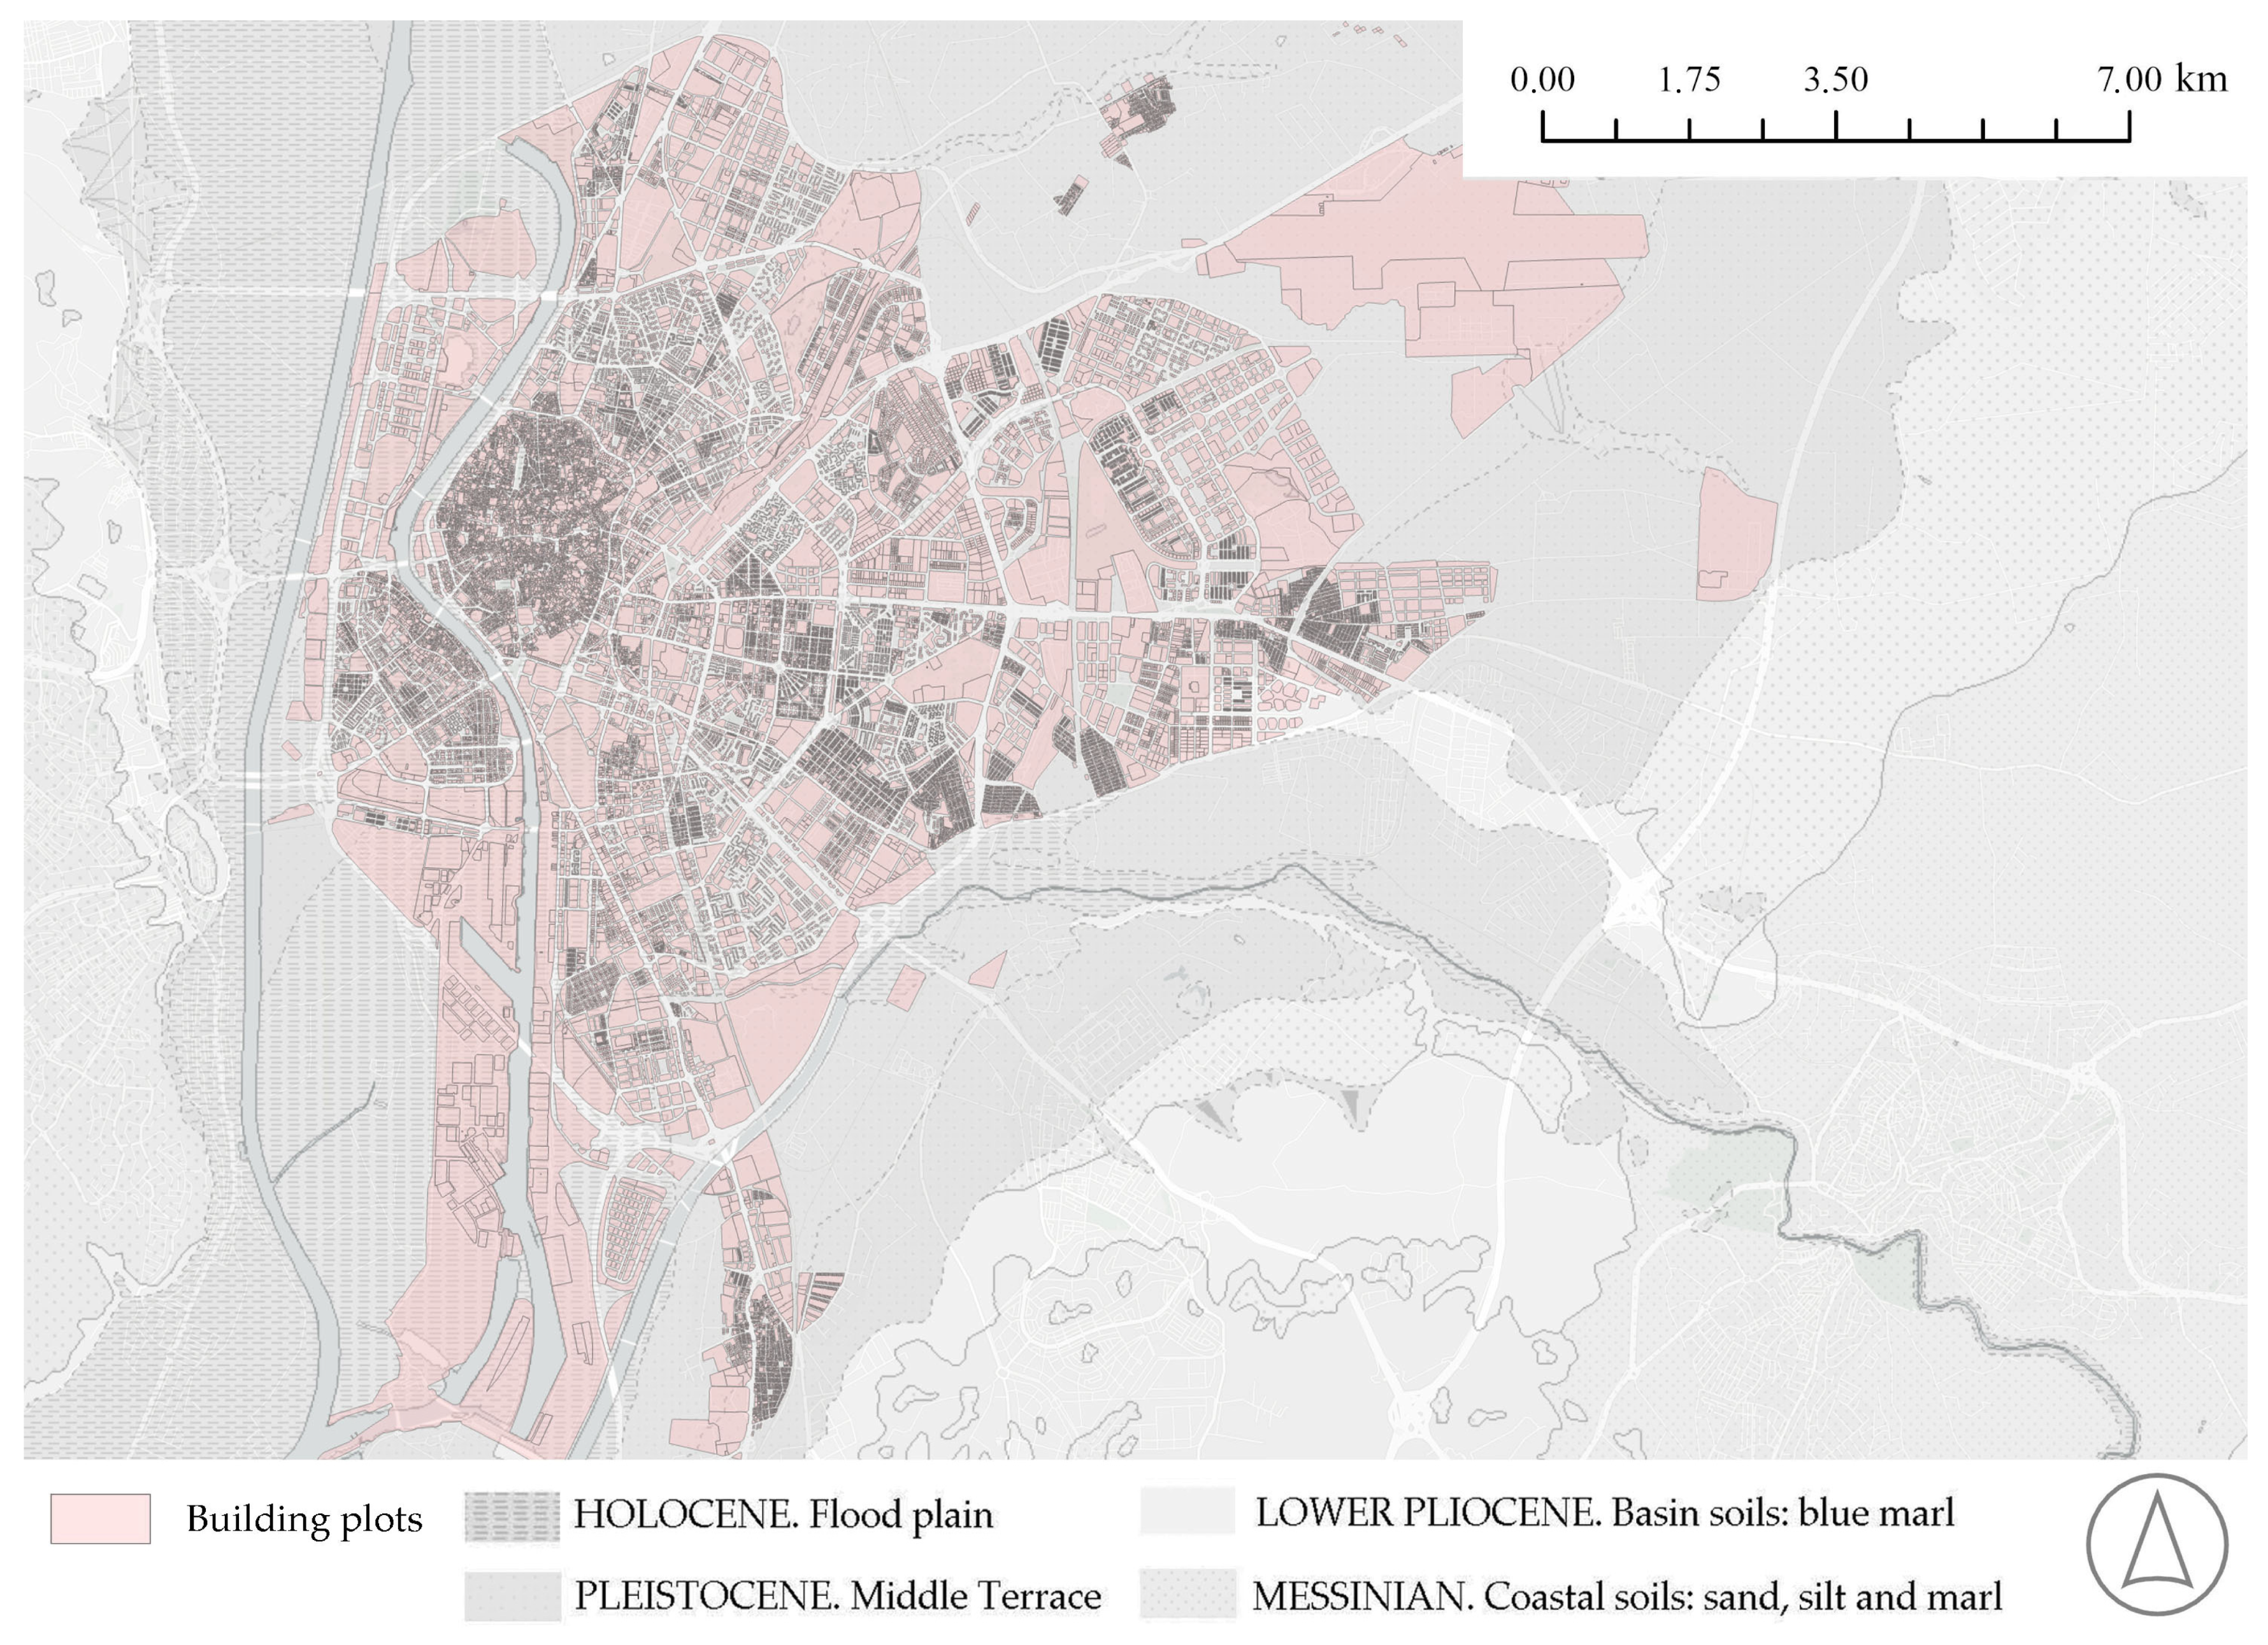
2. Case Study: Seville

Seville is Spain’s fourth-largest metropolitan city, the capital of the Andalusian region, and is located on the lower course of the Guadalquivir River with the following geographical coordinates: 37°23′24″N, 5°59′24″W. At the environmental level, it is the largest city close to Doñana National Park, a UNESCO Biosphere Reserve since 1980 [27]. The city covers an area of 140.80 km2, at an average height above sea level of 7 metres and a flat topography generally characterised by the following environmental hazards: seismic events [28], flooding [29], expansive strata layers, subsidence [30], and subsoil contamination [31]. The city is also acknowledged for its built heritage, and hosts a UNESCO World Heritage Site [32] and significant archaeological remains [33]. The current development of new metro lines also deserves mention—all this with the background of the geotechnical problems experienced in the city during the construction of Metro Line 1 in the first decade of the 20th century [34].

Soil Properties

The general geology of the urban area of Seville and its surroundings is based on Neogene and Quaternary sediments typical of the Guadalquivir Basin (Figure 1): mainly clays, silts, sands, gravels, and marly clay strata [35], although small areas exist where these layers of soil alternate or even disappear. These alterations are due to the variability of the subsoil, and in some cases were caused by artificial transformations of the course of the Guadalquivir River, which has always flowed through the city as the only navigable river in Spain since its origins [36]. Consequently, the presence of groundwater is very close to the surface, which constitutes another key factor to be taken into account.
On the basis of these general properties, a compilation of the published studies that have characterised the subsoil of the city of Seville was made. Table 1 displays the dates of the investigations, the number and type of records used, their level of detail, and the main parameters recorded. Furthermore, comparative analysis shows that research covering a larger urban working area establishes fewer spatial units to characterise the reality of the city’s subsoil. The number of proposed units increases proportionally to the level of detail and the amount of data analysed [35,37,38]. The heterogeneity of the geotechnical strata is accentuated by the incorporation of urban factors such as archaeological pre-existences, the presence of large tree roots, and underground infrastructures.
As a result of this comparative work, the main proposals regarding the characterisation of the properties of the layers that make up the subsoil of the city of Seville were obtained. Table 2 provides an estimate of the main properties of the Sevillian soil layers, by applying the arithmetic averages of the data obtained in the different studies. It can be seen that all studies recognise, directly or indirectly, a basic stratigraphy composed of the five main geotechnical units listed in Table 2. The strata have been characterised with those basic parameters that enable identification of the soils. These magnitudes are appropriate for the attainment of general knowledge and can be completed with the knowledge of other mechanical, chemical, and physical properties.
Due to the different locations of the points, the data specified in Table 2 show major heterogeneity in the criteria for the selection of the magnitudes, in the values related to the properties, and in their ranges of variation. This dispersion can be related to the different disciplinary objectives pursued by each study and may reveal the most common reality in urban sites. This approach to the basic soil properties of Seville reveals a highly complex geotechnical reality, which justifies the need to spatially classify the collected information in a more systematic and detailed way. The published research is highly useful and validates the hypotheses generated from the various zoning strategies developed. However, at the technological level, the following set of shortcomings can be disclosed.
  • Missed integration of global topographic levels in survey points. Supplementary information on surveys is seldom provided.
  • Absence of georeferenced coordinates in most of the surveys, lacking Universal Transverse Mercator (UTM) coordinates and geographic coordinates, and no implementation of Geographic Information Systems (GIS).
  • Limitation of 2D representations: no hypothesis for a 3D distribution of the strata has been detected.
  • Mapping hypotheses generally do not use interpolation tools, and when they do, there is a “blind” selection of the method, with no analytical reflections.
  • Lack of proposals for database structures with management purposes. Previous studies focus on the description of the properties of soil values, without providing detailed methodological considerations regarding information processing and mapping.
In order to further explore a topic of great interest, this research strives to overcome these limitations by developing a special database for the 3D integration of information using LIDAR data.

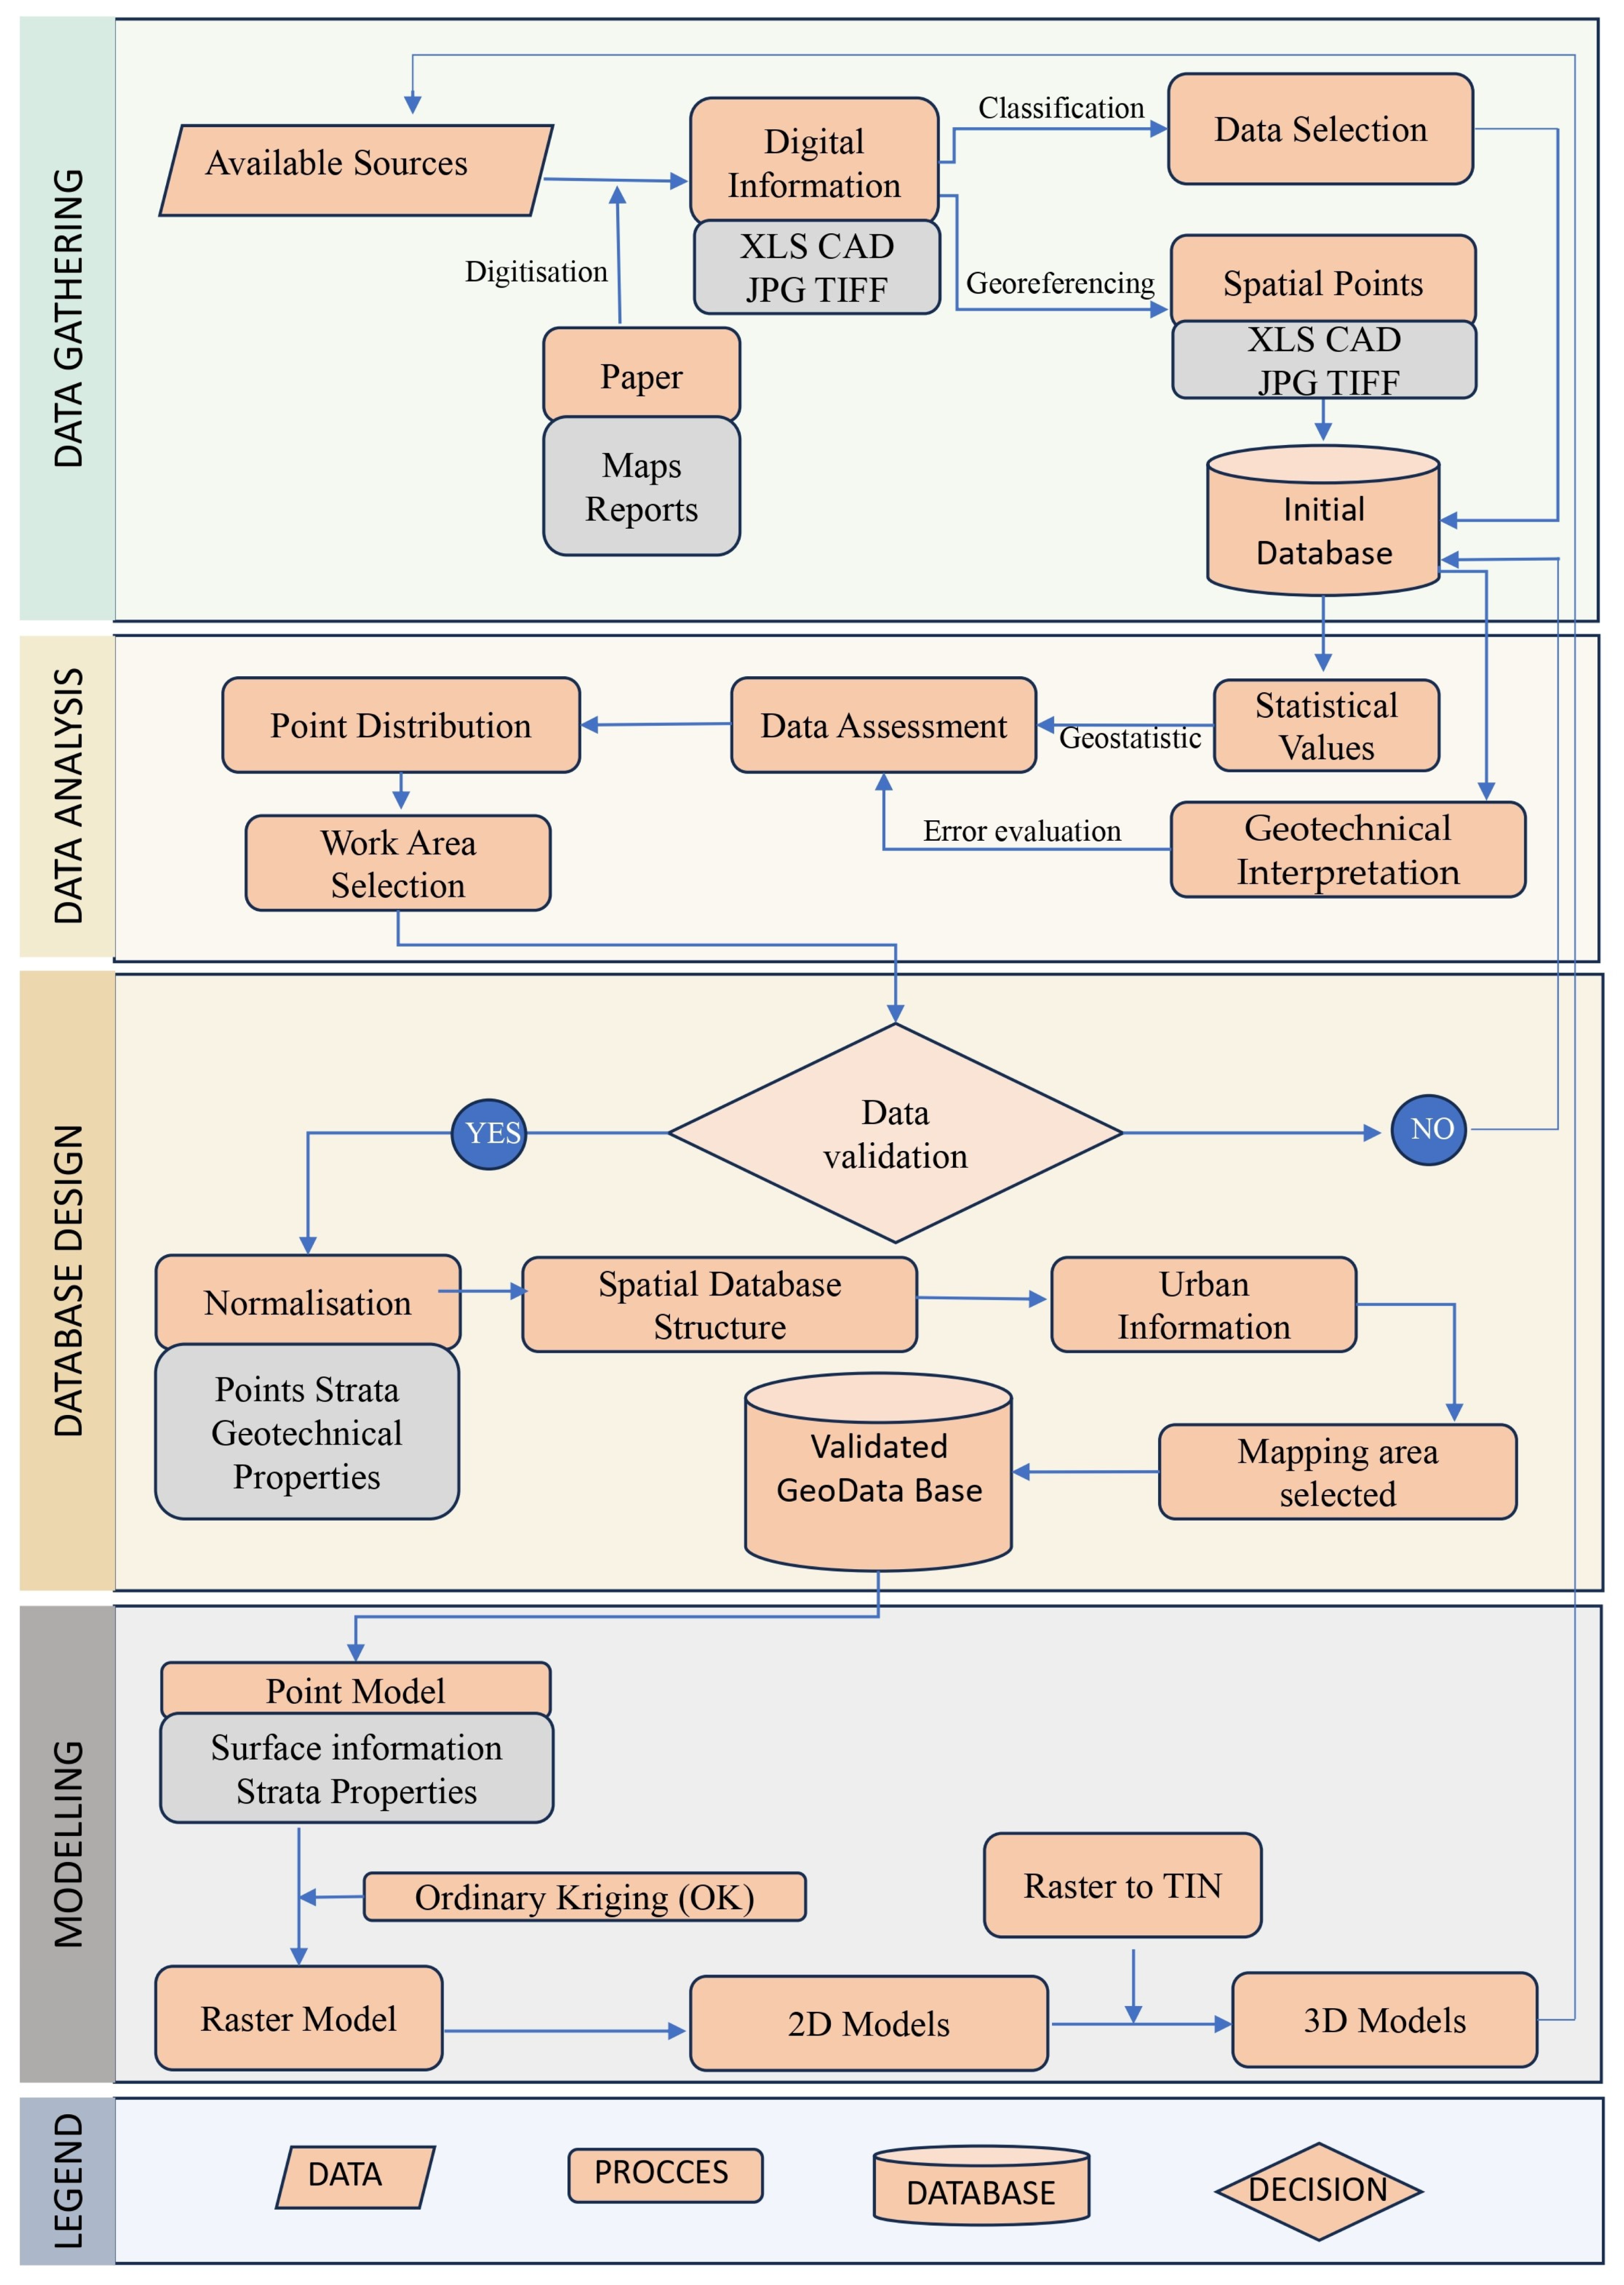
3. Geotechnical 3D Modelling for Urban Environments

This section describes the set of steps of a replicable methodology that allows the integration of geotechnical information collected in urban sites. Figure 2 shows the main phases of the design of a spatial dataset that leads to the automatic visualisation of digital models that evolve the knowledge of the urban underground.

3.1. Data Gathering

Through this phase, it has been possible to develop a comprehensive microzonation strategy by massively collecting a detailed open dataset of geotechnical information in an urban area with an extension of 140 km2.

3.1.1. Available Information

Currently, a large part of the data on the geotechnical characteristics of the Seville subsoil is not openly available. In our case study, we started with data that are accessible [38,41,43,44,46,47] and, through mathematical interpolation, we have estimated the numbers of areas with less information, with an emphasis on the importance of the task of compiling and digitising all the available information that has been developed for this research.
The data gathering process utilised the aforementioned open data through a systematic digitisation of the information that was still in print. In this way, two main digitisation processes have been carried out: (1) those relating to documentation in charts or drawing format, which can be linked as complementary information to the digitised records; and (2) the incorporation of the geotechnical parameters collected in the original documentation for their subsequent integration into the database. Through the procedures, a total of 650 records of the central area of Seville have been generated.

3.1.2. Soil Survey Location

The analysis of the information collected shows that the heterogeneity of the data is very high and is displayed through numerous formats, including summary tables, maps, model sheets, and profiles. The following considerations can be drawn from it:
  • Most of the digitised records come from studies related to architectural work (40.90%), followed in second place by those related to civil work (28.30%) and, finally, by geological (20.30%) and archaeological (10.50%) studies.
  • The date of the information collected runs in a chronological range from 1974 to 2017. However, the recent data has verified that there have been no significant alterations in the oldest points.
  • The definition of the strata has been proven in each case by test results and accredited by the researcher, technician, or company responsible for the corresponding work.

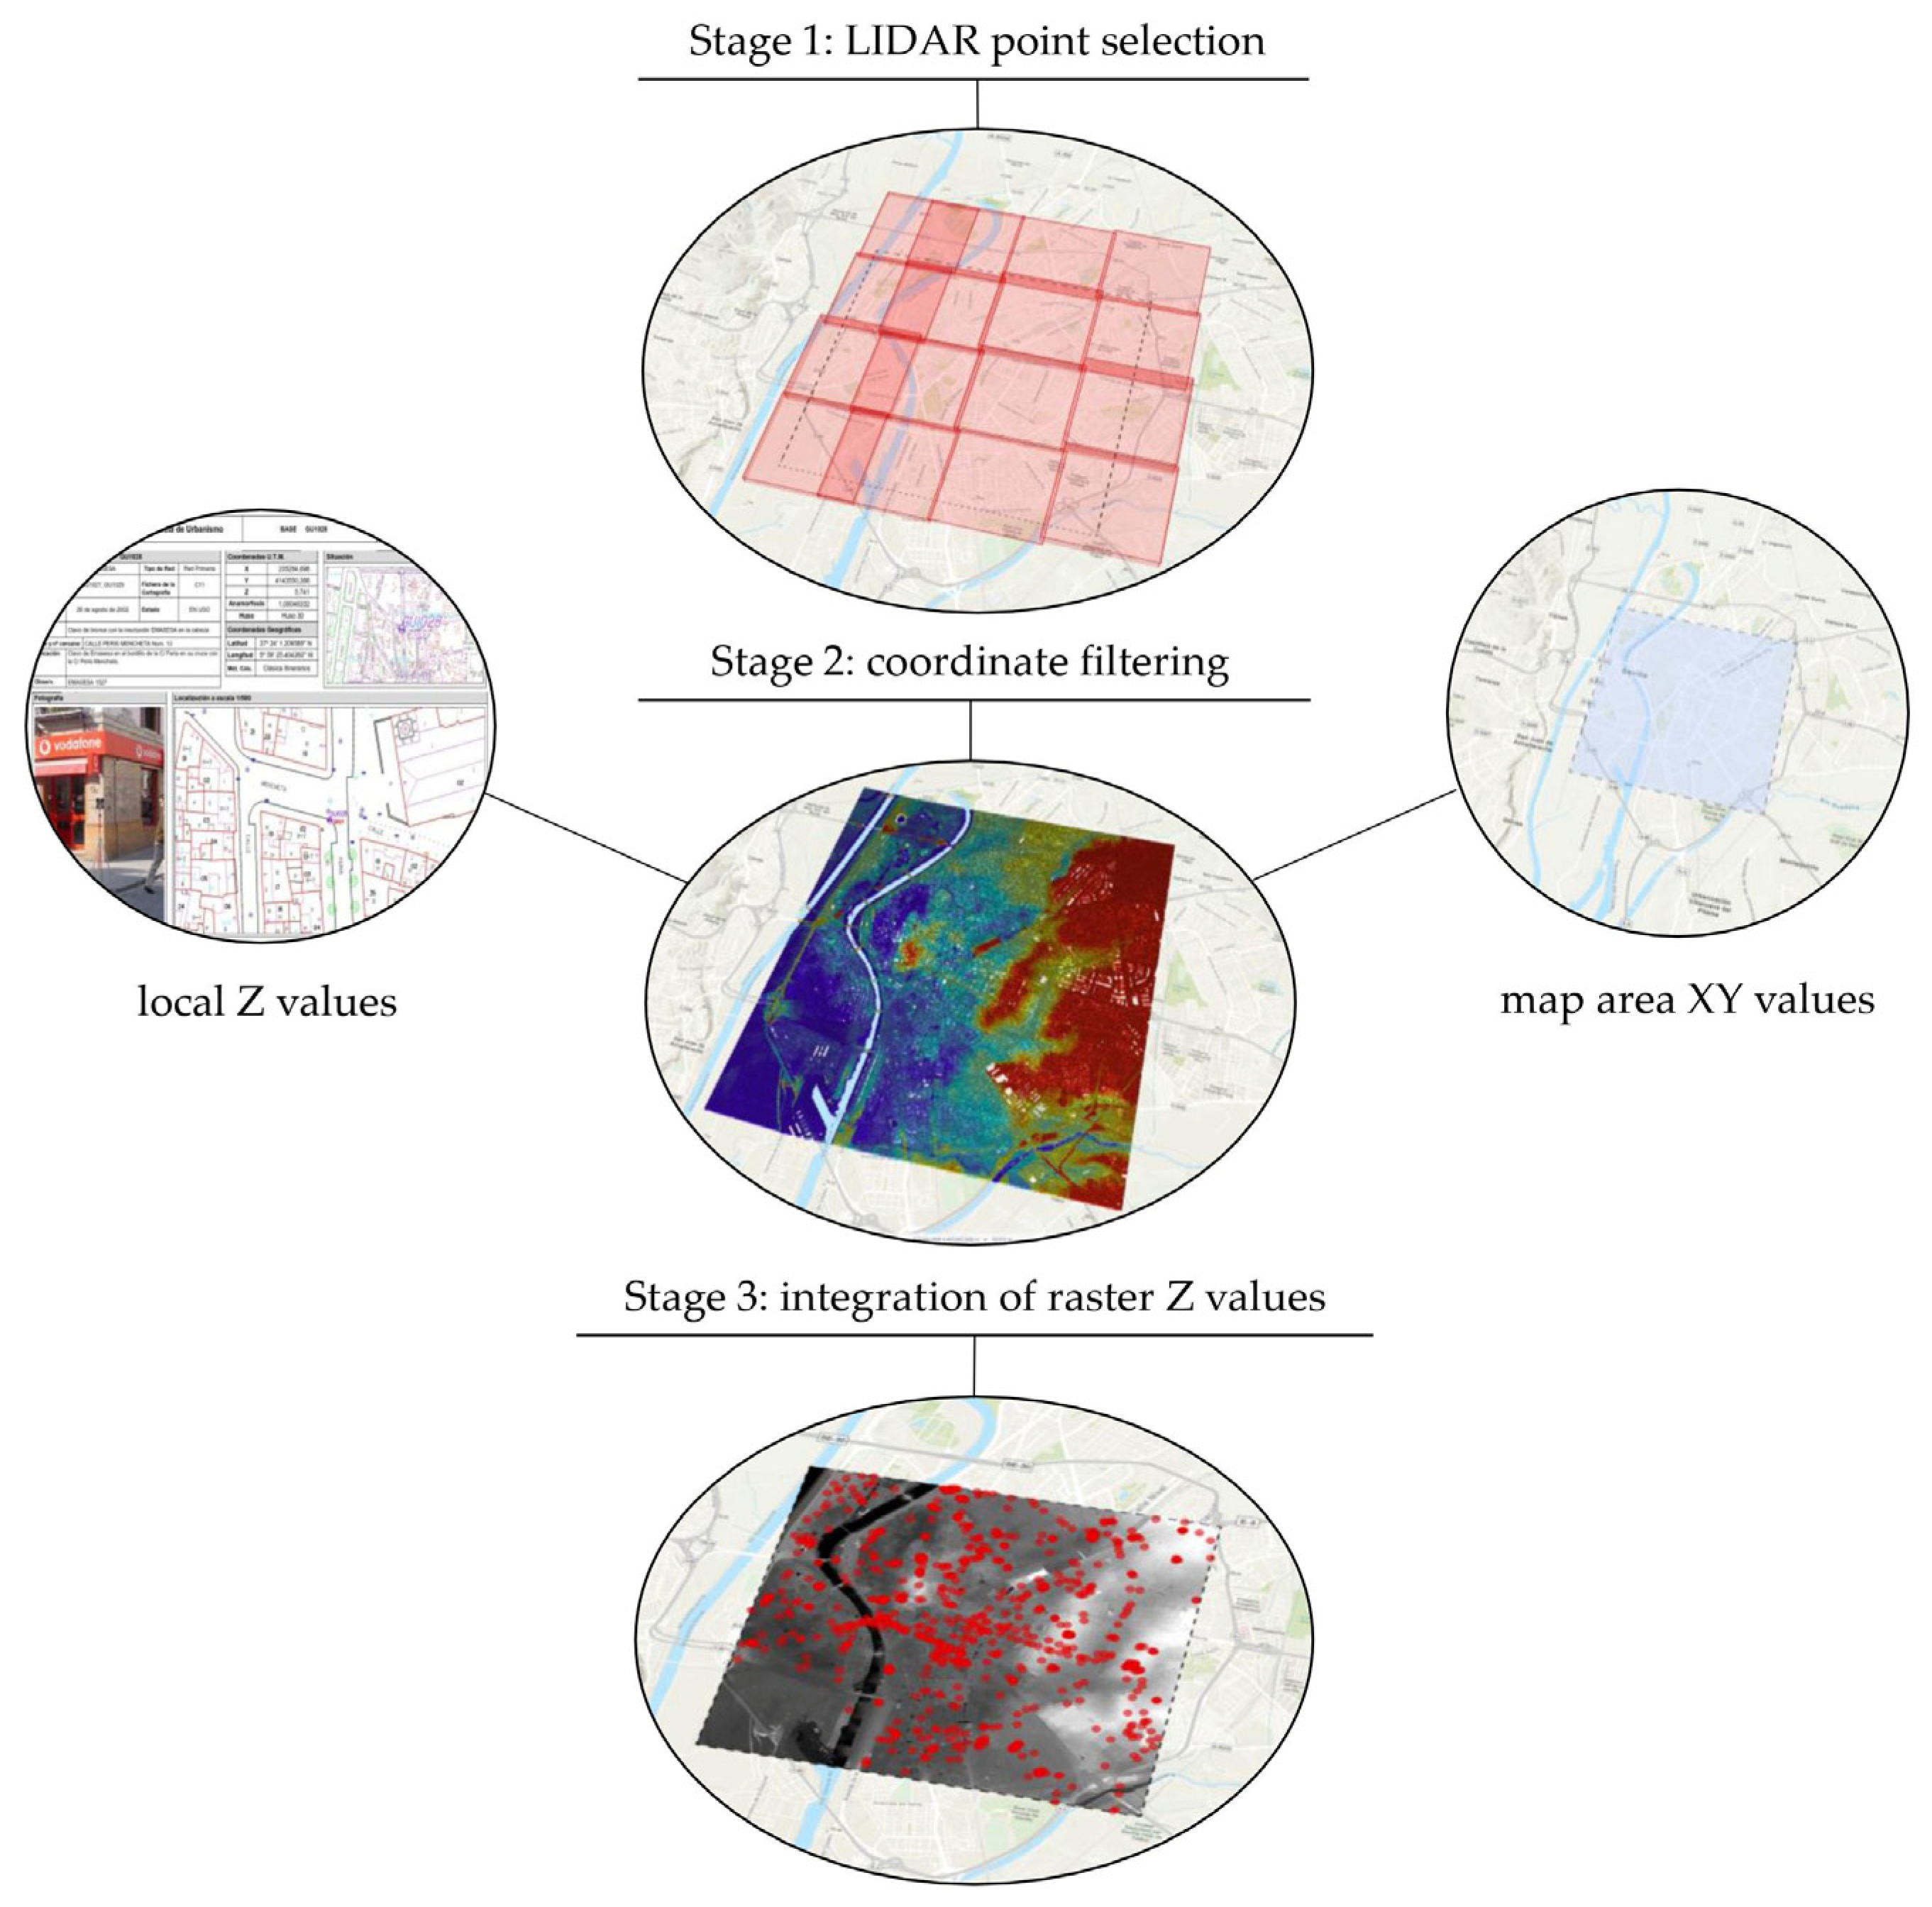
3.1.3. Georeferencing Process

Due to the lack of a proper definition of the location of a number of the points, georeferencing was necessary. It should be borne in mind that in the most favourable cases, the information on the coordinates provided for each survey was only determined by XY values and the global altimetry of each point was missing, which was subsequently incorporated into the topographic integration stage. It was therefore necessary to georeference the location maps of the points scanned in the previous stage. The quality control of the location was finally determined through the creation of specific indicators for this purpose, including the Root Mean Square Error (RMSE).
Based on these conditions, the points were created in vector format and georeferenced in accordance with the European INSPIRE directive [51], which would allow compatibility with the future publication of information in the Spatial Data Infrastructure of Seville (IDE-Sevilla). Consequently, the geodetic system adopted was the European Terrestrial Reference System 1989 (ETRS 1989), the defined coordinate system was the Universal Transverse Mercator (UTM), and the geographical area was Zone 30.

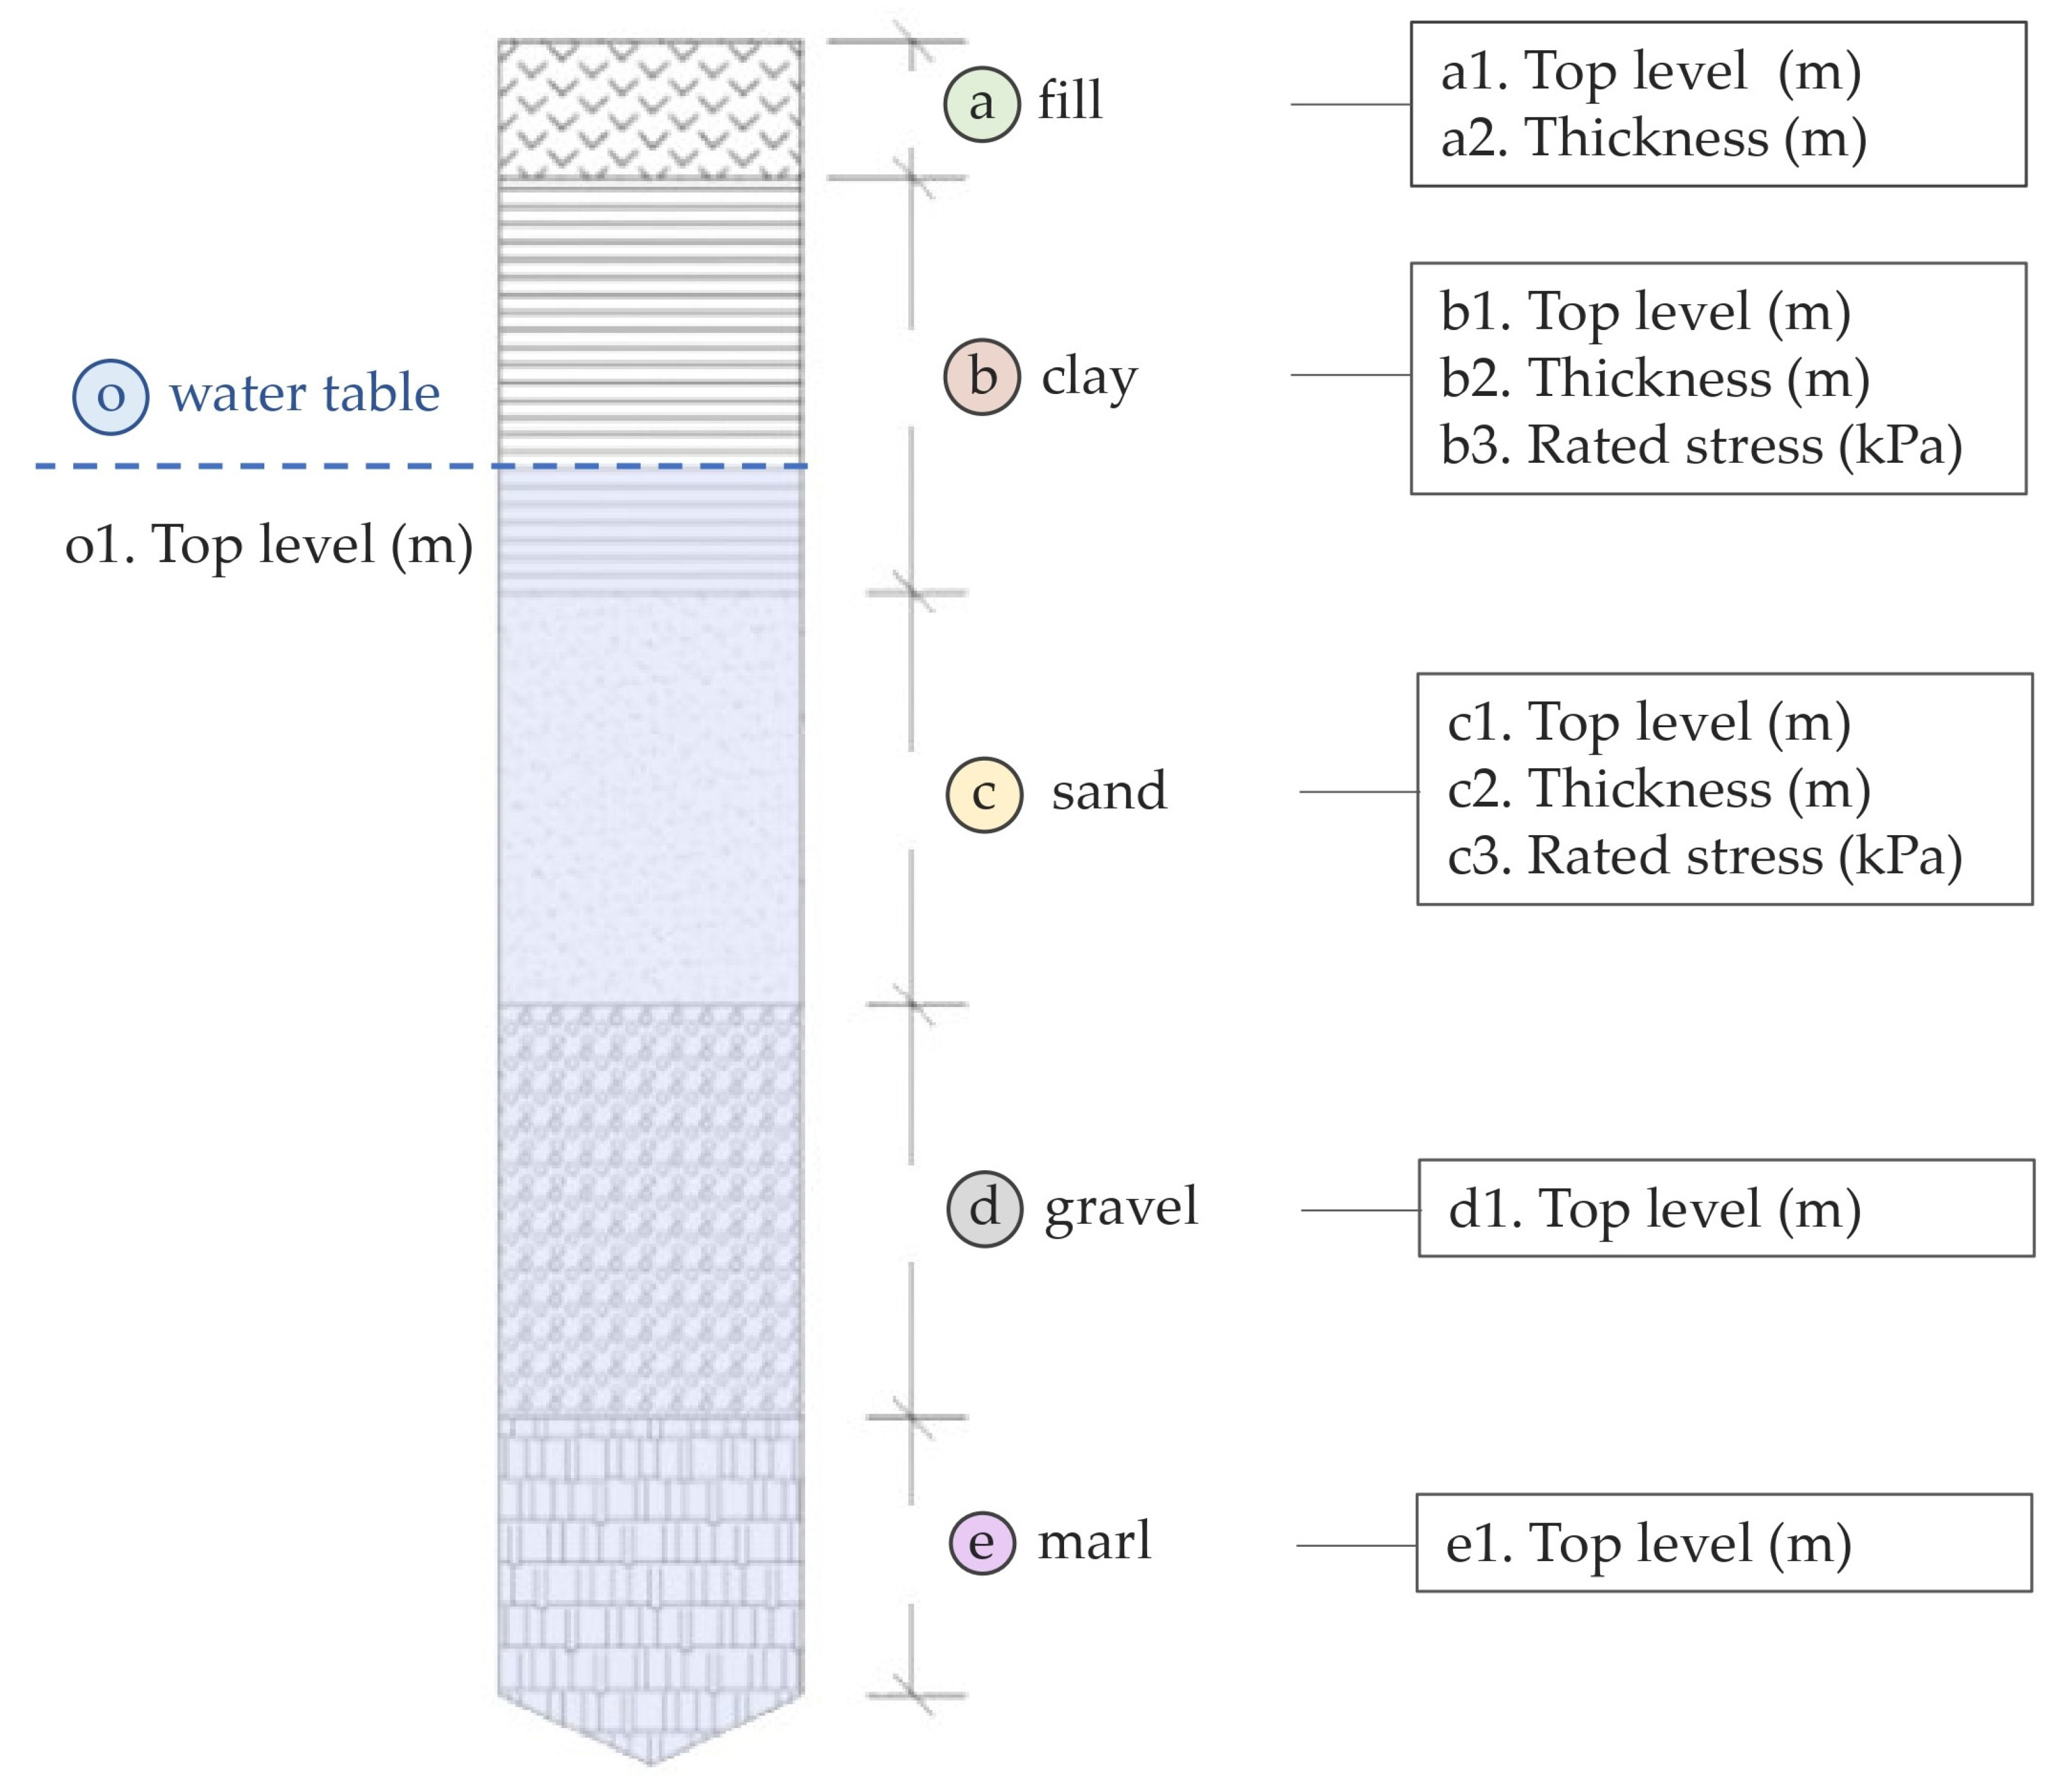
3.1.4. Parameter Selection

The parameters for the characterisation of soil properties depend on the disciplinary approach, the objectives, and the methods followed. In this case, the selection criteria were designed to provide an identification of the spatial and volumetric distribution of the main strata and their relationship to groundwater. In the same way, basic parameters related to the mechanical resistance of the shallow layers of the subsoil have been included, discarding those corresponding to the fill soil layer due to their low reliability (Figure 3).
Most of the data entered into the selected parametric fields come from the geotechnical information gathered. The only exception is the value of the top level of the fill soil layer (parameter a1, according to Figure 3), which comes from the topographical information from the LIDAR points provided by the National Aerial Orthophotography Plan (PNOA, Plan Nacional de Ortofotografía Aérea) developed by the Spanish Government [52].

3.2. Exploratory Analysis

Before designing the definitive structure of the database, preliminary spatial and statistical analyses were performed. These tasks have enabled us to assess the quality of the data collected and the possibilities of the developed information structure.

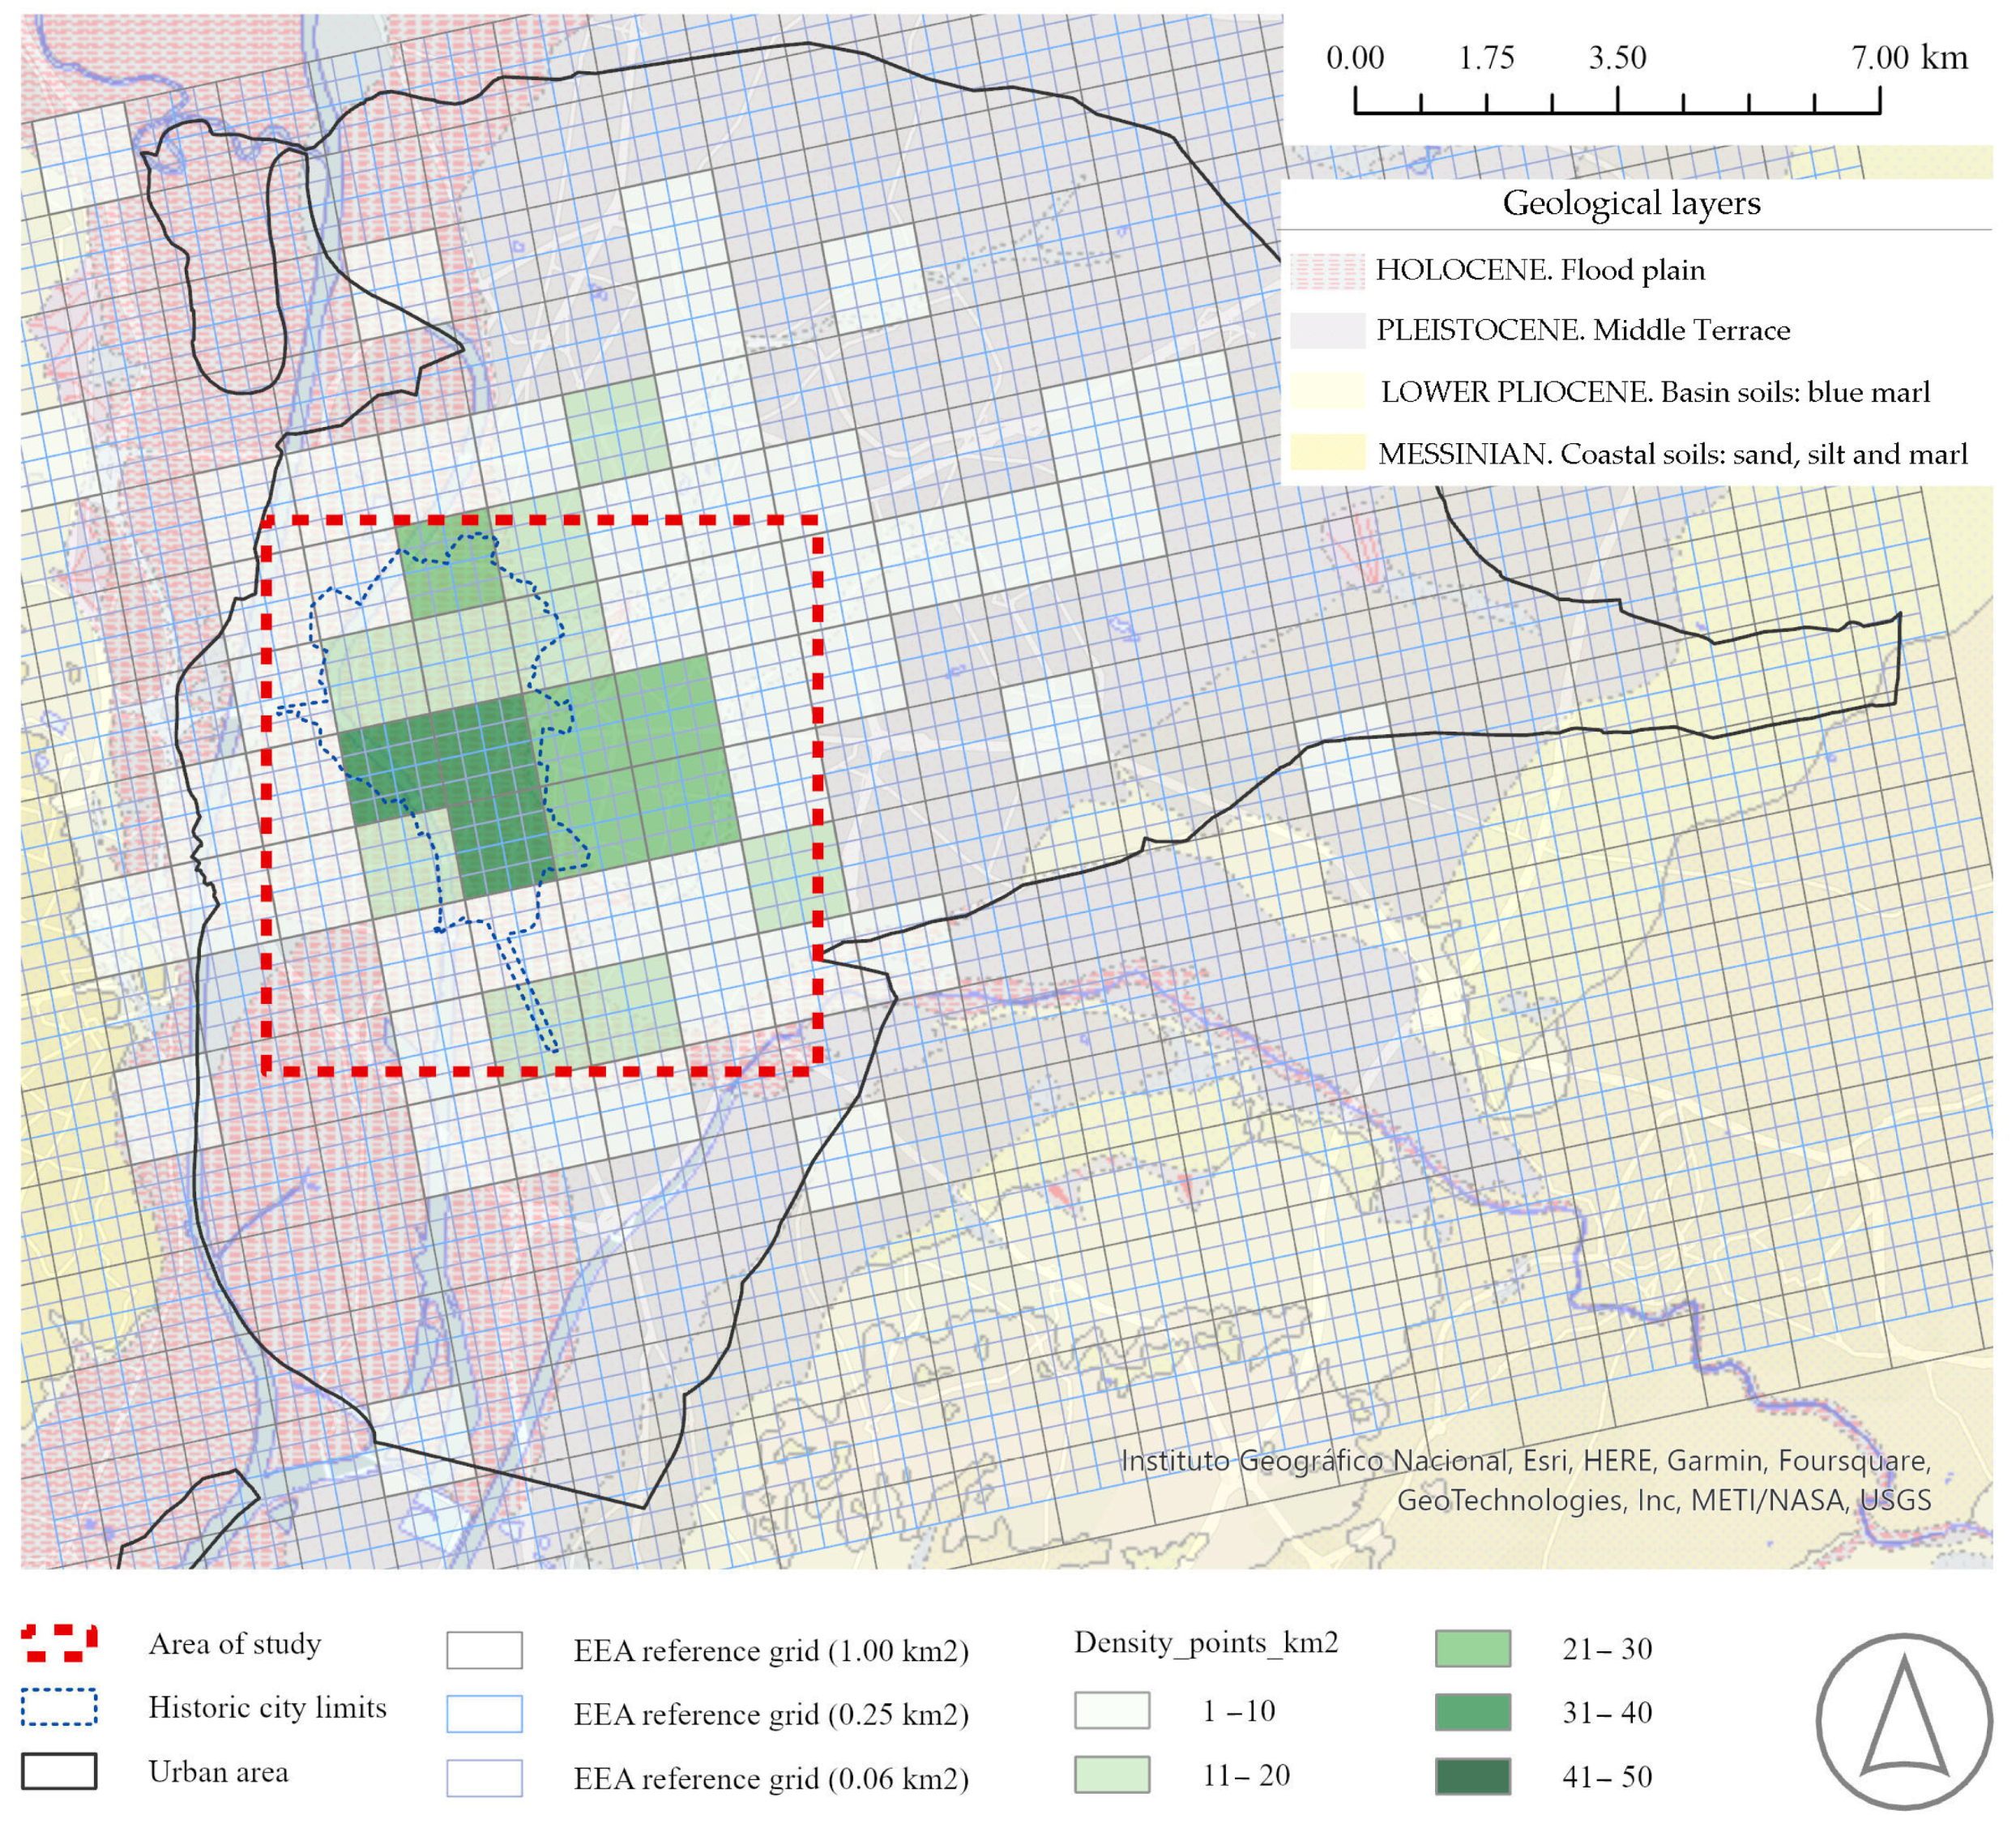
3.2.1. Point Density and Distribution

The study of the density and distribution of the survey points has validated the spatial quality of the data obtained. This process has finally allowed the selection of the mapping area, as Figure 4 shows in the next methodological step.
The density has been defined as the quotient of the number of test points divided by the area of the reference polygon considered to cover the georeferenced points. According to this approach and considering different geometric possibilities (either polygonal or rectangular in shape), a comparative density study of different mapping areas has been established (Table 3).
Complementarily, the distribution analysis displays the degree of spatial homogeneity of the information, determined through the behaviour of the coincident spatial grids. The definition of grids is usually carried out by determining the size, proportion, orientation, and extension of the comprising cells. For this case, the GEOSTAT Grid Dataset 2011 was employed to visualise the spatial distribution of the recorded points [53]. This dataset is also published and spatially filtered by the Seville City Council Spatial Data Infrastructure (IDE Sevilla), which provides various grids with squared cells that range between 0.25, 0.50, and 1.00 km in length [54].

3.2.2. Mapping Area Selection

From the evaluation of the various working hypotheses that have been characterised through density (Table 3) and spatial distribution studies, a rectangular geometry work area and 54 km2 of extension have been proposed due to the area’s representative position and orientation from north to south (Figure 4). This area comprises 650 points and takes a density value of 12.03 points/km2, which optimises the number of cells that display the maximum density values.

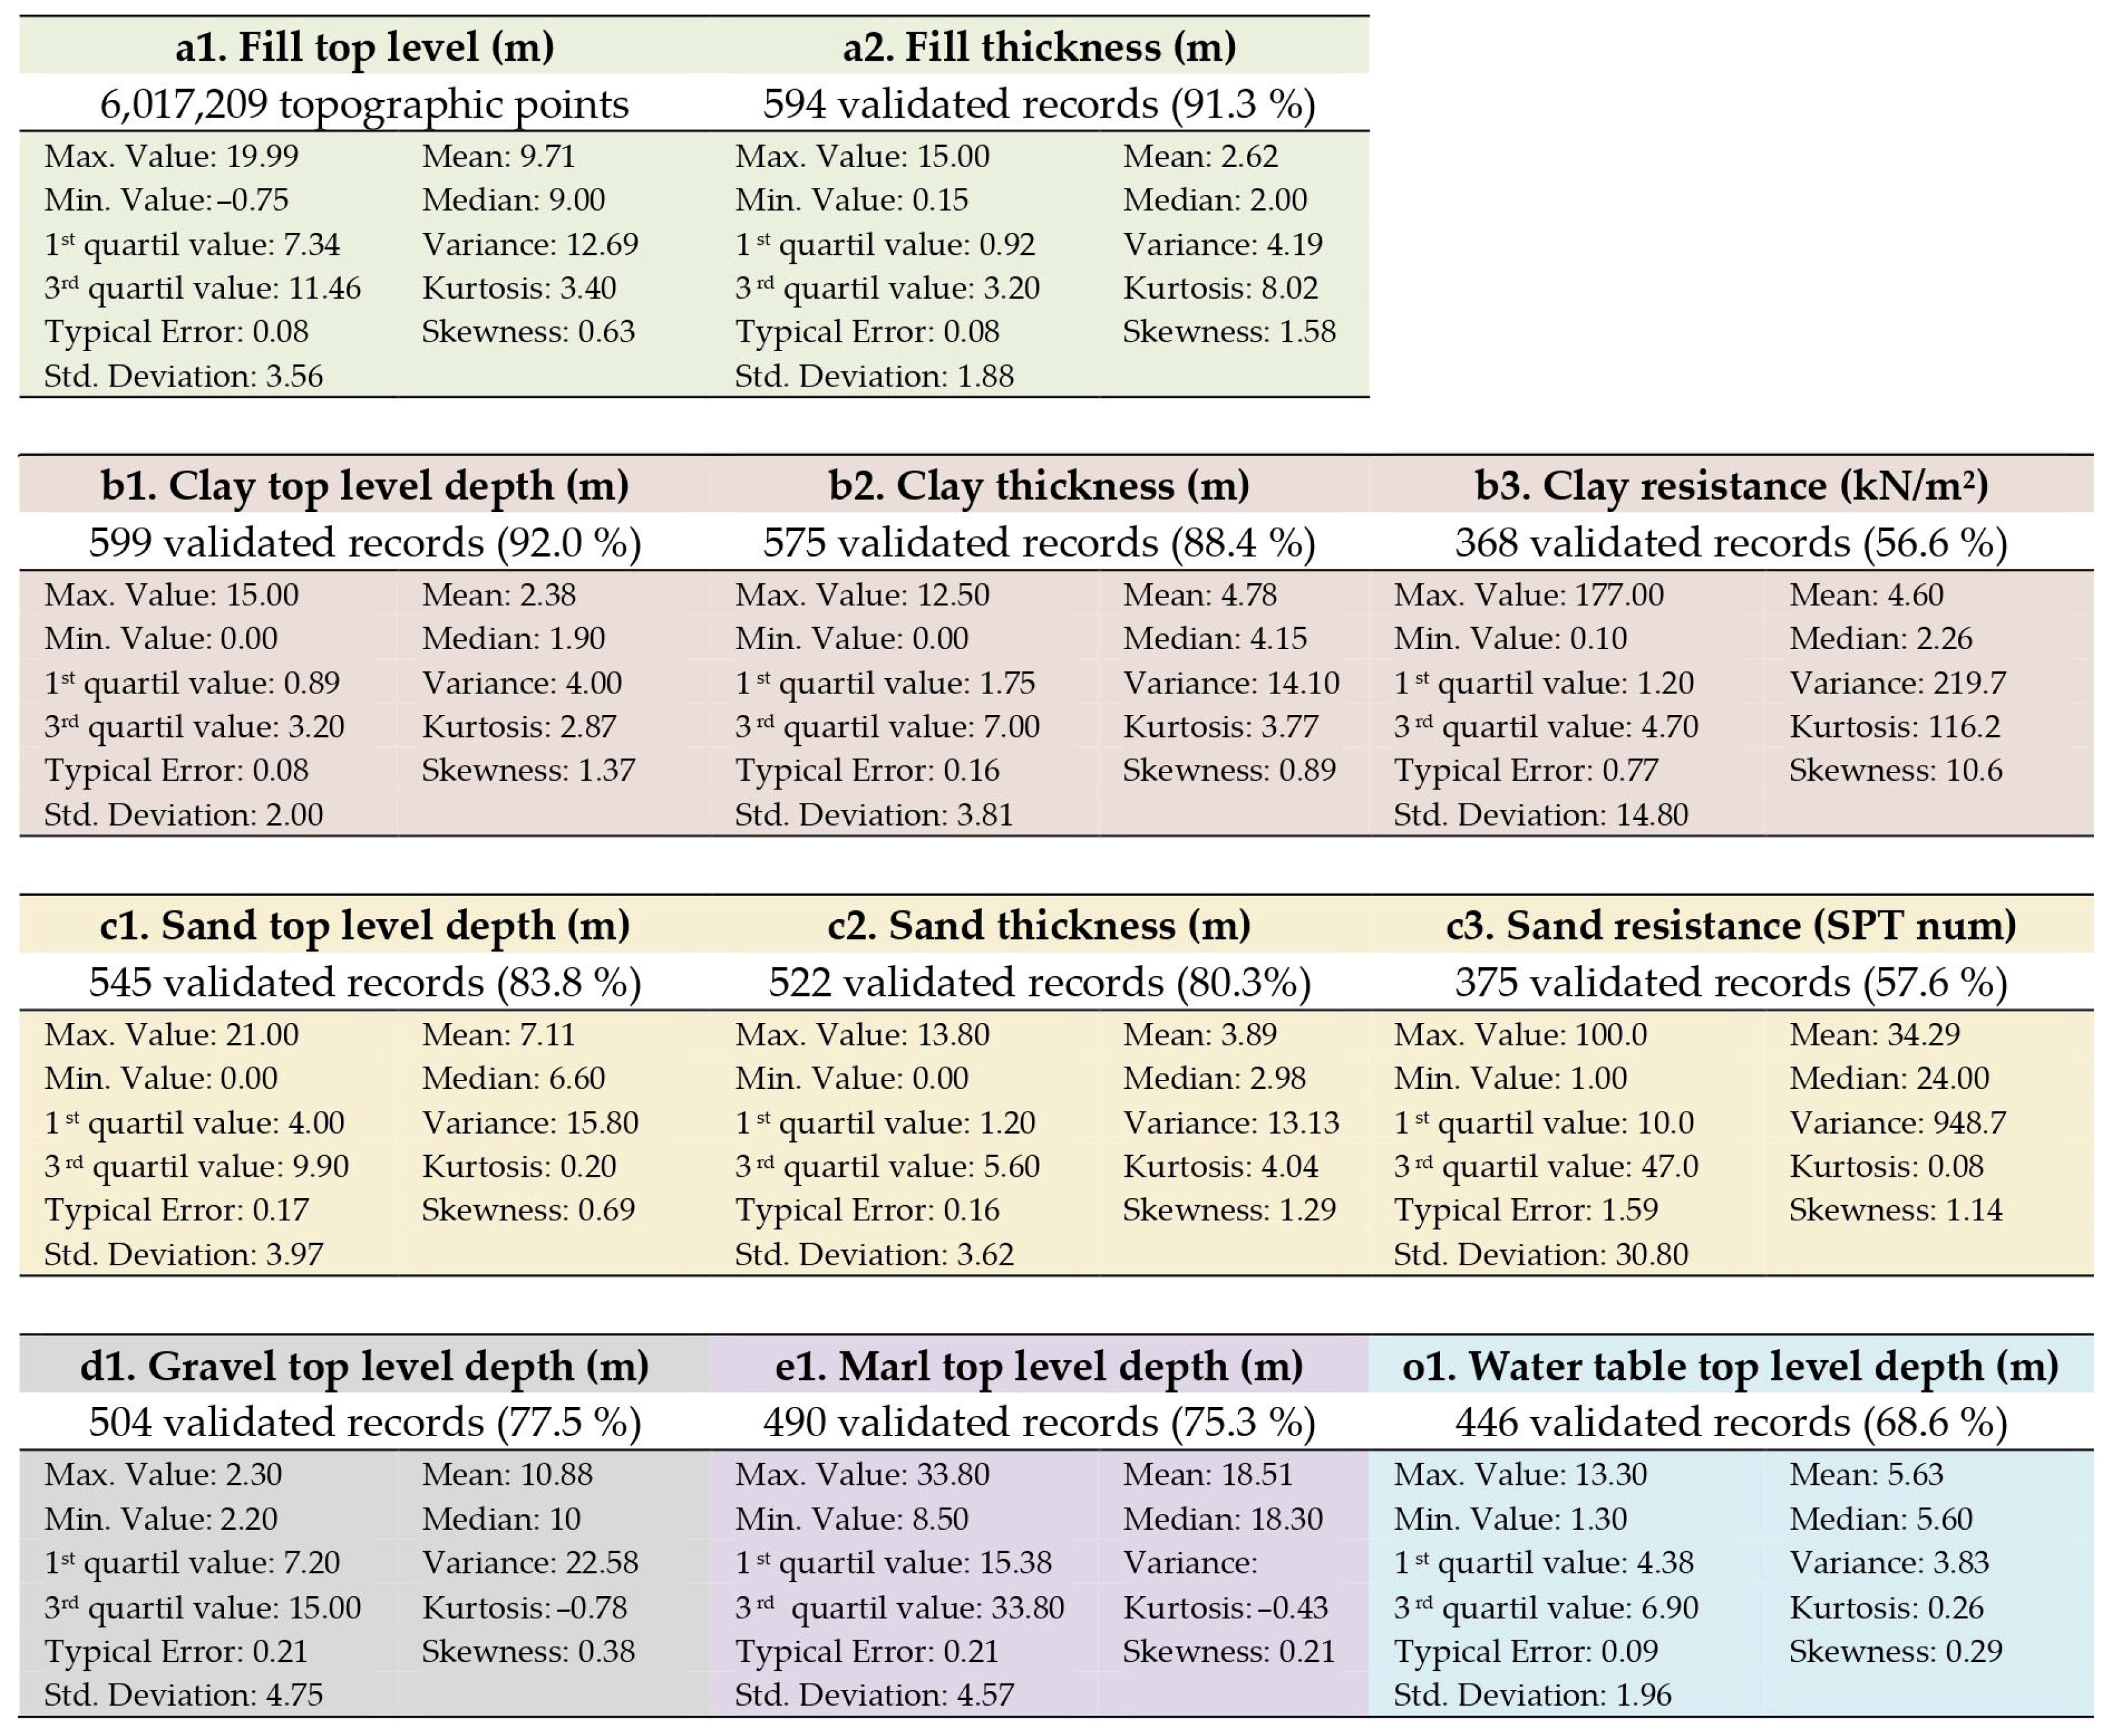
3.2.3. Statistical Values

The use of mathematical analysis of the gathered geotechnical information has led to the identification of a first set of behaviour patterns in the selected data. Through these studies, it has been possible to determine the validity not only of each of the records included in the database, but also of the distribution of the values of the recorded information.
As shown in Figure 5, the statistical characterisation of the samples has considered the maximum and minimum values, and the arithmetic means and medians. Similarly, the distribution of the records has been analysed through their grouping into quartiles and the calculation of kurtosis and skewness coefficients.
Finally, the validity of the data has been corroborated by determining the typical error values and standard deviation. Through this methodological step, anomalous and erroneous results have been removed, which has led to a definitive selection of data regarding the subsequent modelling. Gaps of information have also been detected in certain parameters, or non-existent soil layers in certain areas of the city. In this respect, it can be observed that none of the selected parameters has the full number of 650 records collected in the database. The maximum acceptance values, above 90%, correspond to the upper levels of the soil layers, while the lower values, lying below 60%, correspond to the data related to the resistance of the layers.

3.3. Database Design

This phase has included normalisation of the subsoil data selected from the available information. It strives to design a unified spatial database aimed at evaluating the geotechnical knowledge of the mapping area.

3.3.1. Normalisation

The database has been organised based on three main blocks of information that define the conditions of the study points (A), the geotechnical classification of the strata (B), and the mechanical properties of the most significant layers (C).
Block A determines the position of the survey points, as well as the date of the survey, the company in charge, and the type of work to which it is associated. Block B provides the geometric limits of the strata, through their normalised classification, the depth ceilings of their layers referenced from ground level, and their thicknesses. Block C provides complementary values related to the existence of groundwater, and the values of the strengths of the most superficial layers, defined through the simple compressive strength tests in the case of the clayey layers and the number of hits from the Standard Penetration Tests (SPT) in the case of the sandy layers. Similarly, correlation formulae have been used for the determination of these strength parameters in cases where the available information has been provided by alternative tests.

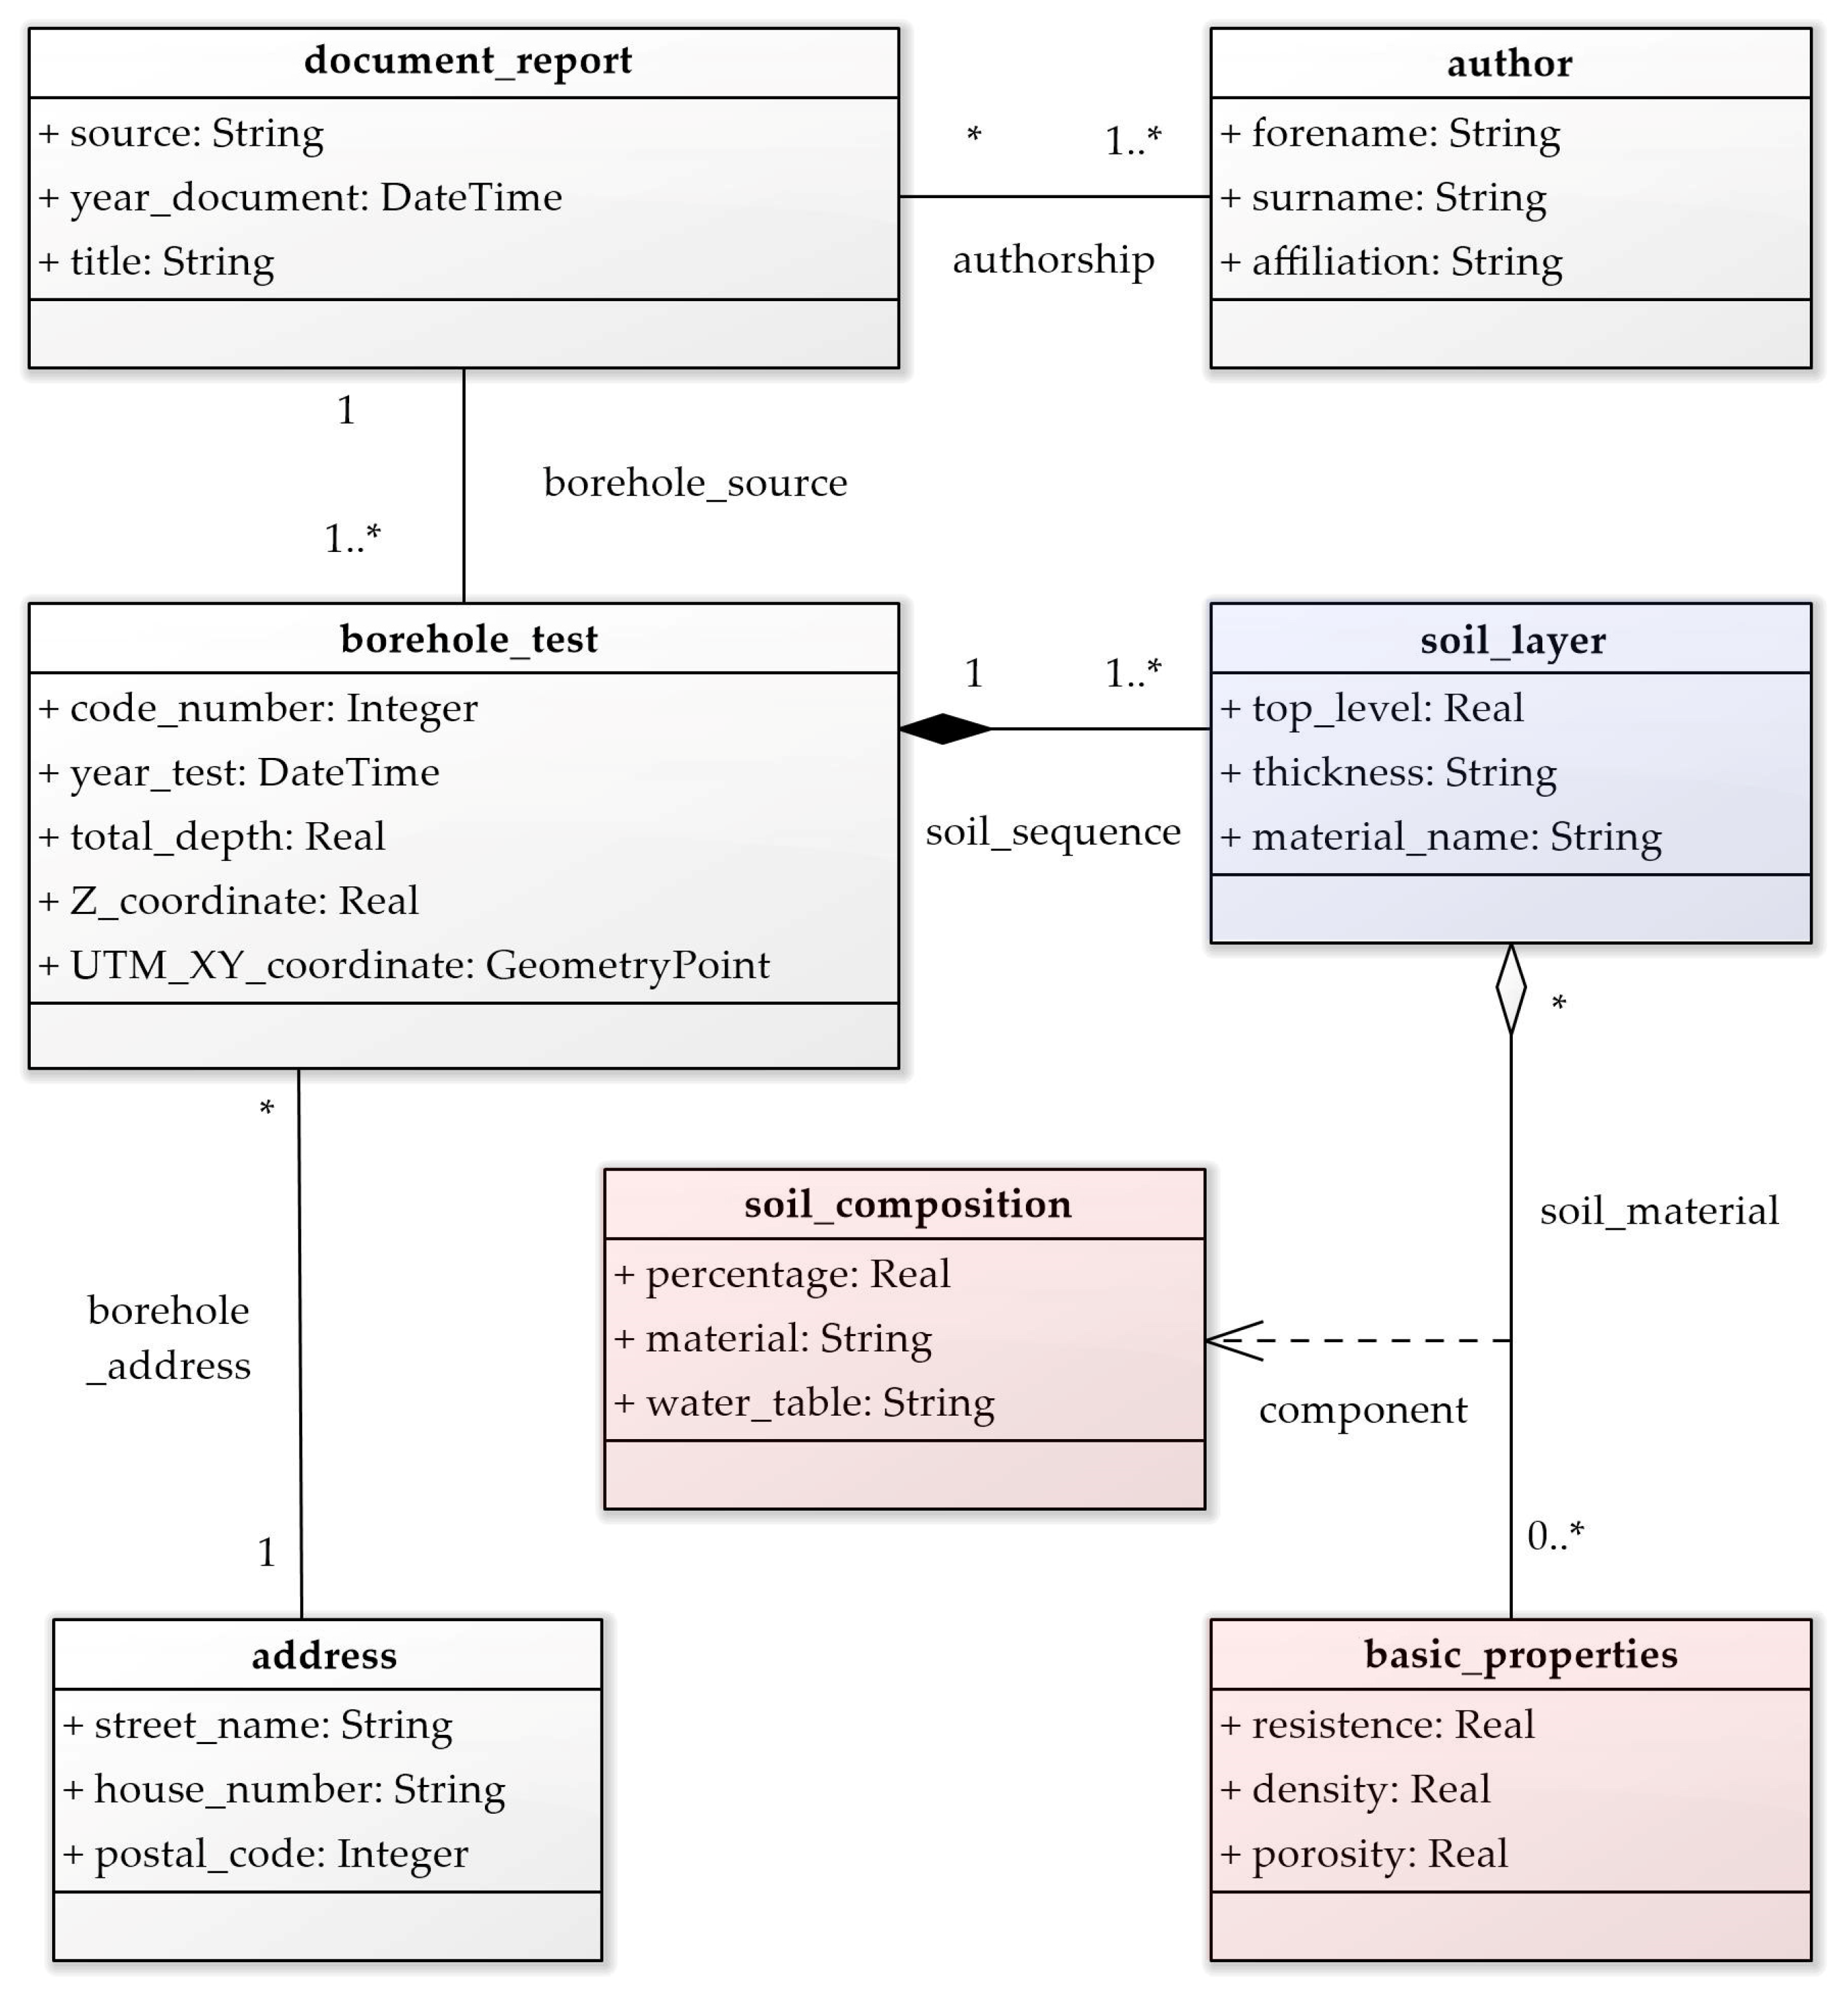
3.3.2. Database Structure

The standardisation work has made it possible to define a relational database (RDBMS) proposal that is organised based on the Unified Modelling Language (UML) class diagram shown in Figure 6. Its design is oriented to work with the basic information for the visualisation of the layers and the mechanical properties of the soil, being susceptible to future evolutions to generate more complex data flows.
Through this diagram, the main information tables have been defined, which respond to the blocks in the previous section. Likewise, the relationships between the different tables and their attributes have been established. The current proposal sets out a working basis for the incorporation of future considerations and parameters, which will allow a subject as complex as that related to the reality of the subsoil in urban and metropolitan areas to be addressed with greater scope.

3.3.3. Formats and Interoperability Processes

The fulfilment of the data has been achieved through the direct interpretation and transcription of the data from the original sources without any automation process having been applied. From there, raster and vector models have been worked with through interoperability processes that have mainly involved the use of CAD and GIS tools. Specifically, the software used was AutoCAD version 2023 and ArcGIS Pro version 3.1.1, with a campus licence from the University of Seville.

3.4. Modelling

The modelling phase involved merging thematic and spatial data, paying particular attention to the integration processes of topographic data. The resulting cartographies and 3D models, created using various interpolation techniques, can be published as interactive spatial information.

3.4.1. Topographical Integration

Given that most of the original data lack global topographic coordinates, with recorded values of 0.00 metres above ground level, the topographic integration process becomes crucial. By taking this step, a significant problem has been resolved to guarantee precise values in subsequent interpolation procedures.
The accurate surface coordinates for the database points were established on the basis of topographic data provided by the major open institutional sources. Table 4 shows a comparison of key properties, including the source, date, Geographic Coordinate System (GCS), raster cell size, total LIDAR points used in the model, and the classification system utilised for these points.
In this study, the ALOS Global Digital Surface Model [55] was considered, but did not offer the level of accuracy necessary for an urban setting. At the national level, PNOA LIDAR data were employed [52]. At the regional level, information provided by Digital Elevation Models (DEM), published by the Institute of Statistics and Cartography of Andalusia (Instituto de Estadística y Cartografía de Andalucía, IECA), has been contemplated [56]. Finally, the values of the points of the geodetic networks of the city, published by IDE Sevilla, were also used at the local level [54].
Through the process shown in Figure 7, the database points within the mapped area have been assigned global Z coordinates. The starting point is to download the LIDAR points in LAZ format, which are provided by the PNOA in Seville (Figure 7, Stage 1). During the decompression process to LAS format, the points are spatially filtered. The mapping area was employed to establish the XY coordinates, while the local geodetic information provided by IDE Sevilla verified the Z coordinates and made it possible to eliminate incorrect height values (Figure 7, Stage 2). This local geodata contain a much smaller number of points but are still strongly representative due to the high quality of the information sheets they provide. Once a filtered LAS dataset of the working area has been created, a raster file is generated and overlaid within the selected geotechnical points (Figure 7, Stage 3). This completes the topographic integration process by assigning Z values to the points through the raster.

3.4.2. D Soil Mapping and Interpolation Criteria

Once all the altimetric values of the layers from the various survey points have been organised as spatial entities, raster maps can be produced from the location and depth values of each geotechnical layer. In Figure 8, the layers selected for the 3D modelling process are displayed as flat maps, showing their depth values by means of isovalues.
In order to identify areas lacking geotechnical information, spatial interpolation has been performed using the Ordinary Kriging (OK) technique, which is currently considered the most consistent in the scientific literature regarding research [20,21,57]. The results demonstrate a geometric distribution of isovalues that align with the statistical analyses conducted in a preliminary manner.

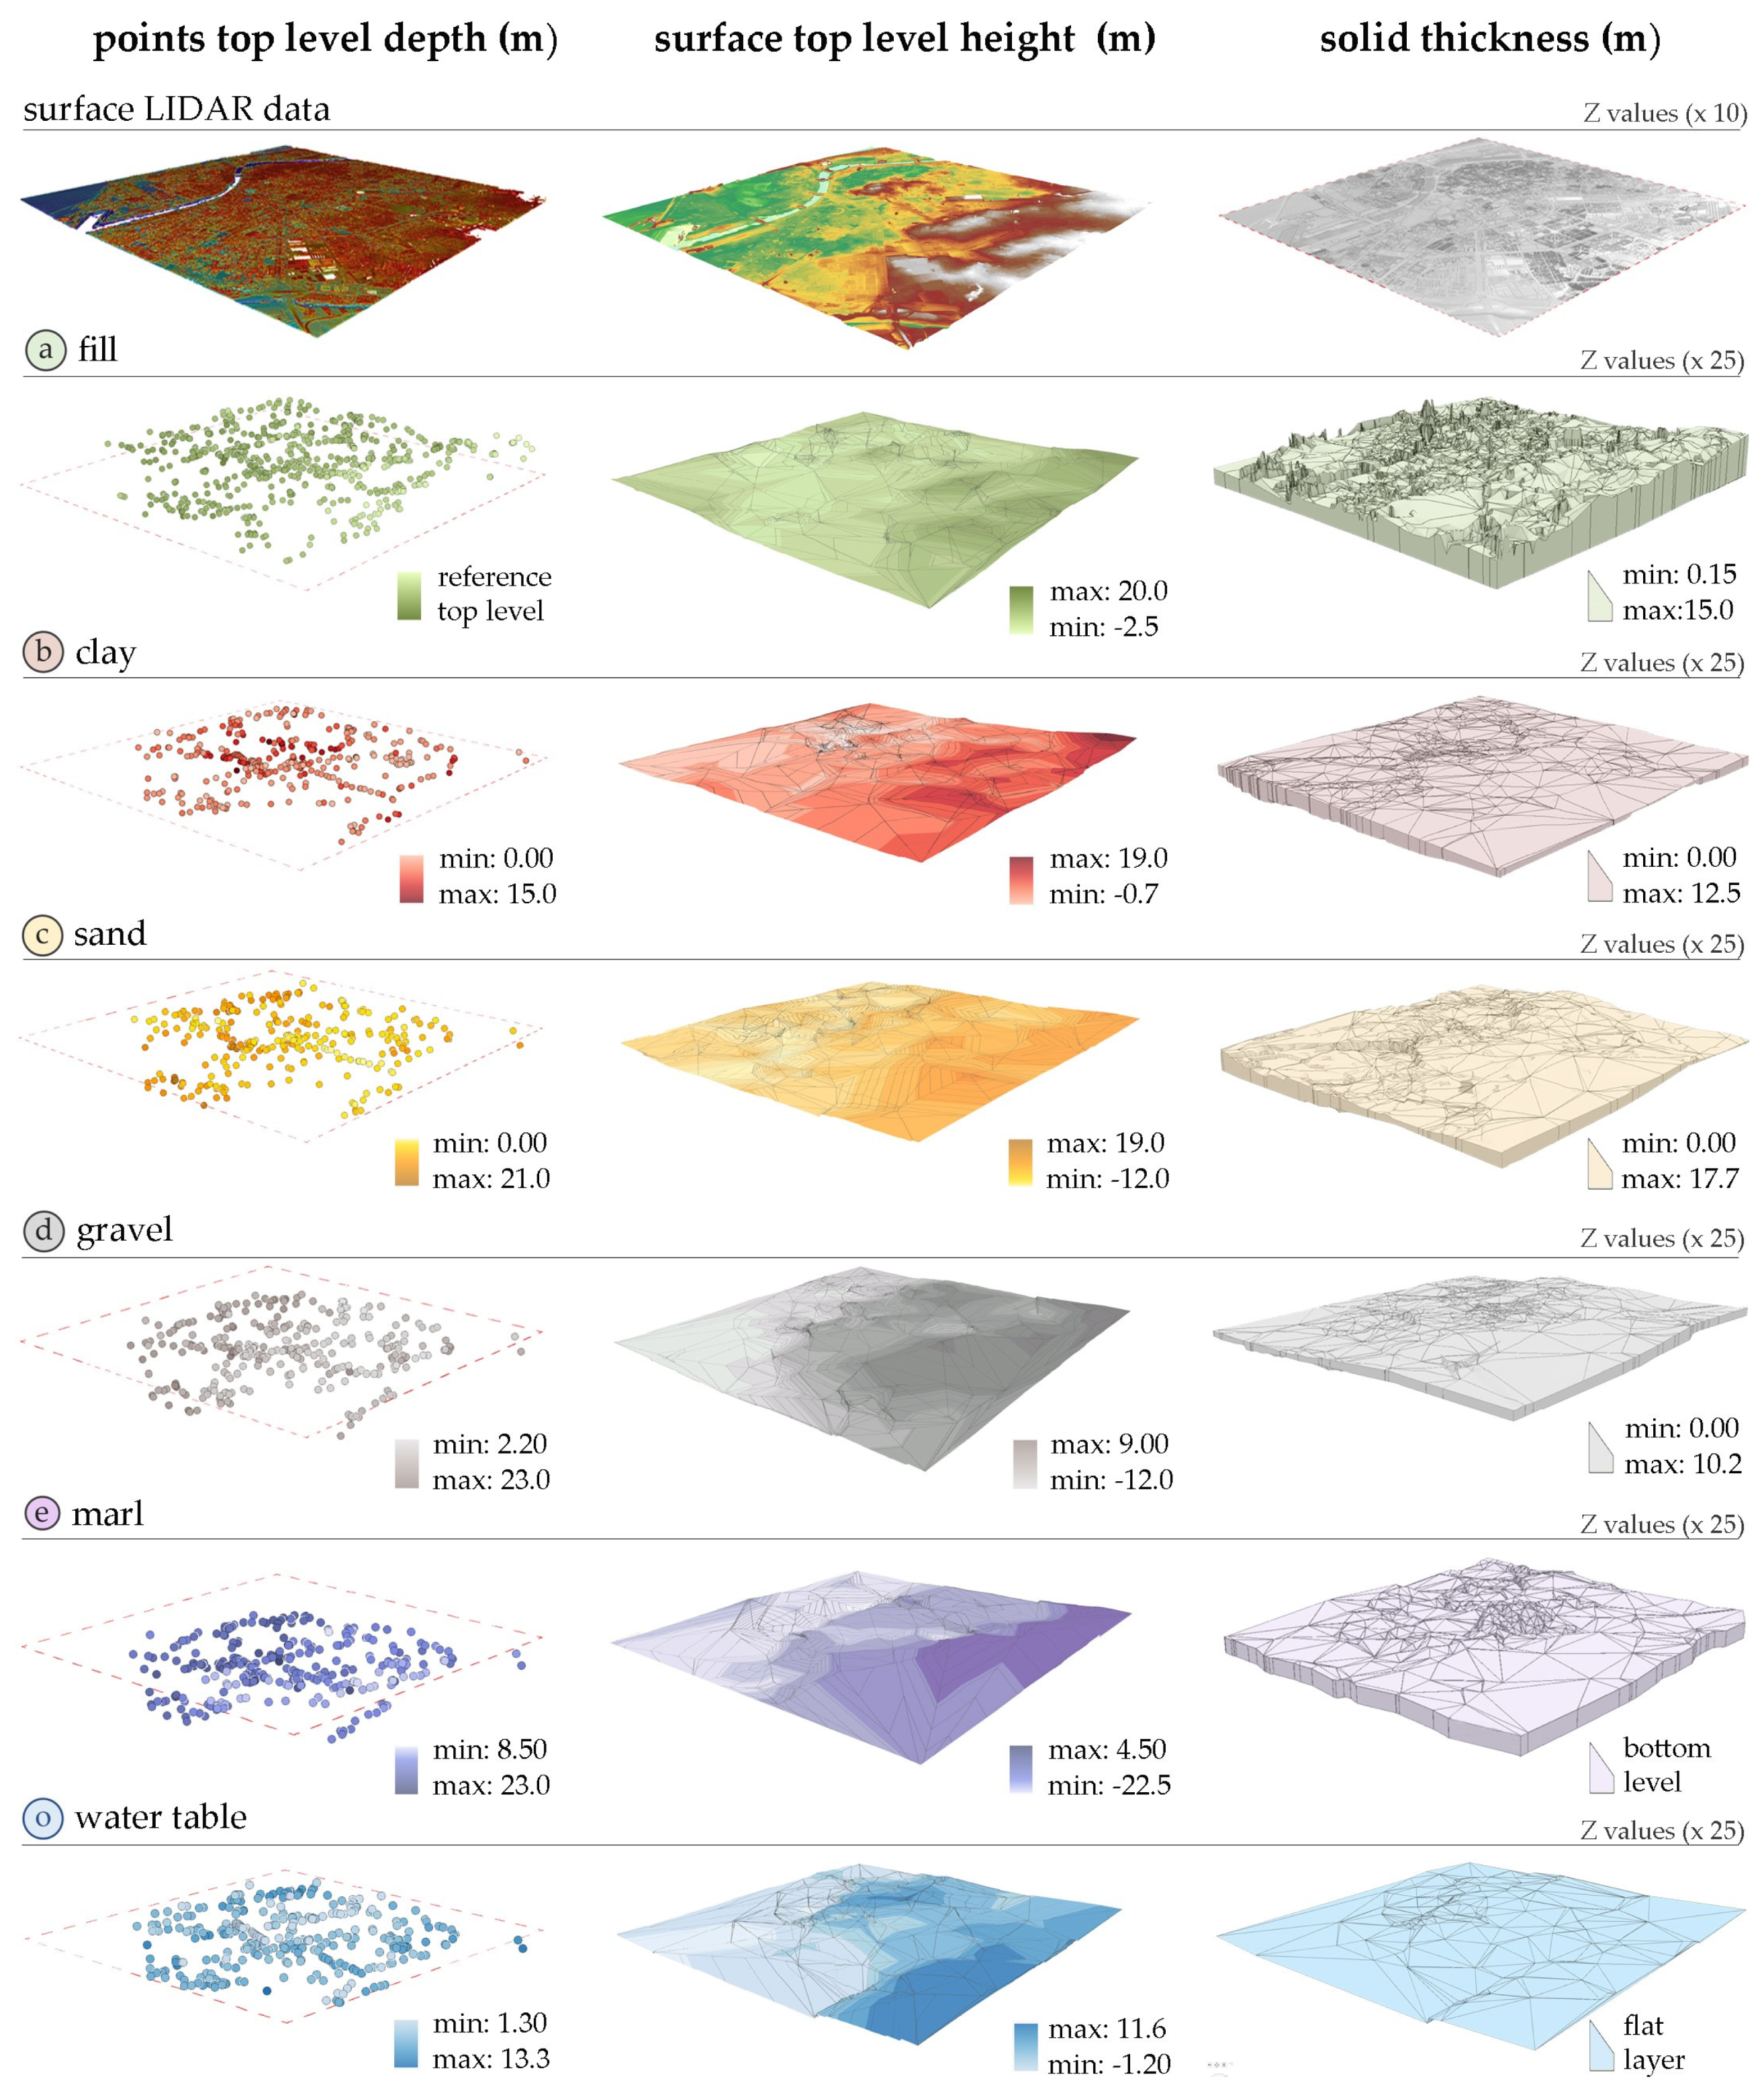
3.4.3. Geotechnical 3D Model

By converting 2D raster maps into Triangulated Irregular Networks (TIN), a 3D model of the subsoil of the city of Seville can be generated within the selected mapping area. The following geoprocesses offered by ArcGIS Pro software version 3.1 have been used to carry out this transformation: “raster to TIN” and “TIN domain”. On the one hand, Figure 9a displays the geotechnical layout of each 3D point in the model and exhibits the linear depth distribution of the boreholes. Additionally, Figure 9b shows the geometric layer distribution.
Both illustrations demonstrate how urban subsoil models have the potential to integrate the city’s topography and the footprint of its buildings in a spatial manner. Similarly, visualising the relationships between the subsoil and the surface can be achieved by producing 3D model sections using various axes and polygonal lines.

4. Discussion

From the results obtained, the following geostatistical and geotechnical interpretations can be made.

4.1. Geostatistical Interpretation

The special behaviour of the interpolation performed can be analysed from a statistical point of view by studying the error metrics. Consequently, the study of isotropic variograms has been carried out using linear, spherical, exponential, and Gaussian models. Table 5 illustrates their suitability for each of the selected working parameters.

4.2. Geotechnical Interpretation

Through the use of microzoning mapping, the heterogeneity of the city’s subsoil can be observed, where the stratigraphic cross-section varies widely from one area to another, leading in certain areas to the absence of several layers in the stratigraphic cross-section. These differences, on a territorial scale, cannot be noticed or taken into consideration, since they are not displayed on the cartography: these characteristics or the strata themselves have been simplified and grouped, in most cases in a very general way. By means of geotechnical evaluation maps, the validity of the hypothesis based on the distribution of the basic geotechnical units defined for the Seville subsoil has been confirmed.
On analysing the results, it is possible to notice the problems generated by the areas where the depth of the clay ceiling exceeds 2 metres, with layers of mainly anthropic fill soils with heterogeneous geotechnical properties and low resistance that lack contrasted parametric information. Likewise, there are several areas with clay thicknesses of more than 3 metres, which can be the origin of problems of expansivity affecting civil infrastructures and buildings. Finally, areas with anomalies in the characteristic geotechnical distribution have been detected, in which the sandy strata are above the clay strata and overlap old, buried river courses or former watercourses of the Guadalquivir River.

5. Conclusions

Studies of the microzoning of subsoils on an urban scale are needed, since they are necessary for the development of related applications such as urban planning, seismic risk evaluation, urban and architectural design, and preventive conservation of built heritage. This approach goes into further depth than the existing approaches developed with macrozonation techniques, whereby the particularity of the subsoil in the urban area of the city is not covered, but parameters or general characteristics are established on a territorial level.
The application of the proposed methodology has shown that it is possible to efficiently determine not only the distribution of the geotechnical units that make up the subsoil in urban environments, but also the variations in their essential mechanical resistance properties. In this way, realistic and accurate hypotheses regarding the underground reality of urban and metropolitan environments can be formed with agility. Thanks to the developed model, it is possible to attain a better understanding of the different strata in the city in relation to the topographic profile, by detecting areas where the strata have different thicknesses, through the application of the 3D model. In this respect, the gathering process together with the compilation and simplification criteria should contribute towards the future design of a geotechnical interpretation protocol.
Transformation of existing geotechnical information into spatial data enables control of the spatial distribution of the strata, thereby making it possible to visualise the variations of the values and to cross-check these values with the urban information provided by geospatial technologies. Nevertheless, the configuration of the database as a predictive model using artificial intelligence requires a comprehensive revision of the current database to consider in greater depth the large number of parameters that set up the complex reality of the urban subsoil, from both an integral perspective and a new contemporary paradigm.
There is currently a clear need for data to be published with open access in order to promote better knowledge of the subsoil, since a key factor in many issues is related to the development and management of urban environments, greater accessibility, and open access to all data. Similarly, it is necessary to encourage the development of strategies to standardise and systematise existing knowledge in order to provide geotechnical information for knowledge models aimed at the creation of digital twins. Thus, through this type of experience, this transformation aims to promote the register of geotechnical information from public institutions, which could lead to its publication and display, and hence enhance the density of points and the development of maps with greater accuracy on an urban and metropolitan scale.
Finally, this work suggests future research directions, such as automating processes through geospatial database systems like PostgreSQL, incorporating the voxel format into 3D model generation, and integrating them into built environments via CityGML.

Author Contributions

All the authors of this publication have collectively contributed to the development of the published version of this manuscript. All authors have read and agreed to the published version of the manuscript.

Funding

The research and writing of this article were supported by a Grant for the International Mobility of Research Staff from the VII Research Plan of the University of Seville for 2022 (VI PPI-US, 2022).

Data Availability Statement

Data are contained within the article.

Acknowledgments

The authors wish to acknowledge the necessary support from the IUACC (Instituto Universitario de Arquitectura y Ciencias de la Construcción) for the development of this research.

Conflicts of Interest

The authors declare there to be no conflicts of interest. The funders played no role in the design of this study; in the collection, analyses, or interpretation of data; in the writing of this manuscript; or in the decision to publish the results.

References

  1. Gao, J.; O’Neill, B.C. Mapping Global Urban Land for the 21st Century with Data-Driven Simulations and Shared Socioeconomic Pathways. Nat. Commun. 2020, 11, 2302. [Google Scholar] [CrossRef] [PubMed]
  2. Wei, G.; He, B.-J.; Sun, P.; Liu, Y.; Li, R.; Ouyang, X.; Luo, K.; Li, S. Evolutionary Trends of Urban Expansion and Its Sustainable Development: Evidence from 80 Representative Cities in the Belt and Road Initiative Region. Cities 2023, 138, 104353. [Google Scholar] [CrossRef]
  3. Moraci, F.; Errigo, M.F.; Fazia, C.; Campisi, T.; Castelli, F. Cities under Pressure: Strategies and Tools to Face Climate Change and Pandemic. Sustainability 2020, 12, 7743. [Google Scholar] [CrossRef]
  4. Mwaura, D.; Kada, M. Developing a Web-Based Spatial Decision Support System for Geothermal Exploration at the Olkaria Geothermal Field. Int. J. Digit. Earth 2017, 10, 1118–1145. [Google Scholar] [CrossRef]
  5. Li, X.Z.; Li, C.; Parriaux, A.; Wu, W.; Li, H.Q.; Sun, L.; Liu, C. Multiple Resources and Their Sustainable Development in Urban Underground Space. Tunn. Undergr. Sp. Technol. 2016, 55, 59–66. [Google Scholar] [CrossRef]
  6. Varone, C.; Carbone, G.; Baris, A.; Caciolli, M.C.; Fabozzi, S.; Fortunato, C.; Gaudiosi, I.; Giallini, S.; Mancini, M.; Paolella, L.; et al. PERL: A Dataset of Geotechnical, Geophysical, and Hydrogeological Parameters for Earthquake-Induced Hazards Assessment in Terre Del Reno (Emilia-Romagna, Italy). Nat. Hazards Earth Syst. Sci. 2023, 23, 1371–1382. [Google Scholar] [CrossRef]
  7. Feizizadeh, B.; Shadman Roodposhti, M.; Jankowski, P.; Blaschke, T. A GIS-Based Extended Fuzzy Multi-Criteria Evaluation for Landslide Susceptibility Mapping. Comput. Geosci. 2014, 73, 208–221. [Google Scholar] [CrossRef]
  8. Thoang, T.T.; Giao, P.H. Subsurface Characterization and Prediction of Land Subsidence for HCM City, Vietnam. Eng. Geol. 2015, 199, 107–124. [Google Scholar] [CrossRef]
  9. Jaramillo-Morilla, A.; Mascort-Albea, E.J.; Romero-Hernández, R.; Soriano-Cuesta, C. Climate Change Impacts on Cultural Heritage Building Foundations in Western Andalusia. In Geotechnical Engineering for the Preservation of Monuments and Historic Sites III; CRC Press: London, UK, 2022; pp. 1079–1087. [Google Scholar]
  10. Gautam, D.; Thapa, S.; Pokhrel, S.; Lamichhane, S. Local Level Multi-Hazard Zonation of Nepal. Geomat. Nat. Hazards Risk 2021, 12, 405–423. [Google Scholar] [CrossRef]
  11. Bastien, C.; Iván, G.; Pere, B.; Agathe, R.; Xavier, G. Geological Based Seismic Macrozonation for Pyrenees. In Proceedings of the 7th European Congress on Regional Geoscientific Cartography and Information Systems: 7th EUROGEO, Bologne, Italy, 12–15 June 2012. [Google Scholar]
  12. Joy, J.; Kanga, S.; Singh, S.K.; Sudhanshu, S. Cadastral Level Soil and Water Conservation Priority Zonation Using Geospatial Technology. Int. J. Agric. Syst. 2021, 9, 10–26. [Google Scholar]
  13. Silvestri, S.; Marani, M.; Marani, A. Hyperspectral Remote Sensing of Salt Marsh Vegetation, Morphology and Soil Topography. Phys. Chem. Earth 2003, 28, 15–25. [Google Scholar] [CrossRef]
  14. Autade, S.E.; Pardeshi, S.D.; Pardeshi, S.S. Advances in Landslide Hazard Assessment in India. Trans. Inst. Indian Geogr. 2021, 42, 257–271. [Google Scholar]
  15. Diz-Mellado, E.; Mascort-Albea, E.J.; Romero-Hernández, R.; Galán-Marín, C.; Rivera-Gómez, C.; Ruiz-Jaramillo, J.; Jaramillo-Morilla, A. Non-Destructive Testing and Finite Element Method Integrated Procedure for Heritage Diagnosis: The Seville Cathedral Case Study. J. Build. Eng. 2021, 37, 102134. [Google Scholar] [CrossRef]
  16. Amanti, M.; Muraro, C.; Roma, M.; Chiessi, V.; Puzzilli, L.M.; Catalano, S.; Romagnoli, G.; Tortorici, G.; Cavuoto, G.; Albarello, D.; et al. Geological and Geotechnical Models Definition for 3rd Level Seismic Microzonation Studies in Central Italy. Bull. Earthq. Eng. 2020, 18, 5441–5473. [Google Scholar] [CrossRef]
  17. Antoniou, A.A.; Tsiambaos, G. Engineering Geological Aspects for the Microzonation of the City of Volos, Greece. Bull. Geol. Soc. Greece 2017, 43, 1104. [Google Scholar] [CrossRef]
  18. Zhu, L.; Zhang, C.; Li, M.; Pan, X.; Sun, J. Building 3D Solid Models of Sedimentary Stratigraphic Systems from Borehole Data: An Automatic Method and Case Studies. Eng. Geol. 2012, 127, 1–13. [Google Scholar] [CrossRef]
  19. Pal, S.; Sharma, P. A Review of Machine Learning Applications in Land Surface Modeling. Earth 2021, 2, 174–190. [Google Scholar] [CrossRef]
  20. Chilès, J.P.; Desassis, N. Fifty Years of Kriging. In Handbook of Mathematical Geosciences: Fifty Years of IAMG; Daya Sagar, B.S., Cheng, Q., Agterberg, F., Eds.; Springer International Publishing: Cham, Switzerland, 2018; pp. 1–914. ISBN 978-3-319-78998-9. [Google Scholar]
  21. Moubarak, A.H.; Arnous, M.O.; El-Rayes, A.E. Integrated Geoenvironmental and Geotechnical Risk Assessment of East Port Said Region, Egypt for Regional Development. Geotech. Geol. Eng. 2021, 39, 1497–1520. [Google Scholar] [CrossRef]
  22. El May, M.; Dlala, M.; Chenini, I. Urban Geological Mapping: Geotechnical Data Analysis for Rational Development Planning. Eng. Geol. 2010, 116, 129–138. [Google Scholar] [CrossRef]
  23. Khaledian, Y.; Miller, B.A. Selecting Appropriate Machine Learning Methods for Digital Soil Mapping. Appl. Math. Model. 2020, 81, 401–418. [Google Scholar] [CrossRef]
  24. Padarian, J.; Minasny, B.; McBratney, A.B. Using Deep Learning for Digital Soil Mapping. Soil 2019, 5, 79–89. [Google Scholar] [CrossRef]
  25. Lee, C.; Oh, H.-J.; Cho, S.-J.; Kihm, Y.H.; Park, G.; Choi, S.-G. Three-Dimensional Prospectivity Mapping of Skarn-Type Mineralization in the Southern Taebaek Area, Korea. Geosci. J. 2019, 23, 327–339. [Google Scholar] [CrossRef]
  26. Sanchez Fuentes, D.; Mascort-Albea, E.J.; Del Espino Hidalgo, B.; Hidalgo-Sánchez, F.M.; Gutiérrez, M.A. Spatial Data for the Design of Critical Cartographies in the Metropolitan Area of Seville (Spain). In Reciprociudad: Design Diplomacy in Seville; Recolectores Urbanos: Sevilla, España, 2021; pp. 251–264. ISBN 9788412149319. [Google Scholar]
  27. Rincón Calderón, J.M.; Galán-Marín, C.; Sánchez-Fuentes, D. The Conservation of the Constructions Located on Protected Natural Areas: Research Experiencie in Doñana. In Proceedings of the IDA 2017. 1st International Congress on Advanced Doctoral Research in Architecture, Sevilla, Spain, 27–28 November 2017; Universidad de Sevilla: Sevilla, Spain, 2017. [Google Scholar]
  28. Mascort-Albea, E.J.; Canivell, J.; Jaramillo-Morilla, A.; Romero-Hernández, R.; Ruiz-Jaramillo, J.; Soriano-Cuesta, C. Action Protocols for Seismic Evaluation of Structures and Damage Restoration of Residential Buildings in Andalusia (Spain): “IT-Sismo” APP. Buildings 2019, 9, 104. [Google Scholar] [CrossRef]
  29. Ortiz, R.; Ortiz, P.; Martín, J.M.; Vázquez, M.A. A New Approach to the Assessment of Flooding and Dampness Hazards in Cultural Heritage, Applied to the Historic Centre of Seville (Spain). Sci. Total Environ. 2016, 551–552, 546–555. [Google Scholar] [CrossRef] [PubMed]
  30. Ruiz-Constán, A.; Ruiz-Armenteros, A.M.; Galindo-Zaldívar, J.; Lamas-Fernández, F.; Sousa, J.J.; Sanz de Galdeano, C.; Pedrera, A.; Martos-Rosillo, S.; Caro Cuenca, M.; Delgado, J.M.; et al. Factors Determining Subsidence in Urbanized Floodplains: Evidence from MT-InSAR in Seville (Southern Spain). Earth Surf. Process. Landf. 2017, 42, 2484–2497. [Google Scholar] [CrossRef]
  31. Morillo, E.; Romero, A.S.; Madrid, L.; Villaverde, J.; Maqueda, C. Characterization and Sources of PAHs and Potentially Toxic Metals in Urban Environments of Sevilla (Southern Spain). Water. Air. Soil Pollut. 2007, 187, 41–51. [Google Scholar] [CrossRef]
  32. UNESCO. UNESCO World Heritage Committee Convention Concerning the Protection of the World Cultural and Natural Heritage. Report of Eleventh Session; UNESCO: Paris, France, 1987. [Google Scholar]
  33. Hidalgo-Sánchez, F.M.; Mascort-Albea, E.J.; Kada, M.; Romero-Hernández, R.; Canivell, J.; López-Larrínaga, F. 3D GIS Semi-Automatized Modelling Procedure for the Conservation of the PHiM: Heritage Municipal Buildings of Seville (Spain). A New Dimension for Urban Cultural Data Management. J. Comput. Cult. Herit. 2022, 15, 1–25. [Google Scholar] [CrossRef]
  34. Bahri, M.; Mascort-Albea, E.J.; Romero-Hernández, R.; Koopialipoor, M.; Soriano-Cuesta, C.; Jaramillo-Morilla, A. Numerical Model Validation for Detection of Surface Displacements over Twin Tunnels from Metro Line 1 in the Historical Area of Seville (Spain). Symmetry 2022, 14, 1263. [Google Scholar] [CrossRef]
  35. González Diez, M.I. Estudio Geológico Del Área Urbana de Sevilla y Alrededores; Universidad de Sevilla: Sevilla, Spain, 1986. [Google Scholar]
  36. Baena-Escudero, R.; Rinaldi, M.; García-Martínez, B.; Guerrero-Amador, I.C.; Nardi, L. Channel Adjustments in the Lower Guadalquivir River (Southern Spain) over the Last 250 years. Geomorphology 2019, 337, 15–30. [Google Scholar] [CrossRef]
  37. Polo Velasco, J. Modelo Para Determinar La Solución Constructiva de Cimentaciones En Edificación, En Función de Los Condicionantes Geotécnicos En Sevilla; Universidad de Sevilla: Sevilla, Spain, 2017. [Google Scholar]
  38. Soler Arias, E.; Huete Fuertes, R.; Rodríguez-Liñán, C.; Jaramillo-Morilla, A.; Suárez Samaniego, L.; Sanz Cuesta, V.; Rodríguez Robles, D.; Ruiz-Jaramillo, J.; García López, J.; Serrano Pérez, J. Anejo I.2. Mapa Geotécnico Básico de La Ciudad de Sevilla. In Protocolo de Inspección Técnica de Edificaciones ITE.; Colegio Oficial de Arquitectos de Sevilla, Fundación Fidas: Sevilla, España, 2005; ISBN 849337869. [Google Scholar]
  39. INYPSA. Mapa Geotécnico General. Sevilla. Hoja 3-10/75; Servicio de Publicaciones, Ministerio de Industria: Madrid, Spain, 1975. [Google Scholar]
  40. ADARO. Mapa Geológico de España. Segunda Serie. Sevilla; Servicio de Publicaciones, Ministerio de Industria: Madrid, Spain, 1975. [Google Scholar]
  41. INTECSA. Mapa Geotécnico Para Ordenación Territorial y Urbana de Sevilla; INTECSA: Madrid, Spain, 1983. [Google Scholar]
  42. IGME. Plan GEODE de Cartografía Geológica Continua; Gobierno de España, Ministerio de Ciencia e Innovación: Madrid, Spain, 2008. [Google Scholar]
  43. Consejería de Fomento y Vivienda Localización de Informes Geotécnicos a Escala 1:50.000; Hojas de Las Capitales de Provincia: Sevilla, Spain, 2009.
  44. Ruiz Carvajal, J. Los Suelos de La Ciudad de Sevilla: Caracterización Geotécnica y Propiedades Mineralógicas de Su Fracción Arcilla; Universidad de Sevilla: Sevilla, Spain, 1985. [Google Scholar]
  45. Oteo Mazo, C. Posibles Métodos Constructivos Para La Infrastructura. In Pasado y Futuro del Metro de Sevilla; Secretariado de Publicaciones de la Universidad de Sevilla: Sevilla, Spain, 1994; pp. 123–151. ISBN 978-84-472-0179-2. [Google Scholar]
  46. Barrios Padura, Á. Estudio de Las Cimentaciones de Edificios Históricos En La Provincia de Sevilla Siglo XII Al XVI; Universidad de Sevilla: Sevilla, España, 2001. [Google Scholar]
  47. De los Barral, M.Á. Estudio Geoarqueológico de La Ciudad de Sevilla; Universidad de Sevilla-Fundación Focus-Abengoa: Sevilla, Spain, 2009; ISBN 978-84-472-0903-3. [Google Scholar]
  48. Arozamena Cagigal, P. Comportamiento Del Terreno Durante Las Obras de Construcción de La Línea 1 Del Metro de Sevilla En Los Tramos de Túnel Entre Pantallas y Las Estaciones Subterráneas; Universidad de Sevilla: Sevilla, Spain, 2013. [Google Scholar]
  49. Borja Barrera, F. Geoarqueología Urbana En Sevilla. In Sevilla Arqueológica. La Ciudad en Época Protohistórica, Antigua y Andalusí; Servicio de Publicaciones de la Universidad de Sevilla: Sevilla, Spain, 2014; pp. 333–367. [Google Scholar]
  50. Puertos del Estado Español. Atlas Geotécnico Del Puerto de Sevilla; Ministerio de Fomento, Gobierno de España: Sevila, Spain, 1999. [Google Scholar]
  51. Bartha, G.; Kocsis, S. Standardization of Geographic Data: The European Inspire Directive. Eur. J. Geogr. 2011, 2, 79–89. [Google Scholar]
  52. Instituto Geográfico Nacional. Plan Nacional de Ortofotografía Aérea (PNOA); Ministerio de Transportes, Gobierno de España: Madrid, España, 2020. [Google Scholar]
  53. European Environment Agency. GEOSTAT Grid Dataset; European Environment Agency: Copenhagen, Denmark, 2011.
  54. Gerencia de Urbanismo y Medioambiente de Sevilla. Infraestructura de Datos Espaciales Del Ayuntamiento de Sevilla—IDE Sevilla. Available online: https://sig.urbanismosevilla.org/InicioIDE.aspx (accessed on 25 June 2022).
  55. Takaku, J.; Tadono, T.; Doutsu, M.; Ohgushi, F.; Kai, H. Updates of ‘AW3D30′ ALOS Global Digital Surface Model with Other Open Access Datasets. Int. Arch. Photogramm. Remote Sens. Spat. Inf. Sci. 2020, XLIII-B4-2, 183–189. [Google Scholar] [CrossRef]
  56. Instituto de Estadística y Cartografía de Andalucía—IECA. Modelos Digitales Del Terreno de Andalucía; Junta de Andalucia: Sevilla, Spain, 2018. [Google Scholar]
  57. Lai, C.G.; Poggi, V.; Famà, A.; Zuccolo, E.; Bozzoni, F.; Meisina, C.; Bonì, R.; Martelli, L.; Massa, M.; Mascandola, C.; et al. An Inter-Disciplinary and Multi-Scale Approach to Assess the Spatial Variability of Ground Motion for Seismic Microzonation: The Case Study of Cavezzo Municipality in Northern Italy. Eng. Geol. 2020, 274, 105722. [Google Scholar] [CrossRef]
Figure 1. Location map of the urban study area and main geological areas.
Remotesensing 16 00141 g001
Figure 2. Methodological and main research and methodology phases.
Remotesensing 16 00141 g002
Figure 3. Ground layer diagram and selection of representative parameters for modelling.
Remotesensing 16 00141 g003
Figure 4. Mapping area selection from density and distribution analysis.
Remotesensing 16 00141 g004
Figure 5. Statistical parameters of the soil properties.
Remotesensing 16 00141 g005
Figure 6. UML class diagram for the database. Block A (grey); Block B (blue); Block C (red).
Remotesensing 16 00141 g006
Figure 7. Stages for integrating topographic data into the geotechnical database.
Remotesensing 16 00141 g007
Figure 8. Raster maps of the geotechnical layers selected for 3D modelling.
Remotesensing 16 00141 g008
Figure 9. Underground 3D model of the case study with (a) boreholes and (b) soil layers.
Remotesensing 16 00141 g009
Table 1. Comparison of published studies on the subsoil of the city of Seville.
InstitutionalYearMain
Topics
Zonation DetailMapping ScaleUnit NumberTest PointsReferences
Geotechnical and Mining Institute of Spain1975General Geotechnical MapNational1:200,0005Not defined[39]
1975General Geological MapNational1:50,0003Not defined[40]
1983Urban Geotechnical MapLocal1:25,000951[41]
2008General Geological MapNational1:50,0003Not defined[42]
Andalusian
Regional Government
2009Regional Geotechnical SamplesNo zonation: test points onlyNot definedNot defined58[43]
University of
Seville
1985Urban Geotechnical and Mineral IdentificationNo zonation: test points onlyNot defined678[44]
1986Urban Geological StudyLocal1:50,0004132[35]
1994No zonation: test points onlyNo zonation: test points onlyNot defined44No zonation: test points only[45]
2001Architectonic and Geotechnical StudyNo zonation: test points onlyNo zonation: test points onlyNot defined44[46]
2009Geoarchaeological MapUrban1:25,0005135[47]
2013Urban Geotechnical MapNo zonation: test points onlyNo zonation: test points onlyNot defined117[48]
2014Geoarchaeological MapLocalNot defined3Not defined[49]
2017Urban Geotechnical MapLocal1:60,0004700[37]
Architects’
Association of Seville
2005Urban Geotechnical MapNo zonation: test points only1:25,000Not defined208[38]
Spanish State Ports2009Geotechnical Map of the urban sectorUrban sector1:15,000Not definedNot defined[50]
Table 2. Geotechnical layer proposal and estimated average geotechnical parameters 1.
Soil
Unit
Geotechnical
Parameters
References
Soils of SevilleHistory of Sevilla MetroGeotechnical Atlas of the PortHistorical FoundationsBuilding InspectionSevilla Metro WorksFoundation Models
[44][45][50][46][38][48][37]
(a) Fill soils and brown claysTop depth (m)Surface level, considered at 0.00 metres of depth, without global height coordinates
Bottom depth (m)--3.03.0–6.03.504.00.5–11.3
Thickness (m)--3.03.0–6.03.504.00.5–11.3
USCS (Soil class)--CL-CLCL-
T200/T 0.08 (%)--94.00-94.0094.00-
Unit weight (kN/m3)--17.30-17.3018.20-
Water content (%)--21.00-21.0021.00-
Friction angle (°)-----22.0–29.0-
Qu (kN/m2)--155.0-155.0155.0-
(b)
Grey Clays
Top depth (m)--3.03.0–6.03.504.00.5–11.3
Bottom depth (m)--8.012.0–15.08.009.02.0–6.0
Thickness (m)3.0–14.0-5.06.0–12.04.505.0-
USCS (Soil class)--CHCL/MLCL/CHCL/CH-
T200/T 0.08 (%)84.1089.5093.00-93.0093.00-
Unit weight (kN/m3)-16.0017.15-17.1514.9–19.4-
Water content (%)45.9015.0028.90-28.9028.90-
Friction angle (°)-27.511.019.0–26.011.011.0–29.0-
Qu (kN/m2)-175.0172.529.0–90.0190.0190.014.0–340.0
SPT (N)--296–10296–29-
(c)
Silty sands
Top depth (m)--8.0-8.09.0-
Bottom depth (m)--12.0-15.014.0-
Thickness (m)6.0–15.0-4.0-7.05.0-
USCS (Soil class)--ML-ML, SML, SM-P-
T200/T 0.08 (%)34.3047.0092.00-92.0042.00-
Unit weight (kN/m3)-18.0017.85-17.8516.0–19.7-
Water content (%)-40.0022.10-22.1022.10-
Friction angle (°)-35.025.0-25.032.0–35.030.0–32.0
Qu (kN/m2)-53.5130.0-130.0130.0
SPT (N)------10–20
(d)
Sandy gravels
Top depth (m)--12.012.0–15.015.014.03.4–17.3
Bottom depth (m)--17.017.0–22.019.018.013.0–25.0
Thickness (m)--5.02.0–10.04.04.03.0–9.0
USCS (Soil class)---SP, GP-GW/P/M-
T200/T 0.08 (%)-5.00--11.403.10-
Unit weight (kN/m3)-21.00---20.0–21.0-
Water content (%)-7.50--16.007.50-
Friction angle (°)-40.0-34.5-34.0–45.0-
Qu (kN/m2)-------
SPT (N)--->406767-
(e)
Marly clays
Top depth (m)--17.0-19.018.013.0–25.0
Bottom depth (m)-------
Thickness (m)-------
USCS (Soil class)--CHCHCHCH-
T200/T 0.08 (%)-94.5095.00-95.0095.00-
Unit weight (kN/m3)-16.0017.7515.50-15.7–19.8-
Water content (%)-25.0026.90-26.9026.90-
Friction angle (°)-29.520.025.0-25.0–34.0-
Qu (kN/m2)--620.00450.00-620–1800325–521
SPT (N)--75-7575-
1 Values with the symbol “-” refer to non-defined quantities in the corresponding layer.
Table 3. Point density values from different geometric criteria.
Area GeometryNumber of Points (n)Area Extension (km2)Density (n/km2)
Urban area (polygon)1256142.088.84
Urban area (rectangle)1503322.304.66
Historical city (polygon)3207.7541.29
Historical city (rectangle)49518.0427.43
Table 4. Sources available for the topographic integration of the model.
SourceYearGCSCell Size (m2)LIDAR PointsClass
ALOS2016WGS_198430.00 × 30.00Not definedNot defined
PNOA2021ETRS89_UTM_Z301.50 × 1.506,017,209ASTM
IECA2018ETRS89_UTM_Z305.00 × 5.00200,000ASTM
IDE Sevilla2009WGS_1984Not defined1250Unclassified
Table 5. Comparison of isotropic error metrics, highlighting best-fit models.
LayerModelR2Nugget (Co)Still
(Co + C)
RangeProportion (C/(co + C))Residual
a2. Fill soil thickness (m)Linear0.003.870.001.32−25.863124.00
Spherical0.130.0132.3411,100.001.00233.00
Exponential0.140.3041.2023,460.001.00285.00
Gaussian0.130.4845.6010,929.240.95116.00
b1. Clay top-level depth (m)Linear0.861.2032.845542.050.96214.00
Spherical0.851.5054.0013,600.000.97239.00
Exponential0.801.0053.0020,850.000.98320.00
Gaussian0.916.1053.0010,149.820.90150.00
b2. Clay thickness (m)Linear0.6510.5716.855542.490.3727.80
Spherical0.897.8215.653590.000.509.26
Exponential0.867.2715.934320.000.5411.30
Gaussian0.877.9115.832857.880.5014.10
b3. Clay undrained compression resistance (kN/m2)Linear0.884.099.725543.410.585.88
Spherical0.874.0716.6418,160.000.766.08
Exponential0.863.9524.6352,620.000.846.49
Gaussian0.894.9515.7411,933.830.695.15
c1. Sand top-level depth (m)Linear0.979.4154.565543.150.8381.40
Spherical0.978.8078.6012,070.000.8993.60
Exponential0.946.5074.0015,900.000.91159.00
Gaussian0.9515.0065.827863.510.77133.00
c2. Sand thickness (m)Linear0.2711.5214.375543.750.2028.90
Spherical0.410.4813.27460.000.9623.40
Exponential0.696.7613.792040.000.5112.30
Gaussian0.412.0313.28398.170.8523.30
c3. Sand (SPT)Linear0.96490.021264.765547.020.6134,340.00
Spherical0.96484.001997.0015,660.000.7637,462.00
Exponential0.95470.003050.0046,920.000.8544,360.00
Gaussian0.97589.001549.008521.690.7121,892.00
d1. Top-level depth of the rock (m)Linear0.9917.3173.695544.040.7741.30
Spherical0.9915.2081.948490.000.8128.90
Exponential0.9812.4085.8012,210.000.86121.00
Gaussian0.9921.6073.705958.250.7138.00
e1. Marls top-level depth (m)Linear0.985.4280.155540.720.93223.00
Spherical0.964.90100.809930.000.95331.00
Exponential0.910.9096.8013,320.000.97767.00
Gaussian0.9815.50112.008902.740.86157.00
o1. Water table top-level depth (m)Linear0.892.8423.895538.590.8871.70
Spherical0.882.9036.8013,010.000.9281.50
Exponential0.832.5036.0019,470.000.93113.00
Gaussian0.936.1043.2011,327.610.8649.80
Disclaimer/Publisher’s Note: The statements, opinions and data contained in all publications are solely those of the individual author(s) and contributor(s) and not of MDPI and/or the editor(s). MDPI and/or the editor(s) disclaim responsibility for any injury to people or property resulting from any ideas, methods, instructions or products referred to in the content.

