
Constraints on the Fault Dip Angles of Lunar Graben and Their Significance for Lunar Thermal Evolution


Abstract
:1. Introduction
2. Materials and Methods
2.1. Calculation of Dips
2.2. Estimation of Area Growth
3. Results
4. Discussion
4.1. Error Analysis
4.1.1. Degradation
4.1.2. Uplift or Subsidence
4.1.3. Elevation
4.2. Optimization of Calculation Results
- (1)
- Removing the results calculated with small ∆h
- (2)
- Assessment of each profile
4.3. Constraints on the Expansion Rate of the Moon
4.3.1. D–L Ratios for Graben-Bounding Faults
4.3.2. Implications for Origin of Graben
4.3.3. Implications for Lunar Thermal Evolution
5. Conclusions
- (1)
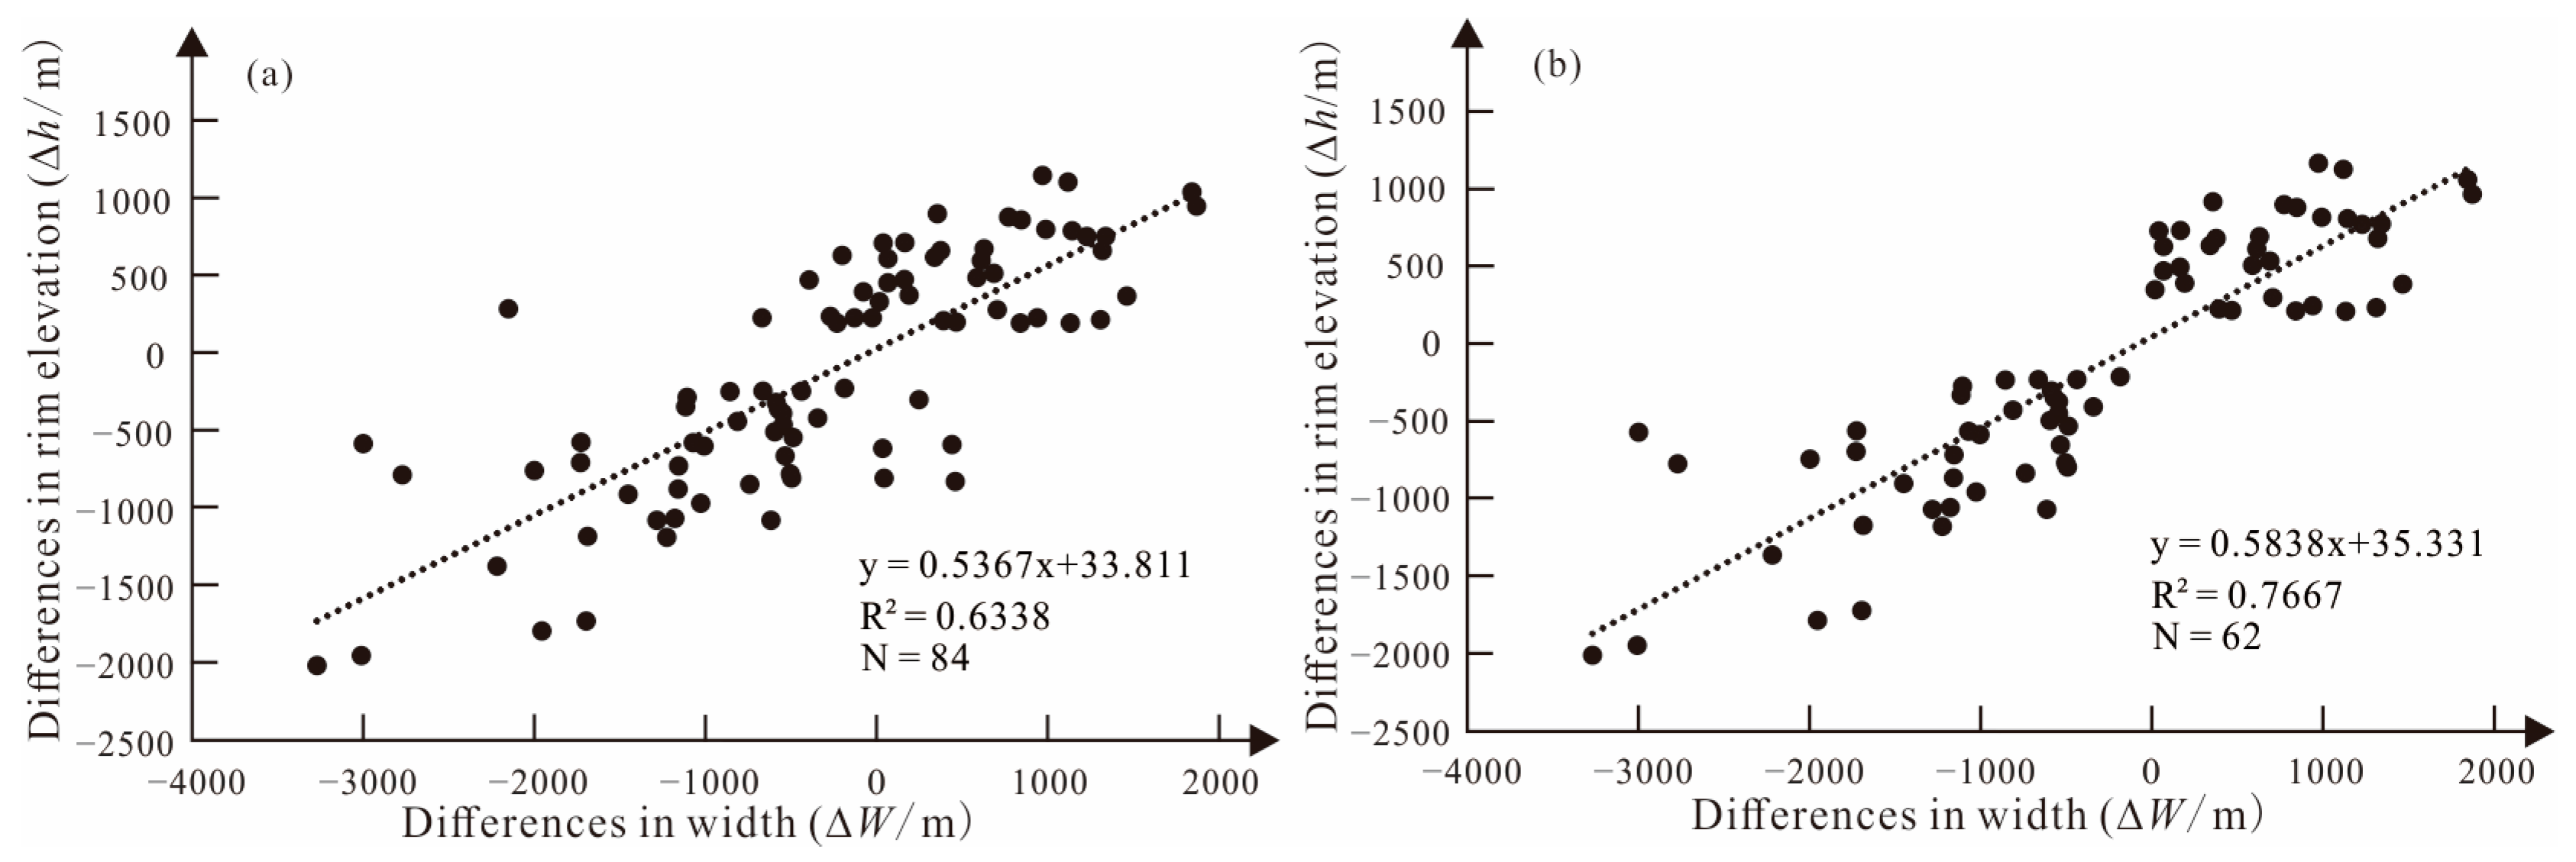
- Error analysis shows that various influencing factors are ultimately reflected in changes in elevation and graben width. Errors are more sensitive to changes in elevation.
- (2)
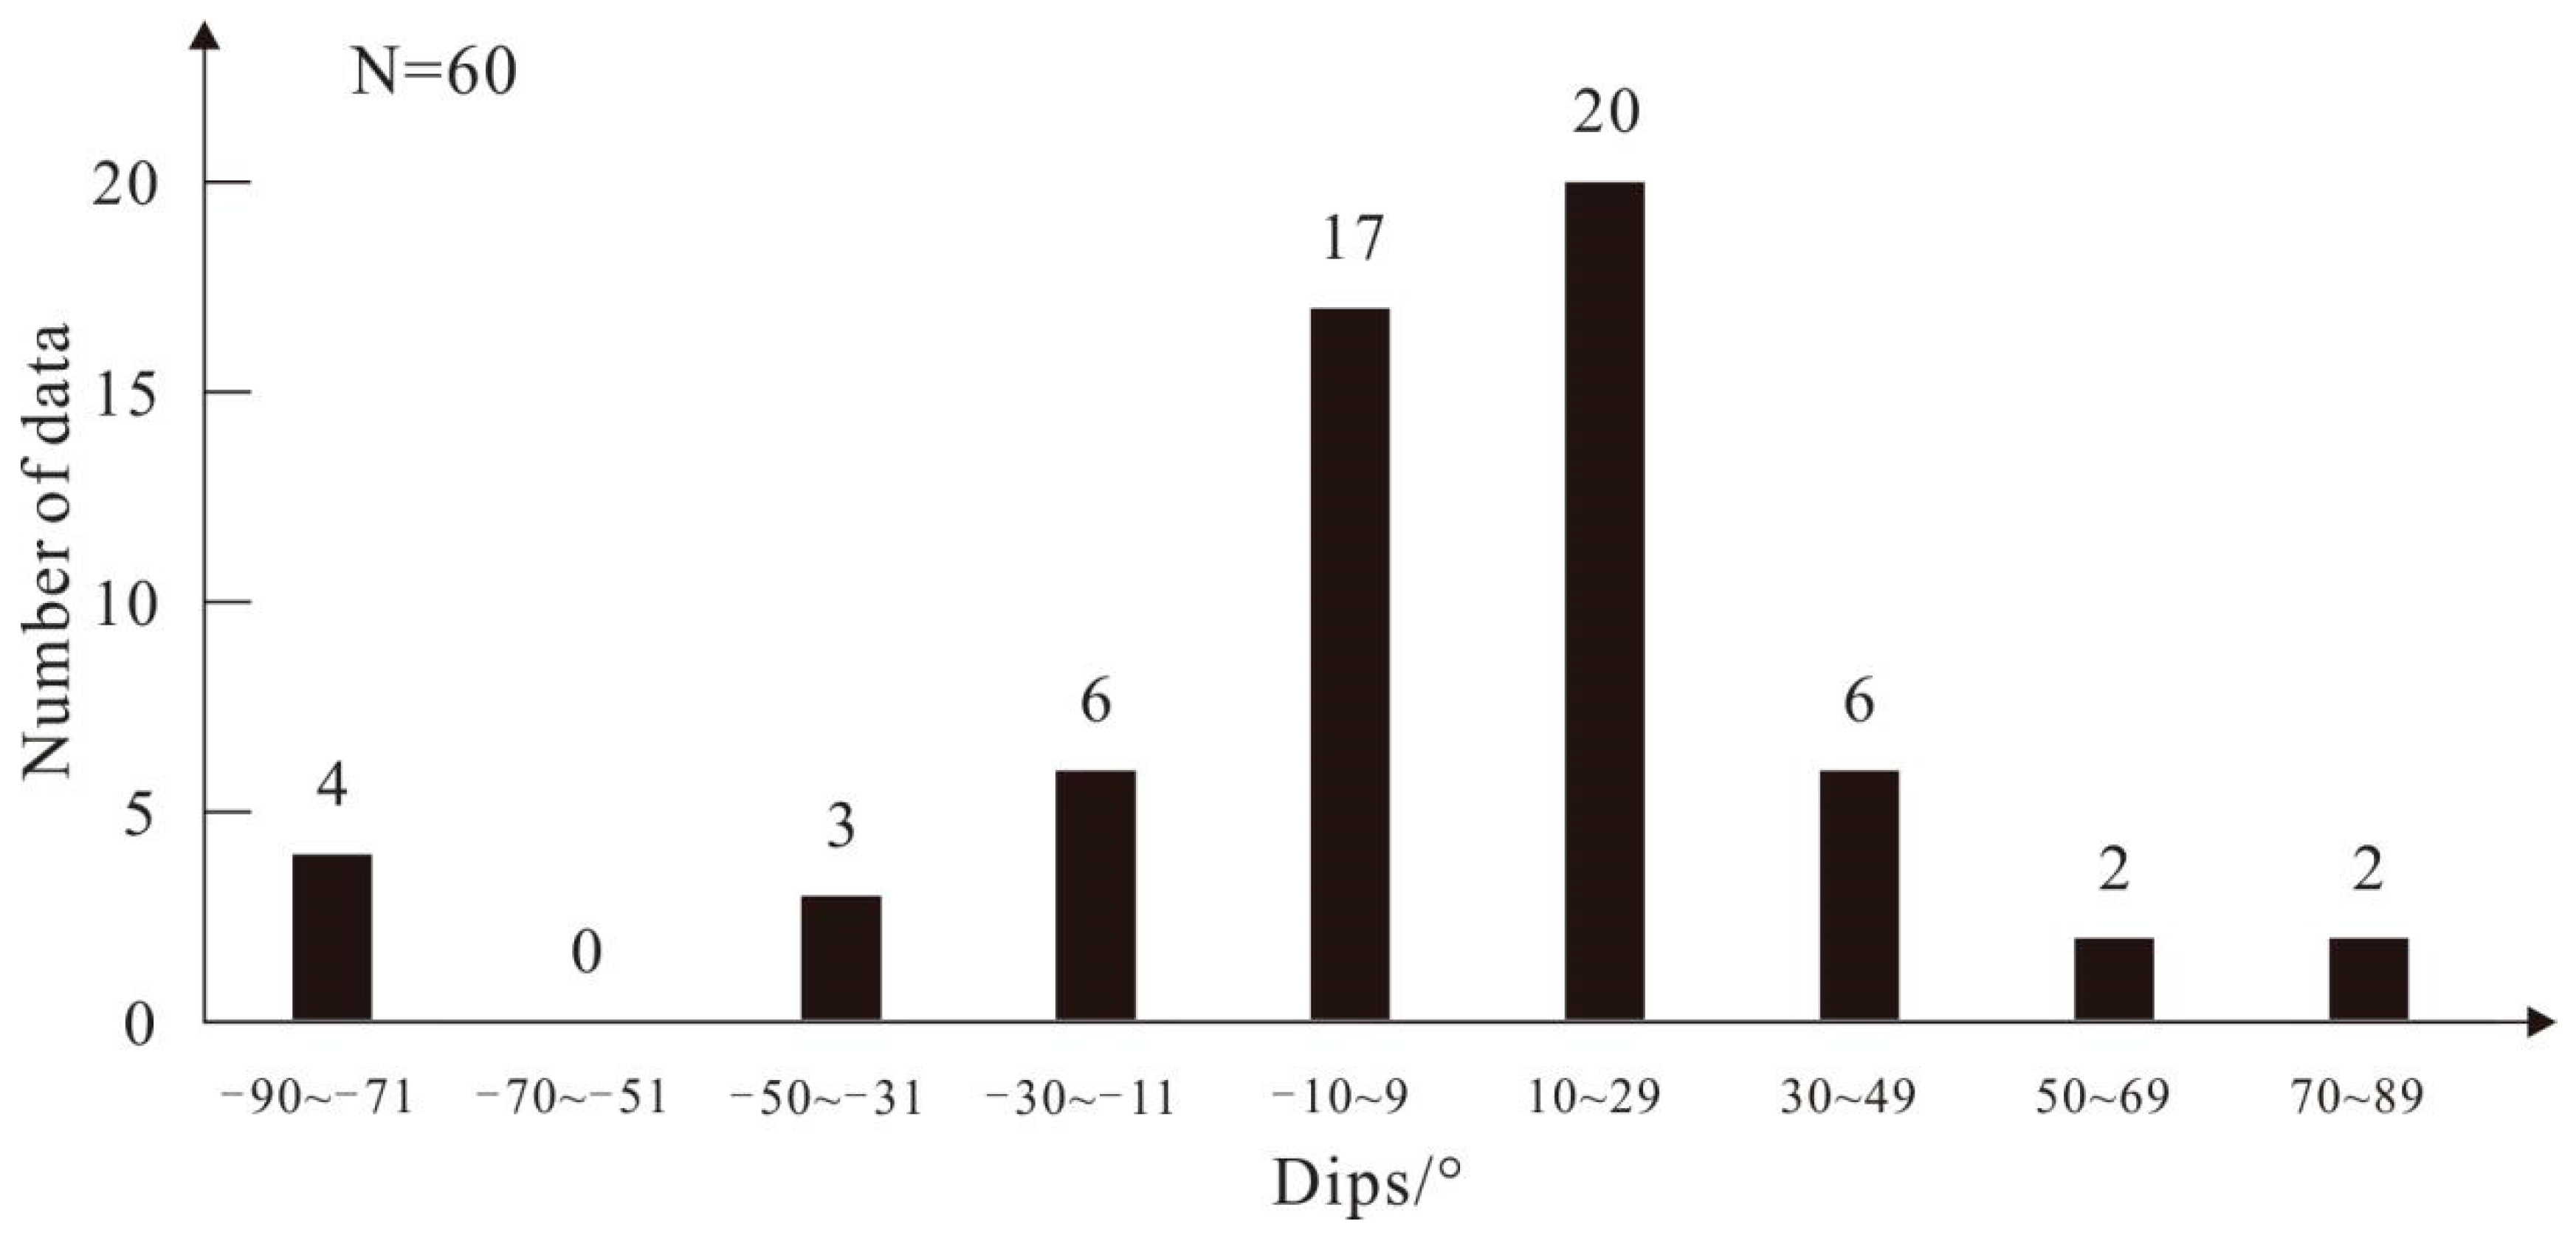
- The average and the standard linear regression methods were used to calculate the dips of the graben-bounding normal faults. A dip of 39.9° was obtained by the method of standard linear regression for all data. After removing large error data, the results of 49.4° and 52.5° were derived by the standard linear regression and average methods, respectively.
- (3)
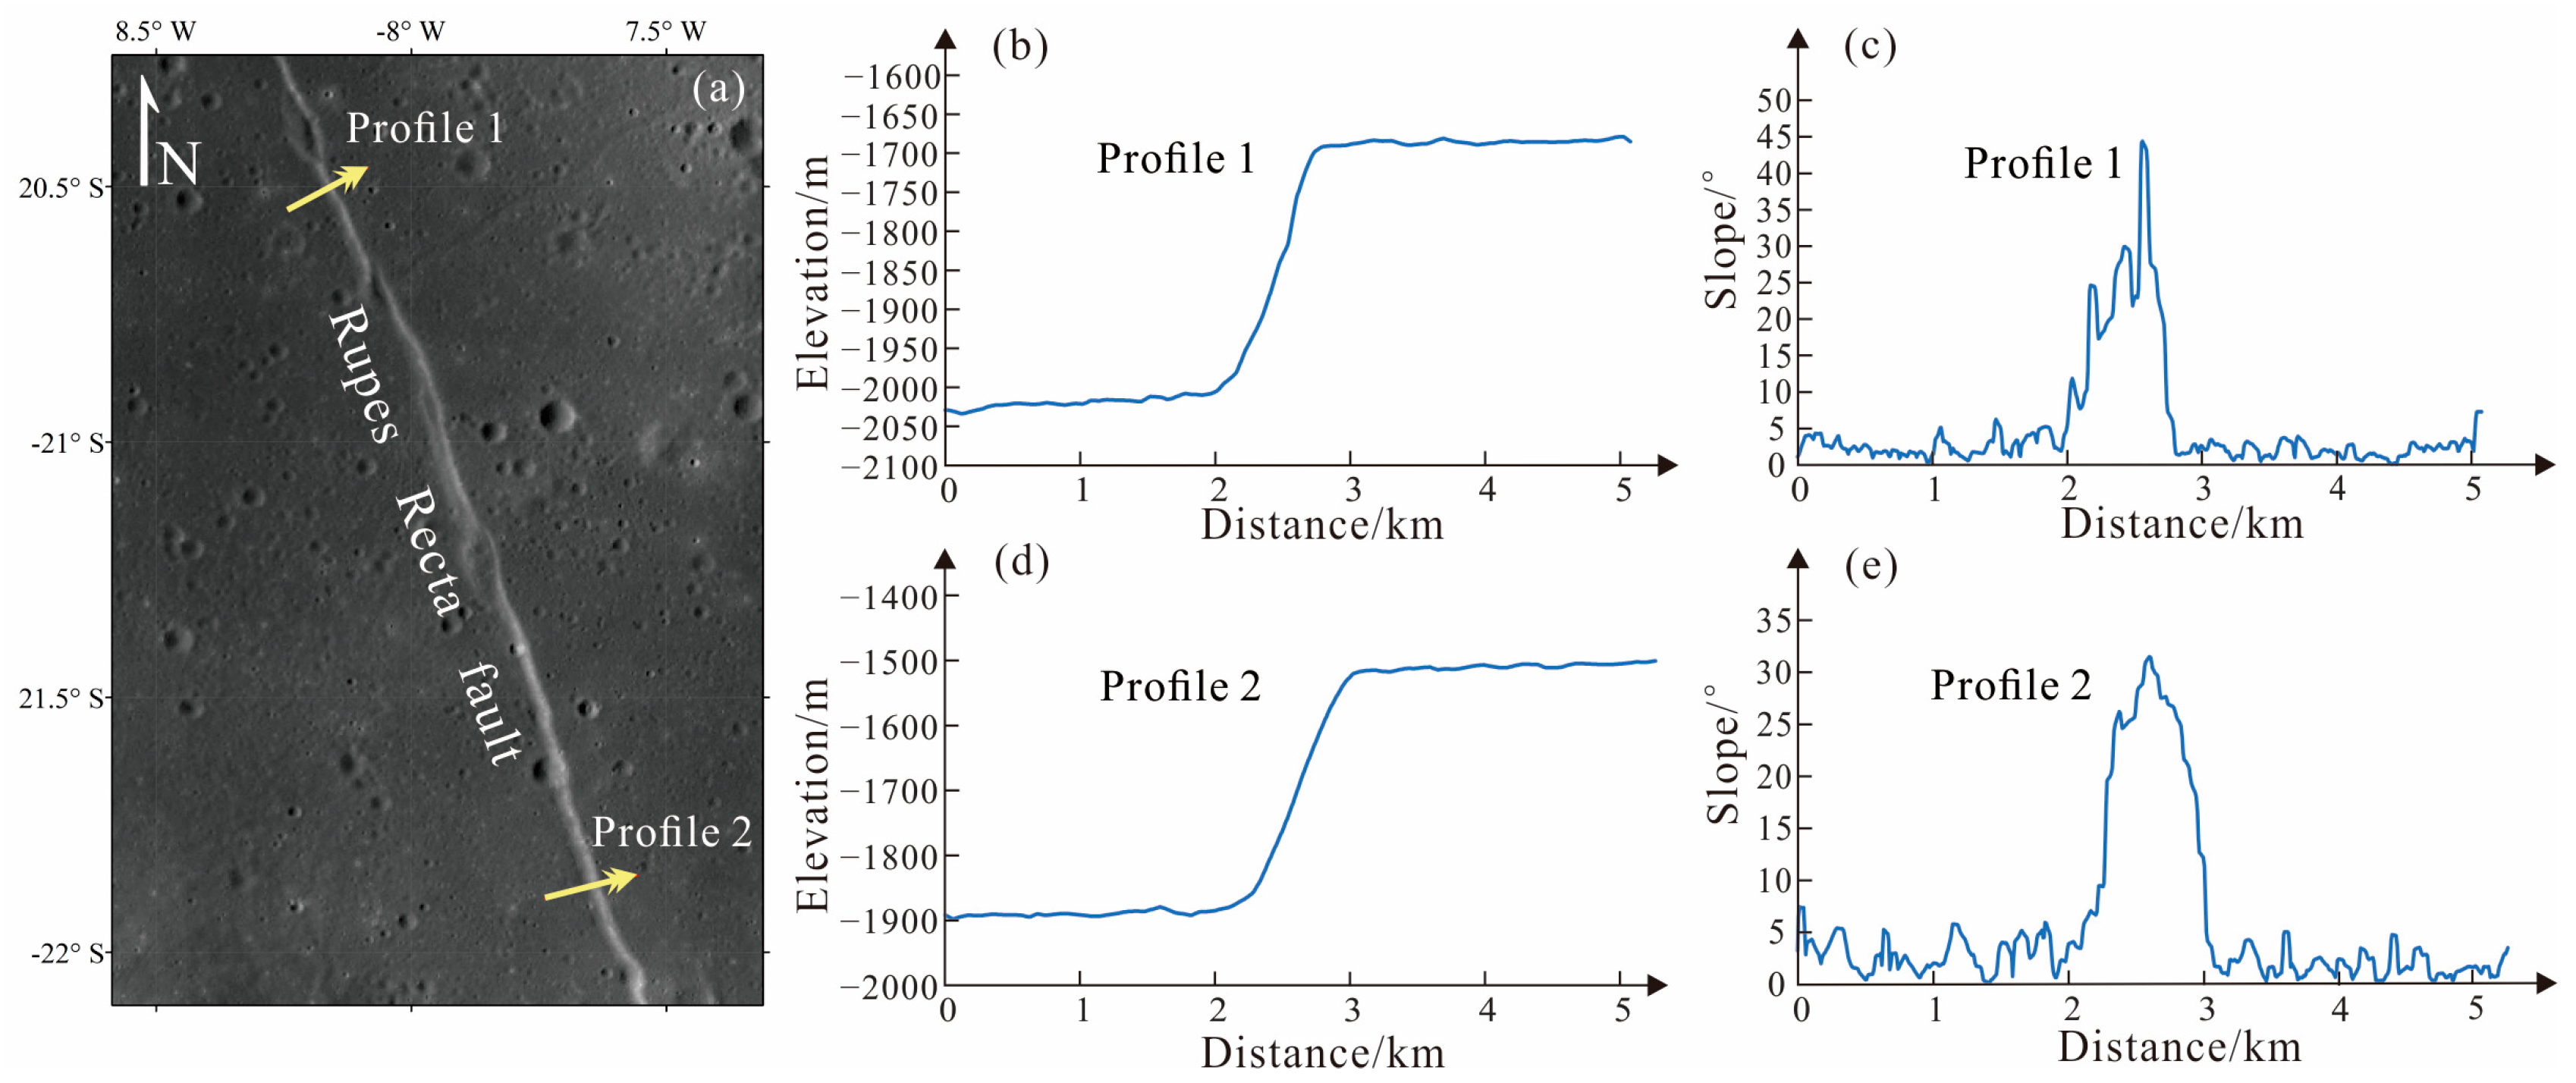
- The D–L ratios calculated from the graben-bounding normal faults are between 2.0 × 10⁻³ and 3.8 × 10⁻³ (for α = 52.5°). The young Rupes Recta normal fault presents a D–L ratio of 3.6 × 10⁻³, which is basically consistent with the results calculated from the graben-bounding normal faults by the standard linear regression method. Thus, the D–L ratio of lunar normal fault is ~3.6 × 10⁻³.
- (4)
- The increase in lunar radius is estimated based on the dip and D–L ratio of the graben-bounding normal faults. The radius of the Moon expanded by approximately 130 m indicated by the formation of grabens.
Author Contributions
Funding
Data Availability Statement
Acknowledgments
Conflicts of Interest
References
- Baldwin, R. The Measure of the Moon; University of Chicago Press: Chicago, IL, USA, 1963. [Google Scholar]
- Quaide, W. Rilles, ridges, and domes—Clues to maria history. Icarus 1965, 4, 374–389. [Google Scholar] [CrossRef]
- Ouyang, Z.Y. Introduction to Lunar Science; Chinese Aerospace Press: Beijing, China, 2005; pp. 1–362. (In Chinese) [Google Scholar]
- Hargitai, H. Rille. In Encyclopedia of Planetary Landforms; Springer: New York, NY, USA, 2014. [Google Scholar]
- Greeley, R. Lava tubes and channels in the lunar Marius Hills. Earth Moon Planets 1971, 3, 289–314. [Google Scholar] [CrossRef]
- Xiao, L.; Huang, J.; Zhao, J.; Zhao, J. Significance and preliminary proposal for exploring the lunar lava tubes. Sci. Sin. Phys. Mech. Astron. 2018, 48, 119602. (In Chinese) [Google Scholar] [CrossRef]
- Smith, G. A Comparison of Two Terrestrial Grabens with the Lunar Rilles Rima Ariadaeus and Rimae Hypatia I and II; USGS: Reston, VA, USA, 1966. [Google Scholar]
- McGill, G.E. Attitude of fractures bounding straight and arcuate lunar rilles. Icarus 1971, 14, 53–58. [Google Scholar] [CrossRef]
- Golombek, M.P. Structural analysis of lunar grabens and the shallow crustal structure of the Moon. J. Geophys. Res. 1979, 84, 4657–4666. [Google Scholar] [CrossRef]
- Head, J.W.; Wilson, L. Lunar graben formation due to near-surface deformation accompanying dike emplacement. Planet. Space Sci. 1993, 41, 719–727. [Google Scholar] [CrossRef]
- Nahm, A.L. Graben on the lunar nearside: Do dikes lie beneath? Acta Geol. Sin. Engl. Ed. 2016, 90, 175–176. [Google Scholar] [CrossRef]
- Schultz, P.H. Floor-fractured lunar craters. Moon 1976, 15, 241–273. [Google Scholar] [CrossRef]
- Jozwiak, L.M.; Head, J.W.; Wilson, L. Lunar floor-fractured craters as magmatic intrusions: Geometry, modes of emplacement, associated tectonic and volcanic features, and implications for gravity anomalies. Icarus 2015, 248, 424–447. [Google Scholar] [CrossRef]
- Lu, T.; Zhu, K.; Chen, S.; Liu, J.; Ling, Z.; Ding, X.; Han, K.; Chen, J.; Cheng, W.; Lei, D.; et al. The 1:2,500,000-scale global tectonic map of the Moon. Sci. Bull. 2022, 67, 1962–1966. [Google Scholar] [CrossRef]
- Ji, J.; Guo, D.; Liu, J. The 1:2,500,000-scale geologic map of the global Moon. Sci. Bull. 2022, 67, 1544–1548. [Google Scholar] [CrossRef] [PubMed]
- Rubin, A.M. Dike-induced faulting and graben subsidence in volcanic rift zones. J. Geophys. Res. 1992, 97, 1839–1858. [Google Scholar] [CrossRef]
- Rubin, A.M. Tensile fracture of rock at high confining pressure: Implications for dike propagation. J. Geophys. Res. 1993, 98, 15919–15935. [Google Scholar] [CrossRef]
- Wilson, L.; Head, J.W. Tharsis-radial graben system as the surface manifestation of plume-related dike intrusion complexes—Models and implications. J. Geophys. Res. 2002, 107, 5057. [Google Scholar] [CrossRef]
- Wilson, L.; Hawke, B.R.; Giguere, T.A.; Petrycki, E.R. An igneous origin for Rima Hyginus and Hyginus crater on the Moon. Icarus 2011, 215, 584–595. [Google Scholar] [CrossRef]
- Petrycki, J.A.; Wilson, L. Volcanic features and age relationships associated with lunar graben. In Proceedings of the Lunar and Planetary Science Conference, Houston, TX, USA, 15–19 March 1999; p. 1335. [Google Scholar]
- Lucchitta, B.K.; Watkins, J.A. Age of graben systems on the Moon. In Proceedings of the Ninth Lunar and Planetary Science Conference, Houston, TX, USA, 13–17 March 1978; pp. 3459–3472. [Google Scholar]
- Hiesinger, H.; Jaumann, R.; Neukum, G.; Head, J.W. Ages of mare basalts on the lunar nearside. J. Geophys. Res. Planets 2000, 105, 29239–29275. [Google Scholar] [CrossRef]
- Hiesinger, H.; Head, J.W.; Wolf, U.; Jaumann, R.; Neukum, G. Ages and stratigraphy of mare basalts in Oceanus Procellarum, Mare Nubium, Mare Cognitum, and Mare Insularum. J. Geophys. Res. 2000, 108, 5065. [Google Scholar] [CrossRef]
- Hiesinger, H.; Head, J.W.; Wolf, U.; Jaumann, R. Ages of lunar mare basalts in Mare Frigoris and other Nearside Maria. In Proceedings of the XXXIV Lunar & Planetary Science Conference, Houston, TX, USA, 17–21 March 2003; p. 1257. [Google Scholar]
- Hiesinger, H.; Head, J.W.; Wolf, U.; Jaumann, R.; Neukum, G. New ages for basalts in Mare Fecunditatis based on crater size-frequency measurements. In Proceedings of the XXXVII Lunar & Planetary Science Conference, Houston, TX, USA, 13–17 March 2006; p. 1151. [Google Scholar]
- Morota, T.; Haruyama, J.; Ohtake, M.; Matsunaga, T.; Honda, C.; Yokota, Y.; Kimura, J.; Ogawa, Y.; Hirata, N.; Demura, H.; et al. Timing and characteristics of the latest mare eruption on the Moon. Earth Planet. Sci. Lett. 2011, 302, 255–266. [Google Scholar] [CrossRef]
- Qian, Y.; She, Z.; He, Q.; Xiao, L.; Wang, Z.; Head, J.W.; Sun, L.; Wang, Y.; Wu, B.; Wu, X.; et al. Mineralogy and chronology of the young mare volcanism in the Procellarum-KREEP-Terrane. Nat. Astron. 2023, 7, 287–297. [Google Scholar] [CrossRef]
- Head, J.W.; Wilson, L. Lunar mare volcanism: Stratigraphy, eruption conditions, and evolution of secondary crust. Geochim. Cosmochim. Acta 1992, 56, 2155–2175. [Google Scholar] [CrossRef]
- Rubin, A.M.; Pollard, D.D. Origins of Blade-Like Dikes in Volcanic Rift Zones; Volcanism in Hawaii, USGS Project Paper; USGS: Reston, VA, USA, 1987; Volume 1350, pp. 1449–1470. [Google Scholar]
- Scott, R.; Wilson, L. The stress state of the lunar lithosphere and the volumes of intruded and erupted magmas. In Proceedings of the 32nd Annual Lunar and Planetary Science Conference, Houston, TX, USA, 12–16 March 2001; p. 1549. [Google Scholar]
- Anderson, E.M. The Dynamics of Faulting, 2nd ed.; Oliver and Boyd: London, UK, 1951; 206p. [Google Scholar]
- Solomon, S.C. The relationship between crustal tectonics and internal evolution in the Moon and Mercury. Phys. Earth Planet. Inter. 1977, 15, 135–145. [Google Scholar] [CrossRef]
- Solomon, S.C.; Chaiken, J. Thermal expansion and thermal stress in the moon and terrestrial planets: Clues to early thermal history. In Proceedings of the Lunar Science Conference, Houston, TX, USA, 15–19 March 1976; pp. 3229–3243. [Google Scholar]
- Barker, M.K.; Mazarico, E.; Neumann, G.A.; Zuber, M.T.; Haruyama, J.; Smith, D.E. A new lunar digital elevation model from the Lunar Orbiter Laser Altimeter and SELENE Terrain Camera. Icarus 2016, 273, 346–355. [Google Scholar] [CrossRef]
- Burgmann, R.; Pollard, D.D.; Martel, S.J. Slip distributions on faults: Effects of stress gradients, inelastic deformation, heterogeneous host-rock stiffness, and fault interaction. J. Struct. Geol. 1994, 16, 1675–1690. [Google Scholar] [CrossRef]
- Scholz, C.H.; Cowie, P.A. Determination of geologic strain from fault slip data. Nature 1990, 346, 837–839. [Google Scholar] [CrossRef]
- Cowie, P.A.; Scholz, C.H.; Edwards, M.; Malinverno, A. Fault strain and seismic coupling on mid-ocean ridges. J. Geophys. Res. 1993, 98, 17911–17920. [Google Scholar] [CrossRef]
- Cowie, P.A.; Scholz, C.H. Displacement-length scaling relationship for faults: Data synthesis and discussion. J. Struct. Geol. 1992, 14, 1149–1156. [Google Scholar] [CrossRef]
- Handin, J. Strength and ductility. In Handbook of Physical Constants; Geological Society of America Member: Boulder, CO, USA, 1966; Volume 97, pp. 223–289. [Google Scholar]
- Handin, J.; Hager, R.V., Jr. Experimental deformation of sedimentary rocks under confining pressure: Tests at room temperature on dry samples. Am. Assoc. Petrol. Geol. Bull. 1957, 41, 1–50. [Google Scholar]
- Handin, J.; Hager, R.V., Jr. Experimental deformation of sedimentary rocks under confining pressure: Tests at high temperature. Am. Assoc. Petrol. Geol. Bull. 1958, 42, 2892–2934. [Google Scholar]
- Nahm, A.L.; Schultz, R.A. Rupes Recta and the geological history of the Mare Nubium region of the Moon: Insights from forward mechanical modelling of the “Straight Wall”. Volcanism and Tectonism Across the Inner Solar System. Geol. Soc. Lond. Spec. Publ. 2015, 401, 377–394. [Google Scholar] [CrossRef]
- Pollard, D.D.; Segall, P. Theoretical displacements and stresses near fractures in rock: With applications to faults, joints, veins, dikes, and solution surfaces. In Fracture Mechanics of Rock; Atkinson, B.K., Ed.; Academic: San Diego, CA, USA, 1987; pp. 277–350. [Google Scholar]
- Walsh, J.J.; Waterson, J. Analysis of the relationship between displacements and dimensions of faults. J. Struct. Geol. 1988, 10, 239–247. [Google Scholar] [CrossRef]
- Cowie, P.A.; Scholz, C.H. Physical explanation for displacement-length relationship for faults using a post-yield fracture mechanics model. J. Struct. Geol. 1992, 14, 1133–1148. [Google Scholar] [CrossRef]
- Cowie, P.A.; Scholz, C.H. Growth of faults by accumulation of seismic slip. J. Geophys. Res. 1992, 97, 11085–11096. [Google Scholar] [CrossRef]
- Wilkins, S.J.; Schultz, R.A.; Anderson, R.C.; Dohm, J.M.; Dawers, N.H. Deformation rates from faulting at the Tempe Terra extensional province. Mars. Geophys. Res. Lett. 2002, 29, 1884. [Google Scholar] [CrossRef]
- Schultz, R.A.; Okubo, C.H.; Wilkins, S.J. Displacement-length scaling relations for faults on the terrestrial planets. J. Struct. Geol. 2006, 28, 2182–2193. [Google Scholar] [CrossRef]
- Watters, T.R.; Johnson, C.L. Lunar tectonics. In Planetary Tectonics; Watters, T.R., Schultz, R.A., Eds.; Cambridge University Press: Cambridge, UK, 2010; pp. 121–182. [Google Scholar]
- Li, B.; Ling, Z.; Zhang, J.; Chen, J.; Ni, Y.; Liu, C. Displacement-length ratios and contractional strains of lunar wrinkle ridges in mare serenitatis and mare tranquillitatis. J. Struct. Geol. 2018, 109, 27–37. [Google Scholar] [CrossRef]
- Dawers, N.H.; Anders, M.H. Displacement-length scaling and fault linkage. J. Struct. Geol. 1995, 17, 607–614. [Google Scholar] [CrossRef]
- Clark, R.; Cox, S. A modern regression approach to determining fault displacementlength scaling relationships. J. Struct. Geol. 1996, 18, 147–154. [Google Scholar] [CrossRef]
- Schultz, R.A.; Fossen, H. Displacement-length scaling in three dimensions: The importance of aspect ratio and application to deformation bands. J. Struct. Geol. 2002, 24, 1389–1411. [Google Scholar] [CrossRef]
- Dong, J.; Zhang, S.H.; Jiang, Y.B. The displacement-length relationship of faults and its significance. Earth Sci. Front. 2004, 11, 575–584. (In Chinese) [Google Scholar]
- Polit, A.T.; Schultz, R.A.; Soliva, R. Geometry, displacement-length scaling, and extensional strain of normal faults on mars with inferences on mechanical stratigraphy of the martian crust. J. Struct. Geol. 2009, 31, 662–673. [Google Scholar] [CrossRef]
- Martin, E.S.; Watters, T.R. Displacement-length scaling relations of nearside graben: Evidence of restricted normal faults on the Moon. Icarus 2022, 388, 115215. [Google Scholar] [CrossRef]
- Arvidson, R.; Drozd, R.J.; Hohenberg, C.M.; Morgan, C.J.; Poupeau, G. Horizontal transport of the regolith, modification of features, and erosion rates on the lunar surface. Moon 1975, 13, 67–79. [Google Scholar] [CrossRef]
- Solomon, S.; Head, J.W. Lunar mascon basins: Lava filling, tectonics, and evolution of the lithosphere Rev. Geophys. Space Phys. 1980, 18, 107–141. [Google Scholar] [CrossRef]
- Pollard, D.D.; Delaney, P.T.; Dutlield, W.A.; Endo, E.T.; Okanmra, A.T. Surface deformation in volcanic rift zones. Tectonophys 1983, 94, 541–584. [Google Scholar] [CrossRef]
- Mège, D.; Cook, A.C.; Garel, E.; Lagabrielle, Y.; Cormier, M.-H. Volcanic rifting at Marian graben. J. Geophys. Res. 2003, 108, 5044. [Google Scholar] [CrossRef]
- Schultz, R.A.; Okubo, C.H.; Goudy, C.L.; Wilkins, S.J. Igneous dikes on Mars revealed by Mars Orbiter Laser Altimeter topography. Geology 2004, 32, 889–892. [Google Scholar] [CrossRef]
- Schultz, R.A.; Moore, J.M.; Grosfils, E.B.; Tanaka, K.L.; Mege, D. The Canyonlands model for planetary grabens: Revised physical basis and implications. In The Geology of Mars: Evidence from Earth-Based Analogs; Chapman, M., Ed.; Cambridge University Press: Cambridge, UK, 2007; pp. 371–399. [Google Scholar]
- Wichman, R.W.; Schultz, P.H. Floor-fractured craters in Mare Smythii and west of Oceanus Procellarum: Implications of crater modification by viscous relaxation and igneous intrusion models. J. Geophys. Res. Planets 1995, 100, 21201–21218. [Google Scholar] [CrossRef]
- Klimczak, C. Igneous Dikes on the Moon: Evidence from Lunar Orbiter Laser Altimeter Topography. In Proceedings of the 44th Lunar and Planetary Science Conference, Houston, TX, USA, 18–22 March 2013. [Google Scholar]
- Klimczak, C. Geomorphology of lunar grabens requires igneous dikes at depth. Geology 2014, 42, 963–966. [Google Scholar] [CrossRef]
- Martin, E.S.; Watters, T.R. A tectonic origin for non-mascon related lunar graben. In Proceedings of the 49th Lunar and Planetary Science Conference, Woodlands, TX, USA, 19–23 March 2018; p. 2846. [Google Scholar]
- Guo, D.; Liu, J.; Head, J.; Zhang, F.; Ling, Z.; Chen, S.; Ding, X.; Ji, J.; Ouyang, Z. A Lunar Time Scale from the Perspective of the Moon’s Dynamic Evolution. Sci. China Earth Sci. 2023; accepted and in press. [Google Scholar]
- Yue, Z.; Michael, G.G.; Di, K.; Liu, J. Global survey of lunar wrinkle ridge formation times. Earth Planet. Sci. Lett. 2017, 477, 14–20. [Google Scholar] [CrossRef]
- Watters, T.R.; Robinson, M.S.; Beyer, R.A.; Banks, M.E.; Bell, J.F., III; Pritchard, M.E.; Hiesinger, H.; Van Der Bogert, C.H.; Thomas, P.C.; Turtle, E.P.; et al. Evidence of recent thrust faulting on the Moon revealed by the Lunar Reconnaissance Orbiter Camera. Science 2010, 329, 936–940. [Google Scholar] [CrossRef]
- Watters, T.R.; Robinson, M.S.; Collins, G.C.; Banks, M.E.; Daud, K.; Williams, N.R.; Selvans, M.M. Global thrust faulting on the Moon and the influence of tidal stresses. Geology 2015, 43, 851–854. [Google Scholar] [CrossRef]


| No. | Graben Name | Location | Length/km | Depth/m | Maximum Measured Wall Slope/° | Number of Profiles | Number of Calculation Results | Dips/° | |
|---|---|---|---|---|---|---|---|---|---|
| Starting/° (X, Y) | End/° (X, Y) | ||||||||
| 1 | / | −67.33, 2.45 | −64.74, −0.19 | 111 | 177 | 29 | 6 | 15 | 46.4 |
| 2 | / | −74.00, −2.98 | −72.78, −5.60 | 87 | 161 | 23 | 4 | 6 | 47.8 |
| 3 | / | −78.29, 4.58 | −76.42, 2.81 | 76 | 125 | 20 | 3 | 3 | 4.0 |
| 4 | Gerard | −84.61, 49.46 | −85.89, 47.12 | 79 | 83 | 19 | 6 | 15 | 61.6 |
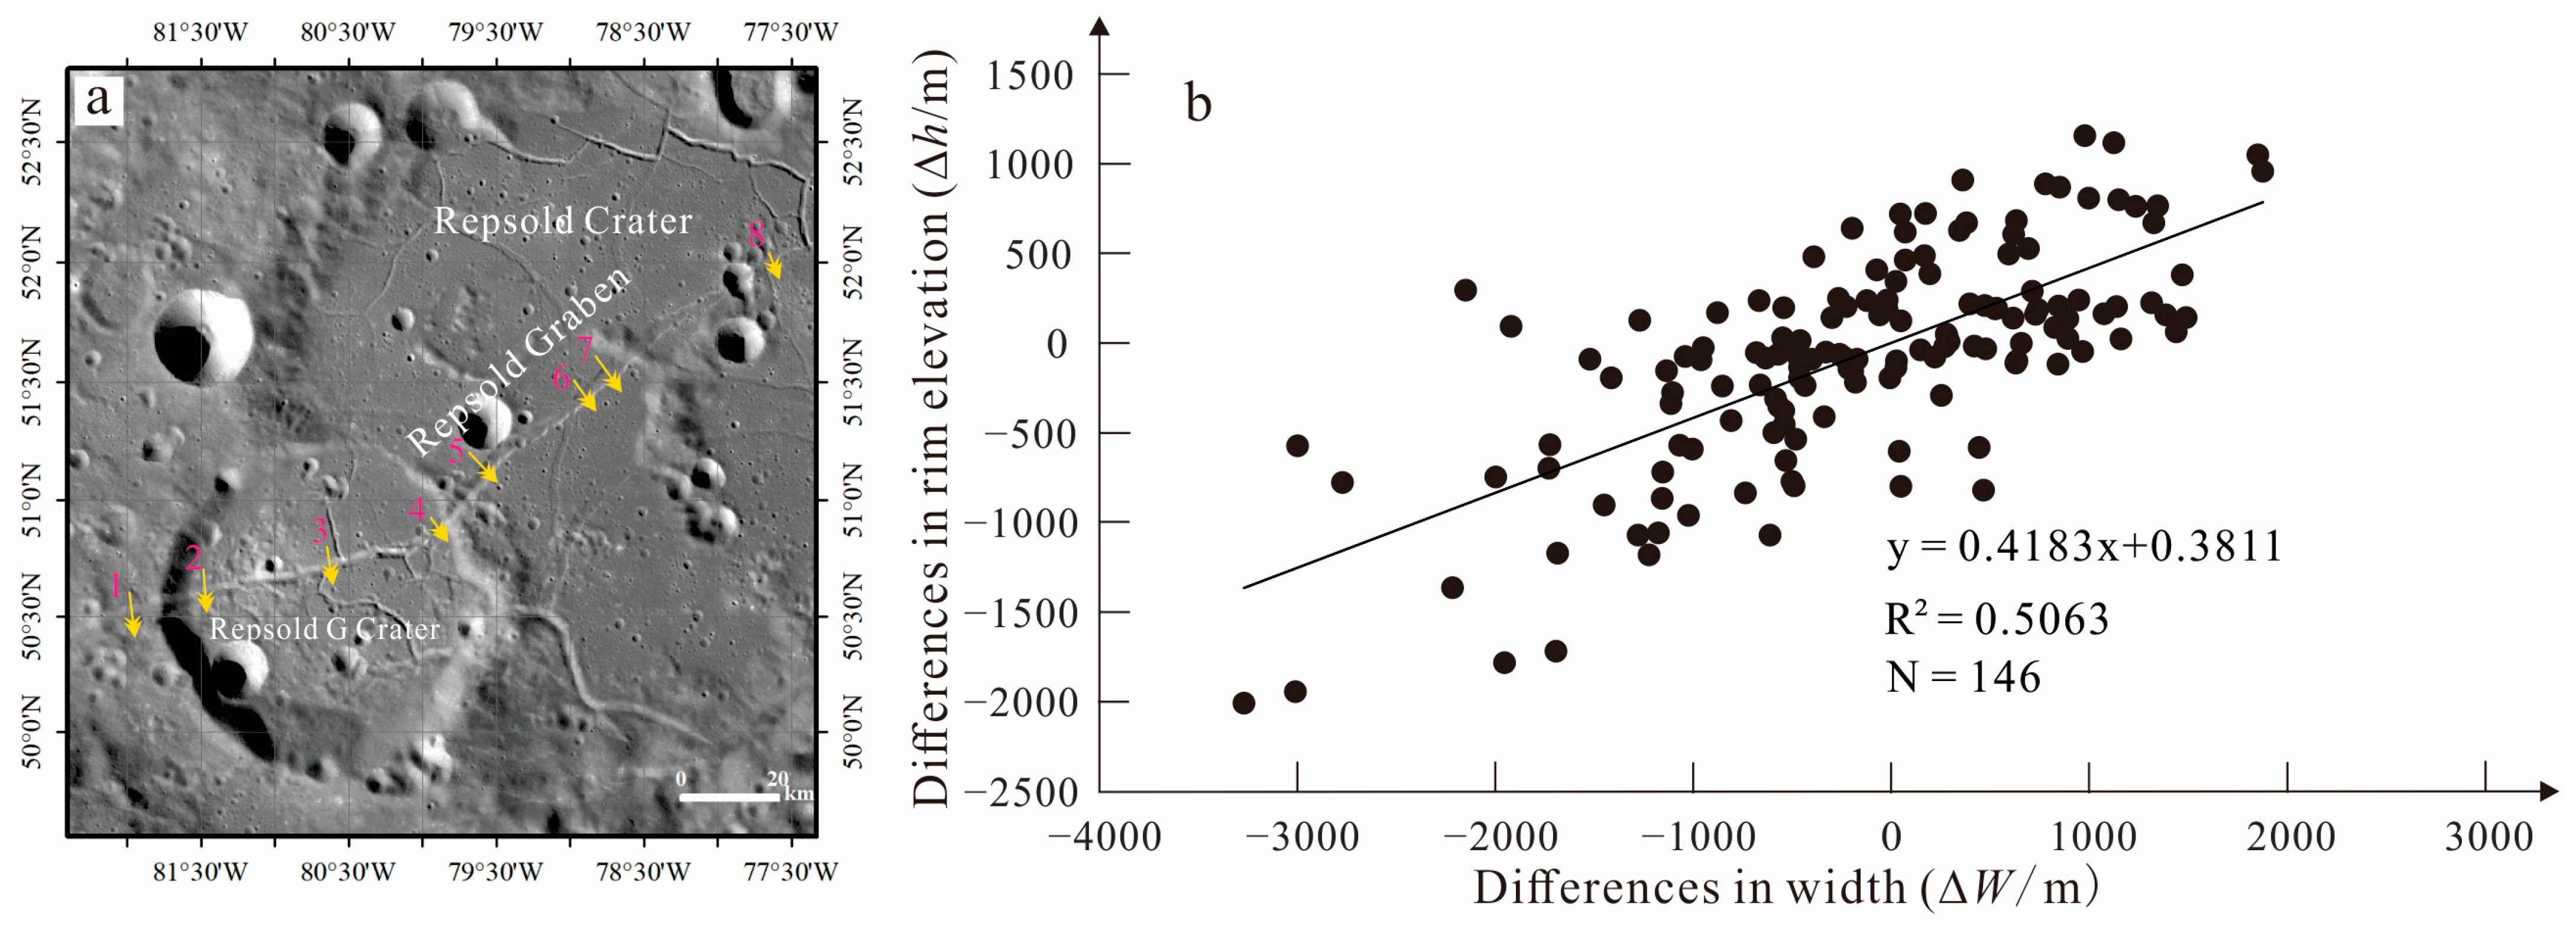
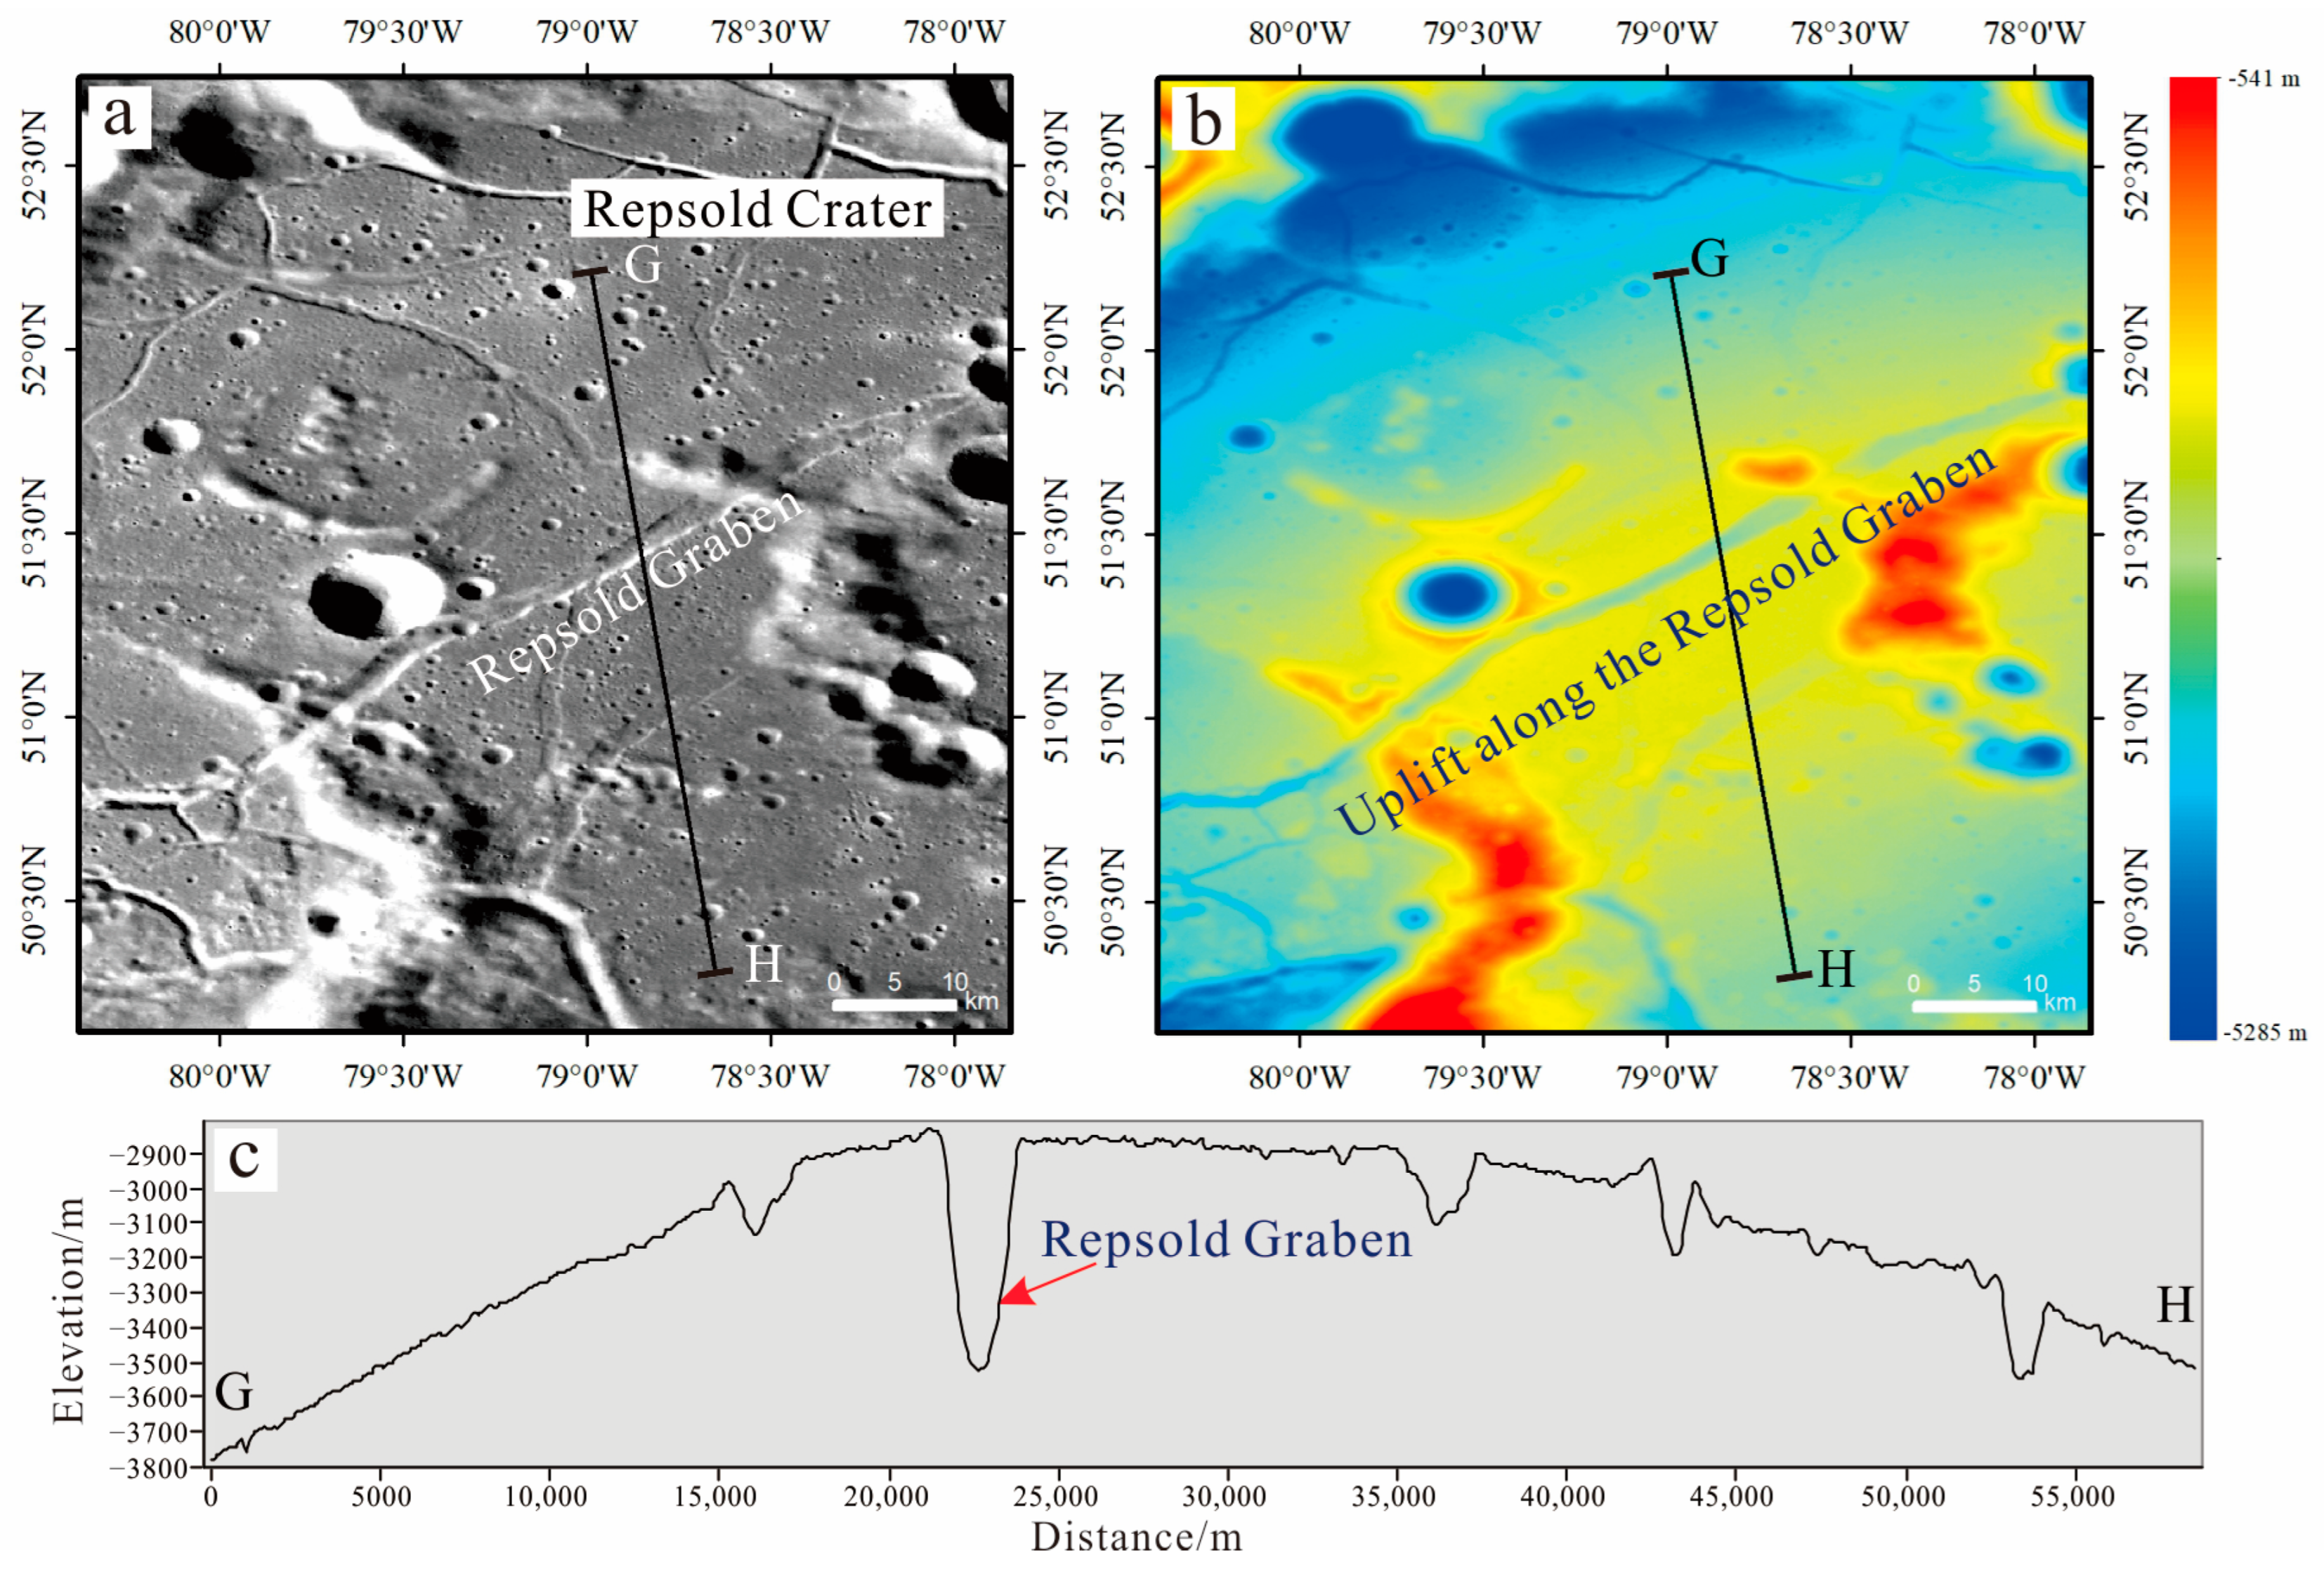
| 5 | Repsold | −82.72, 50.34 | −77.14, 51.88 | 159 | 274 | 36 | 8 | 28 | 52.3 |
| 6 | Sirsalis | −61.99, −16.19 | −66.05, −20.97 | 184 | 342 | 40 | 8 | 28 | 41.5 |
| 7 | de Gasparis | −48.32, −23.00 | −50.69, −25.86 | 109 | 144 | 31 | 3 | 3 | 16.1 |
| 8 | / | −50.98, −25.64 | −48.76, −27.94 | 92 | 173 | 30 | 4 | 6 | 45.4 |
| 9 | / | −46.78, −26.13 | −47.82, −29.10 | 96 | 83 | 25 | 3 | 3 | −2.4 |
| 10 | Hippalus-1 | −30.20, −22.22 | −33.44, −29.24 | 245 | 225 | 47 | 3 | 3 | 26.6 |
| 11 | Hippalus-2 | −29.43, −25.69 | −31.14, −28.60 | 99 | 84 | 24 | 2 | 1 | 3.3 |
| 12 | Hippalus-3 | −28.55, −23.57 | −28.77, −26.16 | 95 | 127 | 21 | 2 | 1 | −3 |
| 13 | Hesiodus | −27.53, −32.40 | −17.16, −28.94 | 279 | 142 | 24 | 6 | 15 | 13.3 |
| 14 | / | 9.62, 7.65 | 14.41, 6.08 | 136 | 291 | 34 | 5 | 10 | 34.6 |
| 15 | Goclenius-1 | 41.39, −6.40 | 43.88, −9.01 | 103 | 127 | 23 | 3 | 3 | 21.8 |
| 16 | Goclenius-2 | 43.89, −9.11 | 45.22, −10.43 | 53 | 132 | 21 | 3 | 3 | 61.5 |
| 17 | / | 30.36, 30.24 | 29.96, 27.49 | 84 | 182 | 20 | 3 | 3 | 68.5 |
| Total | 69 | 146 | |||||||
| Average | 41.3 | ||||||||
| No. | Length/km | Number of Profiles | Dips/° | Reason for Removing Profiles | Number of Remaining Profiles | Number of Remaining Calculation Results | Corrected Dips/° |
|---|---|---|---|---|---|---|---|
| 1 | 111 | 6 | 46.4 | / | 6 | 15 | 46.4 |
| 2 | 87 | 4 | 47.8 | / | 4 | 6 | 47.8 |
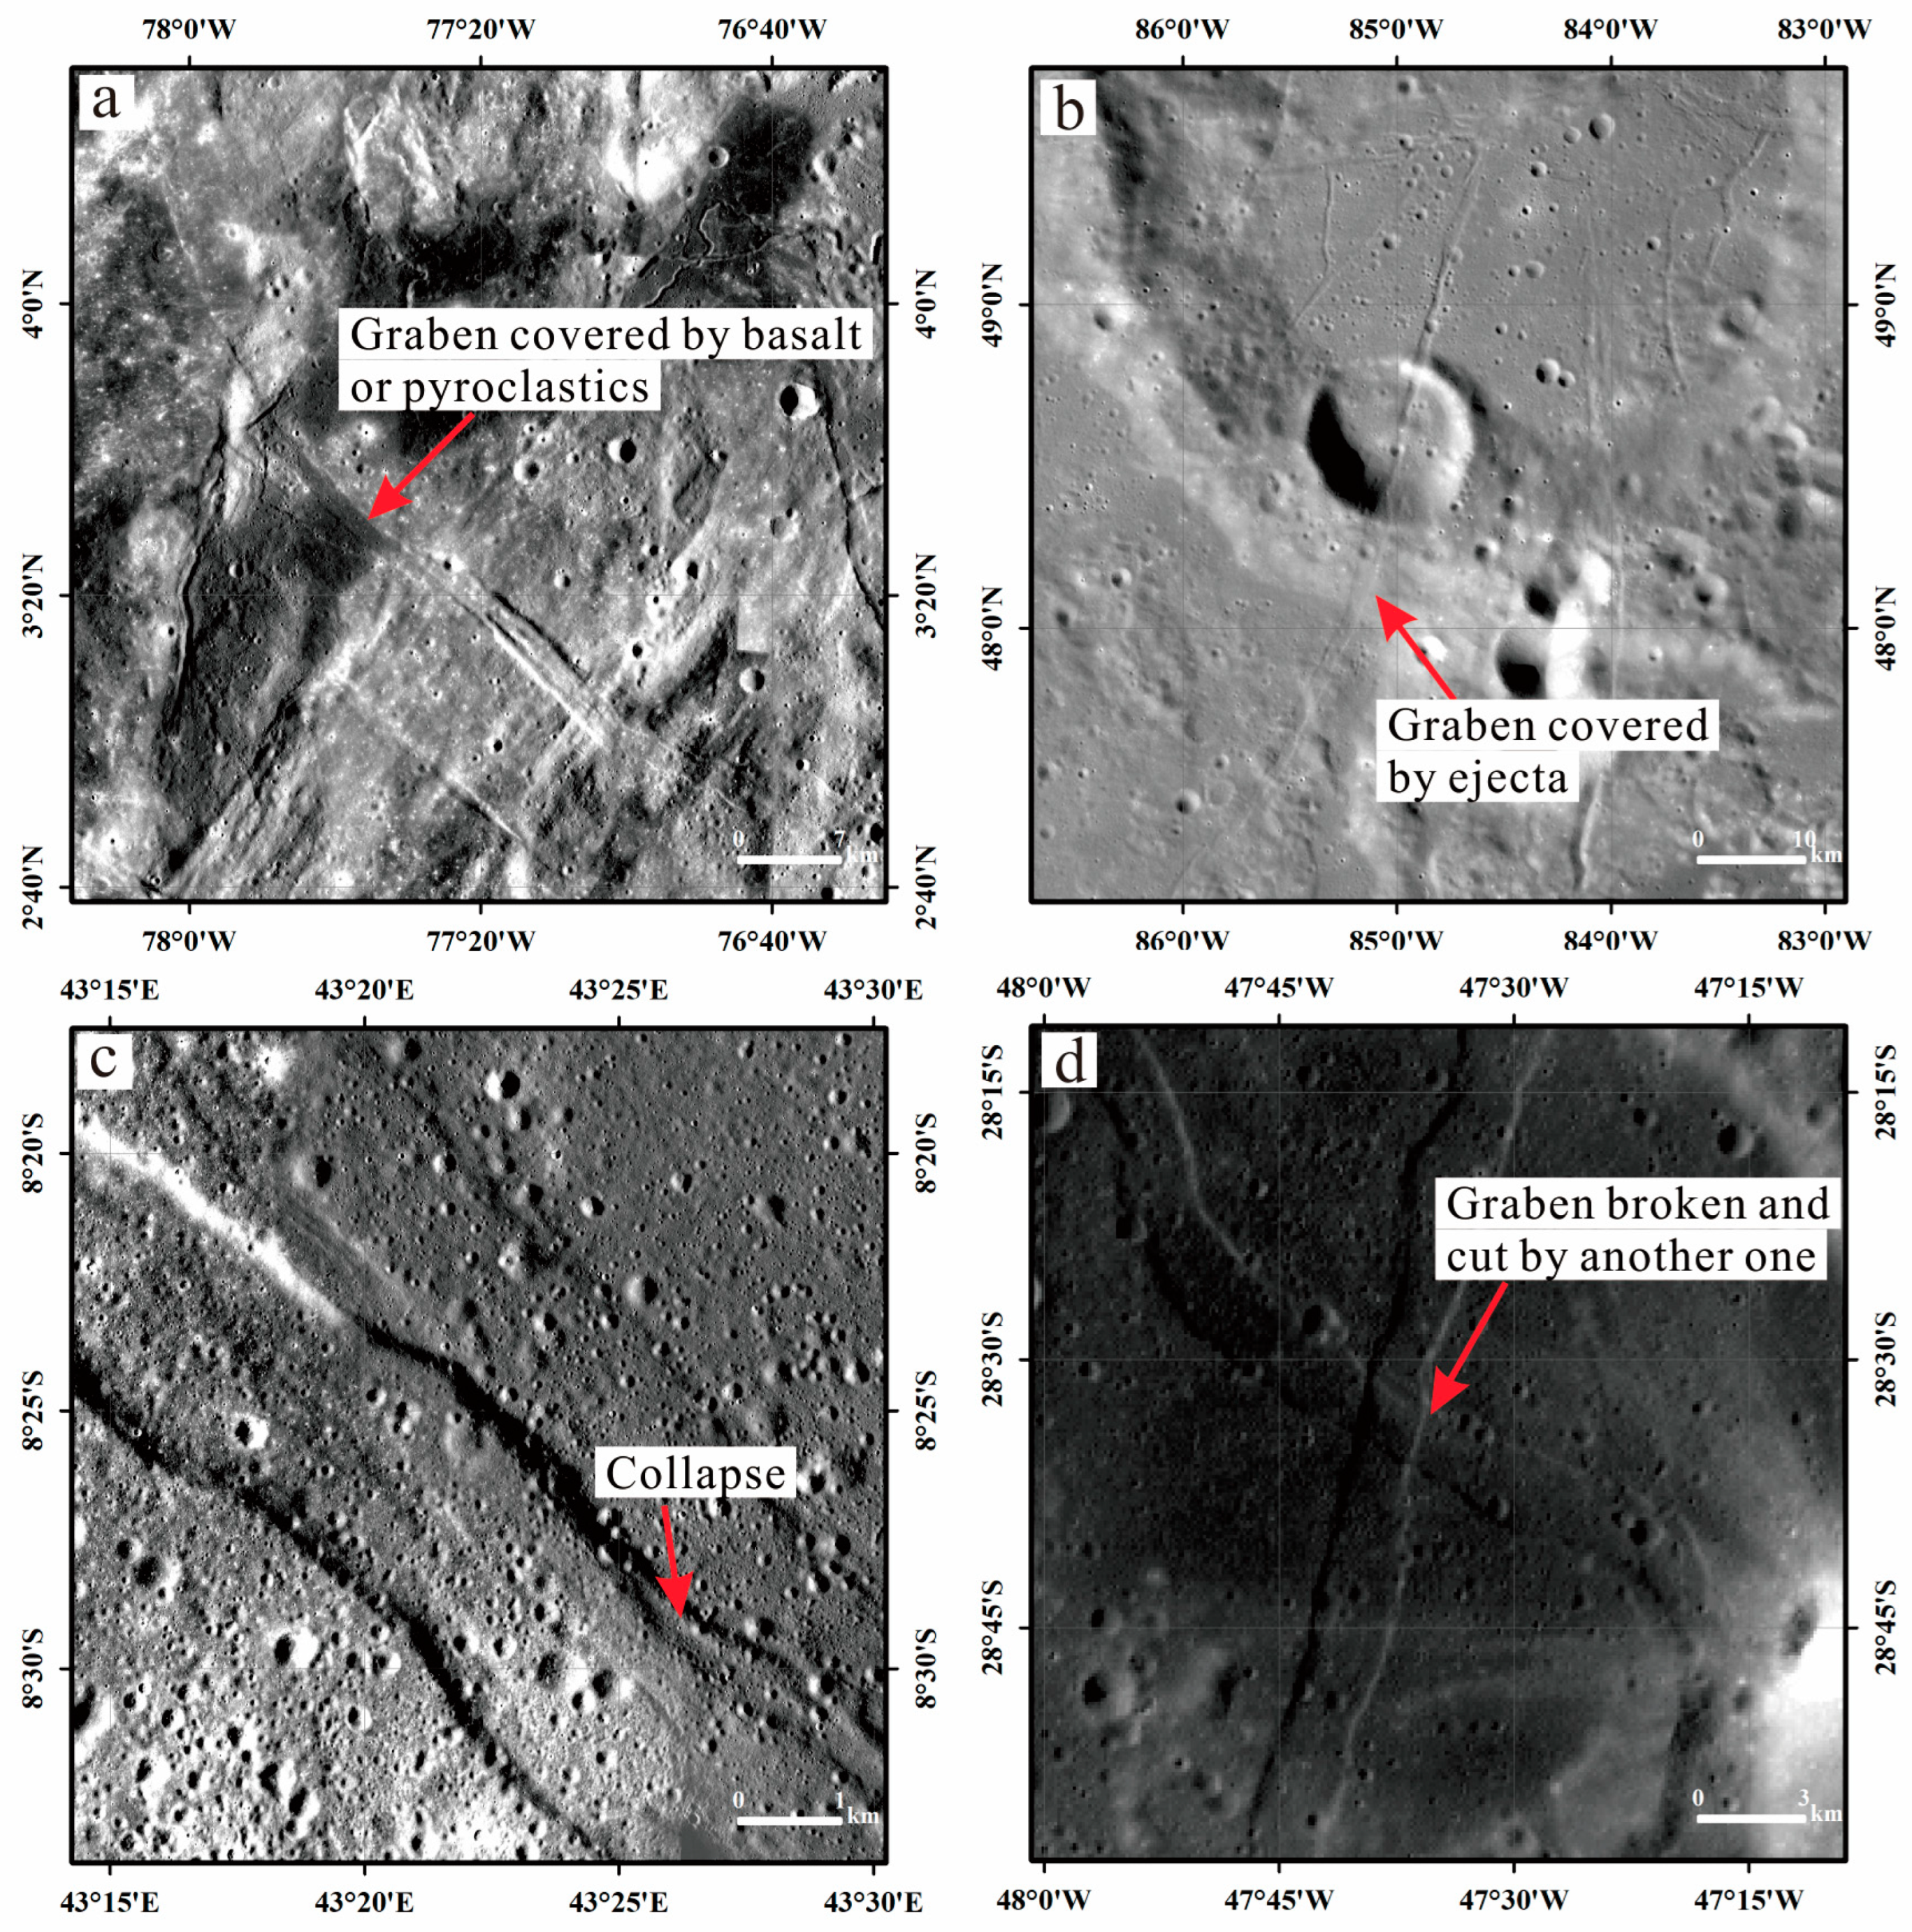
| 3 | 76 | 3 | 4.0 | The graben where a profile passes through is filled with basalt. The other two are located too close to each other, resulting in small ∆h and large errors. | 0 | 0 | / |
| 4 | 79 | 6 | 61.6 | Two profiles are filled with ejecta, resulting in significant changes in rim elevation. | 4 | 6 | 61.0 |
| 5 | 159 | 8 | 52.3 | The graben passes through two craters, and the crater floor show significant uplift. All dips calculated from ∆h and ∆W have large errors. However, the dip calculated by standard linear regression is 52.3°. | 8 | 28 | 52.3 |
| 6 | 184 | 8 | 41.5 | Multi-stage structures and ejecta filling are developed along the extension of the graben. All dips calculated from ∆h and ∆W have large errors. | 8 | 28 | 41.5 |
| 7 | 109 | 3 | 16.1 | One of profiles is influenced by collapse accumulations. This profile is removed. | 2 | 1 | 46.6 |
| 8 | 92 | 4 | 45.4 | / | 4 | 6 | 45.4 |
| 9 | 96 | 3 | −2.4 | This graben is intersected by another graben, and its overall shape and boundaries are unclear. | 0 | 0 | / |
| 10 | 245 | 3 | 26.6 | One of profiles is covered by ejecta, and this profile was removed. | 2 | 1 | 56.4 |
| 11 | 99 | 2 | 3.3 | Difference in elevation is small (~25 m), resulting in large error. | 0 | 0 | / |
| 12 | 95 | 2 | −3 | Difference in elevation is small (~12 m), resulting in large error. | 0 | 0 | / |
| 13 | 279 | 6 | 13.3 | The elevation changes along the graben extension are not significant. In addition, many radiational patterns of ejecta cover this graben. | 0 | 0 | / |
| 14 | 136 | 5 | 34.6 | Two profiles have passed through areas with later uplift, and they are removed. Compared to these two profiles, only one profile has a significant elevation difference. Thus, two values calculated from large ∆h are selected for calculation. | 3 | 2 | (39 + 63.9)/2 = 51.5 |
| 15 | 103 | 3 | 21.8 | One profile has a significant elevation difference from the other two. Two values calculated from large ∆h are selected for dip calculation. | 3 | 2 | (46.8 + 67.4)/2 = 57.1 |
| 16 | 53 | 3 | 61.5 | One profile passed through the areas with later uplift, and it was removed. | 2 | 1 | 59.2 |
| 17 | 84 | 3 | 68.5 | One profile has a significant elevation difference from the other two. Two values calculated from large ∆h are selected for dip calculation. | 3 | 2 | (63.2 + 67.1)/2 = 65.2 |
| Total | 69 | 98 | |||||
| Average | 41.3 | 52.5 |
| Latitude/° | Number of Grabens | Total Length/km |
|---|---|---|
| 60~40 | 116 | 2739 |
| 40~20 | 149 | 3460 |
| 20~0 | 268 | 5778 |
| 0~−20 | 154 | 5405 |
| −20~−40 | 109 | 4582 |
| −40~−60 | 1 | 272 |
Disclaimer/Publisher’s Note: The statements, opinions and data contained in all publications are solely those of the individual author(s) and contributor(s) and not of MDPI and/or the editor(s). MDPI and/or the editor(s) disclaim responsibility for any injury to people or property resulting from any ideas, methods, instructions or products referred to in the content. |
© 2023 by the authors. Licensee MDPI, Basel, Switzerland. This article is an open access article distributed under the terms and conditions of the Creative Commons Attribution (CC BY) license (https://creativecommons.org/licenses/by/4.0/).
Share and Cite
Zhu, K.; Liu, J.; Michael, G.; Lei, D.; Zeng, X. Constraints on the Fault Dip Angles of Lunar Graben and Their Significance for Lunar Thermal Evolution. Remote Sens. 2024, 16, 107. https://doi.org/10.3390/rs16010107
Zhu K, Liu J, Michael G, Lei D, Zeng X. Constraints on the Fault Dip Angles of Lunar Graben and Their Significance for Lunar Thermal Evolution. Remote Sensing. 2024; 16(1):107. https://doi.org/10.3390/rs16010107
Chicago/Turabian StyleZhu, Kai, Jianzhong Liu, Gregory Michael, Danhong Lei, and Xuejin Zeng. 2024. "Constraints on the Fault Dip Angles of Lunar Graben and Their Significance for Lunar Thermal Evolution" Remote Sensing 16, no. 1: 107. https://doi.org/10.3390/rs16010107
APA StyleZhu, K., Liu, J., Michael, G., Lei, D., & Zeng, X. (2024). Constraints on the Fault Dip Angles of Lunar Graben and Their Significance for Lunar Thermal Evolution. Remote Sensing, 16(1), 107. https://doi.org/10.3390/rs16010107