Article

Detection of Rubber Tree Powdery Mildew from Leaf Level Hyperspectral Data Using Continuous Wavelet Transform and Machine Learning

1
State Key Laboratory of Remote Sensing Science, Aerospace Information Research Institute, Chinese Academy of Sciences, Beijing 100094, China
2
Key Laboratory of Earth Observation of Hainan Province, Hainan Aerospace Information Research Institute, Sanya 572029, China
3
University of Chinese Academy of Sciences, Beijing 100049, China
4
Yunnan Key Laboratory of Sustainable Utilization Research on Rubber Tree, Yunnan Institute of Tropical Crops, Jinhong 666100, China
5
National and Local Joint Engineering Research Center of Breeding and Cultivation Technology of Rubber Tree, Yunnan Institute of Tropical Crops, Jinhong 666100, China
6
Honghe Tropical Agriculture Institute of Yunnan, Honghe 661300, China
*
Author to whom correspondence should be addressed.
These authors contributed equally to this work.
Remote Sens. 2024, 16(1), 105; https://doi.org/10.3390/rs16010105
Submission received: 20 November 2023 / Revised: 16 December 2023 / Accepted: 25 December 2023 / Published: 26 December 2023
(This article belongs to the Section Remote Sensing in Agriculture and Vegetation)

Abstract

:
Powdery mildew is one of the most significant rubber tree diseases, with a substantial impact on the yield of natural rubber. This study aims to establish a detection approach that coupled continuous wavelet transform (CWT) and machine learning for the accurate assessment of powdery mildew severity in rubber trees. In this study, hyperspectral reflectance data (350–2500 nm) of healthy and powdery mildew-infected leaves were measured with a spectroradiometer in a laboratory. Subsequently, three types of wavelet features (WFs) were extracted using CWT. They were as follows: WFs dimensionally reduced by the principal component analysis (PCA) of significant wavelet energy coefficients (PCA-WFs); WFs extracted from the top 1% of the determination coefficient between wavelet energy coefficients and the powdery mildew disease class (1%R2-WFs); and all WFs at a single decomposition scale (SS-WFs). To assess the detection capability of the WFs, the three types of WFs were input into the random forest (RF), support vector machine (SVM), and back propagation neural network (BPNN), respectively. As a control, 13 optimal traditional spectral features (SFs) were extracted and combined with the same classification methods. The results revealed that the WF-based models all performed well and outperformed those based on SFs. The models constructed based on PCA-WFs had a higher accuracy and more stable performance than other models. The model combined PCA-WFs with RF exhibited the optimal performance among all models, with an overall accuracy (OA) of 92.0% and a kappa coefficient of 0.90. This study demonstrates the feasibility of combining CWT with machine learning in rubber tree powdery mildew detection.

Graphical Abstract

1. Introduction

The rubber tree is a cash crop native to Brazil and mainly grows in tropical and subtropical regions. The milky latex extracted from rubber trees serves as the primary source of natural rubber and is regarded as one of the four major industrial raw materials, alongside steel, petroleum, and coal [1]. Rubber tree powdery mildew, caused by the infestation of rubber trees by the pathogen Oidium heveae Steinmann, is one of the most significant diseases affecting rubber trees. Its occurrence and prevalence are influenced by a combination of factors, including rubber tree phenology, meteorological conditions, and pathogen population [2]. This disease primarily affects the tender leaves, buds, shoots, and inflorescences of rubber trees, substantially impacting the yield of natural rubber [3]. During the initial stages of infection, rubber tree leaves exhibit radial silvery mycelium. As the disease progresses, the mycelium develops into radially shaped, spider-like lesions, eventually forming unevenly sized powdery mildew spots. In severe cases, the affected leaves become covered with powdery mildew, leading to wrinkling, deformation, yellowing, and the eventual dropping of the leaves [4]. Traditional detection of rubber tree powdery mildew involves periodic leaf surveys during the peak of the disease, with disease management guided by weather forecasts. This method has several drawbacks, including the need for extensive human and material resources, limited representativeness, and an inability to meet the demand for large-scale, rapid detection in production. In addition, some detection sites may provide incomplete or untimely data, weakening their role in providing timely scientific guidance. Therefore, achieving the rapid and accurate detection of rubber tree powdery mildew is of paramount importance.
Hyperspectral remote sensing technology has found widespread application in the identification of crop diseases, owing to its advantages of rapid measurements, large coverage, and non-destructive nature [5,6]. Spectroscopic observations of crop disease symptoms using field spectroradiometers are typically conducted at the leaf and canopy scales. The primary focus of research based on such measurements is on characterizing spectral responses in the visible to near-infrared bands for the assessment of crop diseases, including traditional spectral features (SFs) such as vegetation indices and differential spectral features. Zhang et al. extracted 32 spectral features from indoor spectral data collected from winter wheat leaves and established two regression models, namely, multiple linear regression (MLR) and partial least squares regression (PLSR), to evaluate the severity of winter wheat powdery mildew [7]. Feng et al. collected hyperspectral data from wheat canopies to identify sensitive bands for wheat powdery mildew (ranging from 570–590 nm and 536–566 nm). Based on this, the authors developed the optimal dual-green vegetation index, which was effectively utilized to detect the disease [8]. Huang et al. combined spectral features of the first-order derivatives, spectral absorption features of continuum removal, and vegetation indices with a support vector machine (SVM) to construct a wheat Fusarium head blight identification model at the wheat ear scale [9].
Following on from the application of traditional spectral features, the continuous wavelet transform (CWT) is an emerging spectral analysis method that enables the multiscale decomposition of spectral data, allowing it to capture intricate spectral variations. As a result, it has been applied to detect and identify crop diseases [10,11]. Zhang et al. combined CWT with PLSR based on hyperspectral data from diseased leaves, enabling the assessment of winter wheat powdery mildew at the leaf level [12]. Luo et al. achieved the estimation of wheat aphid density by performing continuous wavelet analysis on the reflectance spectra of winter wheat leaf samples [13]. Shi et al. proposed a method based on wavelet features (WFs) to reveal the processes related to wheat stripe rust [14]. Ma et al. established a wheat Fusarium head blight identification model based on WFs [15]. The aforementioned studies employed a single thresholding method to determine WFs [16], demonstrating the superiority of CWT in crop disease detection. However, research on detecting rubber tree powdery mildew based on CWT is lacking, particularly using multiple types of WFs for detection. Therefore, the performance of CWT in rubber tree powdery mildew detection needs to be further explored.
Accurate classification algorithms are crucial in the establishment of precise crop disease detection models. In recent years, machine learning models have been extensively applied in the detection and identification of crop diseases due to their excellent classification performance [17,18,19]. Su et al. developed a wheat yellow rust detection system using the random forest (RF) method, enabling the identification of yellow rust at the farm scale [20]. Wang et al. proposed an SVM-based detection model for wheat disease severity, enabling the identification and severity evaluation of wheat stripe rust and leaf rust at the leaf level [21]. Bohnenkamp et al. also employed an SVM model to analyze images captured using a hyperspectral camera mounted on an unmanned aerial vehicle (UAV) operating 20 m above the ground, achieving the regional-level detection of wheat stripe rust [22]. Lan et al. employed remote sensing images to extract disease features, including texture, shape, and color, and utilized multiple machine learning algorithms, such as SVM and AdaBoost, allowing for the identification and classification of Citrus Huanglongbing [23]. The aforementioned studies have made substantial progress and provide a basis for further research. However, at present, research on the remote sensing detection of rubber tree powdery mildew is limited, highlighting the pressing need to develop new methods aimed at improving the accuracy of detecting rubber tree powdery mildew.
In order to fill the research gap, particularly addressing the limited research on remote sensing detection of rubber tree powdery mildew and the absence of studies utilizing CWT for feature extraction, this paper uses the hyperspectral reflectance data of rubber tree leaves as the data source and proposes a rubber tree powdery mildew detection model that combines CWT and machine learning to determine the features and methods that can effectively detect rubber tree powdery mildew. This study represents the first attempt in the research community to integrate remote sensing technology with CWT for rubber tree powdery mildew detection, and it is also one of the few studies utilizing multiple types of WF features for crop disease detection. The specific objectives of the study were to (1) evaluate the performance of WFs in detecting rubber tree powdery mildew and (2) construct a rubber tree powdery mildew detection model coupled with CWT and machine learning. This study holds significant reference value for the detection and control of rubber tree powdery mildew.

2. Materials and Methods

2.1. Study Area

The study area is located in the Dai Autonomous Prefecture of Xishuangbanna, Yunnan Province, China (22°2′N, 100°52′E), at an elevation of 852.2 m. Xishuangbanna features a warm and humid climate throughout the year, with annual average temperatures ranging from 18.9 to 23.5 °C and annual rainfall between 1214.8 and 1615.9 mm [24]. Rubber tree powdery mildew is a typical climate-dependent disease, with low temperatures and rainy conditions favoring its occurrence and spread. The experiment was conducted from 28 February to 2 March 2023 in both field and indoor settings. During this period, there was an above-average amount of precipitation, and the average temperatures were relatively low. The rubber tree phenology was predominantly in the bronze to pale-green stage, a critical period for detecting and controlling rubber tree powdery mildew.

2.2. Data Acquisition

The FieldSpec Pro FR spectrometer (ASD, Boulder, CO, USA) was employed to collect hyperspectral reflectance data of rubber tree leaves, with a spectral range of 350–2500 nm and spectral resolutions of 3 nm and 10 nm in the regions of 350–1000 nm and 1000–2500 nm, respectively [25,26]. During measurements, the leaves were positioned horizontally on the operating table, and each sample was measured five times to derive the average leaf spectral reflectance. Prior to measurements, spectral calibration was carried out using a standard white reference board, with recalibrations conducted at intervals of 10–20 min. A total of 1250 reflectance spectra were obtained, with the spectral curve resampled to 1 nm.
During the collection of the leaf hyperspectral reflectance data, disease severity levels were assessed according to the technical regulations for rubber tree powdery mildew prediction implemented in China in 2015 (NY/T1089-2015). Disease severity was classified into the following five levels based on the visual appearance of the rubber tree leaves and the size of lesions (Figure 1): (1) healthy (H) leaves without disease lesions; (2) disease Severity 1 (S1) describes leaves covered with a layer of a white powdery substance, with disease lesions occupying one-eighth of the total leaf area; (3) under disease Severity 2 (S2), disease lesions occupy one-quarter of the total leaf area, or leaves are mildly wrinkled due to the disease; (4) for disease Severity 3 (S3), disease lesions occupy half of the total leaf area, or leaves are moderately wrinkled due to the disease; and (5) for disease Severity 4 (S4) leaves, disease lesions occupy three-fourths of the total leaf area, or leaves are severely wrinkled due to the disease. Table 1 reports the specific grading standards. The final selection included 250 leaf samples, including 50 H, 50 S1, 50 S2, 50 S3, and 50 S4 samples.

2.3. Feature Extraction and Analysis

2.3.1. Traditional Spectral Features

Vegetation indices significantly amplify spectral differences through the combination and transformation of wavebands, yielding favorable outcomes in the remote sensing detection of crop diseases. Hyperspectral reflectance data can eliminate background effects and stray light reflection signals and increase implicit information through spectral differential transform. Thus, it is widely used in crop disease remote sensing detection research. In this study, based on previous research, we selected 23 spectral features from the two mentioned types, comprising 11 vegetation indices and 12 differential spectral features. These features were evaluated for their sensitivity to rubber tree powdery mildew using correlation analysis. Table 2 summarizes the definitions, descriptions, and references of these 23 features.

2.3.2. Continuous Wavelet Transform and Features Extraction

Continuous wavelet transform [38] is an important signal processing method that can localize both the frequency and time domains and refine functions or signals at different scales and positions. Based on CWT, the correlation analysis of the original spectral curves and Gaussian functions at different positions and scales generates a series of continuous wavelet energy coefficients. These energy coefficients are capable of extracting weak information from the spectra of various diseases. The output of CWT is as follows [39]:
W f a , b = + f λ ψ a , b λ d λ
where f λ is the reflectance spectrum, λ = 1, 2, …, m, with m denoting the number of bands—here we set m as 2151; W f a , b represents the wavelet coefficients that constitute a scalogram; and ψ a , b λ represents the mother wavelet basis function, with its generic form as follows:
ψ a , b λ = 1 a ψ λ b a
where a is the scaling factor indicating the width of the wavelet, and b is the shifting factor representing the position of the wavelet.
In this study, the Mexican hat wavelet (mexh), which exhibits similar vegetation absorption characteristics, was selected as the mother wavelet base function [40]. To facilitate computation without compromising the accuracy of CWT, only the wavelet powers at dyadic scales (i.e., 2^n, n = 1, 2, …, 10) [41] were retained and referred to as the 1st scale, 2nd scale, …, up to the 10th scale.
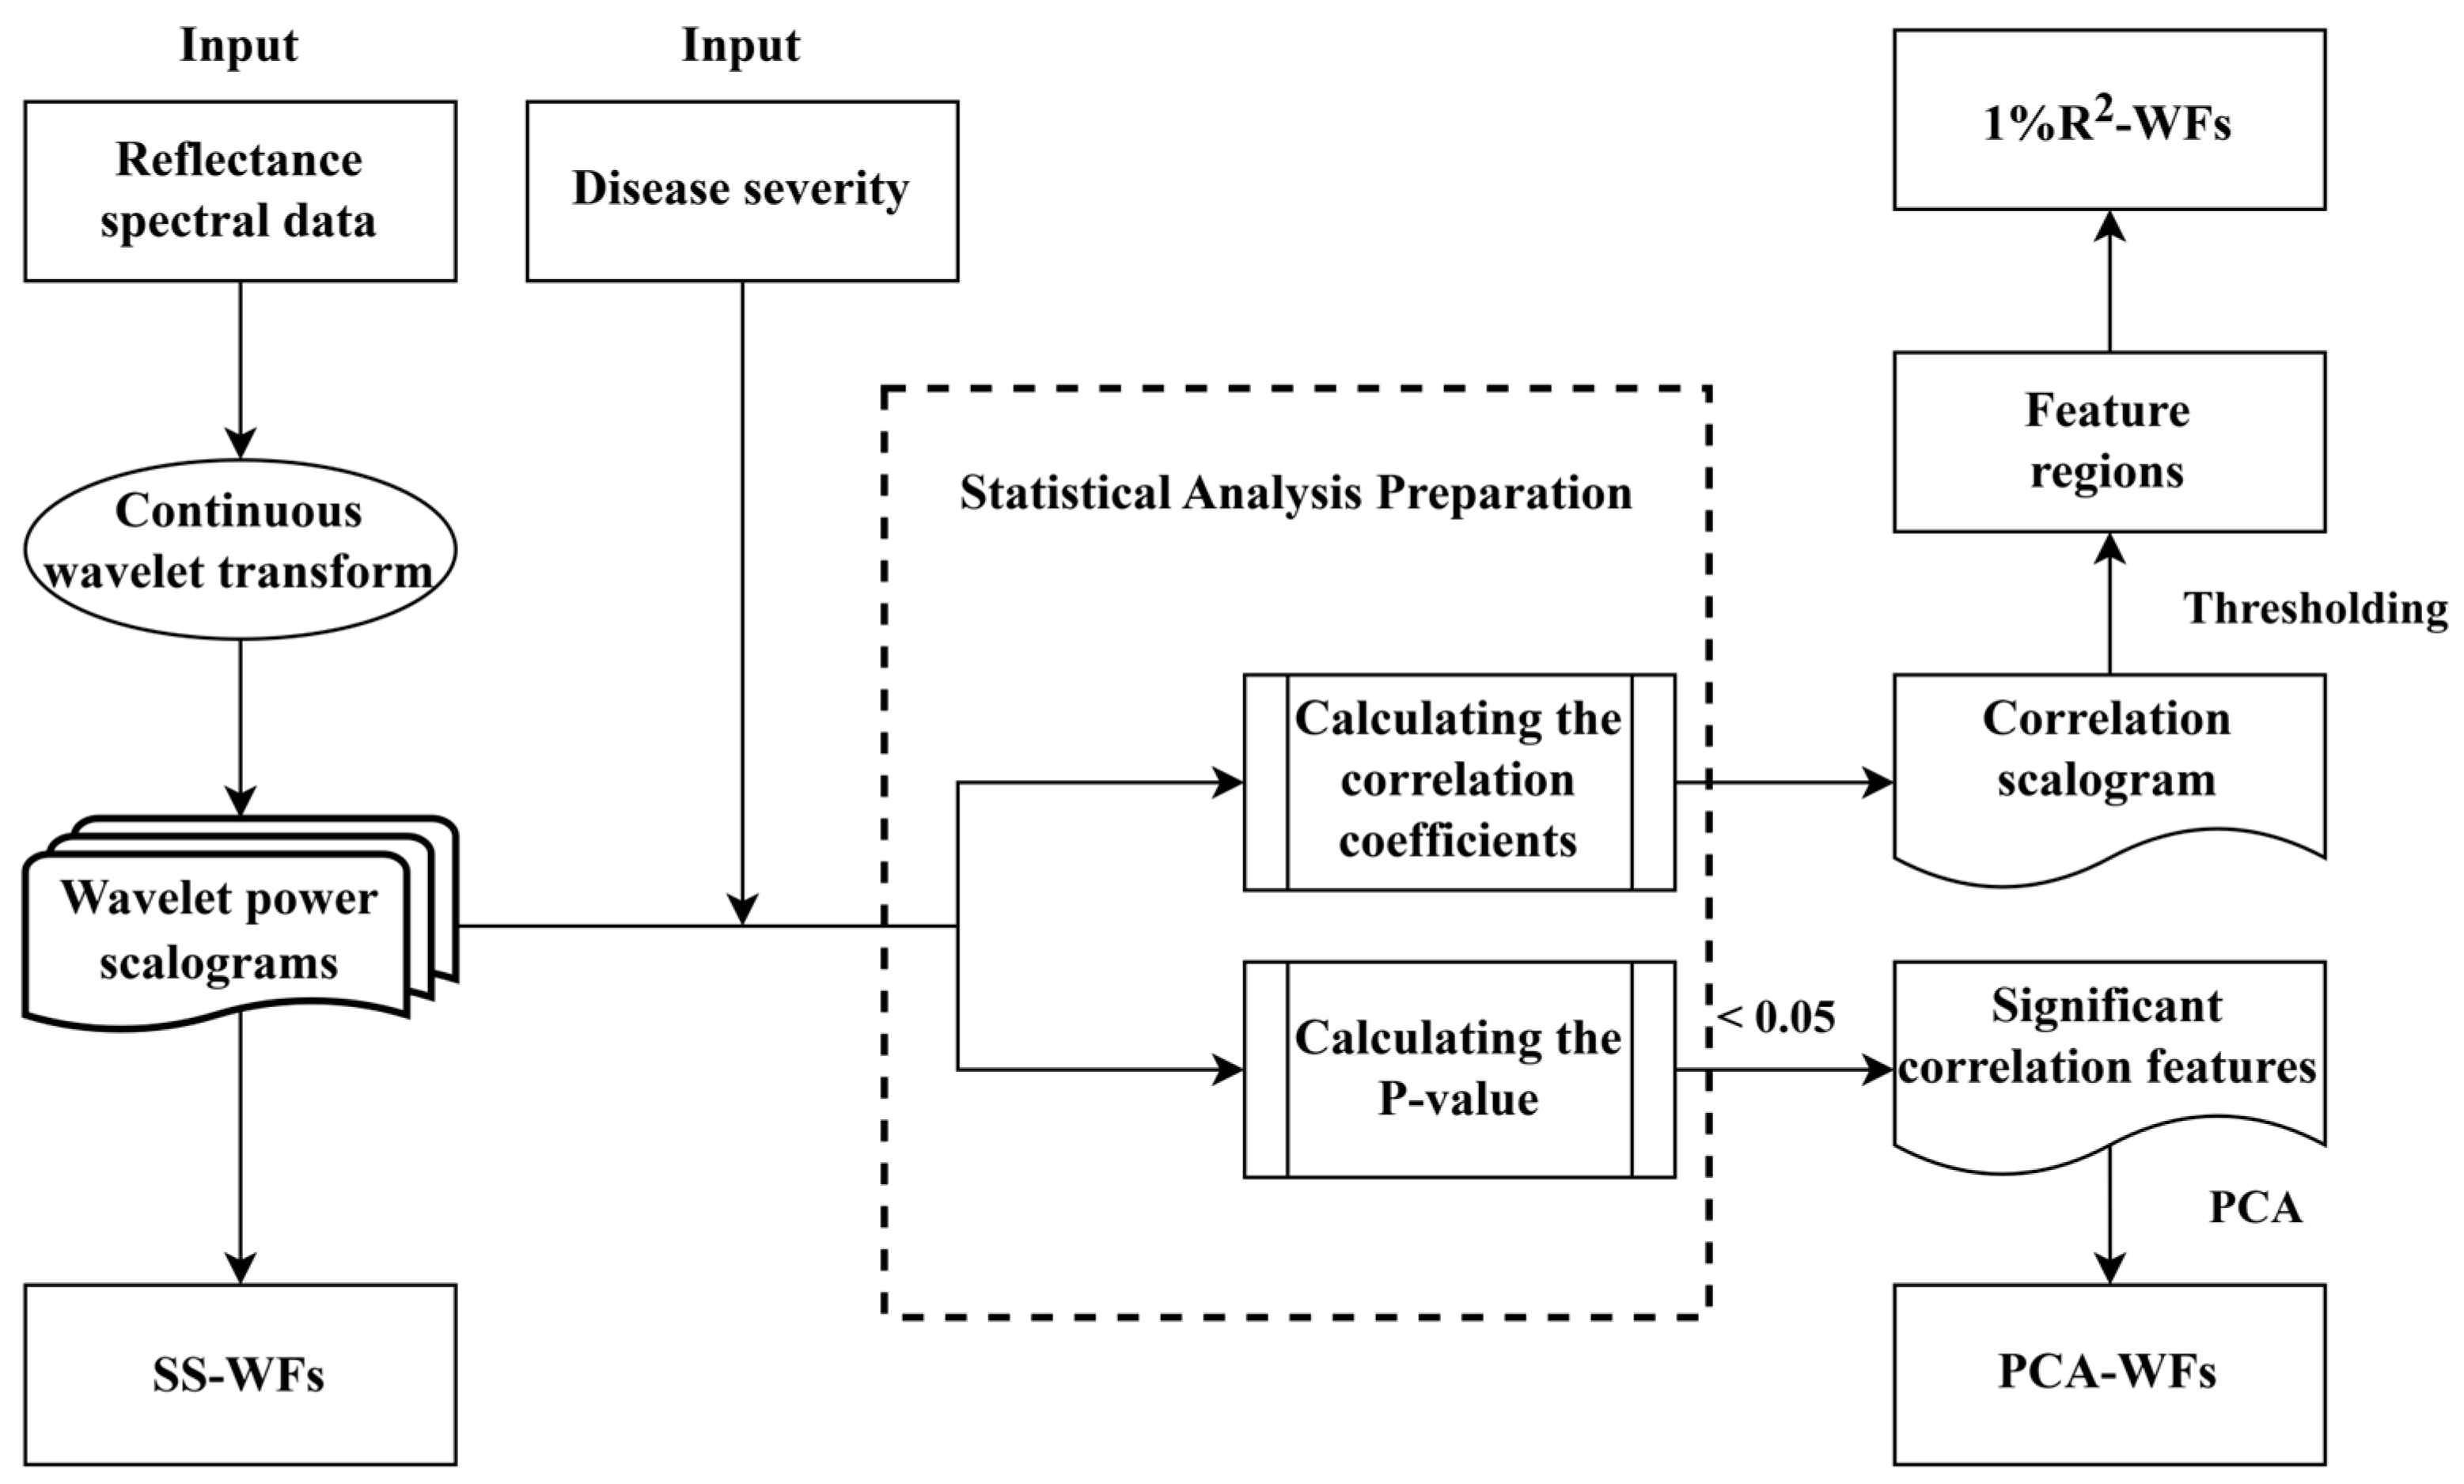
Three types of WFs were extracted based on the CWT: wavelet features dimensionally reduced by principal component analysis (PCA) of significant wavelet energy coefficients (PCA-WFs); wavelet features extracted using the top 1% of the coefficient of determination values between wavelet energy coefficients and the powdery mildew disease class (1%R2-WFs); and all wavelet features at a single decomposition scale (SS-WFs). Figure 2 presents the workflow used in this study. All CWT-related analyses were conducted using MATLAB 2016a (MathWorks).
(1) PCA-WFs
The principal component analysis is a data dimensionality reduction algorithm that maps the original set of n-dimensional features onto k-dimensions through a linear transformation. This process generates a new set of k-dimensional orthogonal features, often referred to as principal components, which are subsequently ranked in descending order of variance [42]. PCA can be categorized into two main classes: (1) dimensionality reduction by specifying the dimension of the lower-dimensional space and (2) dimensionality reduction by specifying a contribution rate. It is widely applied in the fields of data compression, feature extraction, and pattern recognition.
We determined the correlations between the calculated wavelet energy coefficients and disease severity levels, resulting in multiple significant results at different wavebands and scales. PCA was then employed to reduce the dimensionality of the significant results based on specified contribution rates. The features obtained through the process are referred to as PCA-WFs.
(2) 1%R2-WFs
The calculated wavelet energy coefficients were subjected to correlation analysis with the severity levels of rubber tree powdery mildew, generating coefficients of determination (R2). The R2 values of wavelet energy coefficients at different scales and wavebands form a correlation scalogram, characterizing the sensitivity of each wavelet energy coefficient to rubber tree powdery mildew. We sorted the R2 values in descending order across all scales, and the top 1% of R2 values were retained as wavelet feature regions. To minimize redundancy, within each wavelet feature region, only the wavelet energy coefficients with the highest R2 were preserved as extracted 1%R2-WFs.
(3) SS-WFs
Due to the decomposition of spectral information at various positions and multiple scales by CWT, we selected the wavelet energy coefficients at a single decomposition scale as wavelet features in order to effectively capture the spectral changes caused by rubber tree powdery mildew.

2.4. Model Construction

The extracted PCA-WFs, 1%R2-WFs, and SS-WFs are employed as feature variables, combined with three classification methods, namely, RF, SVM, and back propagation neural network (BPNN), to establish rubber tree powdery mildew detection models. The models were used to select suitable feature variables and classification methods for detecting rubber tree powdery mildew. To demonstrate the superiority of WFs in rubber tree powdery mildew detection, the study also combined the extracted SFs with the same classification methods to build detection models for comparisons.
RF is a classification model based on ensemble learning [43], composed of a set of independent, unpruned decision trees. Multiple sample sets are generated through random sampling with replacement, and classification trees are constructed using a fully split method. The final classification result is obtained by averaging the classification results from all individual binary decision trees. RF exhibits the advantages of relatively simple parameter tuning compared to other classification models, that is, the ability to avoid overfitting and improved robustness. SVM is a supervised learning algorithm [44] that employs kernel functions to map data into high-dimensional feature spaces and subsequently performs a straightforward linear regression [45]. The resulting linear regression function in the high-dimensional feature space corresponds to a non-linear regression in the original input space, enabling the modeling and classification of complex data relationships [46]. SVM exhibits excellent performance in high-dimensional spaces and with small-sample data, effectively preventing overfitting, and can produce robust models even when dealing with limited training data. BPNN is a widely used neural network composed of three layers: the input layer, the hidden layer, and the output layer. Information is propagated forward through connections between these layers, and error backpropagation and weight updates are performed using the backpropagation algorithm to minimize the error between predicted and actual outputs [47]. BPNN exhibits high self-learning potential and broad applicability, making it suitable for handling tasks involving non-linear and complex data pattern recognition.

2.5. Accuracy Assessment

To better assess the accuracy and stability of the proposed detection, the sample data was divided into training and validation sets at a ratio of 7:3. A confusion matrix was constructed using true positives (TP), false positives (FP), true negatives (TN), and false negatives (FN). The overall accuracy (OA) and kappa coefficient were computed as evaluation parameters to assess the model performance. While OA serves as a comprehensive measure, evaluating the quality of classification results, the kappa coefficient functions as a metric, gauging the consistency between the model’s prediction results and the actual classification outcomes [48,49]. The model development and data analysis were conducted using the Python machine learning library scikit-learn version 0.24.2 on a Windows 10 operating system [50].

3. Results

3.1. Spectral Responses of Rubber Tree Powdery Mildew

3.1.1. Spectral Responses in Leaves under Powdery Mildew Infection

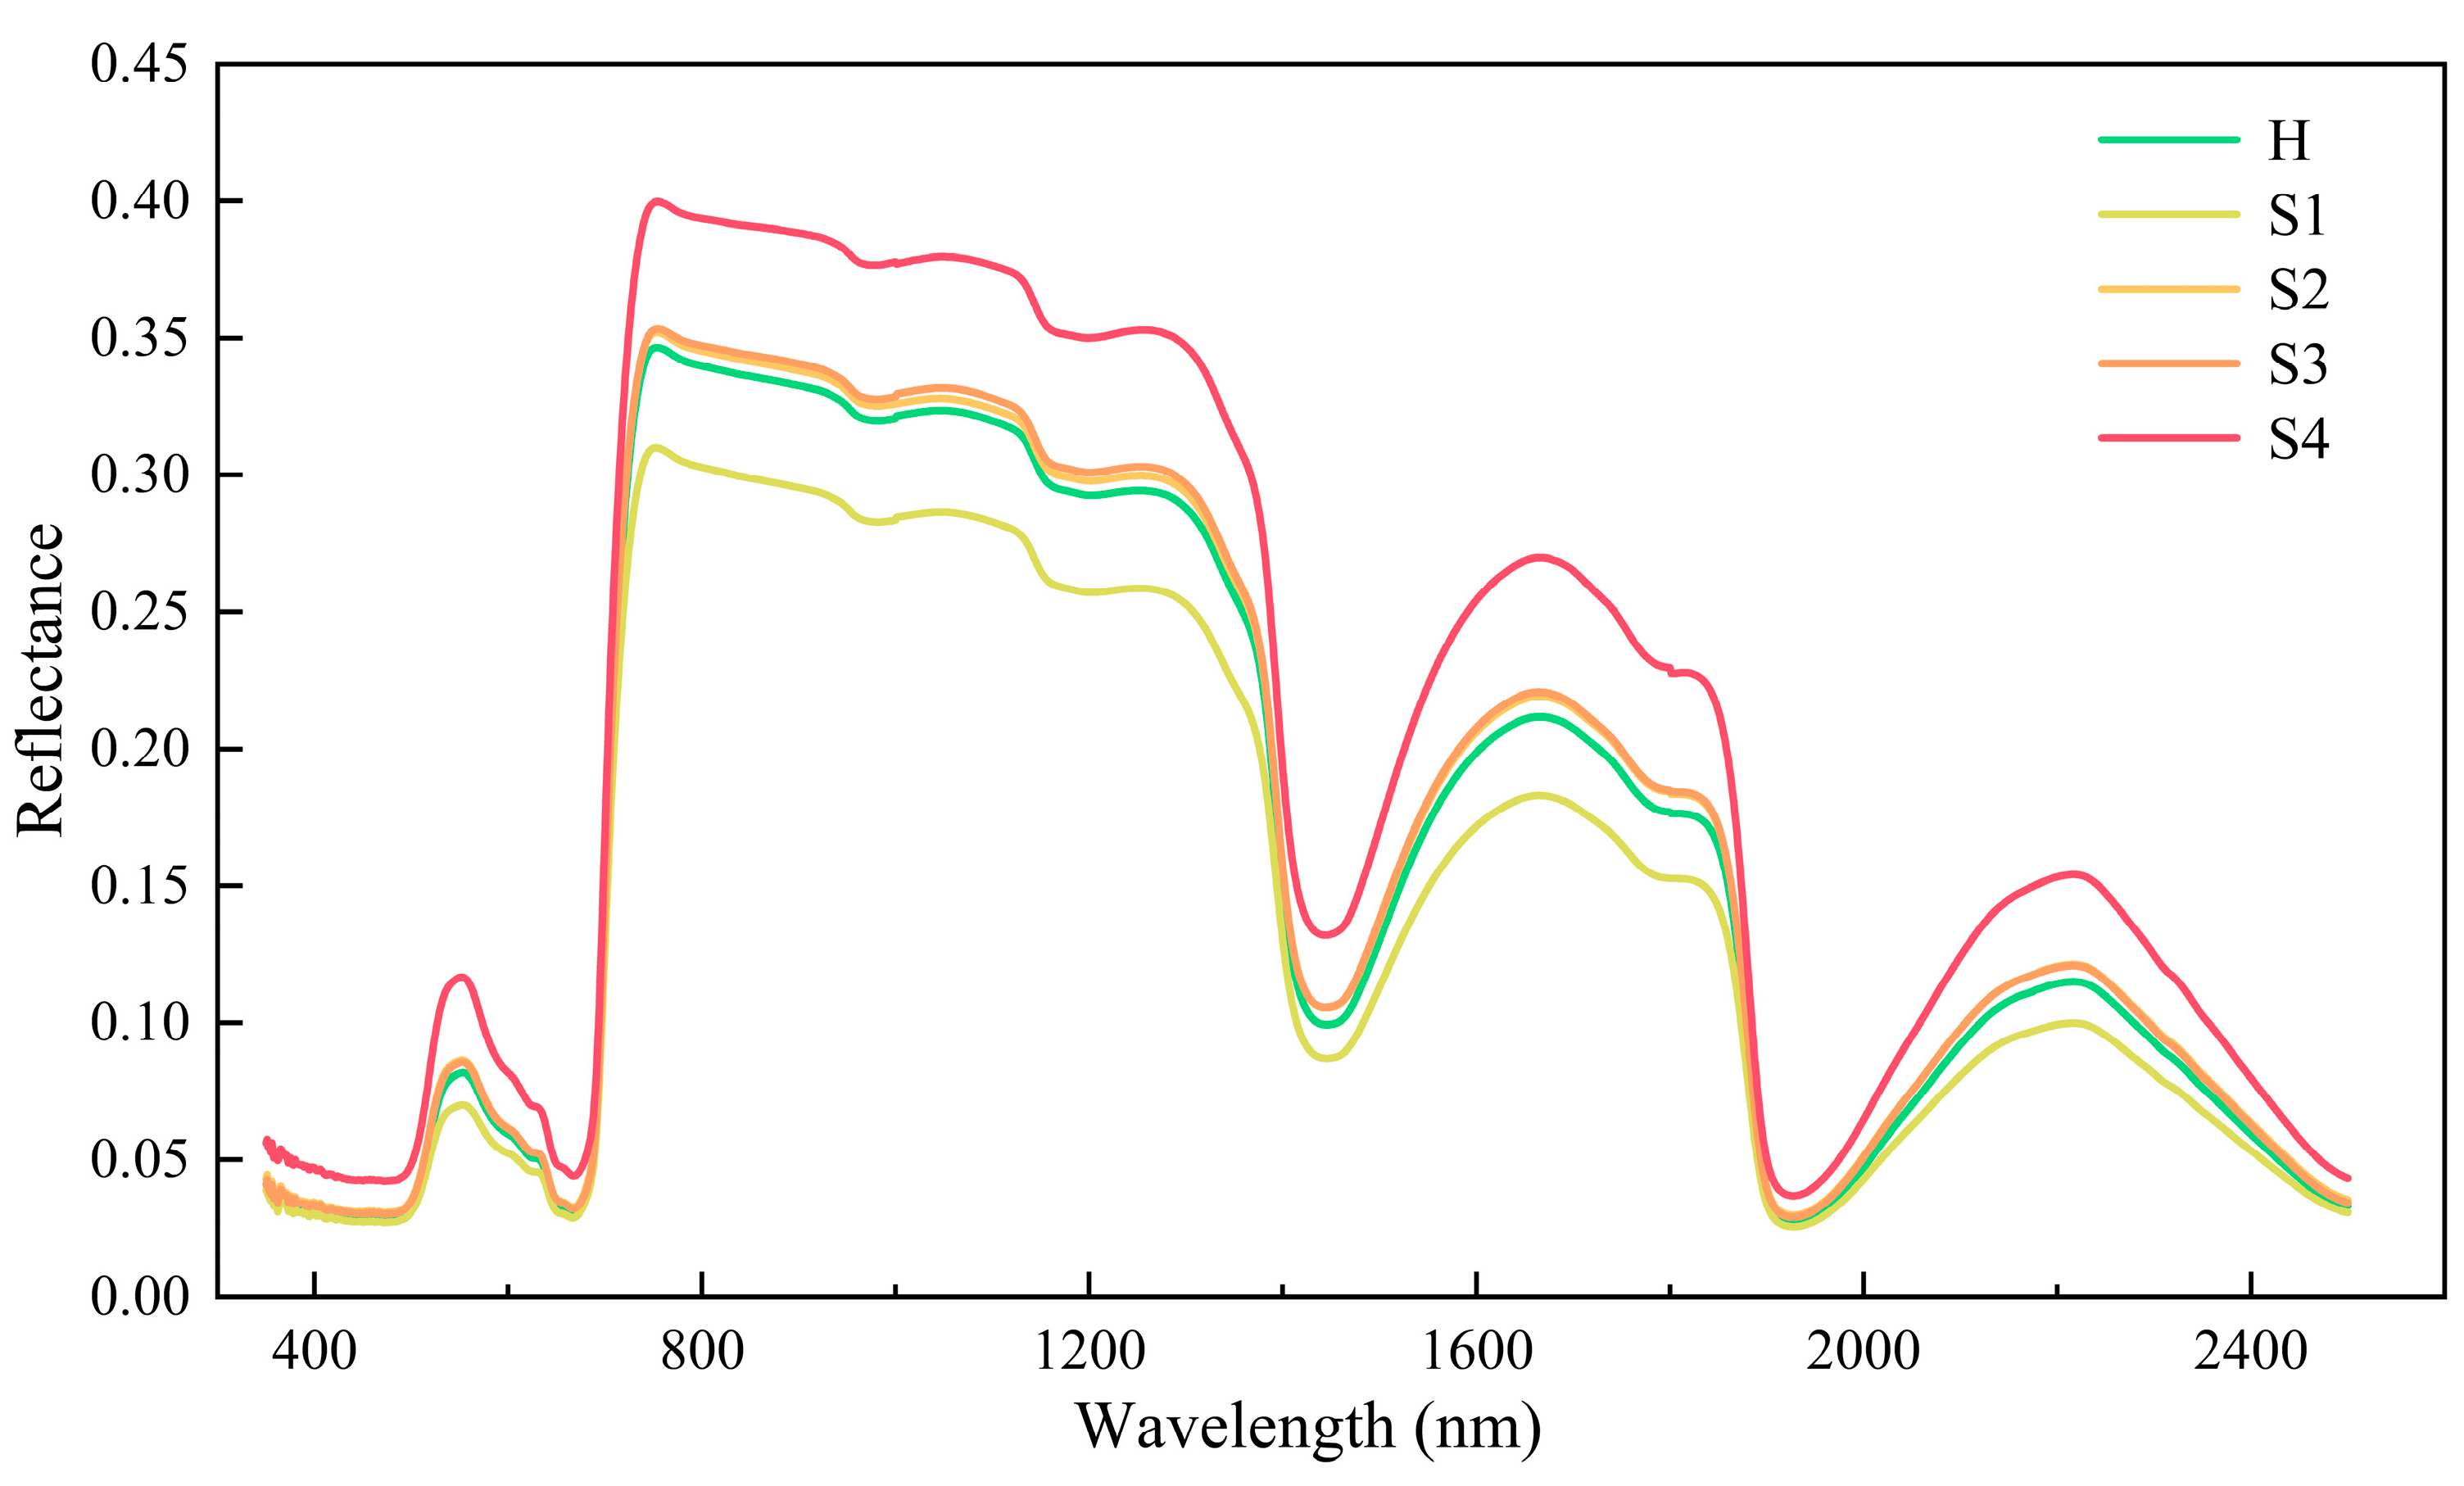
Figure 3 presents the spectral reflectance curves of rubber tree leaf samples at different disease severity levels. The spectral reflectance curves of healthy and diseased leaves exhibit a similar general trend. However, noticeable differences are observed in the magnitude of spectral reflectance between samples of different disease severity levels. At the early stages of infection, during the transition from H to S1, the leaf spectral reflectance presents a sudden downward shift. As the disease severity level advances, the leaf spectral curves exhibit an overall upward trend. This increase is more pronounced in the visible and near-infrared wavelength ranges and becomes more prominent in the near-infrared range. The progress in disease severity clearly affects the reflectance peak at 550 nm, the absorption valley at 670 nm, and the peaks and valleys of the water absorption bands at 1450 nm and 1950 nm. These results indicate that powdery mildew infestation leads to remarkable changes in leaf color, pigments, and moisture content. Furthermore, there is a relatively small differentiation in the spectral curves between S2 and S3. However, a notable distinction in spectral reflectance is observed between S3 and S4, indicating prominent changes in the leaf characteristics during the late stages of disease infestation.

3.1.2. Wavelet Coefficient Responses under Powdery Mildew Infection

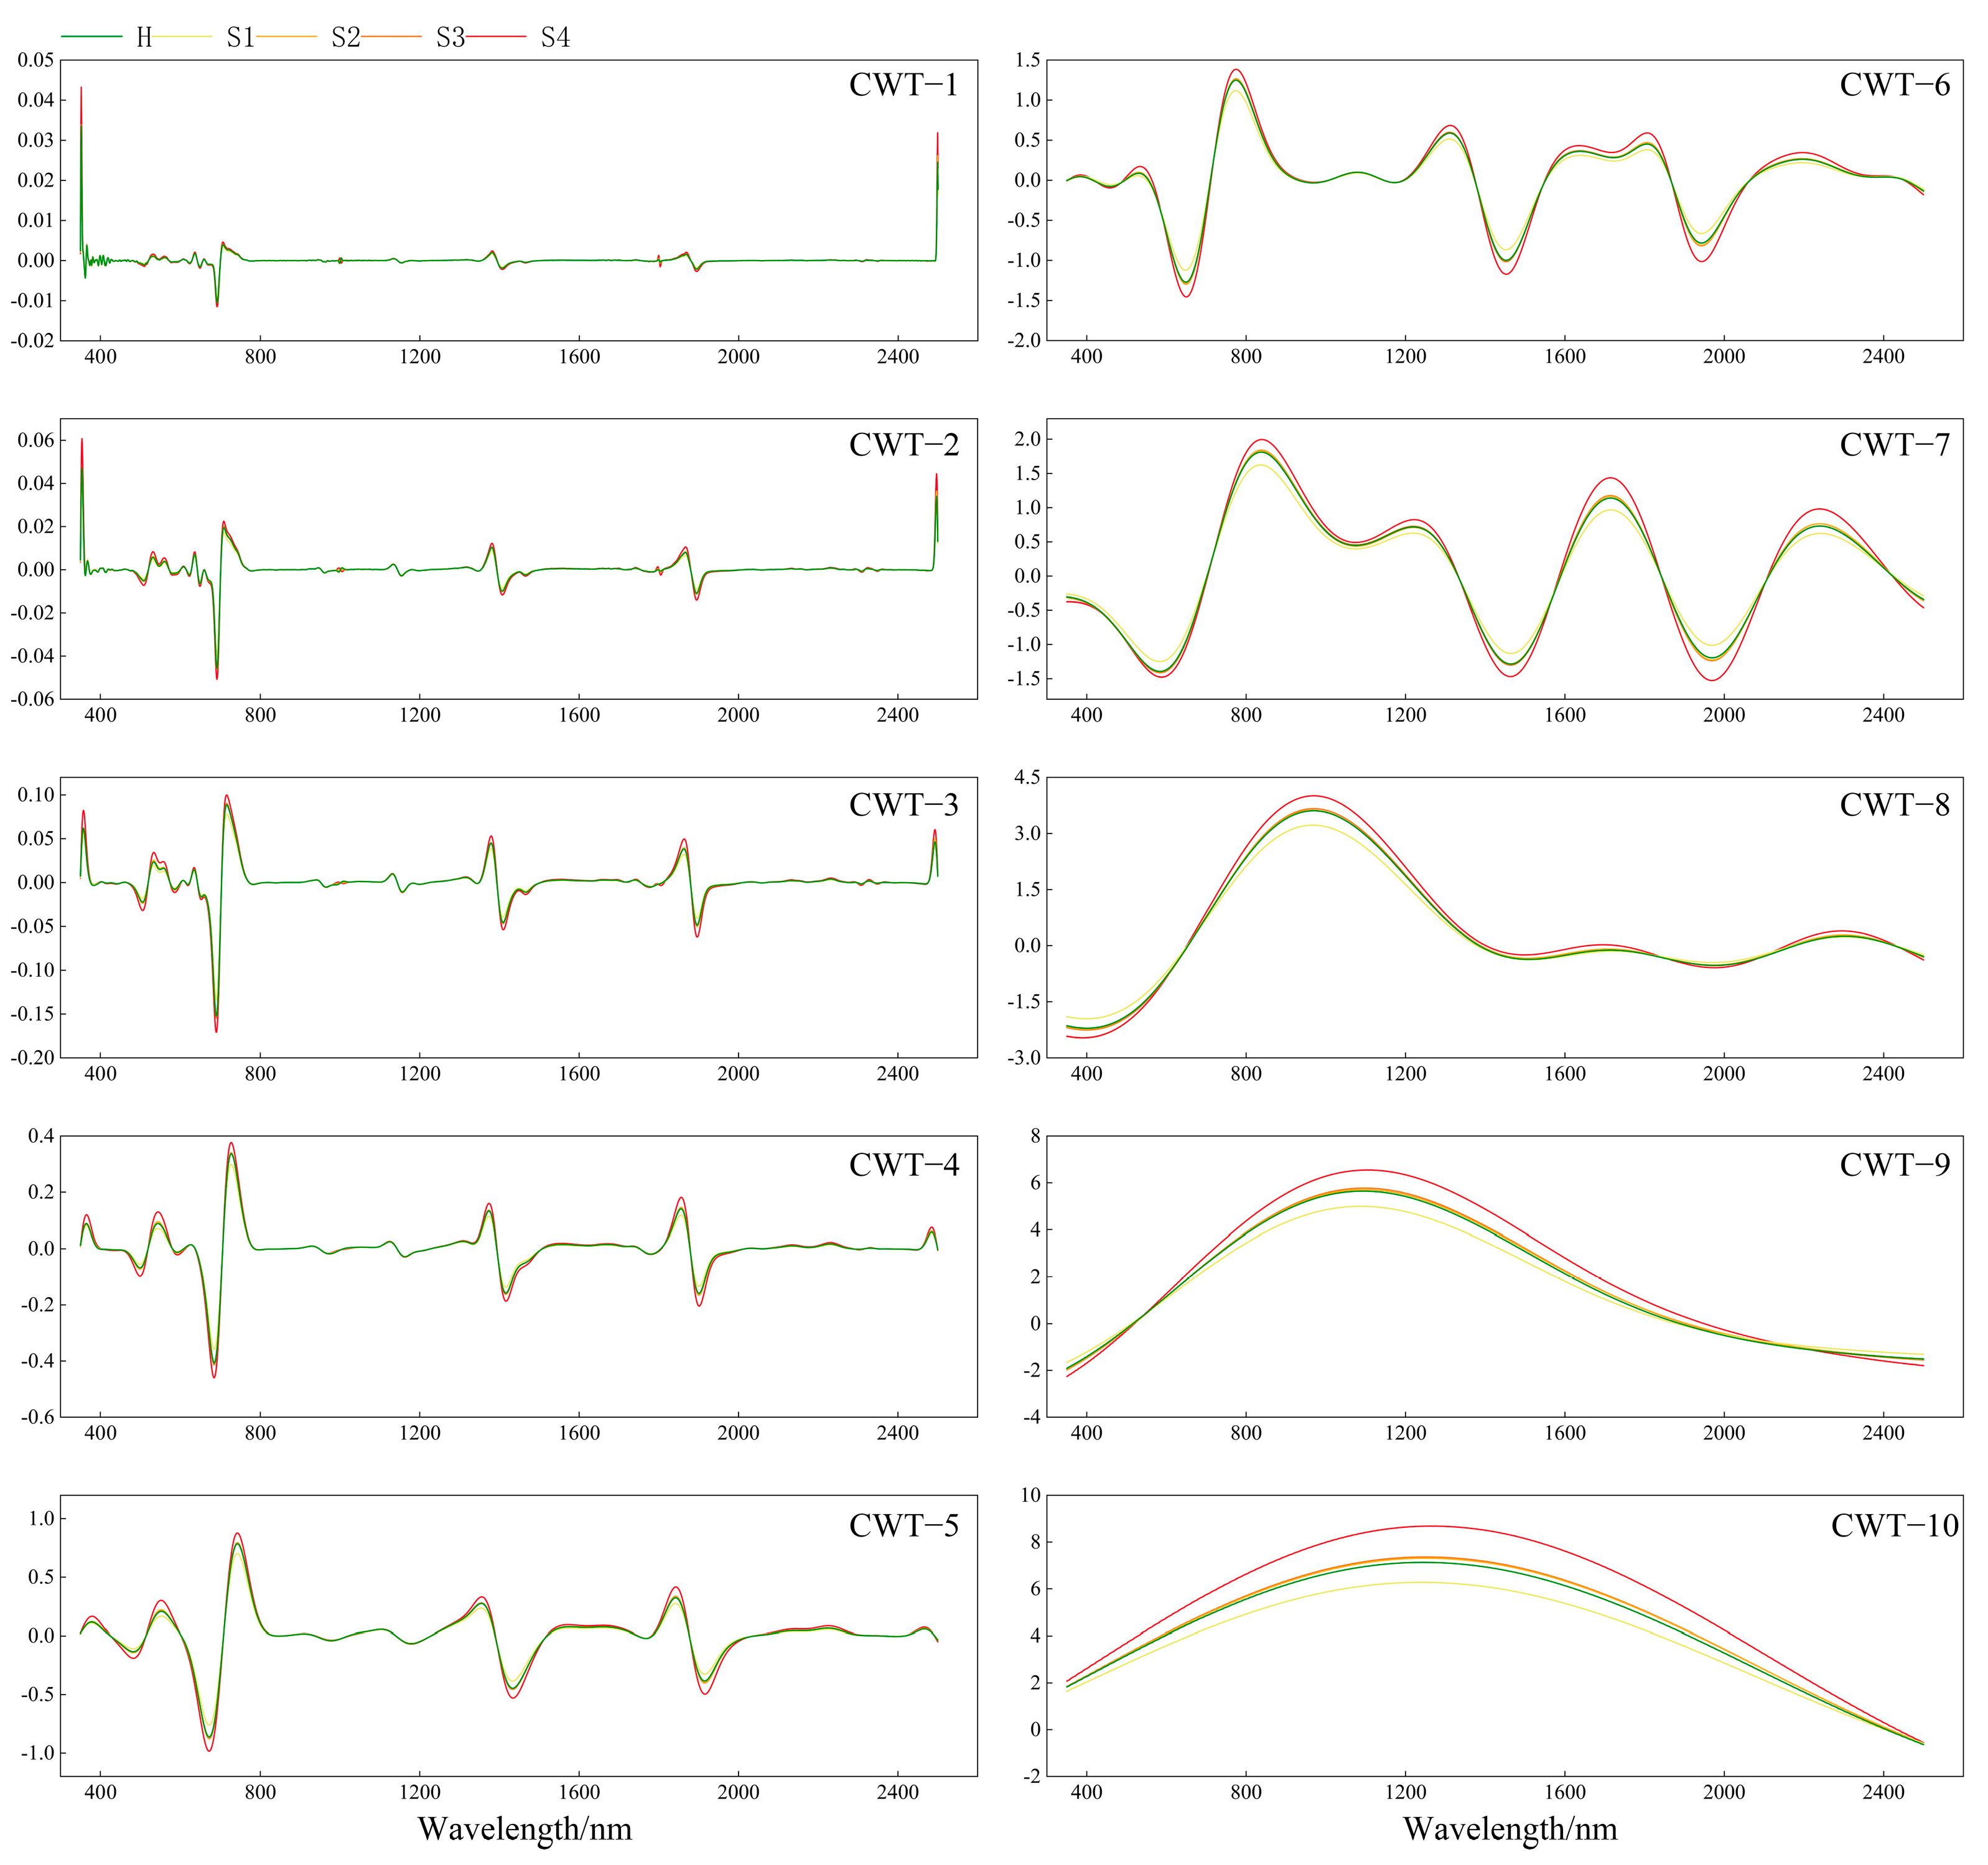
CWT decomposes the spectral information at multiple scales for each position, facilitating the effective detection of spectral changes induced by rubber tree powdery mildew. Figure 4 depicts the wavelet coefficients at different scales. The results reveal remarkable variations in WFs with different disease severity levels across different wavelet scales. As the wavelet scale increases, the spectral variations from wavelet decomposition become coarser. At lower scales, such as the 1st to 4th scales, the spectral changes from wavelet decomposition appear finer across multiple spectral regions. This is particularly true in the visible light range, where pigment-dominated spectral features are prominent, as well as the dominant moisture regions near 1400 nm and 1950 nm in the near-infrared range. At higher scales, such as the 10th scale, although there is a notable difference in wavelet coefficient values among different disease severity levels, the spectral decomposition ability is reduced, resulting in an overall change that is coarser.

3.2. Optimal Feature Extraction Results for Rubber Tree Powdery Mildew

3.2.1. Traditional Spectral Features

Table 3 reports the calculated correlation coefficients between the SFs and disease severity levels. With the exception of the maximum first-order differential value Dy within the yellow edge, all SFs exhibited highly significant correlations with the severity of powdery mildew (p-value < 0.001). Among them, the absolute values of the correlation coefficients for MCARI and TCARI exceeded 0.4, indicating strong correlations. Moreover, the majority of SFs exhibited relatively high correlations with powdery mildew, with |R| > 0.3. Based on the correlation results, 13 SFs with absolute correlation coefficients exceeding 0.2 (i.e., demonstrating highly significant correlations) were selected to construct the model.

3.2.2. Wavelet features

(1) PCA-WFs
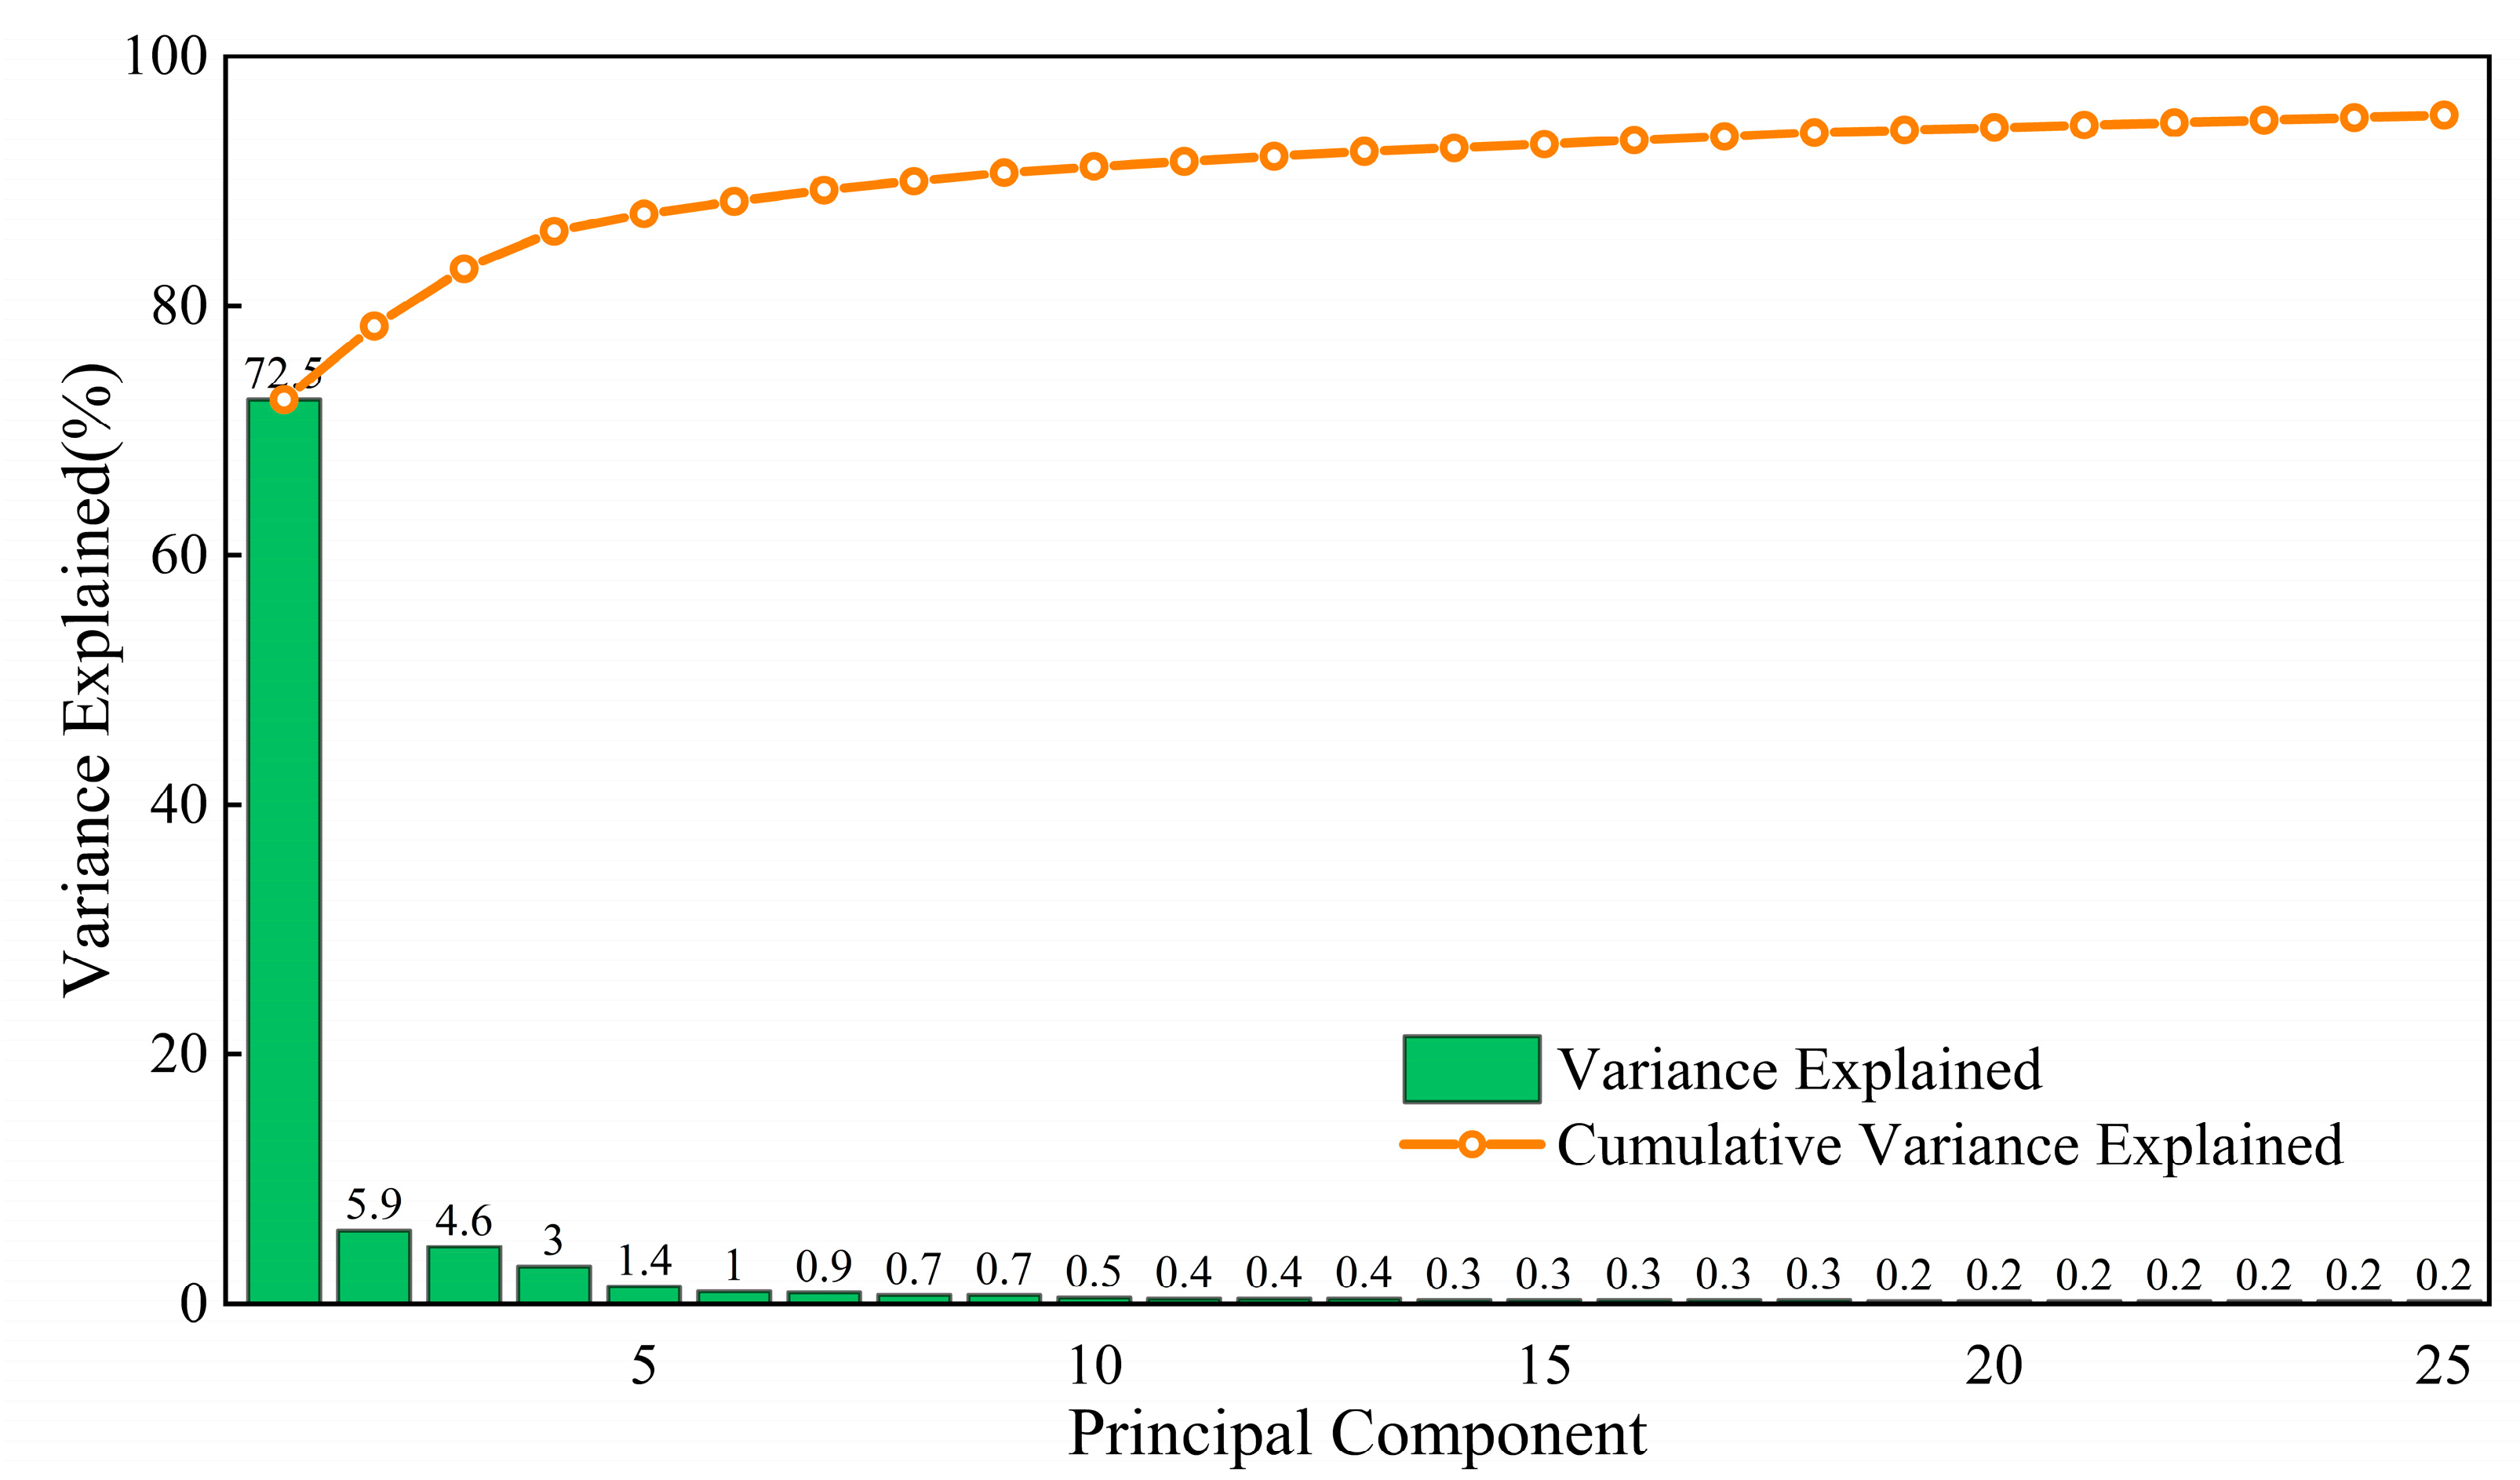
p-values were computed to assess the correlation between the wavelet energy coefficients at different scales and disease severity levels, allowing us to determine the presence of significant relationships between the two variables. Features with p-values < 0.05 (i.e., those with significant correlations) were retained, resulting in a total of 919 features. Dimensionality reduction using PCA was applied to the 919 significant features, with a specified cumulative contribution rate of 95%. This resulted in the selection of 25 features, as illustrated in Figure 5.
(2) 1%R2-WFs
Figure 6 presents the correlation scalogram for disease severity levels and rubber tree leaf spectral reflectance generated using CWT. The R2 values ranged from 0 to 0.425, and the threshold of R2 values in the top 1%, sorted in descending order, was 0.233. The extracted wavelet feature regions are highlighted in red in Figure 6. The results indicate that the extracted WFs are primarily located at relatively lower scales, with the majority at the 1st scale and the highest at the 4th scale. These features are concentrated in the near-infrared regions of 750–1350 nm, 1550–1800 nm, and 2200–2400 nm, which correspond to the sensitive regions of the original spectrum. To reduce redundancy, within each wavelet feature region, the wavelet energy coefficients with the highest R2 are retained as the 1%R2-WFs, resulting in a total of 59 features. Furthermore, all of the selected 59 features exhibit highly significant correlations with disease severity levels (p-value < 0.001) [51], indicating that the 1%R2-WFs are sensitive to rubber tree powdery mildew.
(3) SS-WFs
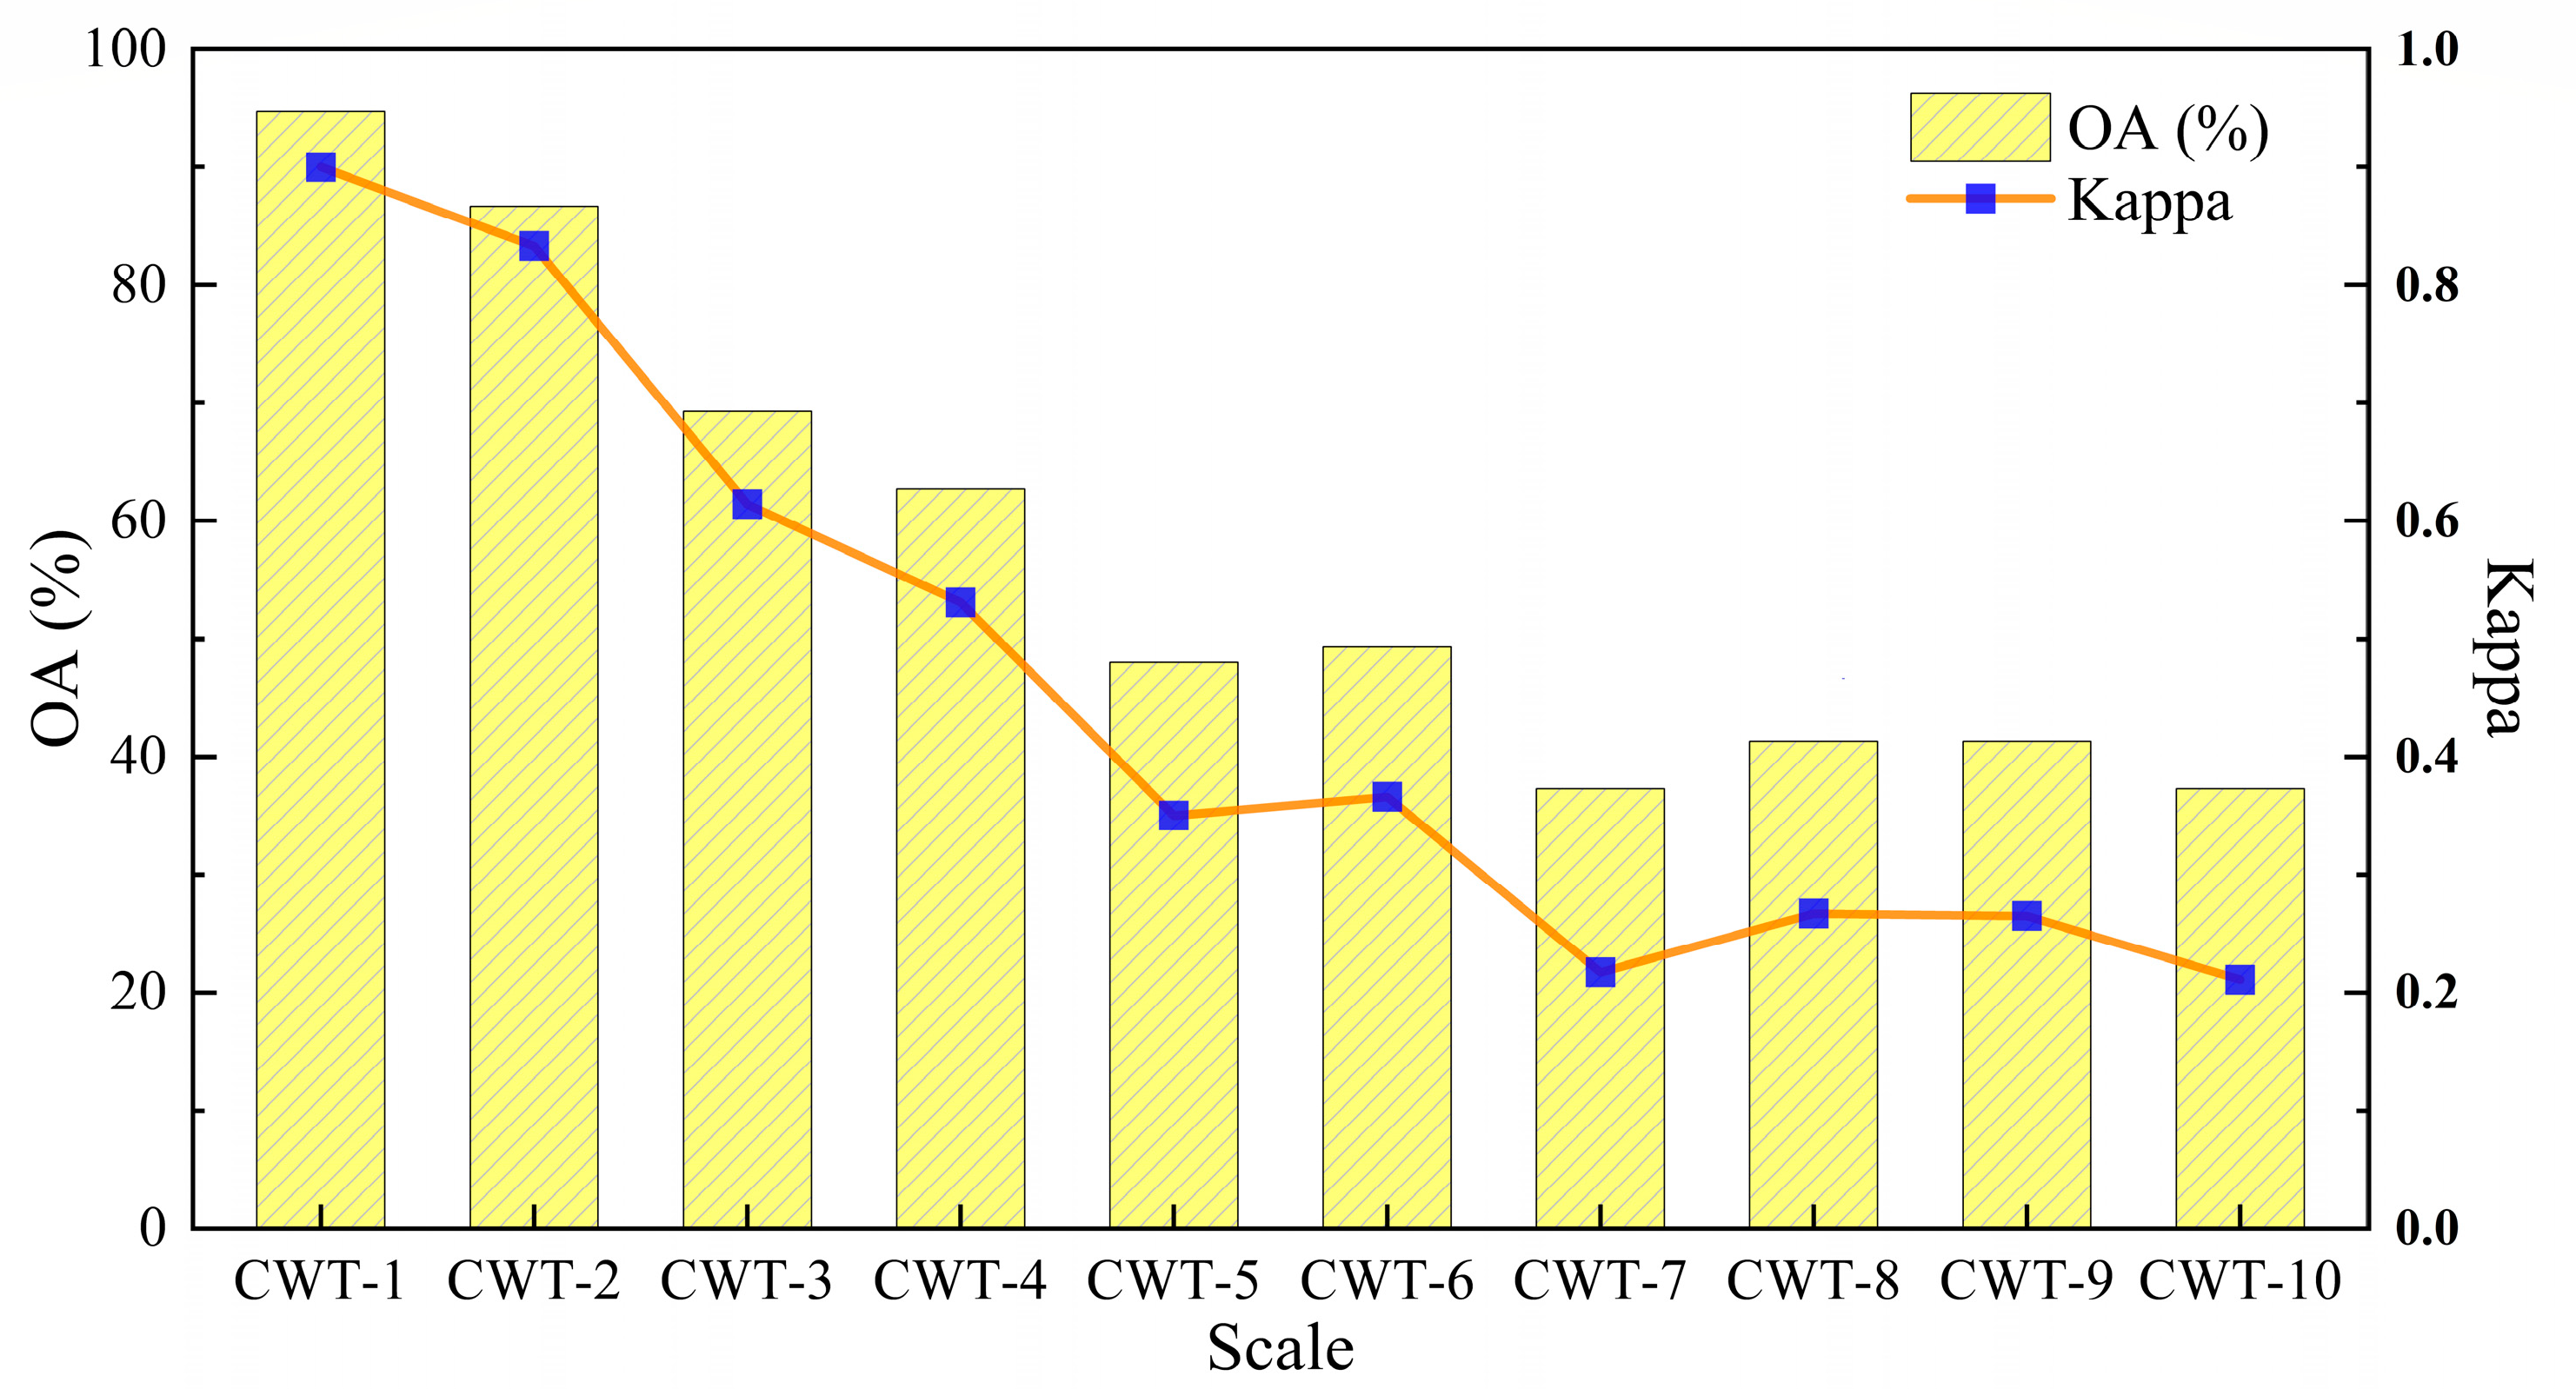
Using the RF algorithm, detection models for rubber tree powdery mildew were individually constructed at 10 different decomposition scales, each based on all WFs at a single decomposition scale (Figure 7). The results indicate that the 1st scale of WFs exhibited superior accuracy, with an OA of 94.7%. As the wavelet scale increased, spectral variations from wavelet decomposition became coarser, and the ability to detect disease symptoms gradually weakened, resulting in a decline in accuracy. These findings demonstrate the applicability of the 1st scale of the WFs as the SS-WFs for the subsequent model construction.

3.3. Evaluation of Rubber Tree Powdery Mildew Detection Models

3.3.1. Comparison of Disease Detection Models Based on Different Wavelet Features

Table 4 summarizes the confusion matrices, OA, and kappa coefficients of the rubber tree powdery mildew detection models constructed by combining the three types of WFs with the three machine learning classification methods. For the same WF type, the models based on RF achieved the highest OA and kappa coefficients for all three WFs (PCA-WFs, 1%R2-WFs, and SS-WFs), with overall accuracies of 92.0%, 88.0%, and 94.7%, and kappa coefficients of 0.90, 0.85, and 0.93, respectively. The BPNN models exhibited the second-best performance, while the SVM models achieved the lowest accuracy. Therefore, the choice of an appropriate classification method significantly impacts the accuracy of crop disease detection models. Using SS-WFs as the input achieved the highest accuracy of 94.7% and a kappa coefficient of 0.93 for the RF model. However, its performance in the SVM model was notably lower, with an accuracy of only 53.3%, and in the BPNN model, it reached just 70.7%. Substantial variations were observed among different classification methods. In contrast, PCA-WFs consistently exhibited relatively high accuracy and exceptional stability in all three machine learning models, with overall accuracies of 92.0%, 86.7%, and 84.0%, and kappa coefficients of 0.90, 0.83, and 0.80, respectively. Therefore, this study suggests that PCA-WFs are more suitable as representative wavelet features for the detection of rubber tree powdery mildew.

3.3.2. Comparison of Disease Detection Models Based on Optimal Wavelet Features and Traditional Spectral Features

After determining PCA-WFs as the optimal wavelet features, we compared the detection performance of PCA-WFs and SFs for rubber tree powdery mildew (Table 5). When employing the selected 13 SFs (MCARI, TCARI, Db, SDb, (SDr − SDy)/(SDr + SDy), TVI, SDr, Dr, RVSI, SDr/SDb, ARI, (SDr − SDb)/(SDr + SDb), SDy, (SDr − SDb)/(SDr + SDb), SDy) as input, the detection models constructed using the RF, SVM, and BPNN algorithms exhibited overall accuracies of 45.3%, 41.3%, and 44.0%, with kappa coefficients of 0.32, 0.26, and 0.30, showing subpar performance for powdery mildew detection. In contrast, the disease recognition models based on PCA-WFs exhibited a prominently higher accuracy compared to the models based on SFs, with overall accuracies increasing by 46.7%, 45.4%, and 40.0%, and kappa coefficients increasing by 0.58, 0.57, and 0.50, respectively.
These results indicate the ability of WF-based models to outperform those built with SFs. WFs perform well in distinguishing healthy and powdery mildew-infected rubber tree leaves, demonstrating the feasibility of combining CWT with machine learning for rubber tree powdery mildew detection. The model combining PCA-WFs and RF exhibits the best performance among all models, with an OA of 92.0% and a kappa coefficient of 0.90. This may be attributed to the multiscale decomposition of spectral information via CWT at various positions, revealing spectral variations related to pigments, moisture, morphology, and structure induced by rubber tree powdery mildew. In addition, the integration of PCA in dimensionality reduction optimally selects positions and scales.

4. Discussion

The natural rubber produced from latex extracted via rubber trees is a vital industrial resource. The global annual economic losses due to rubber tree powdery mildew reach billions of dollars [52]. The implementation of early warning capabilities prior to the occurrence of powdery mildew epidemics or the precise identification in the early stages of infection could reduce pesticide usage, prevent unnecessary environmental pollution, and minimize economic losses, thus effectively controlling the outbreak of powdery mildew.
This study introduces a rubber tree powdery mildew detection model that combines PCA-WFs with RF, representing the first attempt in the research community to integrate remote sensing technology with CWT for rubber tree powdery mildew detection. It is also one of the few studies utilizing multiple types of WF features for crop disease detection. The optimal rubber tree powdery mildew detection model achieved an OA of 92.0% and a kappa coefficient of 0.90, demonstrating the substantial potential of using CWT technology for detecting rubber tree powdery mildew.
Despite the great progress made by this study, it has several limitations. We employed three different machine learning classifiers to categorize rubber tree powdery mildew severity levels. Notably, these classifiers exhibited substantial discrepancies. For each type of feature, models based on RF consistently achieved the highest OA and kappa coefficients compared to BPNN and SVM. This may be attributed to the overall stability of the RF model. As an ensemble method based on multiple decision trees, the risk of overfitting in individual trees is minimized. This results in a more robust overall model that consistently performs well across different datasets. In addition, despite performing less effectively on BPNN and SVM, the study found that using SS-WFs as the input achieved the highest accuracy of 94.7% and a kappa coefficient of 0.93 for the RF model. The possible reason for SS-WFs outperforming PCA-WFs for the RF model might be that SS-WFs retain all wavelet features at the first scale, encompassing data from various spectral positions, thus providing a greater amount of information. Additionally, compared to BPNN and SVM, the RF model excels in handling high-dimensional data [53]. The abundance of features in SS-WFs facilitates more effective feature selection by the RF model, enabling it to make more accurate and robust decisions. In particular, machine learning classifiers are associated with a limited generalization capability. As a result, the performance of disease identification on the same leaf may exhibit variability in different environmental settings, such as varying lighting conditions [54]. Consequently, selecting appropriate classification models is crucial when dealing with distinct diseases.
Furthermore, the study area encompasses various rubber tree varieties. Leaves from different varieties generally exhibit variations in color and shape. However, this study did not consider the potential impact of different varieties on the identification of rubber tree powdery mildew. Thus, the influence of distinct rubber tree varieties on the performance of disease detection models is worthy of further research. The lack of practical application experiments also constitutes a current limitation, necessitating additional research and experimentation to bridge the gap between theoretical advancements and real-world application. Moving forward, research endeavors aim to collaborate with agricultural practitioners to implement this detection method in actual real-world conditions. The integration of feedback from practical applications will contribute to refining and optimizing the research.
While our study results can be applied to indicate foliar lesions related to powdery mildew, the current research did not explore the canopy structure characteristics of rubber trees. In recent years, the rapid advancement of UAV technology has achieved certain successes in pest and disease detection applications [55,56,57]. Compared to proximal spectral measurement devices, instruments onboard UAVs can rapidly and non-invasively collect spectral information from entire crop fields, enabling the more in-depth exploration of the canopy structure, texture, and other information related to rubber trees. Therefore, integrating UAV technology with CWT for future identification of rubber tree powdery mildew is expected to greatly enhance the detection efficiency and accuracy.

5. Conclusions

In this study, based on hyperspectral data of rubber tree powdery mildew, three types of WFs were extracted using CWT for the detection of rubber tree powdery mildew, namely, PCA-WFs, 1%R2-WFs, and SS-WFs. These features were combined with three classification methods, RF, SVM, and BPNN, to establish rubber tree powdery mildew detection models. Based on the results, the following conclusions were drawn:
(1)
The overall magnitude of the spectral curves of rubber tree leaves increases in the visible and near-infrared wavelength ranges as the disease severity progresses.
(2)
All three selected WFs can effectively detect the severity of rubber tree powdery mildew. The models constructed based on PCA-WFs exhibited relatively high accuracy and exceptional stability. The models based on WFs all outperform those based on SFs. For example, the OA based on the RF classification method exhibits prominent improvements of 46.7%, 49.4%, and 42.7%, respectively. For models based on the same WF type, those constructed with the RF classification method achieve the highest OA and kappa coefficient. In particular, compared with the BPNN and SVM methods, the model’s OA improves by more than 5% and 8%, respectively.
(3)
The model combining PCA-WFs with RF demonstrates the best performance among all models, achieving an OA of 92.0% and a kappa coefficient of 0.90. This demonstrates the feasibility of CWT in the detection of rubber tree powdery mildew.
However, it is important to note that our study lacks additional independent datasets for validation. Future research will acquire more diverse leaf samples representing different rubber tree varieties to serve as independent datasets. This endeavor aligns with the need to enhance the robustness and generalizability of our findings. Moreover, future research will focus on employing UAV remote sensing imagery and performing comprehensive analyses of rubber tree canopy structure, texture, and related information for the application of rubber tree powdery mildew identification, aiming to establish a more complete and holistic detection model.

Author Contributions

Conceptualization, X.C., A.G. and W.H.; methodology, X.C. and A.G.; software, X.C.; formal analysis, J.G.; investigation, B.Q. and Z.H.; resources, Y.F., Z.C., G.C. and Y.L.; data curation, Y.F., Z.C., G.C. and Y.L.; writing—original draft preparation, X.C.; writing—review and editing, X.C., A.G. and W.H.; project administration, Y.D.; funding acquisition, A.G. and W.H. All authors have read and agreed to the published version of the manuscript.

Funding

This research was funded by Hainan Provincial Natural Science Foundation of China (422QN349), the Sci-Tech Innovation System Construction for Tropical Crops Grant of Yunnan Province (No. RF2022-7), the Sci-Tech Innovation System Construction for Tropical Crops Grant of Yunnan Province (No. RF2023-7), Technical Support Project for Malaria Control-Elimination in Sao Tome and Principe (3rd Round) (A2-6199-21-411-001), Fengyun project (FY-APP-2022.0306), and Global Vegetation Pest and Disease Dynamic Remote Sensing Monitoring and Forecasting (GEO-PDRS).

Data Availability Statement

The data are available from the authors upon reasonable request as the data need further use.

Acknowledgments

We would like to extend our sincere gratitude to the Yunnan Institute of Tropical Crops for their generous support in providing us with the experimental site and valuable technical assistance.

Conflicts of Interest

The authors declare no conflicts of interest.

References

  1. Van Beilen, J.B.; Poirier, Y. Establishment of New Crops for the Production of Natural Rubber. TRENDS Biotechnol. 2007, 25, 522–529. [Google Scholar] [CrossRef] [PubMed]
  2. Liyanage, K.K.; Khan, S.; Mortimer, P.E.; Hyde, K.D.; Xu, J.; Brooks, S.; Ming, Z. Powdery Mildew Disease of Rubber Tree. For. Pathol. 2016, 46, 90–103. [Google Scholar] [CrossRef]
  3. Limkaisang, S.; Kom-un, S.; Takamatsu, S.; Furtado, E.L.; Liew, K.W.; Salleh, B.; Sato, Y. Molecular Phylogenetic and Morphological Analyses of Oidium Heveae, a Powdery Mildew of Rubber Tree. Mycoscience 2005, 46, 220–226. [Google Scholar] [CrossRef]
  4. De, A.; Liyanage, S.; JACOB, C.K. Diseases of Economic Importance in Rubber. In Developments in Crop Science; Elsevier: Amsterdam, The Netherlands, 1992; Volume 23, pp. 324–359. [Google Scholar] [CrossRef]
  5. Thomas, S.; Kuska, M.T.; Bohnenkamp, D.; Brugger, A.; Alisaac, E.; Wahabzada, M.; Behmann, J.; Mahlein, A.-K. Benefits of Hyperspectral Imaging for Plant Disease Detection and Plant Protection: A Technical Perspective. J. Plant Dis. Prot. 2018, 125, 5–20. [Google Scholar] [CrossRef]
  6. Gowen, A.A.; O’Donnell, C.P.; Cullen, P.J.; Downey, G.; Frias, J.M. Hyperspectral Imaging—An Emerging Process Analytical Tool for Food Quality and Safety Control. Trends Food Sci. Technol. 2007, 18, 590–598. [Google Scholar] [CrossRef]
  7. Zhang, J.C.; Pu, R.; Wang, J.; Huang, W.; Yuan, L.; Luo, J. Detecting Powdery Mildew of Winter Wheat Using Leaf Level Hyperspectral Measurements. Comput. Electron. Agric. 2012, 85, 13–23. [Google Scholar] [CrossRef]
  8. Feng, W.; Shen, W.; He, L.; Duan, J.; Guo, B.; Li, Y.; Wang, C.; Guo, T. Improved Remote Sensing Detection of Wheat Powdery Mildew Using Dual-Green Vegetation Indices. Precis. Agric. 2016, 17, 608–627. [Google Scholar] [CrossRef]
  9. Huang, L.; Wu, Z.; Huang, W.; Ma, H.; Zhao, J. Identification of Fusarium Head Blight in Winter Wheat Ears Based on Fisher’s Linear Discriminant Analysis and a Support Vector Machine. Appl. Sci. 2019, 9, 3894. [Google Scholar] [CrossRef]
  10. Zhang, J.; Pu, R.; Loraamm, R.W.; Yang, G.; Wang, J. Comparison between Wavelet Spectral Features and Conventional Spectral Features in Detecting Yellow Rust for Winter Wheat. Comput. Electron. Agric. 2014, 100, 79–87. [Google Scholar] [CrossRef]
  11. Tian, L.; Xue, B.; Wang, Z.; Li, D.; Yao, X.; Cao, Q.; Zhu, Y.; Cao, W.; Cheng, T. Spectroscopic Detection of Rice Leaf Blast Infection from Asymptomatic to Mild Stages with Integrated Machine Learning and Feature Selection. Remote Sens. Environ. 2021, 257, 112350. [Google Scholar] [CrossRef]
  12. Zhang, J.; Lin, Y.; Wang, J.; Huang, W.; Chen, L.; Zhang, D. Spectroscopic Leaf Level Detection of Powdery Mildew for Winter Wheat Using Continuous Wavelet Analysis. J. Integr. Agric. 2012, 11, 1474–1484. [Google Scholar] [CrossRef]
  13. Luo, J.; Huang, W.; Yuan, L.; Zhao, C.; Du, S.; Zhang, J.; Zhao, J. Evaluation of Spectral Indices and Continuous Wavelet Analysis to Quantify Aphid Infestation in Wheat. Precis. Agric. 2013, 14, 151–161. [Google Scholar] [CrossRef]
  14. Shi, Y.; Huang, W.; González-Moreno, P.; Luke, B.; Dong, Y.; Zheng, Q.; Ma, H.; Liu, L. Wavelet-Based Rust Spectral Feature Set (WRSFs): A Novel Spectral Feature Set Based on Continuous Wavelet Transformation for Tracking Progressive Host–Pathogen Interaction of Yellow Rust on Wheat. Remote Sens. 2018, 10, 525. [Google Scholar] [CrossRef]
  15. Ma, H.; Huang, W.; Jing, Y.; Pignatti, S.; Laneve, G.; Dong, Y.; Ye, H.; Liu, L.; Guo, A.; Jiang, J. Identification of Fusarium Head Blight in Winter Wheat Ears Using Continuous Wavelet Analysis. Sensors 2019, 20, 20. [Google Scholar] [CrossRef] [PubMed]
  16. Cheng, T.; Rivard, B.; Sánchez-Azofeifa, G.A.; Feng, J.; Calvo-Polanco, M. Continuous Wavelet Analysis for the Detection of Green Attack Damage Due to Mountain Pine Beetle Infestation. Remote Sens. Environ. 2010, 114, 899–910. [Google Scholar] [CrossRef]
  17. Rodriguez, J.; Lizarazo, I.; Prieto, F.; Angulo-Morales, V. Assessment of Potato Late Blight from UAV-Based Multispectral Imagery. Comput. Electron. Agric. 2021, 184, 106061. [Google Scholar] [CrossRef]
  18. Duarte-Carvajalino, J.M.; Alzate, D.F.; Ramirez, A.A.; Santa-Sepulveda, J.D.; Fajardo-Rojas, A.E.; Soto-Suárez, M. Evaluating Late Blight Severity in Potato Crops Using Unmanned Aerial Vehicles and Machine Learning Algorithms. Remote Sens. 2018, 10, 1513. [Google Scholar] [CrossRef]
  19. Zhang, T.; Cai, Y.; Zhuang, P.; Li, J. Remotely Sensed Crop Disease Monitoring by Machine Learning Algorithms: A Review. Un. Sys. 2023, 1–11. [Google Scholar] [CrossRef]
  20. Su, J.; Liu, C.; Coombes, M.; Hu, X.; Wang, C.; Xu, X.; Li, Q.; Guo, L.; Chen, W.-H. Wheat Yellow Rust Monitoring by Learning from Multispectral UAV Aerial Imagery. Comput. Electron. Agric. 2018, 155, 157–166. [Google Scholar] [CrossRef]
  21. Wang, H.; Qin, F.; Ruan, L.; Wang, R.; Liu, Q.; Ma, Z.; Li, X.; Cheng, P.; Wang, H. Identification and Severity Determination of Wheat Stripe Rust and Wheat Leaf Rust Based on Hyperspectral Data Acquired Using a Black-Paper-Based Measuring Method. PLoS ONE 2016, 11, e0154648. [Google Scholar] [CrossRef]
  22. Bohnenkamp, D.; Behmann, J.; Mahlein, A.-K. In-Field Detection of Yellow Rust in Wheat on the Ground Canopy and UAV Scale. Remote Sens. 2019, 11, 2495. [Google Scholar] [CrossRef]
  23. Lan, Y.; Huang, Z.; Deng, X.; Zhu, Z.; Huang, H.; Zheng, Z.; Lian, B.; Zeng, G.; Tong, Z. Comparison of Machine Learning Methods for Citrus Greening Detection on UAV Multispectral Images. Comput. Electron. Agric. 2020, 171, 105234. [Google Scholar] [CrossRef]
  24. Xishuangbanna Dai Autonomous Prefecture People’s Government Official Website. Available online: https://www.xsbn.gov.cn/index.dhtml (accessed on 9 December 2023).
  25. Milton, E.J.; Schaepman, M.E.; Anderson, K.; Kneubühler, M.; Fox, N. Progress in Field Spectroscopy. Remote Sens. Environ. 2009, 113, S92–S109. [Google Scholar] [CrossRef]
  26. ASD Portable Spectrometers & Spectroradiometers | Malvern Panalytical. Available online: https://www.malvernpanalytical.com/en/products/product-range/asd-range (accessed on 9 December 2023).
  27. Thenkabail, P.S.; Smith, R.B.; De Pauw, E. Hyperspectral Vegetation Indices and Their Relationships with Agricultural Crop Characteristics. Remote Sens. Environ. 2000, 71, 158–182. [Google Scholar] [CrossRef]
  28. Gamon, J.A.; Penuelas, J.; Field, C.B. A Narrow-Waveband Spectral Index That Tracks Diurnal Changes in Photosynthetic Efficiency. Remote Sens. Environ. 1992, 41, 35–44. [Google Scholar] [CrossRef]
  29. Kim, M.S.; Daughtry, C.S.T.; Chappelle, E.W.; McMurtrey, J.E.; Walthall, C.L. The Use of High Spectral Resolution Bands for Estimating Absorbed Photosynthetically Active Radiation (A Par). In Proceedings of the 6th International Symposium on Physical Measurements and Signatures in Remote Sensing, Val D’Isere France, 17–21 January 1994. [Google Scholar]
  30. Haboudane, D.; Miller, J.R.; Tremblay, N.; Zarco-Tejada, P.J.; Dextraze, L. Integrated Narrow-Band Vegetation Indices for Prediction of Crop Chlorophyll Content for Application to Precision Agriculture. Remote Sens. Environ. 2002, 81, 416–426. [Google Scholar] [CrossRef]
  31. Daughtry, C.S.; Walthall, C.L.; Kim, M.S.; De Colstoun, E.B.; McMurtrey Iii, J.E. Estimating Corn Leaf Chlorophyll Concentration from Leaf and Canopy Reflectance. Remote Sens. Environ. 2000, 74, 229–239. [Google Scholar] [CrossRef]
  32. Merton, R.; Huntington, J. Early Simulation Results of the ARIES-1 Satellite Sensor for Multi-Temporal Vegetation Research Derived from AVIRIS. In Proceedings of the Eighth Annual JPL Airborne Earth Science Workshop, Pasadena, CA, USA, 9–11 February 1999; Citeseer: State College, PA, USA, 1999; pp. 9–11. [Google Scholar]
  33. Merzlyak, M.N.; Gitelson, A.A.; Chivkunova, O.B.; Rakitin, V.Y. Non-destructive Optical Detection of Pigment Changes during Leaf Senescence and Fruit Ripening. Physiol. Plant. 1999, 106, 135–141. [Google Scholar] [CrossRef]
  34. Gitelson, A.A.; Merzlyak, M.N.; Chivkunova, O.B. Optical Properties and Nondestructive Estimation of Anthocyanin Content in Plant Leaves. Photochem. Photobiol. 2007, 74, 38–45. [Google Scholar] [CrossRef]
  35. Filella, I.; Serrano, L.; Serra, J.; Peñuelas, J. Evaluating Wheat Nitrogen Status with Canopy Reflectance Indices and Discriminant Analysis. Crop Sci. 1995, 35, 1400–1405. [Google Scholar] [CrossRef]
  36. Broge, N.H.; Leblanc, E. Comparing Prediction Power and Stability of Broadband and Hyperspectral Vegetation Indices for Estimation of Green Leaf Area Index and Canopy Chlorophyll Density. Remote Sens. Environ. 2001, 76, 156–172. [Google Scholar] [CrossRef]
  37. Gong, P.; Pu, R.; Heald, R.C. Analysis of in Situ Hyperspectral Data for Nutrient Estimation of Giant Sequoia. Int. J. Remote Sens. 2002, 23, 1827–1850. [Google Scholar] [CrossRef]
  38. Mallat, S. A Wavelet Tour of Signal Processing; Elsevier: Amsterdam, The Netherlands, 1999. [Google Scholar] [CrossRef]
  39. Mallat, S. Zero-Crossings of a Wavelet Transform. IEEE Trans. Inf. Theory 1991, 37, 1019–1033. [Google Scholar] [CrossRef]
  40. Torrence, C.; Compo, G.P. A Practical Guide to Wavelet Analysis. Bull. Am. Meteorol. Soc. 1998, 79, 61–78. [Google Scholar] [CrossRef]
  41. Cheng, T.; Rivard, B.; Sanchez-Azofeifa, A. Spectroscopic Determination of Leaf Water Content Using Continuous Wavelet Analysis. Remote Sens. Environ. 2011, 115, 659–670. [Google Scholar] [CrossRef]
  42. Lin, C.; Peng, F.; Wang, B.-H.; Sun, W.-F.; Kong, X.-J. Research on PCA and KPCA Self-Fusion Based MSTAR SAR Automatic Target Recognition Algorithm. J. Electron. Sci. Technol. 2012, 10, 352–357. [Google Scholar] [CrossRef]
  43. Breiman, L. Random Forests. Mach. Learn. 2001, 45, 5–32. [Google Scholar] [CrossRef]
  44. Vapnik, V. The Nature of Statistical Learning Theory; Springer Science & Business Media: Berlin/Heidelberg, Germany, 1999. [Google Scholar] [CrossRef]
  45. Karatzoglou, A.; Meyer, D.; Hornik, K. Support Vector Machines in R. J. Stat. Softw. 2006, 15, 1–28. [Google Scholar] [CrossRef]
  46. Smola, A.J.; Schölkopf, B. A Tutorial on Support Vector Regression. Stat. Comput. 2004, 14, 199–222. [Google Scholar] [CrossRef]
  47. Panda, S.S.; Ames, D.P.; Panigrahi, S. Application of Vegetation Indices for Agricultural Crop Yield Prediction Using Neural Network Techniques. Remote Sens. 2010, 2, 673–696. [Google Scholar] [CrossRef]
  48. Allouche, O.; Tsoar, A.; Kadmon, R. Assessing the Accuracy of Species Distribution Models: Prevalence, Kappa and the True Skill Statistic (TSS). J. Appl. Ecol. 2006, 43, 1223–1232. [Google Scholar] [CrossRef]
  49. Foody, G.M. Explaining the Unsuitability of the Kappa Coefficient in the Assessment and Comparison of the Accuracy of Thematic Maps Obtained by Image Classification. Remote Sens. Environ. 2020, 239, 111630. [Google Scholar] [CrossRef]
  50. Pedregosa, F.; Varoquaux, G.; Gramfort, A.; Michel, V.; Thirion, B.; Grisel, O.; Blondel, M.; Prettenhofer, P.; Weiss, R.; Dubourg, V.; et al. Scikit-Learn: Machine Learning in Python. J. Mach. Learn. Res. 2011, 12, 2825–2830. [Google Scholar]
  51. Heeren, T.; D’Agostino, R. Robustness of the Two Independent Samples t -test When Applied to Ordinal Scaled Data. Stat. Med. 1987, 6, 79–90. [Google Scholar] [CrossRef] [PubMed]
  52. Bai, R.; Wang, J.; Li, N. Climate Change Increases the Suitable Area and Suitability Degree of Rubber Tree Powdery Mildew in China. Ind. Crops Prod. 2022, 189, 115888. [Google Scholar] [CrossRef]
  53. Sarker, I.H. Machine Learning: Algorithms, Real-World Applications and Research Directions. SN Comput. Sci. 2021, 2, 160. [Google Scholar] [CrossRef]
  54. Boulent, J.; Foucher, S.; Théau, J.; St-Charles, P.-L. Convolutional Neural Networks for the Automatic Identification of Plant Diseases. Front. Plant Sci. 2019, 10, 941. [Google Scholar] [CrossRef] [PubMed]
  55. Zhang, C.; Kovacs, J.M. The Application of Small Unmanned Aerial Systems for Precision Agriculture: A Review. Precision Agric. 2012, 13, 693–712. [Google Scholar] [CrossRef]
  56. Guo, A.; Huang, W.; Dong, Y.; Ye, H.; Ma, H.; Liu, B.; Wu, W.; Ren, Y.; Ruan, C.; Geng, Y. Wheat Yellow Rust Detection Using UAV-Based Hyperspectral Technology. Remote Sens. 2021, 13, 123. [Google Scholar] [CrossRef]
  57. Su, J.; Liu, C.; Hu, X.; Xu, X.; Guo, L.; Chen, W.-H. Spatio-Temporal Monitoring of Wheat Yellow Rust Using UAV Multispectral Imagery. Comput. Electron. Agric. 2019, 167, 105035. [Google Scholar] [CrossRef]
Figure 1. Examples of powdery mildew at various disease severity levels. (a) Healthy; (b) Severity 1; (c) Severity 2; (d) Severity 3; (e) Severity 4.
Remotesensing 16 00105 g001
Figure 2. Flowchart of wavelet feature extraction.
Remotesensing 16 00105 g002
Figure 3. Spectral reflectance curves of healthy and powdery mildew-infected rubber tree leaves.
Remotesensing 16 00105 g003
Figure 4. Wavelet coefficient curves at different scales.
Remotesensing 16 00105 g004
Figure 5. PCA feature contribution rate distribution.
Remotesensing 16 00105 g005
Figure 6. Correlation scalogram generated via continuous wavelet transform.
Remotesensing 16 00105 g006
Figure 7. Detecting the accuracy of the RF model based on all wavelet features at a single decomposition scale.
Remotesensing 16 00105 g007
Table 1. Powdery mildew disease severity grading standards.
LevelHealthySeverity 1Severity 2Severity 3Severity 4
Leaf spot area00~12.5%12.5~25%25~50%50~75%
Canopy
appearance
characteristics
No disease lesion infestation.Leaves are covered with a layer of white powdery substance, with disease lesions occupying one-eighth of the total leaf area.Disease lesions occupy one-quarter of the total leaf area, or leaves are mildly wrinkled due to the disease.Disease lesions occupy half of the total leaf area, or leaves are moderately wrinkled due to the disease.Disease lesions occupy three-fourths of the total leaf area, or leaves are severely wrinkled due to the disease.
Table 2. Traditional spectral features selected in the study.
Category Index/Spectral
Feature
DefinitionDescription or FormulaReference
Vegetation
indices
NBNDVINarrow-band normalized
Difference vegetation index
(R850 − R680)/(R850 + R680)[27]
PRIPhotochemical/physiological reflectance index(R531 − R570)/(R531 + R570)[28]
PHRIPhysiological reflectance index(R550 − R531)/(R531 + R550)[28]
CARIChlorophyll absorption ratio index(|(a × 670 + R670 + b)|/(a2 + 1)1/2) × (R700/R670)
a = (R700 − R550)/150, b = R550 − (a × 550)
[29]
TCARITransformed chlorophyll
absorption and reflectance
index
3 × [(R700 − R670) − 0.2 × (R700 − R500)]/(R700/R670)[30]
MCARIModified chlorophyll
absorption ratio index
[(R701 − R671) − 0.2 × (R701 − R549)]/(R700/R670)[31]
RVSIRed-edge vegetation stress
Index
[(R712 + R752)/2] − R732[32]
PSRIPlant senescence reflectance
Index
(R680 − R500)/R750[33]
ARIAnthocyanin reflectance index(R550)−1 − (R700)−1[34]
NRINitrogen reflectance index(R570 − R670)/(R570 + R670)[35]
TVITriangular vegetation index0.5 × [120(R750 − R550) − 200(R670 − R550)][36]
Differential
spectral
features
DbFirst-order maximal derivative
inside blue edge
Blue edge covers 490–530 nm. Db is the
maximum value of the first-order derivatives within the blue edge of 41 bands
[37]
SDbSummation of first-order
derivatives inside blue edge
Defined by the sum of the first-order
derivative values of 41 bands within the blue edge
[37]
λbWavelength at Dbλb is the wavelength at Db[37]
DyFirst-order maximal derivative
inside yellow edge
Yellow edge covers 550–582 nm. Dy is the maximum value of the first-order derivatives within the yellow edge of 33 bands[37]
SDySummation of first-order
derivatives inside yellow edge
Defined by the sum of the first-order
derivative values of 33 bands within the yellow edge
[37]
λyWavelength at Dyλy is the wavelength at Dy[37]
DrFirst-order maximal derivative
inside red edge
Red edge covers 670–737 nm. Dr is the maximum value of the first-order derivatives within the red edge of 68 bands[37]
SDrSummation of first-order
derivatives inside red edge
Defined by the sum of the first-order
derivative values of 68 bands within the red edge
[37]
λrWavelength at Drλr is the wavelength at Dr[37]
SDr/SDbRatio of SDr and SDbSDr/SDb[37]
(SDr − SDb)/(SDr + SDb)Normalized value of
SDr and SDb
(SDr − SDb)/(SDr + SDb)[37]
(SDr − SDy)/(SDr + SDy)Normalized value of
the SDr and SDy
(SDr − SDy)/(SDr + SDy)[37]
Note: Rx is the reflectance at wavelength x nm.
Table 3. Correlation between traditional spectral features and disease severity.
Spectral Parameter
FeatureCoefficient of
Correlation (R)
FeatureCoefficient of
Correlation (R)
MCARI0.420908 **PhRI0.050046 **
TCARI0.411013 **λr0.030369 **
Db0.344213 **Dy−0.006288
SDb0.342047 **λy−0.076195 **
(SDr − SDy)/(SDr + SDy)0.326514 **NBNDVI−0.126625 **
TVI0.311946 **PSRI−0.163091 **
SDr0.295594 **RVSI−0.238656 **
Dr0.284244 **SDr/SDb−0.26991 **
PRI0.194551 **ARI−0.279479 **
CARI0.175568 **(SDr − SDb)/(SDr + SDb)−0.326462 **
NRI0.09784 **SDy−0.340163 **
λb0.078608 **
Note: ** indicates a highly significant correlation with a p-value < 0.001.
Table 4. Comparison of detection model results based on different wavelet features and algorithms.
AlgorithmPCA-WFs1%R2-WFsSS-WFs
HS1S2S3S4OA(%)KappaHS1S2S3S4OA(%)KappaHS1S2S3S4OA(%)Kappa
RFH18000092.00.9017001088.00.8518000094.70.93
S1013200213000015000
S2011300221000001300
S3010111000130000121
S4000114000213000113
SVMH18000086.70.8313012058.70.4811010053.30.42
S101320031020045510
S212110011110012722
S301011101011233662
S4010212200114001211
BPNNH11100084.00.804830070.70.6410110070.70.64
S1012300012300110400
S202120042500021100
S30121430148821188
S4000014100014000014
Table 5. Comparison of the detection model accuracy between optimal wavelet features and traditional spectral features.
AlgorithmPCA-WFsSFs
HS1S2S3S4OA(%)KappaHS1S2S3S4OA(%)Kappa
RFH18000092.00.908211045.30.32
S101320085110
S201130052313
S301011133572
S4000114001211
SVMH18000086.70.833416241.30.26
S101320038040
S212110055012
S301011123153
S4010212100115
BPNNH11100084.00.804164144.00.30
S101230026340
S202120042340
S301214313172
S4000014102113
Disclaimer/Publisher’s Note: The statements, opinions and data contained in all publications are solely those of the individual author(s) and contributor(s) and not of MDPI and/or the editor(s). MDPI and/or the editor(s) disclaim responsibility for any injury to people or property resulting from any ideas, methods, instructions or products referred to in the content.