Abstract
Autonomous navigation using the GNSS has been increasingly used in lunar exploration missions, as it is considered an efficient method for spacecraft to operate without relying on ground facilities. However, so far, only GPS and Galileo have been studied and implemented in lunar missions, whereas the potential of BDS-3 for such missions remains largely unexplored. This paper presents an analysis and evaluation of the navigation service capabilities for spacecraft at lunar altitudes by utilizing existing GNSS satellite resources in orbit. In detail, we investigate the number of GNSS signals received by low lunar orbit (LLO) receivers, as well as the carrier-to-noise ratio (), Doppler shift, and geometric dilution of precision (GDOP) of the received signal. Additionally, a digital intermediate frequency (IF) signal simulation program to emulate the BDS B1I signal is utilized, which allows to freely set the carrier-to-noise ratio, Doppler shift, and code phase. Based on this framework, we discussed a high-sensitivity BDS B1I signal receiver and validated its performance with simulated signals. We verified the capabilities of coherent integration, non-coherent integration, differential integration, and semi-bit methods to detect weak BDS B1I signals in a lunar environment. The results indicate that the semi-bit coherent differential integration method is still capable of acquiring signals at a of 15 dB-Hz and can effectively suppress the navigation data bit sign transition.
1. Introduction
The Global Navigation Satellite System (GNSS) was originally designed to provide positioning, navigation, and timing (PVT) services to ground-based users and low-orbiting spacecraft. When a vehicle orbits at an altitude higher than that of GNSS satellites, nadir antennae can be used to receive unobscured GNSS side lobe signals from the other side of the Earth [1]. Although these signals are quite weak, as the transmitting antenna gain of the side lobe tends to be about 10–15 dB lower than the main lobe, these signals have proven to be usable [2,3,4,5]. The concept of space service volume (SSV) was introduced early in this century as a standard for describing the service performance of the Global Positioning System (GPS) in space applications from 3000 to 36,000 km above the Earth’s surface (geostationary orbit altitude, GEO) [6]. Moreover, a new definition of SSV for GNSS has been proposed in terms of the four parameters of minimum received power, satellite visibility, pseudorange accuracy, and geometric dilution of precision (GDOP) [2].
The first GPS experiment on the highly elliptical orbit (HEO) mission Equator-S [7] successfully tracked a GPS satellite at an altitude of about 34,000 kilometers, demonstrating that it is possible to receive signals from the sidelobes emitted by transmitter antennae. Based on data from the No.2 telecommunication technology test satellite (TJS-2), Jiang et al. [8] analyzed the application of GPS in determining geostationary orbits and explained some systematic errors in code observations by analyzing multipath effects. Results from the Geostationary Operational Environmental Satellite-R (GOES-R) Series and the Magnetospheric Multiscale (MMS) mission conducted by National Aeronautics and Space Administration (NASA) show that the side lobe signals constitute the bulk of the received signals and can be used effectively for spacecraft navigation [9,10]. It is worth noting that the MMS mission broke the record for navigating a spacecraft using Global Positioning System (GPS) signals at a distance of 187,166 km from Earth, about half the distance to the Moon. With the development of multiple GNSS constellations and the continuous upgrading of existing navigation constellations, multi-constellation and multi-frequency GNSS technologies have significantly improved signal availability [2,11]. The No.5 telecommunication technology test satellite (TJS-5) [12], launched by China in 2020, carries an upgraded, highly sensitive receiver capable of tracking single-frequency signals from GPS and second and third generation Beidou Navigation Satellite System (BDS) satellites. This is the first geosynchronous orbit mission to track the second and third generation BDS satellites since the global deployment of BDS-3.
Numerous studies have been conducted on the use of GNSS signals in moon transfer orbit (MTO) or lunar orbit. Ashman et al. [13] studied the accessibility results using only GPS receivers in lunar near-rectilinear halo orbit (NRHO), exploring the potential use of GPS in lunar navigation. Winternitz et al. [10] explored the tracking results of GPS signals by simulating the performance of the MMS navigation system, with a simulated trans-lunar trajectory and an NRHO, which are typically of interest in lunar exploration missions. Chinese lunar experimental mission Chang’e-5T is equipped with an onboard high-sensitivity receiver with GPS tracking capabilities, acquiring an average of 7–8 GPS satellites per epoch, with 90% of observations above 28 dB-Hz [14]. A detailed exploration of the navigation performance for GEO, HEO, and Lunar trajectory using multi-GNSS side lobe signals is suggested in the literature [5,15]. For more related research, refer to [16,17,18].
However, the use of GNSS receivers in lunar missions still faces significant challenges. To cope with the problems such as ultra-low signal power due to free space loss and large rates of Doppler shift, high-sensitivity receivers were designed to achieve autonomous GNSS navigation for lunar orbiting satellites. In this environment, increasing the integration time is usually an effective way to achieve high sensitivity [19]. In addition, non-coherent and differential integration methods are the traditional methods to attenuate the effect of noise [20,21]. However, navigation data bit sign transitions limit the duration of the correlation between the local code and the received signal [22]. A semi-bit method suppresses the data bit sign transition problem by considering that if a segment of the signal is divided into two parts, one half does not necessarily contain a data bit transition [23]. Besides, software-defined receivers are widely studied because of their convenience and the fact that they only need to process digital signals and do not require hardware support. Referring to the upcoming European Student Moon Orbiter mission, Palmerini et al. [24] discussed the advantages of embedding an airborne GNSS receiver and investigated such a possibility, considering GPS and Galileo signals with an acquisition threshold of 35 dB-Hz. Capuano et al. [25] developed a proof-of-concept receiver called WeakHEO, the simulations of which showed it to be capable of capturing and tracking GPS L1 C/A signals down to 15 dB-Hz. Designed for lunar missions, the HiSGR [26] can handle signals down to 15 dB-Hz, and it uses an all-bit approach to increase the sensitivity to take full advantage of GNSS side lobe signals. Musumeci et al. [27] designed a satellite navigation receiver architecture for future lunar exploration missions, demonstrating the feasibility of using GNSS signals integrated with an orbital filter.
Most of the above-mentioned works only consider the availability of GPS and Galileo signals in lunar missions. The algorithms for detecting BDS signals in the lunar environment have not been studied in depth. This paper focuses on the application of the GNSS in the lunar environment, and in particular on the design of a receiver architecture for future lunar exploration missions. The visibility and signal strength of different GNSS satellite combinations in LLO are analyzed. With the reception thresholds of 15 and 10 dB-Hz, we analyze the acceptance performance of the lunar receiver for main and side lobe signals using GNSS combinations. The BDS B1I signal characteristics are then specifically investigated and coherent integration, non-coherent integration, differential integration, and the alternate half-bit method for capturing low power signals are briefly introduced. The simulation results of four methods for acquiring BDS signals from LLO receivers are presented.
This paper is organized as follows: Section 2 describes the scenario of lunar navigation using the GNSS and the acquisition algorithms of weak GNSS signals in detail. Some results on the received signal performance and the capability of the acquisition algorithms are presented in Section 3. Section 4 discusses the effect of the side lobe signals on the navigation performance in LLO. Several conclusions are presented in Section 5.
2. Materials and Methods
In this section, we first define the scenario of a receiver in circumlunar orbit receiving Earth-GNSS signals, and give some simulation parameters. Next, several algorithms for acquisition of weak signals are briefly described and the relevant parameters of the algorithms used in this paper are elaborated.
2.1. GNSS Satellites and Signals
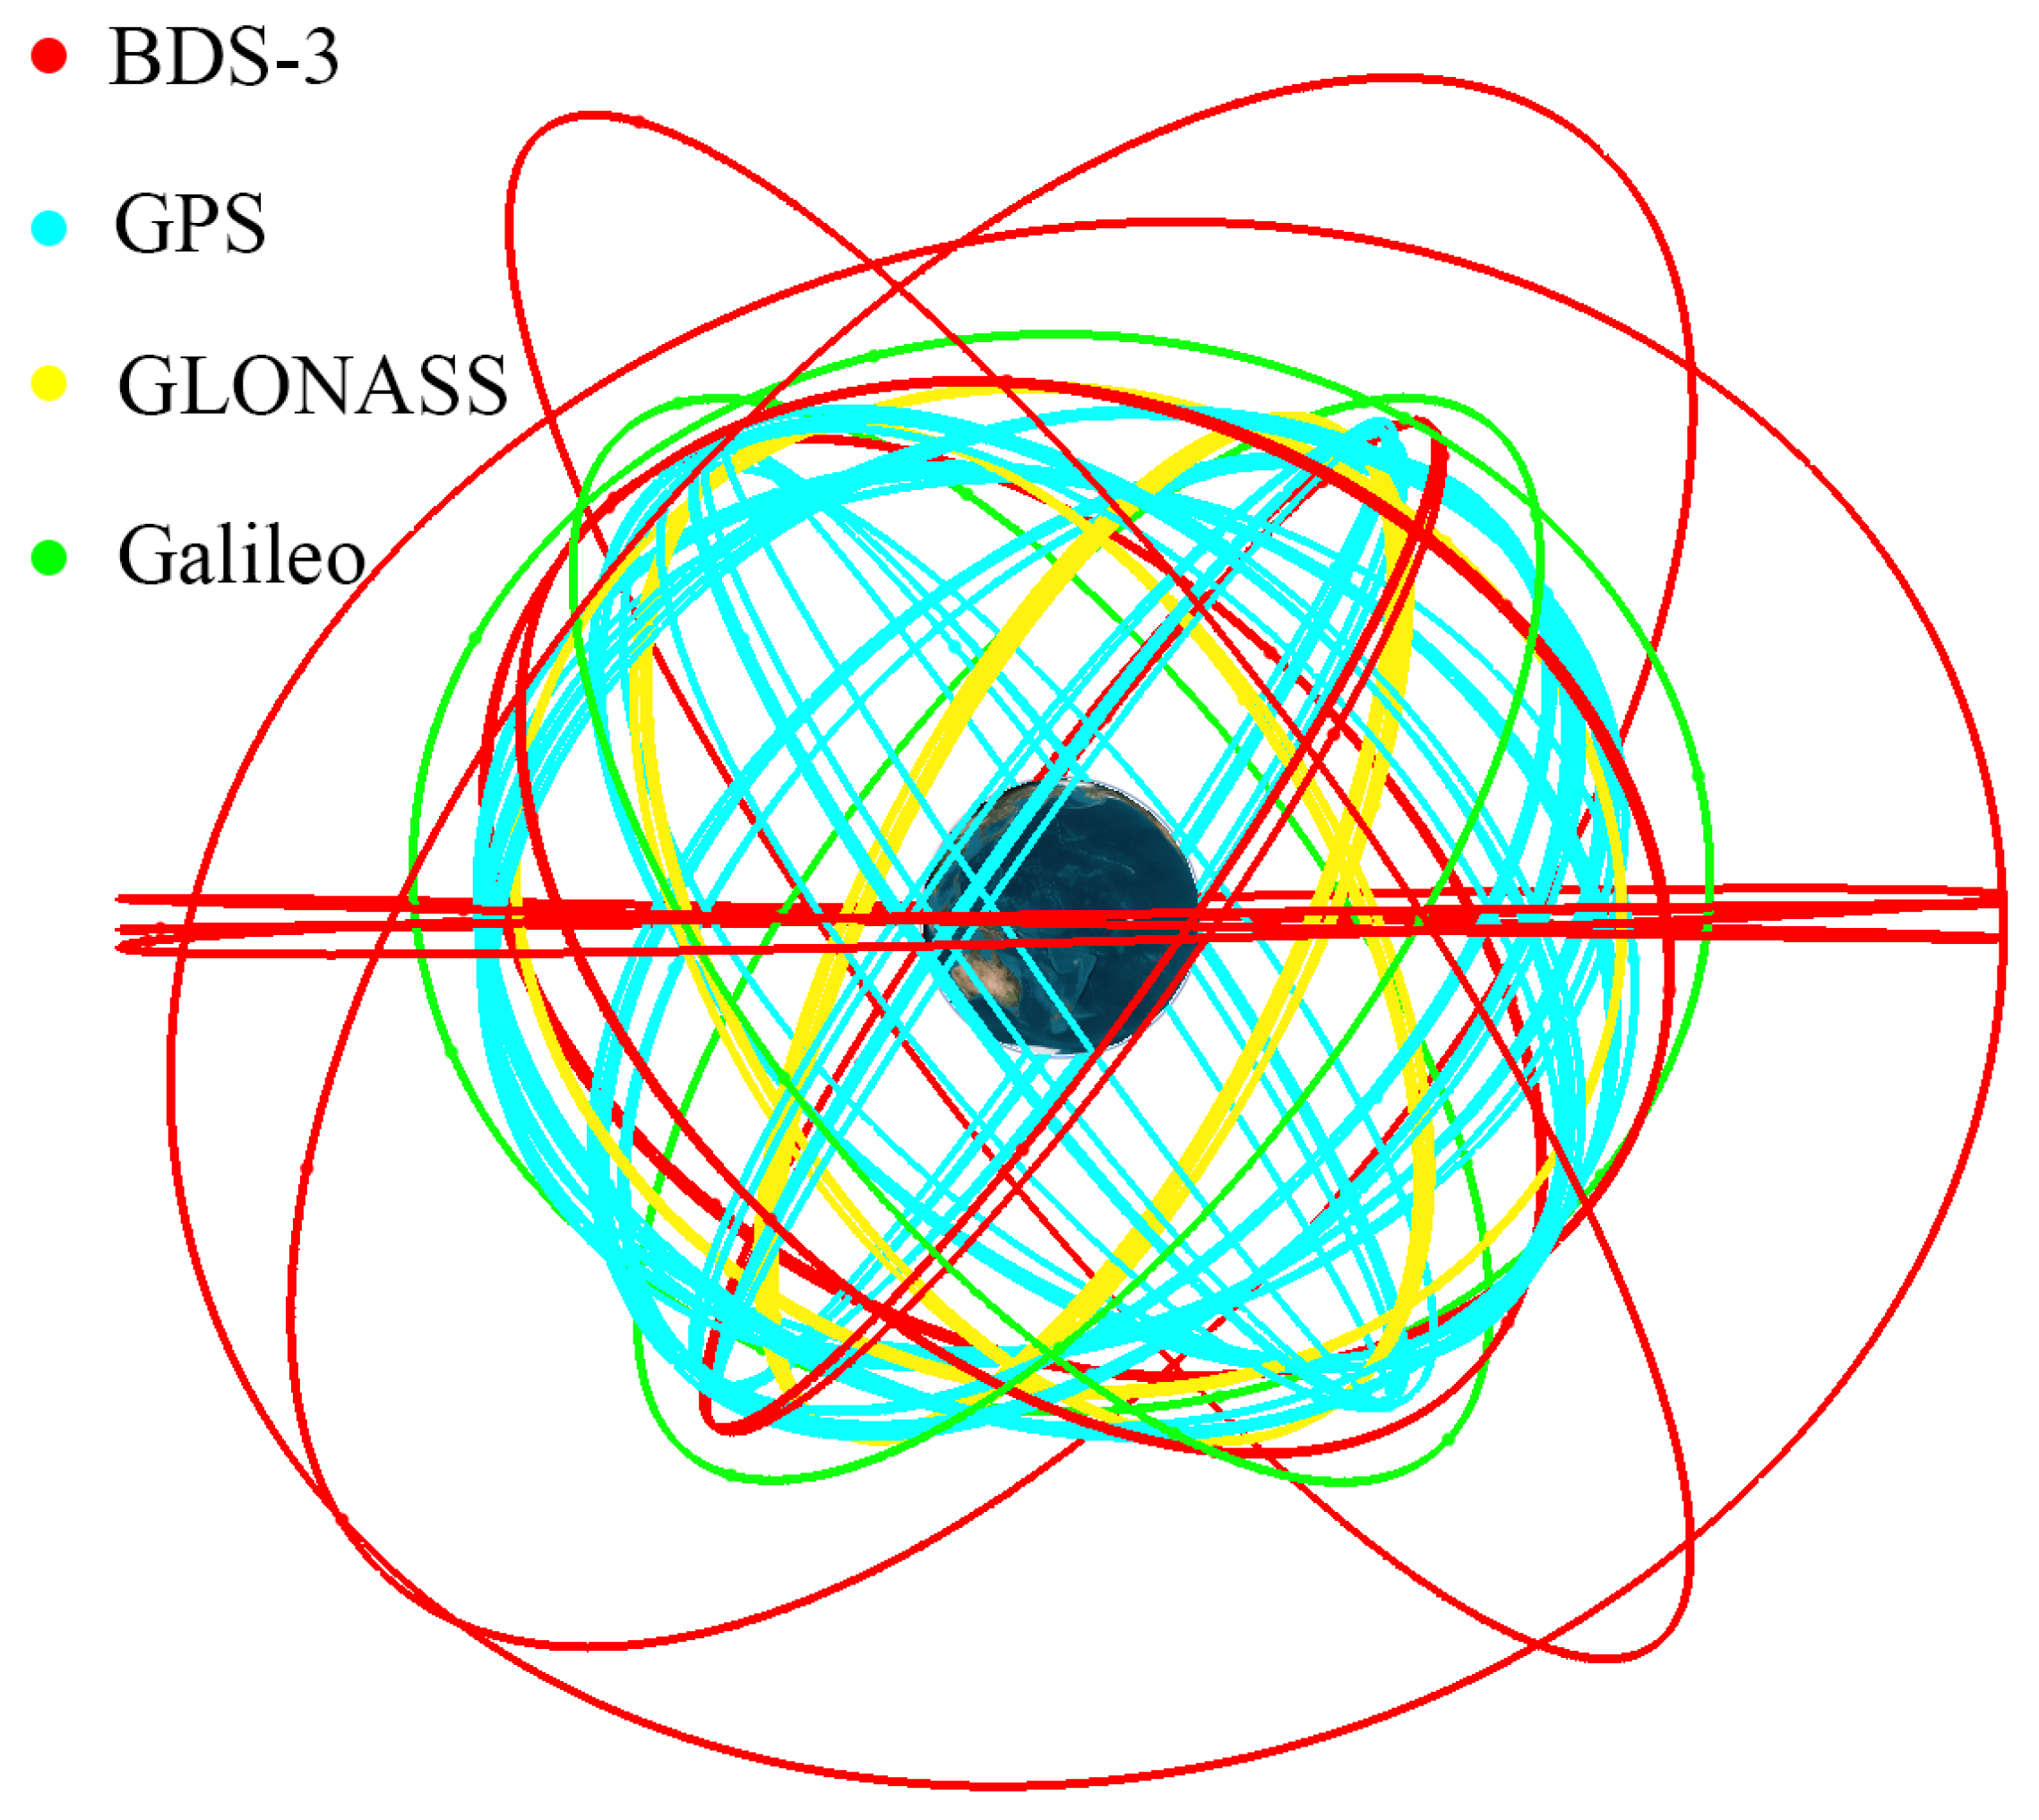
Following Chinese Chang’e-5 [28], we simulated a two-day period LLO with an inclination of 43.7° and an altitude of 200 km starting from 1 March 2023 00:00:00 (UTC). A simulation of the GNSS constellation was performed to generate signals propagating into space. The GPS constellation consists of 31 operational satellites assigned to 6 orbital planes. There are 6 satellites from the IIR block, 7 from the IIR-M block, 12 from the IIF block, and 12 from the III-A block [29], each with a different transmitter radiation pattern, which will be described later. BDS-3 contains 30 satellites, 24 of which are distributed in Medium Earth Orbit (MEO), Inclined Geosynchronous Orbit (IGSO), and Geostationary Orbit (GEO) [30]. GLONASS and Galileo were simulated according to their respective official documents. The spatial distribution of the GNSS is shown in Figure 1. Table 1 lists the frequency bands of each GNSS constellation used in this paper.

Figure 1.
Spatial distribution of each GNSS constellation.

Table 1.
Band frenquency for each GNSS system.
2.2. Transmitter and Receiver Patterns
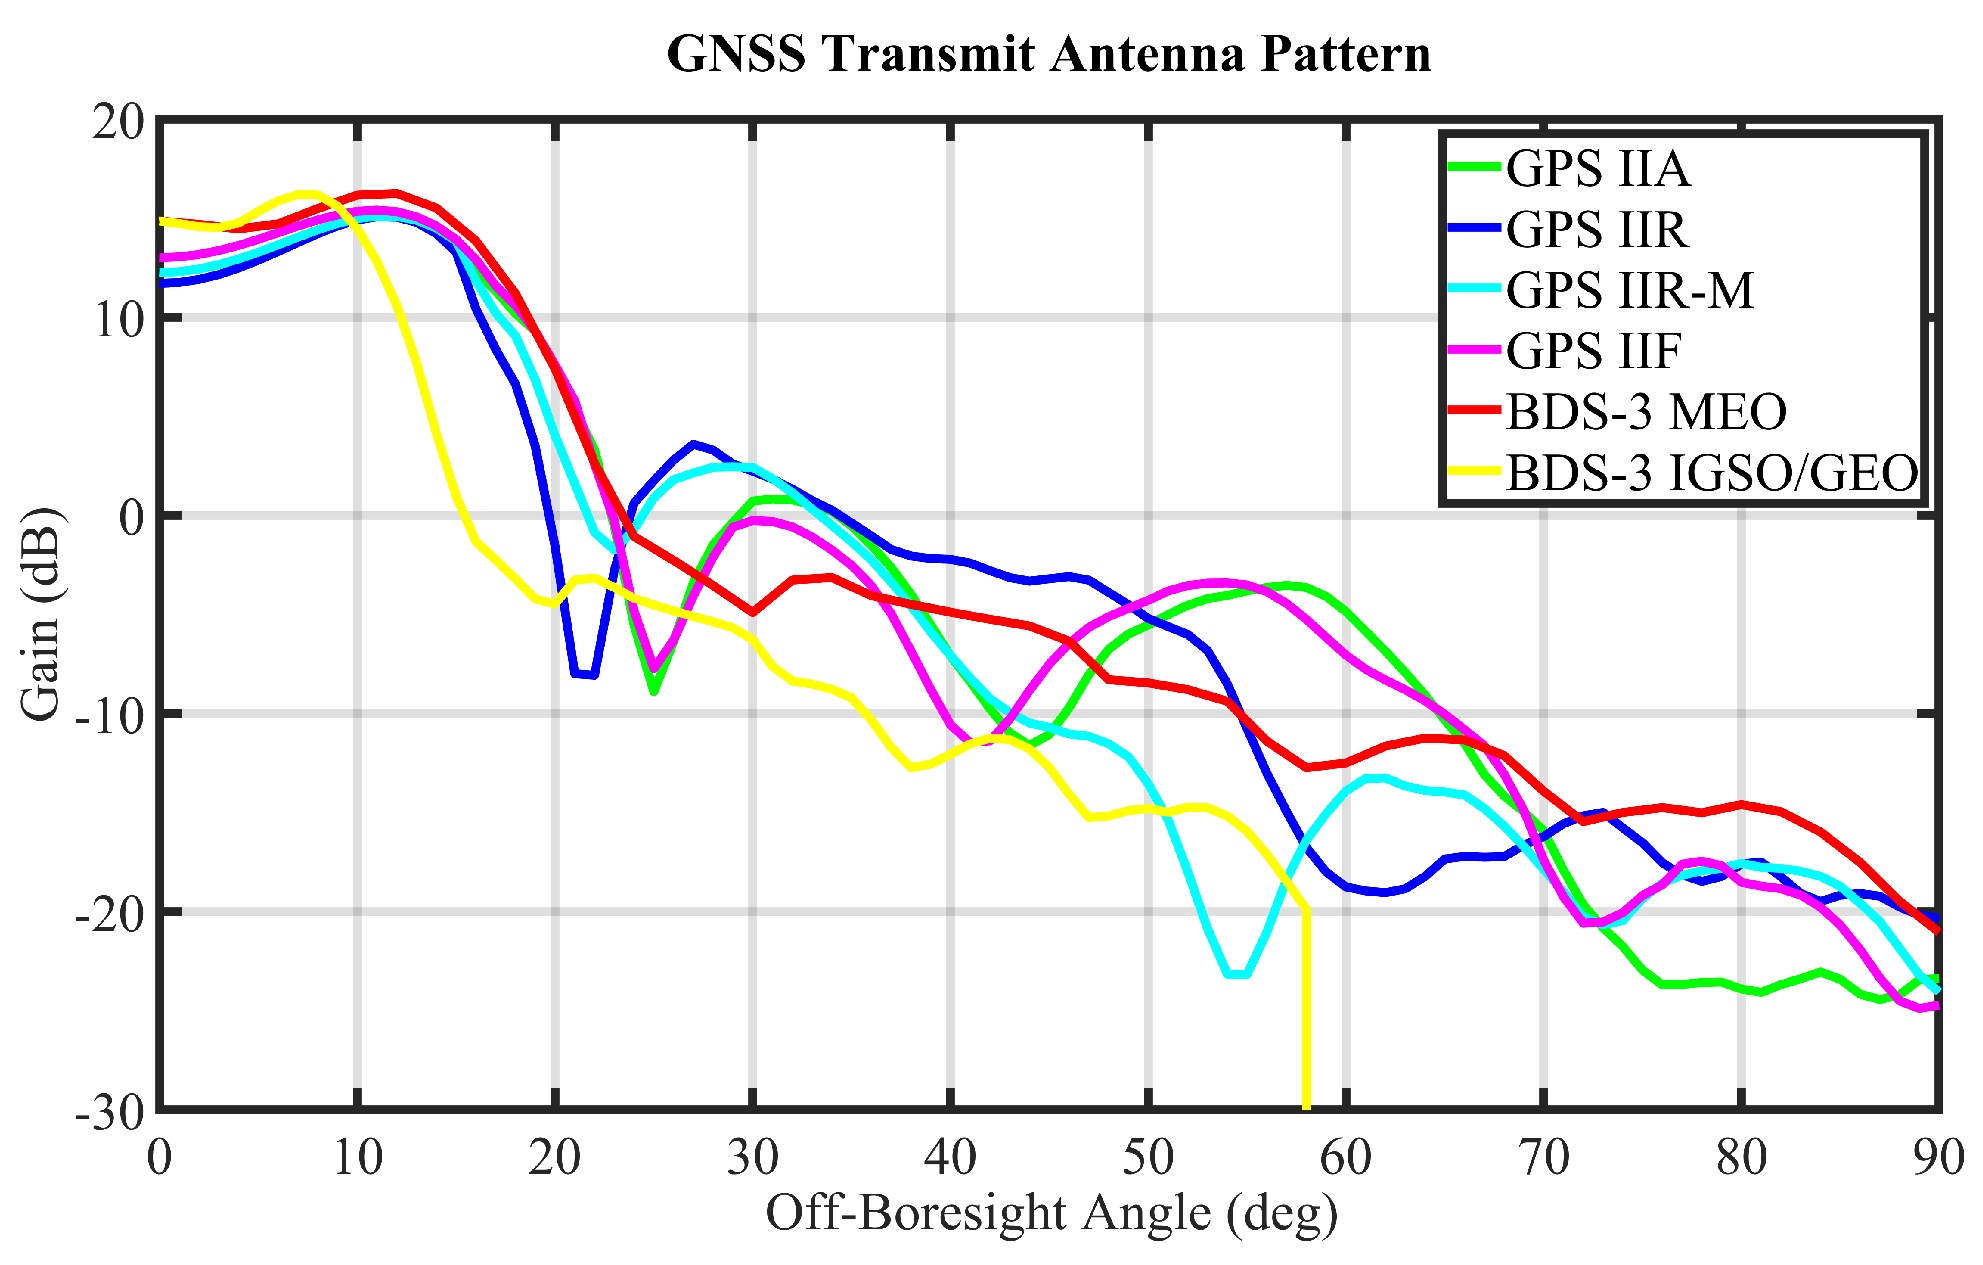
The power of the received signal at the receiver is mainly determined by the GNSS transmitter antenna gain and the receiver antenna gain. A GPS Antenna Characterization Experiment (GPS ACE) reconstructed the transmit gain pattern for GPS blocks IIA, IIR, IIR-M, and IIF [4]. Since existing studies have not found a model for block III-A, we used the gain pattern of block IIA instead. The BDS transmitting antenna gain pattern was reconstructed using TJS-5 measurements by Wang et al. [12]. However, there is no publicly available antenna pattern data for GLONASS and Galileo [5]; thus, the GPS Block IIF satellite antenna pattern was used instead. The values of the GNSS transmitting gain with off-boresight angle is shown in Figure 2.

Figure 2.
The transmitting gain patterns of the GNSS satellite antennas.
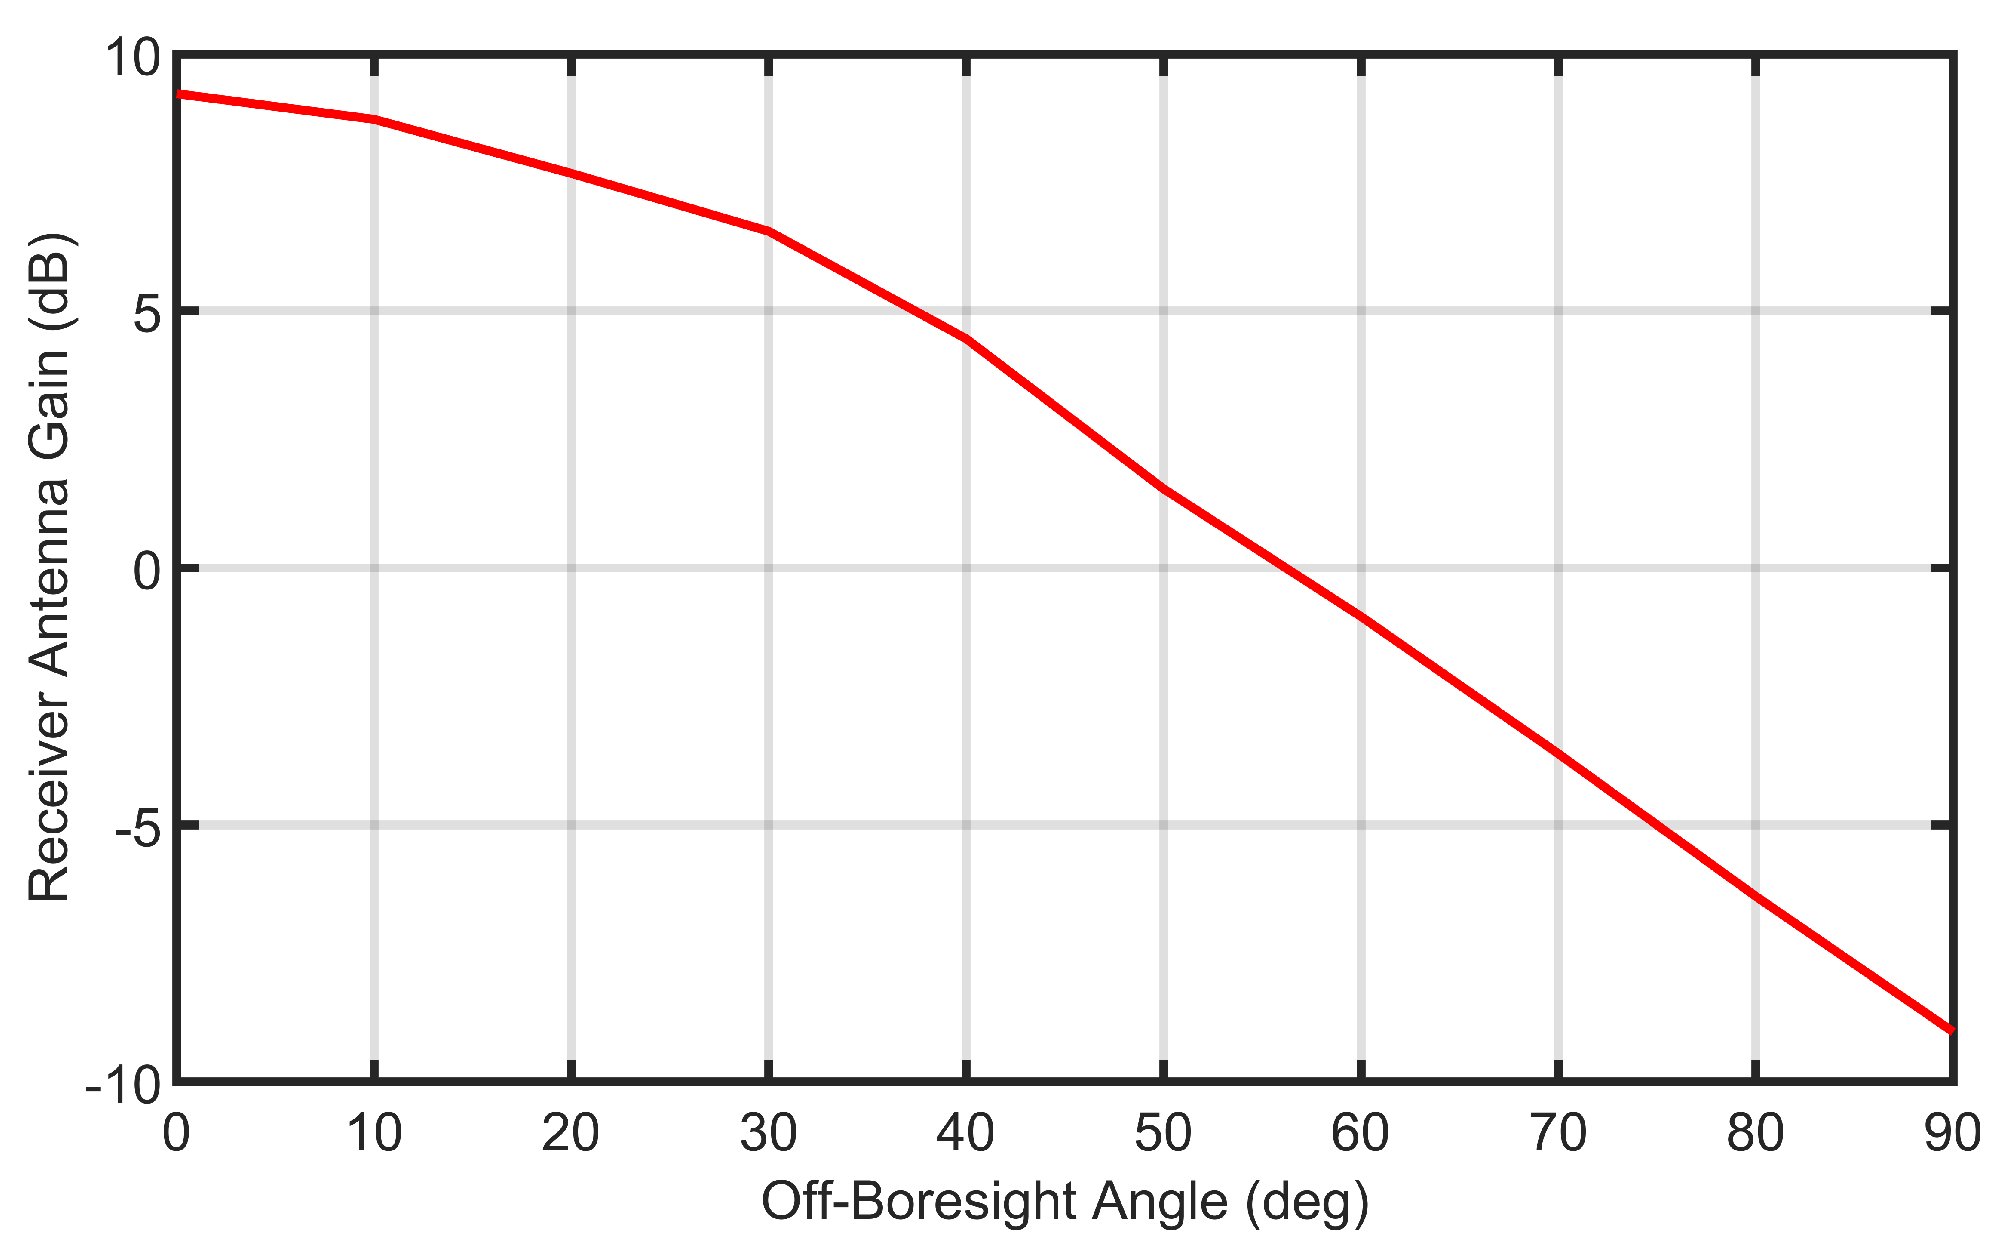
We assume that the spacecraft is equipped with a nadir antenna capable of acquiring multiple GNSS signals for the receiver antenna simulation. The received signal power is faint due to the high free space loss during GNSS signal transmission to the Moon. In this case, only high-gain antennas are able to receive weak signals, and following [5], the gain pattern is depicted in Figure 3.

Figure 3.
Gain pattern of the receiver antenna.
2.3. Observation Scenarios
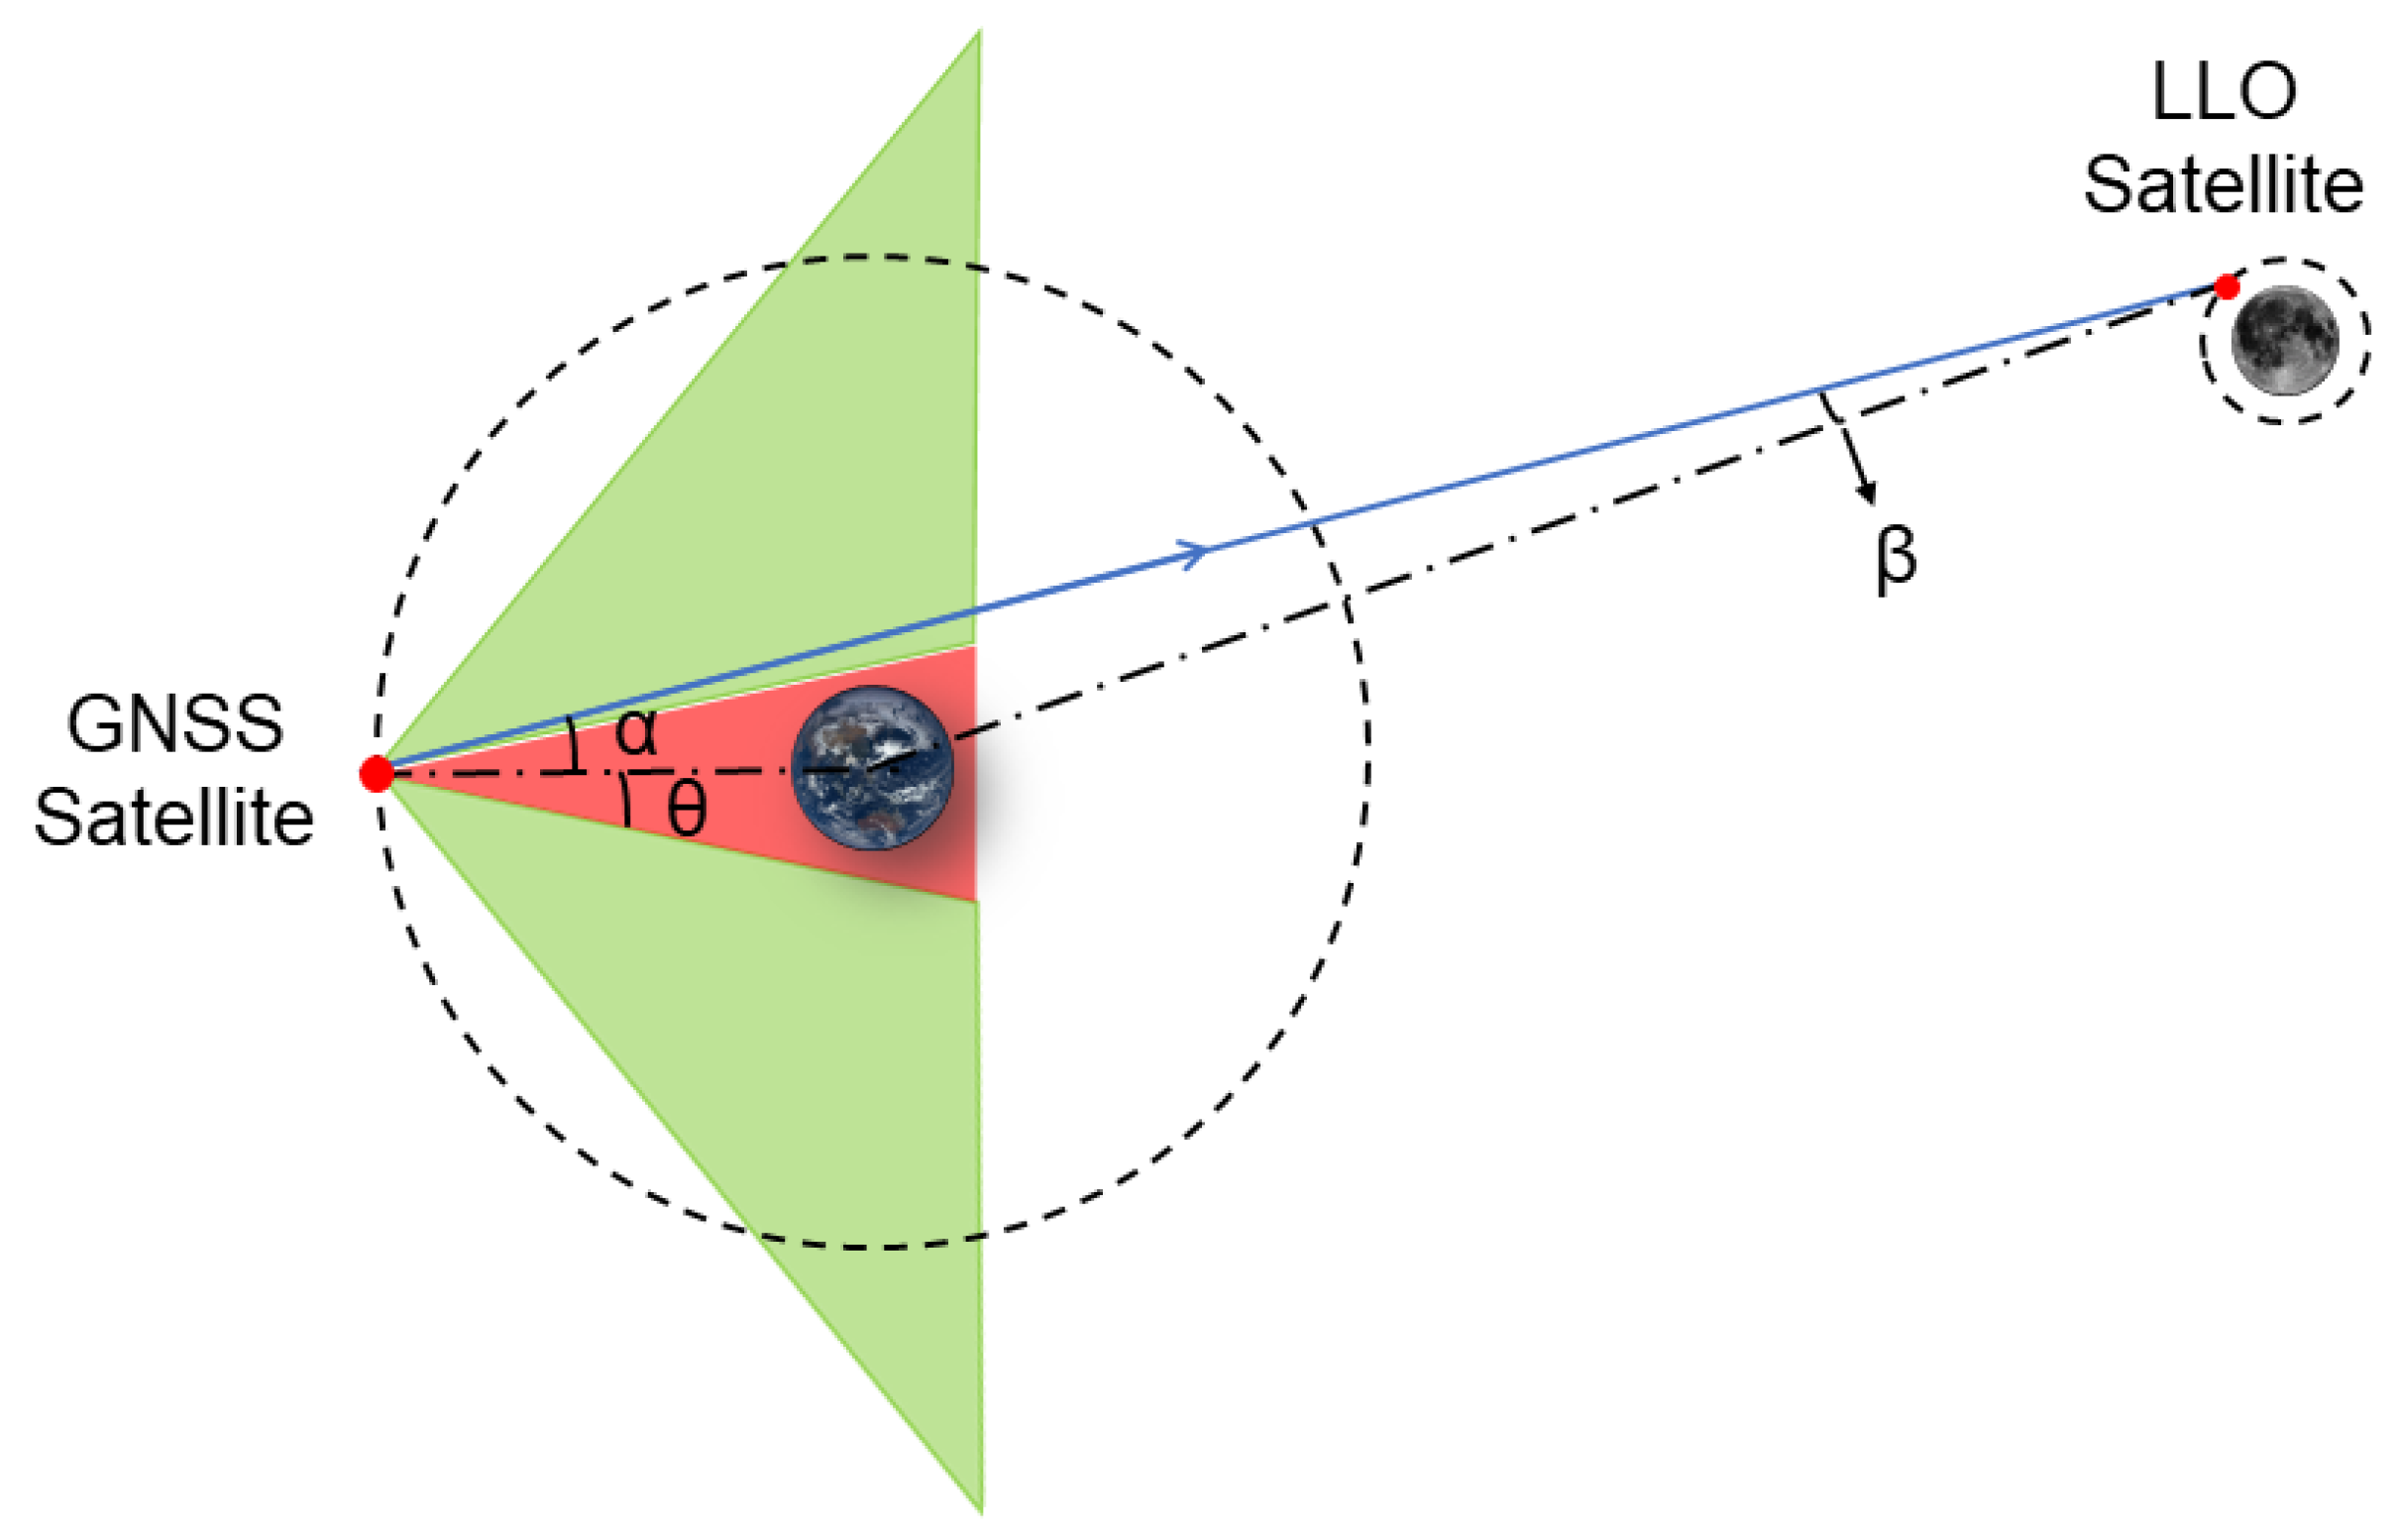
GNSS satellites were originally designed to navigate for low-orbiting spacecraft and ground users, and therefore their signals are transmitted towards the Earth. Lunar spacecraft can only receive those signals that are not obscured by the Earth, most of which are emitted by the sidelobes, as seen in Figure 4. The red and green areas indicate the emitted signals from the main and side lobes, respectively. It can be seen that the receiver on the other side of the Earth relative to the GNSS satellite can only acquire a small portion of the main lobe signals. Table 2 gives the Earth blocking angle which is related to the orbital altitude. When the angle formed by the receiver, the GNSS satellite, and the geocenter is less than the blocking angle, the signal is considered unreachable to the receiver.

Figure 4.
A simulation scenario where the GNSS signal can reach an LLO satellite. and are the off-boresight angles of the transmitted and received signals, respectively. The red and green areas are the main and side lobe areas, respectively. indicates the maximum off-boresight angle of the main lobe signal. (Please note that the distances shown are not to scale and are intended as an illustration only).

Table 2.
Earth blocking angle for each GNSS system.
Once a GNSS satellite is visible to a spacecraft, the received signal power, , of the lunar receiver can be expressed as [31]:
where is the output power of the transmitter amplifier and is the transmitter antenna gain, which is related to the off-boresight angle . is the receiver antenna gain related to off-boresight angle and is the free space propagation loss. As the GNSS signal passes through the troposphere, it covers only a small portion of the entire propagation; hence, the effect of the atmosphere is ignored and the atmospheric loss, , is set to 0 dB in this simulation. The free space propagation loss, , is determined by the propagation distance, d, and the signal frequency, f:
where c is the speed of light in a vacuum.
Based on the received power, , the signal-to-noise ratio (SNR) is denoted as:
where N is the noise power in dB, which can be written as:
where J/K is the Boltzmann constant. The noise temperature of the system T is set to a constant of 175.84 K in our simulation as this is close to the real conditions in SSV applications [5]. is the radio frequency (RF) front-end bandwidth, and this value is closely related to the SNR. In order to compare the performance of different receivers, we usually calculate the carrier/noise ratio, . It can be expreesed as:
where is the noise power spectrum density and is independent of the noise power generated by the receiver front-end bandwidth.
Assuming that the speed of the GNSS satellite is and the speed of the SSV user is , the Doppler shift, , of the received signal can be expressed as:
where is the wavalength of GNSS signal and is the unit observation vector written in the form of
where is the observation vector and it can be calculated from the GNSS satellite position vector and the SSV user position vector :
When N () GNSS satellites are visible, the geometry matrix is calculated as [32]:
where is the geometric distance between the SSV user and the Nth GNSS satellite. Given the measurement matrix , the GDOP value is given by:
2.4. BDS B1I Signal
The BDS B1I signal is received by the antenna, then down-converted and filtered by the front end. Thus, the received signal before the analog-to-digital conversion can be written as follows:
where is the sum of the transmitted signals from different satellites and is the additive white Gaussian noise (AWGN) term. The expression of the intermediate frequency (IF) signal of the i-th satellite without noise usually assumes the following structure [33]:
where:
- is the amplitude of the i-th received signal, and the signal power is given by .
- is the binary phase shift key (BPSK)-modulated navigation data.
- is the spreading sequence generated by two shift registers in a certain way, and it is a pseudo random noise (PRN) code of length 2046.
- is the Neumann–Hoffman (NH) code modulated on the navigation data.
- , , and are the code phase, the Doppler shift, and the initial carrier phase offset for the i-th signal, respectively.
- is the receiver intermediate frequency.
In this research, we wrote a MATLAB-based software for generating BDS BII digital IF signals. According to the performance of the GNSS signal at LLO receivers in Section 3.1, the relevant parameters of the software are presented in Table 3.

Table 3.
Parameters of the BDS B1I IF signal generator.
2.5. Signal Acquisition Algorithms
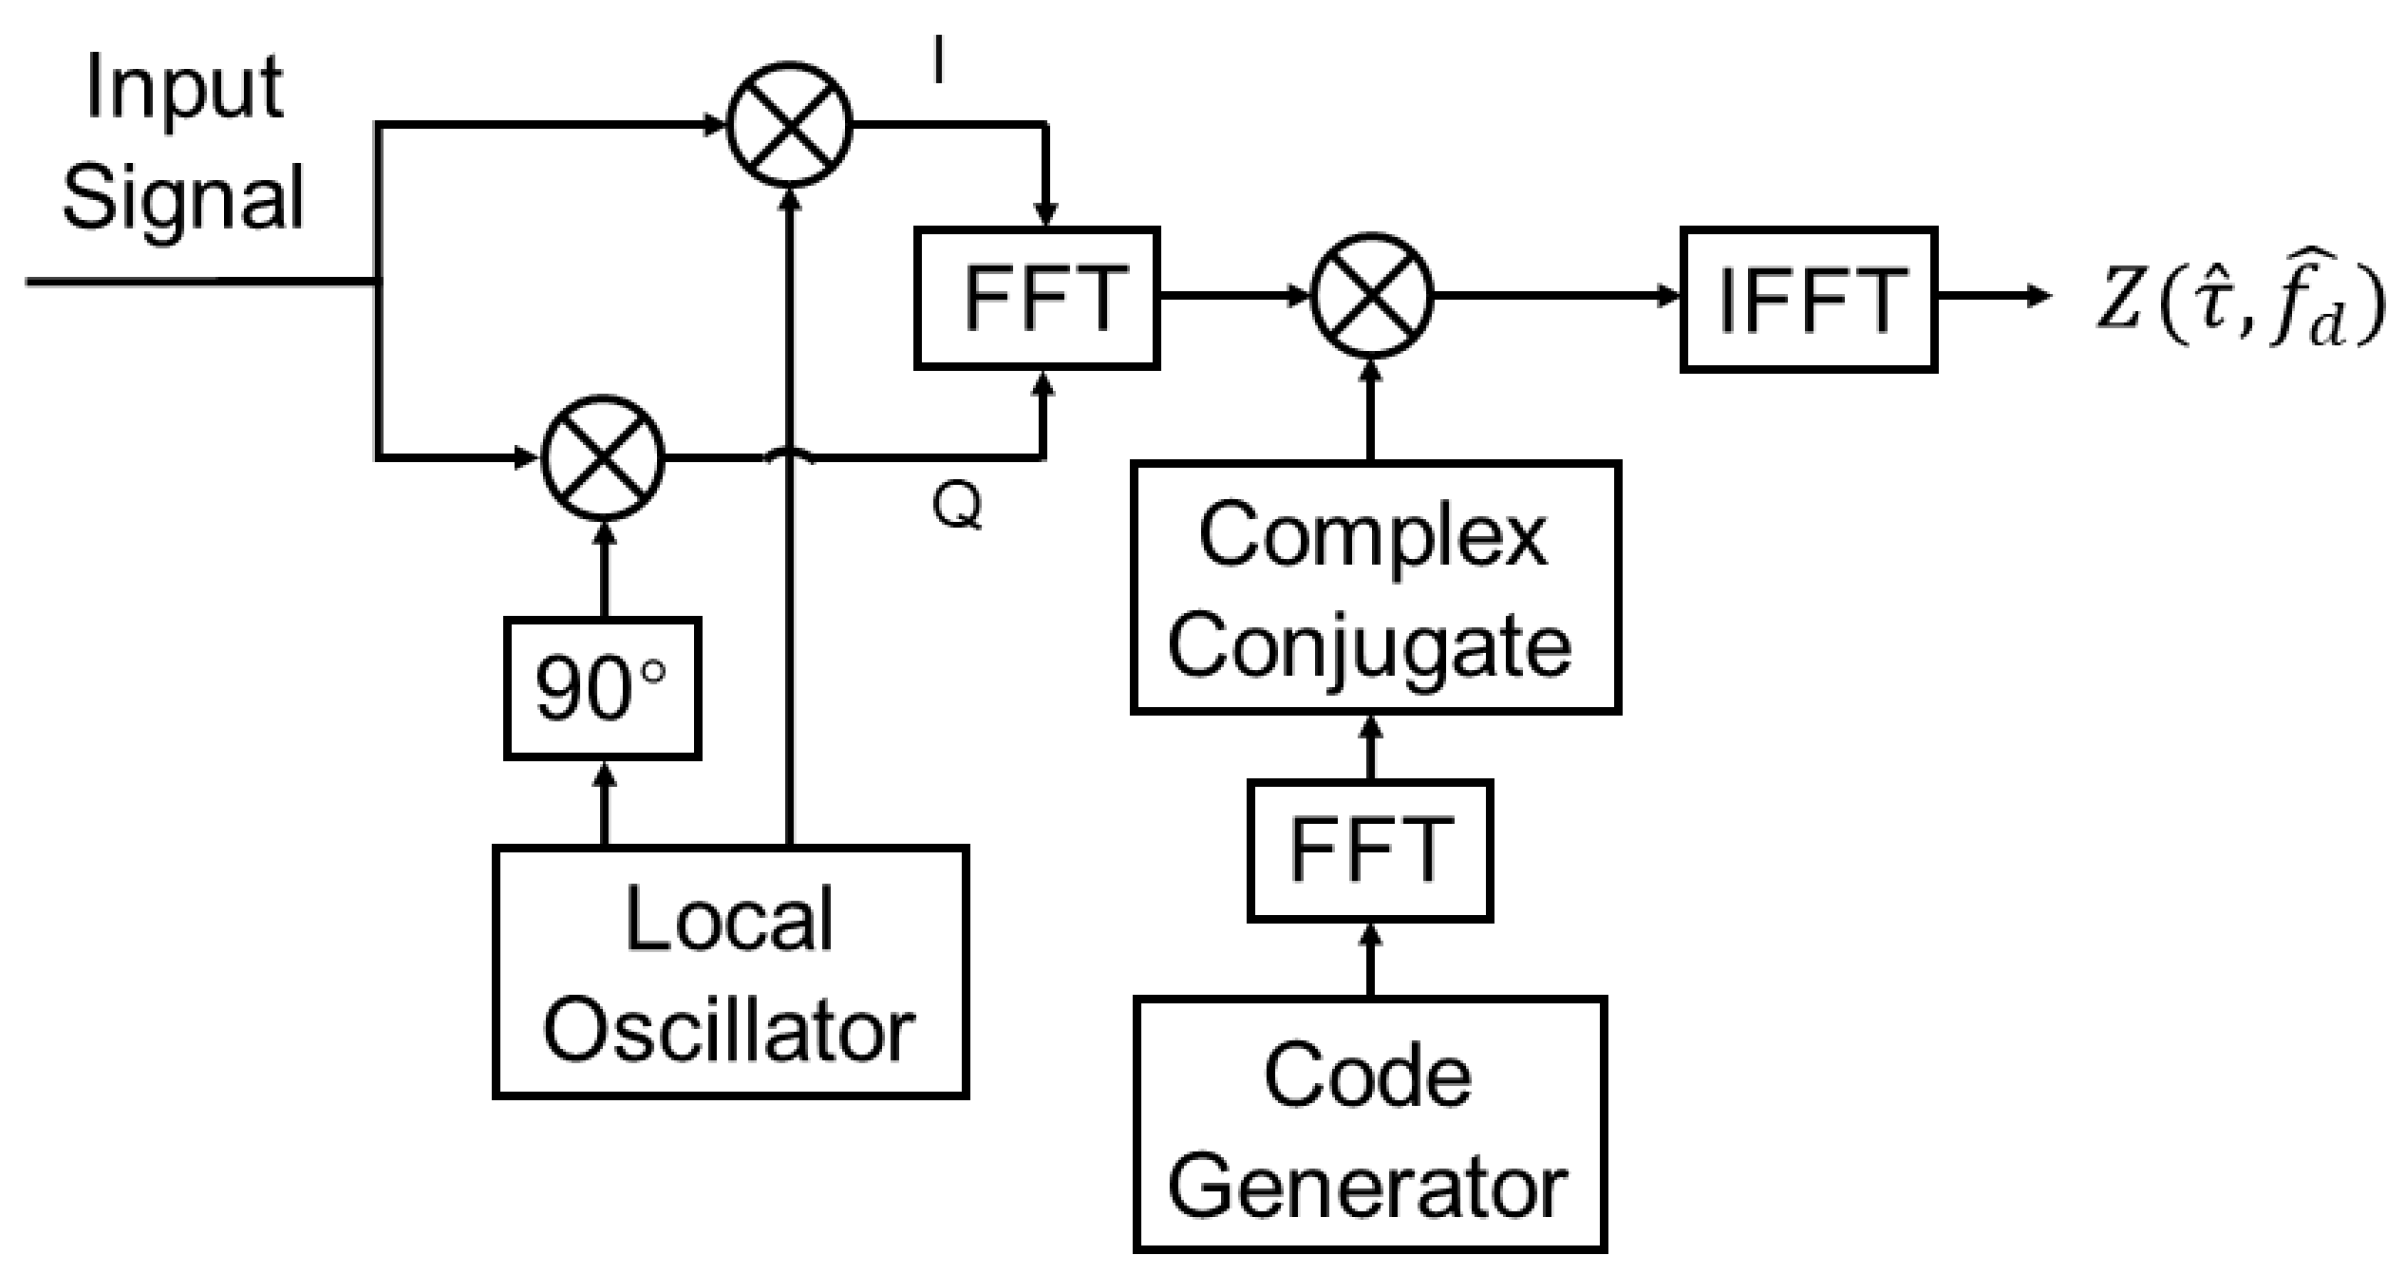
Traditional acquisition search algorithms that rely on code correlation and carrier correlation typically fall into one of the following categories: serial search, parallel frequency space search, and parallel code phase search [34,35]. Parallel code phase search operates in parallel on the code phase and is faster than the other two algorithms. Therefore, all the algorithms used in this study are based on this method. The flowchart of the parallel code phase search algorithm is illustrated in Figure 5.

Figure 5.
Block diagram of the parallel code phase search algorithm.
denotes the correlation function, where and are the estimates of the code phase and Doppler frequency, respectively. Since performing correlation operations on a single C/A code period (1ms for BDS B1I signal) is not sufficient in a weak signal environment, the integration time must be increased to increase the SNR. An extra correlation operation is carried out on the output value in Figure 5. Three techniques are used for this purpose and can be classified as follows: (1) coherent integration (COI), (2) non-coherent integration (NCOI), and (3) differential integration (DI).
The detection function, T, of the coherent integration method has the following relationship:
where M represents the number of performed correlations, i.e., M millisecond data length for the correlation operation. However, a long coherent integration leads to an increase in the number of fast Fourier transforms (FFTs); thus, the coherent integration expression can also be expressed as [36]:
where represents the FFT of the received signal unit . is obtained by the complex conjugate of the C/A code signal replicated locally through the FFT. It means that the received signal is split into M blocks of processing units before carrier correlation is performed and then directly summed. The following operations requiring long code coherent integration are performed using the method shown in Equation (14). Due to the presence of a data bit sign transition in the received signal, coherent integration does not grow the coherence gain indefinitely and can even lead to worse results.
The non-coherent integration method can be expressed in the following form:
where the meanings of the symbols in this expression are the same as in Equation (13). Although this method is insensitive to the data bit sign transition, the problem of square loss occurs due to the square operation. In fact, this operation increases the signal power while amplifying the amount of noise at the output. Moreover, combining coherent and non-coherent integration is a powerful approach that can significantly improve the sensitivity of the receiver.
Differential integration is usually combined with coherent integration and is called coherent differential integration (CODI). The output noise will be lost as a result of the differential operation because the noise of the correlated outputs are almost independent of each other. Coherent differential integration can be expressed as:
where represents the complex conjugate of .
Furthermore, to prevent the effect of navigation data bit sign transitions, the alternate half-bit method is introduced. The BDS B1I signal undergoes a data bit sign transition every 20 ms. Therefore, if the bit transition occurs in the first 10 ms of a continuous 20 ms signal, it cannot occur in the second 10 ms. The alternate half-bit method divides the data into odd and even blocks at 10 ms intervals. As shown in Figure 6, the entire dataset is divided into blocks. Then, the effect of signal bit sign transitions can be avoided by performing integration operations on odd and even blocks, respectively, and then comparing the output of both.

Figure 6.
Block division by the alternate half-bit method, with each block containing 10 ms signals.
The semi-bit coherent differential integration (SBCODI) method [37] combines the advantages of the above methods and can efficiently acquire signals with a lower SNR. The SBCODI method performs differential integration of adjacent odd or even blocks in Figure 6. The larger of the two differential results is then taken as the detected value; thus, the method can be expressed as:
where
and and represent the results of differential integration for odd and even blocks, respectively. In fact, the detected value, Z, of each processing block is the coherently integrated result for 10 ms before differential operation.
2.6. Acquisition Strategy
According to the range of values of the carrier-to-noise ratio set in Table 3, we generated signals with different in steps of 1 dB-Hz. Furthermore, with the same , we performed 100 random tests for each algorithm scheme by Monte Carlo, i.e., the signal contains randomly different pseudo-random noise (PRN) satellites with a random Doppler shift and code phase. Considering that coherent integration alone still has difficulty in acquiring the signal at super low carrier-to-noise ratios, we used the coherent integration algorithm in combination with other algorithms. Therefore, in semi-bit coherent integration (SBCOI) and SBCODI, we accumulated a segment of signals spaced 10 ms apart to the desired integration length. The total integration time for each method was set to 0.8 or 1.6 s and the specific parameters are shown in Table 4.

Table 4.
Receiver parameters for each algorithm.
3. Results
3.1. Observation Results
In this section, the lunar probe receptor characteristics with a combination of main and side lobe signals are evaluated. Based on the simulation scenario and setup described above, we analyzed the number of signals received by the lunar vehicle, the received signal power, and the carrier-to-noise ratio when using single GNSS and combined GNSS systems, respectively. The performances of the signals from the main and side lobe were also compared. The receiver sensitivity was set to 15 dB-Hz or 10 dB-Hz, and the number of visible GNSS satellites and the geometric dilution of precision (GDOP) values were determined based on these two thresholds.
3.1.1. Visible GNSS Satellites
GNSS visibility for this lunar application has two constraints: (1) the line of sight is not obstructed by the Earth and (2) the is greater than the threshold value of the receiver. The number of visible GNSS satellites for different GNSS system combinations at carrier-to-noise ratio thresholds of 15 and 10 dB-Hz, respectively, is given in Figure 7. At a threshold of 15 dB-Hz, the average number of visible satellites for BDS-3 and GPS are 1.7 and 2.0, respectively. However, these two values are 3.6 and 3.9, respectively, when the receiving threshold is reduced to 10 dB-Hz, which is to be expected. BDS-3 performs worse than GPS, which is understandable because the transmitting antenna of the BDS-3 satellite suppresses the side lobe gain, as seen in Figure 2. This is reflected by the fact that there is only one main lobe peak in the gain pattern, while on the contrary, the antenna gain patterns of different GPS blocks show several gain peaks. The average number of accessible GNSS satellites increases to 6.3 and 13.5 when the thresholds are 15 and 10 dB-Hz, respectively, for the joint use of four GNSS systems. In addition, it can be found that periodic signal interruptions occur during the simulation time period, i.e., the number of visible GNSS satellites is 0, which is due to the occlusion of the Moon. Therefore, satellites in circumlunar orbit still have difficulty maintaining a high number of available signals when using the signals of four GNSS systems. Other navigation sensors such as inertial measurement units (IMUs) can be used to provide navigation solutions when GNSS satellite signals are not available. The literature [38] describes the simulation of an onboard GNSS receiver using a loosely coupled inertial navigation system (INS) on several different lunar missions.

Figure 7.
The number of visible GNSS satellites for different GNSS system combinations at a threshold of 15 (left) and 10 (right) dB-Hz. (GREC indicates that quad-GNSS is used.)
Table 5 summarizes the signal availability with at least one satellite and four or more satellites. If the recepted threshold is 15 dB-Hz, the percentage of epochs where more than four satellites are visible to BDS-3 is only 4.82%, while this value increases to 67.86% for when at least one satellite is visible. After lowering the threshold to 10 dB-Hz, the value of at least four BDS-3 available signals reaches 66.33%, which indicates that the of most of the signals is between 10 and 15 dB-Hz. The effect of using the combined GNSS system is evident, when both BDS-3 and GPS systems are available, for more than 60% of the simulation period, the number of visible satellites is at least four. However, when four GNSS systems are used simultaneously, the improvement is not significant; the advantage brought by the dual system receivers is already excellent considering the number of receiver channels.

Table 5.
Satellite visibility for different system combinations.
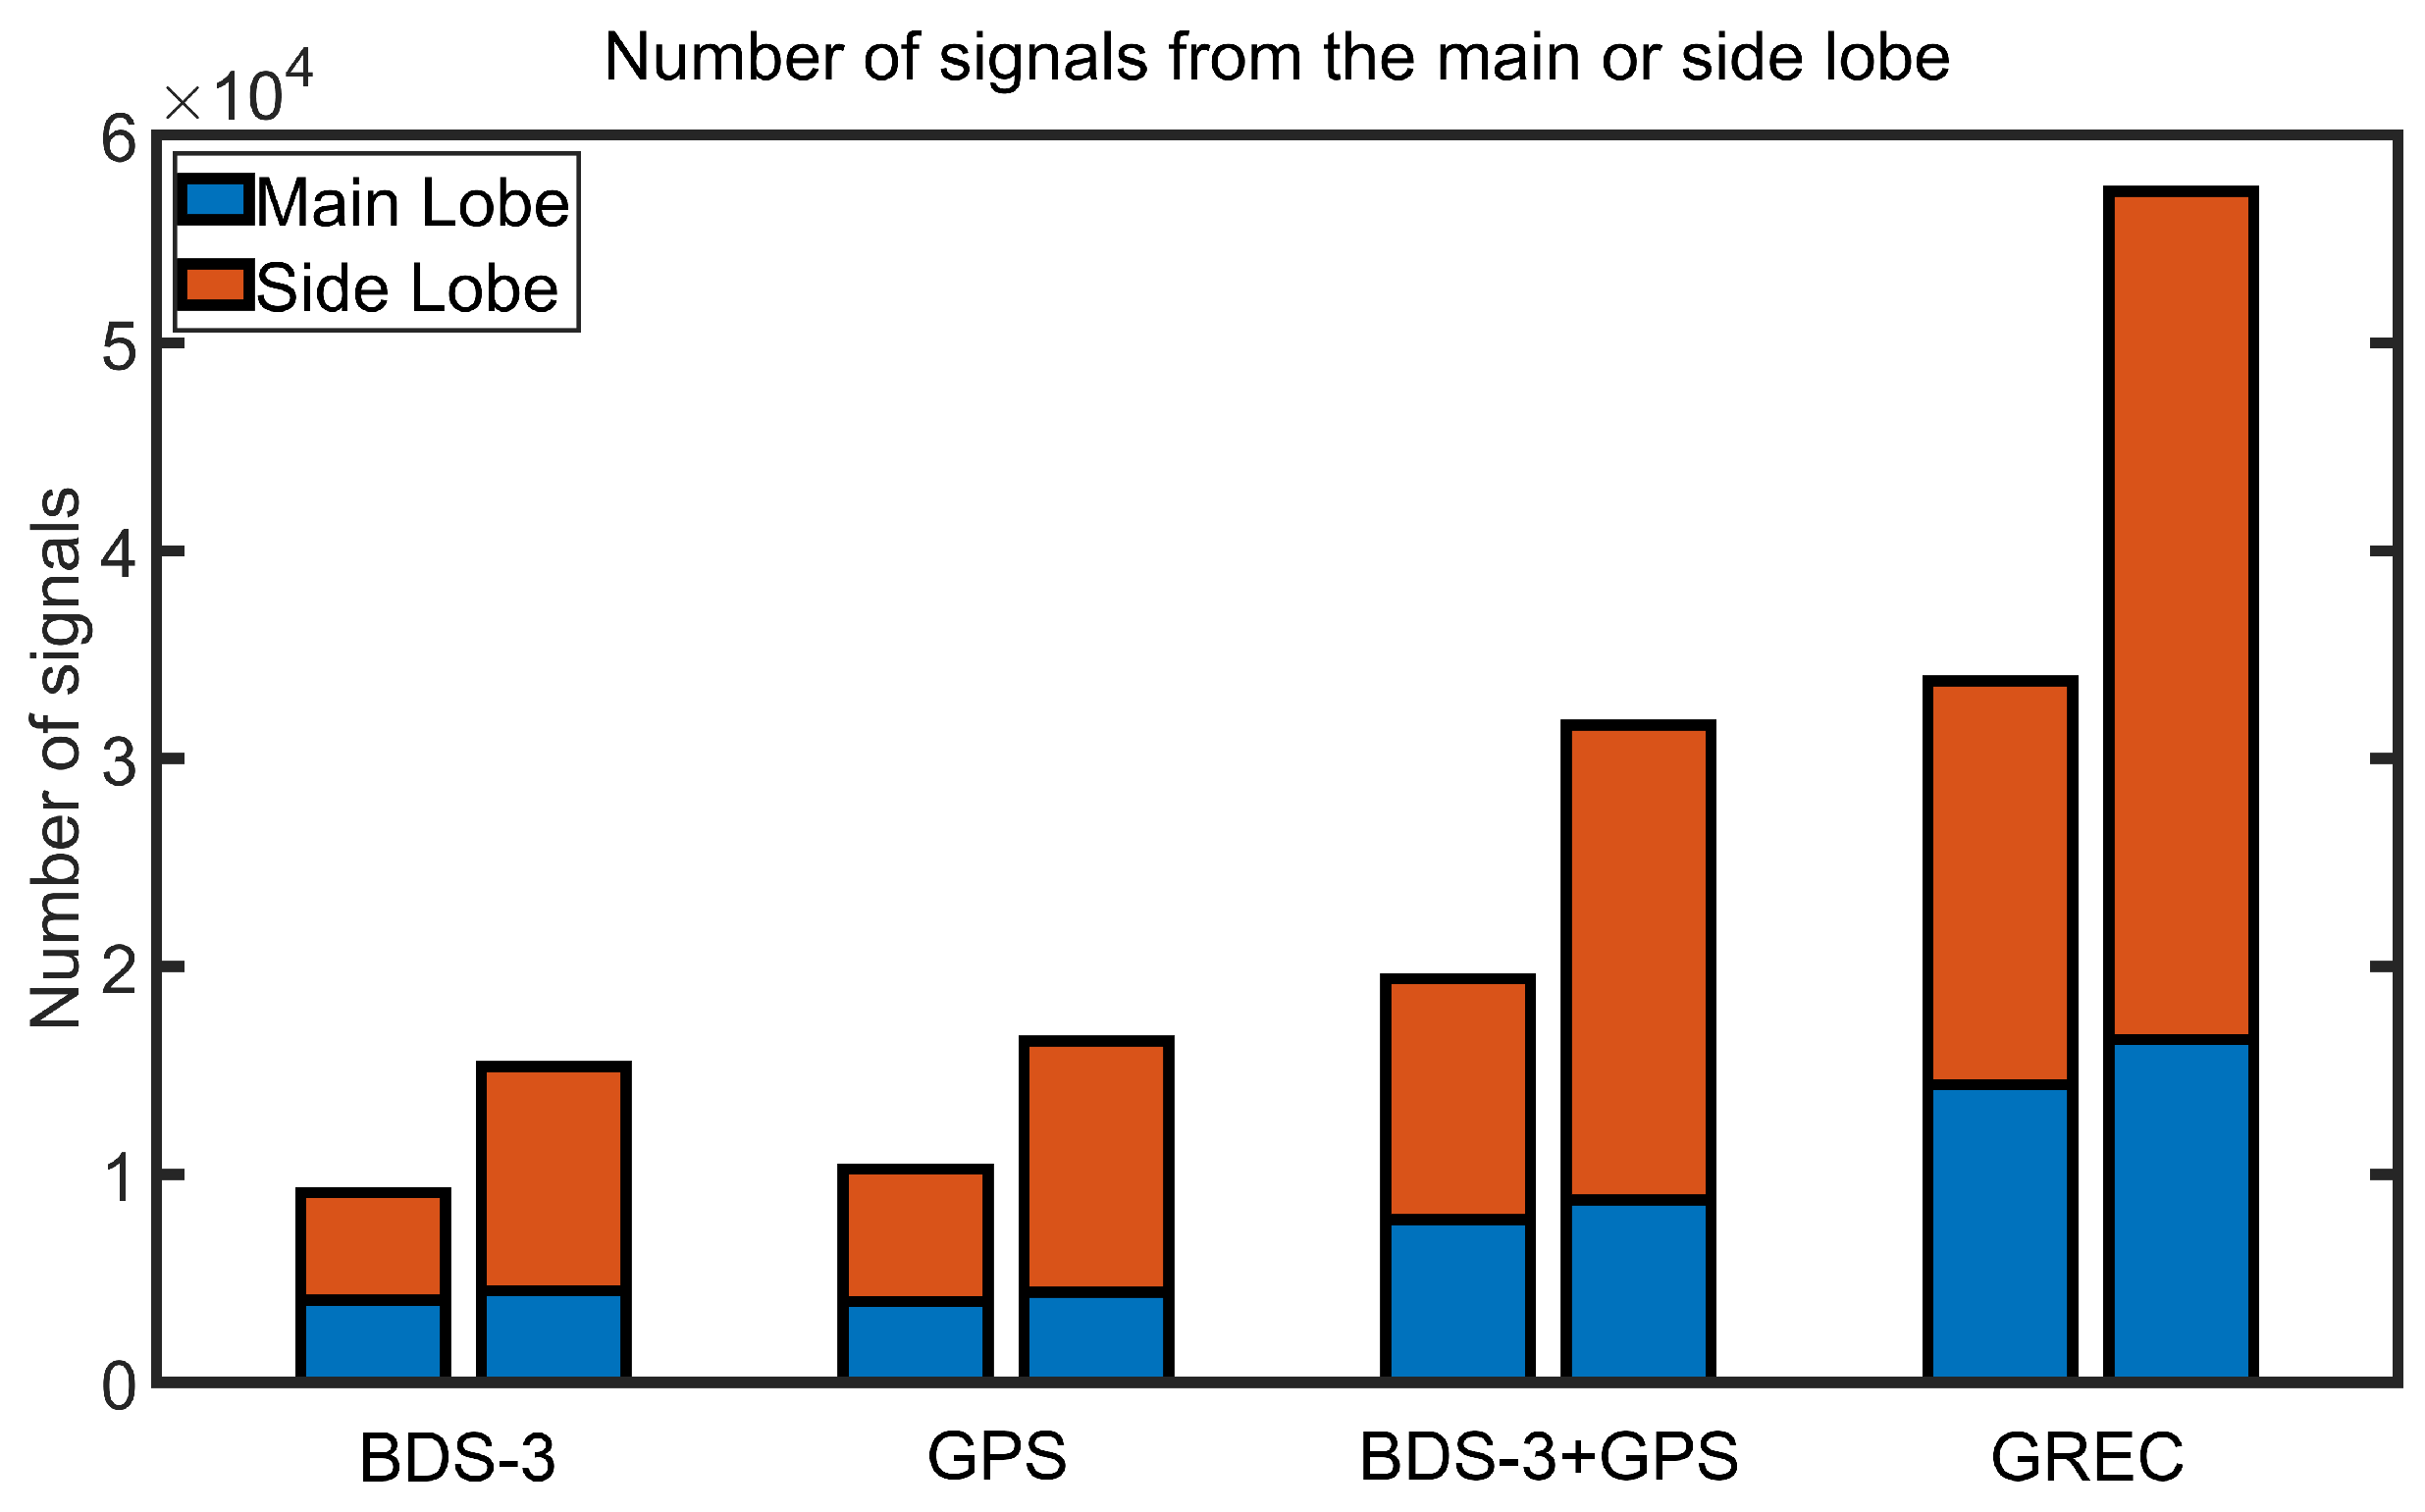
Figure 8 displays the statistical distribution of signals from the main and side lobes within a one minute time interval. The number of main lobe signals received from BDS-3 is higher than GPS, while the number of side lobe signals is less, in agreement with the side lobe gain suppression revealed in Figure 2. Although the number of side lobe signals is higher than the main lobe, this difference is not as noticeable in the BDS-3 system. Therefore, a more sensitive receiver is still required to effectively receive the side lobe signals. Lowering the received threshold from 15 to 10 dB-Hz approximately doubles the number of side lobe signals, while the number of main lobe signals increases only slightly. This suggests that the majority of low signals originate from the side lobe of the GNSS transmitting antenna.

Figure 8.
The number of signals from the main or side lobe for different GNSS system combinations at a threshold of 15 (left bar) and 10 (right bar) dB-Hz.
3.1.2. Received Power and
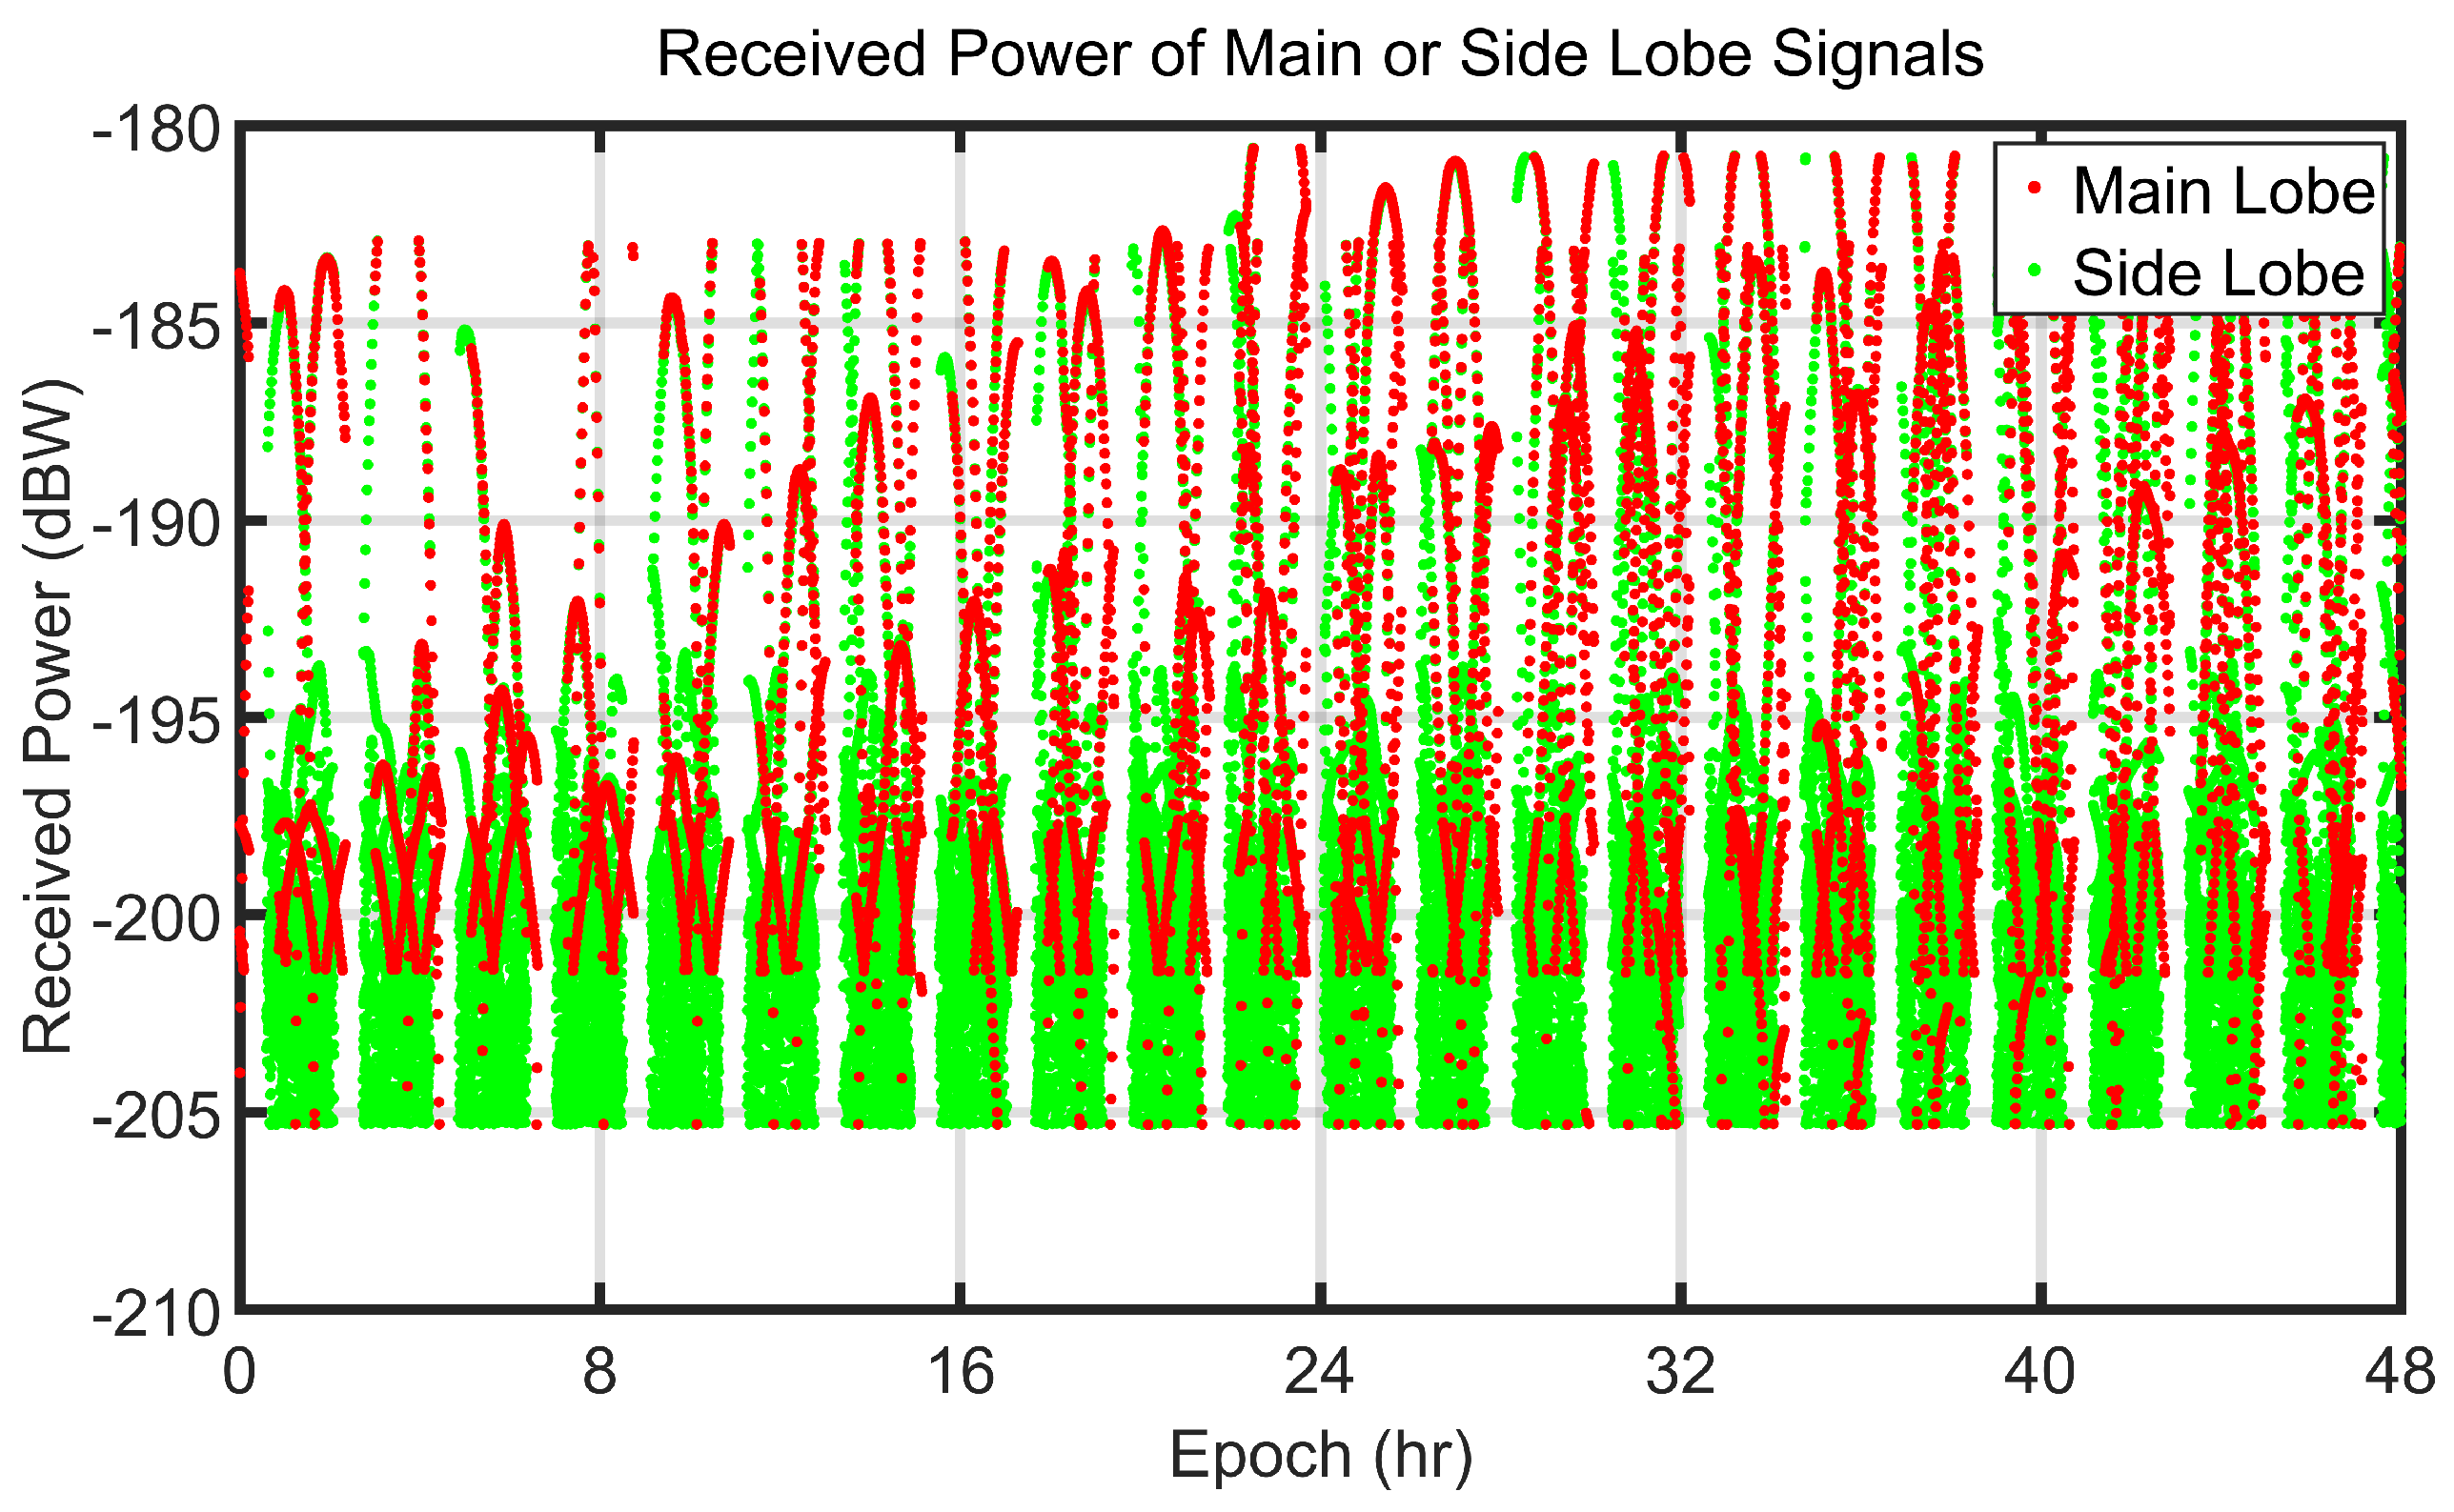
The signal powers received at the main and side lobes using a quad GNSS system with a reception threshold of 10 dB-Hz are displayed in Figure 9. A large number of green dots, i.e., side lobe signals, are concentrated below −195 dBW and the main lobe signal rarely appears when the received power is below −202 dBW. The maximum received power reaches only −180.59 dBW due to the free space propagation loss.

Figure 9.
Received signal power using a quad GNSS system with a reception threshold of 10 dB-Hz.
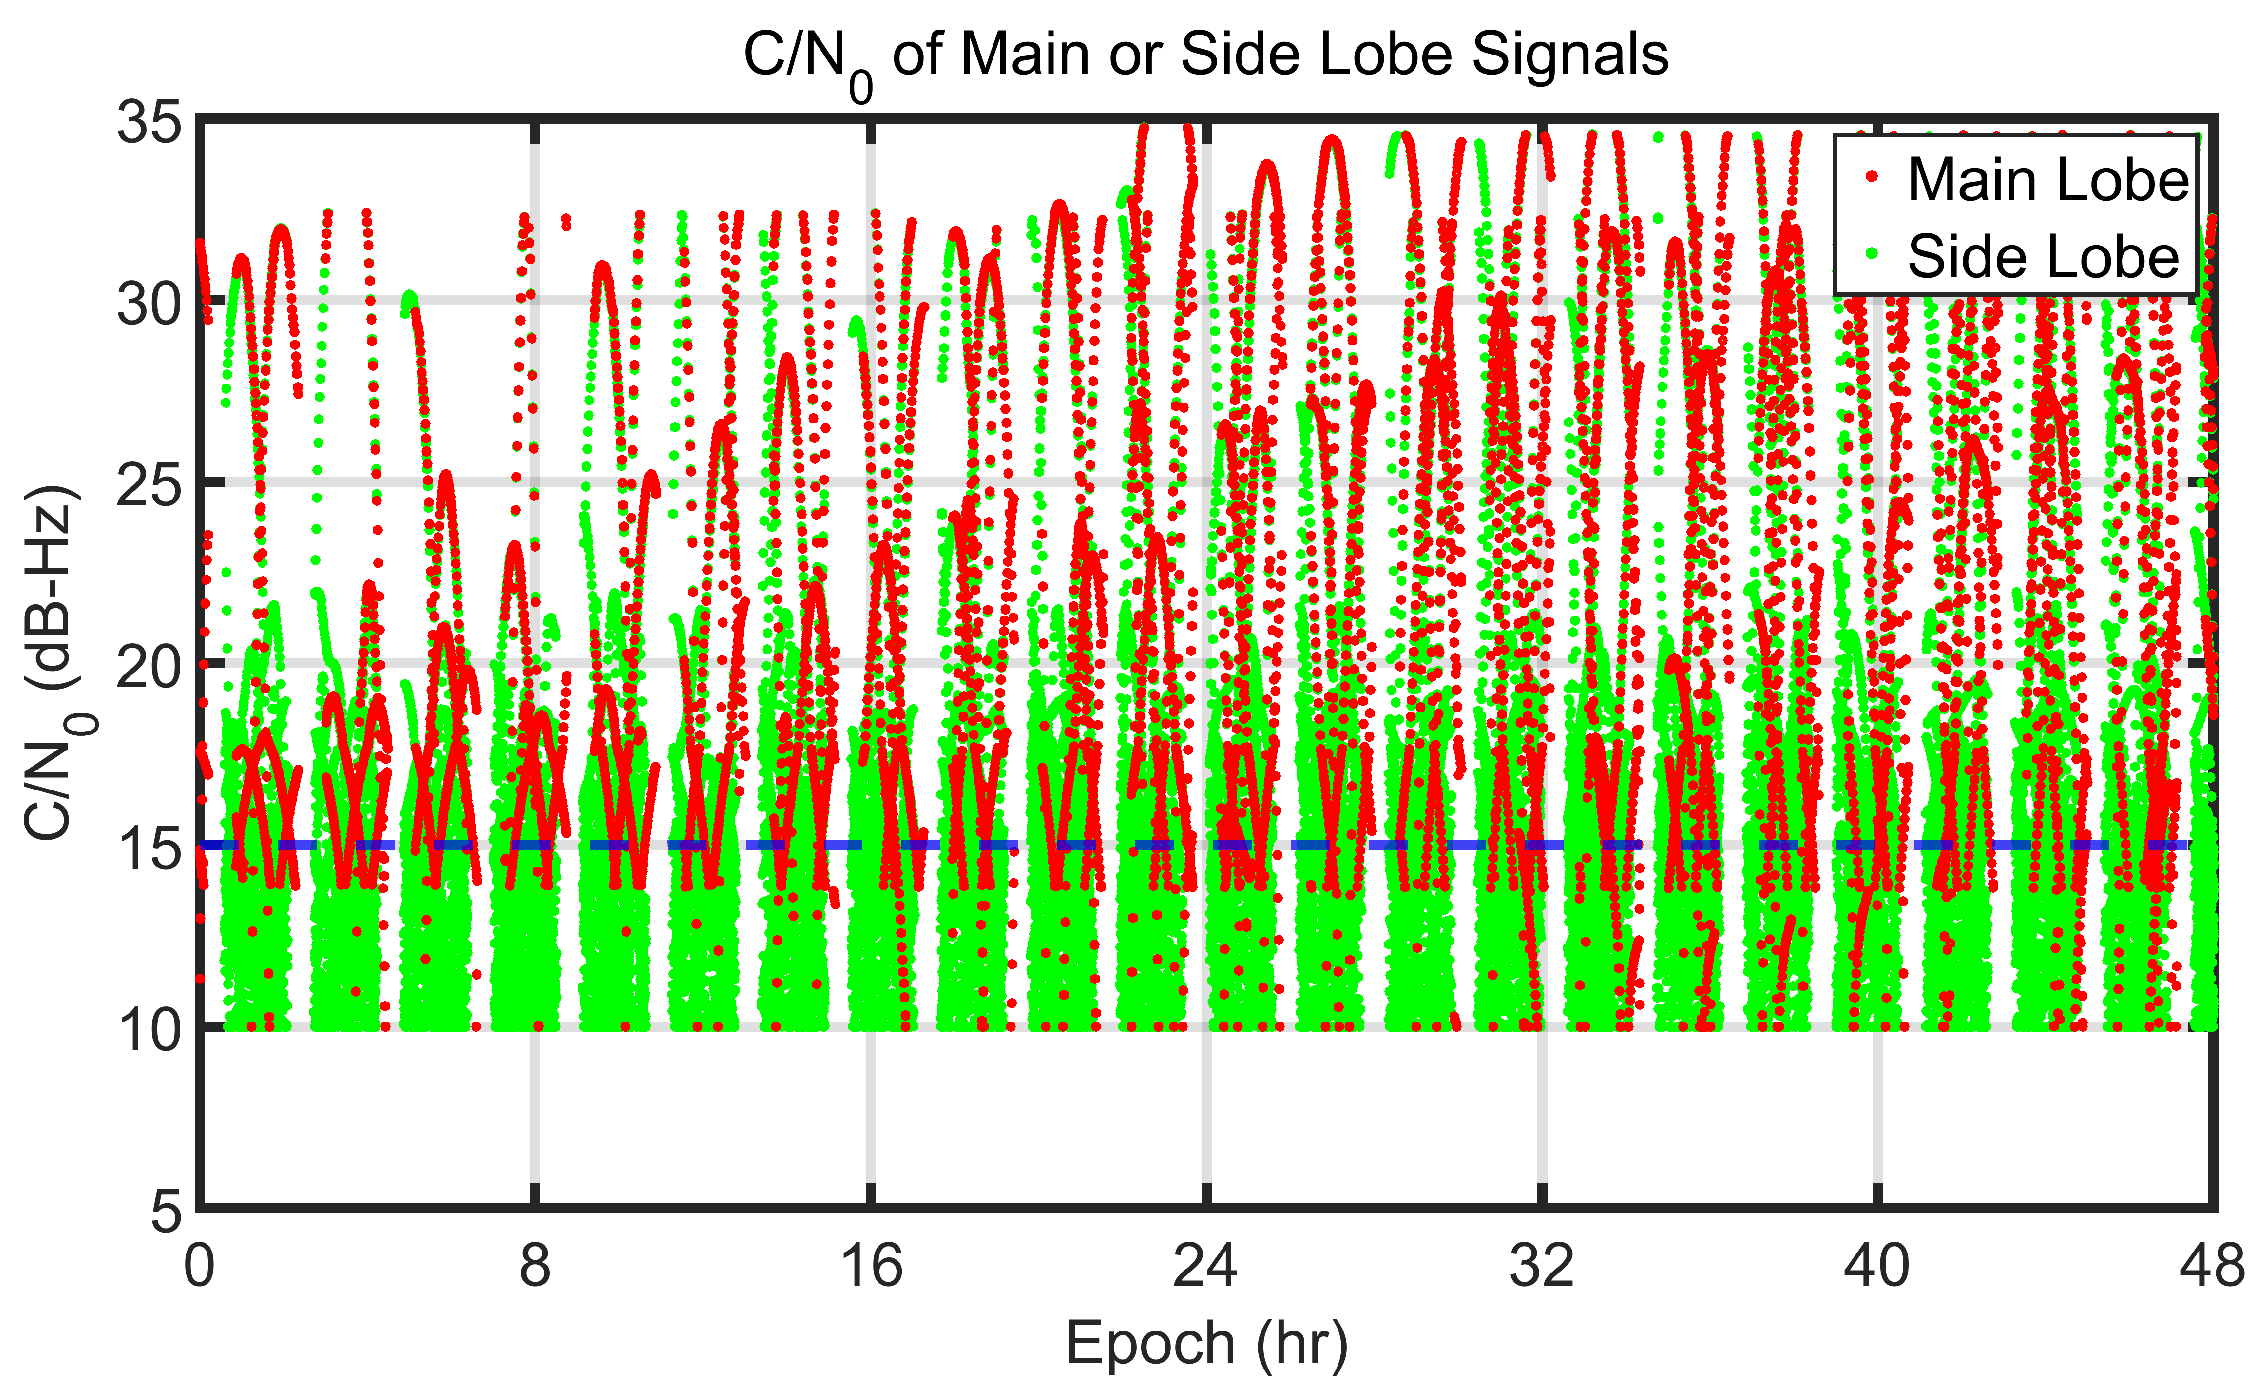
The received signal carrier/noise ratio, , was then calculated according to Equation (5) based on the received signal power above. The is shown in Figure 10, where the received threshold is 10 dB-Hz. As the spacecraft travels along the LLO, received signals are marked by either red or green dots, indicating main or side lobe signals, respectively. For ease of comparison, the reception threshold of 15 dB-Hz is represented as a blue dashed line in Figure 10. It can be seen that the maximum of the received signal is 34.8 dB-Hz. About 87% of the main lobe signals exceed the 15 dB-Hz threshold, while roughly 55% of the side lobe signals have a below this threshold. Therefore, it can be expected that for lunar missions, the availability of side lobe signals will be greatly increased if the detected sensitivity can be further improved. Ultra-high sensitivity GNSS receivers are a necessary technology to achieve the autonomous navigation of lunar probes.

Figure 10.
Received signal using a quad GNSS system with a reception threshold of 10 dB-Hz.
3.1.3. Doppler Shift
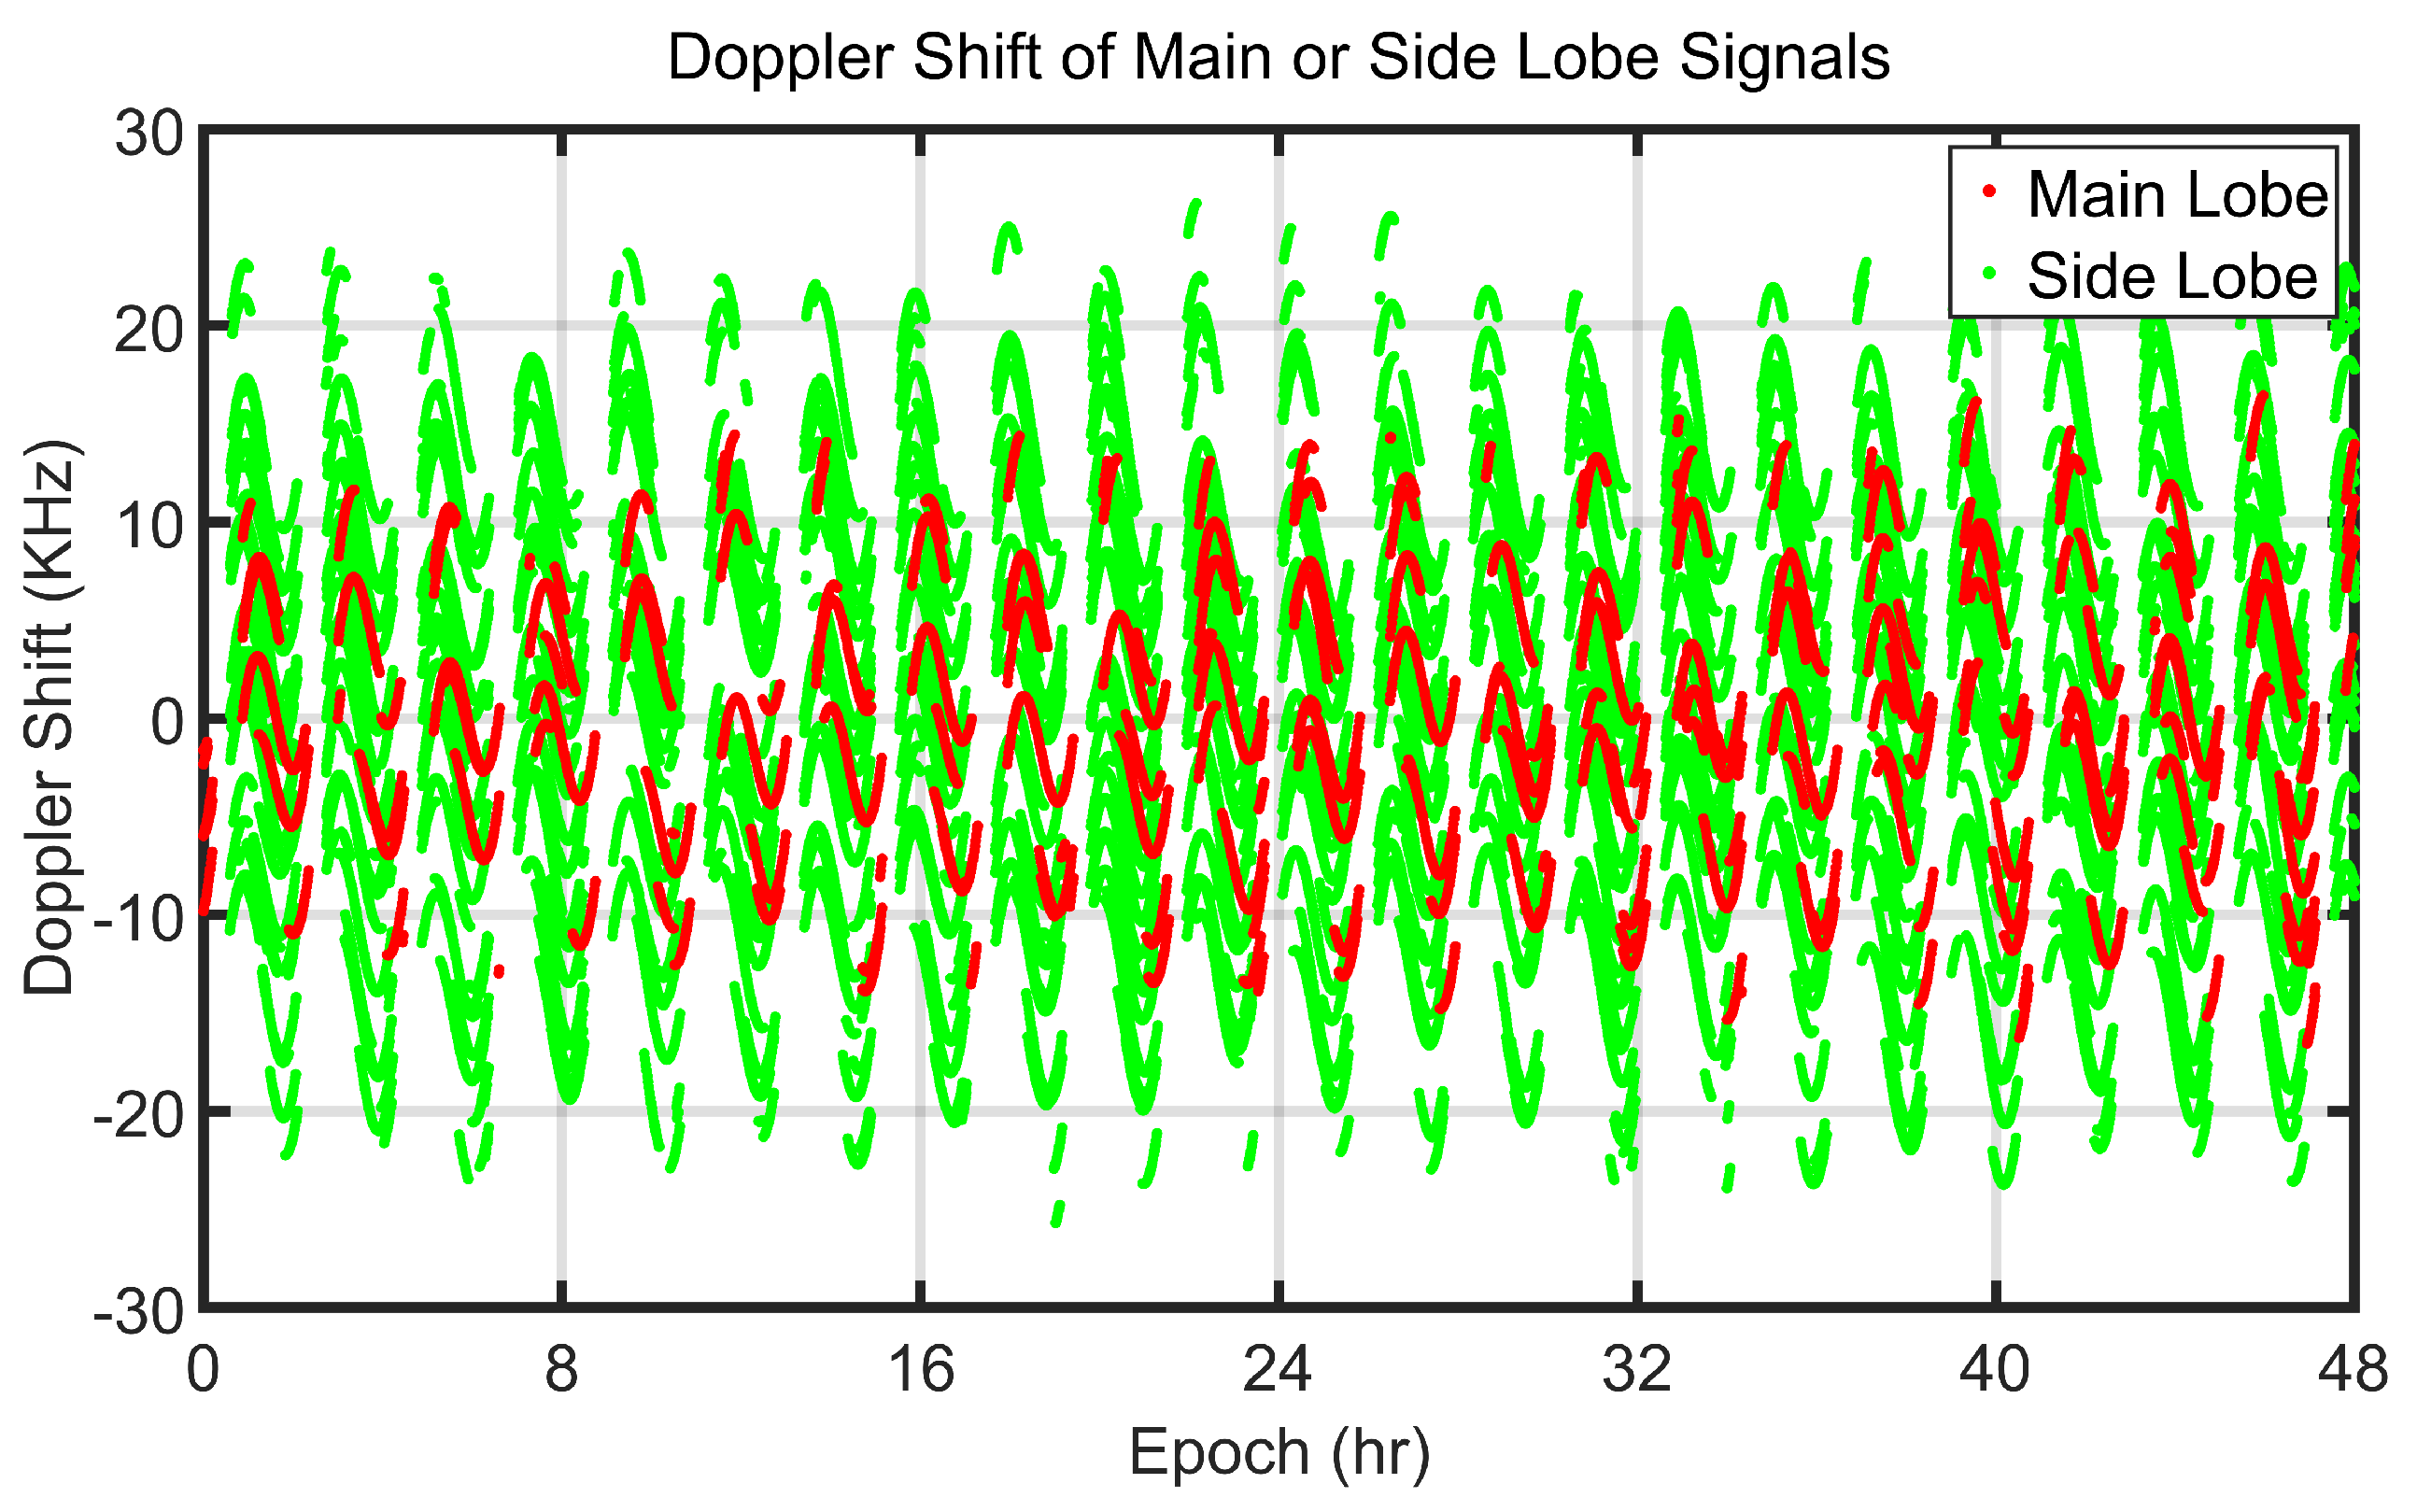
The Doppler shift is a crucial parameter in receiver design because it influences the search range during acquisition and determines the cold start time. It is directly related to the relative dynamics between the receiver and the satellite in the line of sight (LOS) direction, as well as the signal frequency. Figure 11 illustrates the results of the Doppler shift simulation. The Doppler shift values of most of the main lobe signals are concentrated between −10 and +10 KHz, while most the side lobe signals range between −20 and +20 KHz. The maximum Doppler shift reaches 26.23 KHz, which is much larger than the Doppler shift value of ±10 KHz for dynamic receivers on Earth. To successfully acquire these highly dynamic and low power side lobe signals requires a subtle design of the receiver’s acquisition algorithm.

Figure 11.
Received signal Doppler shift using a quad GNSS system with a reception threshold of 10 dB-Hz.
3.1.4. GDOP
As shown in Figure 12, the GDOP values are given using different GNSS combinations for the circumlunar orbit. Obviously, more GNSS satellites can significantly improve the GDOP. In the circumlunar orbit mission, GDOP values can reach an average of about 9.3 when considering four GNSSs at a reception threshold of 15 dB-Hz. Therefore, a GNSS-based PNT service for lunar exploration still has challenges. With the receiver threshold reduced to 10 dB-Hz, the GDP reaches an average of about 2.2; however, using BDS-3 or GPS alone, the GDOP values are 8.8 and 7.3, respectively. Therefore, a much more significant improvement in the receiver sensitivity is achieved by using advanced algorithms. This will result in the lunar mission achieving a high precision orbit determination as well as navigation.

Figure 12.
GDOP values of different GNSS system combinations at the thresholds of 15 (left) and 10 (right) dB-Hz.
3.2. Signal Acquisition Results
Several algorithms were simulated and validated in terms of detection probability and acquisition results according to the acquisition strategy. The results and analysis are presented below.
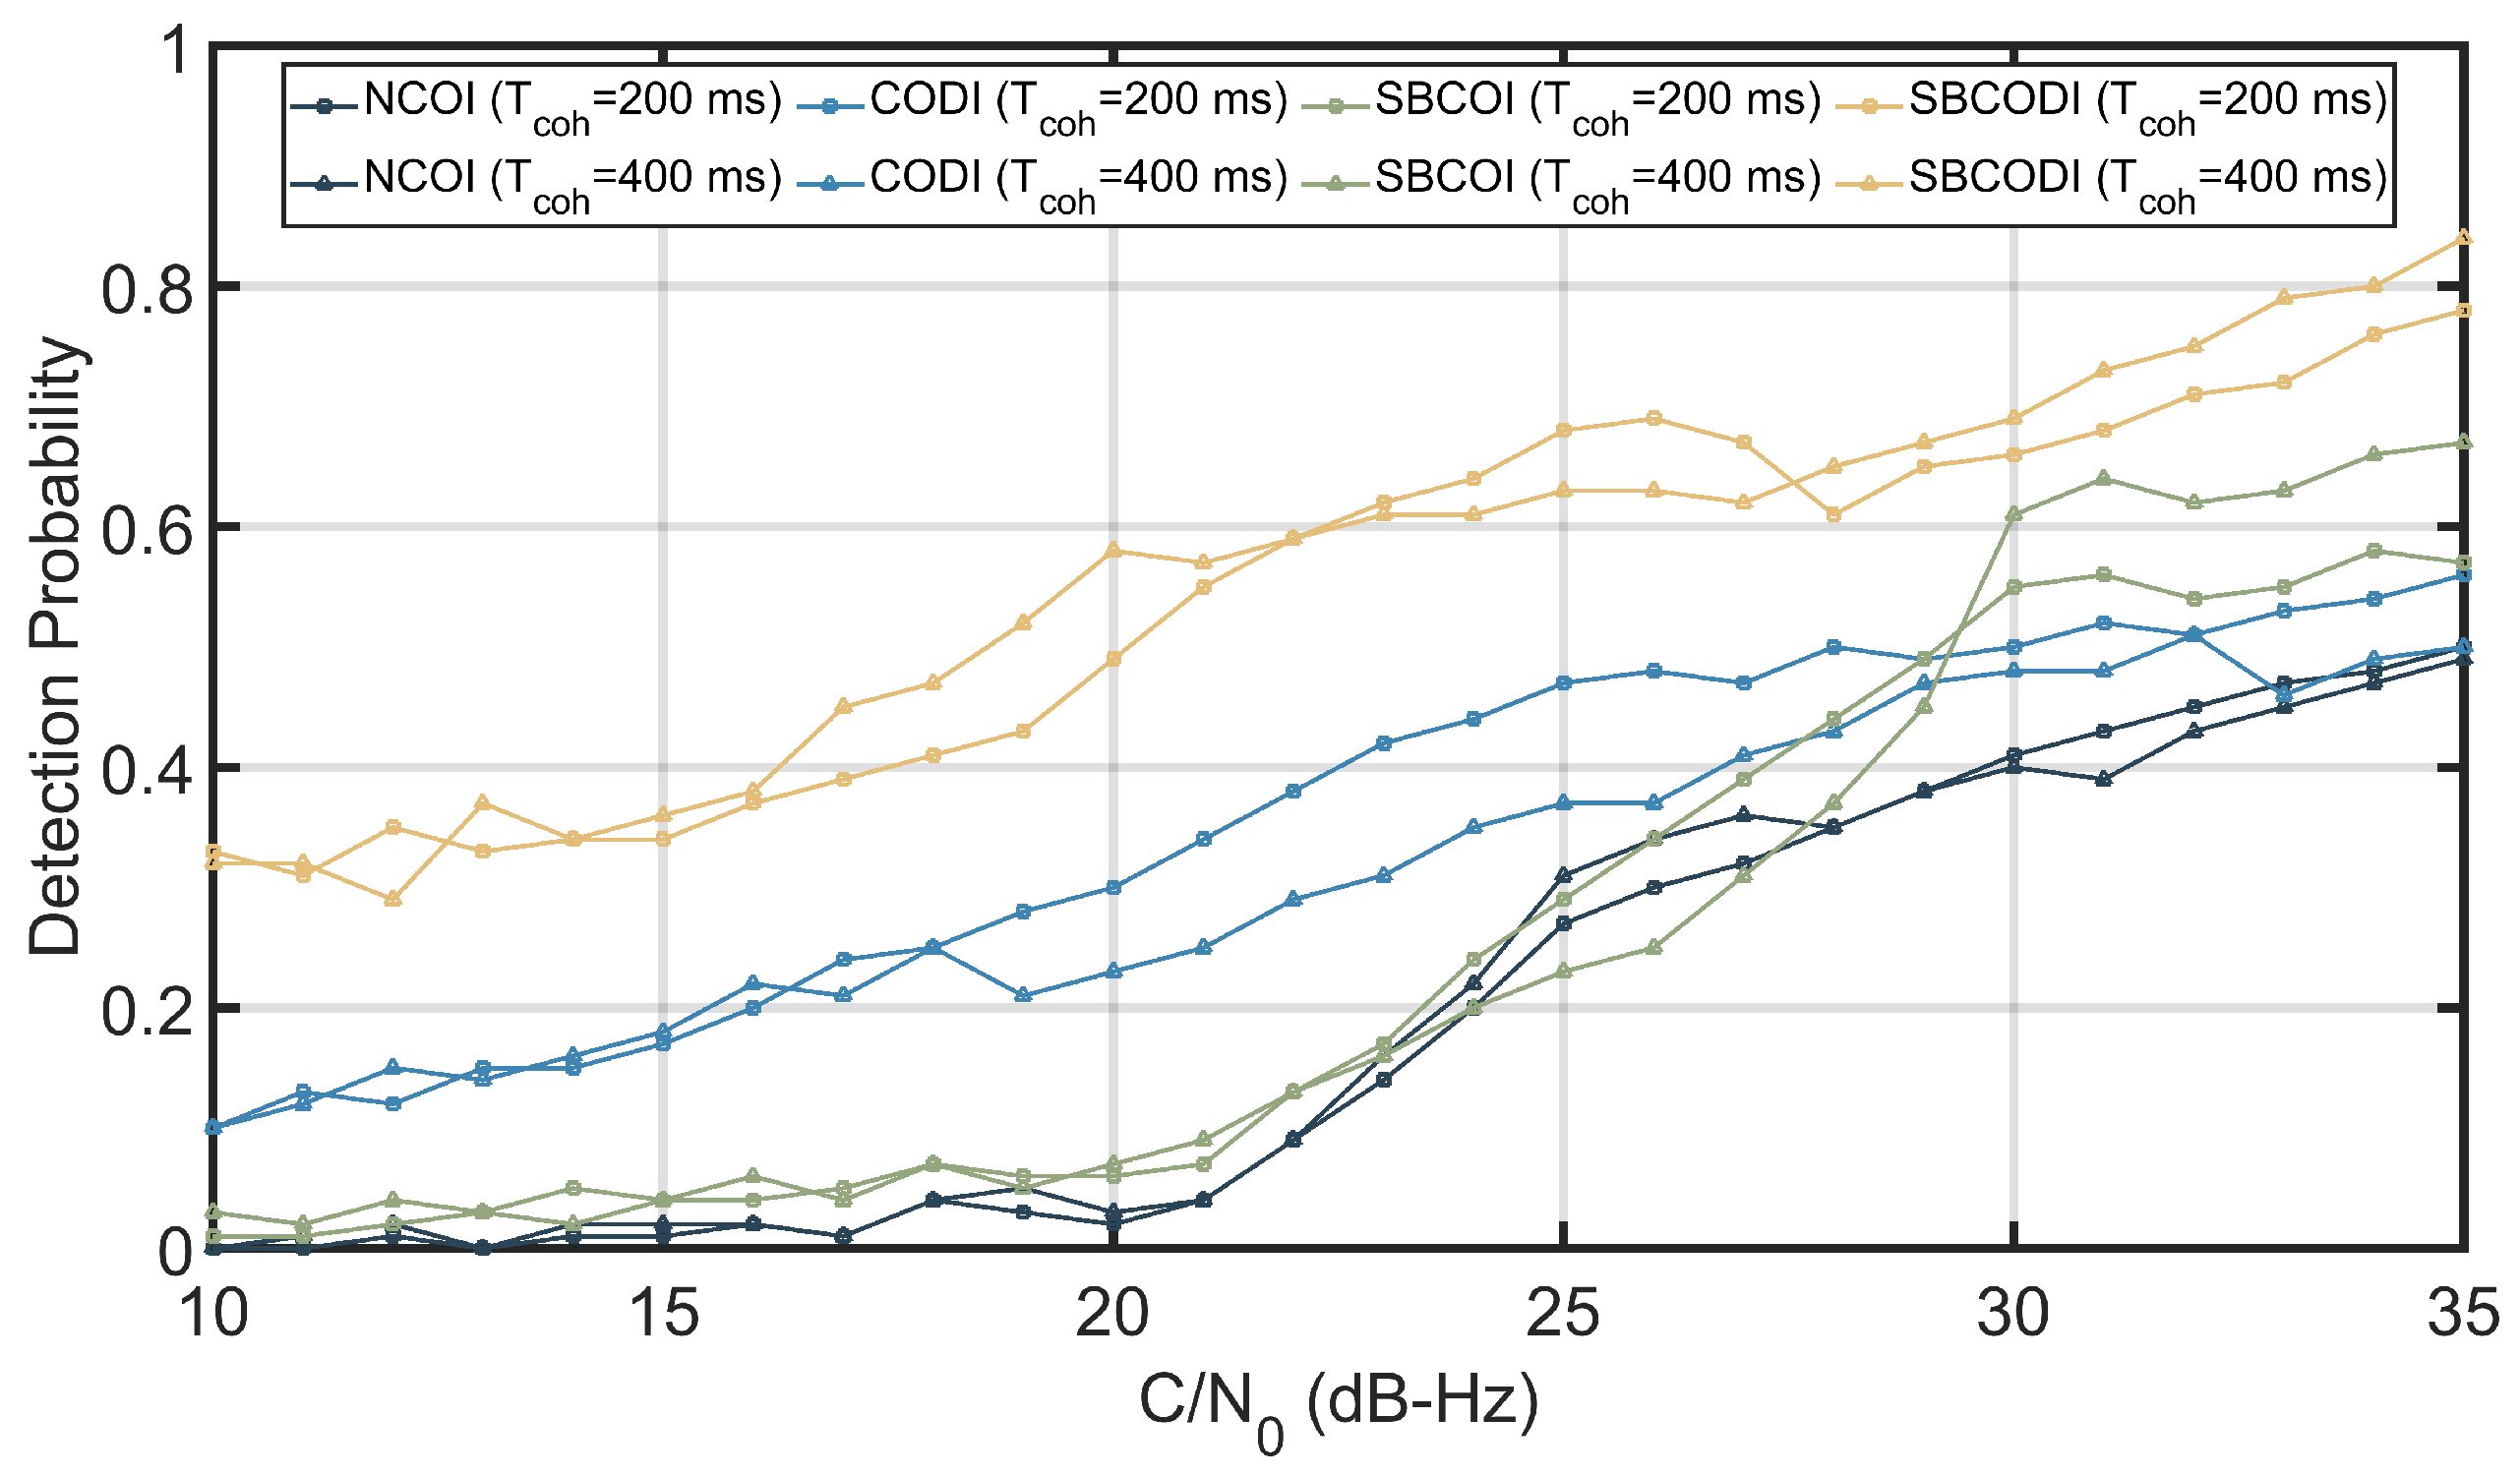
We compared the detection probabilities of the various methods mentioned above and the results are shown in Figure 13. At carrier-to-noise ratios below 20 dB-Hz, non-coherent integration and semi-bit coherent integration can barely detect the BDS signal, while conventional differential integration has a 10–20% probability of capturing it. This shows that the differential integration method is more effective in suppressing white noise. When the carrier-to-noise ratio is greater than 30 dB-Hz, the semi-bit coherent integration algorithm shows its superiority, as the noise interference is lower and coherent integration can effectively amplify the signal gain. The semi-bit coherent differential integration method that combines these algorithmic features performs much better at all carrier-to-noise ratios. At a carrier-to-noise ratio of 10 dB-Hz, SBCODI still has a 30% probability of acquiring the signal, and the value increases to about 80% when the carrier-to-noise ratio is increased to 35 dB-Hz. It is also worth noting that the advantage brought by the coherent integration of 400 ms compared to the coherent integration of 200 ms does not seem to be obvious.

Figure 13.
Detection probability under various using different methods.
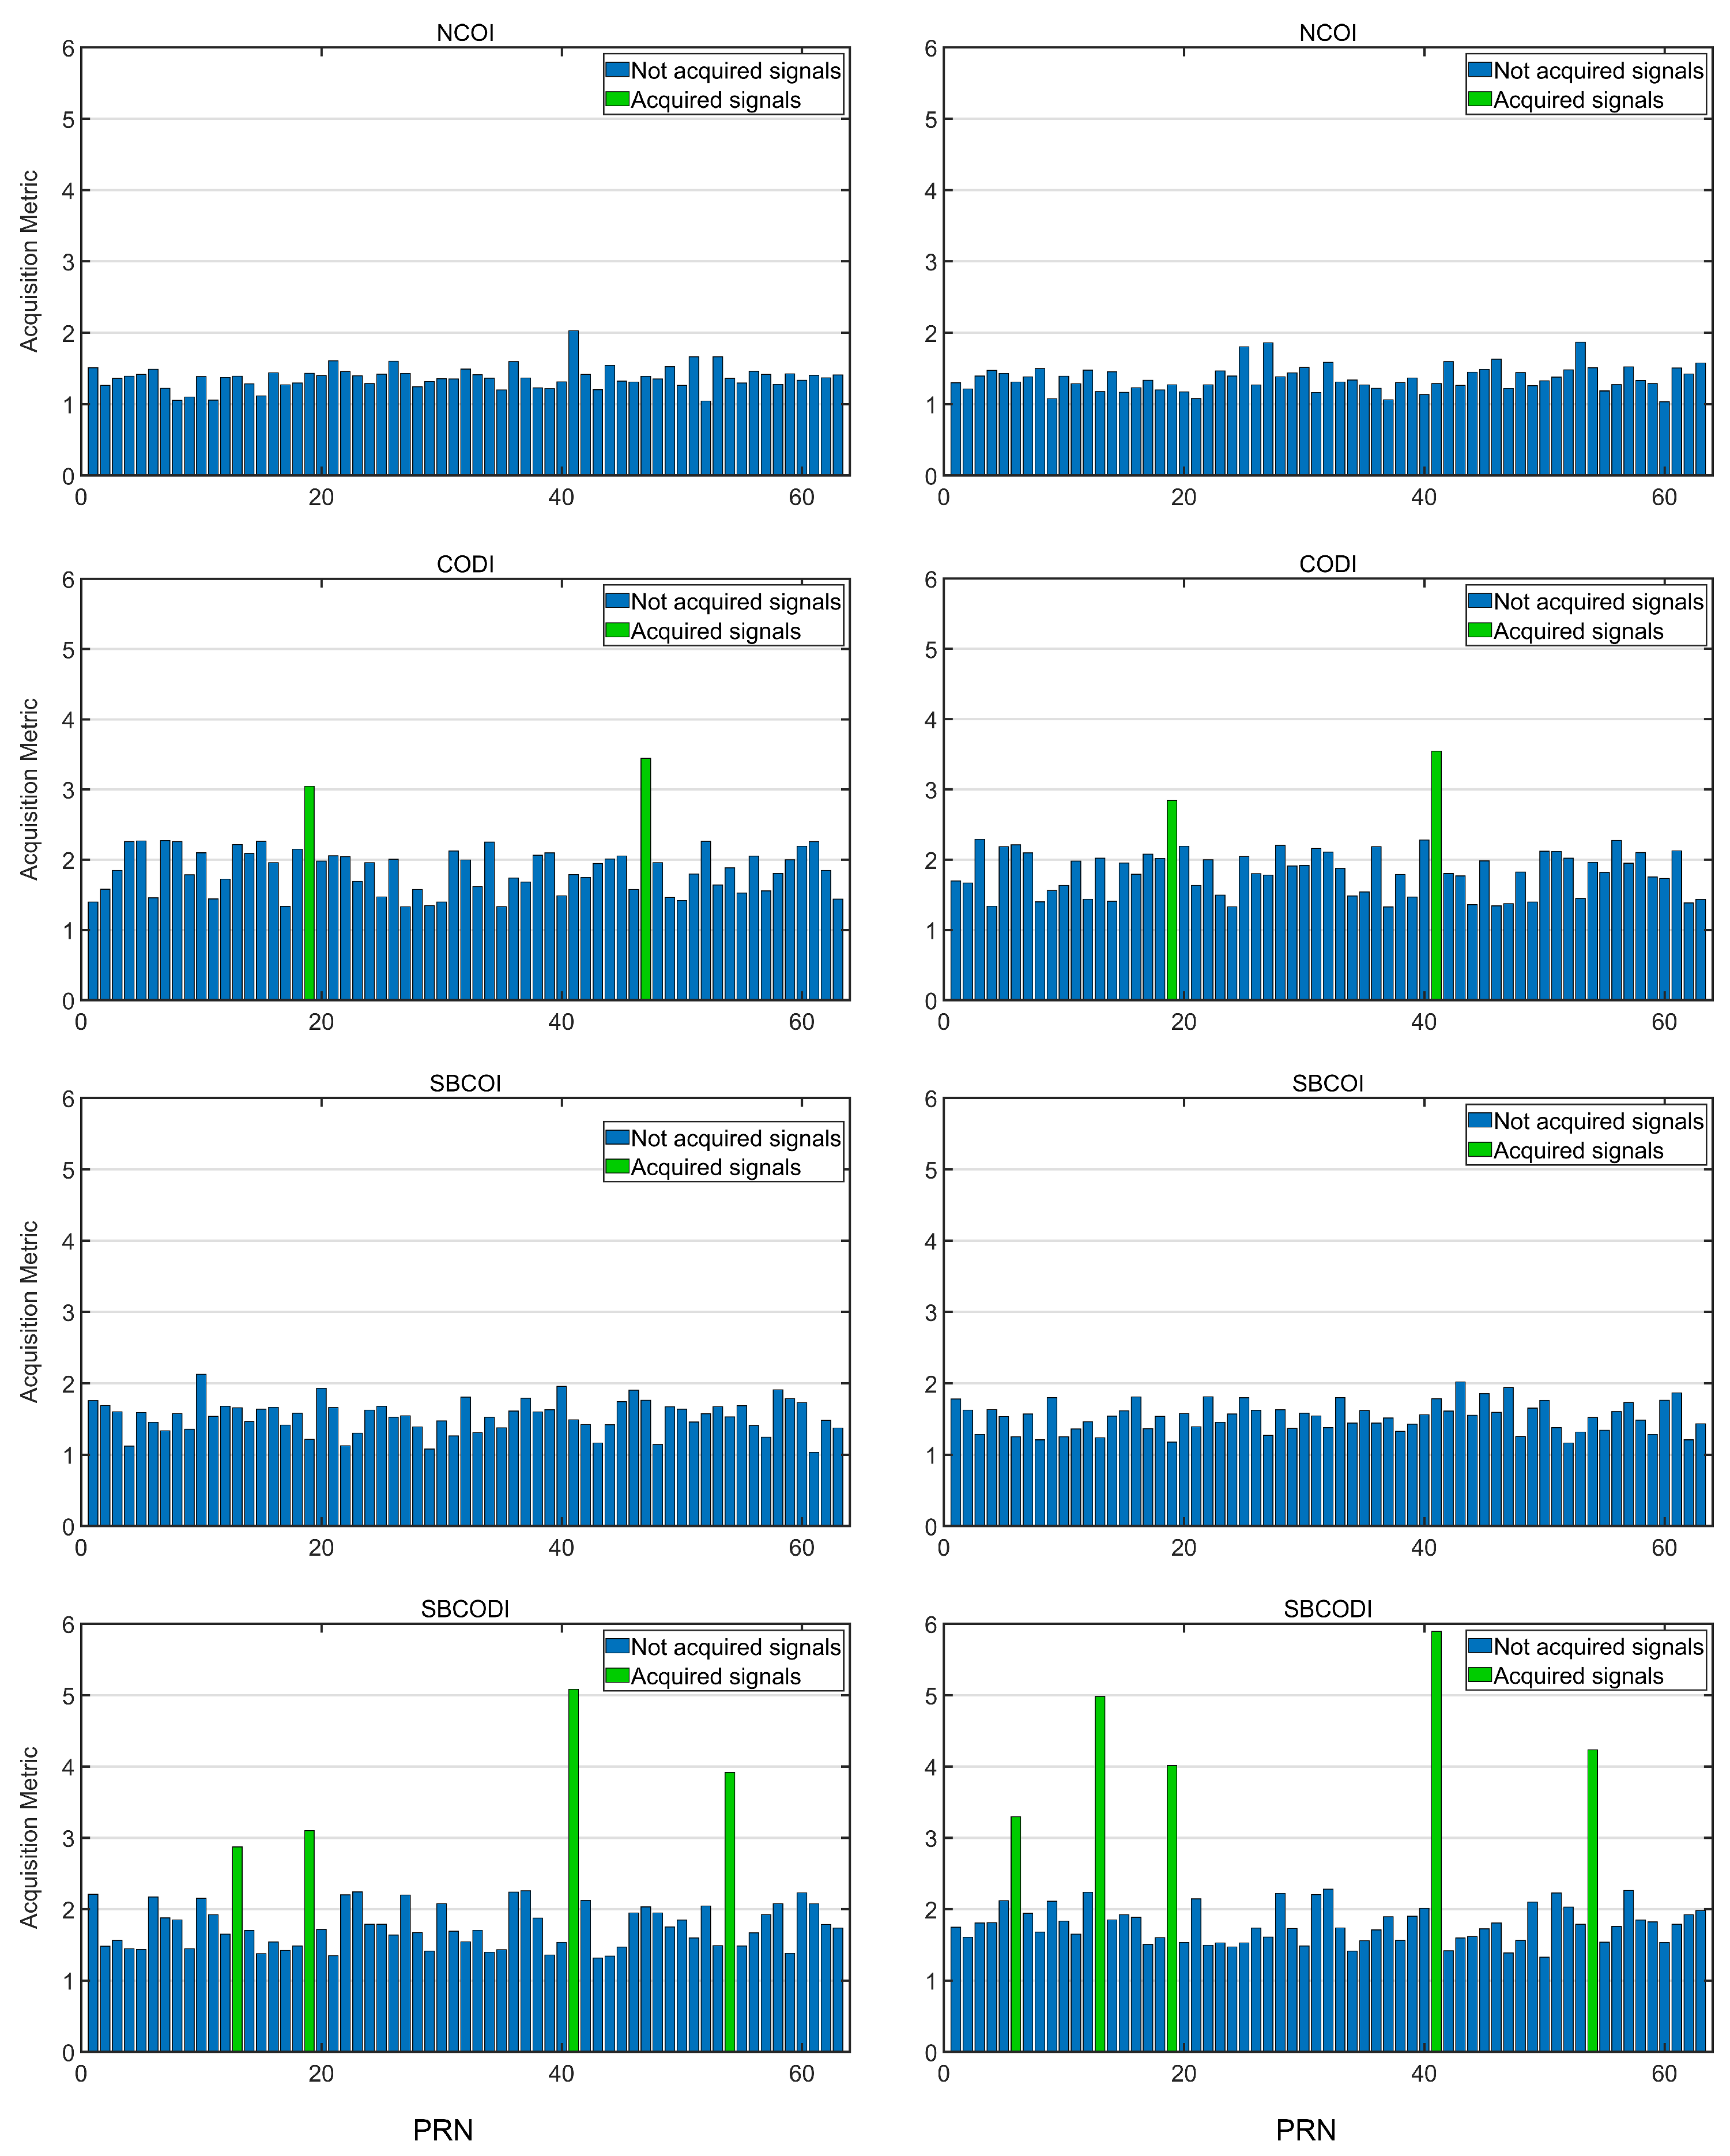
In Figure 14, the simulation results are related to the number of captured satellites found and the maximum peak value used to compare the different accumulations with the threshold value of 2.5. The value for this received signal was set to 15 dB-Hz. As shown in Figure 14, the output peak metric of the non-coherent integration is very low due to the square loss. Even using long code semi-bit coherent integration results in an insufficient gain in the detection of low power signals from the noise. Furthermore, the differential coherence algorithm is the preferred method to suppress Gaussian white noise. The semi-bit coherent differential integeration method is more effective than the conventional coherent differential algorithm in capturing signals with a low carrier-to-noise ratio.

Figure 14.
Peak metric values and detection status for each satellite searched by NCOI, CODI, SBCOI, and SBCODI methods for = 200 ms (left) and = 400 ms (right). (Not acquired signals (blue) and acquired signals (green)).
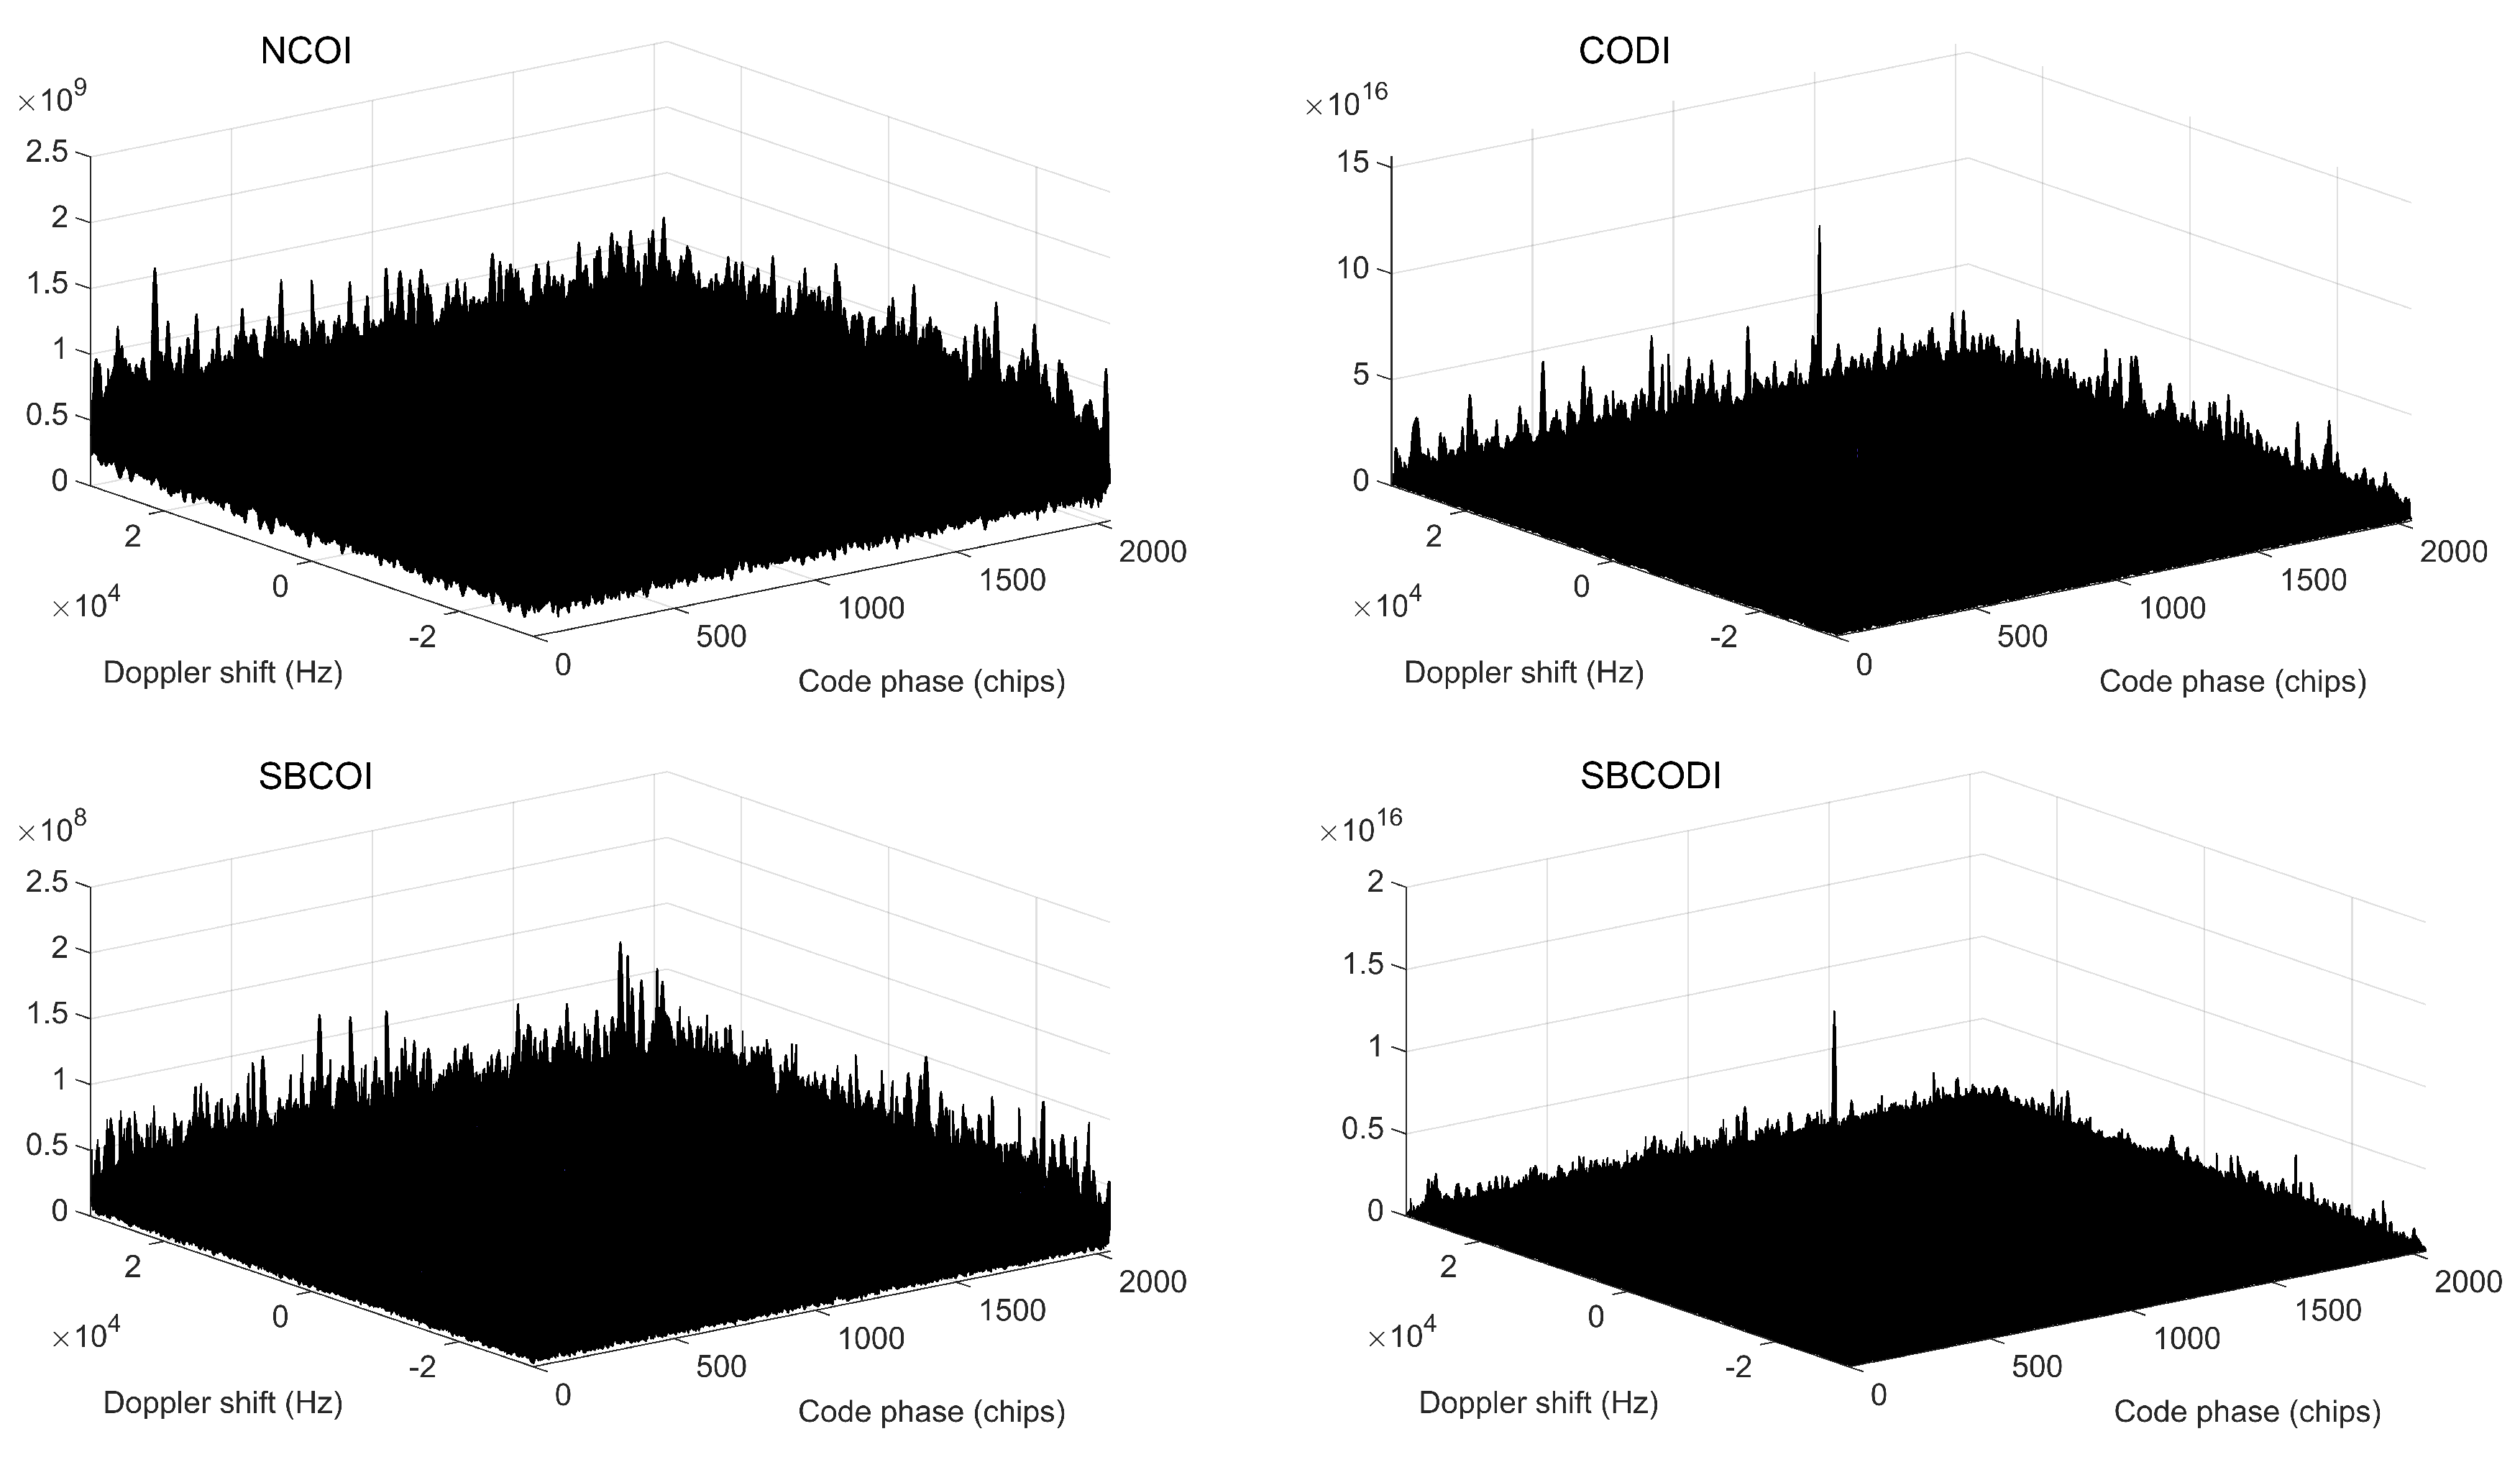
Figure 15 shows the correlation functions of various algorithms on the code-frequency search grid for PRN 20 as an example. Simulations were run with a Doppler frequency of Hz and a code phase of 506 chips. It can be observed that the non-coherent integration and the semi-bit coherent integration do not acquire the signal, i.e., there is no significant peak, while the peaks appear in the correlation function plots of the CODI and SBCODI methods. Furthermore, although the coherent differential integration algorithm detects the signal, there are still many peaks, while in the SBCODI method, there is only one distinct peak. Thus, the SBCODI can detect the BDS B1I signal with an ultra-low carrier-to-noise ratio.

Figure 15.
Correlation values of different methods for a 15 dB-Hz signal using coherent integration of 200 ms.
4. Discussion
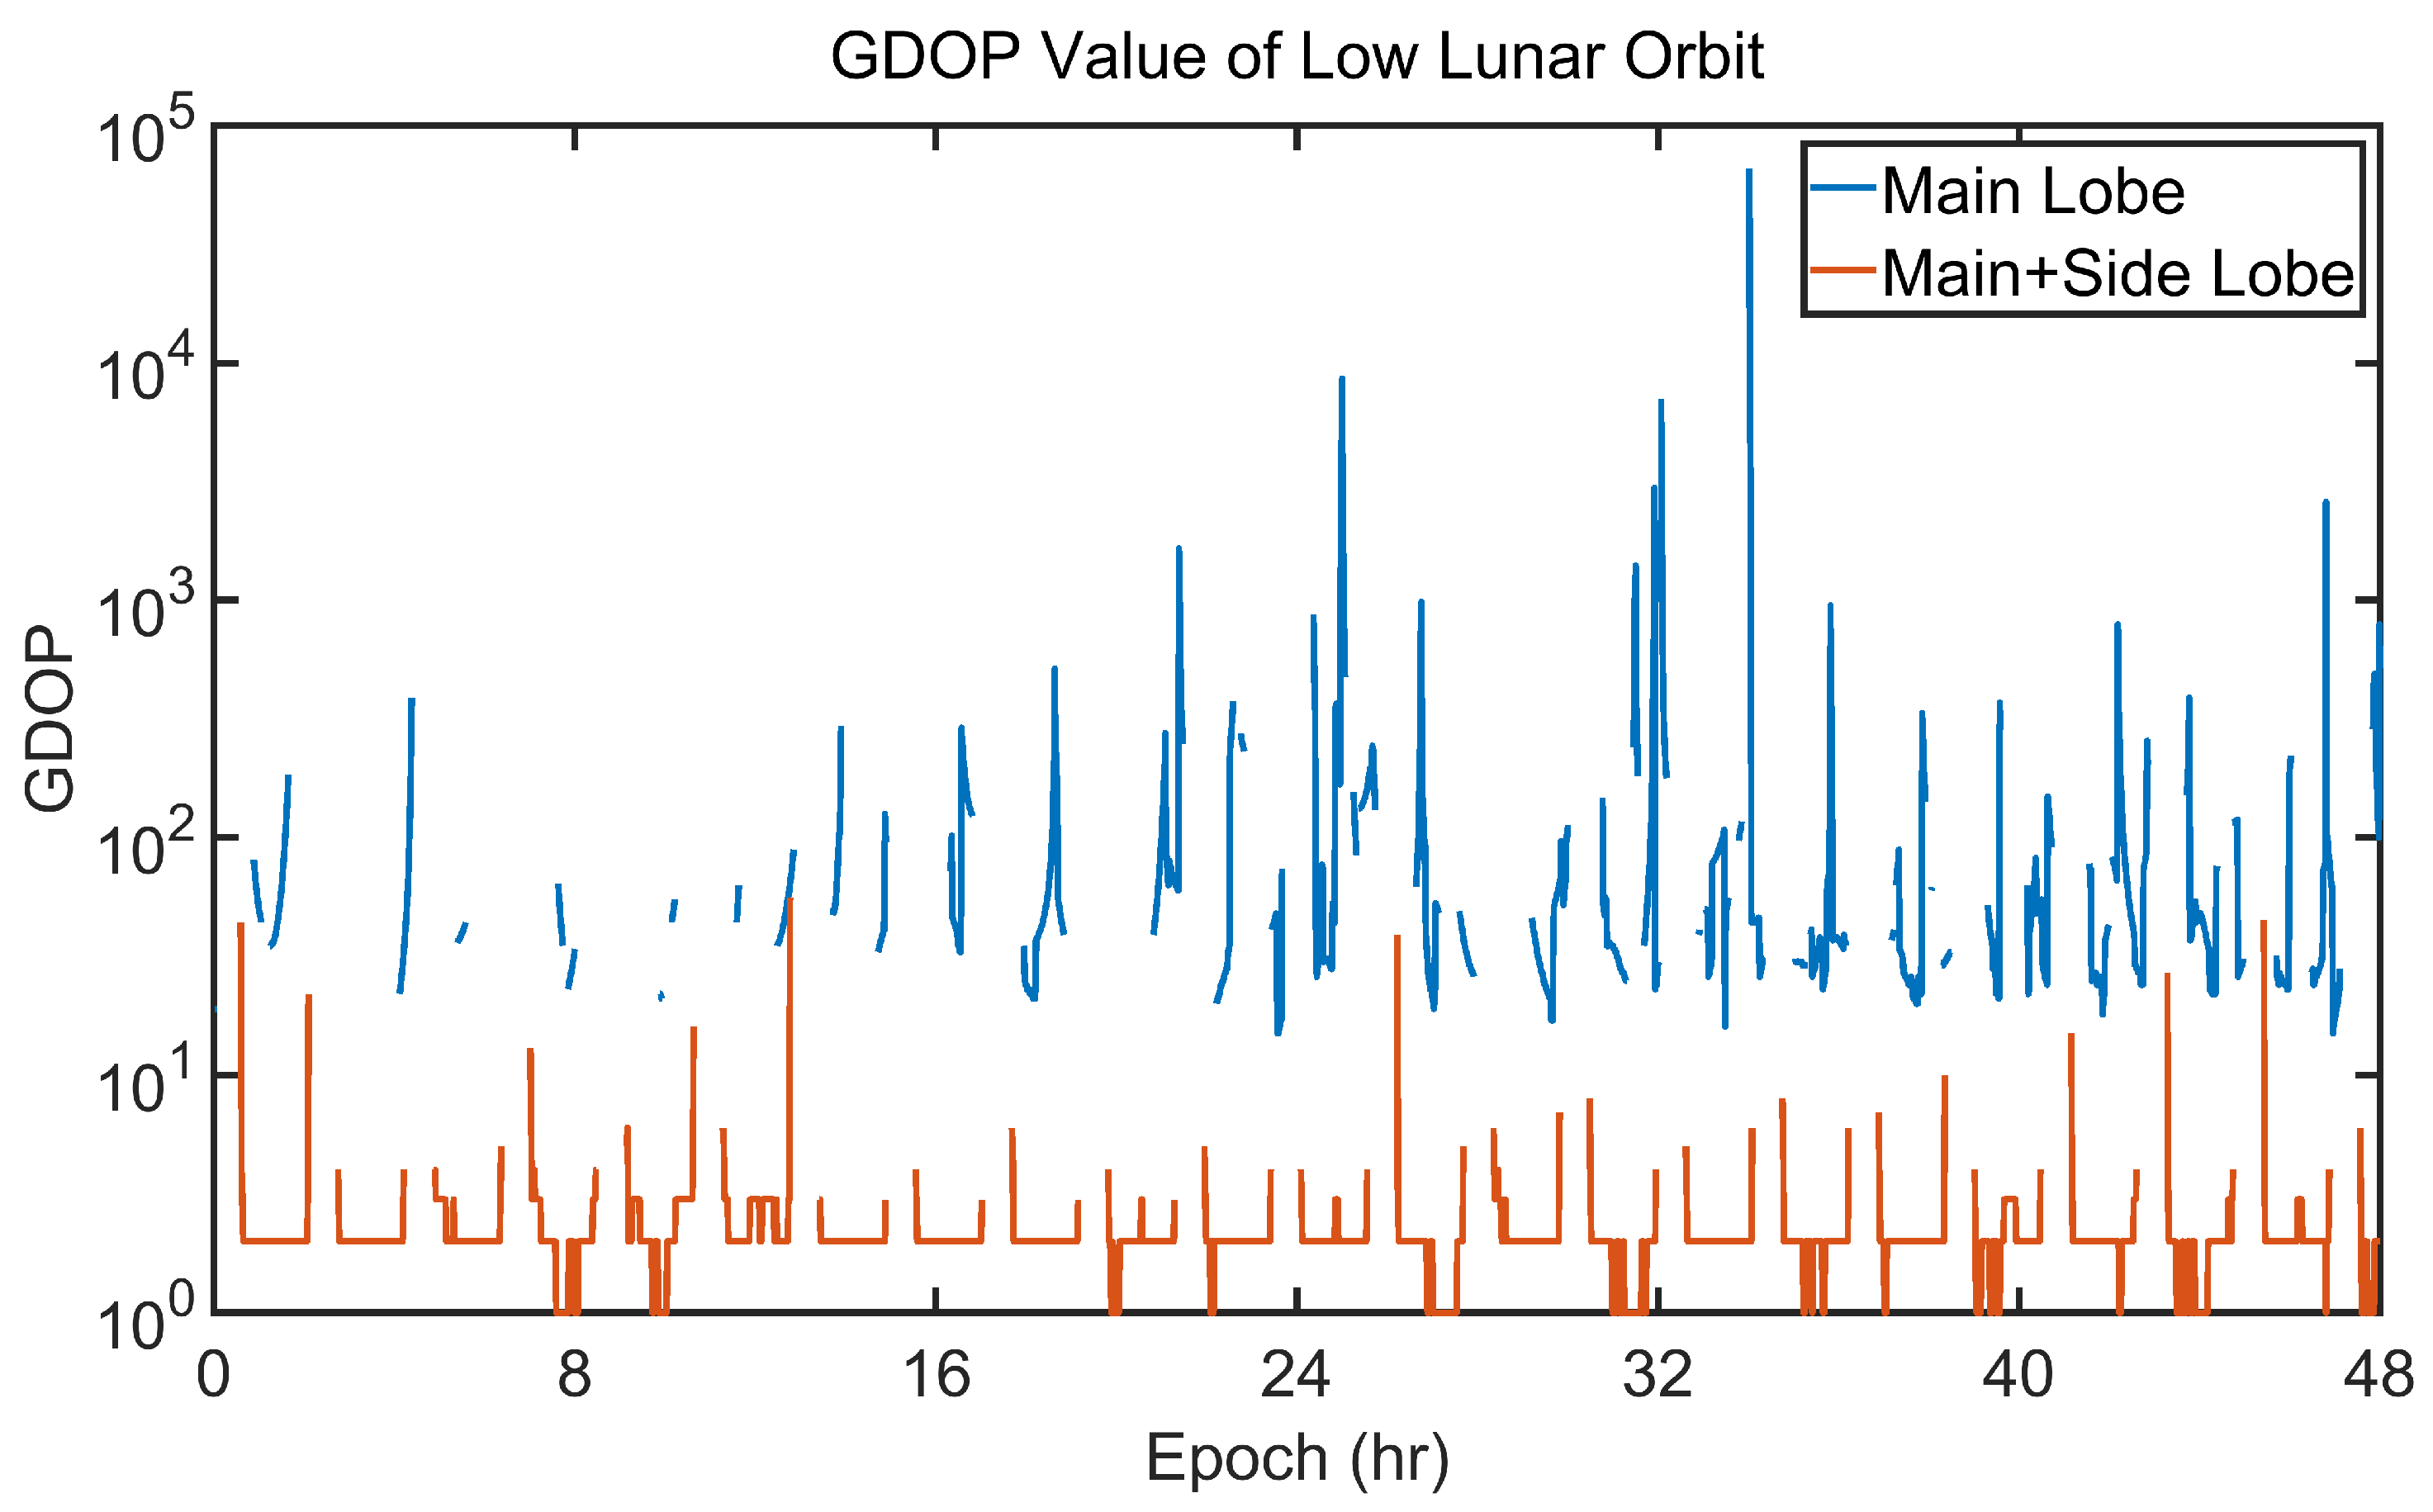
To further explain the significance of the side lobe signals for the navigation of a lunar rover, Figure 16 presents the GDOP values in the cases of using the main lobe signals only (blue line) and all the signals (orange line). In the circumlunar mission, the GDOP value can descend from to less than when side lobe signals are considered. Furthermore, due to the small number of visible satellites, the discontinuity of the GDOP values using only the main lobe signals is evident. It can be seen that the low number of visible satellites and poor geometry are the main reasons for the large GDOP values.

Figure 16.
GDOP values of LLO using quad-GNSS at a threshold of 10 dB-Hz.
Figure 17 displays a histogram of the statistical distribution with a width of 1 dB-Hz for different global positioning systems. The left and right subplots give the distribution of the carrier-to-noise ratios of the main and side lobe signals, respectively. The distribution of the main lobe signals is relatively uniform, especially when the value is greater than 18 dB-Hz, but it can also be found that they are aggregated in the range of 14–18 dB-Hz. For the side lobe signals, the signals are concentrated around 10–20 dB-Hz, and only 11.6% of the signals are greater than 20 dB-Hz when quad GNSS is used, which is consistent with the results in Figure 10.

Figure 17.
Histogram of the distribution of the main (left) and side (right) lobe signals, when BDS-3, GPS, and quad-GNSS are applied.
Multi-GNSS is beneficial for space users, especially those far from Earth; thus, developing interoperable multi-GNSS systems is worthwhile. Accurate simulation results and better recommendations for onboard receiver designs can be achieved once GLONASS and Galileo satellite antenna patterns are published. In addition to GNSS satellites, the navigation performance can be further improved once regional satellite navigation systems are used, such as Japan’s Quasi-Zenith Satellite System (QZSS), the Navigation with Indian Constellation (NavIC) system, and the Korean Positioning System (KPS). These abundant signals will help GNSS-based spacecraft to position themselves at longer distances, such as at Earth–Moon Lagrange points, contributing to deep space exploration. The interruption of GNSS signals on the lunar backside also needs to be noted, and the future prospects of using lunar-GNSS or relay satellites for lunar probe navigation are bright.
Furthermore, the current paper only considers one type of GNSS signal. Future studies can explore the navigation performance using different signal types, especially new signals from BDS-3 such as B1C. It would be valuable to investigate high-sensitivity acquisition algorithms for signals that contain both data and pilot components [39] or dual-frequency joint signals [40].
5. Conclusions
This study explores the potential use of GNSS main and side lobe signals for receivers in a low lunar orbit. We have estimated the number of visible satellites, the carrier-to-noise ratio, the received power, the Doppler shift, and the GDOP values. Additionally, we have discussed the critical role of GNSS side lobe signals in lunar navigation, where the number of side lobe signals is approximately three times that of the main lobe at a reception threshold of 10 dB-Hz. The use of multiple GNSS constellations and side lobe signals can significantly increase the number of visible signals, providing greater opportunities for spacecraft navigation at lunar altitudes.
To further examine the potential for BDS-only navigation in the lunar environment, we discuss the methodology for acquiring BDS B1I signals under these conditions. We analyzed the composition of the BDS B1I signal and simulated it using MATLAB. Several algorithms commonly used to acquire weak signals were then presented, and the results demonstrated that the semi-bit coherent differential integration algorithm is more effective. Specifically, this algorithm succeeds in acquiring a 15 dB-Hz BDS signal with a probability of approximately 35%.
Author Contributions
Conceptualization, Z.J. and L.C.; methodology, Z.J., L.C. and J.Y.; software, Z.J.; validation, Z.J.; formal analysis, Z.J., L.C. and J.Y.; investigation, Z.J.; resources, L.C. and J.Y.; data curation, Z.J.; writing—original draft preparation, Z.J.; writing—review and editing, L.C.; visualization, Z.J.; supervision, L.C.; project administration, L.C.; funding acquisition, L.C. All authors have read and agreed to the published version of the manuscript.
Funding
This research was funded by the National Natural Science Foundation of China under grant number 42171417, the Key Research and Development Program of Hubei Province under grant number 2021BAA166, the Central Guided Local Science and Technology Development Special Project under grant number 20222ZDH04090, the Medium- and Long-term Scientific and Technological Planning Projects for Radio, Television and Audio-Visual Networks, and the Special Fund of Hubei Luojia Laboratory under grant number 220100008.
Data Availability Statement
The data presented in this study are available on request from the corresponding author.
Conflicts of Interest
The authors declare no conflict of interest.
References
- Parker, J.J.K.; Valdez, J.E.; Bauer, F.H.; Moreau, M.C. Use and Protection of Gps Sidelobe Signals for Enhanced Navigation Performance in High Earth Orbit. In Proceedings of the Annual AAS Guidance and Control Conference 2016, Breckenridge, CO, USA, 5–10 February 2016; pp. 329–341. [Google Scholar]
- Jing, S.; Zhan, X.Q.; Lu, J.; Feng, S.J.; Ochieng, W.Y. Characterisation of GNSS Space Service Volume. J. Navig. 2015, 68, 107–125. [Google Scholar] [CrossRef]
- Li, W.W.; Jiang, K.C.; Li, M.; Zhao, Q.L.; Wang, M.; Shi, C.; Xu, C.J. BDS and GPS side-lobe observation quality analysis and orbit determination with a GEO satellite onboard receiver. GPS Solut. 2023, 27, 18. [Google Scholar] [CrossRef]
- Donaldson, J.E.; Parker, J.J.K.; Moreau, M.C.; Highsmith, D.E.; Martzen, P.D. Characterization of on-orbit GPS transmit antenna patterns for space users. Navig. J. Inst. Navig. 2020, 67, 411–438. [Google Scholar] [CrossRef]
- Guan, M.; Xu, T.; Li, M.; Gao, F.; Mu, D. Navigation in GEO, HEO, and Lunar Trajectory Using Multi-GNSS Sidelobe Signals. Remote Sens. 2022, 14, 318. [Google Scholar] [CrossRef]
- Bauer, F.H.; Moreau, M.C.; Dahle-Melsaether, M.E.; Petrofski, W.P.; Stanton, B.J.; Thomason, S.; Harris, G.A.; Sena, R.P.; Temple, L.P. The GPS Space Service Volume. In Proceedings of the 19th International Technical Meeting of the Satellite Division of the Institute of Navigation (Ion Gnss 2006), Fort Worth, TX, USA, 26–29 September 2006; pp. 2503–2514. [Google Scholar]
- Balbach, O.; Eissfeller, B.; Hein, G.W.; Enderle, W.; Schmidhuber, M.; Lemke, N. Tracking GPS above GPS satellite altitude: First results of the GPS experiment on the HEO mission Equator-S. In Proceedings of the IEEE 1998 Position Location and Navigation Symposium (Cat. No.98CH36153), Palm Springs, CA, USA, 20–23 April 1996; pp. 243–249. [Google Scholar]
- Jiang, K.C.; Li, M.; Wang, M.; Zhao, Q.L.; Li, W.W. TJS-2 geostationary satellite orbit determination using onboard GPS measurements. GPS Solut. 2018, 22, 1–14. [Google Scholar] [CrossRef]
- Ramsey, G.; Barker, L.; Chapel, J.; Winkler, S.; Frey, C.; Freesland, D.; Baltimore, P.; Krimchansky, A. Goes-R Series Geo Side-Lobe Capable Gpsr Post-Launch Refinements and Operational Capabilities. In Proceedings of the American Astronautical Society Annual Guidance and Control Conference (AAS GNC 2019), Breckenridge, CO, USA, 17 April 2019. [Google Scholar]
- Winternitz, L.B.; Bamford, W.A.; Price, S.R. New High-Altitude GPS Navigation Results from the Magnetospheric Multiscale Spacecraft and Simulations at Lunar Distances. In Proceedings of the 30th International Technical Meeting of the Satellite Division of the Institute of Navigation (Ion Gnss+ 2017), Portland, OR, USA, 25–29 September 2017; pp. 1114–1126. [Google Scholar]
- Enderle, W.; Gini, F.; Boomkamp, H.; Parker, J.J.K.; Ashman, B.W.; Welch, B.W.; Koch, M.; Sands, O.S. Space User Visibility Benefits of the Multi-GNSS Space Service Volume: An Internationally-Coordinated, Global and Mission-Specific Analysis. In Proceedings of the 31st International Technical Meeting of the Satellite Division of the Institute of Navigation (Ion Gnss+ 2018), Miami, FL, USA, 24–28 September 2018; pp. 1191–1207. [Google Scholar]
- Wang, M.; Shan, T.; Liu, L.; Huan, H.; Tao, R. On-orbit BDS signals and transmit antenna gain analysis for a geostationary satellite. Adv. Space Res. 2022, 69, 2711–2723. [Google Scholar] [CrossRef]
- Ashman, B.W.; Parker, J.J.K.; Bauer, F.H.; Esswein, M. Exploring the Limits of High Altitude Gps for Future Lunar Missions. In Proceedings of the American Astronautical Society Annual Guidance and Control Conference (AAS GNC 2018), Breckenridge, CO, USA, 2–5 February 2018. [Google Scholar]
- Su, X.; Geng, T.; Li, W.W.; Zhao, Q.L.; Xie, X. Chang’E-5T Orbit Determination Using Onboard GPS Observations. Sensors 2017, 17, 1260. [Google Scholar] [CrossRef]
- Lin, K.; Zhan, X.Q.; Yang, R.; Shao, F.W.; Huang, J.H. BDS Space Service Volume characterizations considering side-lobe signals and 3D antenna pattern. Aerosp. Sci. Technol. 2020, 106, 106071. [Google Scholar] [CrossRef]
- Capuano, V.; Botteron, C.; Leclere, J.; Tian, J.; Wang, Y.G.; Farine, P.A. Feasibility study of GNSS as navigation system to reach the Moon. Acta Astronaut. 2015, 116, 186–201. [Google Scholar] [CrossRef]
- Delepaut, A.; Giordano, P.; Ventura-Traveset, J.; Blonski, D.; Schonfeldt, M.; Schoonejans, P.; Aziz, S.; Walker, R. Use of GNSS for lunar missions and plans for lunar in-orbit development. Adv. Space Res. 2020, 66, 2739–2756. [Google Scholar] [CrossRef]
- Lin, Z.; Shi, T.; Zhuang, X.; He, Y. Evaluation of Multiple GNSS Navigation Performance in Lunar Transfer Orbit and Circumlunar Orbit. In Proceedings of the 2022 IEEE International Conference on Unmanned Systems (ICUS), Guangzhou, China, 28–30 October 2022; pp. 566–571. [Google Scholar]
- Ziedan, N.I.; Garrison, J.L. Unaided acquisition of weak GPS signals using circular correlation or double-block zero padding. In Proceedings of the 2004 IEEE/ION Position, Location and Navigation Symposium (PLANS), Monterey, CA, USA, 26–29 April 2004; pp. 461–470. [Google Scholar]
- Borio, D.; Lachapelle, G. A non-coherent architecture for GNSS digital tracking loops. Ann. Telecomm. 2009, 64, 601–614. [Google Scholar] [CrossRef]
- Chung, C.D. Differentially Coherent Detection Technique for Direct-Sequence Code Acquisition in a Rayleigh Fading Mobile Channel. IEEE Trans. Commun. 1995, 43, 1116–1126. [Google Scholar] [CrossRef]
- Van Diggelen, F. A-GPS: Assisted GPS, GNSS, and SBAS; Artech House: Boston, MA, USA, 2009. [Google Scholar]
- Lo Presti, L.; Zhu, X.F.; Fantino, M.; Mulassano, P. GNSS Signal Acquisition in the Presence of Sign Transition. IEEE J-STSP 2009, 3, 557–570. [Google Scholar] [CrossRef]
- Palmerini, G.B.; Sabatini, M.; Perrotta, G. En route to the Moon using GNSS signals. Acta Astronaut. 2009, 64, 467–483. [Google Scholar] [CrossRef]
- Capuano, V.; Blunt, P.; Botteron, C.; Tian, J.; Leclere, J.; Wang, Y.G.; Basile, F.; Farine, P.A. Standalone GPS L1 C/A Receiver for Lunar Missions. Sensors 2016, 16, 374. [Google Scholar] [CrossRef]
- Meng, Y.S.; Qu, B.; Wang, Y.G.; Bian, L.; Li, L.L.; Wang, X.L. A High Sensitive GNSS Receiver for High Altitude Space Missions. In Proceedings of the 30th International Technical Meeting of the Satellite Division of the Institute of Navigation (Ion Gnss+ 2017), Portland, OR, USA, 25–29 September 2017; pp. 1688–1694. [Google Scholar]
- Musumeci, L.; Dovis, F.; Silva, J.S.; da Silva, P.F.; Lopes, H.D. Design of a High Sensitivity GNSS receiver for Lunar missions. Adv. Space Res. 2016, 57, 2285–2313. [Google Scholar] [CrossRef]
- Wang, Z.S.; Meng, Z.F.; Gao, S.; Peng, J. Orbit Design Elements of Chang’e 5 Mission. Space Sci. Tech. 2021, 2021, 9897105. [Google Scholar] [CrossRef]
- Test and Assessment Research Center of China Satellite Navigation Office. Available online: http://www.csno-tarc.cn/gps/constellation (accessed on 2 March 2023).
- Development of the BeiDou Navigation Satellite System (Version 4.0). Available online: http://www.beidou.gov.cn/xt/gfxz/201912/P020191227430565455478.pdf (accessed on 1 March 2023).
- Hogg, D.C. Fun with the Friis free-space transmission formula. IEEE Antennas Propag. Mag. 1993, 35, 33–35. [Google Scholar] [CrossRef]
- Misra, P. Global Positioning System: Signals, Measurements, and Performance; Ganga-Jamuna Press: Lincoln, MA, USA, 2011. [Google Scholar]
- Xu, S.; Wu, F.L.; Geng, C.C. BeiDou Signal Acquisition based on a New Double Block Zero-padding Method. In Proceedings of the 2018 IEEE/ION Position, Location and Navigation Symposium (PLANS), Monterey, CA, USA, 23–26 April 2018; pp. 1414–1421. [Google Scholar]
- Gebre-Egziabher, D.; Gleason, S. GNSS Applications and Methods; Artech House: Boston, MA, USA, 2009. [Google Scholar]
- Chen, L.; Lu, X.C.; Shen, N.; Wang, L.; Zhuang, Y.; Su, Y.; Li, D.R.; Chen, R.Z. Signal acquisition of Luojia-1A low earth orbit navigation augmentation system with software defined receiver. Geo. Spat. Inf. Sci. 2022, 25, 47–62. [Google Scholar] [CrossRef]
- Lin, M.Y.; Luo, Y.M.; Zhu, X.F.; Tu, G.Y.; Lu, Z.P. Optimal GPS Acquisition Algorithm in Severe Ionospheric Scintillation Scene. Electronics 2023, 12, 1343. [Google Scholar] [CrossRef]
- Nezhadshahbodaghi, M.; Mosavi, M.R.; Rahemi, N. Improved Semi-Bit Differential Acquisition Method for Navigation Bit Sign Transition and Code Doppler Compensation in Weak Signal Environment. J. Navig. 2020, 73, 892–911. [Google Scholar] [CrossRef]
- Witternigg, N.; Obertaxer, G.; Schonhuber, M.; Palmerini, G.B.; Rodriguez, F.; Capponi, L.; Soualle, F.; Floch, J.J. Weak GNSS Signal Navigation for Lunar Exploration Missions. In Proceedings of the 28th International Technical Meeting of the Satellite Division of the Institute of Navigation (Ion Gnss+ 2015), Tampa, FL, USA, 14–18 September 2015; pp. 3928–3944. [Google Scholar]
- Li, Y.F.; Shivaramaiah, N.C.; Akos, D.M. Design and implementation of an open-source BDS-3 B1C/B2a SDR receiver. GPS Solut. 2019, 23, 3. [Google Scholar] [CrossRef]
- Wu, M.Y.; Zhao, L.; Ding, J.H.; Gao, Y.; Li, Y.F.; Kang, Y.Y. A BDS-3 B1C/B2a dual-frequency joint tracking architecture based on adaptive Kalman filter and extended integration time. GPS Solut. 2020, 24, 30. [Google Scholar] [CrossRef]
Disclaimer/Publisher’s Note: The statements, opinions and data contained in all publications are solely those of the individual author(s) and contributor(s) and not of MDPI and/or the editor(s). MDPI and/or the editor(s) disclaim responsibility for any injury to people or property resulting from any ideas, methods, instructions or products referred to in the content. |
© 2023 by the authors. Licensee MDPI, Basel, Switzerland. This article is an open access article distributed under the terms and conditions of the Creative Commons Attribution (CC BY) license (https://creativecommons.org/licenses/by/4.0/).

