Abstract
Soil erosion triggered by water and wind pose a great threat to the sustainable development of Pakistan. In this study, a combination of geographic information systems (GISs) and machine learning approaches were used to predict soil water erosion rates. The Revised Wind Erosion Equation (RWEQ) model was used to evaluate soil wind erosion, map erosion factors, and analyze the soil erosion rates for each land use type. Finally, the maps of soil water and wind erosion were spatially integrated to identify erosion risk regions and recommend land use management in Pakistan. According to our estimates, the Potohar Plateau and its surrounding regions were mostly impacted by water erosion and have a soil erosion rate of 2500–5000 t·km−2·a−1; on the other hand, wind erosion predominated the Kharan Desert and the Thar Desert, with a soil erosion rate exceeding 15,000 t·km−2·a−1. The Sulaiman and Kirthar Mountain Ranges were susceptible to wind–water compound erosion, which was more than 8000 t·km−2·a−1. This study offers new perspectives on the geographic pattern of individual and integrated water–wind erosion threats in Pakistan and provides high-precision data and a scientific foundation for designing rational soil and water conservation practices.
1. Introduction
Soil is a finite natural resource that is essential for food security, carbon absorption, water and nutrient control, contaminant filtering, biodiversity promotion, heritage preservation, and climate regulation [1,2,3]. Healthy soils provide the foundation for safeguarding the agricultural and natural resources that people require; however, global soil degradation is increasing due to rising populations, economic growth, and frequent extreme climate events [4,5]. However, the soil of many regions around the world are being eroded in diverse ways [6,7,8]. Soil erosion causes environmental problems, including land degradation; the siltation of rivers, lakes, and reservoirs; and the eutrophication of surface water bodies. All of these severely restrict sustainable resource-environment-socioeconomic development [9,10]. It is estimated that soil erosion costs the economy roughly USD 400 billion a year [11]. Therefore, monitoring and evaluating soil erosion has become an essential research topic for soil resource conservation, food security, and ecological security construction strategies under a global climate change scenario [12]. Since the 1980s, with the advancement of soil erosion forecasting models and their integration with geographic information systems (GISs), researchers have attempted to quantitatively assess soil erosion and have conducted a number of studies in small, medium, and large watersheds in various countries and even globally [6,7,13,14,15]. A methodology for soil erosion mapping was developed using sampling survey units [14,15] and remote sensing technologies, and the findings provide a powerful support for soil conservation policy making [16].
Pakistan is traditionally an agricultural nation, but over 76% of its area suffers from wind and water erosion, which covers about 16 million hectares, meaning that about 1 billion tons of fertile soil are lost each year [17]. This not only endangers the livestock industry and ecological security but also threatens sustainable economic development [18,19,20]. To strengthen the management of soil erosion and to help decision makers develop effective soil and water conservation (SWC) practices, it has become essential to obtain the actual reality of soil erosion with the current climatic and land use circumstances and identify the risk regions and types of soil erosion. In Pakistan, soil water erosion research mostly uses the Revised Universal Soil Loss Equation (RUSLE) to estimate soil erosion in local small watersheds [21,22,23,24,25]. Gilani et al., (2021) evaluated and analyzed soil water erosion rates from 2005 to 2015 using the RUSLE in Pakistan; however, with a coarse resolution (1 km), methods that are worth considering for the calculation of soil erosion factors (e.g., a greater K-factor value, assignment of E- and P-factors depending on land use type), and soil wind erosion was not considered [19]. Yang et al., (2021) evaluated the global wind soil erosion rates using the Revised Wind Erosion Equation (RWEQ), but with a spatial resolution of 10 km [20]. It is difficult to provide valuable information for stakeholders to design rational SWC practices in soil erosion-prone regions.
This study calculated the soil water erosion factors using high-resolution sampling survey units (2.5 m), a method that has been extensively utilized and thoroughly appraised in the United States [26], Europe [27], and China [14]. Additionally, more attention was paid to SWC practices, particularly in the assignment of the E-factor, where cropland was divided into rainfed cropland and post-flooding/irrigated cropland and combined with slope to assign the value of the E-factor, which was an innovative way. The LS-factor was generated using a 30 m resolution DEM, which expresses more realistic terrain characteristics. The K-factor was corrected for rock fragment effects, resulting in a more accurate expression of soil erodibility. Based on previous studies [15,28,29], predictions of the soil water erosion rates (SAERs) have been made using machine learning models in a new attempt that combines GISs with artificial intelligence (AI), which can improve the resolution of the calculated results compared with traditional map algebra methods. Moreover, we evaluated the soil wind erosion rate (SIER) using the RWEQ model as conducted by previous survey studies [15,26,27]. Finally, the maps of soil water and wind erosion were spatially integrated to generate a comprehensive geographic distribution map of soil erosion in Pakistan. The particular goals were to (a) evaluate the geographic pattern and erosion intensity of soil water and wind erosion, respectively; and (b) identify regions that are prone to erosion from water and wind. This study could help policy makers and the land administration ministry understand the scale and intensity of soil erosion. Furthermore, it may be useful for enhancing the development of national and regional regulation systems in ecological protection and may help establish priority regions for SWC services.
2. Method
2.1. Study Area
Pakistan is a South Asian nation (23°30′–36°45′, 60°53′–75°31′) and is bordered by India in the east, China in the northeast, Afghanistan in the northwest, Iran in the west, and the Arabian Sea in the south; the country covers an area of about 796,095 km2 [19] (Figure 1). The spatial and temporal diversity of temperature and precipitation is significant in Pakistan. The southeastern region has rainfall associated with the southwestern summer monsoon (June to September), while precipitation in the northern and western parts of the southern half of the country is concentrated from December to March [30]. The summer monsoon contributes about 60% of the annual precipitation [31]. The climate is mainly arid/semiarid, with 75% of the country having an annual rainfall of less than 250 mm; the southern slopes of the Himalayas and the sub-mountainous areas in the north receive annual rainfall of 760–2000 mm [30]. The topography gradually decreases from the northeast to the southwest and may be divided into mountainous regions in the north and west, plains in the center-east, the Kharan Desert in the south, and coastal areas in the south, with approximately 60% of the territory being mountainous and hilly [32].
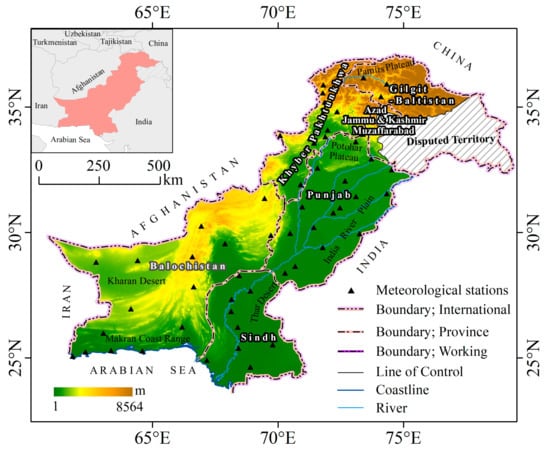
Figure 1.
The spatial distribution of elevation and meteorological stations across Pakistan (source “political_map_pakistan 5th 2020” downloaded from https://www.pakistan.gov.pk, (accessed on 22 April 2022)).
2.2. Materials
This study used four datasets (Table 1): (1) A set of 475 sampling survey units from Pakistan (Figure 2), obtained from the “Strategic Priority Research Program of Chinese Academy of Sciences” project phase results, which were quality-verified [15,29] and serve as the dependent variable in the machine learning dataset. (2) Machine learning covariate layers (independent variable): rainfall erosivity force (R), soil erodibility (K), terrain factor (LS), biological practices factor (B), engineering practices factor (E), and tillage practices factor (T). All covariate layers were resampled to 30 m. (3) The RWEQ model used meteorological, soil, topography, and vegetation data among others, with all raster data being resampled to 250 m. (4) Socioeconomic data: population density and gross domestic product (GDP). The soil water erosion map was resampled to 250 m when integrated with the soil wind erosion map.

Table 1.
List of the resources used in the current study.
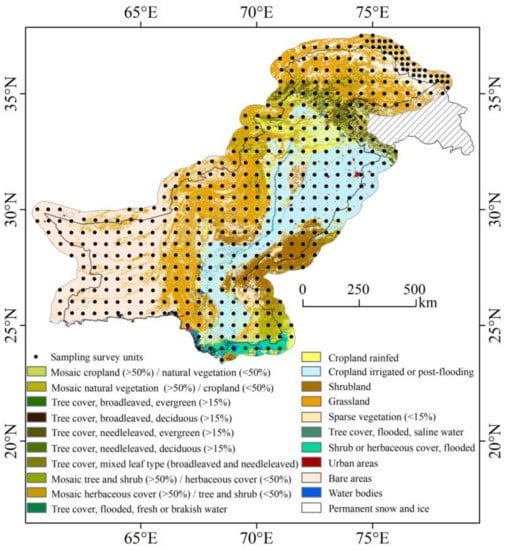
Figure 2.
The spatial pattern of land use and sampling survey units in Pakistan (source: Climate Change Initiative—Land Cover 2000 (CCI-LC 2000), European Space Agency, ESA).
2.3. Spatial Prediction of Soil Water Erosion
(1) Sampling survey units
The sampling units were designed using a stratified variable probability systematic sampling method. The spatiotemporal characteristics of soil erosion and conservation were taken into account, and finer-resolution, freely available, and accessible images in Google Earth were used. Through the visual interpretation of the free high-resolution remote sensing images, detailed information on land use and soil conservation measures was obtained. Then, along with the R-factor, K-factor, LS-factor, B-factor, E-factor, and T-factor, we used the Chinese Soil Loss Equation (CSLE) model to calculate the soil water erosion maps (2.5 m resolution) for each sampling survey unit [15,33].
where A represents the SAER (t·km−2·a−1) of the sampling survey unit; R represents the rainfall erosivity factor (MJ·mm·ha−1·h−1·a−1); K represents the soil erodibility factor (t·hm2·h·hm−2·MJ−1·mm−1); L represents the slope length factor (dimensionless); S represents the slope factor (dimensionless); B represents the biological practices factor (dimensionless); E is the engineering practices factor (dimensionless); and T is the tillage practices factor (dimensionless).
(2) Machine learning
A machine learning method was used to predict the SAER, with the soil water erosion factors of the CSLE model serving as the covariate layers and the SAER (A) for each sampling survey unit serving as the dependent variable [34,35,36].
Step 1: Enter the SAER (A) point layer for the sampling units. Calculate the coordinates of the centroid of each sampling survey unit and export the attribute table. The display XY function of ArcGIS software was used to display and save the result of the display layer as an SHP file. Finally, the average value of SAER (Amean) for each sampling unit was used as the dependent variable for machine learning.
Step 2: Spatial prediction. The model fitting and generation of the map were performed in the R environment. The exact procedure was as follows:
(1) Overlay the Amean with covariate layers and prepare a regression matrix.
(2) Perform fitting of a spatial prediction model.
(3) Perform spatial prediction using covariate layers.
(4) Conduct a 10-fold cross-validation to assess the accuracy of the model.
The final predicted model is defined as: R > Amean ~ R + K + LS + B + E + T, where R, K, LS, B, E, and T are covariate layers and Amean is the mean value of each sampling survey unit. Note that “+” does not mean summing; it only means that there are six covariates. The flowchart for predicting the SAER is shown in Figure 3.
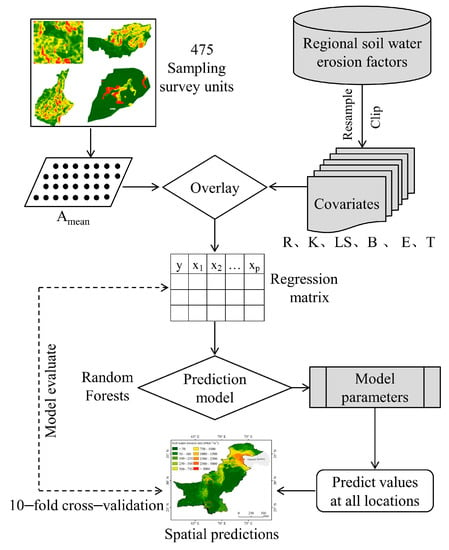
Figure 3.
The procedure for predicting the SAER in Pakistan.
2.3.1. Rainfall Erosivity Factor (R)
The R-factor was obtained from the CAS project team [37], which was clipped by the Pakistan border (with a 55 km buffer) and resampled to 30 m resolution. The R-factor was calculated using global station data (0.5° × 0.5°) provided by the Climate Prediction Center (CPC) for the years of 1986–2015, and the method for estimating station rainfall erosion can be found in [38,39,40] and the Supplementary Materials (lines 44–52).
2.3.2. Soil Erodibility Factor (K)
The K-factor from the team led by the corresponding author [41], which was clipped by the Pakistan border (with a 55 km buffer) and resampled to 30 m resolution. Because the K-factor is significantly influenced by rock fragments, the K0 layer was adjusted according to the influence factor of rock fragments to obtain thematic data of soil erodibility factor K1 at a 1 km resolution in the study area [42].
where K0 is the soil erodibility factor (t·h·MJ−1·mm−1), M is the silt content (0.1–0.002 mm) multiplied by the quantity (1 − clay%), OM is the organic matter fraction (%), S is the soil structure class, and P is the soil permeability class [43]. St represents the influence factor of rock fragments, taking the value of 0–1; K1 represents the final soil erodibility factor.
2.3.3. Terrain Factor (LS)
The LS-factor was provided by the team led by the corresponding author [44], which was clipped by the Pakistan border (with a 55 km buffer). According to the process of Yang et al., (2013), the SRTM DEM (30 m) data were input into the LS tool as input data to calculate the LS-factor [44,45]. The LS-factor upper limit was set at 21.24 (the slope was 30 degrees and the slope length was 100 m) with reference to the relevant technical regulations and standards of the Chinese Ministry of Water Resources (Center of Soil Conservation Monitoring of MWR, Soil erosion census technical regulations, 2021.6; Center of Soil Conservation Monitoring of MWR, Guide to Soil Erosion Monitoring, 2021.6; Ministry of Water Resources of the People’s Republic of China, Standard for Classification and Gradation of Soil Erosion SL190–2007, 2008,1) and the study by Brychta and Brychtova (2020) [46].
2.3.4. Biological Practices Factor (B)
According to the methodology of Borrelli et al., (2017) for the global B-factor, the nonagricultural land B-factor and forest category were calculated using Equation (4), and the shrub and grassland categories were calculated using Equation (5); cropland is assigned a value of 1.
where Bna is the B-factor value for forest cover. Tc (forest cover surface) is normalized to a range of 0 to 1 and describes the percentage of surface covered by forest. Bp is the B-factor value for non-forest land cover (i.e., shrub, grassland, and bare land, etc.). NonTree_vegetate is vegetation (excluding forest) cover and is assumed to be in the range of 0–1. MAXb and MINb are the maximum and minimum B-factor values for each land use type, respectively, according to the assignment rules of Borrelli et al., (2017), the range of which is detailed in Table 2. Then, using the nearest neighbor approach, the B-factor layer was resampled to 30 m resolution.

Table 2.
B-factor values for nonagricultural land.
2.3.5. Engineering Practices Factor (E)
Field surveys and Google Earth observations showed that cropland in Pakistan is mainly terraced [47]. Therefore, the E-factor of cropland (rainfed cropland and post-flooding or irrigated cropland) was assigned according to the Guide of Soil Erosion Monitorin, 2021.6, the European Space Agency Climate Change Initiative Land Cover CCI (ESA CCI_LC), and slope (Table 3). The E-factor for land use types other than cropland was assigned as 1. Finally, the E-factor layer was resampled to 30 m.

Table 3.
E-factor value assignment table of cropland.
2.3.6. Tillage Practices Factor (T)
Based on the global cropping rotation system map and the Guide of Soil Erosion Monitoring, 2021.6, various kinds of tillage practices were allocated in ArcGIS software to produce a T-factor layer with a 30 m resolution.
2.4. Revised Wind Erosion Equation (RWEQ) Model
The RWEQ model is commonly used for estimating soil wind erosion, which overcomes the lack of the significant human and financial investment that is required for in situ measurements such as isotope monitoring and wind tunnel experiments [20,48,49,50]. The calculation formulas are shown below:
where Qmax represents the maximum transport capacity (kg·m−1); S represents the critical field length (m); and SL represents the soil wind erosion amount (kg·m−2), which was taken as 50 m in this study. WF represents the weather factor (kg·m−1); EF represents the soil erodible fraction (dimensionless); SCF represents the soil crust factor (dimensionless); K’ represents the wind soil roughness factor (dimensionless); and C represents the vegetation factor (dimensionless).
The soil wind erosion factors and rate were calculated using the Java programming language. We summarized the soil erosion losses for 24 semi-monthly periods to obtain the SIER. Figure 4 is a flowchart for evaluating the SIER.
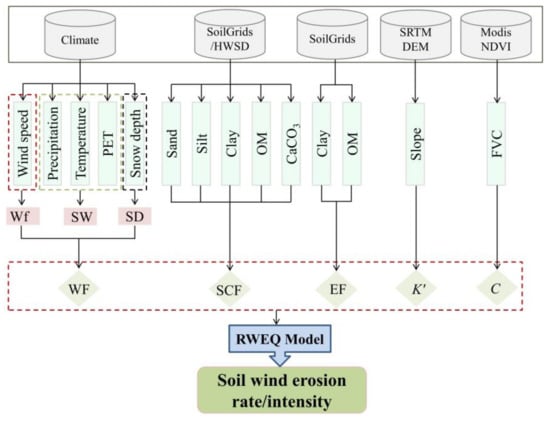
Figure 4.
Map showing the flowchart for evaluating the SIER in Pakistan.
2.4.1. Weather Factor (WF)
The WF-factor was assessed using the following formula [51,52]:
where WF represents the weather factor (kg·m−1); u2 represents the wind speed at 2 m (m·s−1); u1 represents the critical wind speed at 2 m (m·s−1), which was proposed to be 5 m·s−1 [20]; N represents the count of wind speed for an observation period; Nd represents the number of days in the observation period; ρ represents the air density (kg·m−3); g represents the acceleration of gravity (m·s−2); EL represents the elevation (km); T represents the thermodynamic temperature (K); SW represents the soil moisture factor (dimensionless); ETp represents the potential relative evapotranspiration (mm); R represents the precipitation (mm); I represents the amount of irrigation (mm); Rd represents the number of days of precipitation or irrigation; SR represents the solar radiation (cal·cm−2); DT represents the average temperature (°C); and SD represents the snow cover factor (number of days without snow cover/number of days observed) (dimensionless).
2.4.2. Soil Wind Erodible Fraction (EF) and Soil Crust Factor (SCF)
The EF-factor and SCF-factor can be calculated according to the equation below [53]:
where Sa (5.5–93.6%), Si (0.5–69.5%), Cl (5–39.3%), OM (0.32–4.74%), and CaCO3 (0–25.2%) represent the soil sand, silt, clay, organic matter, and calcium carbonate fractions, respectively.
2.4.3. Soil Roughness Factor (K′)
The K′-factor can be determined using the formula below:
where α is the slope gradient, which is generated from SRTM DEM data [50].
2.4.4. Vegetation Factor (C)
The C-factor represents the suppression of soil wind erosion under different vegetation cover levels [54], which was estimated using following equations:
where C represents the vegetation factor (dimensionless). FVCi is the fractional vegetation cover (%). NDVIsoil represents the pure soil pixel value, which is theoretically close to 0 and is generally taken to be the closest to 5% of the cumulative NDVI; NDVIveg represents the pure vegetation pixel value, which is theoretically close to 1 and is generally taken as the value closest to 95% of the cumulative NDVI.
3. Result
3.1. Spatial Distribution of Soil Water Erosion
This study used the createDataPartition function in the R environment to randomly divide the sampling unit dataset into a training dataset (80% of the total dataset) and test dataset (20% of the total dataset), which was performed to train the model and test the model’s performance. Spatial interpolation using the randomForest function, according to the traversal modeling results, has the lowest error rate when mtry = 3; when ntree = 300, the error within the model is basically stable (Figure 5a). The receiver operating characteristic (ROC) curve and area under the curve (AUC) values were used to evaluate the performance of the binary classifier; the higher the value of AUC, the better the classification effect of the model. In Figure 5b, the ROC curve is near the upper left corner, and the AUC is 96.31%. The random forest model passed a 10-fold cross-validation and had a model explained degree (R2) of 89.4%, mean absolute error (MEA) of 559.41, and root mean square error (RMSE) of 786.39, showing that the deviation between the fitted and true values of the model is small and that the random forest simulation results were more accurate. The importance of the covariate layers was ranked as R > LS > B > E > K > T with contributions of 40%, 21%, 19%, 11%, 7%, and 2%, respectively, which is in agreement with a priori knowledge of the soil erosion survey and indicates that the random forest simulation meets the requirements of this study.
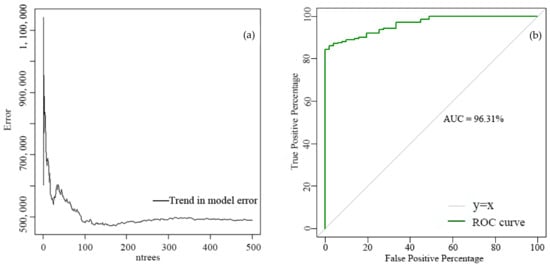
Figure 5.
Trend in the model error (a) and ROC curve (b).
Figure 6 displayed that the Potohar Plateau, Sulaiman Mountain Range, the southern Central Brae Grey Ridge, and the Gilbert Range had the severest soil water erosion, which was mostly attributable to the steep terrain and heavy rain (Supplementary Figure S1a,c). Soil water erosion was also severe in the northern mountains, where the topography is undulating and the vegetation is mostly sparse shrubs and grasses (Figure 2; Supplementary Figure S1c); meanwhile, the soil water erosion in the India River Plain in the central-eastern region, the Kharan Desert, and the southern Arabian Coast was light. The northeastern portion of Kashmir mostly consists of bare rock and glacier tundra; the central-eastern region and southern coastal zone were the most important agricultural cultivation regions, with their flat topography and crop cover providing certain protection to the soil (Supplementary Figure S1a,c), and soil erosion was light. In Pakistan, the mean SAER was 447.25 t·km−2·a−1, which is 1.56 times higher than the global mean SAER of 287.2 t·km−2·a−1 [6]. Despite a SAER of below 250 t·km−2·a−1 covering about 52.15% of Pakistan, it only contributes to 14.47% of the total soil loss. The percentage between 250 and 500 t·km−2·a−1 was 19.86%, between 500 and 750 t·km−2·a−1 was 10.16%, between 750 and 1000 t·km−2·a−1 was 5.81%, between 1000 and 1500 t·km−2·a−1 was 7.41%, and between 1500 and 2500 t·km−2·a−1 was 1.95%. The area accounted for by the SAER is over 2500 t·km−2·a−1 for 2.66% of the area, but the soil erosion loss contributes about 17.98%, indicating that the soil erosion is severe in these regions. According to the methodology of Borrelli et al., (2018) [55], based on the SAER of each pixel, the soil water erosion amount was roughly evaluated to be about 3.90 × 10⁸ t·a−1 in Pakistan, and the amount of soil organic carbon because of soil water erosion was about 2.7 × 10⁷ t·a−1.
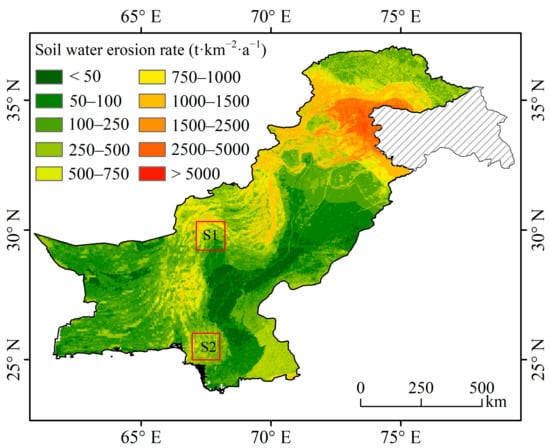
Figure 6.
Spatial pattern of the SAER in Pakistan (S1, S2 represent sample 1 and sample 2, respectively).
The SAER for each land use type (Supplementary Table S1) showed that forests had the highest rate at 1859.87 t·km−2·a−1; Borrelli et al., (2017) and Gilani et al., (2021) estimated a SAER of 3786.93 t·km−2·a−1 and 500–2000 t·km−2·a−1 in forests, respectively, which were closer to the results of this study. This is because the northern high mountains have sparse forests, where the average annual rainfall of forest land is 1220.26 mm, which is the greatest among all land use types and leads to a high rainfall erosivity factor (R). The topography is more complex, and the mean value of the LS-factor was 14.46, which is higher than the LS values of other land uses. Steep terrain increases the scouring of the soil by rainfall (especially extreme rainfall) and even leads to sheet erosion. This is followed by a SAER of 747.73 t·km−2·a−1 for rainfed cropland, which is mainly found in the southwest of the India River Plain and Potohar Plateau, where a higher rainfall erosivity force and greater topographic relief result in a higher soil erosion intensity. Although the rainfall erosivity force is strong in post-flooding or irrigated cropland, the terrain is flatter, and more appropriate SWC practices have been implemented, resulting in a significant improvement in soil erosion status. Bare land had the lowest SAER of 194.66 t·km−2·a−1 because the R-factor was the weakest and the terrain is flatter (Supplementary Figure S1a,c).
3.2. Spatial Distribution of Soil Wind Erosion
The map of soil wind erosion displays two hot regions, as shown in Figure 7: (1) The Karan Desert and the Thar Desert, where the SIER exceeds 2500 t·km−2·a−1 and the soil types are predominantly arenosols, gypsisols, and solonchaks. Some regions have sporadically distributed luvisols and leptosols, but the organic matter content is low with low vegetation cover, which makes them vulnerable to wind erosion. In the southwest coastal areas, due to the small amount of water vapor carried by the southwest air currents from the Arabian Peninsula and Africa, the flat topography does not have a significant lifting effect; moreover, with the destruction of vegetation by humans for historical reasons, precipitation is scarce, forming deserts distributed along the coast. A variety of problems, such as soil desertification and salinization, are particularly prominent. (2) The transition zone from the eastern plains to the western mountains, where the predominant soil types are drier calcisols and arenosols with low water content, which have weak erosion resistance and are sensitive to wind erosion.
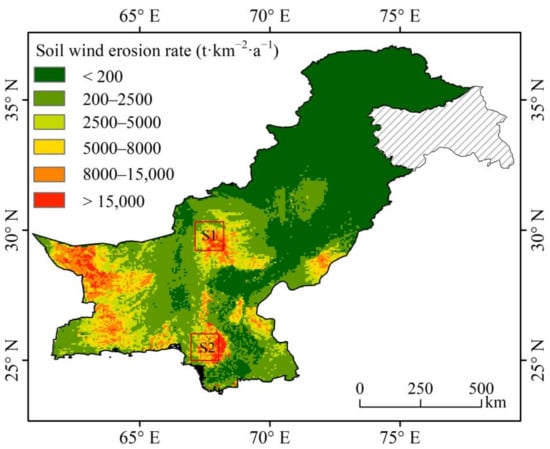
Figure 7.
Spatial pattern of the SIER in Pakistan (S1, S2 represent sample 1 and sample 2, respectively).
The mean SIER was 2063.45 t·km−2·a−1, with the soil wind erosion amounting to 1.77 × 10⁹ t·a−1. An SIER of less than 200 t·km−2·a−1 covers about 46.52% of Pakistan but only accounts for about 0.53% of the total soil loss; this is found in the Potohar Plateau south of the northern high mountains, which has irrigated fields in the center and southern areas, and coastal regions in the south, where they are most prevalent. These regions mostly consist of cropland and grassland, and their vegetation coverage was greater and more resistant to wind erosion. The percentage in the range of 250–2500 t·km−2·a−1 was 29.27%, and those of 2500–5000 t·km−2·a−1 and 5000–8000 t·km−2·a−1 were 9.47% and 7.06%, respectively. Although an SIER of more than 8000 t·km−2·a−1 covers approximately 7.68% of Pakistan, it accounts for approximately 47.08% of the total soil loss, which is mainly found in the Kharan Desert and Thar Desert. Referring to the method of the global soil organic carbon map evaluated by Hengl et al., (2017), Pakistan was extracted, and the amount of soil organic carbon caused by soil wind erosion was calculated to be about 1.43 × 10⁶ t·a−1 using the methodology of Borrelli et al., (2018) [55].
The SIER for bare land was 3864.32 t·km−2·a−1, and it was 3882.47 t·km−2·a−1 for sparse desert; the rates for other land uses were lower. This was attributed to the fact that 43.3% of area is bare land in Pakistan, which is mostly located in the Gobi and Kharan Deserts and in the India Desert in the southeast, where soil quality is quite poor and the surface is bare and susceptible to wind erosion. In contrast, forests and grasslands have higher vegetation cover, which protects the soil by conserving soil moisture, increasing surface roughness, and reducing wind speed.
3.3. Soil Erosion in Relation to Socio-Economics
At the administrative unit level (Supplementary Table S2), Azad Jammu and Kashmir had the highest mean SAER at 2942.28 t·km−2·a−1, while the Balochistan Province had the highest SIER at 3751.07 t·km−2·a−1. The Khyber Pakhtunkhwa Province had the highest soil water erosion loss with 10.65 × 10⁷ t·a−1, which accounts for 27.46% of the total soil erosion loss. In the Balochistan Province, the soil water erosion amount was 10.25 × 10⁷ t·a−1, which covers 26.43% of the total soil erosion loss. These two provinces should strengthen the management of soil water erosion. The Balochistan Province has the greatest soil wind erosion amount at 12.67 × 10⁸ t·a−1, which accounts for 71.54% of the total soil wind erosion loss, followed by the Sindh Province, whose soil wind erosion loss was 3.87 × 10⁸ t·a−1 accounting for 21.85%; the two provinces are the ones that are most susceptible to wind erosion.
The increasing population of Pakistan has been exerting more pressure on the food production system. Exploring the relation among soil water and wind erosion rates, GDP, and population density in each province is intended to provide administrative units with a solid scientific foundation for soil erosion management. Table 4 revealed that: (1) soil water erosion is negatively correlated with GDP, while SIER is not significantly correlated with GDP; (2) the negative correlation between soil wind erosion and population density is more obvious, while the SAER does not correlate significantly with population density. The table shows that developed provinces have the lowest soil water erosion, while poor provinces are most vulnerable to severe soil water erosion. The erosion rate decreased with the increase in GDP due to the increased investment in erosion control. Moreover, human health is negatively impacted by soil erosion, which is typically present in the arid regions of the southwest of Pakistan, where there is a low GDP and population density and where there is a significant amount of soil deterioration [56,57]. This demonstrates the importance of rational SWC practices in achieving global sustainable development goals.

Table 4.
Soil erosion and socioeconomic characteristics of each administrative unit in Pakistan.
4. Discussion
4.1. Spatial Patterns of Soil Erosion Risks
In Pakistan, soil erosion gradually transitions from water erosion to wind erosion from the northeast to the southwest under the spatial differences of climate, terrain, soil texture, etc. In the space, there is the existence of interlocking, and in the mountain front plain zone, the wind and water composite erosion type is present. Wind–water composite erosion is not simply the overlay of wind and water erosion but rather a complicated system of interlacing of time that overlaps in space [58,59,60,61,62,63]; both prolong the erosion time and enhance the erosion intensity for the regional environment, becoming the fundamental cause of ecological fragility and deterioration. Although it is possible to analyze the process and influencing factors of slope erosion under wind–water cross-erosion conditions using experiments in a wind tunnel and using artificially simulated rainfall, a quantitative model of wind, water force, and erosion characteristics with universal applicability has yet to be developed, and a large number of studies still focus on a qualitative analysis of the effects of wind erosion on water erosion and the relation between the two [64]. In Pakistan, spatial differences in soil water and wind erosion were apparent, and to evaluate the comprehensive soil erosion status, the two were spatially overlaid (Figure 8). In future studies, the simultaneous evaluation of soil water and wind erosion on a monthly or semimonthly scale should be conducted, and the relationship between their energies (e.g., R and WF) should be analyzed to recognize the complex relationship [16].
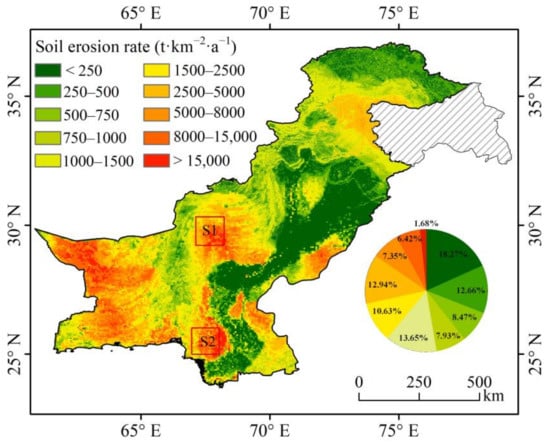
Figure 8.
Geographical distribution of the soil erosion rates in Pakistan (S1, S2 represent sample 1 and sample 2, respectively).
Figure 8 shows three risk regions: (1) The Potohar Plateau and neighboring mountainous areas that are the main agricultural regions, with soil types dominated by cambisols and calcisols and which have greater soil water content, viscosity, and soil quality. However, the topography is undulating (Supplementary Figure S1c), and human activities are frequent, such as deforestation. The R-factor has a maximum value of 5534 (MJ·mm·ha−1·h−1·a−1), which is approximately eight times more than the average rainfall erosion force of Pakistan (717.16 MJ·mm·ha−1·h−1·a−1) (Supplementary Figure S1a). Under the interaction of natural circumstances and human activity, these regions have drastic soil water erosion, with an erosion rate of 2500–5000 t·km−2·a−1. (2) The Kharan Desert and Thar Desert have abundant sand dunes, sparse vegetation, high evapotranspiration, and little precipitation. Arenosols and gypsisols are the most common soil types, which have a high sand content, low clay content, loose texture, increased wind erosion, and soil erosion rates exceeding 15,000 t·km−2·a−1. Wind velocity, temperature, precipitation, soil moisture, etc., variables have a close relationship with soil wind erosion [20]. Wind transfers surface soil and sand, which directly influences wind erosion [65]. Variations in precipitation and temperature influence soil wetness and plant growth, which have a compounded effect on soil erosion [66]. Surface moisture enhances the cohesion of soil particles, thus improving soil resistance to wind erosion and moderating soil wind erosion. Different soil textures have varying degrees of stability and cohesiveness; the higher the silt content and clay content, the more resistant the soil is to erosion [35]. Vegetation functions as a sand consolidator and prevents soil erosion by altering the roughness of the ground and controlling wind speed [50]. Figure 9 compares the SIER with the FVC- and WF-factor on monthly scales; the EF-, SCF-, and K′-factors were considered static and do not change on monthly scales. Soil wind erosion mainly occurs in summer, which corresponds with the seasonal winds of Pakistan, and it is highly consistent with the monthly trend of the WF-factor. Soil wind erosion is most prevalent in desert regions, where vegetation is sparse; the changes on a monthly scale were not significant, and the restraining effect on wind erosion was not obvious. (3) The SAERs of S1 and S2 in Figure 5 were 460.31 t·km−2·a−1 and 381.06 t·km−2·a−1, respectively. However, under the wind–water multiplex effect, the soil erosion rates of S1 and S2 in Figure 7 were 8038.73 t·km−2·a−1 and 9155.63 t·km−2·a−1, respectively, which were very strong. As a consequence, S1 and S2 should be prioritized in soil erosion management, and the soil erosion rates of other regions do not change significantly after spatial overlay.
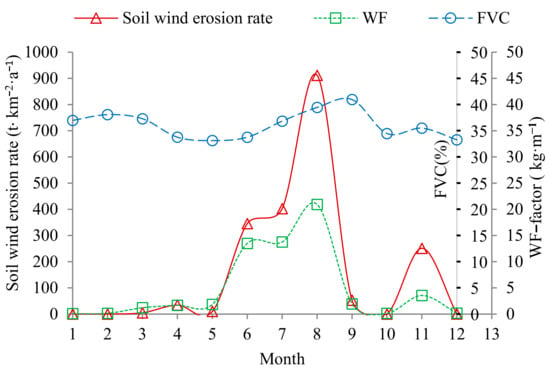
Figure 9.
Comparative map of the monthly SIER with the FVC and WF−factor in Pakistan.
The map of soil erosion showed the area occupied by each soil erosion class (Figure 8), with the greatest area being covered by soil erosion rates that were below 250 t·km−2·a−1; area with more than 15000 t·km−2·a−1 only accounted for 1.68% of the total area. The mean soil erosion rate was 2512.09 t·km−2·a−1, which greatly exceeded the soil formation rate (20 t·km−2·a−1) [67] and was twice as high as the tolerance soil loss rate in hilly and mountainous regions (224–1120 t·km−2·a−1) [68]. Furthermore, the soil erosion in the risk regions was extremely severe, and regional SWC management should be improved.
4.2. Plausibility of Soil Erosion
4.2.1. Plausibility of Soil Water Erosion
(1) Comparison with the small watersheds indicated that the SAER in the current study were closer to the local sub-basins; however, the findings of Gilani et al., (2021) were measured to be less than the local sub-basins [21,22,23,24,25] (Supplementary Table S3). The current study was compared with maps of the SAER in the Potohar Plateau region [25] (Figure 10a,b), which revealed that the macroscopic pattern was similar, with the severest soil erosion being in the northeast and lighter soil erosion being in the southwest. When comparing the classification of the SAER between Ullah et al., (2018) and the current study, 69.25% of the Potohar Plateau has an erosion rate of less than 200 t·km−2·a−1 according to Ullah et al., (2018) [25] (Supplementary Table S4). However, according to the field investigated by Chen et al., (2021) in the Potohar Plateau [28], the results of Ullah et al., (2018) were mainly lower because the R-factor was calculated using the annual precipitation and because the erosive force of extreme precipitation was not taken into account, resulting in a lower value. Among the 15 sub-watersheds investigated in the ground by Chen et al., (2021), 60% of the average SAER was 500 to 2000 t·km−2·a−1, and 59.50% of the erosion rates in this study were between 500 and 2000 t·km−2·a−1, showing that the current study’s results were more in line with the field surveys.
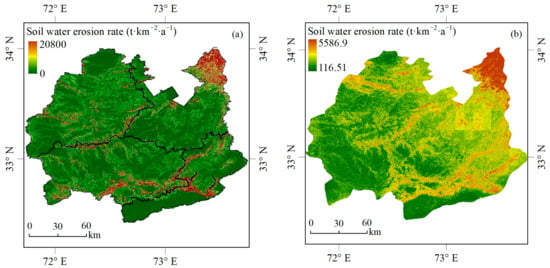
Figure 10.
Spatial comparison of the SAER over the Potohar Plateau: (a) Ullah et al., (2018) study [25] and (b) current study.
(2) A comparison with Gilani et al., (2021) evaluated the soil water erosion map (Figure 11a,b), which displayed the spatial pattern of the two maps to be similar; the results showed the severest soil water erosion in the northern mountainous regions of Azad Jammu and Kashmir and Khyber Pakhtunkhwa and lighter soil water erosion in the agricultural regions of the India River Plain and Gobi. The results of Gilani et al., (2021) for an SAER of less than 100 t·km−2·a−1 in the Thar Desert and India River Plain regions correspond to the SAER of 100–500 t·km−2·a−1 in the current study; however, the SAER values were close in the Potohar Plateau and nearby mountainous regions in the two studies. The mean SAER evaluated by Gilani et al., (2021) and the current study were 247 t·km−2·a−1 and 447.25 t·km−2·a−1, respectively. The differences in details were attributed to the data source and method of calculating factors, etc. (Supplementary Section S1.1).
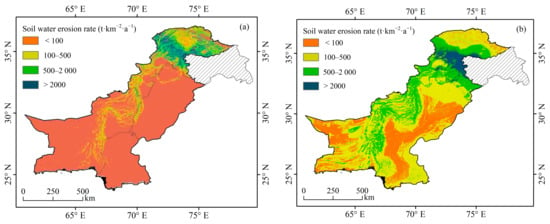
Figure 11.
Spatial comparison of the SAER between Gilani et al., (2021) [19] (a) and current study (b) for Pakistan.
(3) The mean SAER evaluated by Borrelli et al., (2017) and by the current study were 1251.79 t·km−2·a−1 and 552.65 t·km−2·a−1, respectively. Although there was variability in data sources, the calculation methods of factors (e.g., the K-factor), resolution, (Supplementary Section S1.2), and macroscopic patterns in Figure 12a,b were consistent and showed severe soil water erosion in the northern mountainous region and Azad Jammu and Kashmir region; meanwhile, light soil water erosion occurred in the India River Plain and the southwestern desert. As shown in Figure 13, the sample survey points are more evenly distributed on both sides of the line y = x, indicating the agreement between the current prediction results and the results obtained by Borrelli et al., (2017). The SAER values for each land use between the two studies were strongly correlated (R2 = 0.98) (Figure 14), and the land use type points are distributed on the left of the line y = x, indicating that the soil water erosion rate in the current study was less than that of Borrelli et al., (2017); however, the ranking of the soil water erosion rates for each land use type was consistent. This indicates that the predicted results are plausible for Pakistan’s current situation.
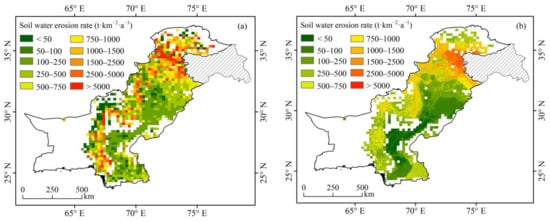
Figure 12.
Spatial comparison of the SAER in Borrelli et al., (2017) [6] (a) and current research (b) across Pakistan.
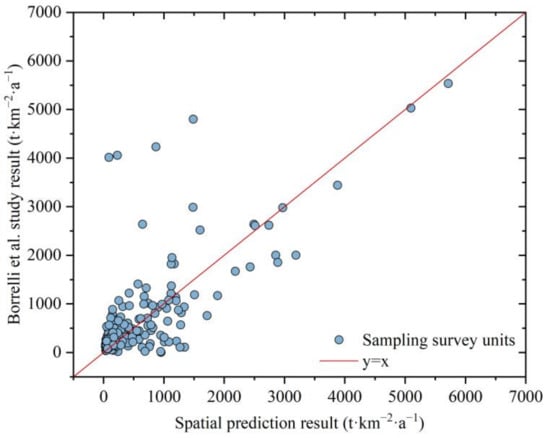
Figure 13.
Correlation of the spatial prediction result with Borrelli et al., (2017) [6] for Pakistan.
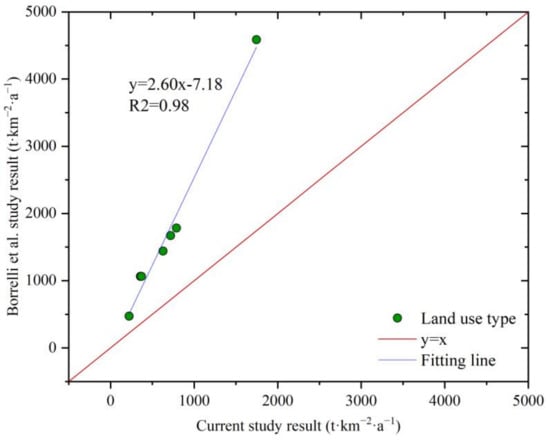
Figure 14.
Correlation of the spatial prediction result with Borrelli et al., (2017) [6] for each land use type.
(4) The global and Pakistan SAERs evaluated by Borrelli et al., (2017) and Gilani et al., (2021) using the RUSLE model were compared with the current study on a national scale and in six administrative units (Table 5). Borrelli et al., (2017) found a higher SAER for each administrative unit compared with the current study, whereas Gilani et al., (2021) found a lower SAER for each administrative unit in 2015 (Nodata areas were not counted). However, the order of soil water erosion intensity was the same for all administrative units: Azad Jammu and Kashmir > Gilgit-Baltistan > Khyber > Khyber Pakhtunkhwa > Balochistan > Punjab > Sindh. The differences in the models, data sources, etc., used by each study may account for the variation in the results.

Table 5.
Comparison of Borrelli, Gilani, and the current study with respect to the SAER of administrative units.
4.2.2. Plausibility of Soil Wind Erosion
(1) The global SIER map was compared with the current study [20] (Figure 15a,b), which showed a geographical pattern of severe soil wind erosion in the Gobi and Kharan Deserts in the southwest, the India Desert in the southeast; light soil wind erosion was observed in the cultivated regions of the central plains and southern coast. Despite varying in the temporal scales, spatial resolution, and methods of calculating the K-factor and C-factor (Supplementary Section S2.1), the wind speed differs considerably in time (for example, in the black box of Figure 14, the daily wind speed in 2001 and 2006–2010 were about twice that of 2018, resulting in a significant variation in soil wind erosion rates), and there is coherence in the macroscopic pattern.
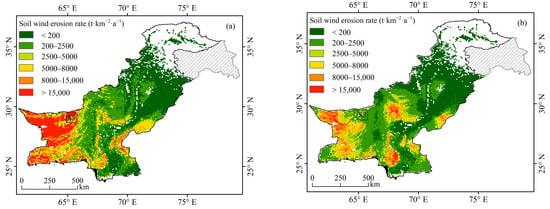
Figure 15.
Spatial comparison of the SIER between Yang et al., (2021) [20] (a) and the current study (b) for Pakistan (the sample3 (S3) with a large variation of wind speeds).
(2) By comparing the SIER for each land use type in the current study and other typical regions [49,50,69] in Table 6, it is shown that the SIER values were ranked as follows: bare land > sparse desert > cropland > forest. The SIER of each land use type in the Zhundong and Korla regions of Xinjiang, China, monitored by Ding et al., (2018) and Pu et al., (1998) over a long period of time using the 137Cs approach [70,71], were also close to the results of the current study. The results of the present research may offer a more objective perception of the SIER in Pakistan.

Table 6.
Comparison of the SIER between the current study and typical regions.
4.3. Suggestions for Improving Soil Erosion
With the presence of global warming, terrestrial hydrological cycle processes are accelerated, and extreme rainfall is more frequent [72,73,74,75]. High-intensity, short-duration precipitation events tend to be more erosive [72,76], and future research should focus more on the effect of severe rainfall events on hydraulic erosion. Simultaneously, an increased temperature will promote the evaporation of water from surface vegetation, resulting in a further decrease in soil moisture and increase in soil erodibility. Over the course of the agricultural and pastoral production of Pakistan, the population explosion, reclamation, overgrazing, illegal logging, etc., that has resulted in the decrease of forest and grassland areas and salinization of land as a result of irrigation, etc., have exacerbated the severity of soil erosion [77,78]. The Punjab and Sindh provinces are the most important agricultural regions, and it is suggested that appropriate farming plans be developed, suitable farming practices and crop rotation systems be implemented, and sloping cropland be returned to forest and grass in order to reduce soil erosion. Engineering practices should be strengthened in regions where conditions permit to improve soil water conservation projects to reduce or avoid natural disasters such as floods. To prevent the degradation of vegetation by human activity in nonagricultural regions, afforestation initiatives should be increased. Especially in the Potohar Plateau and northern mountainous regions where precipitation intensity is great, the timely diversion of precipitation runoff should be enhanced by planting soil-fixing plants or importing fast-growing alien species [18]. We must also pay attention to the LS-factor where the slope is steep, and terraces should be built; in places where the slope length is long, runoff interception should be considered. In dry and semi-arid regions, water is a critical factor for supporting vegetation growth and for preventing soil erosion; thus, the capacity for the soil to hold water must be considered while restoring vegetation [79]. Vegetation restoration and changes in land use are related to human activities, and rational SWC projects can effectively reduce the severity of soil erosion [80,81].
The Karan Desert and Thar Desert were the main wind erosion risk regions, where there were massive mobile sand dunes, and strategies for afforestation of mobile sand dunes in the proximity of human populations were required to prevent land desertification [18]. Vegetation is an important biological factor in the ecosystem; surface vegetation reduces the dynamic energy of raindrops, enhances the infiltration rate of surface runoff, and improves surface roughness, further reducing the wind erosion risk [82]. Wind erosion may be controlled by coarsening the soil surface, enhancing ground cover, or constructing wind barriers [83]. Nickling and Wolfe (1994) pointed out the idea of planting drought-tolerating plants or regenerating natural vegetation to reduce wind erosion in arid areas [84]. Sterk (2003) noted that reducing soil surface wind speed and increasing soil resistance to wind were effective methods for controlling wind erosion [85]. Zhao (2017) discovered that wind speed slowing at the soil surface was not significant when vegetation cover was under 20%, whereas vegetation cover exceeding 60% effectively stopped soil wind erosion [86]. In addition, remote sensing and GIS technology should be used for the long-term monitoring and management of vulnerable ecosystems in the arid regions of Pakistan, where wind erosion intensity is severe and requires timely attention [18].
4.4. Limitation and Future Research Prospects
The following aspects were the primary limitations of this study: (1) The density of sampling survey units was evenly distributed in Pakistan, but in the northern mountainous regions where the terrain was complex, the density of sampling survey units should be increased to reduce errors in future model predictions; (2) The soil water and wind erosion rate were compared with previous studies but not verified by field investigations. In the future, conduct field surveys as funding and time permit; future research must also consider the interaction of sand and dust storms and the climate conditions of wind erosion. (3) This study is an attempted methodology to more completely assess the soil erosion in Pakistan; it was a static analysis, and no long-term trend analysis of soil erosion rates has been conducted. (4) Multi-resolution data were used in the soil erosion rate calculations, e.g., R-factor and calcium carbonate data with a spatial resolution of 1 km, which causes some errors in the results. With the development of remote sensing and geographic information technology, higher resolution data will be available for use in the future. Soil erosion is vital to the global geochemical cycle and to agricultural production, and studying the connectivity among soil erosion and the various spheres of the earth system is a critical scientific topic that cannot be ignored in light of the future climate change scenarios.
5. Conclusions
This study made an effort to evaluate the geographical distributions of individual and composite water–wind erosion-sensitive regions to provide more useful knowledge about the status of soil erosion in Pakistan. (1) The SAER calculated using machine learning showed that the average SAER was 447.25 t·km−2·a−1 and that the soil water erosion amount was about 3.90 × 10⁸ t·a−1, with 53.89% originating from the Khyber Pakhtunkhwa and Balochistan provinces. (2) According to the RWEQ model estimates, the mean SIER was 2063.45 t·km−2·a−1, with the soil wind erosion amounting to 1.77 × 10⁹ t·a−1, and the Balochistan and Sindh provinces accounting for 93.89%. (3) The overlay map of the soil water and wind erosion rate showed three risk regions: (a) the Potohar Plateau and the surrounding mountainous cultivated regions, which are prone to soil water erosion; (b) the soil erosion rate in the Karan Desert in the southwest and in the Thar Desert in the southeast, which are dominated by soil wind erosion; (c) the soils of the Sulaiman and Kirthar Mountain Ranges were susceptible to wind–water compound erosion. Under the future global climate change scenario, the technology of the afforestation of mobile sand dunes needs to be implemented in regions with severe wind erosion to prevent wind erosion. The construction and improvement of SWC projects should be prioritized in cultivated regions with severe soil water erosion, whereas non-cultivated regions should plant soil-fixing plants or introduce fast-growing exotic species to improve soil erosion by enhancing the vegetation cover.
Supplementary Materials
The following supporting information can be downloaded at: https://www.mdpi.com/article/10.3390/rs15092404/s1, Figure S1: Soil water erosion—machine learning covariate maps: (a) rainfall erosivity factor (R), (b) soil erodibility factor (K), (c) terrain factor (LS), (d) biological practices factor (B), (e) engineering practices factor (E), and (f) tillage practices factor (T); Figure S2: WF–factor values from January to December in Pakistan; Figure S3: Soil wind erosion—RWEQ factor maps: (b) soil erosion erodibility factor (EF), (c) soil curst factor (SCF), (d) soil roughness factor (K′); Figure S4: C factor values from January to December in Pakistan; Table S1: Average soil water erosion rate for each land use type; Table S2: Soil erosion each administrative unit in Pakistan; Table S3: Statistically comparison between local scales conducted studies in Pakistan and Current study; Table S4: Comparison of soil water erosion classification in Potohar Plateau [6,19,20,21,22,23,25,49,87,88].
Author Contributions
Conceptualization, X.Y. and Q.Y.; methodology, X.Y. and H.Z.; software, X.Y., H.Z. and L.W.; investigation, C.W., G.P. and C.D.; resources, X.Y. and Q.Y.; data curation, X.Y., Q.Y. and H.Z.; writing—original draft preparation, X.Y.; writing—review and editing, X.Y., Q.Y., M.M., M.W. and S.H.; project administration, Q.Y.; research group leader, Q.Y. All authors have read and agreed to the published version of the manuscript.
Funding
This study was supported by the National Key R&D Program of China (Grant No. 2022YFF130080101, 2022YFE0115300) and CAS Strategic Priority Research Program of Chinese Academy of Sciences (Grant NO. XDA20040202).
Data Availability Statement
Not applicable.
Acknowledgments
The authors thank Muhammad Mubeen for assisting with the query dataset of the paddy rice fields of Pakistan. Thanks to Muhammad Mubeen, Mirza Waleed and Sajjad Hussain for their suggestions on revisions to the manuscript.
Conflicts of Interest
The authors declare no conflict of interest.
References
- Berthelin, J.; Valentin, C.; Munch, J.C. Soils as a Key Component of the Critical Zone:1 Functions and Services; John Wiley & Sons, Inc.: Hoboken, NJ, USA, 2018. [Google Scholar]
- Blum, W.; Schad, P. Essentials of Soil Science: Soil formation, functions, Use and Classification (WorldReference Base, WRB); Borntraeger Gebrueder: Stuttgart, Germany, 2018. [Google Scholar]
- Weil, R.R.; Brady, N.C. The Nature and Properties of Soils; Pearson Education Limited: New York, NY, USA, 2017. [Google Scholar]
- FAO. The State of Food and Agriculture 2019. Moving Forward on Food Loss and Waste Reduction; FAO: Rome, Italy, 2019. [Google Scholar]
- Montanarella, L.; Pennock, D.J.; McKenzie, N.; Badraoui, M. World’s soils are under threat. Soil 2016, 2, 79–82. [Google Scholar] [CrossRef]
- Borrelli, P.; Robinson, D.A.; Fleischer, L.R.; Lugato, E.; Ballabio, C.; Alewell, C.; Meusburger, K.; Modugno, S.; Schütt, B. An assessment of the global impact of 21st century land use change on soil erosion. Nat. Commun. 2017, 8, 2013. [Google Scholar] [CrossRef]
- Borrelli, P.; Robinson, D.A.; Panagos, P.; Ballabio, C. Land use and climate change impacts on global soil erosion by water (2015–2070). Proc. Natl. Acad. Sci. USA 2020, 117, 21994–22001. [Google Scholar] [CrossRef]
- Oldeman, L.R.; Hakkeling, R.T.A.; Sombroek, W.G. The Global Extent of Soil Degradation; ISRIC: Wageningen, The Netherlands, 1994. [Google Scholar]
- Tan, Z.; Leung, L.R.; Li, H.Y.; Cohen, S. Representing Global Soil Erosion and Sediment Flux in Earth System Models. J. Adv. Model Earth Syst. 2022, 14, e2021MS002756. [Google Scholar] [CrossRef]
- Wang, Z.; Hoffmann, T.; Six, J.; Kaplan, J.O.; Govers, G.; Doetterl, S.; Van Oost, K. Human-induced erosion has offset one-third of carbon emissions from land cover change. Nat. Clim. Chang. 2017, 7, 345–349. [Google Scholar] [CrossRef]
- Montanarella, L. Govern our soils. Nature 2015, 287, 32–33. [Google Scholar] [CrossRef]
- Li, R. Opportunities and Challengers of Basic Research on Soil and Water loss in China. Chin. J. Nat. 2008, 30, 6–11. (In Chinese) [Google Scholar]
- Fu, B.J.; Zhao, W.W.; Chen, L.D.; Zhang, Q.J. Assessment of soil erosion at large watershed scale using RUSLE and GIS: A case study in the Loess Plateau of China. Land Degrad. Dev. 2005, 16, 73–85. [Google Scholar] [CrossRef]
- Liu, B.; Yun, X.; Li, Z.; Liang, Y.; Zhang, W.; Fu, S.; Yin, S.; Wei, X.; Zhang, K.; Wang, Z.; et al. The assessment of soil loss by water erosion in China. Int. Soil Water Conserv. Res. 2020, 8, 430–439. [Google Scholar] [CrossRef]
- Yang, Q.K.; Zhu, M.Y.; Wang, C.M.; Zhang, X.P.; Liu, B.Y. Study on a soil erosion sampling survey in the Pan-Third Pole region based on higher-resolution images. Int. Soil Water Conserv. Res. 2020, 8, 440–451. [Google Scholar] [CrossRef]
- Panagos, P.; Borrelli, P.; Robinson, D.A. Tackling soil loss across Europe. Nature 2015, 526, 195. [Google Scholar] [CrossRef]
- Pimentel, D.; Burgess, M. Soil Erosion Threatens Food Production. Agric. Ecosyst. Environ. 2013, 3, 443–463. [Google Scholar] [CrossRef]
- Anjum, S.A.; Wang, L.C.; Xue, L.L.; Saleem, M.F.; Wang, G.X.; Zou, C.M. Desertification in Pakistan: Causes, impacts and management. J. Food Agric. Environ. 2010, 8, 1203–1208. [Google Scholar]
- Gilani, H.; Ahmad, A.; Younes, I.; Abbas, S. Impact assessment of land cover and land use changes on soil erosion changes (2005–2015) in Pakistan. Land Degrad. Dev. 2021, 33, 204–217. [Google Scholar] [CrossRef]
- Yang, G.C.; Sun, R.H.; Jing, Y.C.; Xiong, M.Q.; Li, J.L.; Chen, L.D. Global assessment of wind erosion based on a spatially distributed RWEQ model. Prog. Phys. Geogr. 2021, 46, 28–42. [Google Scholar] [CrossRef]
- Abuzar, M.K.; Shakir, U.; Ashraf, M.A.; Mukhtar, R.; Khan, S.; Shaista, S.; Pasha, A.R. GIS based risk modeling of soil erosion under different scenarios of land use change in Simly watershed of Pakistan. J. Himal. Earth Sci. 2018, 51, 132–143. [Google Scholar]
- Ashraf, A. Risk modeling of soil erosion under different land use and rainfall conditions in Soan river basin, sub-Himalayan region and mitigation options. Model. Earth Syst. Environ. 2020, 6, 417–428. [Google Scholar] [CrossRef]
- Ashraf, A.; Abuzar, M.K.; Ahmad, B.; Ahmad, M.M.; Hussain, Q. Modeling risk of soil erosion in high and medium rainfall zones of Pothwar Region, Pakistan. Proc. Pak. Acad. Sci. 2017, 54, 67–77. [Google Scholar]
- Nasir, A.; Uchida, K.; Ashraf, M. Estimation of Soil Erosion by Using RUSLE and GIS for Small Mountainous Watersheds in Pakistan. Pak. J. Water Resour. 2006, 10, 11–21. [Google Scholar]
- Ullah, S.; Ali, A.; Iqbal, M.; Javid, M.; Imran, M. Geospatial assessment of soil erosion intensity and sediment yield: A case study of Potohar Region, Pakistan. Environ. Earth Sci. 2018, 77, 705. [Google Scholar] [CrossRef]
- USDA. Summary Report: 2017 National Resources Inventory, Natural Resources Conservation Service, Washington, DC, and Center for Survey Statistics and Methodology; Iowa State University: Ames, IA, USA, 2020. [Google Scholar]
- Bosco, C.; de Rigo, D.; Dewitte, O.; Poesen, J.; Panagos, P. Modelling soil erosion at European scale: Towards harmonization and reproducibility. Nat. Hazards Earth Syst. Sci. 2015, 15, 225–245. [Google Scholar] [CrossRef]
- Chen, T.D.; Fakher, A.; Jiao, J.Y.; Shahzada, S.L.; An, S.S.; Muhammad, A. Investigation of Soil Erosion in Pothohar Plateau of Pakistan. Pak. J. Agric. Sci. 2021, 34, 362–371. [Google Scholar]
- Zhu, H.N.; Yang, Q.K.; Du, C.Z. Assessment of Soil Erosion in Pakistan Based on CSLE Model. J. Soil. Water Conserv. 2021, 35, 22–30. (In Chinese) [Google Scholar]
- Asian Development Bank. Climate Change Profile of Pakistan; Avenue, A.D.B.A.: Mandaluyong, Philippines, 2017. [Google Scholar]
- Hussain, M.S.; Lee, S. The regional and the seasonal variability of extreme precipitation treads in Pakistan. Asia-Pac. J. Atmos. Sci. 2013, 49, 421–441. [Google Scholar]
- Zhu, S.Z.; Huang, F.R.; Li, L.H. Drought characteristics and its risk assessment across Pakistan. Arid. Land Geogr. 2021, 44, 1058–1069. (In Chinese) [Google Scholar]
- Zhu, M.Y.; Yang, Q.K.; Wang, C.M.; Zhang, X.P. Sampling Survey Method of Regional Soil Erosion Based on Remote Images. J. Soil Water Conserv. 2019, 33, 64–71. (In Chinese) [Google Scholar]
- Yin, S.Q.; Zhu, Z.Y.; Wang, L.; Liu, B.Y.; Xie, Y.; Wang, G.N.; Li, Y.S. Regional soil erosion assessment based on a sample survey and geostatistics. Hydrol. Earth Syst. Sci. 2018, 22, 1695–1712. [Google Scholar] [CrossRef]
- Wang, X.L. Soil Erosion of Alpine Grassland Ecosystem on Sanjiangyuan Region. Ph.D. Thesis, Lanzhou University, Lanzhou, China, 2016. [Google Scholar]
- Hengl, T.; Mendes de Jesus, J.; Heuvelink, G.B.; Ruiperez Gonzalez, M.; Kempen, M. SoilGrids250m: Global gridded soil information based on machine learning. PLoS ONE 2017, 12, e0169748. [Google Scholar] [CrossRef]
- Zhang, W.B. Dataset of R-factor of Rainfall Erosivity with 1 km Resoluton in 65 Countries (1986–2015). National Tibetan Plateau Data Center. 2021. Available online: https://cstr.cn/18406.11.Soil.tpdc.271764 (accessed on 15 March 2022).
- Yin, S.Q.; Xue, Y.C.; Yue, T.Y.; Xie, Y.; Gao, G. Spatiotemporal distribution and return period of rainfall erosivity in China. Trans. Chin. Soc. Agric. Eng. 2019, 35, 105–113. (In Chinese) [Google Scholar]
- Yin, S.Q.; Zhang, W.B.; Xie, Y.; Liu, S.H.; Liu, F. Spatial distribution of rainfall erosivity in China based on high density weather station network. Soil Water Conserv. China 2013, 10, 45–51. [Google Scholar]
- Liu, B.Y.; Guo, S.Y.; Li, Z.G.; Xie, Y.; Zhang, K.L.; Liu, X.C. Sampling program of water erosion inventory in China. Soil Water Conserv. China 2013, 10, 26–34. [Google Scholar]
- Yang, Q.K. Soil Erodibility Dataset of Pan-Third Pole 20 countries (2020, with a Resolution of 7.5 Arc Second). National Tibetan Plateau Data Center. 2021. Available online: https://cstr.cn/18406.11.Terre.tpdc.271863 (accessed on 3 February 2022).
- Yang, M.M.; Yang, Q.K.; Zhang, K.L.; Wang, C.M.; Pang, G.W.; Li, Y.R. Effects of Soil Rock Fragment Content on the USLE-K Factor Estimating and Its Influencing Factors. ISWCR 2022, 11, 263–275. [Google Scholar]
- Baillie, I. Soil Survey Staff 1999, Soil Taxonomy: A Basic System of Soil Classification for Making and Interpreting Soil Surveys, Agricultural Handbook 436, Natural Resources Conservation Service; USDA: Washington, DC, USA, 2001; p. 869. [Google Scholar]
- Yang, Q.K.; Guo, M.H.; Li, Z.G.; Wang, C.M. Topographic factor of soil erosion in China: Extraction and preliminary analysis. Soil Water Conserv. China 2013, 379, 17–21. (In Chinese) [Google Scholar]
- Zhang, H.M.; Yang, Q.K.; Li, R.; Liu, Q.R.; Moore, D.; He, P.; Ritsema, C.J.; Geissen, V. Extension of a GIS procedure for calculating the RUSLE equation LS factor. Comput. Geosci. 2013, 52, 177–188. [Google Scholar] [CrossRef]
- Brychta, J.; Brychtova, M. Possibilities of including surface runoff barriers in the slope-length factor calculation in the GIS environment and its integration in the user-friendly LS-RUSLE tool. Soil Water Res. 2020, 15, 246–257. [Google Scholar] [CrossRef]
- Waleed, M.; Mubeen, M.; Ahmad, A.; Habib-Ur-Rahman, M.; Amin, A.; Farid, H.U.; Hussain, S.; Ali, M.; Qaisrani, S.A.; Nasim, W.; et al. Evaluating the efficiency of coarser to finer resolution multispectral satellites in mapping paddy rice fields using GEE implementation. Sci. Rep. 2022, 12, 13210. [Google Scholar] [CrossRef]
- Borrelli, P.; Lugato, E.; Montanarella, L.; Panagos, P. A new assessment of soil loss due to wind erosion in European agricultural soils using a quantitative spatially distributed modelling approach. Land Degrad. Dev. 2016, 28, 335–344. [Google Scholar] [CrossRef]
- Li, J.; Ma, X.; Zhang, C. Predicting the spatiotemporal variation in soil wind erosion across Central Asia in response to climate change in the 21st century. Sci. Total Environ. 2020, 709, 136060. [Google Scholar] [CrossRef]
- Teng, Y.M.; Zhan, J.Y.; Liu, W.; Sun, Y.X. Spatiotemporal dynamics and drivers of wind erosion on the Qinghai-Tibet Plateau, China. Ecol. Indic. 2021, 123, 107340. [Google Scholar] [CrossRef]
- Fryrear, D.W.; Bilbro, J.D.; Saleh, A. RWEQ: Improved wind erosion technology. J. Soil Water Conserv. 2000, 55, 183–189. [Google Scholar]
- Fryrear, D.W.; Saleh, A.; Bilbro, J.D.; Schomberg, H.M.; Stout, J.E.; Zobeck, T.M. Revised Wind Erosion Equation; Technical Bulletin 1; Southern Plains Area Cropping Systems Research Laboratory, Wind Erosion and Water Conservation Research Unit, USDA-ARS: Washington, DC, USA, 1998. [Google Scholar]
- Skidmore, E.L.; Tatarko, J. Stochastic wind simulation for erosion modeling. Trans. ASAE 1990, 33, 1893–1899. [Google Scholar] [CrossRef]
- Bilbro, J.D.; Fryrear, D.W. Wind Erosion Losses as Related to Plant Silhouette and Soil Cover. Agron. J. 1994, 86, 550–553. [Google Scholar] [CrossRef]
- Borrelli, P.; Panagos, P.; Lugato, E.; Alewell, C.; Ballabio, C.; Montanarella, L.; Robinson, D.A. Lateral carbon transfer from erosion in noncroplands matters. Glob. Change Biol. 2018, 24, 3283–3284. [Google Scholar] [CrossRef]
- George, P. European Commission community research: Wind erosion on agricultural land in Europe—Research results for land managers. Geogr. J. 2004, 170, 525–545. [Google Scholar]
- Visser, S.M.; Sterk, G. Nurient dynamics-wind and water erosion at the village scale in the Sahel. Land Degrad. Dev. 2007, 18, 578–588. [Google Scholar] [CrossRef]
- Fenta, A.A.; Tsunekawa, A.; Haregeweyn, N.; Poesen, J.; Tsubo, M.; Borrelli, P.; Panagos, P.; Vanmaercke, M.; Broeckx, J.; Yasuda, H.; et al. Land susceptibility to water and wind erosion risks in the East Africa region. Sci.Total Environ. 2020, 703, 135016. [Google Scholar] [CrossRef]
- Lin, D.G.; Shi, P.J.; Meadows, M.; Yang, H.M.; Wang, J.A.; Zhang, G.F.; Hu, Z.H. Measuring Compound Soil Erosion by Wind and Water in the Eastern Agro–Pastoral Ecotone of Northern China. Sustainability 2022, 14, 6272. [Google Scholar] [CrossRef]
- Poesen, J. Soil erosion in the Anthropocene: Research needs. Earth Surf. Process. Landf. 2018, 43, 64–84. [Google Scholar] [CrossRef]
- Zhang, J.Q.; Liu, Z.; Yang, M.Y.; Zhang, F.B.; Wang, Y.J.; Deng, X.X. Soil erosion and its influence factors an a slope in the wind-water erosion crisscross region on the loess plateau. Res. Soil Water Conserv. 2018, 25, 1–22. (In Chinese) [Google Scholar]
- Zhang, P.; Yao, W.Y.; Liu, G.B.; Xiao, P.Q. Dynamic characteristics of complex erosion in a typical small watershed of soft sandstone area. J. Hydraul. Eng. 2019, 50, 1384–1391. (In Chinese) [Google Scholar]
- Zhang, P.; Yao, W.Y.; Xiao, P.Q.; Liu, G.B.; Yang, C.X. Interactive superposition effect of multi-dynamic erosion in the Pisha sandstone area of the Yellow River basin. J. Hydraul. Eng. 2022, 53, 109–116. (In Chinese) [Google Scholar]
- Tuo, D.F.; Xu, M.X.; Gao, G.Y. Relative contributions of wind and water erosion to total soil loss and its effect on soil properties in sloping croplands of the Chinese Loess Plateau. Sci. Total Environ. 2018, 633, 1032–1040. [Google Scholar] [CrossRef] [PubMed]
- Zhang, G.F.; Cesar, A.M.; Shi, P.J.; Lin, D.G. Impact of near-surface wind speed variability on wind erosion in the eastern agro-pastoral transitional zone of Northern China, 1982–2016. Agric. For. Meteorol. 2019, 271, 102–115. [Google Scholar] [CrossRef]
- Sharratt, B.S.; Tatarko, J.; Abatzoglou, J.T.; Fox, F.A.; Huggins, D. Implications of climate change on wind erosion of agricultural lands in the Columbia plateau. Weather Clim. Extrem. 2015, 10, 20–31. [Google Scholar] [CrossRef]
- Montgomery, D.R. Soil erosion and agricultural sustainability. Proc. Natl. Acad. Sci. USA 2007, 104, 13268–13272. [Google Scholar] [CrossRef]
- Wischmeier, W.H.; Smith, D.D. Predicting Rainfall Erosion Losses: A Guide to Conservation Planning; Science and Education Administration U.S. Dept. of Agriculture: Washington, DC, USA, 1978. [Google Scholar]
- Gong, G.L.; Liu, J.Y.; Shao, Q.Q. Wind erosion in Xilingol League, Inner Mongolia since the 1990s using the Revised Wind Erosion Equation. Prog. Geogr. 2014, 33, 825–834. (In Chinese) [Google Scholar]
- Ding, Z.; Wang, J.; Xu, P.; Cao, Y.; Yang, J. Using 137 Cs technique to study soil wind erosion of different land use types in eastern Junggar Basin, Xinjiang. Soil 2018, 50, 398–403. [Google Scholar]
- Pu, L.J.; Bao, H.S.; Peng, B.Z.; Higgitt, D.L. Preliminary study on the potential of using 137CS to estimate soil erosion rates in wind eroded area, China: Case study on the koral area. Acta Pedol. Sin. 1998, 35, 441–449. (In Chinese) [Google Scholar]
- Liu, S.Y.; Huang, S.Z.; Xie, Y.Y.; Leng, G.Y.; Huang, Q.; Wang, L.; Xue, Q. Spatial-temporal changes of rainfall erosivity in loess plateau, China: Changing patterns, causes and implications. Catena 2018, 166, 279–289. [Google Scholar] [CrossRef]
- Trenberth, K.E. Changes in precipitation with climate change. Clim. Res. 2011, 47, 123–128. [Google Scholar] [CrossRef]
- IPCC. Summary for Policymakers. In Climate Change 2013: The Physical Science Basis—Contribution of Working Group I to the Fifth Assessment Report of the Intergovernmental Panel on Climate Change; Stocker, T.F., Qin, D., Plattner, G.K., Tignor, M., Allen, S.K., Boschung, J., Nauels, A., Xia, Y., Bex, V., Midgley, P.M.E., Eds.; Cambridge University Press: Cambridge, MA, USA, 2013; pp. 1–30. [Google Scholar]
- Santos, C.A.C.D.; Neale, C.M.U.; Rao, T.V.R.; Silva, B.B. Trends in indices for extremes in daily temperature and precipitation over Utah, USA. Int. J. Climatol. 2011, 31, 1813–1822. [Google Scholar] [CrossRef]
- Wei, W.; Chen, L.; Fu, B.; Huang, Z.; Wu, D.; Gui, L. The effect of land uses and rainfall regimes on runoff and soil erosion in the semi-arid loess hilly area, China. J. Hydrol. 2007, 335, 247–258. [Google Scholar] [CrossRef]
- Khan, F.K. Pakistan: Geography, Economy and People; Oxford University Press: Oxford, UK, 2015. [Google Scholar]
- Irshad, M.; Inoue, M.; Faridullah, A.M.; Delower, H.K.M.; Tsunekawa, A. Land desertification: An emerging threat to environment and food security of Pakistan. J. Appl. Sci. 2007, 7, 1199–1205. [Google Scholar] [CrossRef]
- Jiang, C.; Zhang, H.Y.; Zhang, Z.D.; Wang, D.W. Model-based assessment soil loss by wind and water erosion in China’s Loess Plateau: Dynamic change, conservation effectiveness, and strategies for sustainable restoration. Glob. Planet Change 2019, 172, 396–413. [Google Scholar] [CrossRef]
- Hussain, S.; Hussain, S.; Mubeen, M.; Akram, W.; Ahmad, A.; Farid, H.U. Study of land use/land cover changes using RS and GIS: A case study of Multan district, Pakistan. Environmental Monitoring and Assessment. Environ. Monit. Assess. 2019, 192, 2. [Google Scholar] [CrossRef]
- Hussain, S.; Mubeen, M.; Ahmad, A.; Akram, W.; Hammad, H.M.; Ali, M.; Masood, N.; Amin, A.; Farid, H.U.; Sultana, S.R.; et al. Using GIS tools to detect the land use/land cover changes during forty years in Lodhran District of Pakistan. Environ. Sci. Pollut. Res. Int. 2019, 27, 39676–39692. [Google Scholar] [CrossRef]
- Sterk, G.; Herrmann, L.; Bationo, A. Wind-blown nutrient transport and soil productivity changes in southwest Niger. Land Degrad. Dev. 1996, 7, 325–335. [Google Scholar] [CrossRef]
- Tibke, G. Basic principles of wind erosion control. Agric. Ecosyst. Environ. 1988, 22, 103–122. [Google Scholar] [CrossRef]
- Nickling, W.G.; Wolfe, S.A. The morphology and origin of Nabkhas, region of Mopti, Mali. West Africa. J. Arid. Environ. 1994, 28, 13–30. [Google Scholar] [CrossRef]
- Sterk, G. Causes, consequences and control of wind erosion in Sahelian Africa: A review. Land Degrad. Dev. 2003, 14, 95–108. [Google Scholar] [CrossRef]
- Zhao, Y.Y.; Wu, J.G.; He, C.Y.; Ding, G.D. Linking wind erosion to ecosystem services in drylands: A landscape ecological approach. Landsc. Ecol. 2017, 32, 2399–2417. [Google Scholar] [CrossRef]
- Duan, X.W.; Bai, Z.W.; Rong, L.; Li, Y.B.; Ding, J.H.; Tao, Y.Q.; Li, J.X.; Li, J.S.; Wang, W. Investigation method for regional soil erosion based on the Chinese Soil Loss Equation and high-resolution spatial data: Case study on the mountainous Yunnan Province, China. Catena 2020, 184, 104237. [Google Scholar] [CrossRef]
- Tiruwa, D.B.; Khanal, B.R.; Lamichhane, S.; Acharya, B.S. Soil erosion estimation using Geographic Information System (GIS) and Revised Universal Soil Loss Equation (RUSLE) in the Siwalik Hills of Nawalparasi, Nepal. J. Water Clim. Chang. 2021, 12, 1958–1974. [Google Scholar] [CrossRef]
Disclaimer/Publisher’s Note: The statements, opinions and data contained in all publications are solely those of the individual author(s) and contributor(s) and not of MDPI and/or the editor(s). MDPI and/or the editor(s) disclaim responsibility for any injury to people or property resulting from any ideas, methods, instructions or products referred to in the content. |
© 2023 by the authors. Licensee MDPI, Basel, Switzerland. This article is an open access article distributed under the terms and conditions of the Creative Commons Attribution (CC BY) license (https://creativecommons.org/licenses/by/4.0/).