Article

Evaluating Atmospheric Correction Methods for Sentinel−2 in Low−to−High−Turbidity Chinese Coastal Waters

1
State Key Laboratory of Satellite Ocean Environment Dynamics, Second Institute of Oceanography, Ministry of Natural Resources, Hangzhou 310012, China
2
Donghai Laboratory, Zhoushan 316021, China
3
College of Electronic and Information Engineering, Guangdong Ocean University, Zhanjiang 524088, China
*
Author to whom correspondence should be addressed.
Remote Sens. 2023, 15(9), 2353; https://doi.org/10.3390/rs15092353
Submission received: 25 February 2023 / Revised: 20 April 2023 / Accepted: 24 April 2023 / Published: 29 April 2023
(This article belongs to the Section Ocean Remote Sensing)

Abstract

:
Inaccuracies in the atmospheric correction (AC) of data on coastal waters significantly limit the ability to quantify the parameters of water quality. Many studies have compared the effects of the atmospheric correction of data provided by the Sentinel−2 satellites, but few have investigated this issue for coastal waters in China owing to a limited amount of in situ spectral data. The authors of this study compared four processors for the atmospheric correction of data provided by Sentinel−2—the Atmospheric Correction for OLI ‘lite’(ACOLITE), Sea-viewing Wide Field-of-view Sensor (SeaWiFS) Data Analysis System (SeaDAS), Polynomial-based algorithm applied to MERIS (POLYMER), and Case 2 Regional Coast Colour (C2RCC)—to identify the most suitable one for water bodies with different turbidities along the coast of China. We tested the algorithms used in these processors for turbid waters and compared the resulting inversion of the remote sensing reflectance (Rrs) using in situ reflectance data from three stations with varying levels of coastal turbidity (HTYZ, DONG’OU, and MUPING). All processors significantly underestimated the results on data from the HTYZ station, which is located along waters with high turbidity, with the SeaDAS delivering the best performance, with an average band R M S E of 0.0146 and an average M A P E of 29.80%. It was followed by ACOLITE, with an average band R M S E of 0.0213 and an average M A P E of 43.43%. The performance of two AC algorithms used in ACOLITE, dark spectrum fitting (DSF) and exponential extrapolation (EXP), was also evaluated by comparing their results with in situ measurements at the HTYZ site. The ACOLITE-EXP algorithm delivered a slight improvement in results for the blue band compared with the DSF algorithm in highly turbid water, but led to no significant improvement in the green and red bands. C2RCC delivered the best performance on data from the DONG’OU station, which is located along water with medium turbidity, and from the MUPING station (water with low turbidity), with values of the M A P E of 18.58% and 28.41%, respectively.

Graphical Abstract

1. Introduction

Most of the signals received by satellite sensors represent the scattering of atmospheric molecules and aerosols, with only about 10% of the recorded total radiance (Lt) due to water bodies [1,2,3]. The process of atmospheric correction (AC) aims to derive the water-leaving radiance (Lw) by removing the impact of non-water elements present in Lt, including atmospheric scattering, reflected light from the sky, and signals of sun-glint formed due to the air–water interface [4]. The accuracy of atmospheric correction must be established before satellite imagery can be used to obtain reliable quantitative information on water quality [2].
The first step in the process of atmospheric correction is Rayleigh correction based on a look-up table (LUT) [5,6]. The density and type of aerosols are then determined through various correction algorithms. For instance, NASA’s standard algorithm uses the “black pixel” assumption in the near-infrared (NIR) band [3,7]. However, this approach is inapplicable to near-shore turbid waters, where increased water-leaving reflectance in the NIR band due to the backscattering of particles invalidates the black pixel assumption [8,9]. Moore et al. introduced the bright pixel algorithm (BPAC) to assess the contribution of total suspended matter (TSM) to remote sensing reflectance in turbid waters by using MERIS satellite imagery [10]. The NIR-SWIR algorithm combines the standard NIR algorithm for clean pixels with the SWIR algorithm for pixels representing turbid water in images, and extends the definition of dark pixels from the NIR band to the short-wave infrared (SWIR) band [11,12,13,14,15]. Atmospheric correction algorithms that use short-wave infrared bands have been found to be effective for extremely turbid waters. Bands with central wavelengths of around 1.6 nm and 2.2 nm can be selected for Sentinel−2 and Landsat-8 [15,16,17,18]. Some atmospheric correction algorithms also use the ultraviolet (UV) band [19,20] and baseline residuals (BLRs) through three pairs of spectrally dense bands to separate the contributions of signals of aerosol and water [21]. These methods are designed for use with ocean color satellite sensors with a high spectral resolution, but low spatial resolution, such as the Moderate Resolution Imaging Spectroradiometer (MODIS), Medium-Resolution Imaging Spectrometer (MERIS), and Sea-viewing Wide Field-of-view Sensor (SeaWiFS). The use of satellites with a high spatial resolution, such as Landsat-8 and Sentinel−2, to monitor water quality at small spatial scales has led to the proposal of new methods for atmospheric correction. However, applying prevalent algorithms to data from high-resolution satellites encounters challenges due to such issues as the poor quality of data from SWIR bands [22] and the absence of UV bands, as well as the need to account for mixed sea–land pixels and the effects of adjacency in coastal waters [23]. Many new or improved methods have been proposed for the atmospheric correction of meter-scale satellites. For example, Vanhellemont et al. introduced the dark-spectrum fit (DSF) method and used the exponential extrapolation (EXP) method based on SWIR for the atmospheric correction of data on turbid water [24,25]. These two methods have been integrated into the publicly available atmospheric processor Atmospheric Correction for OLI ‘lite’(ACOLITE). Ruddick et al. improved the atmospheric correction of data on highly turbid water by using the SWIR band and an improved MUMM algorithm developed in the Sea-viewing Wide Field-of-view Sensor (SeaWiFS) Data Analysis System (SeaDAS) [26]. The Image Correction for Atmospheric Effects (iCOR) AC processor, developed by De Keukelaere et al., applied SIMilarity Environmental Correction (SIMEC) to correct the adjacency effect, and is well suited to images containing pixels representing both land and sea [27]. The Polynomial-based algorithm applied to MERIS (POLYMER) for spectral optimization uses a polynomial function to model atmospheric reflectance, and can be used in regions contaminated by sun-glint [28,29]. Wang et al. proposed an innovative multi-pixel atmospheric correction approach (MPACA) based on a revised POLYMER model [30]. Furthermore, machine-learning-based AC processors, such as Case 2 Regional Coast Colour (C2RCC), Case 2 Regional Coast Colour for Complex waters (C2X) [31], and the Ocean Color-Simultaneous Marine and Aerosol Retrieval Tool (OC-SMART) [32,33], have been developed to handle the complex atmospheric conditions of coastal waters.
Several studies have evaluated the performance of various AC processors, including those by Pahlevan, Novoa, Martins, Warren, Bui, and Renosh [22,34,35,36,37,38]. Spectral data obtained from observations during voyages or automatic observation stations, such as AERONET-OC, are typically used for validation purposes. However, only 32 AERONET-OC stations had been established worldwide by the end of 2020, and they covered only limited parts of Chinese coastal waters [39]. In this study, we analyze the spectral characteristics of three recently established stations for spectral coastal observations in China. These are the HTYZ station, established by the Second Institute of Oceanography of the Ministry of Natural Resources (SIO, MNR), in the turbid Hangzhou Bay (HZB), and the DONG’OU and MUPING stations, established by the National Satellite Ocean Application Service (NSOAS), in the East China Sea and the Yellow Sea, respectively. The aim is to evaluate the performance of four atmospheric correction algorithms—ACOLITE, SeaDAS, POLYMER, and C2RCC—on images of water bodies with different turbidities acquired by the Sentinel−2 satellite. The remainder of this article is organized as follows. We introduce the in situ data used for this study in Section 2, followed by a comprehensive overview of the AC processors tested and the matchup criteria. Section 3 details a quantitative comparison of the results of atmospheric correction with field measurements of the Rrs. Section 4 summarizes the conclusions of this study.

2. Data and Method

2.1. Study Sites

The research sites were located in three areas with turbid waters along the coast of China. The stations, in decreasing order of the turbidity of waters along which they were located, were HTYZ in Hangzhou Bay (HZB), DONG’OU in the East China Sea, and MUPING in the Yellow Sea (see Figure 1). HZB is located on the periphery of the Qiantang River estuary, which is the largest estuary along the east coast of China [40]. The Bay has a typical funnel shape, with a width of about 100 km at the entrance that decreases to 20 km around 90 km westward [41]. The average depth of water is about 10 m, and the topography of the seabed is relatively flat, rising from east to west, with a gradient of about 0.06 m/km. The special shape of the estuary causes the height of the tide to increase when it propagates upstream. HZB is one of the largest macro-tidal embayments in the world. The tidal height at the mouth is about 3–4 m and increases upstream to 4–6 m, with a maximum height of 8.93 m [42,43]. There is a high concentration of TSM in HZB, up to 5000 mg/L, owing to the substantial input of suspended sediment from the Yangtze River in the north and the resuspension of bottom sediments caused by strong tides [44].
The DONG’OU and MUPING sites, situated in the East China Sea and the Yellow Sea, respectively, are significantly influenced by river inflows and seasonal monsoons [39,44,45], resulting in significant seasonal variations in the TSM in them. The MUPING site, for instance, exhibits higher turbidity in winter (46.61 NTU) than in summer (0.98 NTU), as evidenced by data collected by NSOAS. The DONG’OU site is influenced by the input of sediment from the Yangtze River (about 4.8 × 10⁸ tons/year), which results in the formation of a turbid plume that extends to the center of the East China Sea [45]. The concentration of TSM in the coastal waters is about 100 mg/L [46]. The two sites have their highest water transmittance values in the 560 nm band, with the coefficient of water attenuation of the DONG’OU site at approximately 0.6 m−1 and that of the MUPING site at 0.2 m−1. The turbidity of the water at the DONG’OU site is higher than that at the MUPING site [39].

2.2. In Situ Data

2.2.1. In Situ Rrs Data from Sites

In situ spectral data for the HTYZ site were collected by using a high-frequency automatic spectral observation system set on the tower of the HZB Bridge (121.1251°E, 30.4627°N). The system began stable operation in 2019 and contained two hyperspectral radiance sensors and one irradiance sensor (Trios RAMSES) that measured the upward radiance on the sea surface ( L w a t e r ), downward sky radiance ( L s k y ), and downward irradiance ( E d ), respectively. The azimuth of the two radiance sensors was about 139.64° (with reference to the north), and 1 sensor had a zenith angle of 40° toward the sky, while the other had that of 140° pointing to the surface of water. The HTYZ site was set on the platform of the middle tower of the HZB bridge. Influenced by the runoff from the Qiantang River and tides, the TSM of the water at this site reached 5000 mg/L, and there were large changes in their turbidity. The daily change in its concentration was as high as 1000 mg/L [43,44]. Data were acquired at the site from 07:00 a.m. to 17:00 p.m. (UTC + 8) at a temporal resolution of 15 min. The spectral domain was in the range of 320 nm to 950 nm, and the obtained spectral data were calculated in terms of Rrs, as shown in Equation (1) [47]:
Rrs   = L w a t e r ρ × L sky E s
ρ is the coefficient of the sea surface reflection that was set as a constant at 0.028 [47,48], L w a t e r is the upward radiance on the surface of the water, L s k y is the downward radiance of the sky, and E s is the downward irradiance. The Rrs data obtained were then subjected to automatic quality control by using the process reported by Zibordi et al. and Dai et al. [48,49]. It included (i) removing the abnormal low-value spectrum and the influence of the shadow of the tower; (ii) calculating the coefficient of solar-glint [50] and removing data with values greater than 0.005; and (iii) calculating the atmospheric transmittance, removing data with low transmittance, and avoiding the influence of clouds [47]. We used hyperspectral data collected at the site from January 2019 to February 2022. The site’s operation and maintenance logs showed that no data were collected from the end of August to the end of December in 2021.
Data for the MUPING and DONG’OU sites were taken from records of the National Satellite Ocean Application Service (NSOAS). The MUPING site was situated along the coast of Shandong, in the Yellow Sea, on a fixed experimental platform (121.696955°E, 37.684371°N), while the DONG’OU site was located on a fixed platform in the East China Sea (121.358356°E, 27.674966°N). Both sites were farther than 22 km from the shoreline in waters deeper than 18 m. The multispectral data collected by SeaPRISM at both sites exhibited central band wavelengths at 400, 412, 442, 490, 510, 560, 620, 667, 779, 865, and 1020 nm. The AERONET Version 3 algorithm for processing radiometer data was used to screen clouds and control data anomalies. The measurement plan at each site involved acquiring data every 15 min from 7 a.m. to 5 p.m. local time (UTC + 8). The spectral data for the MUPING site were obtained from 3 RAMSES hyperspectral radiometers, with spectral ranges of 330 nm to 900 nm at an interval of 1 nm. The measurement plan for this equipment involved acquiring data every 30 min from 8 a.m. to 6 p.m. local time (UTC + 8). We used the Rrs data from the site, and the calculation is as follows [49]:
R r s λ , θ , φ = L T λ , θ , φ ρ λ , θ 0 , φ , W L i λ , θ , φ E s λ
λ represents the wavelength, while LT and Li denote the total radiation from the water and the sky, respectively, as measured by the radiometer. ES is the downward irradiance on the sea surface, with θ and θ′ representing the zenith observation angles of the two radiometers. φ refers to the relative azimuth angle. The difference between Equations (1) and (2) is that the coefficient of the sea surface reflection, ρ , is dependent on the wind speed and the solar zenith angle, which can be obtained in turn through the interpolation of look-up tables for various observational geometries and wind speeds, as described in Refs. [39,51]. The standards of quality control for the study site require that there be no missing data, the observation angle be within the optimal range, and the wind speed not exceed 15 m/s [39]. The time frame for the spectral data used in the study was from January 2020 to December 2021 for the MUPING site, and from January 2020 to October 2022 for the DONG’OU site.

2.2.2. Evaluating In Situ Spectral Data by Quality Assurance System (QAS)

We quantitatively assessed the quality of the hyperspectral data by using the quality assurance system (QAS) proposed by Wei and Lee [52]. The QAS consists of four steps. (1) We convolved the hyperspectral Rrs spectrum obtained from field measurements to the corresponding Rrs data at the four visible bands of Sentinel−2 by using the spectral response function of the multispectral instrument (MSI). We selected the four closest bands between the MSI and the reference bands (412, 443, 488, 510, 531, 547, 555, 667, and 678 nm) and used the four bands of 443, 490, 560, and 665 nm for scoring. The subsequent steps were the (2) renormalization of the four selected bands based on the values of the Rrs of 23 reference spectra of water, (3) calculation of the cosine of the spectral angle to classify the calculated spectrum into a specific type of water, and (4) determination of the final score by summing the scores of the bands and dividing them by the number of bands. The closer the score was to one, the higher was the quality of the hyperspectral data.

2.3. Satellite Data

The L1C data of Sentinel−2 subjected to atmospheric correction were obtained from the ESA Scientific Data Center. The MSI onboard the Sentinel−2 satellite is capable of measuring the reflected solar spectrum in 13 bands, ranging from visible to short-wave infrared [22]. The Sentinel−2 system comprises two satellites, Sentinel−2A and Sentinel−2B, that work together to provide a five-day revisit cycle in both inland and coastal regions. The spatial resolutions of Sentinel−2A and Sentinel−2B are 10 m, 20 m, and 60 m.
We analyzed the three stations that fell within the range of coverage of the Sentinel−2 satellite. The orbital and map numbers of the stations are presented in Table 1.

2.4. Atmospheric Correction Processors

The objective of atmospheric correction is to transform the measured top-of-atmosphere radiance reflectance, ρ t ( ρ t = π L t F 0 · C o s θ s ), into the water-leaving radiance reflectance at sea level, pw. The total reflectance received at the top of the atmosphere can be calculated by using Equation (3) [1]:
ρ t λ = ρ r λ + ρ a λ + ρ r a λ + t λ ρ w λ
where ρ r λ represents the reflectance of Rayleigh scattering; ρ a λ represents the scattering reflectance of aerosol; ρ r a λ represents multiple Rayleigh–aerosol scattering reflectances; and t λ represents the diffuse transmittance of the atmosphere, while ignoring the effects of sun-glint and whitecaps on the sea surface, as well as at adjacent pixels. The component of Rayleigh scattering, ρ r λ , can be accurately calculated through a Rayleigh look-up table. However, the components of aerosol, ρ a λ , and ρ r a λ are challenging to accurately calculate, and errors in them lead to large errors in the calculated reflectance of the water [1].
The atmospheric correction processors can be categorized into two types based on the mechanisms of their algorithms [4]: the two-step method and the machine learning method. The two-step method removes the influence of Rayleigh scattering and then estimates the contribution of aerosols, while the machine learning method uses a multilayer perceptron neural network trained on extensive simulation data to establish a model of correction. We selected four AC processors that used different atmospheric correction algorithms: ACOLITE, SeaDAS, POLYMER, and C2RCC. The versions and other information of the atmospheric correction processors are shown in Table 2. ACOLITE contains two algorithms, DSF and EXP. DSF is an improved version of the traditional terrestrial AC algorithm [53] and divides the entire image into several 6 × 6 km tiles to estimate the optical thickness of aerosol from the darkest pixel in each tile, while assuming homogeneous atmospheric properties within the tile. EXP is an improved version of the traditional ocean AC algorithm [3] and defaults to using two SWIR bands for the atmospheric correction of S2 and L8, by assuming that signals from the SWIR bands are all from the atmosphere. It uses exponential extrapolation to calculate the contribution of aerosol in a pixel-by-pixel manner [24]. The SeaDAS AC processor employs the l2 gen module for atmospheric correction of Sentinel−2 data, offering a range of atmospheric correction algorithms [54]. At the DONG’OU and MUPING sites, we chose the NASA-standard iterative NIR AC algorithm [55], which utilizes a pair of NIR/SWIR bands and an iterative bio-optical modeling scheme, providing highly accurate estimation of atmospheric transmittance and aerosol reflectance. However, due to its limited application in highly turbid water, the MUMM algorithm, a refined method specifically designed for turbid coastal waters, was employed for the HTYZ station. The MUMM algorithm assumes consistent ratios of reflectance at 765 and 865 nm for both aerosol and water leaving reflectance, and uses them as parameters for calibration [56]. The POLYMER algorithm applies a second-order polynomial fit to data on ρ r c to simultaneously correct for the effects of aerosol and sun-glint [28,29]. C2RCC is a machine-learning-based AC model that includes c2rcc-Nets and c2x-Nets [31]. The difference between them is that c2x contains additional training data for complex water bodies that are not covered by c2rcc. Because only the water body at the HTYZ station was within the range of extreme turbidity in this study, we used the c2x network for HTYZ and c2rcc for the other two stations.
The four atmospheric correction algorithms were chosen based on four criteria: (i) the availability of a complete AC workflow applicable to satellites with meter-level resolution, such as Sentinel−2 and Landsat-8; (ii) widespread use and adequate research support; (iii) the inclusion of different AC algorithms; and (iv) open-source code.

2.5. Data Filtering and Matching Methods

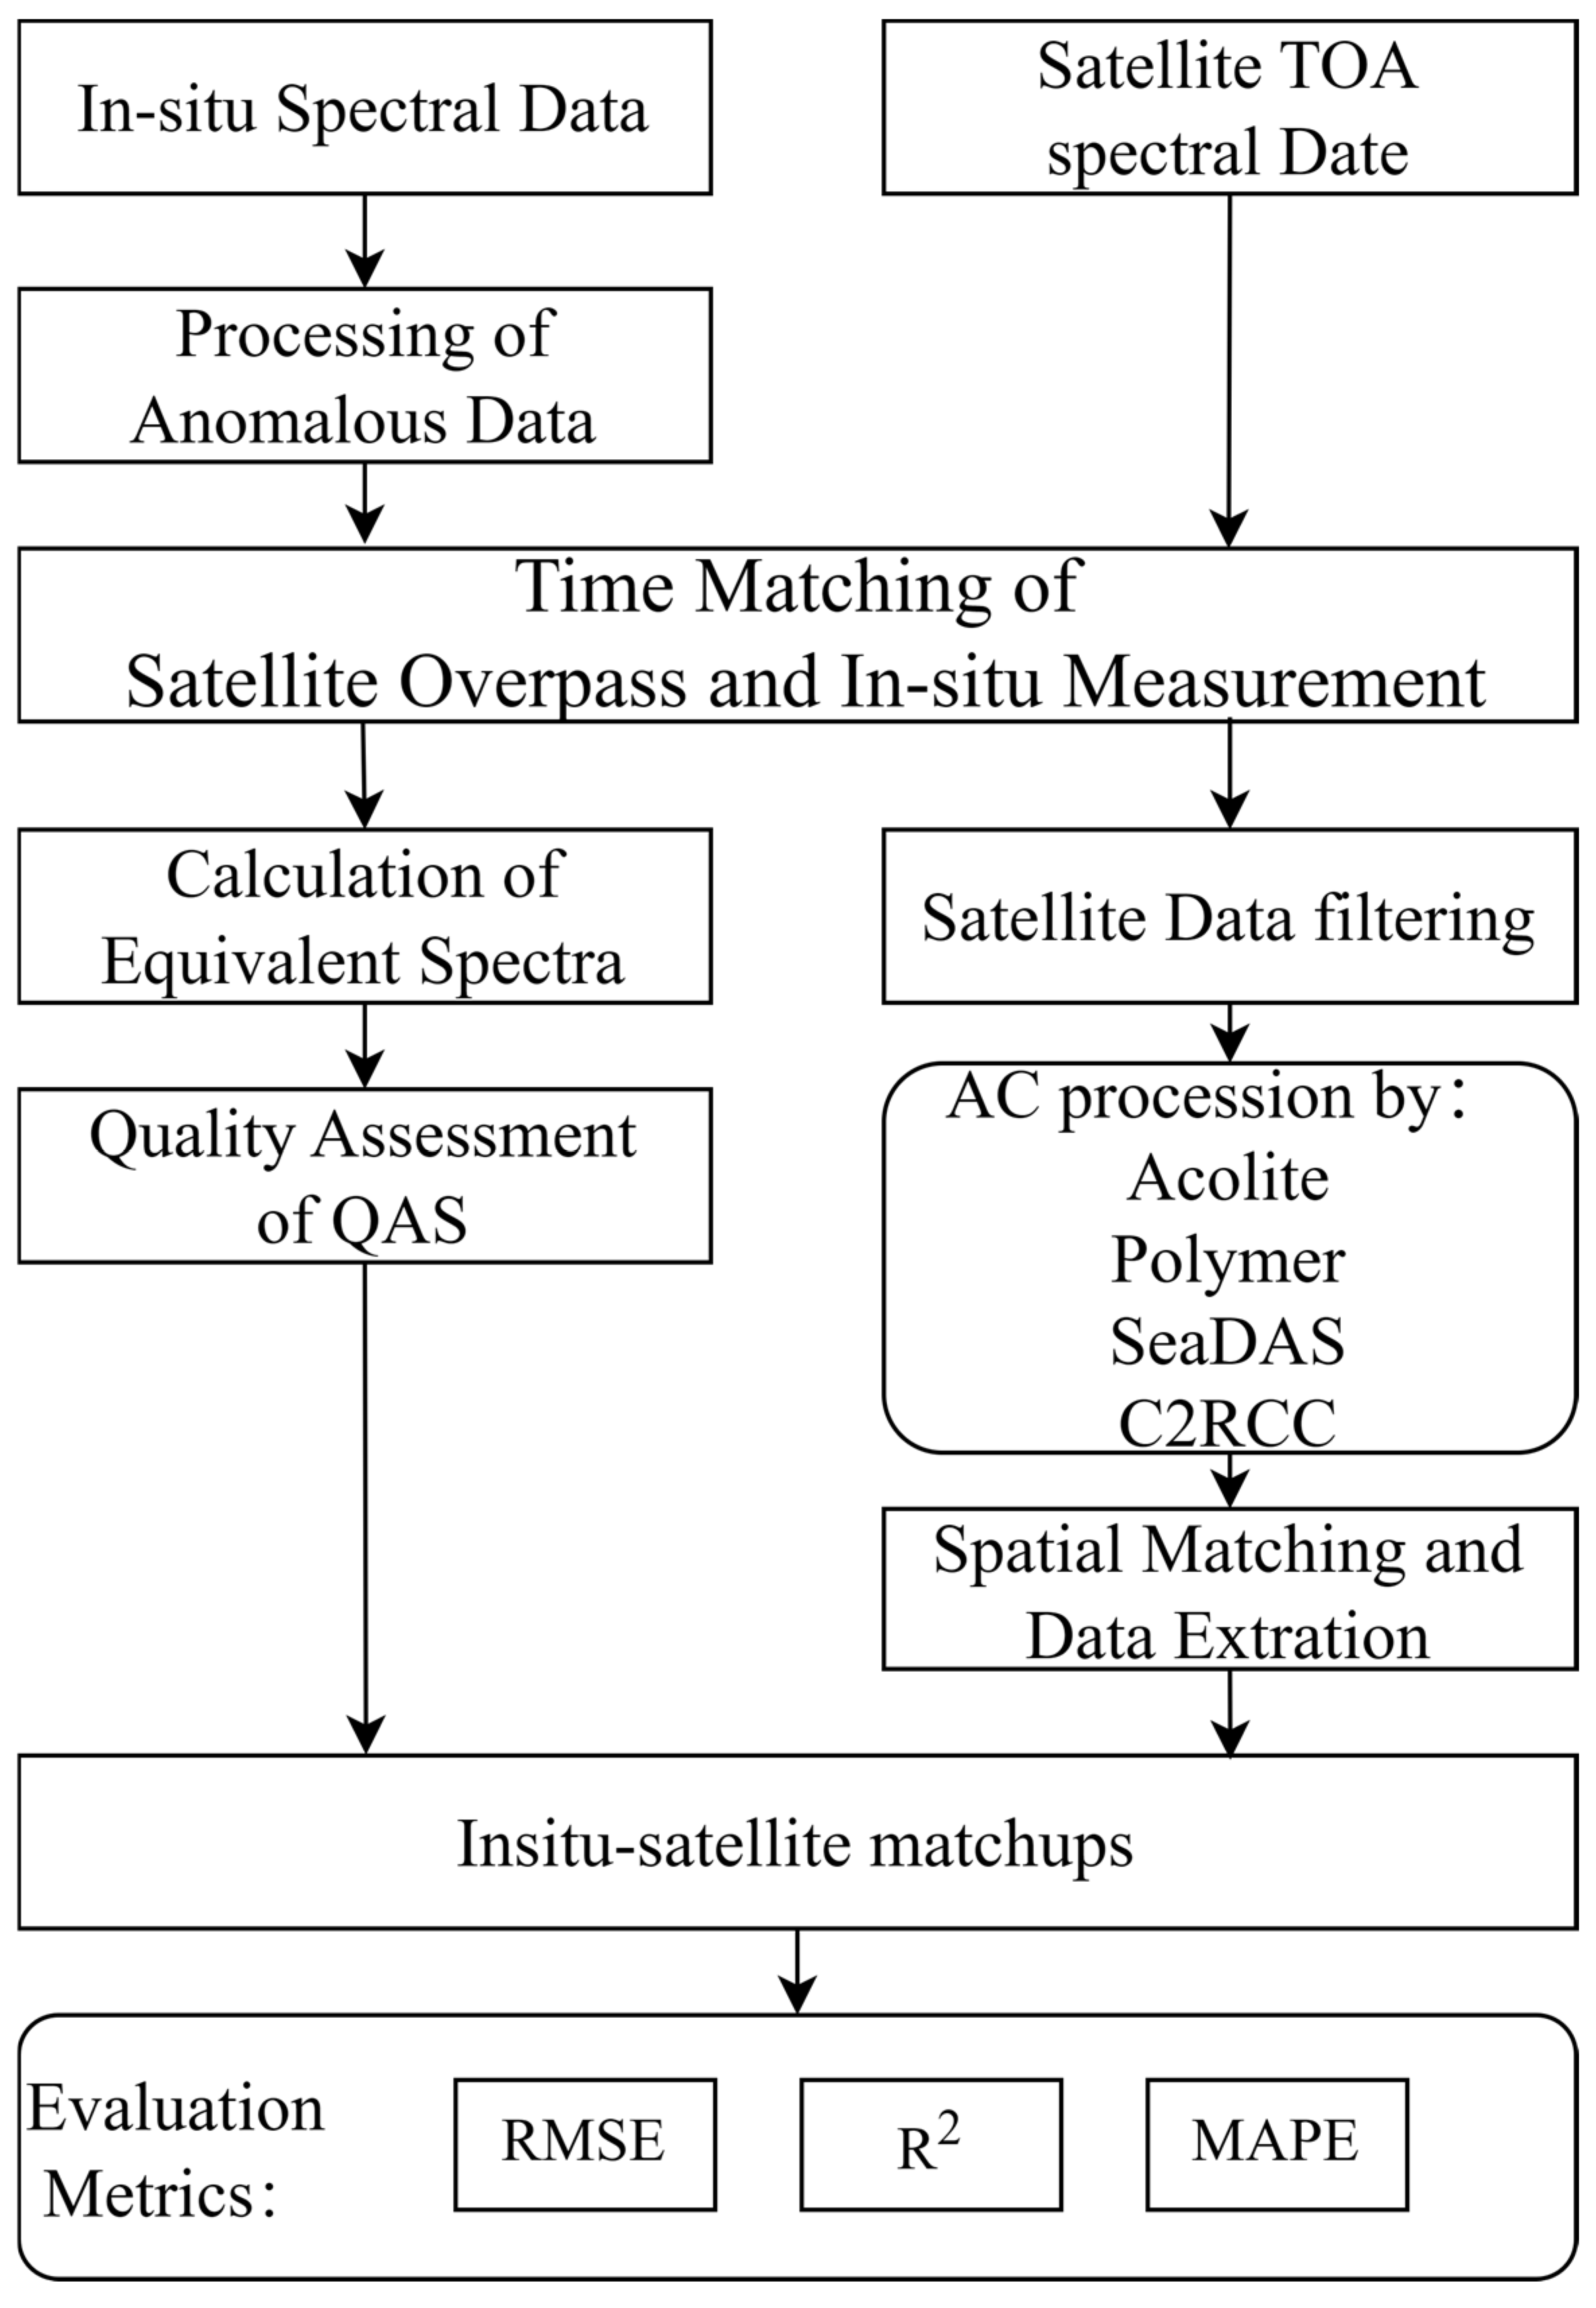
To eliminate the impact of extraneous factors on the results of atmospheric correction and to assess the accuracy of the algorithms, we needed to obtain the optimal temporal and spatial matches between the data from the satellite and the in situ data. A strict screening and matching process was implemented for the measured spectral data and the satellite images as follows (see Figure 2):

2.5.1. In Situ Data Processing

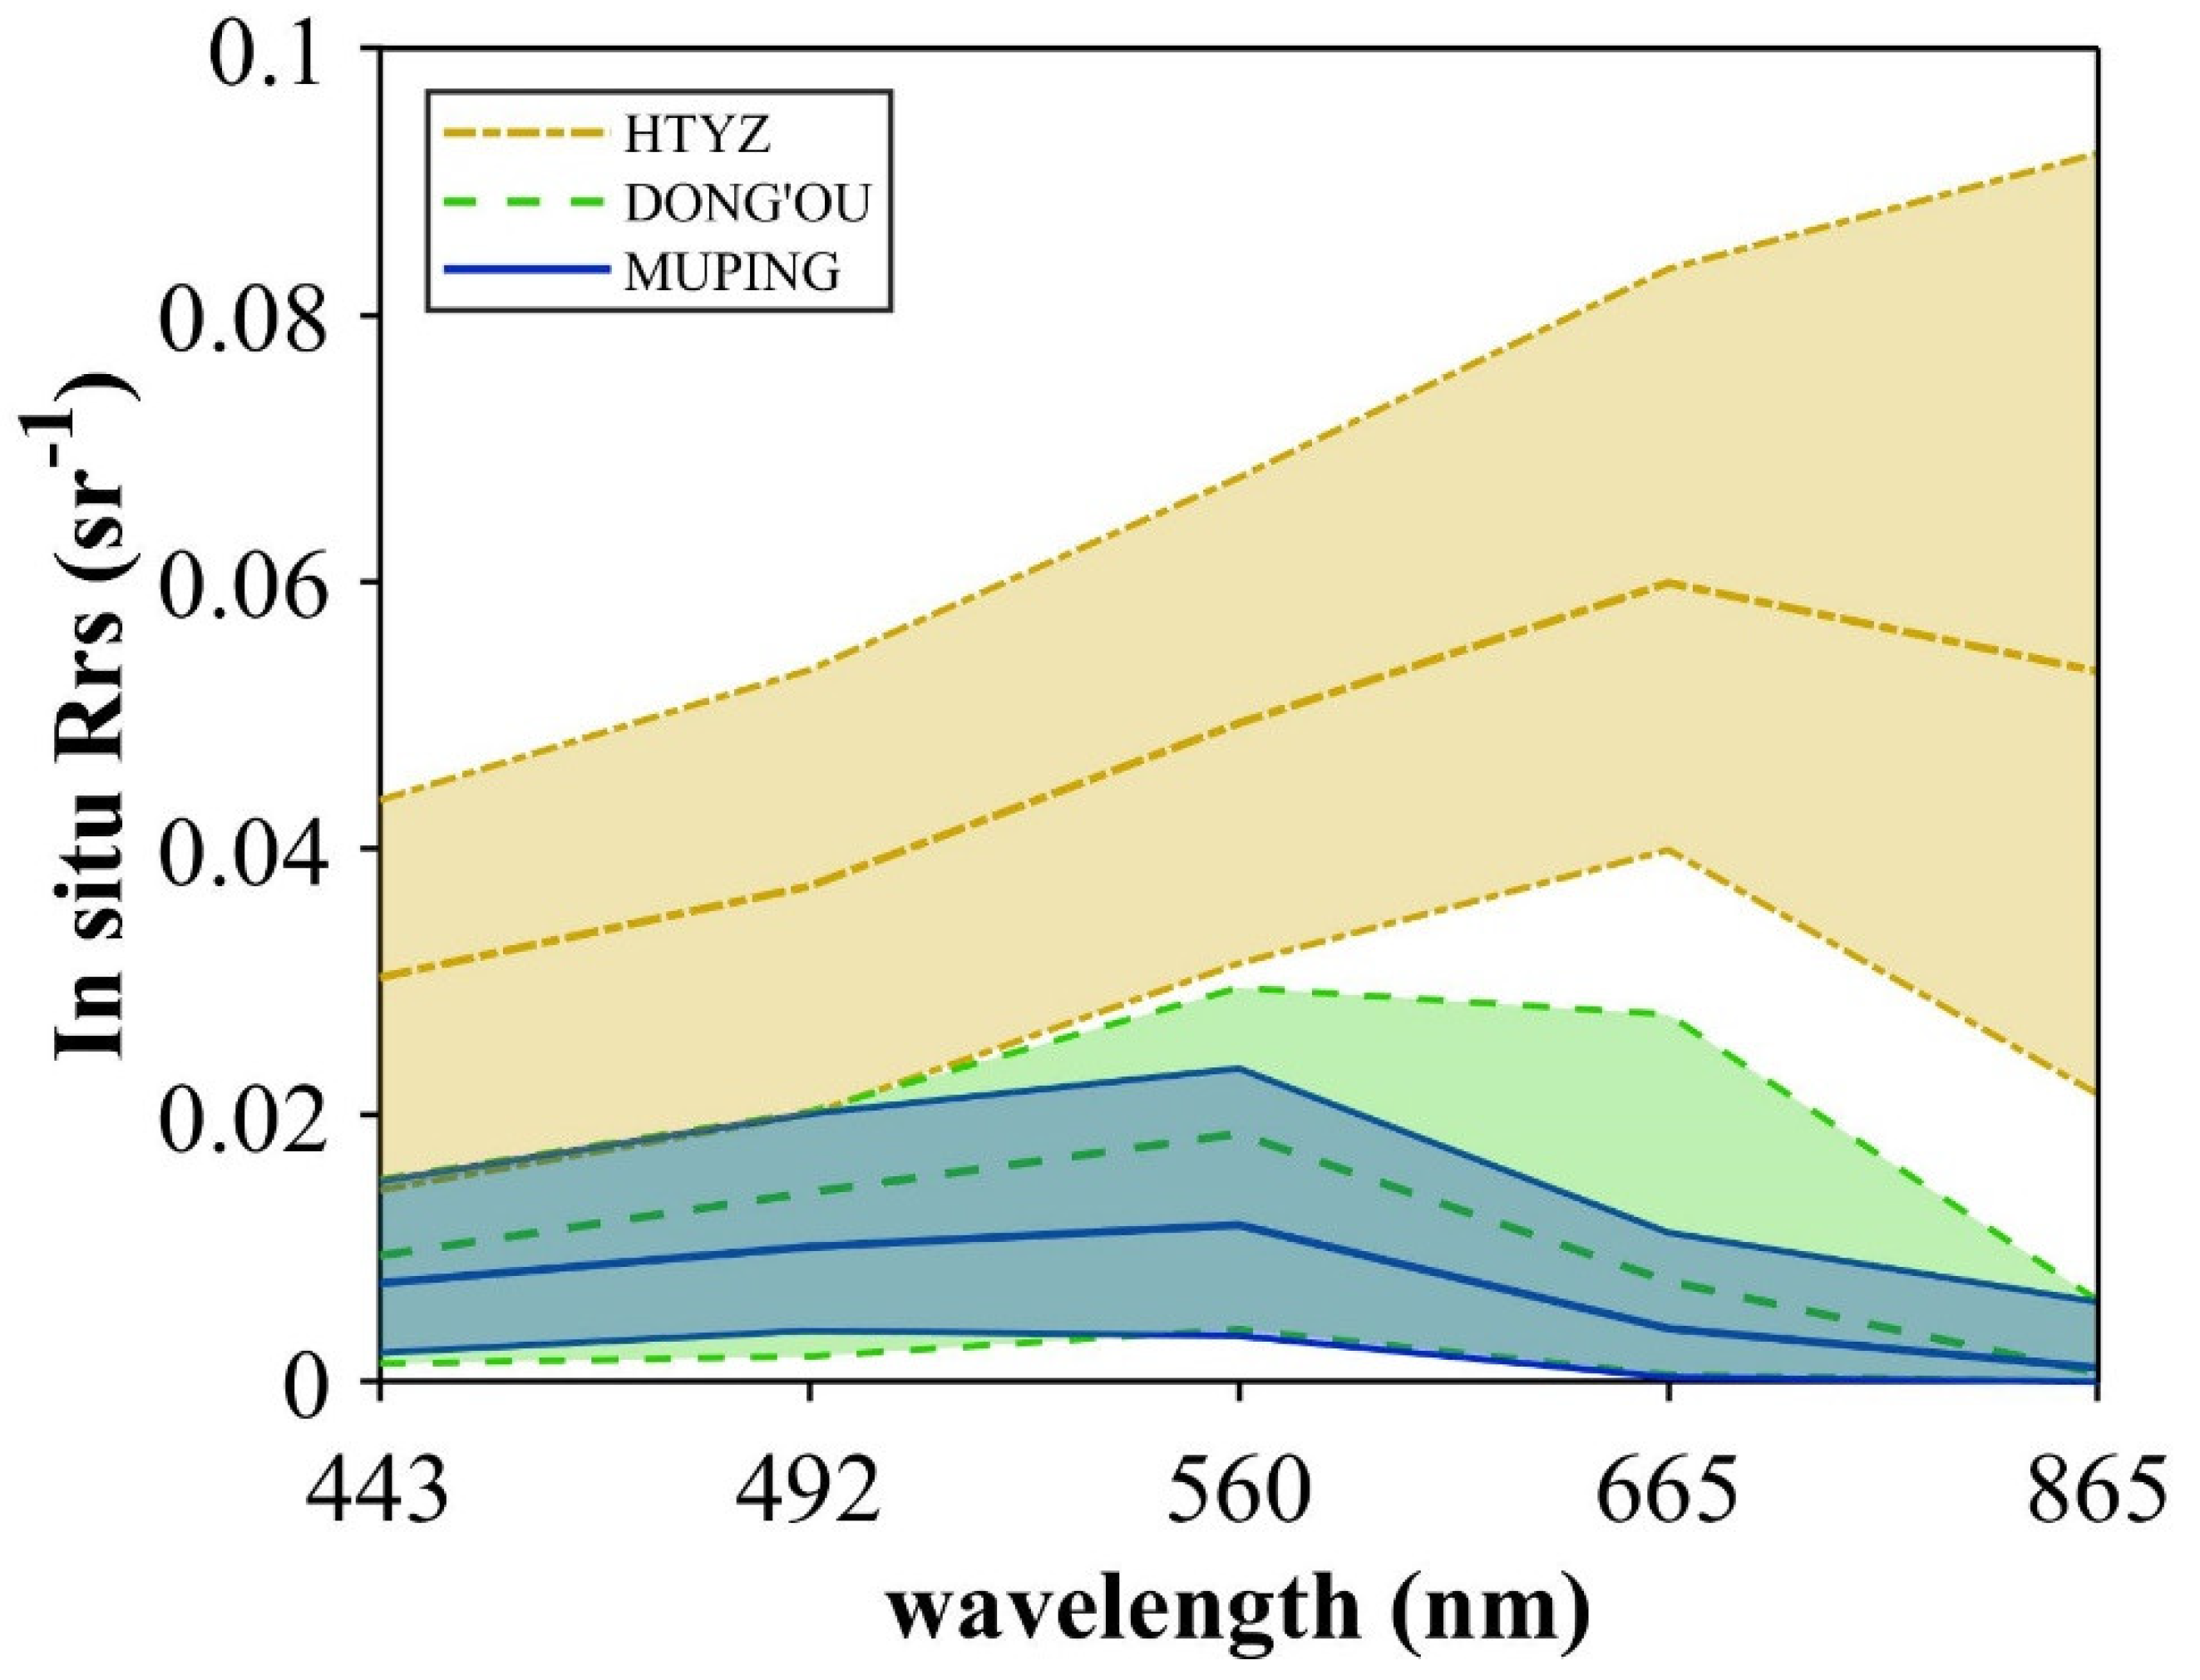
The screening and matching process to identify the highest-quality data involved setting a standard for abnormal data and defining a time-matching window for the filtered spectral data obtained from the sites. The time window for satellite transit was established for each site, with a ±30 min window for the site with highly turbid water (HTYZ) and a ±1 h window for the sites with waters with medium (DONG’OU) and low turbidity (MUPING). The spectral data from the sites showed distinct patterns. The value of Rrs of the HTYZ site exhibited a trend of increase starting from 350 nm to a peak at 665 nm. The lowest Rrs value was recorded at the DONG’OU site at 865 nm, with the maximum obtained at around 560 nm, while the minimum value at the MUPING site was obtained at 865 nm and the maximum at around 443 nm. A standard of filtering was then implemented to remove data that fell outside the transit time window of the satellite or that had negative values in the visible-light (380–740 nm) band. For the HTYZ site, we excluded data with Rrs_443 nm > 0.03 and Rrs_665 nm > 0.1 due to the high turbidity of the water. Previous studies have shown that Lwn (350 nm) greater than 3 mW/(cm2·µm·sr) should be removed in the HTYZ site [47,48], and we calculated Rrs (350 nm) = Lwn (350 nm)/Fn (350 nm) to obtain Rrs (350 nm) > 0.029, setting the criterion for the exclusion of Rrs_443 nm at 0.03. We excluded data with Rrs_665 nm > 0.1 based on field measurements and previous studies by Pahlevan et al. [7], which showed that reflectances of the red band were generally <0.03 and <0.01 for most of their data points. For the MUPING and DONG’OU sites, we excluded data with Rrs_865 nm > 0.01 and Rrs_max > 0.03.
Following the application of the aforementioned screening criteria, 463 lines of data for 202 days from the HTYZ site met the standard (out of a total of 238 days with 2684 lines of original data). Moreover, 239 lines of data over 84 days from the DONG’OU site (out of a total of 148 days with 999 lines of original data) and 1015 lines of data over 261 days from the MUPING site (out of a total of 414 days with 3613 lines of original data) met the standard. Figure 3 illustrates the filtered spectral data collected at the three sites.
Finally, the selected in situ data were correlated with the overpass dates of the satellites. In instances where multiple measured spectra were recorded on the same day, the spectrum with the highest QAS was selected after calculating the band−equivalent Rrs.

2.5.2. Processing Satellite Data

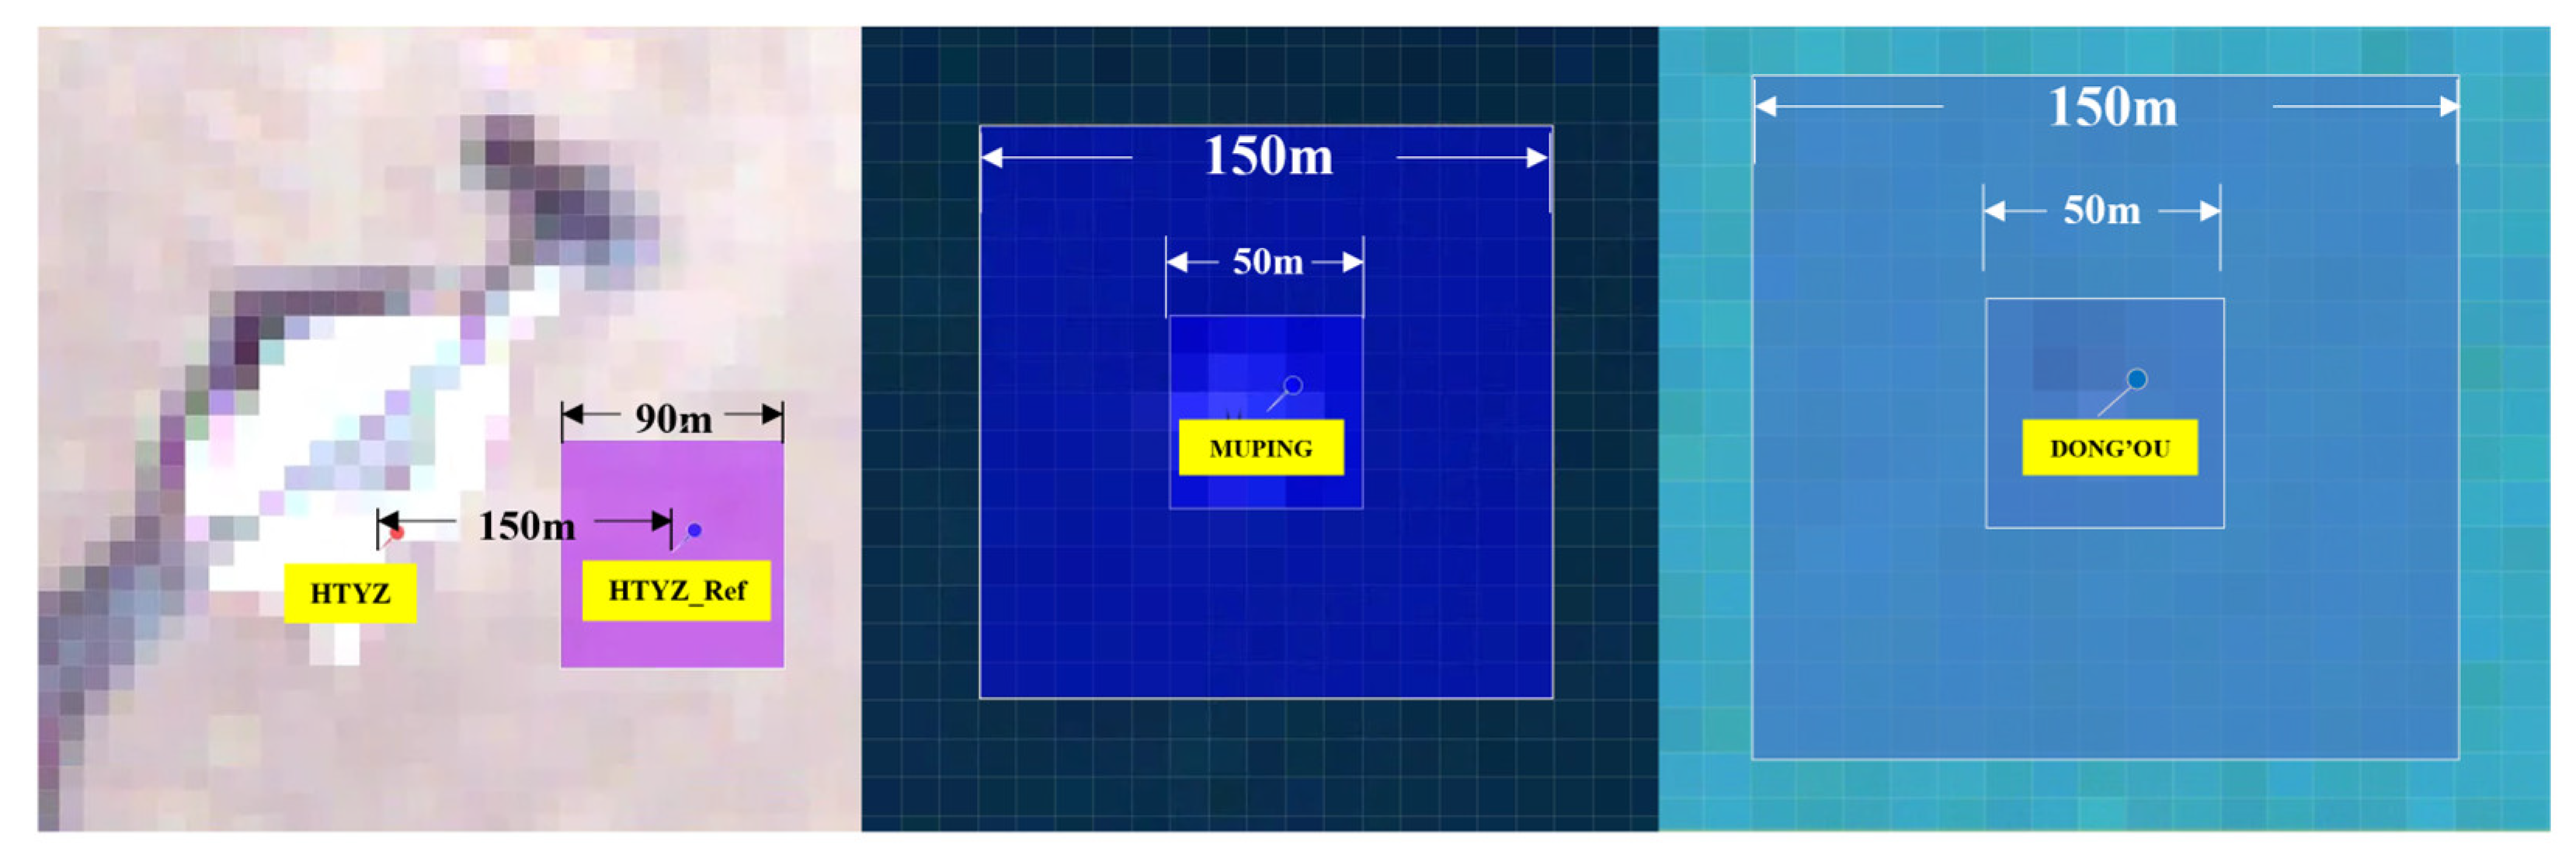
The satellite images affected by clouds, glint, and other factors were screened out. Spatial boxes with sizes of 90 m × 90 m, 150 m × 150 m, and 150 m × 150 m were selected for the HTYZ, DONG’OU, and MUPING sites, respectively. The center of reference of the box representing the HTYZ site was shifted 150 m to the east to reduce the effects of pixels representing direct pollution and the shadow of the tower (121.126721°E, 30.462750°N) [57,58,59,60]. The same method of extraction was used for the DONG’OU and MUPING sites by using windows of size 150 m × 150 m and removing a 50 m × 50 m area around the center of the station to avoid contamination from buildings on the respective platforms. The average value of the remaining pixels represented the measurements of the satellite [4,58]. The extraction windows of satellite scenes for the three stations are illustrated in Figure 4.
(a)
95 t h % | ρ t 1.3   μ m > 0.005
(b)
95th % | ρ t 1.6   μ m > 0.05
(c)
95 t h % | ρ t 443 n m > 0.3
(d)
C V V I S > 0.2
Standards a, b, and c for pre−processing the satellite images were intended to mitigate the effects of cloud cover and intense flares. To ensure the homogeneity of the properties of water within a defined spatial box, a spatial variability coefficient (CV) was computed as the ratio of the standard deviation (σ) to the mean value (μ) of the data, in the VIS bands (blue–red). Data with a value of CV greater than 0.2 were removed. The Rrs value at the measurement site was then extracted by inverting the satellite data. The spatial resolution of the Rrs products output by all the AC processors is 10 m, except for SeaDAS, which has a spatial resolution of 20 m. Therefore, the value window size at HTYZ is 5 × 5 pixels, which is equivalent to 100 × 100 m. At DONG’OU and MUPING, the outer value window size is 7 × 7 pixels (140 × 140 m), while the inner value window size is 3 × 3 pixels (60 × 60 m).

2.6. Metrics to Assess Precision

We assessed the accuracy of atmospheric correction by using the root mean−squared error ( R M S E ) and the mean absolute percentage error ( M A P E ) of the four spectral bands produced by the various AC processors. These metrics were calculated based on the matched satellite and in situ data. The R M S E and the M A P E were calculated as follows:
R M S E = 1 N × i = 1 N y i x i 2
M A P E = 1 N i = 1 N | y i x i x i | × 100 %
where N represents the number of matching data points, x i denotes the measured Rrs value, and y i represents the Rrs value obtained from the image subjected to atmospheric correction. We also calculated the Pearson correlation coefficient (R) between the satellite data and the measured data.

3. Results and Discussion

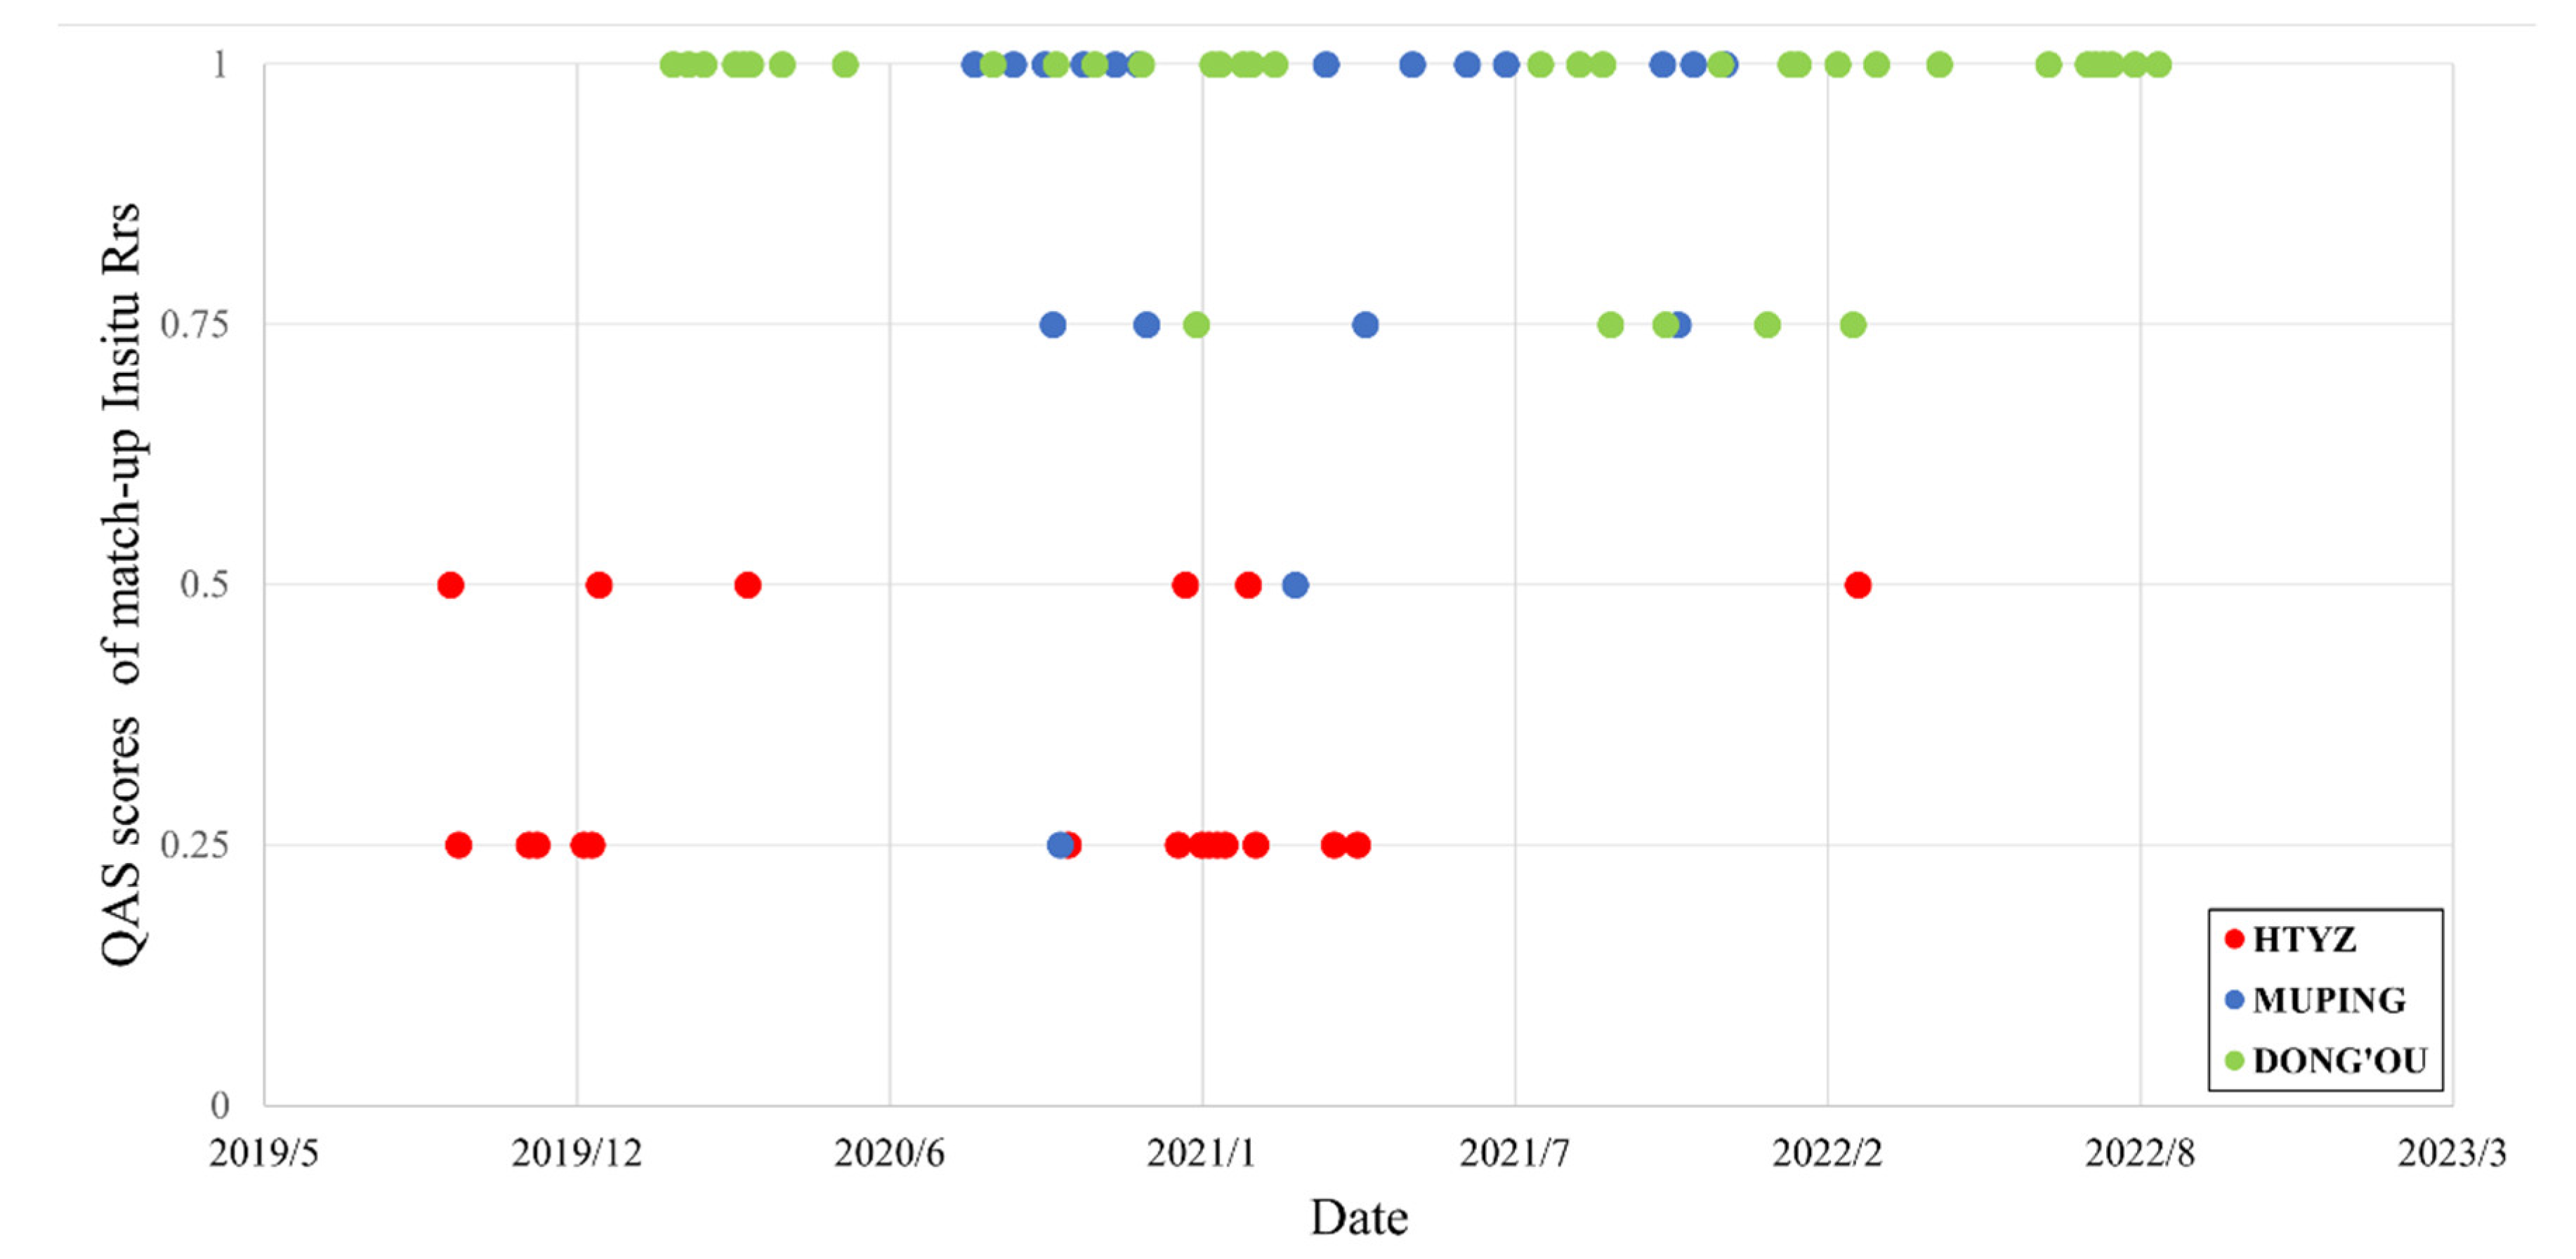
To ensure a fair evaluation of the performance of the AC processors, each was used to process the same number of images from Sentinel−2, as shown in Table 3. The total numbers of matchups for HYTZ, DONG’OU, and MUPING were 20, 38, and 23, respectively. The temporal distribution of the matchups and the QAS scores of the in situ spectrum in the matchups are shown in Figure 5. After processing, negative values or NAN values might have appeared in the area of Rrs extraction, in which case the data for the corresponding day were considered to be invalid [61]. C2RCC−c2x had the lowest number of valid data, but was still included for the sake of comparison. We used MATLAB to handle the removal of abnormal data, temporal matching, the calculation of band equivalent reflectance, and the screening of clouds from the satellite data. All atmospheric correction processors output the Rrs data in the netCDF4 format. They were subsequently imported and processed by using MATLAB.

3.1. Comparison of Results of Atmospheric Correction of Data on Waters with Varying Turbidity

Scatter plots of the Rrs, measured and retrieved at three sites, are shown in Figure 5. Both ACOLITE−DSF and ACOLITE−EXP needed to mask pixels representing land and clouds at the HTYZ site with highly turbid water. However, the default threshold of ρ t 1610   n m > 0.0215 for ACOLITE led to the removal of too many pixels representing water owing to the increased reflectance of the water body in the infrared band; therefore, the threshold was modified to 0.05 [62]. The default iterative NIR algorithm did not generate valid results for all matching dates for the SeaDAS AC processor. We thus used the optimized MUMM algorithm instead, with its default band combination of 865–1610 nm, to compare it with the other methods. The Polymer AC processor was used with the default settings. The C2RCC machine−learning−based AC processor used the c2x−Nets configuration for the HTYZ site and the c2rcc−Nets configuration for the other two sites. Except for SeaDAS and C2RCC, which used their default settings (NIR and c2rcc), the settings for the other AC processors for the two sites containing waters with lower turbidity were the same as those for the HTYZ site.
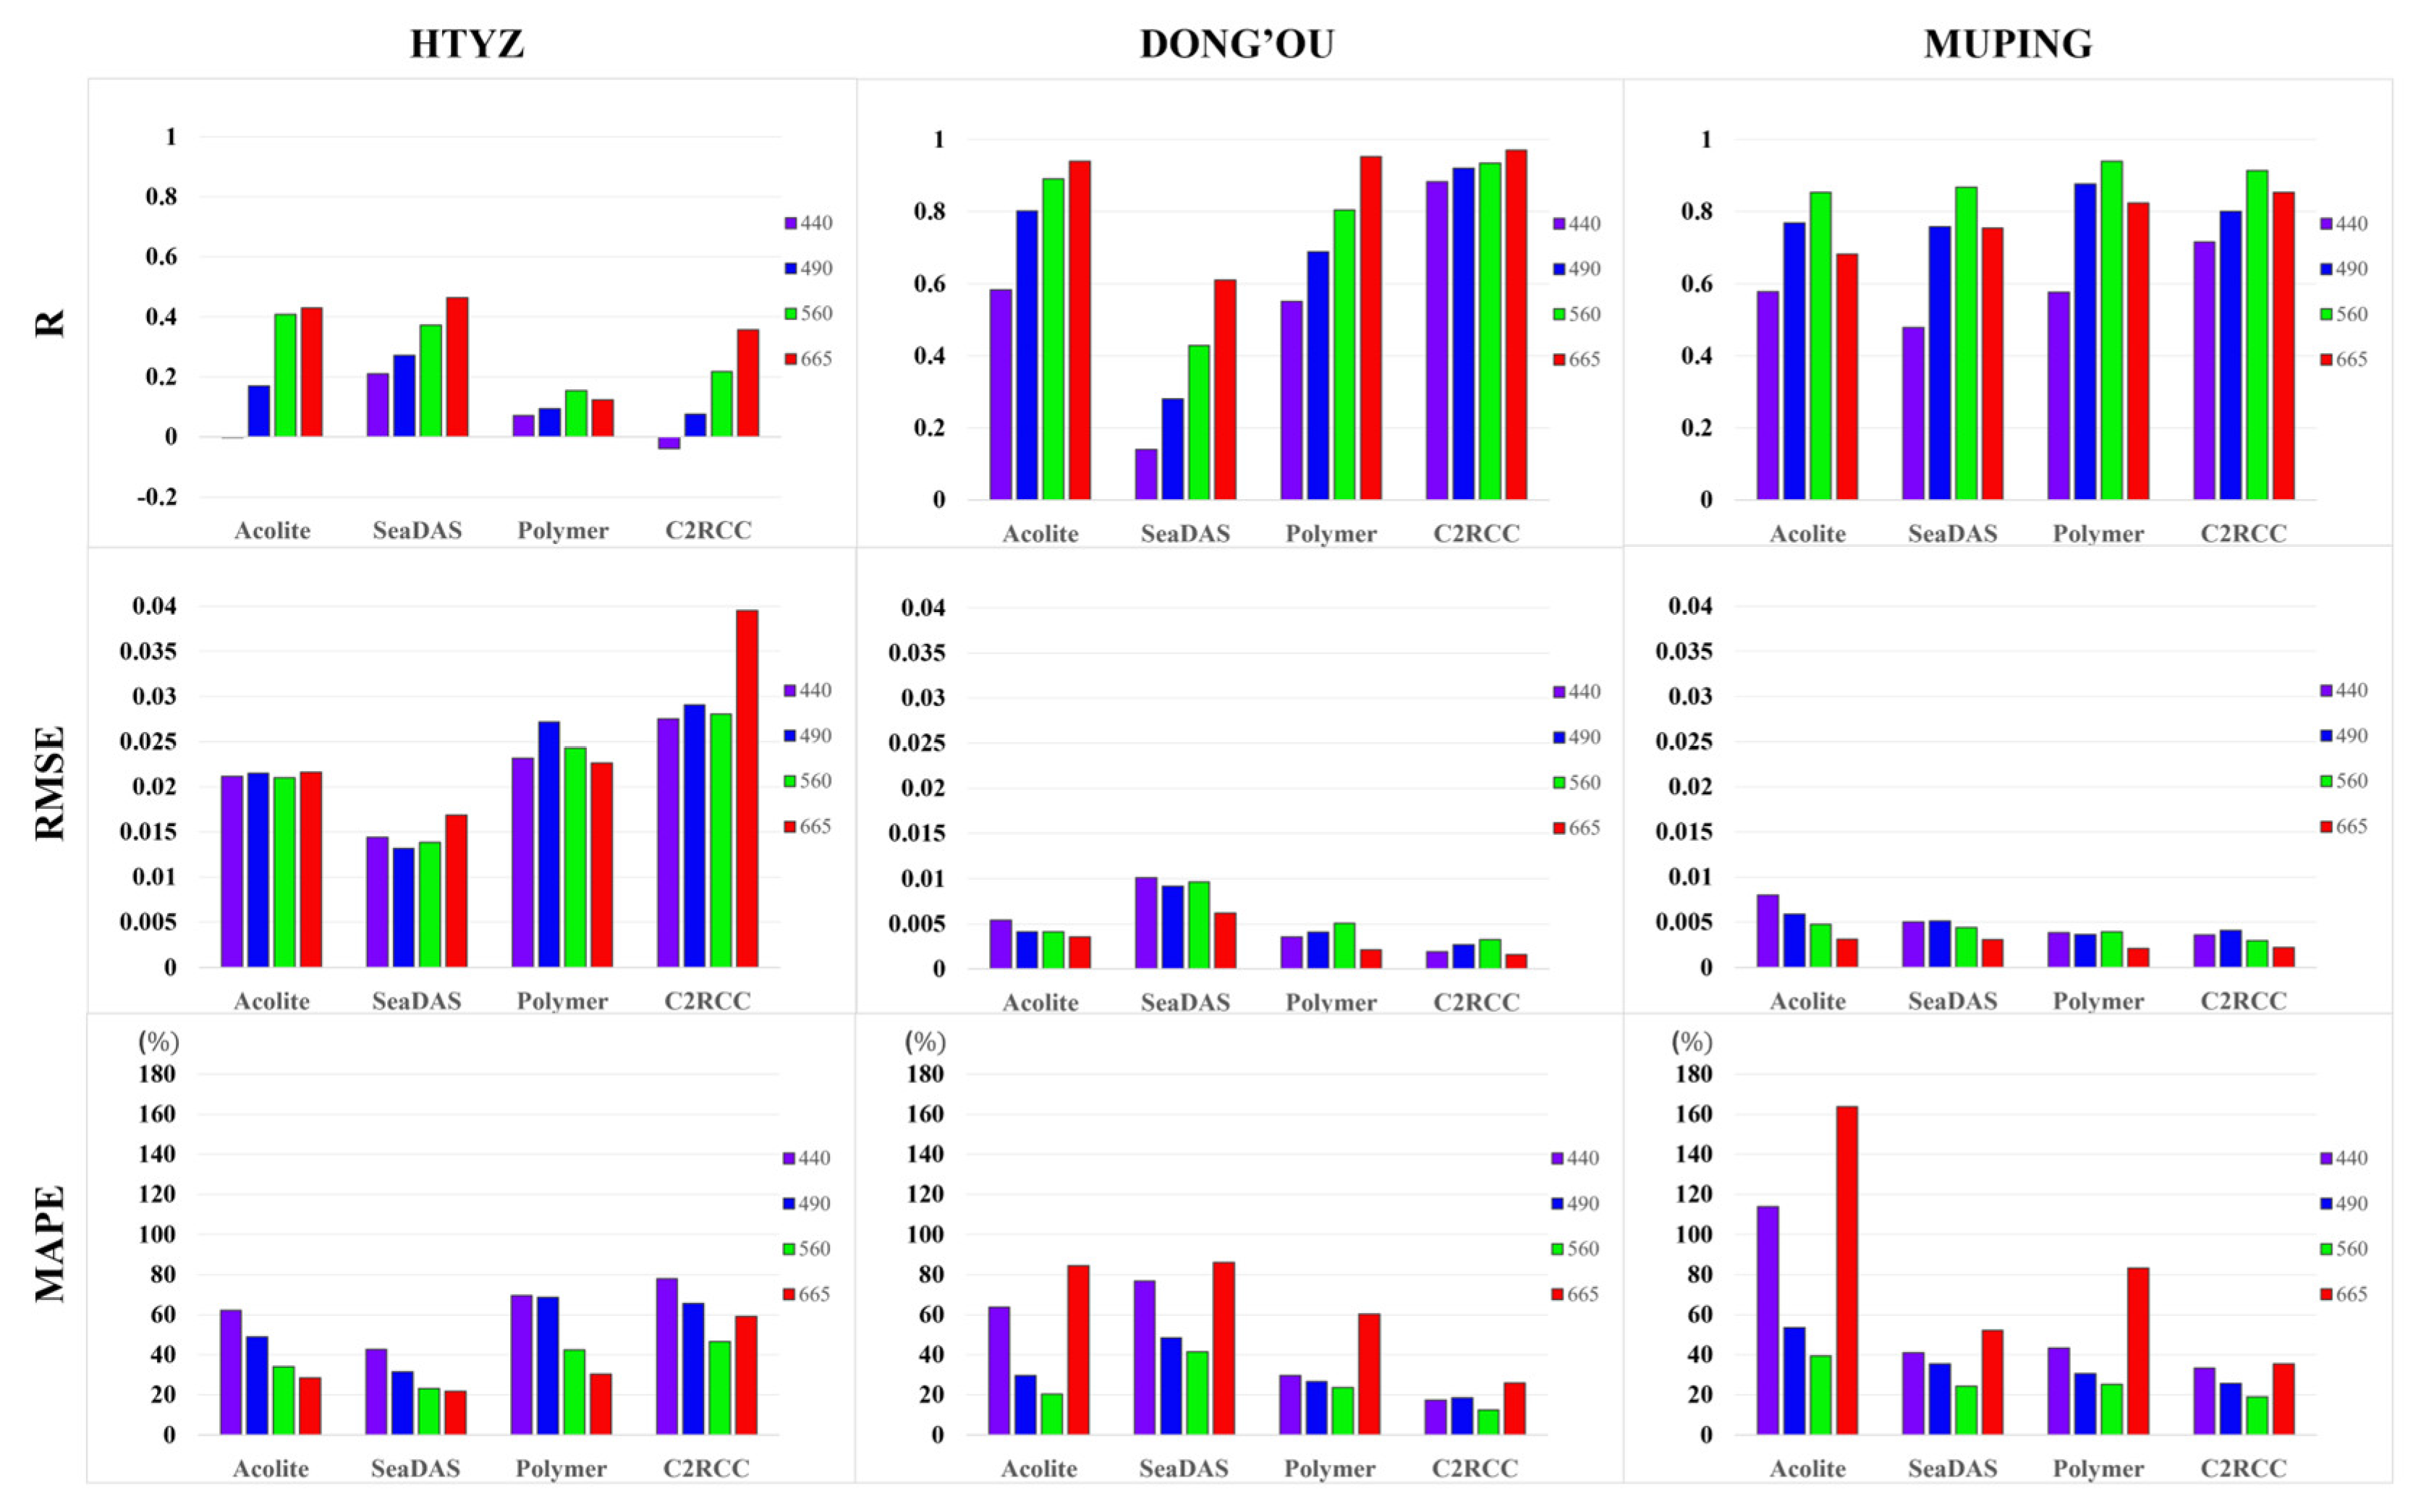
All AC processors except SeaDAS significantly underestimated the results for the high−turbidity HTYZ site, with a dividing line of 0.04 indicating high levels of underestimation and low levels of overestimation. The slope of the regression line increased slightly with the wavelength. SeaDAS−MUMM had the highest correlation coefficient (R), with values of 0.21, 0.27, 0.37, and 0.46 for the four bands, respectively. It also had the lowest R M S E and M A P E values of all the AC processors, followed closely by ACOLITE−DSF. By contrast, the machine learning method C2RCC−c2x had the worst correction effect, likely owing to an insufficient number of training samples in highly turbid water. The results of SeaDAS−MUMM are illustrated in subgraphs (ii)(a) to (ii)(d) by red points, while those of C2RCC are represented by red dots in subgraphs (iv)(a) to (iv)(d) in Figure 6.
The Rrs values at the DONG’OU site, with moderately turbid water, were mainly within the range of 0 to 0.025. As the wavelength increased, the curve of regression approached the 1:1 line, with the blue band exhibiting the largest deviation. Table 4 and Figure 7 show that the correlation coefficients of the other processors were generally above 0.55, except for those of SeaDAS in the 443, 490, and 560 nm bands. C2RCC recorded the highest correlation coefficients at the DONG’OU site, with little variation across the individual bands (0.88, 0.92, 0.93, and 0.97). As at the HTYZ site, the correlation coefficients at the DONG’OU site increased with the wavelength. C2RCC outperformed the other processors, with a maximum R M S E of 0.0032 and a M A P E ranging from 16% to 32% across the four bands. POLYMER also performed well at this site, with all R M S E values smaller than 0.005, and met the requirement of an accuracy of 30% on all bands, except the red band [4].
The Rrs values at the MUPING site, located in water with low turbidity, were generally lower and more concentrated than those at the other 2 sites, except in the 560 nm band. The correlation coefficients of all four AC processors were high, with the lowest observed for SeaDAS in the 443 nm band and the highest for POLYMER in the 560 nm band. Figure 7 shows that the overall correlation coefficient was the lowest in the 443 nm band, the highest in the green band, and intermediate in the blue–red band. Apart from ACOLITE, the R M S E and M A P E values of all the processors were lower for water bodies with medium and high turbidity. The values of M A P E of all the processors in the 560 nm band were smaller than 30% (C2RCC had the lowest at 19.03%), and were smaller than 35% in the 490 nm band (C2RCC had the lowest at 25.73%). The M A P E values of ACOLITE were unusually high at 443 nm and 665 nm—113.78% and 163.78%, respectively.

3.2. Evaluation of Results of ACOLITE−EXP for Highly Turbid Waters

The EXP method, also known as the exponential extrapolation method of SWIR, represents an improvement in the results of atmospheric correction in highly turbid waters. The method requires the specification of a short−wave and a long−wave band in order to calculate the ratio of aerosol reflection ϵ , which is defined as ϵ = ρ a m λ s h o r t / ρ a m λ l o n g . ρ a m is the aerosol−related reflectance after Rayleigh correction. The calculated value of ε is then used to determine the aerosol model during aerosol correction, with the water−leaving reflection of the other bands calculated through extrapolation in the standard atmospheric correction algorithm, and the combination of the red/NIR bands is typically used. However, in turbid waters with high backscattering in the near−infrared band, this combination may result in the failure of atmospheric correction and yield negative values in the short−wave range. To overcome this issue, alternative band combinations, such as NIR/NIR, NIR/SWIR, and even SWIR/SWIR, may be selected.
The ACOLITE−EXP algorithm initially selected the 1610/2200 band combination at the HTYZ site. To evaluate potential improvements in performance resulting from different band combinations, we modified the configuration to test the 865/1610 and 865/2200 band combinations. The results showed that compared with their performance with the 1610/2200 combination, both the EXP and DSF algorithms yielded fewer valid results when the other 2 band combinations were used. The results of correction of the 443 nm, 490 nm, and 560 nm bands were predominantly negative, and even the 665 nm band yielded negative values. Therefore, ACOLITE−EXP could use only the 1610/2200 band combination to obtain valid data for highly turbid water at the HTYZ site. The errors in correction for different band combinations are summarized in Table 5, in which each row corresponds to a different combination. The data represent the ratio of valid items to the total number of matching samples.
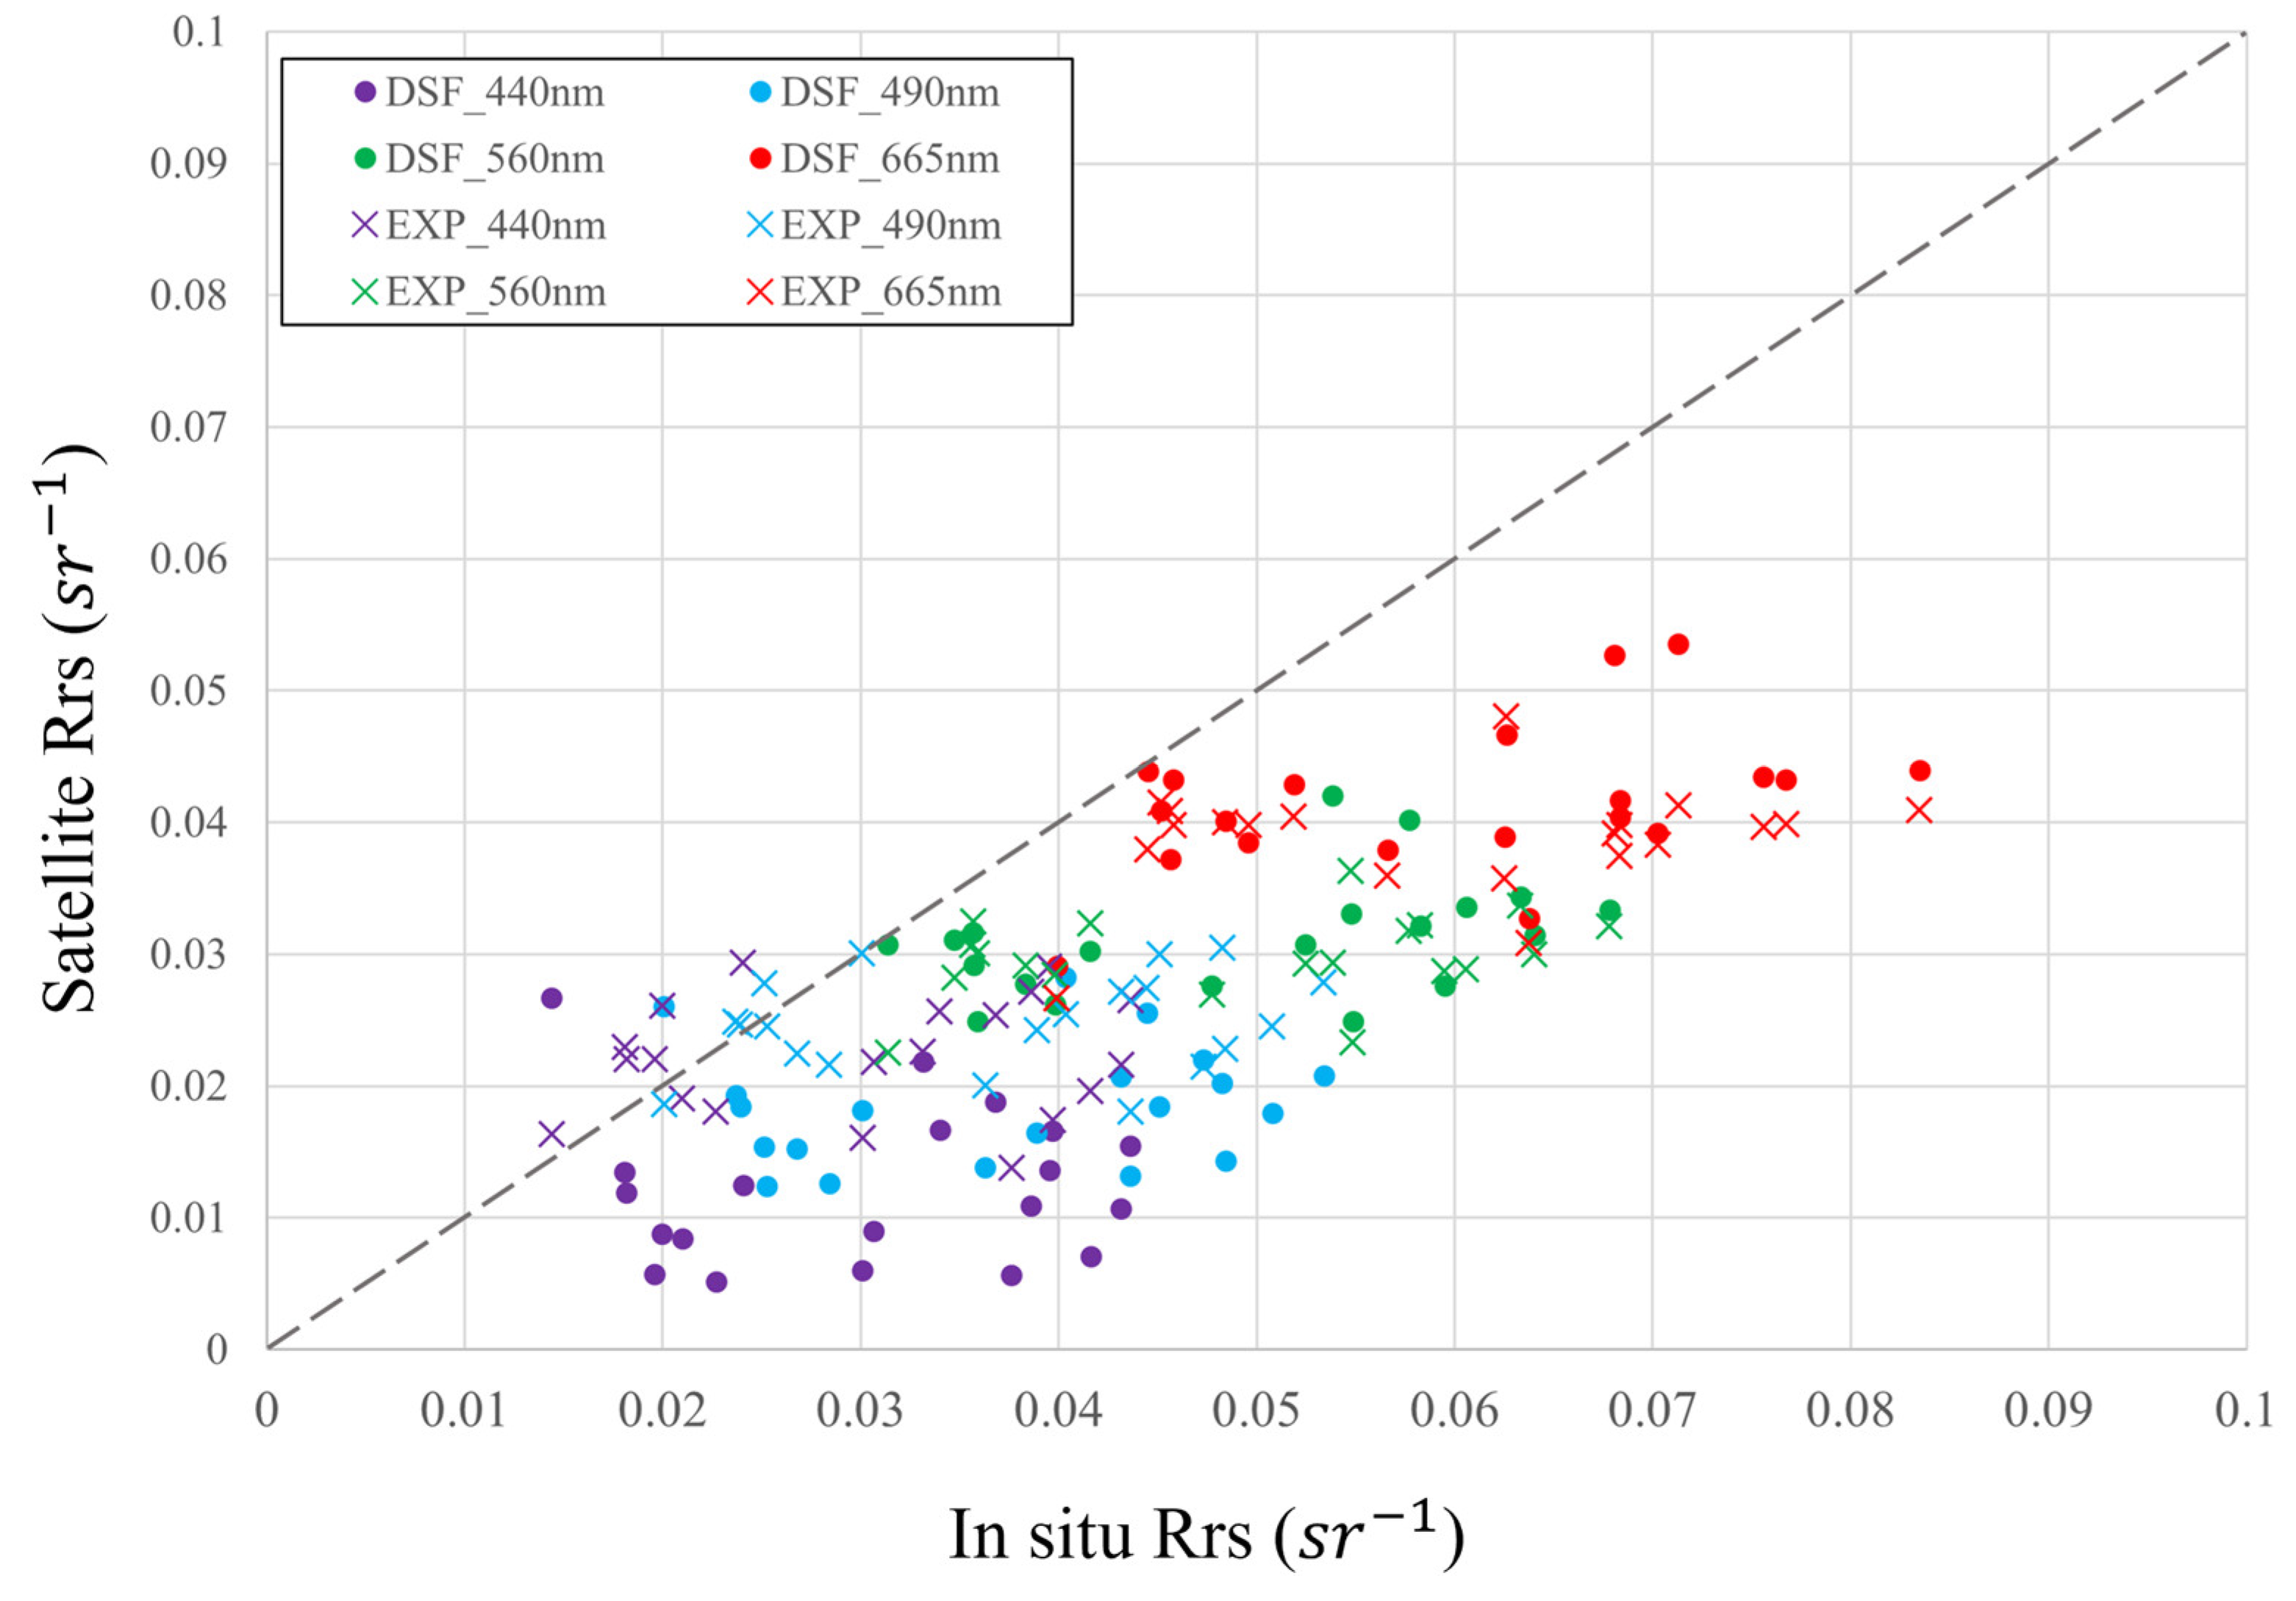
We compared the performance of the ACOLITE−DSF algorithm at the HTYZ site with that of the EXP algorithm (with a band combination of 1610/2200), as illustrated in Figure 8 and Table 6. The figure shows the Rrs values obtained by both algorithms, as well as the measured Rrs values. The four different bands are represented by different colors in the figure. In the blue bands of 443 nm and 490 nm, the EXP algorithm exhibited closer proximity to the 1:1 line than the DSF algorithm, and the degree of underestimation of the results decreased. Their values of M A P E declined from 62.26% and 48.96% to 31.87% and 29.98%, respectively. Their R M S E s also showed a slight decrease, from 0.0212 and 0.0215 to 0.0128 and 0.0161, respectively. However, the improvement in the results of the EXP algorithm in the green and red bands was not substantial.

4. Conclusions

In this study, the performance of four open−source atmospheric correction (AC) processors—ACOLITE, SeaDAS, POLYMER, and C2RCC—was examined on Sentinel−2 images of Chinese coastal waters. The objective was to access the accuracy of these processors in waters with different levels of turbidity, using in situ spectra collected from three stations in China. The results indicated significant variability in the performance of the AC processors for different turbidity conditions.
The findings can be summarized as follows:
(i)
The performance of the AC processors was limited in highly turbid water, with correlation coefficients lower than 0.46 and negative values observed in the 443 nm band. Among the four processors evaluated, SeaDAS−MUMM demonstrated the best performance, with an average R M S E of 0.0146 and an average M A P E of 29.80%. The performance of ACOLITE−DSF was relatively better than that of the other processors, with an average R M S E of 0.0213 and an average M A P E of 43.43%.
(ii)
The performance of the AC processors improved significantly in water with medium turbidity (DONG’OU), with C2RCC−c2rcc yielding the best results. The correlation coefficients of 443, 490, 560, and 665 nm were 0.88, 0.92, 0.93, and 0.97, respectively, with an average R M S E of 0.0024, and their M A P E s were 17.29%, 18.56%, 12.51%, and 25.96%, respectively. These results met the accuracy requirement of 30% prescribed by the Global Climate Observing System. The performance of POLYMER was relatively good, with correlation coefficients of0.55, 0.69, 0.80, 0.95, and an average R M S E of 0.0037. The M A P E s for the four bands were 29.74%, 26.64%, 23.57%, and 60.33%, and all bands except for the red band had a M A P E smaller than 30%.
(iii)
The performances of the four AC processors were comparable in water with low turbidity (MUPING), with the average correlation coefficients of all exceeding 0.7. The average R M S E s of the ACOLITE−DSF, SeaDAS−NIR, POLYMER, and C2RCC−c2rcc were 0.0054, 0.0044, 0.0034, and 0.0032, respectively, and their average M A P E s were 92.64%, 38.26%, 45.62%, and 28.41%, respectively. C2RCC−c2rcc delivered the best performance. However, the performance of the ACOLITE−EXP processor in waters with low turbidity (MUPING) was notably inferior to its performance in waters with moderate turbidity (DONG’OU). Notably, the M A P E s of ACOLITE−DSF at 443 nm and 665 nm were alarmingly high, with readings of 113.78% and 163.78%, respectively.
The selection of an appropriate AC processor and algorithm can minimize errors in the inversion of the parameters of water quality when monitoring the quality of water in bodies with varying levels of turbidity. For instance, the EXP algorithm of ACOLITE can be selected to improve the results in the blue light band to a greater extent than the DSF algorithm in highly turbid waters. The C2RCC processor is a suitable choice in both waters with medium and low turbidity.

Author Contributions

Conceptualization, S.Z. and D.W.; methodology, D.W.; data analyses, S.Z.; formal analysis, S.Z. and Y.X.; investigation, S.Z. and X.Z.; resources, D.W. and F.G.; writing—original draft preparation, S.Z. and D.W.; writing—review and editing, S.Z., D.W. and D.F.; visualization, S.Z.; supervision, D.W.; project administration, D.W. and X.H.; funding acquisition, D.W. All authors have read and agreed to the published version of the manuscript.

Funding

This research was funded by the National Key R&D Program of China under Grant Nos. 2018YFB0505005 and 2017YFC1405300, the Key Research and Development Plan of Zhejiang Province under contract no. 2017C03037, and the National Natural Science Foundation of China under contract no. 41476157.

Data Availability Statement

The data presented in this study are available on request from the corresponding author.

Acknowledgments

We thank the team at the European Space Agency (ESA) for providing Sentinel−2 data, which were essential for this study. We also thank the team led by Qinjun Song from NSOAS for their invaluable assistance during the production, distribution, and real−time update of the in situ spectral data used in this research. We are also grateful to the creators and maintainers of the ACOLITE, SeaDAS, POLYMER, and C2RCC processors, particularly those of the ACOLITE forum, for their support and expertise. The authors also thank the satellite ground station, and the satellite data processing and sharing center of SOED/SIO for help with the data processing. Finally, we extend our gratitude to the editors and reviewers of the journal for their review of this manuscript and thoughtful suggestions on improving it.

Conflicts of Interest

The authors declare no conflict of interest.

References

  1. Gordon, H.R.; Wang, M. Retrieval of Water-Leaving Radiance and Aerosol Optical Thickness over the Oceans with SeaWiFS: A Preliminary Algorithm. Appl. Opt. 1994, 33, 443–452. [Google Scholar] [CrossRef]
  2. Wang, M.; IOCCG. Atmospheric Correction for Remotely-Sensed Ocean-Colour; International Ocean Colour Coordinating Group (IOCCG): Dartmouth, NS, Canada, 2010. [Google Scholar]
  3. Mobley, C.D.; Werdell, J.; Franz, B.; Ahmad, Z.; Bailey, S. Atmospheric Correction for Satellite Ocean Color Radiometry; NASA: Washington, DC, USA, 2016. [Google Scholar]
  4. Pahlevan, N.; Mangin, A.; Balasubramanian, S.V.; Smith, B.; Alikas, K.; Arai, K.; Barbosa, C.; Bélanger, S.; Binding, C.; Bresciani, M.; et al. ACIX-Aqua: A Global Assessment of Atmospheric Correction Methods for Landsat-8 and Sentinel-2 over Lakes, Rivers, and Coastal Waters. Remote Sens. Environ. 2021, 258, 112366. [Google Scholar] [CrossRef]
  5. Gordon, H.R.; Wang, M. Surface-Roughness Considerations for Atmospheric Correction of Ocean Color Sensors 1: The Rayleigh-Scattering Component. Appl. Opt. 1992, 31, 4247–4260. [Google Scholar] [CrossRef] [PubMed]
  6. Wang, M. The Rayleigh Lookup Tables for the SeaWiFS Data Processing: Accounting for the Effects of Ocean Surface Roughness. Int. J. Remote Sens. 2002, 23, 2693–2702. [Google Scholar] [CrossRef]
  7. Gordon, H.R. Atmospheric Correction of Ocean Color Imagery in the Earth Observing System Era. J. Geophys. Res. Atmos. 1997, 102, 17081–17106. [Google Scholar] [CrossRef]
  8. Hu, C.; Carder, K.L.; Muller-Karger, F.E. Atmospheric Correction of SeaWiFS Imagery over Turbid Coastal Waters: A Practical Method. Remote Sens. Environ. 2000, 74, 195–206. [Google Scholar] [CrossRef]
  9. Shi, W.; Wang, M. Detection of Turbid Waters and Absorbing Aerosols for the MODIS Ocean Color Data Processing. Remote Sens. Environ. 2007, 110, 149–161. [Google Scholar] [CrossRef]
  10. Moore, G.F.; Aiken, J.; Lavender, S.J. The Atmospheric Correction of Water Colour and the Quantitative Retrieval of Suspended Particulate Matter in Case II Waters: Application to MERIS. Int. J. Remote Sens. 1999, 20, 1713–1733. [Google Scholar] [CrossRef]
  11. Wang, M.; Shi, W. Estimation of Ocean Contribution at the MODIS Near-Infrared Wavelengths along the East Coast of the U.S.: Two Case Studies. Geophys. Res. Lett. 2005, 32, L13606. [Google Scholar] [CrossRef]
  12. Wang, M. Remote Sensing of the Ocean Contributions from Ultraviolet to Near-Infrared Using the Shortwave Infrared Bands: Simulations. Appl. Opt. 2007, 46, 1535–1547. [Google Scholar] [CrossRef]
  13. Shi, W.; Wang, M. An Assessment of the Black Ocean Pixel Assumption for MODIS SWIR Bands. Remote Sens. Environ. 2009, 113, 1587–1597. [Google Scholar] [CrossRef]
  14. Wang, M.; Son, S.; Shi, W. Evaluation of MODIS SWIR and NIR-SWIR Atmospheric Correction Algorithms Using SeaBASS Data. Remote Sens. Environ. 2009, 113, 635–644. [Google Scholar] [CrossRef]
  15. Vanhellemont, Q.; Ruddick, K. Advantages of High Quality SWIR Bands for Ocean Colour Processing: Examples from Landsat-8. Remote Sens. Environ. 2015, 161, 89–106. [Google Scholar] [CrossRef]
  16. Ibrahim, A.; Franz, B.A.; Ahmad, Z.; Bailey, S.W. Multiband Atmospheric Correction Algorithm for Ocean Color Retrievals. Front. Earth Sci. 2019, 7, 116. [Google Scholar] [CrossRef]
  17. Wang, D.; Ronghua, M.; Xue, K.; Li, J. Improved Atmospheric Correction Algorithm for Landsat 8–OLI Data in Turbid Waters: A Case Study for the Lake Taihu, China. Opt. Express 2019, 27, A1400–A1418. [Google Scholar] [CrossRef]
  18. Wang, D.; Ma, R.; Xue, K.; Loiselle, S.A. The Assessment of Landsat-8 OLI Atmospheric Correction Algorithms for Inland Waters. Remote Sens. 2019, 11, 169. [Google Scholar] [CrossRef]
  19. He, X.; Bai, Y.; Pan, D.; Tang, J.; Wang, D. Atmospheric Correction of Satellite Ocean Color Imagery Using the Ultraviolet Wavelength for Highly Turbid Waters. Opt. Express 2012, 20, 20754–20770. [Google Scholar] [CrossRef]
  20. Singh, R.K.; Shanmugam, P.; He, X.; Schroeder, T. UV-NIR Approach with Non-Zero Water-Leaving Radiance Approximation for Atmospheric Correction of Satellite Imagery in Inland and Coastal Zones. Opt. Express 2019, 27, A1118–A1145. [Google Scholar] [CrossRef]
  21. Gossn, J.I.; Ruddick, K.G.; Dogliotti, A.I. Atmospheric Correction of OLCI Imagery over Extremely Turbid Waters Based on the Red, NIR and 1016 Nm Bands and a New Baseline Residual Technique. Remote Sens. 2019, 11, 220. [Google Scholar] [CrossRef]
  22. Pahlevan, N.; Schott, J.R.; Franz, B.A.; Zibordi, G.; Markham, B.; Bailey, S.; Schaaf, C.B.; Ondrusek, M.; Greb, S.; Strait, C.M. Landsat 8 Remote Sensing Reflectance (Rrs) Products: Evaluations, Intercomparisons, and Enhancements. Remote Sens. Environ. 2017, 190, 289–301. [Google Scholar] [CrossRef]
  23. Sterckx, S.; Knaeps, S.; Kratzer, S.; Ruddick, K. SIMilarity Environment Correction (SIMEC) Applied to MERIS Data over Inland and Coastal Waters. Remote Sens. Environ. 2015, 157, 96–110. [Google Scholar] [CrossRef]
  24. Vanhellemont, Q. Adaptation of the Dark Spectrum Fitting Atmospheric Correction for Aquatic Applications of the Landsat and Sentinel-2 Archives. Remote Sens. Environ. 2019, 225, 175–192. [Google Scholar] [CrossRef]
  25. Vanhellemont, Q.; Ruddick, K. Atmospheric Correction of Metre-Scale Optical Satellite Data for Inland and Coastal Water Applications. Remote Sens. Environ. 2018, 216, 586–597. [Google Scholar] [CrossRef]
  26. Ruddick, K.G.; Ovidio, F.; Rijkeboer, M. Atmospheric Correction of SeaWiFS Imagery for Turbid Coastal and Inland Waters. Appl. Opt. 2000, 39, 897–912. [Google Scholar] [CrossRef] [PubMed]
  27. Keukelaere, L.D.; Sterckx, S.; Adriaensen, S.; Knaeps, E.; Reusen, I.; Giardino, C.; Bresciani, M.; Hunter, P.; Neil, C.; Van der Zande, D. Atmospheric Correction of Landsat-8/OLI and Sentinel-2/MSI Data Using ICOR Algorithm: Validation for Coastal and Inland Waters. Eur. J. Remote Sens. 2018, 51, 525–542. [Google Scholar] [CrossRef]
  28. Steinmetz, F.; Deschamps, P.-Y.; Ramon, D. Atmospheric Correction in Presence of Sun Glint: Application to MERIS. Opt. Express 2011, 19, 9783–9800. [Google Scholar] [CrossRef]
  29. Steinmetz, F.; Ramon, D. Sentinel-2 MSI and Sentinel-3 OLCI Consistent Ocean Colour Products Using POLYMER. In Proceedings of the Remote Sensing of the Open and Coastal Ocean and Inland Waters, Honolulu, HI, USA, 24–25 September 2018; Volume 10778, pp. 46–55. [Google Scholar]
  30. Wang, J.; Lee, Z.; Wang, D.; Shang, S.; Wei, J.; Gilerson, A. Atmospheric Correction over Coastal Waters with Aerosol Properties Constrained by Multi-Pixel Observations. Remote Sens. Environ. 2021, 265, 112633. [Google Scholar] [CrossRef]
  31. Brockmann, C.; Doerffer, R.; Peters, M.; Kerstin, S.; Embacher, S.; Ruescas, A. Evolution of the C2RCC Neural Network for Sentinel 2 and 3 for the Retrieval of Ocean Colour Products in Normal and Extreme Optically Complex Waters. In Proceedings of the Living Planet Symposium, Prague, Czech Republic, 9–13 May 2016; Volume 740, p. 54. [Google Scholar]
  32. Fan, Y.; Li, W.; Gatebe, C.K.; Jamet, C.; Zibordi, G.; Schroeder, T.; Stamnes, K. Atmospheric Correction over Coastal Waters Using Multilayer Neural Networks. Remote Sens. Environ. 2017, 199, 218–240. [Google Scholar] [CrossRef]
  33. Fan, Y.; Li, W.; Chen, N.; Ahn, J.-H.; Park, Y.-J.; Kratzer, S.; Schroeder, T.; Ishizaka, J.; Chang, R.; Stamnes, K. OC-SMART: A Machine Learning Based Data Analysis Platform for Satellite Ocean Color Sensors. Remote Sens. Environ. 2021, 253, 112236. [Google Scholar] [CrossRef]
  34. Novoa, S.; Doxaran, D.; Ody, A.; Vanhellemont, Q.; Lafon, V.; Lubac, B.; Gernez, P. Atmospheric Corrections and Multi-Conditional Algorithm for Multi-Sensor Remote Sensing of Suspended Particulate Matter in Low-to-High Turbidity Levels Coastal Waters. Remote Sens. 2017, 9, 61. [Google Scholar] [CrossRef]
  35. Martins, V.S.; Barbosa, C.C.F.; De Carvalho, L.A.S.; Jorge, D.S.F.; Lobo, F.D.L.; Novo, E.M.L.d.M. Assessment of Atmospheric Correction Methods for Sentinel-2 MSI Images Applied to Amazon Floodplain Lakes. Remote Sens. 2017, 9, 322. [Google Scholar] [CrossRef]
  36. Warren, M.A.; Simis, S.G.H.; Martinez-Vicente, V.; Poser, K.; Bresciani, M.; Alikas, K.; Spyrakos, E.; Giardino, C.; Ansper, A. Assessment of Atmospheric Correction Algorithms for the Sentinel-2A MultiSpectral Imager over Coastal and Inland Waters. Remote Sens. Environ. 2019, 225, 267–289. [Google Scholar] [CrossRef]
  37. Renosh, P.R.; Doxaran, D.; Keukelaere, L.D.; Gossn, J.I. Evaluation of Atmospheric Correction Algorithms for Sentinel-2-MSI and Sentinel-3-OLCI in Highly Turbid Estuarine Waters. Remote Sens. 2020, 12, 1285. [Google Scholar] [CrossRef]
  38. Bui, Q.-T.; Jamet, C.; Vantrepotte, V.; Mériaux, X.; Cauvin, A.; Mograne, M.A. Evaluation of Sentinel-2/MSI Atmospheric Correction Algorithms over Two Contrasted French Coastal Waters. Remote Sens. 2022, 14, 1099. [Google Scholar] [CrossRef]
  39. Song, Q.; Chen, S.; Hu, L.; Wang, X.; Shi, X.; Li, X.; Deng, L.; Ma, C. Introducing Two Fixed Platforms in the Yellow Sea and East China Sea Supporting Long-Term Satellite Ocean Color Validation: Preliminary Data and Results. Remote Sens. 2022, 14, 2894. [Google Scholar] [CrossRef]
  40. Jilan, S.; Kangshan, W. Changjiang River Plume and Suspended Sediment Transport in Hangzhou Bay. Cont. Shelf Res. 1989, 9, 93–111. [Google Scholar] [CrossRef]
  41. Jiyu, C.; Cangzi, L.; Chongle, Z.; Walker, H.J. Geomorphological Development and Sedimentation in Qiantang Estuary and Hangzhou Bay. J. Appl. Remote Sens. 1990, 6, 559–572. [Google Scholar]
  42. Lin, C.-M.; Zhuo, H.-C.; Gao, S. Sedimentary Facies and Evolution in the Qiantang River Incised Valley, Eastern China. Mar. Geol. 2005, 219, 235–259. [Google Scholar] [CrossRef]
  43. Xie, D.; Wang, Z.; Gao, S.; De Vriend, H.J. Modeling the Tidal Channel Morphodynamics in a Macro-Tidal Embayment, Hangzhou Bay, China. Cont. Shelf Res. 2009, 29, 1757–1767. [Google Scholar] [CrossRef]
  44. He, X.; Bai, Y.; Pan, D.; Huang, N.; Dong, X.; Chen, J.; Chen, C.-T.A.; Cui, Q. Using Geostationary Satellite Ocean Color Data to Map the Diurnal Dynamics of Suspended Particulate Matter in Coastal Waters. Remote Sens. Environ. 2013, 133, 225–239. [Google Scholar] [CrossRef]
  45. Shen, F.; Zhou, Y.; Li, J.; He, Q.; Verhoef, W. Remotely Sensed Variability of the Suspended Sediment Concentration and Its Response to Decreased River Discharge in the Yangtze Estuary and Adjacent Coast. Cont. Shelf Res. 2013, 69, 52–61. [Google Scholar] [CrossRef]
  46. Zhang, M.; Tang, J.; Dong, Q.; Song, Q.; Ding, J. Retrieval of Total Suspended Matter Concentration in the Yellow and East China Seas from MODIS Imagery. Remote Sens. Environ. 2010, 114, 392–403. [Google Scholar] [CrossRef]
  47. Xu, Y.; He, X.; Bai, Y.; Wang, D.; Zhu, Q.; Ding, X. Evaluation of Remote-Sensing Reflectance Products from Multiple Ocean Color Missions in Highly Turbid Water (Hangzhou Bay). Remote Sens. 2021, 13, 4267. [Google Scholar] [CrossRef]
  48. Dai, Q.; Pan, D.; He, X.; Zhu, Q.; Gong, F.; Huang, H. High-Frequency Observation of Water Spectrum and Its Application in Monitoring of Dynamic Variation of Suspended Materials in the Hangzhou Bay. Guang Pu 2015, 35, 3247–3254. [Google Scholar] [PubMed]
  49. Zibordi, G.; Mélin, F.; Berthon, J.-F.; Holben, B.; Slutsker, I.; Giles, D.; D’Alimonte, D.; Vandemark, D.; Feng, H.; Schuster, G.; et al. AERONET-OC: A Network for the Validation of Ocean Color Primary Products. J. Atmos. Oceanic Technol. 2009, 26, 1634–1651. [Google Scholar] [CrossRef]
  50. Wang, M.; Bailey, S.W. Correction of Sun Glint Contamination on the SeaWiFS Ocean and Atmosphere Products. Appl. Opt. 2001, 40, 4790–4798. [Google Scholar] [CrossRef]
  51. Mobley, C.D. Estimation of the Remote-Sensing Reflectance from above-Surface Measurements. Appl. Opt. 1999, 38, 7442–7455. [Google Scholar] [CrossRef]
  52. Wei, J.; Lee, Z.; Shang, S. A System to Measure the Data Quality of Spectral Remote-Sensing Reflectance of Aquatic Environments. J. Geophys. Res. Oceans 2016, 121, 8189–8207. [Google Scholar] [CrossRef]
  53. Vermote, E.F.; El Saleous, N.; Justice, C.O.; Kaufman, Y.J.; Privette, J.L.; Remer, L.; Roger, J.C.; Tanré, D. Atmospheric Correction of Visible to Middle-Infrared EOS-MODIS Data over Land Surfaces: Background, Operational Algorithm and Validation. J. Geophys. Res. Atmos. 1997, 102, 17131–17141. [Google Scholar] [CrossRef]
  54. Ibrahim, A.; Franz, B.A.; Ahmad, Z.; Healy, R.J.; Gao, B.C. Hyperspectral Atmospheric Correction Using L2gen; American Geophysical Union: Washington, DC, USA, 2016; Volume 2016, p. EC34D-1208. [Google Scholar]
  55. Bailey, S.W.; Franz, B.A.; Werdell, P.J. Estimation of Near-Infrared Water-Leaving Reflectance for Satellite Ocean Color Data Processing. Opt. Express 2010, 18, 7521–7527. [Google Scholar] [CrossRef]
  56. Ahmad, Z.; Fraser, R.S. An Iterative Radiative Transfer Code For Ocean-Atmosphere Systems. J. Atmos. Sci. 1982, 39, 656–665. [Google Scholar] [CrossRef]
  57. Lenoble, J.; Herman, M.; Deuzé, J.L.; Lafrance, B.; Santer, R.; Tanré, D. A Successive Order of Scattering Code for Solving the Vector Equation of Transfer in the Earth’s Atmosphere with Aerosols. J. Quant. Spectrosc. Radiat. Transf. 2007, 107, 479–507. [Google Scholar] [CrossRef]
  58. Vanhellemont, Q. Sensitivity Analysis of the Dark Spectrum Fitting Atmospheric Correction for Metre- and Decametre-Scale Satellite Imagery Using Autonomous Hyperspectral Radiometry. Opt. Express 2020, 28, 29948–29965. [Google Scholar] [CrossRef]
  59. Franz, B.A.; Bailey, S.W.; Kuring, N.; Werdell, P.J. Ocean Color Measurements with the Operational Land Imager on Landsat-8: Implementation and Evaluation in SeaDAS. J. Appl. Remote Sens. 2015, 9, 096070. [Google Scholar] [CrossRef]
  60. Vanhellemont, Q.; Ruddick, K. Assessment of Sentinel-3/OLCI Sub-Pixel Variability and Platform Impact Using Landsat-8/OLI. In Proceedings of the Sentinel-3 for Science Workshop, Venice-Lido, Italy, 2–5 June 2015; p. 8. [Google Scholar]
  61. Pereira-Sandoval, M.; Ruescas, A.; Urrego, P.; Ruiz-Verdu, A.; Delegido, J.; Tenjo, C.; Soria-Perpinya, X.; Vicente, E.; Soria, J.; Moreno, J. Evaluation of Atmospheric Correction Algorithms over Spanish Inland Waters for Sentinel-2 Multi Spectral Imagery Data. Remote Sens. 2019, 11, 1469. [Google Scholar] [CrossRef]
  62. Maciel, F.P.; Pedocchi, F. Evaluation of ACOLITE Atmospheric Correction Methods for Landsat-8 and Sentinel-2 in the Río de La Plata Turbid Coastal Waters. Int. J. Remote Sens. 2022, 43, 215–240. [Google Scholar] [CrossRef]
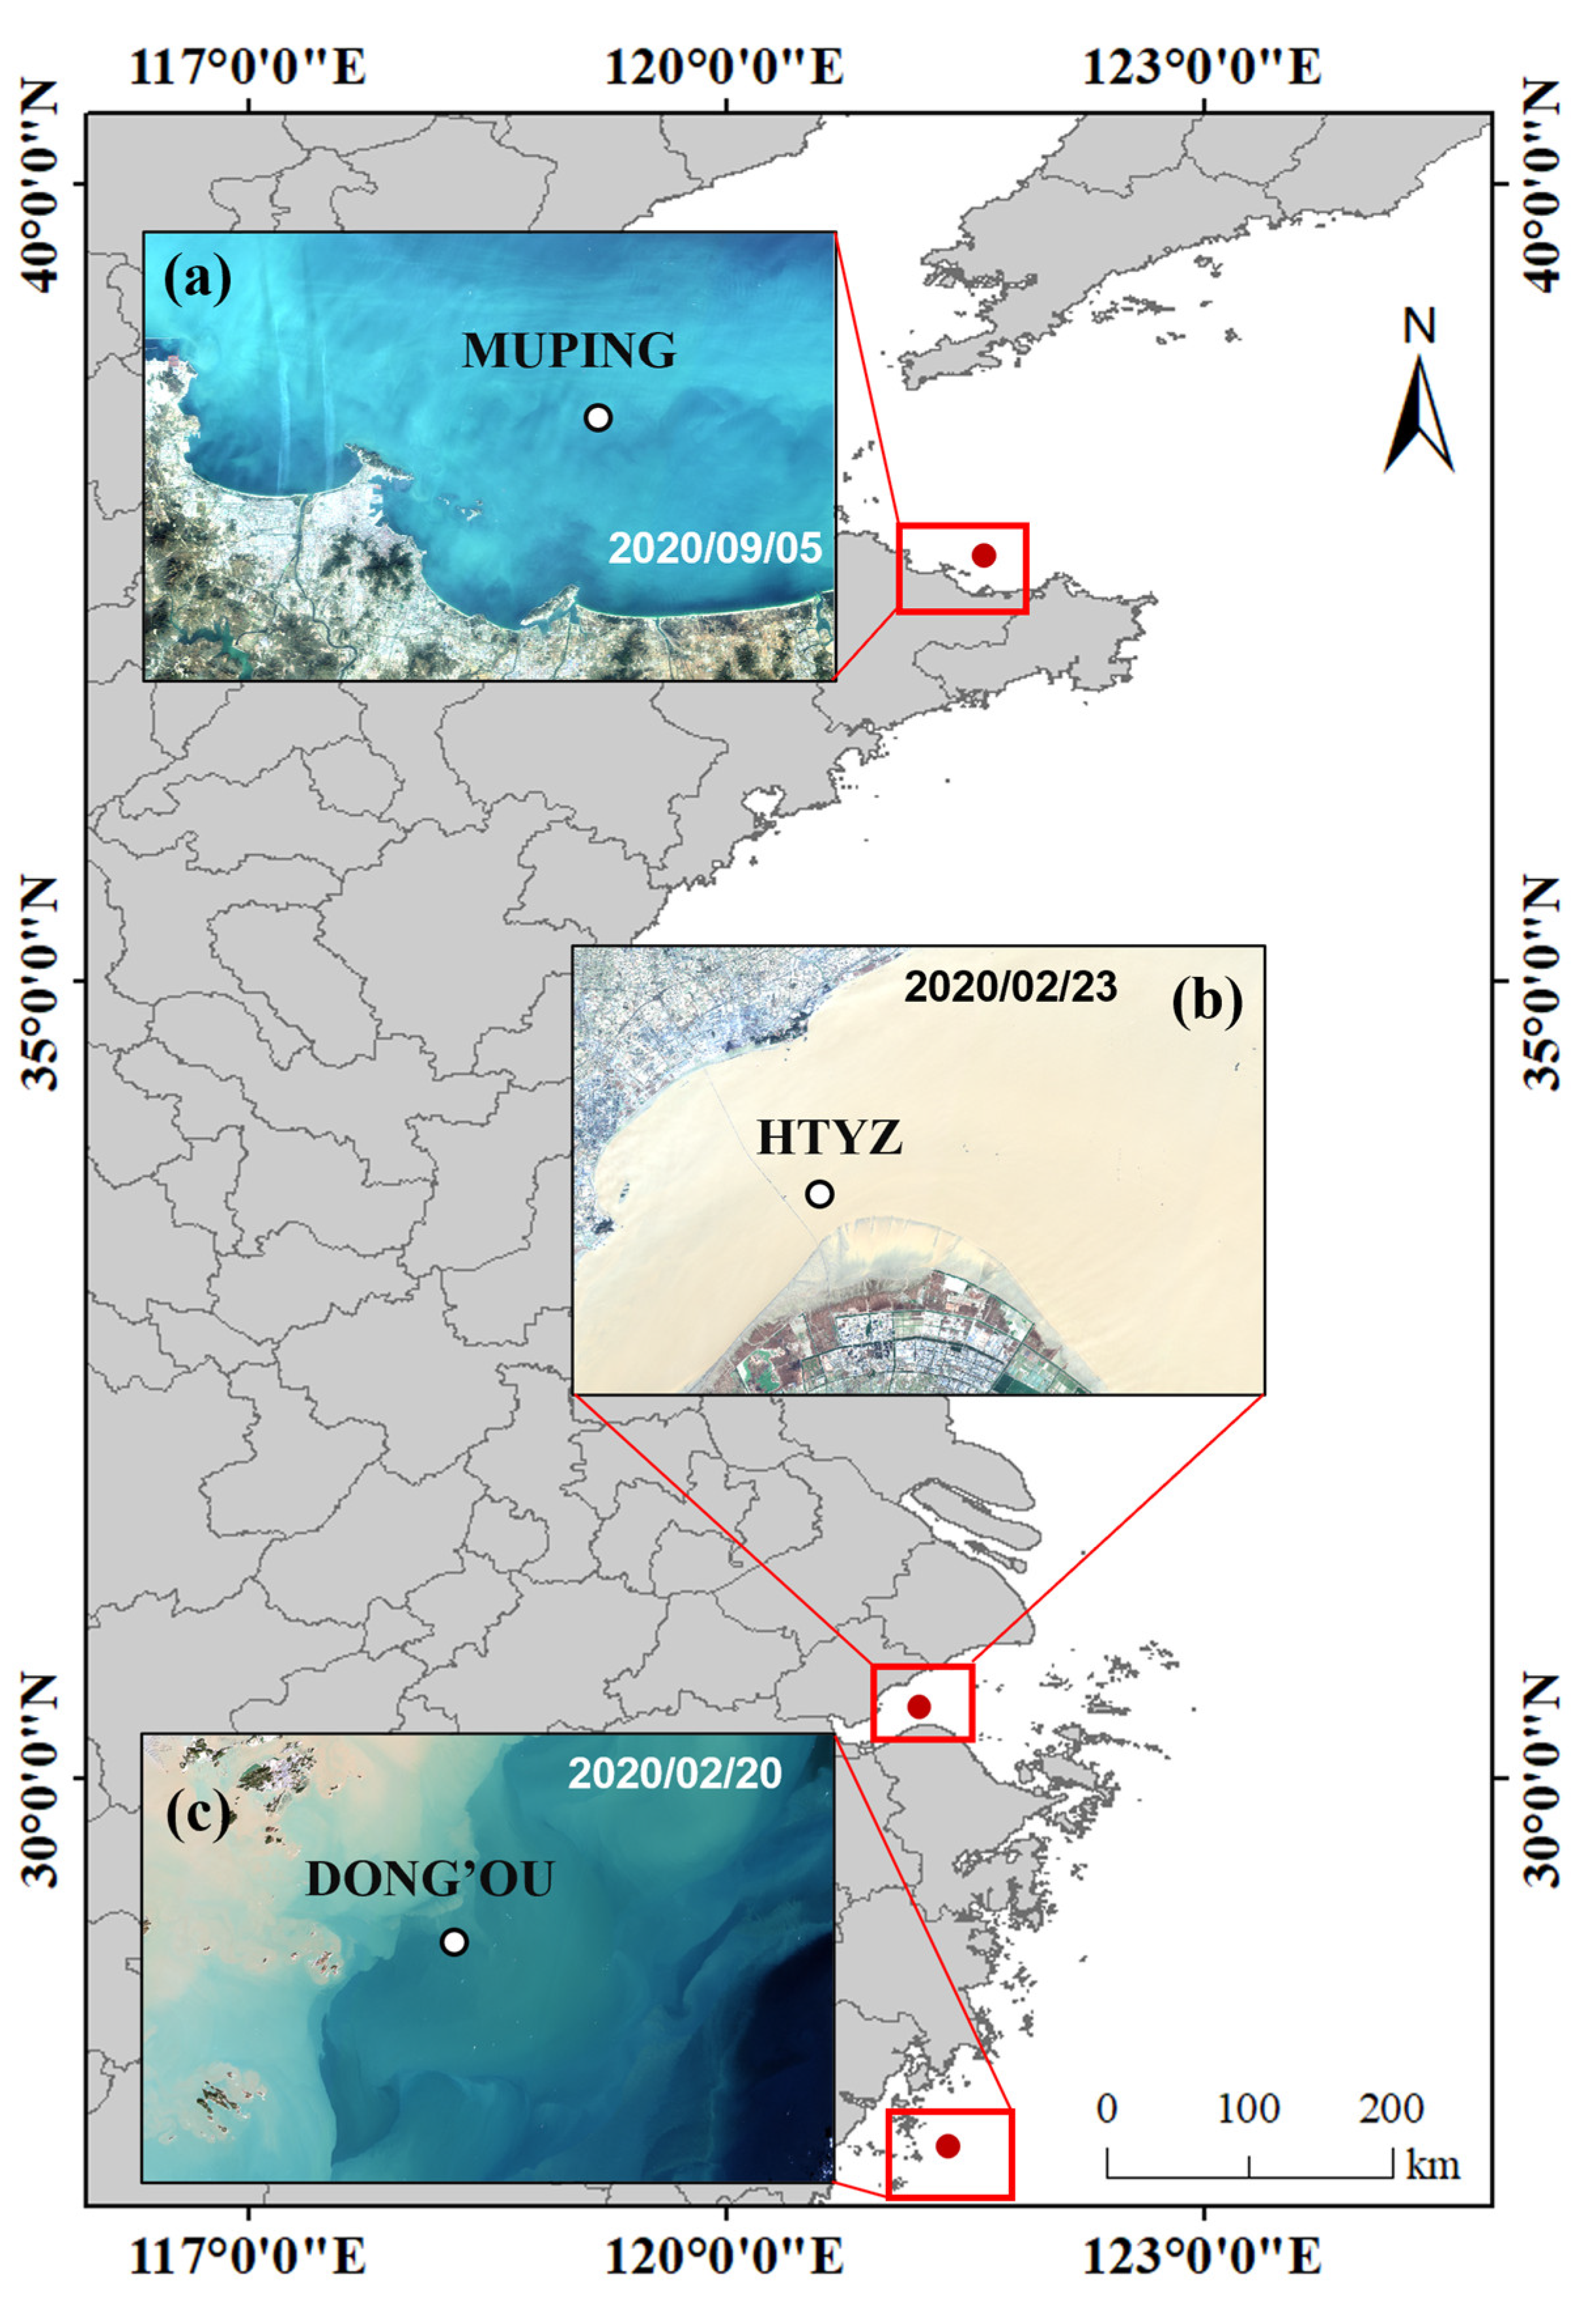
Figure 1. Map of the distribution of the sites considered. Location of (a) MUPING site containing water with low turbidity, (b) HTYZ site containing highly turbid water, and (c) DONG’OU site containing water with medium turbidity. Red dots represent the locations of the sites. The three subplots represent the RGB composites of ρ s near the sites.
Remotesensing 15 02353 g001
Figure 2. Filtering and matching the spectral data.
Remotesensing 15 02353 g002
Figure 3. In situ Rrs spectra of the three sites with water with varying turbidity. The high−turbidity site (HTYZ) is represented by the yellow block, and its average spectrum is represented by the yellow dotted line. The medium-turbidity site (DONG’OU) is represented by the green block, and its average spectrum is represented by the green dotted line. The low-turbidity site (MUPING) is represented by the blue block, and its average spectrum is represented by the solid blue line.
Remotesensing 15 02353 g003
Figure 4. Extraction windows of satellite scenes for three stations. The pinning cursor represents the pixel location of the site.
Remotesensing 15 02353 g004
Figure 5. Map of the temporal distribution of the matchups, with the x−axis representing the time series and the y−axis denoting the QAS scores of the in situ spectrum in the matchups. Red dots represent HTYZ site, green dots represent DONG’OU site, and blue dots represent MUPING site.
Remotesensing 15 02353 g005
Figure 6. Scatter plot showing the comparison between Rrssat and Rrsin situ at the HTYZ, DONG’OU, and MUPING sites. The plot includes the results of the four AC methods ACOLITE−DSF, SeaDAS, POLYMER−default, and C2RCC. It is arranged in four columns corresponding to the four VNIR bands (443 nm, 490 nm, 560 nm, and 665 nm), and each row represents an atmospheric correction method. The points are color−coded based on the site, with red representing HTYZ, green representing DONG’OU, and blue representing MUPING. The solid circular labels indicate matching points for Sentinel−2A, while the hollow circular labels indicate those for Sentinel−2B. Each subfigure represents the performance of different AC processors in different bands at three sites. (i)(a) Presents a scatter plot comparing the Rrs_440nm calculated by the Acolite AC processor DSF algorithm and in situ Rrs_440nm at three sites. (i)(b) Presents a scatter plot comparing the Rrs_490nm values calculated by the Acolite AC processor DSF algorithm and in situ Rrs_490nm at three sites. (i)(c) Presents a scatter plot comparing the Rrs_560nm calculated by the Acolite AC processor DSF algorithm and in situ Rrs_560nm at three sites. (i)(d) Presents a scatter plot comparing the Rrs_665nm calculated by the Acolite AC processor DSF algorithm and in situ Rrs_665nm at three sites. (ii)(a) Presents a scatter plot comparing the Rrs_440nm calculated by the SeaDAS AC processor and in situ Rrs_440nm at three sites. The HTYZ site utilized the SeaDAS-MUMM algorithm while the DONG’OU and MUPING site utilized the SeaDAS-NIR algorithm. (ii)(b) Presents a scatter plot comparing the Rrs_490nm calculated by the SeaDAS AC processor and in situ Rrs_490nm at three sites. The HTYZ site utilized the SeaDAS-MUMM algorithm while the DONG’OU and MUPING site utilized the SeaDAS-NIR algorithm. (ii)(c) Presents a scatter plot comparing the Rrs_560nm calculated by the SeaDAS AC processor and in situ Rrs_560nm at three sites. The HTYZ site utilized the SeaDAS-MUMM algorithm while the DONG’OU and MUPING site utilized the SeaDAS-NIR algorithm. (ii)(d) Presents a scatter plot comparing the Rrs_665nm calculated by the SeaDAS AC processor and in situ Rrs_665nm at three sites. The HTYZ site utilized the SeaDAS-MUMM algorithm while the DONG’OU and MUPING site utilized the SeaDAS-NIR algorithm. (iii)(a) Presents a scatter plot comparing the Rrs_440nm calculated by the POLYMER AC processor default algorithm and in situ Rrs_440nm at three sites. (iii)(b) Presents a scatter plot comparing the Rrs_490nm calculated by the POLYMER AC processor default algorithm and in situ Rrs_490nm at three sites. (iii)(c) Presents a scatter plot comparing the Rrs_560nm calculated by the POLYMER AC processor default algorithm and in situ Rrs_560nm at three sites. (iii)(d) Presents a scatter plot comparing the Rrs_665nm calculated by the POLYMER AC processor default algorithm and in situ Rrs_665nm at three sites. (iv)(a) Presents a scatter plot comparing the Rrs_440nm calculated by the C2RCC AC processor and in situ Rrs_440nm at three sites. The HTYZ site utilized the C2RCC-c2x Nets while the DONG’OU and MUPING site utilized the C2RCC-c2rcc Nets. (iv)(b) Presents a scatter plot comparing the Rrs_490nm calculated by the C2RCC AC processor and in situ Rrs_490nm at three sites. The HTYZ site utilized the C2RCC-c2x Nets while the DONG’OU and MUPING site utilized the C2RCC-c2rcc Nets. (iv)(c) Presents a scatter plot comparing the Rrs_560nm calculated by the C2RCC AC processor and in situ Rrs_560nm at three sites. The HTYZ site utilized the C2RCC-c2x Nets while the DONG’OU and MUPING site utilized the C2RCC-c2rcc Nets. (iv)(d) Presents a scatter plot comparing the Rrs_665nm calculated by the C2RCC AC processor and in situ Rrs_665nm at three sites. The HTYZ site utilized the C2RCC-c2x Nets while the DONG’OU and MUPING site utilized the C2RCC-c2rcc Nets.
Remotesensing 15 02353 g006
Figure 7. Comparative analysis of matching data of Sentinel−2 based on the values of R, R M S E , and M A P E . The spectral bands are distinguished by color.
Remotesensing 15 02353 g007
Figure 8. Comparison of the effects of atmospheric correction of ACOLITE−EXP and ACOLITE−DSF for data on the HTYZ site.
Remotesensing 15 02353 g008
Table 1. Information on the orbits and tiles of Sentinel−2.
SiteOrbitTile
HTYZR089T51RUP
DONG’OUR089T51SUB
MUPINGR046T51RUL
Table 2. AC processors considered in the study.
ACOLITE
(DSF\EXP)
SeaDAS
(NIR\MUMM)
POLYMERC2RCC
(C2rcc\C2x)
CategoriesTwo stepTwo stepTwo stepMachine learning
Aerosol algorithmDark target approach (tiled) & SWIR extrapolation (per pixel) NIR-SWIR band ratio (per pixel)Polynomial fitting (per pixel)-
Cloud masking ρ t 1610 > 0.0215 ρ t 865 > 0.0275   0 < N D W I < 1.1 ρ t 865 > 0.2 IdePix
Output grid cell pixel (m)102010/20/6010/20/60
Version202111248.2.04.141.1
Open-source accessYesYesYesYes
Table 3. Final number of matchups for the four AC processors across the three sites.
SiteTotal MatchupsSatelliteACOLITESeaDASPOLYMERC2RCC
HTYZ20Sentinel−2A1010103
Sentinel−2B101094
DONG’OU38Sentinel−2A22222222
Sentinel−2B16161616
MUPING23Sentinel−2A12121313
Sentinel−2B971010
Table 4. Errors in values of Rrs of different processors at the three sites.
HTYZDONG’OUMUPING
R R M S E
(SR−1)
M A P E
(%)
R R M S E
(SR−1)
M A P E
(%)
R R M S E
(SR−1)
M A P E
(%)
ACOLITE–DSF
(N = 20, 38, 21)
443−0.00210.021262.260.58330.005463.730.57810.0080113.78
4900.16930.021548.960.80190.004129.800.76920.005953.49
5600.40790.021034.070.89160.004120.450.85430.004839.51
6650.42940.021628.440.94050.003584.420.68230.0031163.78
SeaDAS
(N = 20, 38, 19)
4430.21040.014442.660.13970.010176.800.47890.005141.08
4900.27250.013231.440.27990.009248.480.75820.005135.38
5600.37200.013823.250.42910.009641.460.86780.004424.45
6650.46360.016921.860.61000.006286.040.75430.003152.14
POLYMER
(N = 19, 38, 23)
4430.07150.023269.640.55120.003629.740.57650.003843.36
4900.09360.027268.700.68960.004126.640.87760.003730.63
5600.15440.024342.460.80480.005023.570.94020.003925.24
6650.12390.022630.390.95340.002160.330.82400.002183.25
C2RCC
(N = 7, 38, 23)
443−0.03890.027678.040.88400.001917.300.71560.003633.44
4900.07610.029165.670.92120.002718.560.80140.004125.73
5600.21790.028146.610.93490.003212.510.91390.003019.03
6650.35650.039559.150.97140.001625.960.85330.002235.45
Table 5. Ratio of the number of valid corrected data items (N1) of ACOLITE−EXP and the total number of matchups (N2) for the HTYZ site.
Band Combination (nm)S2A (N1/N2)S2B (N1/N2)
865–16100/101/10
865–22000/102/10
1610–220010/1010/10
Table 6. Errors in the results of Rrs retrieved by the ACOLITE DSF and EXP algorithms.
Band (nm)R R M S E ( s r 1 ) M A P E (%)
DSF
(N = 20)
443−0.00210.021262.26
4900.16930.021548.96
5600.40790.021034.07
6650.42940.021628.44
EXP
(N = 20)
4430.14310.012831.87
4900.23860.016129.98
5600.30770.022436.57
6650.22770.024532.80
Disclaimer/Publisher’s Note: The statements, opinions and data contained in all publications are solely those of the individual author(s) and contributor(s) and not of MDPI and/or the editor(s). MDPI and/or the editor(s) disclaim responsibility for any injury to people or property resulting from any ideas, methods, instructions or products referred to in the content.