Article

Epoch-Wise Estimation and Analysis of GNSS Receiver DCB under High and Low Solar Activity Conditions

1
School of Geography and Planning, Sun Yat-sen University, Guangzhou 510006, China
2
Guangzhou Urban Planning and Design Survey Research Institute, Guangzhou 510003, China
3
Guangdong Enterprise Key Laboratory for Urban Sensing, Monitoring and Early Warning, Guangzhou 510003, China
*
Author to whom correspondence should be addressed.
Remote Sens. 2023, 15(8), 2190; https://doi.org/10.3390/rs15082190
Submission received: 13 March 2023 / Revised: 14 April 2023 / Accepted: 15 April 2023 / Published: 20 April 2023

Abstract

:
Differential code bias (DCB) is one of the main errors involved in ionospheric total electron content (TEC) retrieval using a global navigation satellite system (GNSS). It is typically assumed to be constant over time. However, this assumption is not always valid because receiver DCBs have long been known to exhibit apparent intraday variations. In this paper, a combined method is introduced to estimate the epoch-wise receiver DCB, which is divided into two parts: the receiver DCB at the initial epoch and its change with respect to the initial value. In the study, this method was proved feasible by subsequent experiments and was applied to analyze the possible reason for the intraday receiver DCB characteristics of 200 International GNSS Service (IGS) stations in 2014 (high solar activity) and 2017 (low solar activity). The results show that the proportion of intraday receiver DCB stability less than 1 ns increased from 72.5% in 2014 to 87% in 2017, mainly owing to the replacement of the receiver hardware in stations. Meanwhile, the intraday receiver DCB estimates in summer generally exhibited more instability than those in other seasons. Although more than 90% of the stations maintained an intraday receiver DCB stability within 2 ns, substantial variations with a peak-to-peak range of 5.78 ns were detected for certain stations, yielding an impact of almost 13.84 TECU on the TEC estimates. Moreover, the intraday variability of the receiver DCBs is related to the receiver environment temperature. Their correlation coefficient (greater than 0.5 in our analyzed case) increases with the temperature. By contrast, the receiver firmware version does not exert a great impact on the intraday variation characteristics of the receiver DCB in this case.

1. Introduction

Due to high temporal continuity and spatial coverage, global navigation satellite systems (GNSSs) have become a key technology, leading to significant advances in ionosphere sounding [1,2]. The GNSS-derived ionospheric total electron content (TEC) can provide information beneficial to space weather [3,4,5], seismic hazard research [6] and significant improvements in GNSS positioning, such as precise point positioning (PPP) [7,8] or PPP enabled by real-time kinematic integer ambiguity resolution (PPP-RTK) [9,10,11,12]. When sensing the ionosphere using a GNSS code and phase observations, the satellite and receiver differential code biases (DCBs) are one of the main sources of error in estimating the TEC [13,14]. By employing an ionospheric model, these biases in ionospheric observables can be extracted and calibrated [15,16,17]. Thus, the accuracy of the resulting STEC estimates is directly affected by the satellite and receiver DCB accuracies [18,19]. According to prior research [20], the estimated levels of precision of satellite and receiver DCBs within the framework of the International GNSS Service (IGS) can reach 0.1 ns and 1 ns, respectively. Nevertheless, the assumption that the DCBs are constant or almost constant on a daily timescale is imposed as an implicit constraint. In fact, since the space environment on board a GNSS constellation is nearly constant, satellite DCBs have indeed been found to remain fairly stable over considerable periods of time [21,22]. However, significant intraday variations, ranging from 1.4 to 8.8 TECU, have been detected in the estimated values of receiver DCBs and have been found to be related to temperature perturbations near the receiver [18,23,24]. If this variability is not properly considered in the receiver DCB estimation process, it will severely degrade the accuracy of the STEC estimates and could even be mistaken as the variability of the local ionosphere. Hence, addressing the short-term temporal variability of receiver DCB is a crucial task for enhancing the reliability of GNSS-derived TEC measurements.
The existing studies that have examined the time variability of receiver DCBs using real GNSS data can be classified into two groups. The first group considers receiver DCB estimates as byproducts of ionospheric modeling. Their methods consist of either estimating the DCBs and the parameters of the ionospheric model in a common adjustment process or determining the DCB estimates using pre-computed global ionosphere maps (GIMs) [25,26]. Because of the high correlation between DCBs and the ionosphere, these DCB estimates may be susceptible to modeling errors in the ionospheric model (e.g., a GIM), especially in active ionosphere regions. Regarding the trends and instabilities observed in the receiver DCBs, it is necessary to discriminate between real physical effects and those related to modeling errors in the ionospheric model [27,28]. In the second group of studies, this modeling error analysis can be avoided, because the dependence on the ionospheric modeling process is completely eliminated. These studies assessed the short-term variations in receiver DCBs directly on the basis of between-receiver differences in ionospheric observables or code-only geometry-free observables collected by two collocated receivers with a zero- or short-baseline setup [18,29]. Since most common source of biases can be largely eliminated in a zero- or short-baseline setup, the between-receiver DCBs (BR-DCBs) can be obtained epoch by epoch. However, these results only represent the relative variations in the DCBs between a given receiver pair. To understand the DCB performance of one specific receiver, another previously calibrated receiver or a GNSS simulator is required [30].
To eliminate the need for either ionospheric modeling or an external reference such as a short-baseline setup or GNSS simulator, we introduced an effective method called modified carrier-to-code leveling (MCCL) for detecting receiver DCB variations (relative values with respect to the first epoch) in an epoch-wise manner using a standalone receiver [31]. On the basis of MCCL, in this paper, we aim to carry out the following work: (1) obtaining the absolute receiver DCB estimates with an epoch-wise temporal resolution using receiver DCB offsets together with the datum isolated from MCCL-derived ionospheric measurements; (2) assessing the intraday stability of the receiver DCBs for IGS stations, most of which have standalone receivers, meaning that the short-term temporal variations in their single-receiver DCBs cannot be understood using the typical zero- or short-baseline setup, as in the methodology proposed by [18]; and (3) investigating the possible factors accounting for the intraday variability of receiver DCBs.
This paper proceeds as follows. First, we review the derivation procedure for MCCL and describe how to address the rank deficiencies in detail. Then, we introduce the approach to retrieving the absolute receiver DCBs based on MCCL and validate this approach by means of simulated DCB variations and an experiment using co-located receivers. Following this validation, we use the proposed approach to assess the intraday stability of the receiver DCBs for 200 IGS stations in two years (2014 and 2017) with different solar activities. Hence, the characteristics of the intraday variations in these receiver DCB estimates are investigated in detail. Furthermore, the significant intraday variations in the receiver DCBs and their adverse effect on STEC estimates are presented. The impacts of the receiver firmware version and the surrounding temperature on the intraday variability of the receiver DCBs are also analyzed. In the last section, we summarize the results and conclusions.

2. Methodology

This section briefly reviews the basic principles and technological aspects of modified carrier-to-code leveling (MCCL), which are used to estimate receiver DCB variations with respect to its value at the initial epoch, and a thin-layer ionospheric model used for isolating the initial value of the receiver DCB from ionosphere observations. We primarily focus on the development of a functional model and the process of epoch-wise receiver DCB estimates.

2.1. MCCL for Receiver DCB Variation and Ionosphere Parameter Estimation

The starting point for CCL is the geometry-free (GF) combination of carrier phase ϕ r , G F s ( i ) and code p r , G F s ( i ) observables. Assuming that receiver r simultaneously tracks satellites s = 1 , , M at frequencies j = 1 , 2 with no cycle slips, the observable equations for each epoch i of a continuous arc (that consists of a total of T epochs) can be given as:
p r , G F s ( i ) = ι r s ( i ) + 1 μ 1 μ 2 d r d s ϕ r , G F s ( i ) = ι r s ( i ) + 1 μ 1 μ 2 λ 1 N r , 1 s λ 2 N r , 2 s
where μ j = λ j 2 / λ 1 2 denotes the frequency-dependent ionospheric coefficient; λ j is the wavelength corresponding to frequency j; ι r s ( i ) denotes the (first-order) slant ionosphere delay at the first frequency; d r and d s denote the receiver and satellite DCBs, respectively, which are considered to be constant over time; and N r , j s is the real-valued ambiguity. In contrast to CCL, the parameterization used in MCCL assumes that the receiver DCBs vary rather than remaining constant over time. With this in mind, a set of new time-varying parameters for the receiver DCBs, denoted as d r ( i ) , is introduced to the original CCL model, allowing the receiver DCBs to vary freely between epochs. Thus, Equation (1) is rewritten as:
p r , G F s ( i ) = ι r s ( i ) + 1 μ 1 μ 2 d r ( i ) d s ϕ r , G F s ( i ) = ι r s ( i ) + 1 μ 1 μ 2 a r , j s
with a r , j s = λ 1 N r , 1 s λ 2 N r , 2 s , which is the real-valued ambiguity.
Unfortunately, Equation (2) represents a rank-deficient system, in which not all parameters can be estimated. We can eliminate the rank deficiency in the equations by choosing S-basis constraints [32]. This usually involves three steps: (1) identifying the types of rank deficiencies; (2) choosing a minimum set of parameters as the datum, the number of which should equal the size of the rank deficiency; and (3) recombining the datum with the other parameters, thereby re-parameterizing the rank deficient equations. From the coefficient matrix of Equation (4), two types of rank deficiencies can be identified, one of which occurs between d s and d r ( i ) and is of size one. One solution is to choose d r ( 1 ) , corresponding to the receiver DCB in the first epoch, as the datum. Lumping d r ( 1 ) into d s and d r ( i ) ,   i > 1 yields:
d ¯ r ( i ) = d r ( i ) d r ( 1 ) d ¯ s = d s d r ( 1 )
The second type of rank deficiency appears among ι r s ( i ) , d ¯ s and a r , j s , and its size is equal to the number of satellites. To resolve this rank deficiency, we chose d ¯ s as the datum, thereby forming the biased slant ionospheric delay ι ˜ r s ( i ) and the biased ambiguity a ¯ r , j s :
ι ˜ r s ( i ) = ι r s ( i ) 1 μ 1 μ 2 d ¯ s a ¯ r , j s = a r , j s d ¯ s
Considering Equations (3) and (4), we can obtain the full-rank form of Equation (2), which reads as follows:
p r , G F s ( i ) = ι ˜ r s ( i ) + 1 μ 1 μ 2 d ¯ r ( i ) ϕ r , G F s ( i ) = ι ˜ r s ( i ) + 1 μ 1 μ 2 a ¯ r , j s
It should be noted that d ¯ r ( i ) at the first epoch does not need to be estimated, owing to the fact that d ¯ r ( 1 ) = d r ( 1 ) d r ( 1 ) = 0 . Thus, at the first epoch, the ionosphere delay parameter ι ˜ r s ( i ) and ambiguity a ¯ r , j s can be estimated from the observations. Then, in the second epoch and beyond, the a ¯ r , j s estimates can be used as the initial values for the subsequent Kalman filter, making ι ˜ r s ( i ) and d ¯ r ( i ) ,   i > 1 estimable. To obtain the original receiver DCBs, d r ( 1 ) must be simply isolated from the biased slant ionospheric delays ι ˜ r s ( i ) by employing a thin-layer ionospheric model. Second, for a standalone receiver, the redundancy of Equation (5) in the filtering process is equal to s 1 i 1 . This condition shows that one satellite is the minimum needed for a unique solution when only two epochs of data are used.

2.2. Isolation of Initial RCB from MCCL-Derived Ionosphere Parameters

As described above, to obtain the absolute receiver DCB variation, the reference datum d r ( 1 ) should be separated from the ionospheric observables, which is achieved by relying on a thin-layer ionospheric model that interprets the whole of the ionospheric space as being compressed into a fictitious spherical shell surrounding the Earth at a fixed height. Correspondingly, the slant ionospheric delay ι r s ( i ) must be translated into a vertical TEC (VTEC) value at the location of the ionospheric pierce point (IPP), which is defined by the intersection of the satellite receiver line of sight with the infinitely thin spherical shell by means of a mapping function m f z . Considering the representation of ι ˜ r s ( i ) in Equation (4), we can obtain
ι ˜ r s ( i ) = 40.23 f 1 2 m f z v r s ( i ) + 1 μ 1 μ 2 d r ( 1 ) d s m f z = 1 sin 2 z ( 1 + H i o n / R e ) 2 1 / 2
where z is the satellite’s zenith angle at the receiver, H i o n is the height of the spherical shell, R e is the mean radius of the Earth, and v r s ( i ) represents the VTEC value. In this study, the generalized triangle series function (GTSF) is chosen to characterize the spatial and temporal variations in the VTEC for a single station [16]. The GTSF reads as follows:
v r s ( i ) = f E n m , C k , S k = n = 0 2 m = 0 2 E n m φ φ 0 n h m                                 + k = 1 4 C k cos k h + S k sin k h
where φ and φ 0 are the geographic latitudes of the ionospheric IPP and the station, respectively; h is the local time at the IPP; and E n m , C k and S k are the model coefficients to be estimated.
By inserting Equation (7) into Equation (8) and decoupling d r ( 1 ) and d s imposing the zero-mean conditions, we obtain the following:
ι ˜ r s ( i ) = 40.23 f 1 2 m f z f E n m , C k , S k + 1 μ 1 μ 2 d r ( 1 ) d s S   d r ( 1 ) , d s T = 0                
where S is a constraint vector, in which the elements corresponding to d r ( 1 )     and     d s are 0 and 1, respectively [33]. All parameters in Equation (8) are estimable. Considering the early estimated relative variation in the receiver DCBs in Equation (3), one can obtain its absolute magnitude as d r ( 1 ) + d ¯ r ( i ) .

3. Results and Analysis

To test the performance of the receiver DCB estimation scheme presented in Section 2, the following performance metrics are employed in this section: (1) the consistency between the receiver DCB variations estimated using the proposed method and the values simulated with a known mathematical function and (2) the consistency between the BR-DCBs estimated using short baselines and the results obtained using the proposed method.

3.1. Validation of Epoch-Wise Receiver DCB Estimates Based on Simulated and Experimental Data

The experimental data were collected by two sets of collocated GPS receivers with a sampling rate of 30 s and a cut-off elevation angle of 5 degrees. The first set of data were also used by the authors of [18] to reveal that the accuracy of the ionospheric TEC retrieved by the levelling method is subject to the severe levelling errors produced by time-varying receiver DCBs.
Table 1 presents an overview of the basic characteristics of the receiver pairs, including the receiver and antenna types, the approximate receiver locations and the periods of time covered by the observations. DLF4 and DLF5, which are two identical receivers, are separated by a zero baseline because they are connected to the same antenna via an antenna-splitter device located 10 m from the antenna of the DLFT. By contrast, ALGO, ALG2 and ALG3 are independently connected to three different antennas, creating three short baselines of distances between 70 and 150 m. During data processing, we used a cut-off elevation angle of 20 degrees to discard particularly noisy GPS data and adopted an elevation-dependent weighting of the observations. The elevation angles were calculated on the basis of the satellite positions computed using broadcast ephemeris and the known receiver positions. The zenith-referenced standard deviations were empirically set to 30 cm for the code and 0.3 cm for the phase. First, simulations were carried out to illustrate the efficiency of the proposed approach. The variations in the receiver DCBs simulated using the given mathematical functions were incorporated into the GPS C1/P1 data, whereas the remaining P2, L1 and L2 data were left as the original data. Then, the changed GPS observables, including the receiver DCBs known a priori, could be obtained. Second, based on [29], we designed zero- and short-baseline experiments to eliminate errors due to ionospheric delays and satellite DCBs, making it possible to retrieve a BR-DCB time series for use as the reference for the single-receiver DCB estimates obtained using the proposed approach.
To verify the effectiveness of the proposed method, we modified the code observation by adding the DCB variation simulated from three types of mathematical representations. This was also used as the reference value for method valuation. In Figure 1, the red lines indicate the simulated values of the receiver DCB obtained from the three given mathematical representations, namely, a constant function (Figure 1a), a cosine function (Figure 1b) and a sine function (Figure 1c), which were also incorporated into the raw code observables collected by ALG3 on day 07 of 2017. The scattered blue dots represent the corresponding estimates retrieved from the modified code observables using the proposed method. It can be seen that an intraday variation of as small as 2 ns in the receiver DCB can successfully be detected, and good agreement between the estimated and simulated values is evident. This agreement demonstrates the feasibility of the proposed approach for retrieving absolute receiver DCB variations using a standalone receiver. The standard deviation of these estimates is at the level of approximately 0.5 ns, which is similar to the noise level of the measurements.
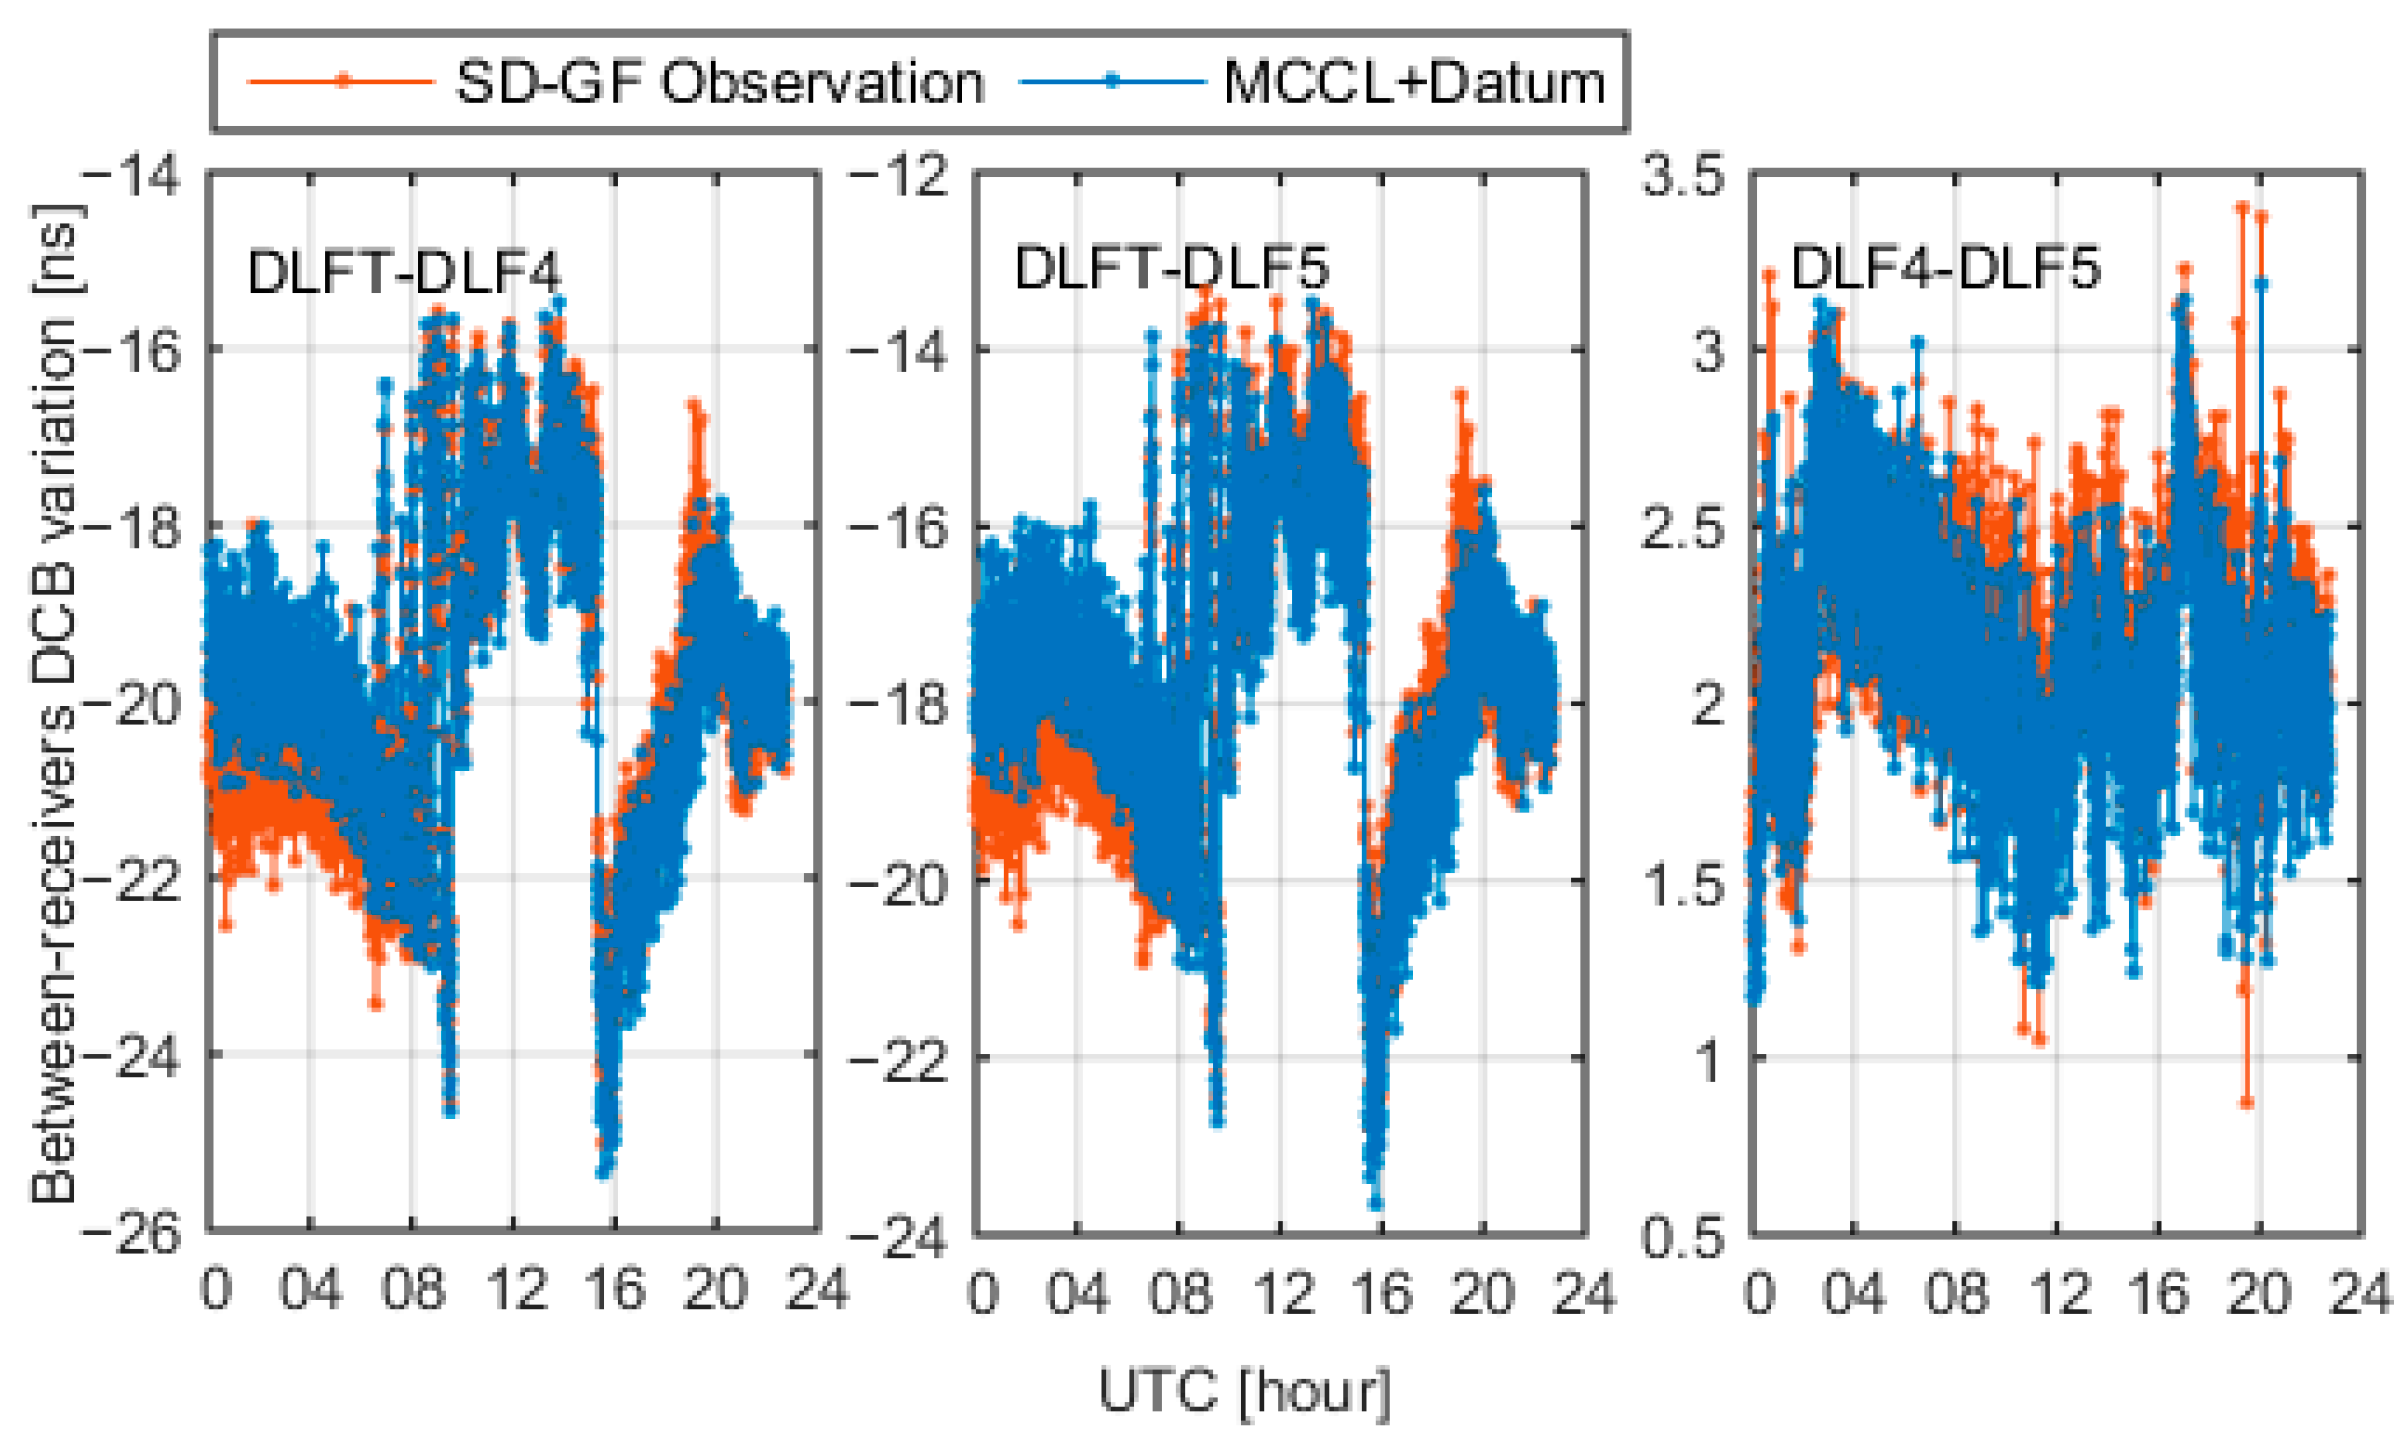
In Figure 2, the BR-DCBs are plotted for three baselines, namely, DLFT-DLF4, DLFT-DLF5 and DLF4-DLF5, on day 172 in 2010. The red lines depict the BR-DCB estimates obtained using the SD-GF method [29]. The blue lines depict the same parameters computed with the single-receiver DCB estimates using the MCCL plus datum method. It can be seen that the red and blue lines present similar change trends, especially the significant intraday variations for the DLFT-DLF4 and DLFT-DLF5, showing an inverted “W-shape” pattern with a peak-to-peak range of almost 8 ns and short-term changes within 15 min reaching approximately 6 ns at 16:00 UTC. For the DLFT-DLF4 configuration, the intraday variation in the BR-DCB is reduced to a peak-to-peak value of approximately 2.3 ns. Clearly, according to the results of the SD-GF method, it is difficult to identify the specific receiver whose DCBs fluctuate significantly, since the results only reflect the relative DCB variation between two co-located receivers.
Figure 3 shows the variations in the single-receiver DCBs estimated using the MCCL plus datum method for the same three receivers (DLFT, DLF4 and DLF5), where the epoch-wise variations in the DCBs were obtained via MCCL and the datum was isolated from the ionospheric observables based on the ionospheric model. Among the considered receivers, none of their DCBs remained stable throughout the analyzed time period. In particular, the receiver DCB of DLFT showed a substantial variation, with a peak-to-peak range of almost 8 ns. This finding also confirms the previous BR-DCB estimates, which indicate that a significant variation in the form of an inverted “W-shape” can mainly be attributed to the instability of the DLFT receiver. At the same time, both DLF4 and DLF5 present less pronounced variations in their receiver DCBs, following a similar trend with a peak-to-peak value of almost 3 ns, since they are of the same receiver type and are connected to the same antenna.
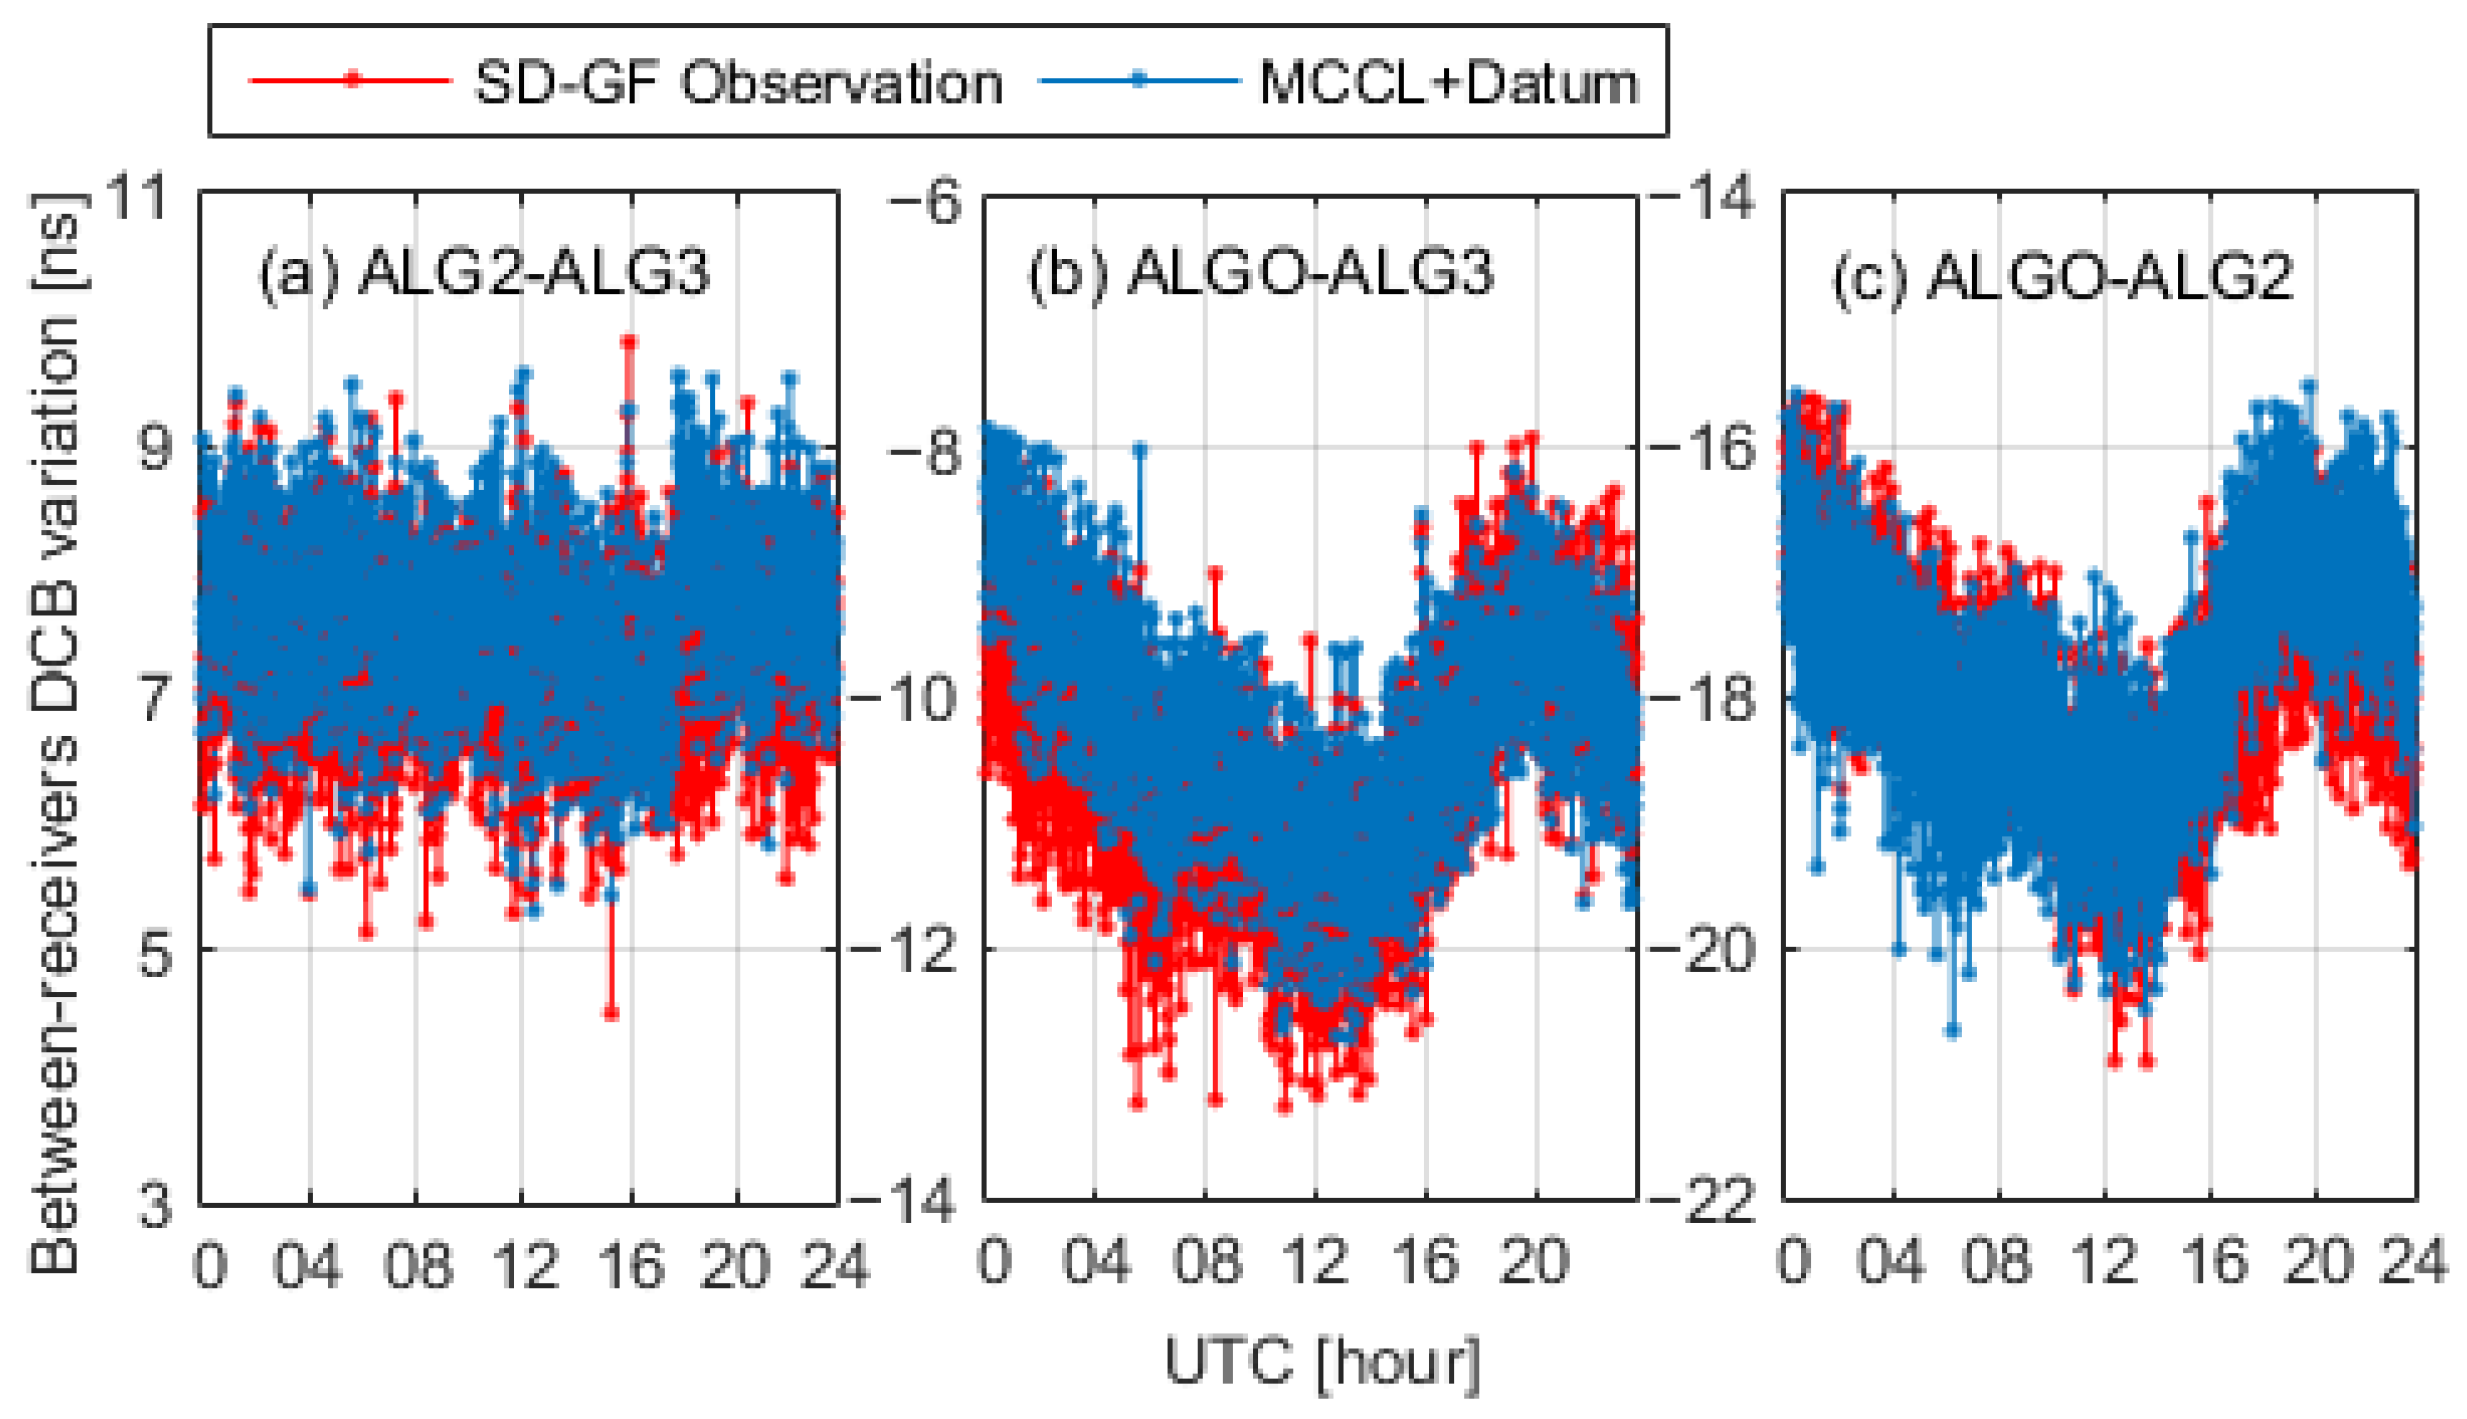
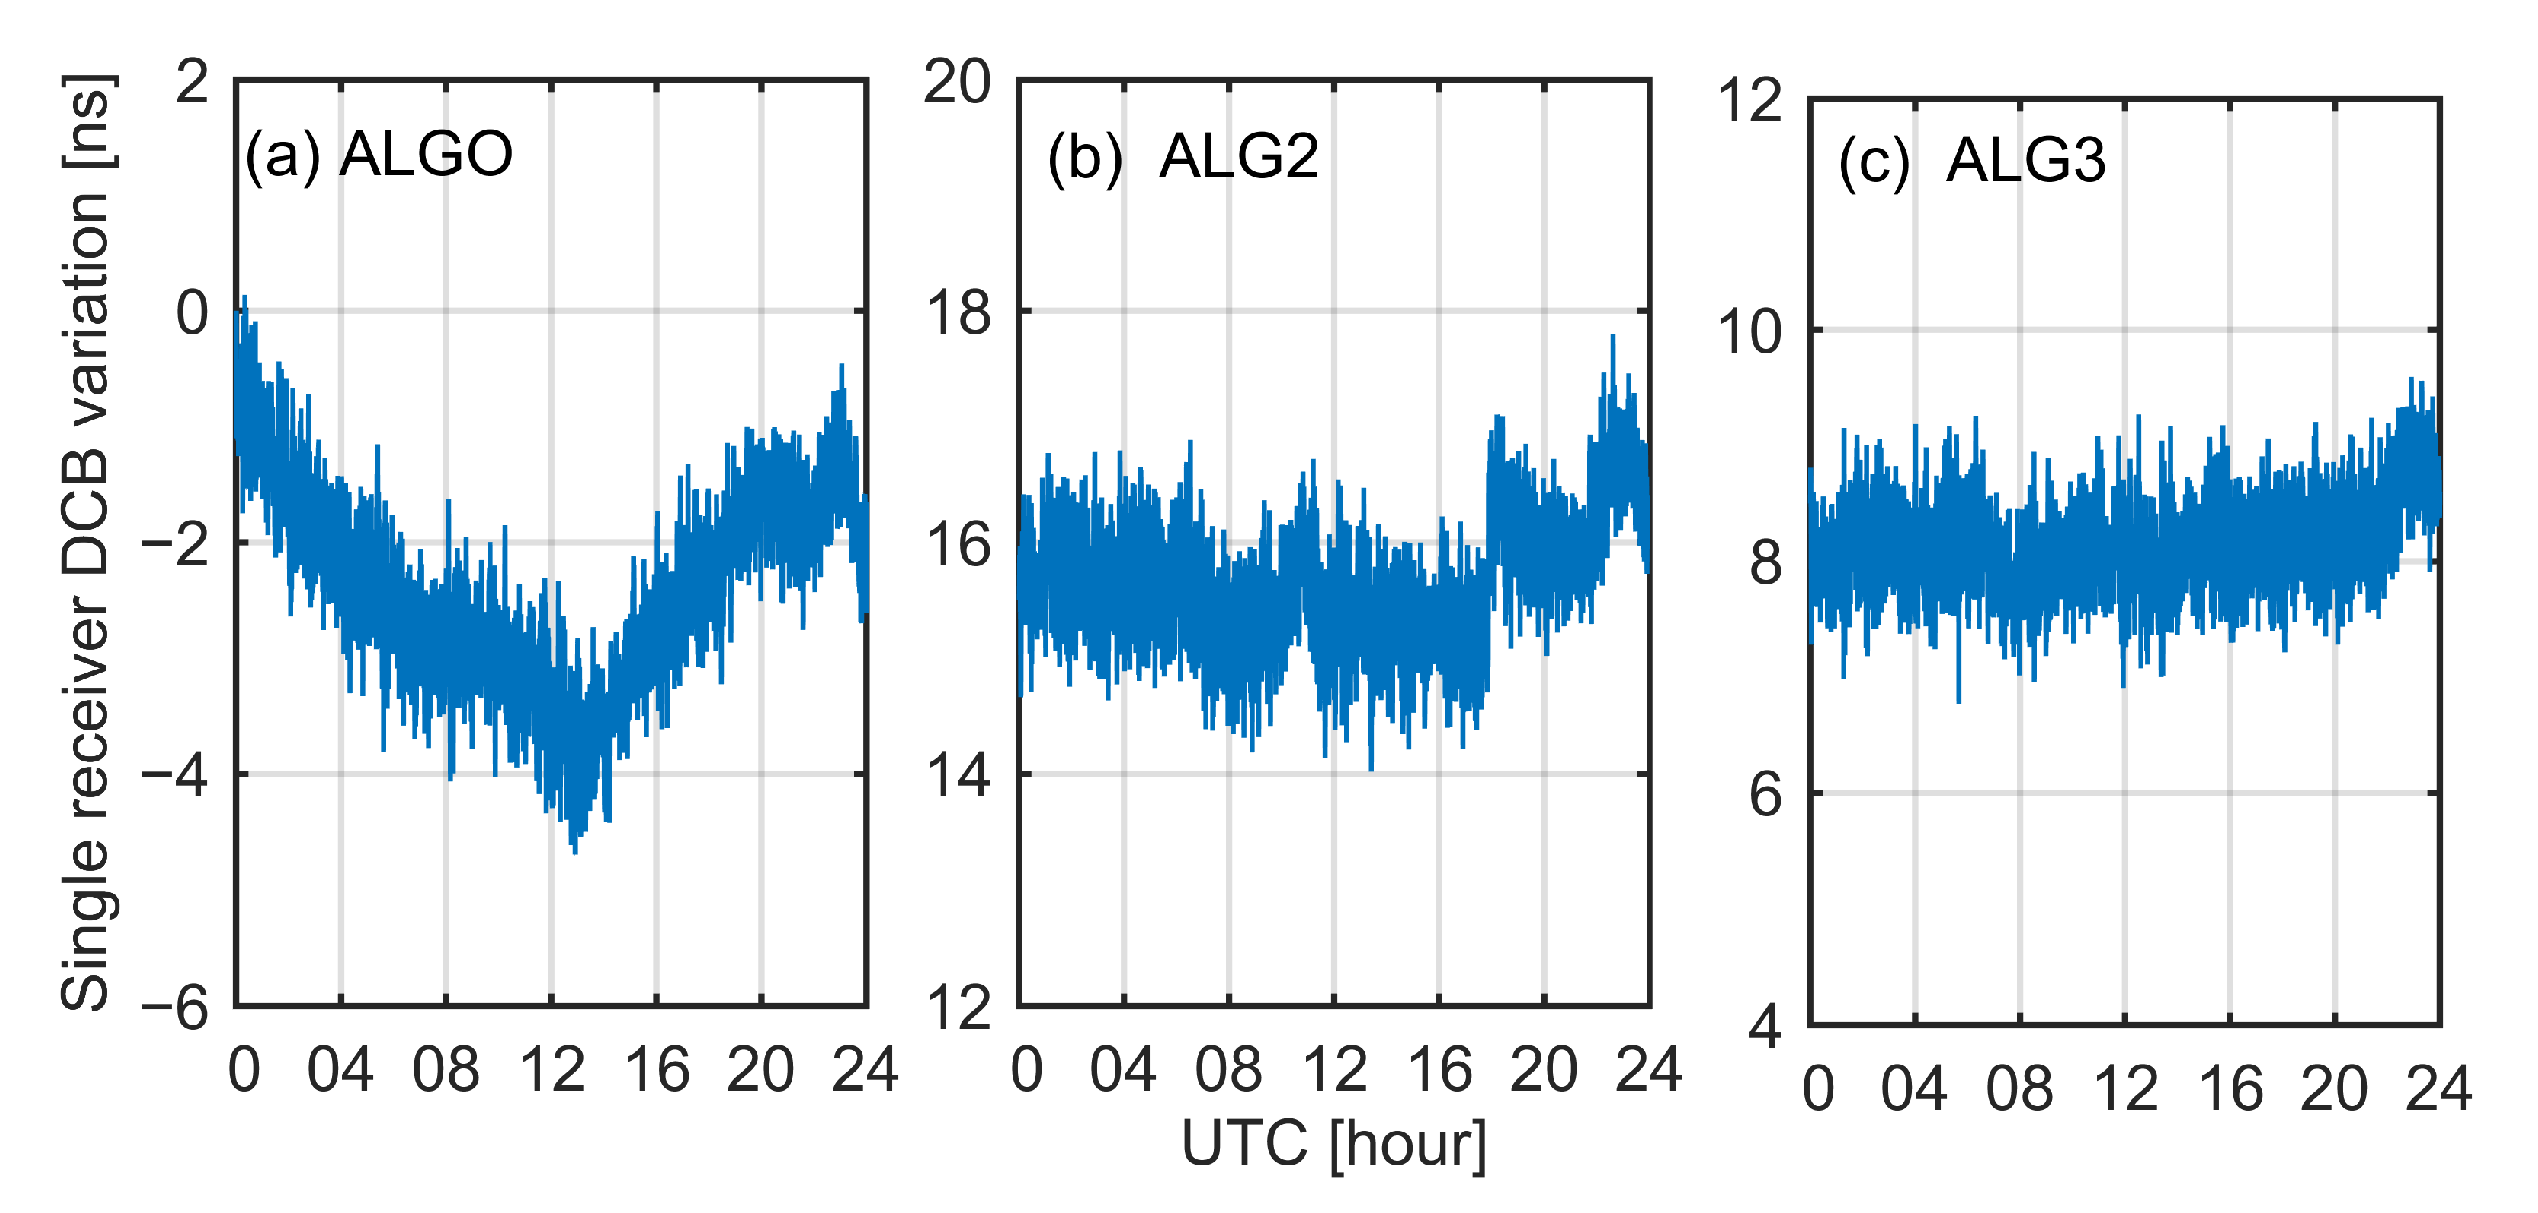
Figure 4 and Figure 5 shows results that are analogous to those in Figure 2 and Figure 3 but based on the second set of GPS data listed in Table 1. It can be seen from Figure 5 that the DCB estimates for station ALGO clearly vary during the day, with a peak-to-peak range of approximately 4 ns, while those from stations ALG2 and ALG3 are rather constant. These characteristics of the receiver DCB variations, as retrieved with the MCCL plus datum method, show strong agreement with those observed in the time series of BR-DCBs shown in Figure 4. In conclusion, compared with the BR-DCBs, the analysis of single-receiver DCB estimates allows a receiver with significant intraday DCB variations to be directly distinguished. On the other hand, these results further prove the validity of the proposed method for retrieving absolute receiver DCB estimates with an epoch-wise temporal resolution.

3.2. Statistical Results for the Intraday Stability of Receiver DCBs at IGS Stations

Many previous studies have analyzed the annual stability of, or day-to-day variations in, receiver DCBs. However, the intraday variations in single-receiver DCBs have not yet been systematically studied at an epoch-wise temporal resolution. Therefore, our work mainly focused on the intraday stability of GPS receiver DCB estimates based on the MCCL method for 200 IGS stations, including 6 main types of receivers. The distribution of the stations is shown in Figure 6. The observation period covered 2 years, 2014 (high solar activity) and 2017 (low solar activity). The data sampling rate was 30 s. The intraday stability of epoch-wise receiver DCB estimates can be expressed in terms of their daily standard deviation (DSTD), which is computed using the following equation:
DSTD = i = 1 n d r ( i ) d ¯ a v g n 1
where DSTD represents the intraday stability index of epoch-wise (30 s interval) receiver DCBs d r ( i ) ( i = 1 , 2 , 2880 ) and d ¯ a v g is the daily average of the receiver DCB estimates.
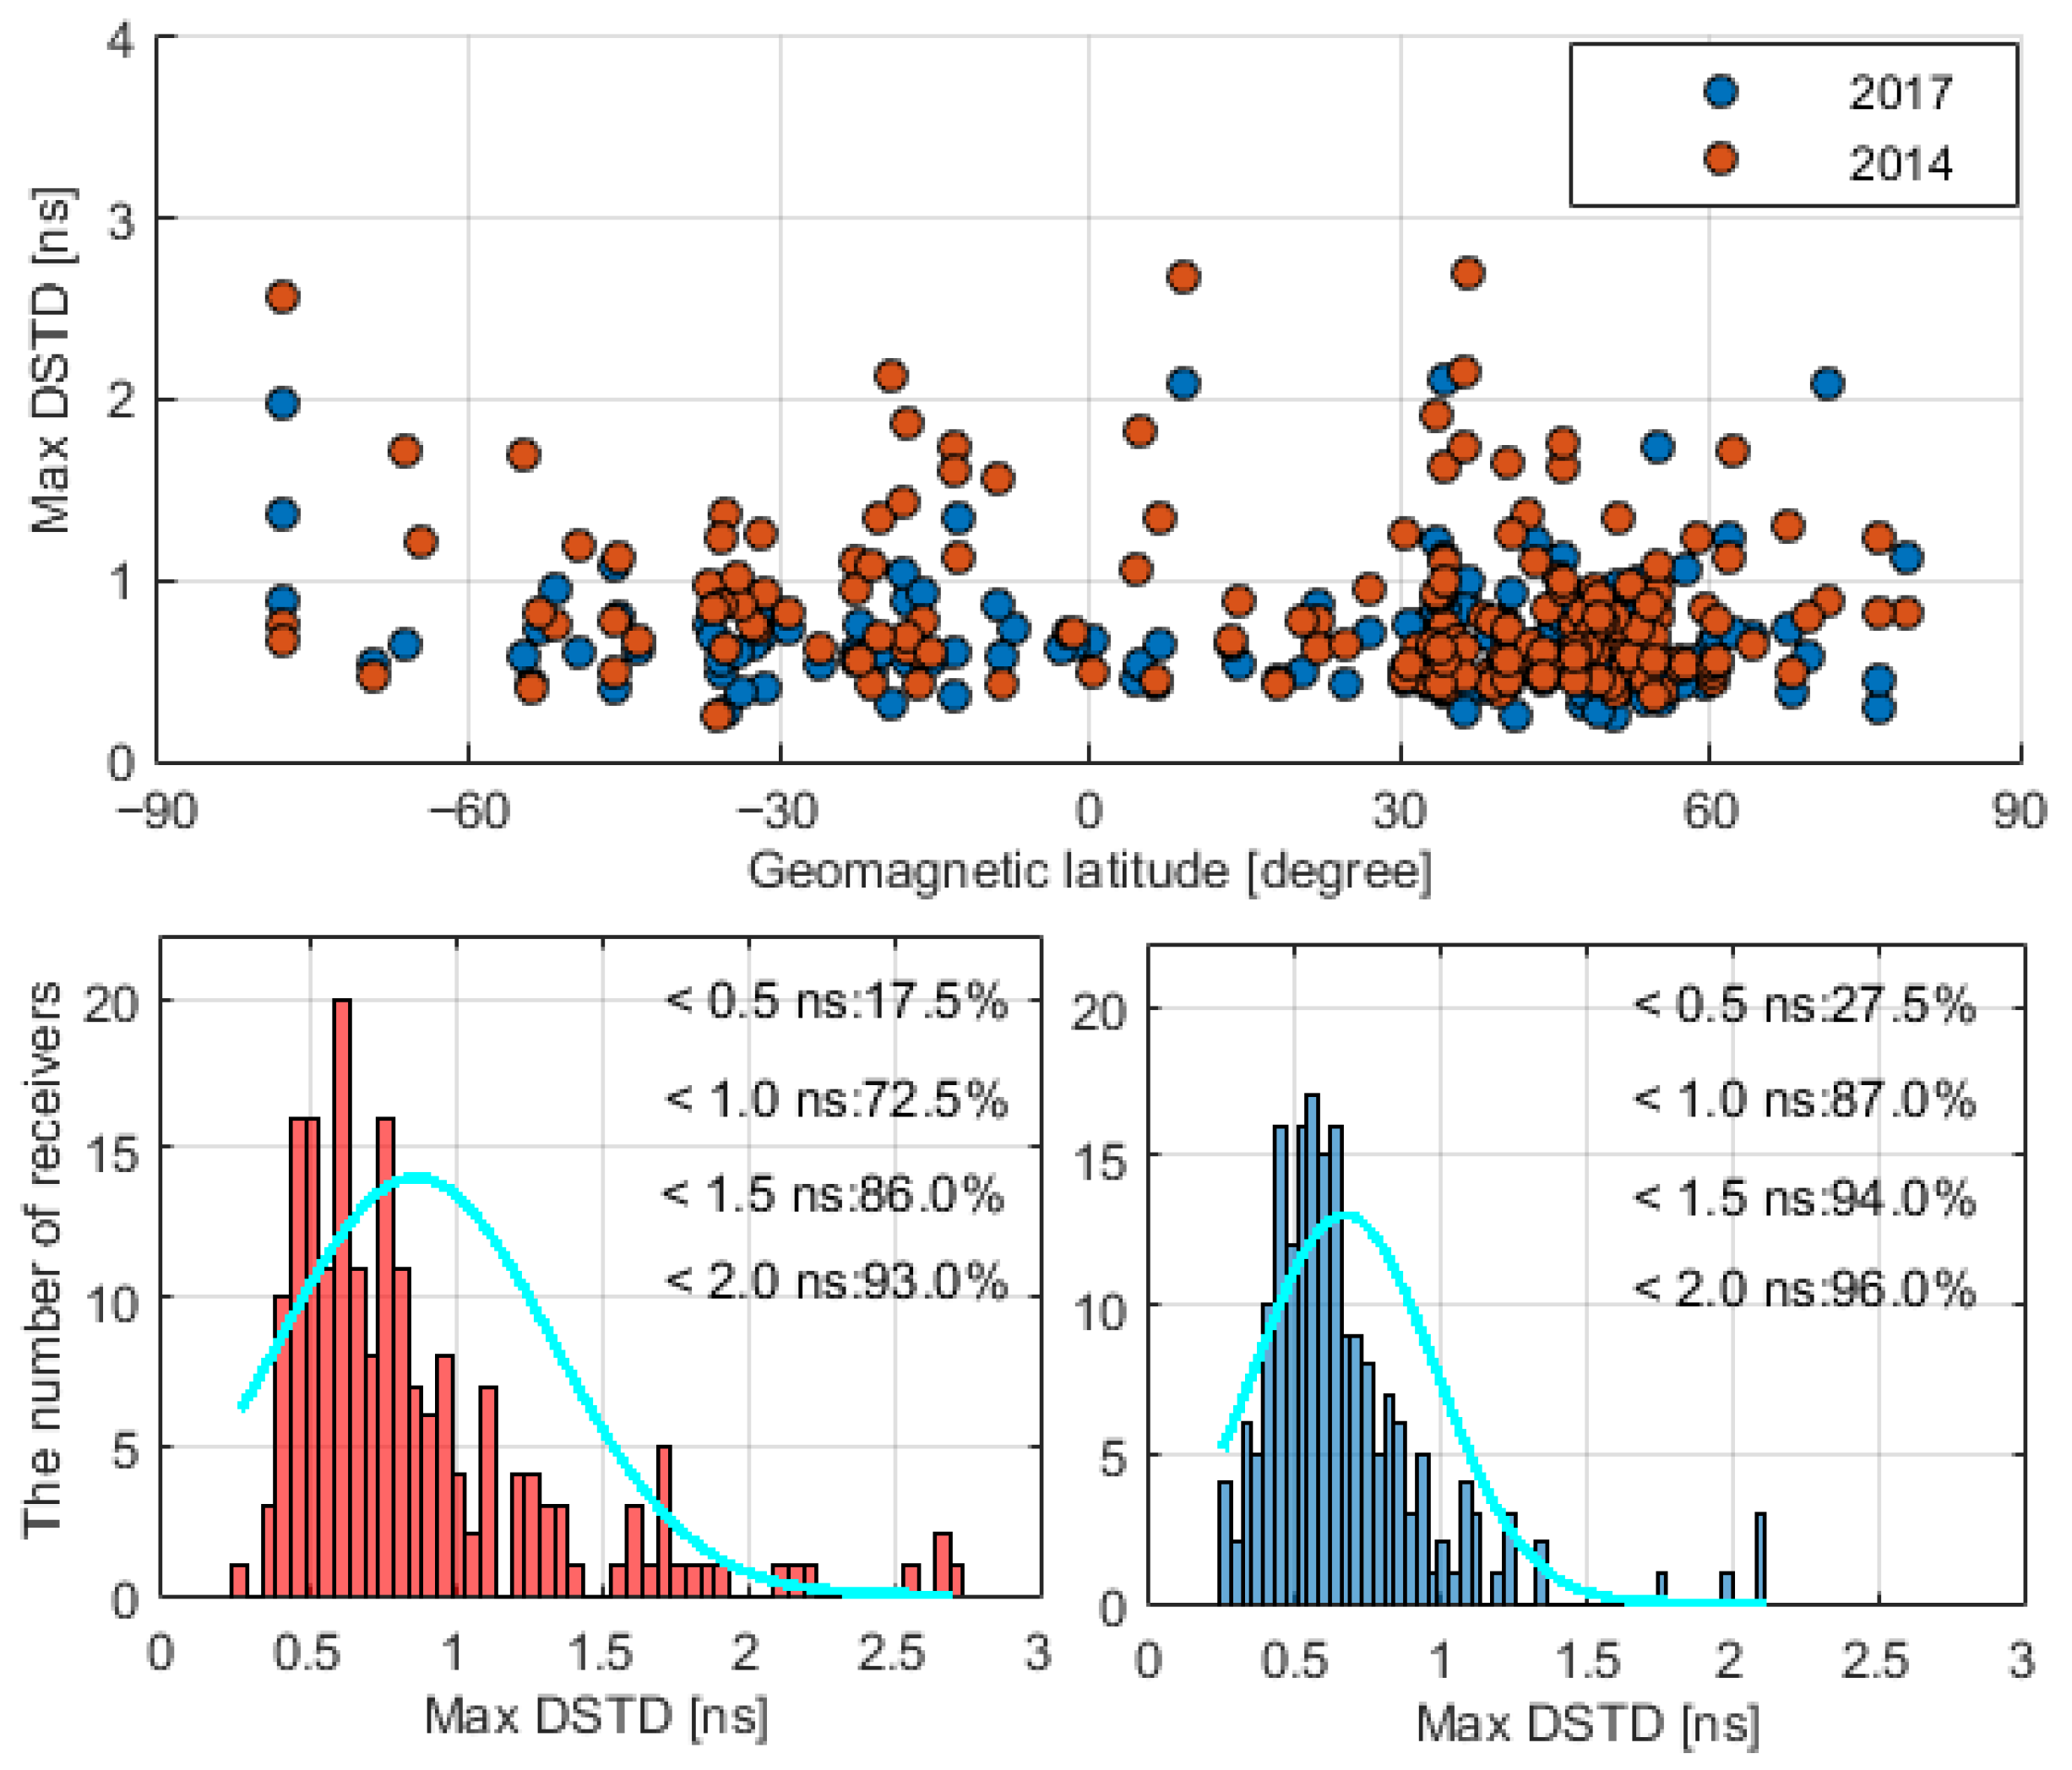
Figure 7 demonstrates the maximum intraday stability index DSTD of receiver DCB estimates derived using the MCCL method for 200 IGS stations in 2014 (red dots) and 2017 (blue dots), which are aligned according to their geomagnetic latitudes ranging from 90°S to 90°N. In the upper scatter plot, the red dots are more scattered than the blue ones, implying that, in general, the receiver DCBs in 2017 are more stable than those in 2014. As the bottom histogram shows, the DSTD is smaller than 1 ns (or 2ns) in 72% (or 93%) of cases for all the receivers in 2014, while these variations in 2017 are less than 1 ns (or 2ns) in 87% (or 96%) of cases. However, it can be seen from the scatter plot that the maximum DSTD values in the low-latitude region (from 30°S to 30°N, with an average DSTD of 0.74 ns) are no more scattered than those in the middle- and high-latitude regions (from 30°S (N) to 80°S (N), with an average DSTD of 0.76 ns) in either 2014 or 2017. These results suggest that the intraday stability of the receiver DCBs is not associated with the geomagnetic latitudes of the receiver locations.
Figure 8 shows the DSTD distribution of the receiver DCBs in different seasons. In the northern hemisphere, the three months of June, July and August are regarded as summer and the three months of December, January and February are winter. The opposite trend is observed in the southern hemisphere. The other months with relatively moderate temperatures are classified as spring and autumn. It can be seen that the DSTD of the receiver DCB estimates within 1 ns (or 2 ns) in winter accounts for 89.5% (or 99.5%) of cases for all of the receivers in 2014, while for those in summer, it accounts for 72.5% (or 99.5%) of all the receivers. In spring and autumn, the ratio of the DSTD within 1 ns (or 2 ns) reaches 84.0% (95.5%). These results indicate that the intraday stability of receiver DCBs may be related to the seasons, especially meteorological parameters such as the temperature of the receiver environment. Moreover, compared with those in 2014, the number of receivers with a DSTD less than 1 ns (or 2 ns) in different seasons of 2017 is correspondingly increased. Even though the solar activity in 2017 is lower than that in 2014, the increase may not be attributed to this factor. As Figure 7 shows, there is no obvious discrepancy in the intraday stabilities of the receiver DCBs between the stations located at different geomagnetic latitudes.

3.3. Intraday Variation Characteristics of Epoch-Wise Receiver DCBs

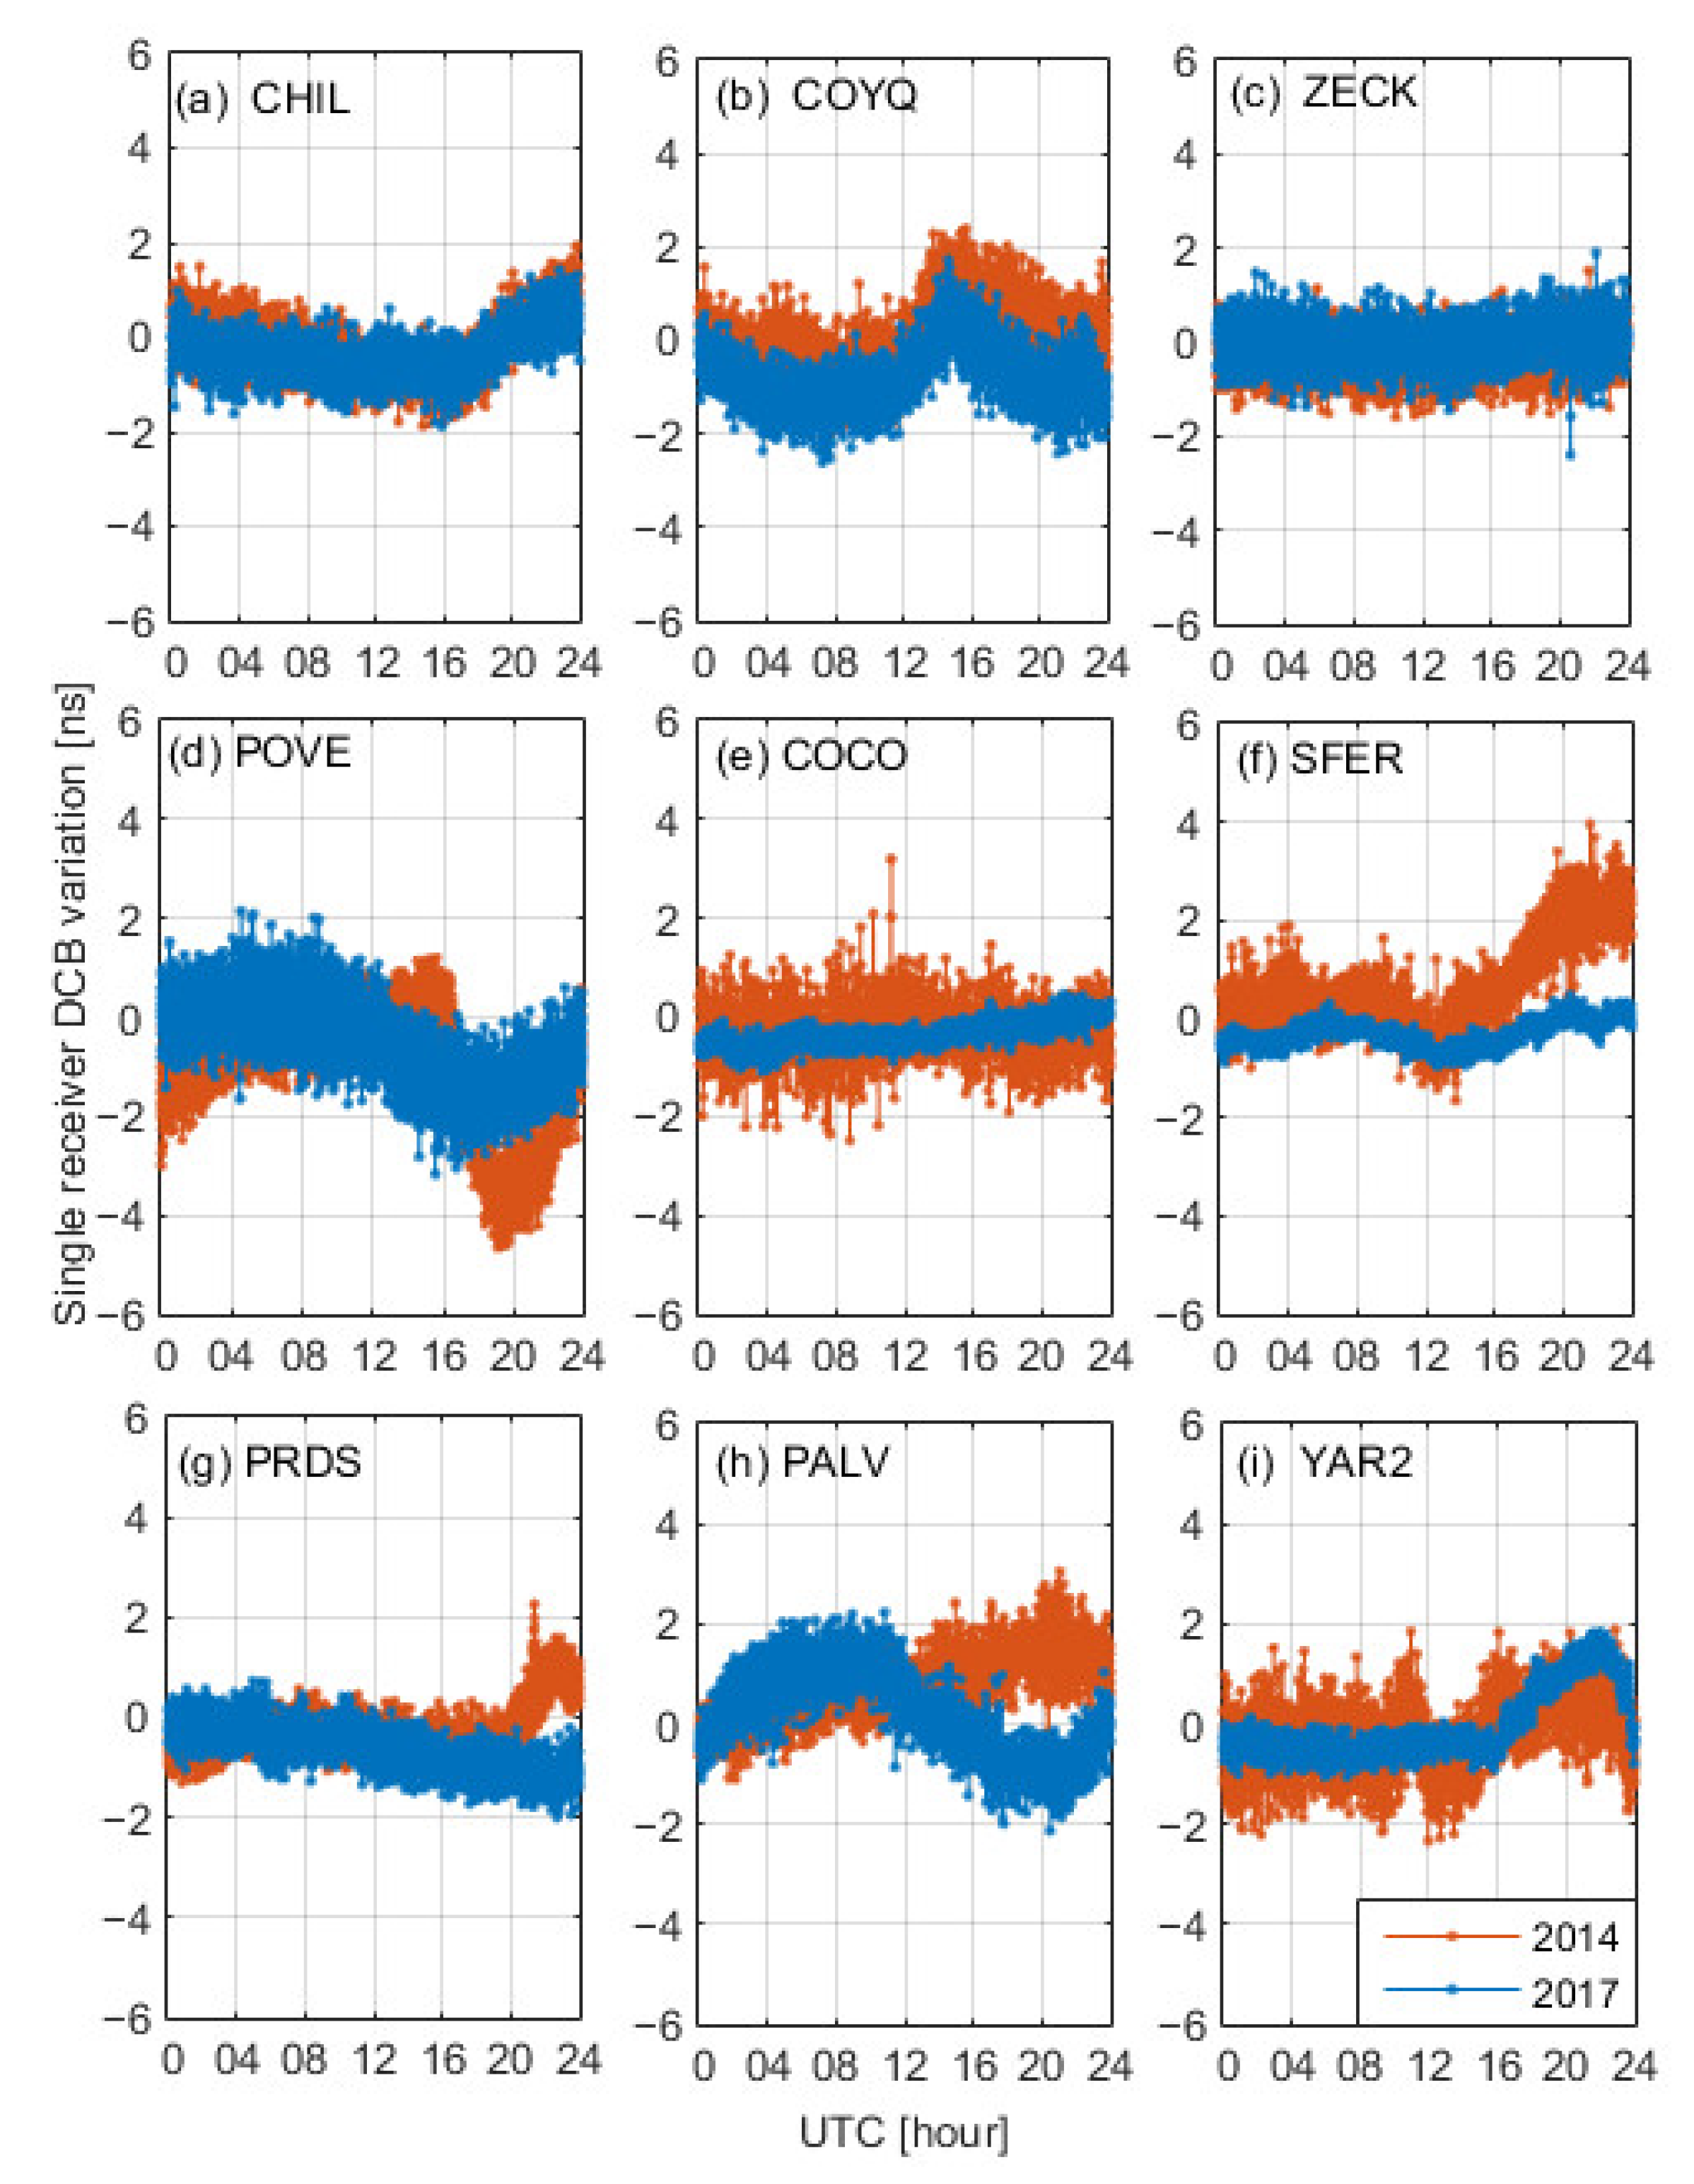
To further investigate the difference in the intraday stabilities of the receiver DCBs between 2014 and 2017, we conducted a comparison of the intraday variation in the receiver DCBs in the two years for some specific stations where receiver DCBs estimates exhibited more stability in 2017 than in 2014. The information regarding the receiver types and antenna types is presented in Table 2. For these stations, the intraday variations in the receiver DCBs over one day in two different years are shown in Figure 9. It can be seen that the stations equipped with the same types of receivers and antennas have the same intraday variations in their receiver DCBs, as Figure 9a–c shows, while for the stations equipped with different receivers and antennas, the intraday variation in the receiver DCBs is more stable, with different patterns (Figure 9d–i) in 2017 compared to 2014. These results demonstrate that the improvement in the intraday stability of receiver DCBs is mainly attributed to the replacement of the receivers and antennas of IGS stations.
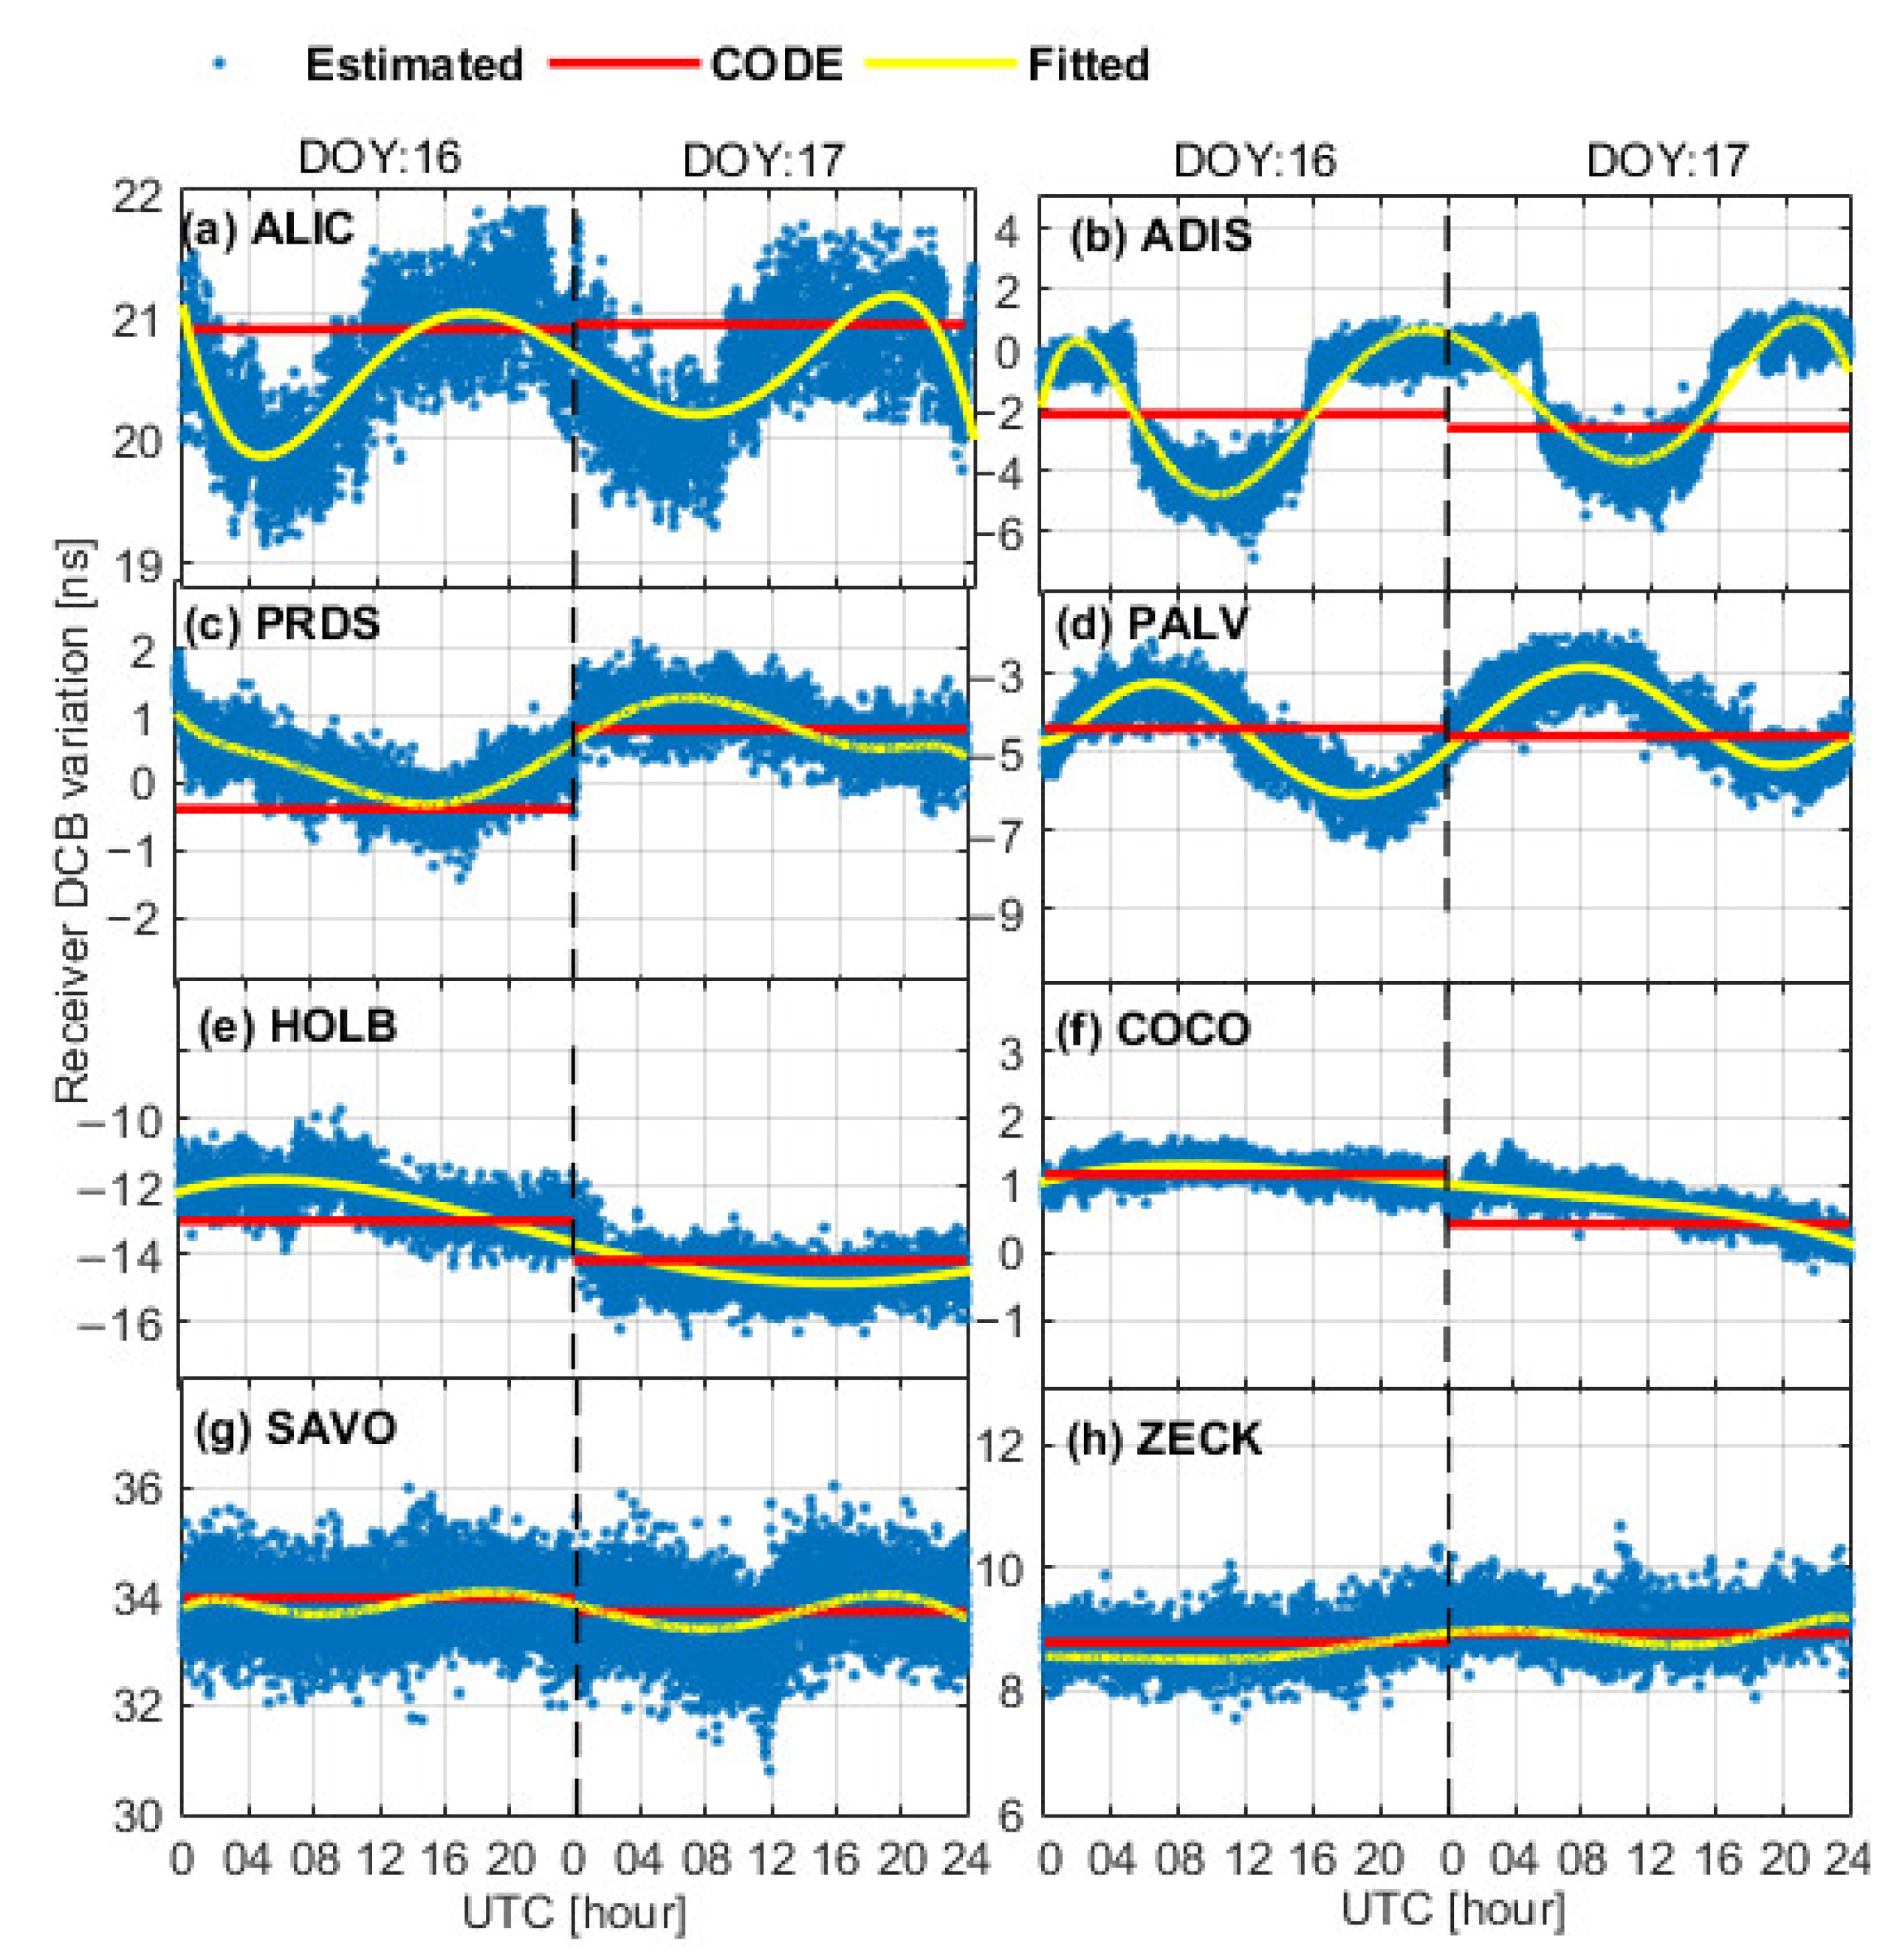
To represent this information in greater detail, the time series of the epoch-wise receiver DCBs on representative days are shown in Figure 10, where the yellow lines represent polynomial fits to the estimated receiver DCBs and the red lines represent the corresponding receiver DCB products provided by CODE. Since the MCCL-based estimates have an epoch-wise temporal resolution, the receiver DCBs change gradually rather than abruptly, as is the case for the CODE-based estimates, between these two consecutive days; however, similar variation trends between these two DCB products for DOY 016–017 are evident. We can take this similarity as an indication that the obvious jumps in the CODE-based DCBs between the different days are related, in part, to the intraday variations in the receiver DCBs. A closer look at Figure 10 reveals three types of intraday variation characteristics. The first type is a quasi-periodic variation, as shown in Figure 10a–d. These DCB series show recovery to the initial state over a one-day period, most likely due to a thermally induced variation, such as a variation in the ambient temperature. Therefore, these DCB series may exhibit daily repeatability. The second type is an almost quasi-linear variation, as shown in Figure 10e,f, but with a magnitude smaller than 1 ns. Due to the lack of knowledge about the receiver design, the exact reason for this variation is not clear and requires further study. The third type of variation in the DCB series, as shown in Figure 10g,h, appears to be similar to random noise. We can conclude that these DCBs remain stable at the intraday level relative to their noise level.

3.4. Factors Affecting the Intraday Variability of Receiver DCBs

It has been shown that variations in receiver DCBs may be associated with environmental temperature variations and the receiver firmware version [23,34]. To understand the relationships between the intraday variation in the receiver DCBs and these two factors in more detail, we considered the station ALIC with different firmware versions as an example, plotted the corresponding epoch-wise receiver DCB variations estimated with the MCCL method and the intraday temperature values extracted from the IGS meteorological data, and calculated the Pearson correlation coefficient (PCC) to assess their correlation.
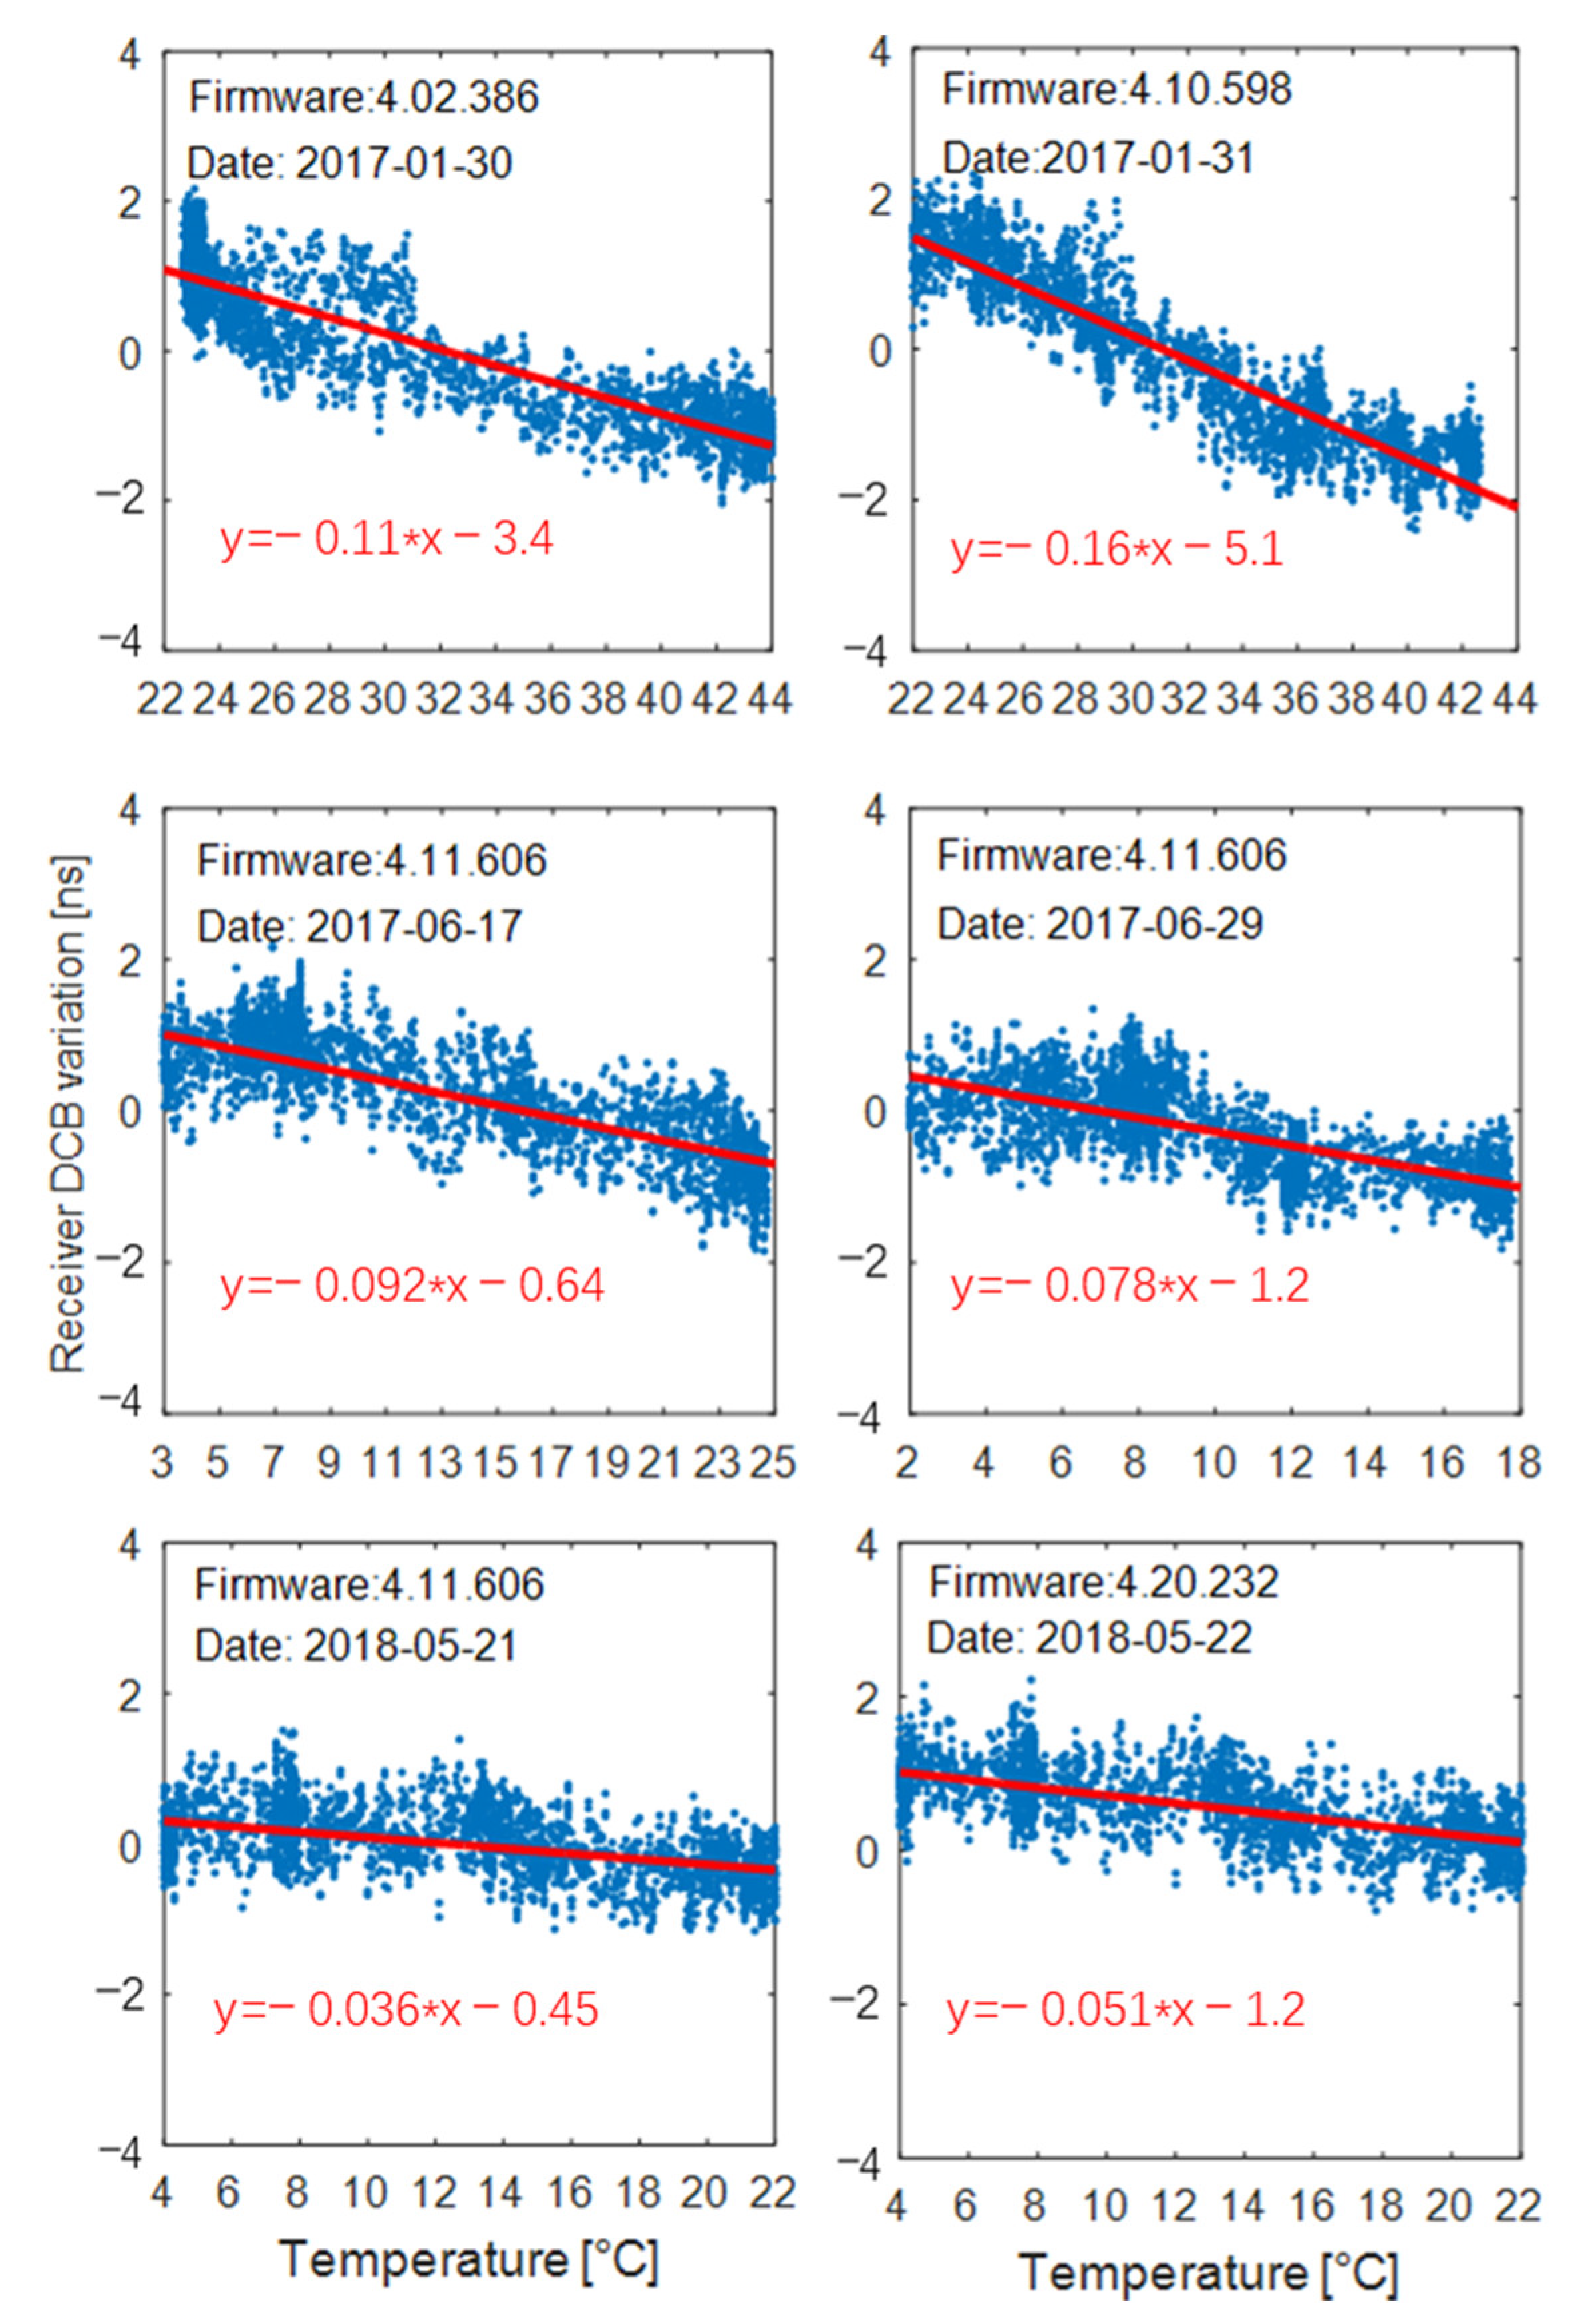
As seen in Figure 11, the receiver DCB variation is, in principle, consistent with the temperature variation. Meanwhile, all the absolute values of the PCC on different days are greater than 0.5, indicating a strong correlation between the receiver DCB and the temperature. Moreover, the slope of the corresponding linear regression equation is presented to visualize the extent of the impact of temperature variation in the receiver DCB variation, as shown in Figure 12.
Table 3 presents the statistical results, from which it can be seen that the absolute value of the PCC and the slope of the linear regression equation become larger as the daily temperature increases, and vice versa. Thus, it is confirmed that temperature is a major contributor to the intraday variation in the receiver DCBs. In addition, during the period 2017–2018, the receiver firmware version at station ALIC was changed three times; however, there are no obvious corresponding differences in the intraday variations in the receiver DCB estimates. The PCC gaps between consecutive days corresponding to firmware version changes (from 30 January 2017 to 31 January 2017 and from 21 May 2018 to 22 May 2018) are smaller than 0.07. These observations indicate that the receiver firmware version has no great impact on receiver DCB variation in this case 3.5. Effects of intraday variations in receiver DCBs on STEC observables.

3.5. Effects of Intraday Variations in Receiver DCBs on STEC Observables

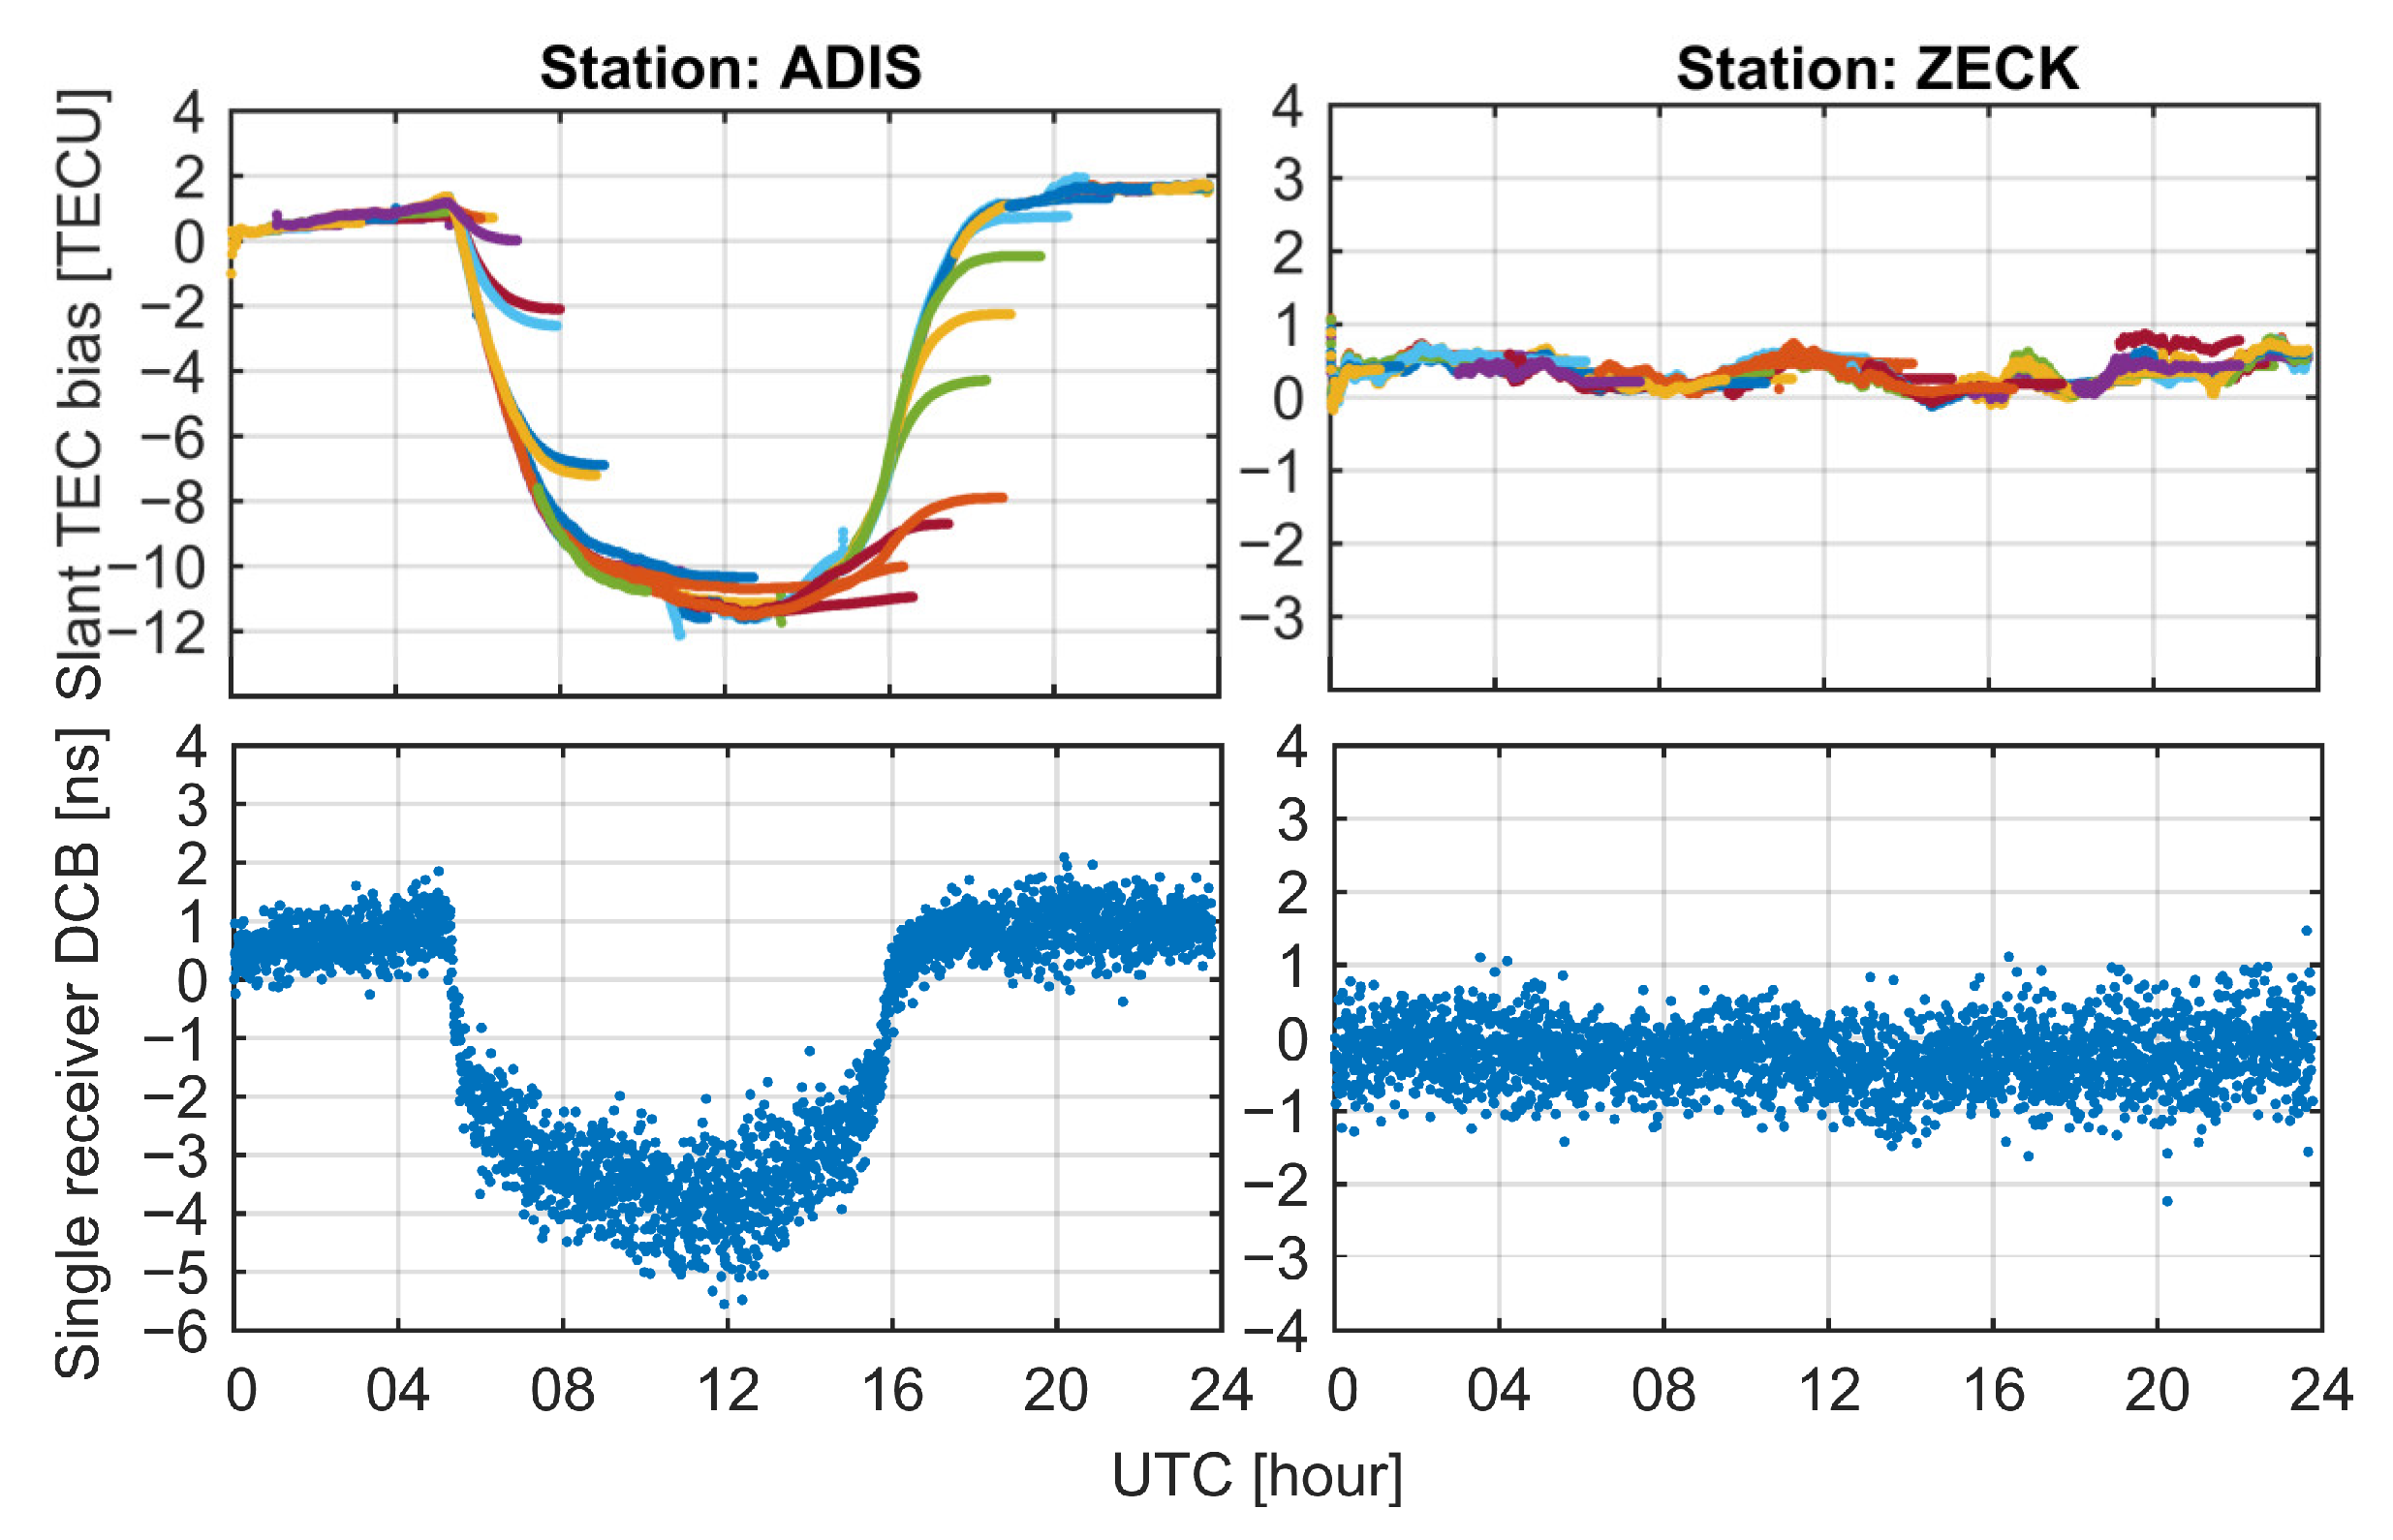
Although most receiver DCBs remain relatively stable at the daily timescale, large intraday variations in receiver DCBs have been detected at certain stations. To provide a better understanding of the impact of abnormal intraday variations in receiver DCBs on the extraction of ionospheric observables, let us consider the example of DOY 016, for which the receiver DCB at station ADIS varies significantly, whereas the receiver DCB at station ZECK remains stable. For this example, in Figure 13, we compare the intraday variations in the receiver DCBs with the STEC biases caused by these variations. The STEC biases caused by the intraday variations in the receiver DCBs can be interpreted as differences between the CCL-derived and MCCL-derived ionospheric observables, because the MCCL method compensates for possible between-epoch variations in the receiver DCBs, which, consequently, are not reflected in the ionospheric STEC observables derived using this method. When the receiver DCBs exhibit a significant variation, the STEC biases become correspondingly apparent. As the panels on the left of Figure 13 show, when the receiver DCBs at ADIS vary over time with a peak-to-peak range of almost −5.78 ns, the STEC biases reach −13.84 TECU (peak-to-peak value), while the right panels show that the receiver DCBs at ZECK remain stable throughout the time period and the corresponding STEC biases are smaller than 1 TECU. Thus, under the assumption that the receiver DCBs are constant over a one-day period, intraday variations in the receiver DCBs will introduce errors to the process of ionospheric TEC extraction. Therefore, considering the receiver DCB as a time-varying parameter is helpful for enhancing the reliability of TEC estimation.

4. Conclusions

This study presented the epoch-wise estimation of single-receiver DCBs consisting of DCB variations estimated based on the MCCL, together with the absolute DCB datum isolated from MCCL-derived ionospheric measurements. The feasibility and effectiveness of this scheme for estimating single-receiver DCBs with an epoch-wise temporal resolution were validated through numerical simulation and zero-/short-baseline experiments. Compared with typical daily receiver DCB estimates, the estimates obtained using the proposed method have two advantages: (1) the retrieval of the relative DCB variations is independent of the ionospheric model, rendering the intraday stability assessment of the receiver DCBs immune to disturbances caused by ionospheric model errors, and (2) these epoch-wise estimates more closely reflect the intraday variations in the receiver DCBs, providing insight into the possible factors that affect these variations.
Based on epoch-wise receiver DCB estimates, the intraday stability of a GPS receiver DCBs for 200 IGS stations, most of which contribute to the GIM product, was assessed for the two years of 2014 (high solar activity) and 2017 (low solar activity). The maximum DSTD values of the receiver DCBs in 2014 and 2017 were less than 1 ns in 72.5 and 87% of all cases, respectively. The difference in the intraday stability of the receiver DCBs between the two years is mainly attributed to the replacement of receivers and antennas at IGS stations. In addition, the intraday stability of the receiver DCBs was generally lower in summer than in the other seasons in the two years. Although more than 90% of the investigated receiver DCBs showed an intraday stability of less than 2 ns, significant variations over a one-day period were observed with a maximum range of approximately 5.78 ns (peak-to-peak value), corresponding to an impact of almost 13.85 TECU on the extraction of ionospheric STEC values in this case.
Furthermore, the epoch-wise receiver DCB estimates exhibit three representative patterns of intraday variation: quasi-periodic variation, quasi-linear variation and random noise fluctuation. In contrast to the CODE-based DCB product, the epoch-wise receiver DCB estimates do not show day-boundary jumps; instead, they vary gradually over time. However, they also present trends of day-to-day variation similar to those of the CODE-based DCB product, indicating that the abrupt change in the CODE-based DCB between two consecutive days is partially due to the intraday variation in the receiver DCB.
We also found that the significant variability in the estimates of the receiver DCBs over a one-day period showed good consistency with the intraday temperature variation. The maximum correlation coefficient between the receiver DCB and the temperature was as high as 0.9, and the minimum value was still greater than 0.5. By contrast, when the receiver firmware version was updated, the intraday variation characteristics of the receiver DCBs showed no significant change. It can be concluded that temperature is one of the main factors affecting the intraday variability of receiver DCBs.

Author Contributions

Conceptualization, X.Z. and L.X.; methodology, X.Z.; software, X.Z.; validation, X.Z., H.L. and Q.L.; writing—original draft preparation, X.Z.; writing—review and editing, X.Z. and L.X.; visualization, X.Z.; supervision, L.X.; project administration, L.X. All authors have read and agreed to the published version of the manuscript.

Funding

This research was funded by the Key Research and Development Program of Guangdong Province, grant number 2020B0101130009; Guangdong Enterprise Key Laboratory for Urban Sensing, Monitoring and Early Warning, grant number 2020B121202019; the China Natural Science Funds, grant number 42271325; the Guangzhou Key Field R&D Program, grant number 202206030005; and the GZPI Basic R&D Program, grant number RDI2230201002.

Data Availability Statement

Not applicable.

Conflicts of Interest

The authors declare no conflict of interest.

References

  1. Hernández-Pajares, M.; Juan, J.; Sanz, J. New approaches in global ionospheric determination using ground GPS data. J. Atmos. Sol.-Terr. Phys. 1999, 61, 1237–1247. [Google Scholar] [CrossRef]
  2. Dyrud, L.; Jovancevic, A.; Brown, A.; Wilson, D.; Ganguly, S. Ionospheric measurement with GPS: Receiver techniques and methods. Radio Sci. 2008, 43, 1–11. [Google Scholar] [CrossRef]
  3. Wang, C.; Rosen, I.G.; Tsurutani, B.T.; Verkhoglyadova, O.P.; Meng, X.; Mannucci, A.J. Statistical characterization of ionosphere anomalies and their relationship to space weather events. J. Space Weather. Space Clim. 2016, 6, A5. [Google Scholar] [CrossRef]
  4. Jakowski, N.; Heise, S.; Wehrenpfennig, A.; Schlüter, S.; Reimer, R. GPS/GLONASS-based TEC measurements as a contributor for space weather forecast. J. Atmos. Sol.-Terr. Phys. 2002, 64, 729–735. [Google Scholar] [CrossRef]
  5. Wen, D.; Mei, D. Ionospheric TEC disturbances over China during the strong geomagnetic storm in September 2017. Adv. Space Res. 2020, 65, 2529–2539. [Google Scholar] [CrossRef]
  6. Afraimovich, E.; Ding, F.; Kiryushkin, V.; Astafyeva, E.; Jin, S.; Sankov, V. TEC response to the 2008 Wenchuan earthquake in comparison with other strong earthquakes. Int. J. Remote Sens. 2010, 31, 3601–3613. [Google Scholar] [CrossRef]
  7. Li, Z.; Wang, N.; Wang, L.; Liu, A.; Yuan, H.; Zhang, K. Regional ionospheric TEC modeling based on a two-layer spherical harmonic approximation for real-time single-frequency PPP. J. Geodesy 2019, 93, 1659–1671. [Google Scholar] [CrossRef]
  8. Juan, J.; Hernández-Pajares, M.; Sanz, J.; Ramos-Bosch, P.; Aragon-Angel, A.; Orus, R.; Ochieng, W.; Feng, S.; Jofre, M.; Coutinho, P. Enhanced precise point positioning for GNSS users. IEEE Trans. Geosci. Remote Sens. 2012, 50, 4213–4222. [Google Scholar] [CrossRef]
  9. Zhang, B.; Teunissen, P.J.; Odijk, D. A novel un-differenced PPP-RTK concept. J. Navig. 2011, 64, S180–S191. [Google Scholar] [CrossRef]
  10. Zhang, B.; Hou, P.; Zha, J.; Liu, T. Integer-estimable FDMA model as an enabler of GLONASS PPP-RTK. J. Geod. 2021, 95, 1–21. [Google Scholar] [CrossRef]
  11. Zha, J.; Zhang, B.; Liu, T.; Hou, P. Ionosphere-weighted undifferenced and uncombined PPP-RTK: Theoretical models and experimental results. GPS Solut. 2021, 25, 135. [Google Scholar] [CrossRef]
  12. Zhang, B.; Hou, P.; Zha, J.; Liu, T. PPP–RTK functional models formulated with undifferenced and uncombined GNSS observations. Satell. Navig. 2022, 3, 3. [Google Scholar] [CrossRef]
  13. Zhang, B. Three methods to retrieve slant total electron content measurements from ground-based GPS receivers and performance assessment. Radio Sci. 2016, 51, 972–988. [Google Scholar] [CrossRef]
  14. Li, M.; Zhang, B.; Yuan, Y.; Zhao, C. Single-frequency precise point positioning (PPP) for retrieving ionospheric TEC from BDS B1 data. GPS Solut. 2019, 23, 1–11. [Google Scholar] [CrossRef]
  15. Wei, L.; Pengfei, C.; Jinzhong, B.; Hanjiang, W.; Hua, W. Calibration of regional ionospheric delay with uncombined precise point positioning and accuracy assessment. J. Earth Syst. Sci. 2012, 121, 989–999. [Google Scholar] [CrossRef]
  16. Yuan, Y.; Ou, J. A generalized trigonometric series function model for determining ionospheric delay. Prog. Nat. Sci.-Mater. Int. 2004, 14, 1010–1014. [Google Scholar] [CrossRef]
  17. Li, Z.; Yuan, Y.; Wang, N.; Hernandez-Pajares, M.; Huo, X. SHPTS: Towards a new method for generating precise global ionospheric TEC map based on spherical harmonic and generalized trigonometric series functions. J. Geod. 2015, 89, 331–345. [Google Scholar] [CrossRef]
  18. Ciraolo, L.; Azpilicueta, F.; Brunini, C.; Meza, A.; Radicella, S.M. Calibration errors on experimental slant total electron content (TEC) determined with GPS. J. Geod. 2007, 81, 111–120. [Google Scholar] [CrossRef]
  19. Yasyukevich, Y.V.; Mylnikova, A.; Kunitsyn, V.; Padokhin, A. Influence of GPS/GLONASS differential code biases on the determination accuracy of the absolute total electron content in the ionosphere. Geomagn. Aeron. 2015, 55, 763–769. [Google Scholar] [CrossRef]
  20. Hernández-Pajares, M.; Juan, J.; Sanz, J.; Orus, R.; Garcia-Rigo, A.; Feltens, J.; Komjathy, A.; Schaer, S.; Krankowski, A. The IGS VTEC maps: A reliable source of ionospheric information since 1998. J. Geod. 2009, 83, 263–275. [Google Scholar] [CrossRef]
  21. Sardón, E.; Zarraoa, N. Estimation of total electron content using GPS data: How stable are the differential satellite and receiver instrumental biases? Radio Sci. 1997, 32, 1899–1910. [Google Scholar] [CrossRef]
  22. Zhang, D.; Zhang, W.; Li, Q.; Shi, L.; Hao, Y.; Xiao, Z. Accuracy analysis of the GPS instrumental bias estimated from observations in middle and low latitudes. In Annales Geophysicae; Copernicus Publications: Göttingen, Germany, 2010. [Google Scholar]
  23. Coster, A.; Williams, J.; Weatherwax, A.; Rideout, W.; Herne, D. Accuracy of GPS total electron content: GPS receiver bias temperature dependence. Radio Sci. 2013, 48, 190–196. [Google Scholar] [CrossRef]
  24. Li, M.; Yuan, Y.; Wang, N.; Liu, T.; Chen, Y. Estimation and analysis of the short-term variations of multi-GNSS receiver differential code biases using global ionosphere maps. J. Geod. 2018, 92, 889–903. [Google Scholar] [CrossRef]
  25. Wang, N.; Yuan, Y.; Li, Z.; Montenbruck, O.; Tan, B. Determination of differential code biases with multi-GNSS observations. J. Geod. 2016, 90, 209–228. [Google Scholar] [CrossRef]
  26. Keshin, M. A new algorithm for single receiver DCB estimation using IGS TEC maps. GPS Solut. 2012, 16, 283–292. [Google Scholar] [CrossRef]
  27. Zhang, D.; Shi, H.; Jin, Y.; Zhang, W.; Hao, Y.; Xiao, Z. The variation of the estimated GPS instrumental bias and its possible connection with ionospheric variability. Sci. China Technol. Sci. 2014, 57, 67–79. [Google Scholar] [CrossRef]
  28. Sanz, J.; Miguel Juan, J.; Rovira-Garcia, A.; González-Casado, G. GPS differential code biases determination: Methodology and analysis. Gps Solut. 2017, 21, 1549–1561. [Google Scholar] [CrossRef]
  29. Zhang, B.; Teunissen, P. Zero-baseline Analysis of GPS/BeiDou/Galileo Between-Receiver Differential Code Biases (BR-DCBs): Time-wise Retrieval and Preliminary Characterization. J. Inst. Navig. 2016, 63, 181–191. [Google Scholar] [CrossRef]
  30. Ammar, M.; Aquino, M.; Vadakke Veettil, S.; Andreotti, M. Estimation and analysis of multi-GNSS differential code biases using a hardware signal simulator. Gps Solut. 2018, 22, 1–12. [Google Scholar] [CrossRef]
  31. Zhang, B.; Teunissen, P.J.; Yuan, Y.; Zhang, X.; Li, M. A modified carrier-to-code leveling method for retrieving ionospheric observables and detecting short-term temporal variability of receiver differential code biases. J. Geod. 2019, 93, 19–28. [Google Scholar] [CrossRef]
  32. Teunissen, P. Zero Order Design: Generalized Inverses, Adjustment, the Datum Problem and S-Transformations; Springer: Berlin/Heidelberg, Germany, 1985. [Google Scholar]
  33. Li, Z.S.; Yuan, Y.B.; Li, H.; Ou, J.K.; Huo, X.L. Two-step method for the determination of the differential code biases of COMPASS satellites. J. Geod. 2012, 86, 1059–1076. [Google Scholar] [CrossRef]
  34. Zhang, B.C.; Teunissen, P.J.G. Characterization of multi-GNSS between-receiver differential code biases using zero and short baselines. Sci. Bull. 2015, 60, 1840–1849. [Google Scholar] [CrossRef]
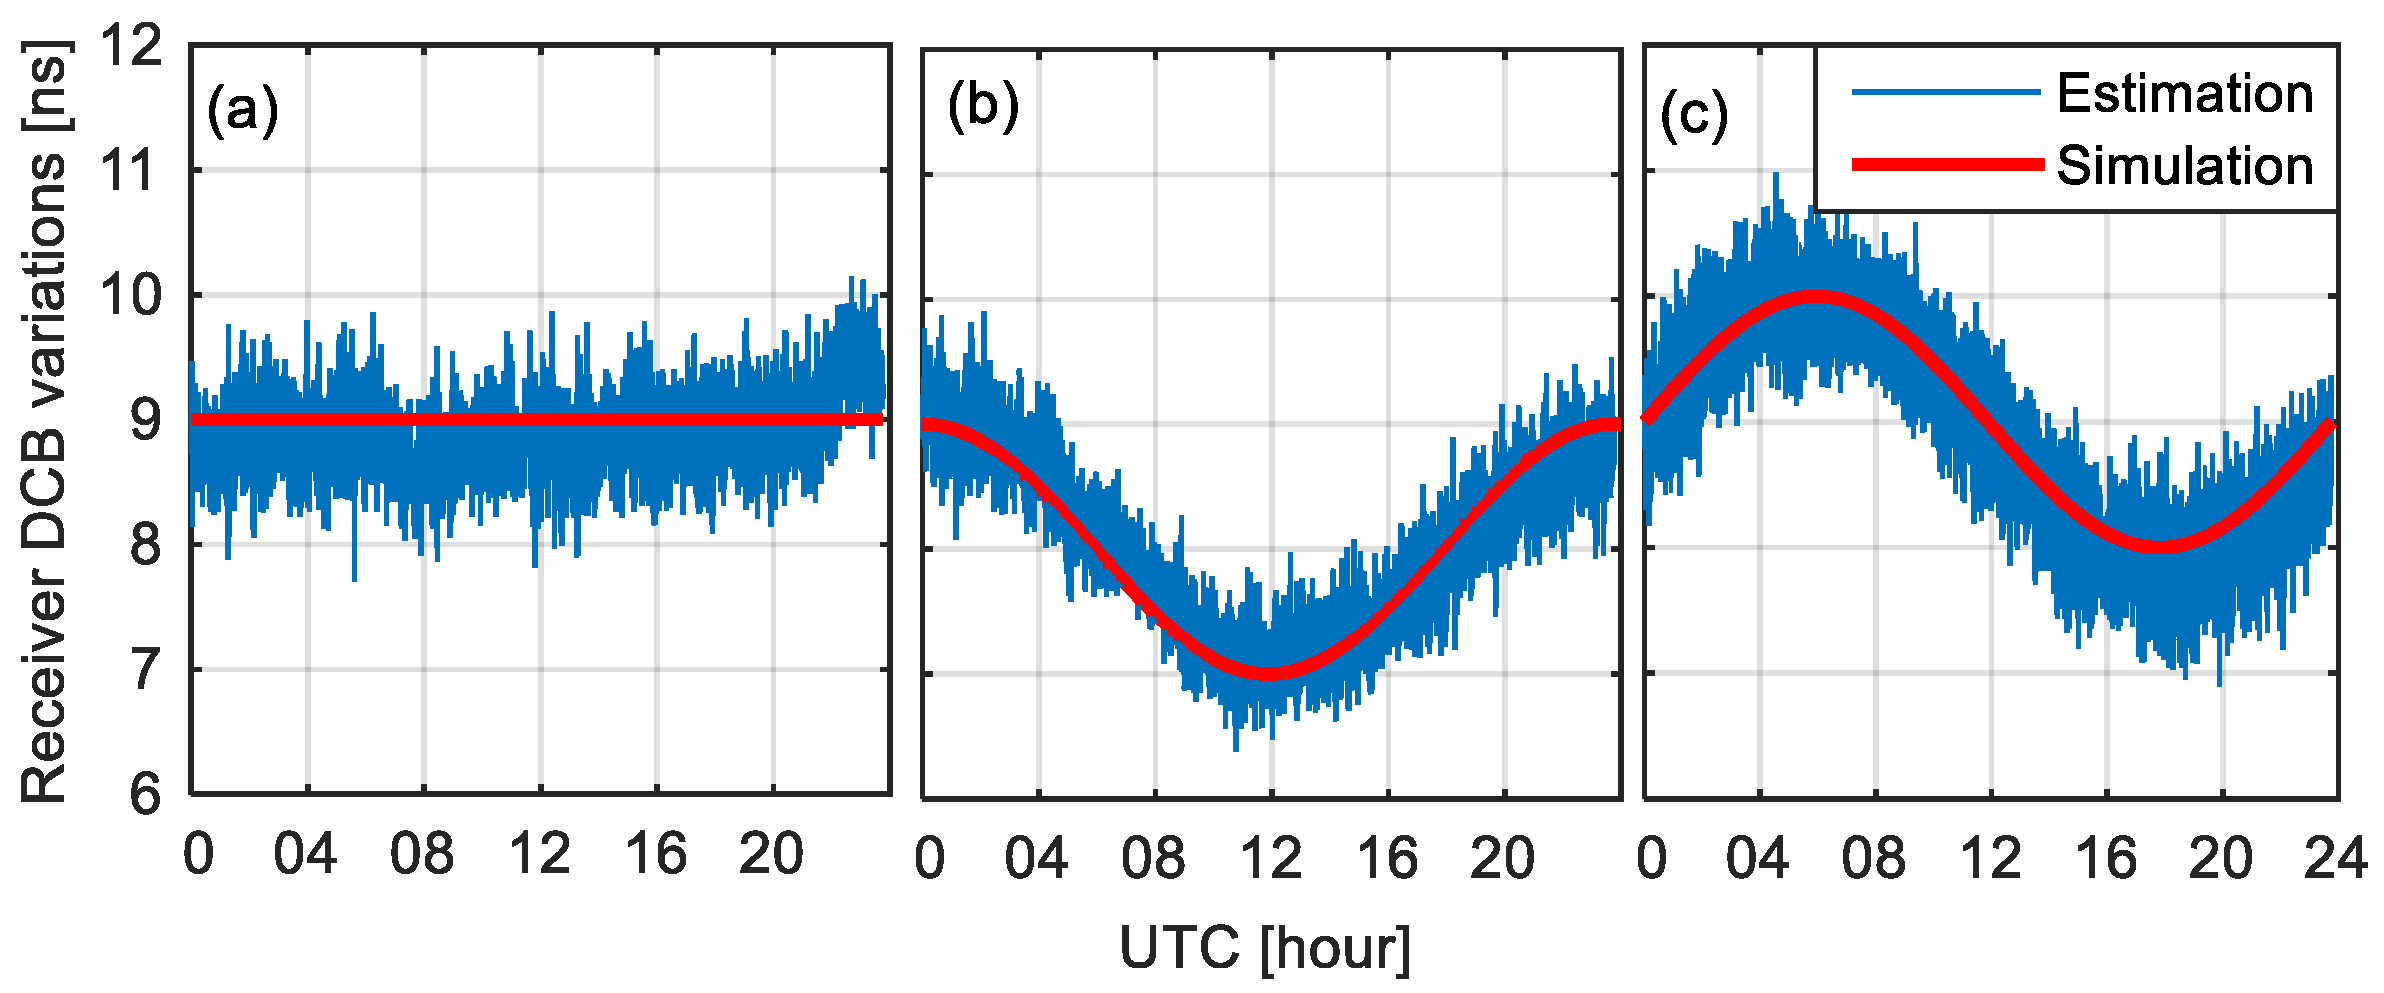
Figure 1. Simulated values (red line) versus estimates (blue line) of receiver DCB variations at site ALG3 on DOY 07, 2017: (a) D C B ( i ) = 0 , (b) D C B ( i ) = C os   ( 2 π n i ) 1 and (c) D C B ( i ) = 2 sin 2 π n i for epochs i = 1 , 2 n , where n = 2880 and the interval is 30 s.
Remotesensing 15 02190 g001
Figure 2. Epoch-by-epoch estimates of BR-DCB using SD-GF method (red line) and MCCL plus datum method (blue line) for three pairs of co-located receivers: DLFT-DLF4, DLFT-DLF5, DLF4-DLF5 on DOY 172, 2010.
Remotesensing 15 02190 g002
Figure 3. Epoch-by-epoch estimates of single-receiver DCBs retrieved using the MCCL plus datum method for three co-located receivers: DLFT, DLF4, DLF5 on DOY 172, 2010.
Remotesensing 15 02190 g003
Figure 4. Epoch-by-epoch estimates of BR-DCB using SD-GF method (red line) and MCCL plus datum method (blue line) for three pairs of co-located receivers: ALG2-ALG3, ALGO-ALG3, ALGO-ALG2 on DOY 07, 2017.
Remotesensing 15 02190 g004
Figure 5. Epoch-by-epoch estimates of single-receiver DCBs retrieved with the MCCL plus datum method for three co-located receivers: ALGO, ALG2, ALG3 on DOY 07, 2017.
Remotesensing 15 02190 g005
Figure 6. Geographic locations of receivers (of different types) that provide the second set of data analyzed in this work.
Remotesensing 15 02190 g006
Figure 7. The upper scatter plot displays the maximum DSTD of the estimated receiver DCBs in 2014 and 2017, where the stations are aligned in accordance with their geomagnetic latitudes along the horizontal axis. The bottom histograms show the distribution of the DSTD values, where the vertical axis represents the number of receivers.
Remotesensing 15 02190 g007
Figure 8. The distribution of the intraday stability DSTD of the estimated receiver DCBs determined using MCCL in different seasons of 2014 (red) and 2017 (blue). The vertical axis stands for the number of selected receivers and the horizontal axis stands for the DSTD of receiver DCB estimates.
Remotesensing 15 02190 g008
Figure 9. Intraday variations in the receiver DCBs estimates obtained using MCCL for the analyzed stations over one day (DOY 06) in 2014 (red lines) and 2017 (blue lines). The lines are shifted to the same datum for ease of comparison.
Remotesensing 15 02190 g009
Figure 10. Intraday variation characteristics of receiver DCBs spanning consecutive days. The blue scattered dots represent the epoch-wise estimates of the receiver DCBs, the yellow lines represent fits to these values, and the red solid lines represent the CODE DCB products.
Remotesensing 15 02190 g010
Figure 11. Receiver DCB variations (blue lines) at station ALIC, as estimated with the MCCL method for various receiver firmware versions and various temperature conditions. The intraday temperature values (red lines) were extracted from IGS meteorological data. PCC denotes the Pearson correlation coefficient between the blue line and the red line.
Remotesensing 15 02190 g011
Figure 12. Receiver DCB variations (vertical axis) plotted as a function of the intraday temperature values (horizontal axis). The red line represents the results obtained by fitting a linear regression equation to the same dataset used in Figure 11.
Remotesensing 15 02190 g012
Figure 13. Biases of the ionospheric STEC (upper panels, where different colors correspond to different satellite arcs) stemming from the intraday variations in the receiver DCBs (bottom panels) for stations ADIS and ZECK on DOY 16, 2017.
Remotesensing 15 02190 g013
Table 1. A general overview of two groups of co-located receivers.
Receiver NameReceiver TypeAntenna TypeLocationObservation Period
DLFTJPS LEGACYJPSREGANT_DD_E51.98°E, 4.39°N2010, day 172
DLF4SEPT POLARX2LEIAT504
DLF5SEPT POLARX2LEIAT504
ALGOAOA BENCHMARK ACTAOAD/M_T 78.07°W, 45.95°N2017, day 07
ALG2TPS NET-G3A NOV750.R4
ALG3TPS NETG3TPSCR.G3
Table 2. Information on receiver and antenna types used by the analyzed stations.
Station20142017
Receiver TypeAntenna TypeReceiver TypeAntenna Type
CHIL TPS NET-G3ATPSCR.G3 TPS NET-G3ATPSCR.G3
COYQTRIMBLE NETRSASH700936D_M TRIMBLE NETRSASH700936D_M
ZECK JAVAD TRE_G3THJAVRINGANT_DMJAVAD TRE_G3THJAVRINGANT_DM
POVETRIMBLE NETR5TRM29659.00TRIMBLE NETRSASH701945B_M
COCOTRIMBLE NETR8AOAD/M_TSEPT POLARXS AOAD/M_T
SFER TRIMBLE NETRSTRM29659.00LEICA GR25LEIAR20
PRDSTPS NET-G3AAOAD/M_TJAVAD TRE_G3THAOAD/M_T
PALVJPS EGGDT ASH700936D_MJAVAD TRE_G3THASH700936D_M
YAR2ASHTECH UZ-12AOAD/M_TSEPT POLARX4TRAOAD/M_T
Table 3. Factors influencing the intraday variability of the receiver DCBs at station ALIC, with a LEICA GR25 receiver and a LEIAR25.R3 antenna.
TimeFirmware VersionTemperature Span (°C)PCCSlope
30 January 20174.02.38622.9~44.2−0.914−0.11
31 January 20174.10.59821.6~42.6−0.927−0.16
17 June 20174.11.6062.5~24.7−0.791−0.092
29 June 20174.11.6061.7~17.5−0.693−0.078
21 May 20184.11.6062.3~22.5−0.52−0.036
22 May 20184.20.2327.3~22.92−0.65−0.051
Disclaimer/Publisher’s Note: The statements, opinions and data contained in all publications are solely those of the individual author(s) and contributor(s) and not of MDPI and/or the editor(s). MDPI and/or the editor(s) disclaim responsibility for any injury to people or property resulting from any ideas, methods, instructions or products referred to in the content.