Abstract
In this paper, we compare the performances of radio frequency interference (RFI) suppression between radio frequency interference mitigation (RFIM) and frequency-domain adaptive clutter suppression (FACS) algorithms that apply to ionograms for foF2 scaling through true height analysis. We find that the use of RFIM and FACS can both effectively suppress RFIs in ionograms to improve the signal-to-clutter (SCR) of the original ionogram. Overall, the RFI clutter suppressed by FACS is about 5–7 dB better than that by RFIM. In addition, the SCR improvement made by FACS with neighboring range cells in a range of 10–40 is also better than that made by RFIM, which is about 5–10 dB for FACS and 4–8 dB for RFIM, respectively. However, the signal-to-noise ratios (SNRs) of the ionospheric echoes of the ionograms with FACS are about 3–5 dB (2–3 dB) smaller than those of RFIM during daytime (nighttime). Intercomparisons reveal that the correlations of the scaled foF2 values between the original and RFIM ionograms are slightly higher than those between the original and FACS ionograms, while the root-mean-square-error (RMSE) and mean bias of the former are slightly larger than the latter. These results indicate that the use of RFIM and FACS algorithms to suppress RFIs in ionograms can conditionally improve the quality of scaled foF2 using Ke et al.’s autoscaling algorithm. Statistical results reveal that the use of FACS algorithms can result in about a 5–12% improvement in uncertainty and a 9–80% improvement in accuracy, provided that 5–20 neighboring range cells are selected. As for the RFIM algorithm with a threshold of 2–2.5 times standard deviation, the improvements in uncertainty and accuracy are, respectively, about 0.9–10% and 11–90%.
1. Introduction
Researchers working on ionogram analysis for ionospheric observations and monitoring have long been well aware that the traces (or ionospheric echoes) in ionograms are susceptible to the HF (High Frequency, 2–30 MHz) radio frequency interference (RFI) that originates from many HF radio sources, such as lightning radiation, amateur radio, ionospheric skywave over-the-horizon radar (OTHR), HF SeaSonde, and other unknown HF radio sources [1]. The RFI can not only contaminate the range-frequency distribution of the echoes in ionograms, but also degrade the quality of the ionogram traces, causing difficulty in true height analysis to retrieve the electron density profile of the ionospheric bottom side from traces [2]. Therefore, it is essential to identify RFI in ionograms and develop an effective method to mitigate the effect of the RFI on the ionogram to estimate correct ionospheric parameters from the traces.
A number of RFI mitigation techniques have been proposed. For example, Reinisch et al. [3] implemented time domain radio frequency interference mitigation (RFIM) algorithms to the signal processing procedure of Digisonde to mitigate RFI on the ionograms so that the signal-to-noise ratio (SNR) of the traces could be improved. On the basis of statistical methods, Ke et al. [4] developed an interference filtering process (IFP) in the Chung-Li ionosonde to remove background noise and radio interference in the ionogram. Chen et al. [5] employed curvelet transform combined with statistical methods to eliminate ionogram noise and radio interference to obtain high quality traces for ionogram autoscaling. In addition to the ionogram, techniques employed using HF radar to eliminate RFI presents in the range-Doppler-intensity (RDI) spectrum of radar echoes were also developed. For instance, using orthogonal property of the eigenvector subspaces between the interference, noise and radar returns of the desired targets, Zhou et al. [6] developed the orthogonal projection filtering method to mitigate RFI in the RDI spectrum domain. According to the high correlation property of the intense narrow band radio interference between different ranges, Lou [7] proposed the frequency domain adaptive clutter suppression method (FACS) to suppress RFI in RDI spectral domain.
This paper attempts to compare the performances of RFIM and FACS methods in the suppression of radio frequency interference in ionograms for the F2 layer critical frequency foF2 scaling, based on the autoscaling algorithm developed by Ke et al. [4]. The ionograms employed for the RFI performance comparison in this study were taken from the Chung-Li ionosonde observations. Compared to original ionograms, the improvements in SNR and signal-to-clutter ratio (SCR) of the RFI-removed ionograms will be analyzed, and the bias and root-mean-squares error (RMSE) of foF2 scaled from RFI-removed ionograms are examined. It showed that the performance of FACS seems to be superior to that of RFIM in the improvement of SCR, while inferior to SNR. As for the bias and RMSE of foF2, FACS seems to be comparable to RFIM. The organization of this paper is described as follows. In Section 2, theoretical backgrounds of RFIM and FACS algorithms are introduced. In Section 3, the performances of RFIM and FACS in RFI suppression are examined. In Section 4, the SNRs and SCRs of the ionograms processed by RFIM and FACS are compared. In Section 5, comparisons in foF2 scaling between RFIM and FACS are made. In Section 6, discussions are made and the conclusion is drawn.
2. Theoretical Backgrounds of RFIM and FACS Algorithms
2.1. Radio Frequency Interference Mitigation (RFIM)
RFIM is a very effective technique to suppress narrow-band RFI in ionograms [3]. Before applying RFIM to an RFI-contaminated ionogram, the interference frequency should be identified first. In this study, we use the following procedure to search for the RFI in an ionogram. First, we calculate the mean () of the echo powers throughout the range at each frequency component of the ionogram. Then, we estimate the mean () and standard deviation () of the averaged echo powers of all frequency components. The echo signal at a specific frequency component is considered as the radio frequency interference if the corresponding value is larger than . We then perform the fast Fourier transform (FFT) to the time series of the raw echo signal at to find the true interference frequency . Given that the signal spectrum is composed of N spectral components with frequency resolution , can be calculated in accordance with the following expression [3]:
where is the frequency component with largest peak amplitude and is the frequency component with amplitude that is the larger one in the two frequency components neighboring on the right and left sides. Once is obtained, we can form a complex Fourier series at this specific frequency based on the complex amplitude of the time series of the raw signal, which is given below.
where is the complex spectral amplitude at , is the complex amplitude of the time series of the sampled data, and is the total number of the samples. From Equation (2), it is straightforward from inverse Fourier transform that the complex amplitude in time domain at frequency can be expressed as follows.
Subtracting from , we then obtain the RFI-mitigated echo signal in the time domain.
2.2. Frequency-Domain Adaptive Clutter Suppression (FACS)
The narrow band RFI is characterized by high correlation in its intensities between neighboring range cells. With this property, the FACS algorithm was originally proposed to mitigate RFI for the HF sea radar echoes in the range-Doppler frequency-intensity (RDI) domain [7]. Considering that the similarity in the dimension and coordinate between the ionogram and sea radar echo spectra varied with range, it is reasonable to apply FACS algorithm to the ionogram for RFI suppression. The FACS algorithm is briefly described below. Let X be a n × m matrix of the echo intensity in the RDI domain, where n is the number of range cells and m is number of Doppler frequencies. Let X(l, :) be the 1 × m row matrix at lth range cell (or referred to as tested range cell), and XR is a (n − 1) × m matrix in the absence of X(l, :). It is expected that for the intense RFI the correlation between X(l, :) and XR is high. However, the cross correlation between RFI and other types of radar returns, such as ionospheric echoes and background noise, is expected to be low. In this context, it is possible to find a weighting function W in accordance with the following relation to suppress the RFI from X(l, :) with the help of XR:
where is the error matrix, W is a (n − 1) × 1 column matrix and H is a conjugate transpose operator. By differentiating the variance of , namely , where E denotes ensemble average, with respect to W and letting the result be zero, we have
It is clear that W is the ratio of cross correlation function between and to the autocorrelation function of . To proceed, we construct a new weighting matrix based on W, which is given below.
Then we normalize to obtain a normalized weighting matrix . Combining and to form an augmented matrix and multiplying it with normalized , we eventually obtain RFI-suppressed echo matrix at the lth range cell given below.
The flow charts of the RFIM and FACS algorithms are summarized in Figure 1.
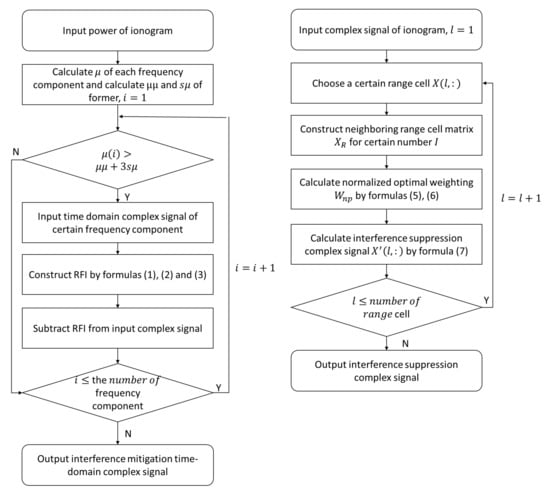
Figure 1.
Flowchart of Radio Frequency Interference Mitigation (RFIM) (left) and Frequency-domain Adaptive Clutter Suppression algorithms (FACS) (right).
3. Performances of RFIM and FACS in RFI Suppressions
In this study, the data taken from the Chung-Li ionosonde were employed to compare the performances of RFIM and FACS in RFI suppression. The Chung-Li ionosonde is a pulse radar that transmits a sequence of short pulses with respective carrier frequencies between 2 and 30 MHz at an interval of 50 kHz. The duration of an entire frequency sweep is 294.13 s, which is divided into 561 frequency components. The 16-bit complementary code is employed in this study to increase the signal-to-noise of the reflected echoes. The observational range is from 70 to 1152 km with a range resolution of 3.84 km. The observed complex radar data in the ionograms are arranged as a three dimensional matrix with 283 rows (range cells), 32 columns (sampling times) and 561 layers (frequency components) for further analysis. For details on the characteristics of the Chung-Li ionosonde, refer to [4]. Before comparing the performances of the RFIM and FACS algorithms in RFI suppression for the radar echoes in ionograms, the procedures of identifying and separating ionospheric echoes (or traces), RFIs (or clutter), and background noise in ionograms are described below. In this study we used statistical methods to classify and separate ionospheric signal, clutter and noise in ionograms. The signal is defined as the ionospheric echoes that are reflected and/or scattered from the ionospheric layers and electron density irregularities, and the clutter is named to represent the RFI that majorly occurred at specific frequencies. On the basis of the algorithms established by Ke et al. [4], the ionospheric signals are estimated as follows. The mean and standard deviation of the radar echo intensities throughout the range for each frequency component in the ionogram are calculated first. We then calculate the mean and the averaged value for , and the mean and the standard deviation for . The echoes with greater than and with smaller than are considered to be radio frequency interference. After removing the echoes greater than , we calculate the mean of all of the echo intensities in the ionogram and the corresponding standard deviation . The echoes greater than are considered to be ionospheric signals and those smaller than are treated as background noise. Consequently, the SNR and SCR can thus be estimated. Note that the ionospheric signal, RFI clutter and background noise extracted from the original ionogram using Ke et al.’s statistical method are dubbed original results, and those extracted from the ionogram processed by RFIM and FACS algorithms are called RFIM and FACS results, respectively.
Figure 2 presents an example of the original ionogram recorded by the Chung-Li ionosonde on 1 June 2022, at 08:00 LT (left panel), in which ionospheric signals (i.e., traces) and RFI events at specific frequencies are clearly noticeable. The middle and right panels of Figure 2 are, respectively, the mean and standard deviations of the echo intensities that are averaged throughout the ranges (or virtual height) at individual frequency. As shown, the mean intensities of the RFIs are about 25 dB greater than those of the ionospheric echoes and background noise. In addition, there is a tendency for the standard deviations of the background noise in a spectral region greater than about 8 MHz to stay at a constant level, with a mean of about 5.5 dB for the present case, while those of the ionospheric traces are slightly greater than the background noise by about 0.5–1 dB. However, the standard deviations of the RFIs are quite small, ranging from 0.2 to 3 dB. From Figure 2, it is very clear that the RFIs in ionograms are characterized by exceedingly large intensities and very small standard deviations. With this property, the ionospheric signals, RFI clutter and background noise level can be individually separated for the estimates of signal-to-clutter ratio (SCR) and signal-to-noise ratio (SNR). Figure 3 depicts an example of the corresponding ionospheric signals, RFI clutter and background noise for the ionogram presented in Figure 2, from which the SCR and SNR can be calculated accordingly. As shown, the use of Ke et al.’s method can effectively identify and separate original signals, clutter and background noise from the original ionogram.

Figure 2.
(left) Example of original ionogram recorded on 1 June 2022, 08:00 LT; (middle) range-averaged echo intensity at each frequency; and (right) corresponding standard deviation at each frequency.
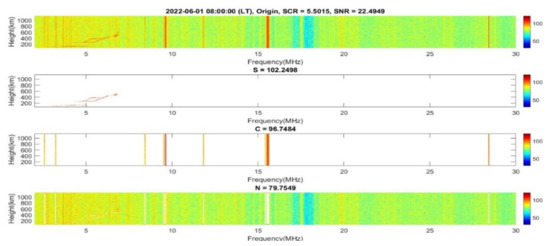
Figure 3.
Examples of ionospheric signal (second panel), RFI clutter (third panel) and background noise (bottom panel) extracted from the original ionogram (top panel) observed by the Chung-Li ionosonde on 1 June 2022 at 08:00 LT.
It is noteworthy that, although the use of RFIM and FACS algorithms can effectively suppress most of the RFIs in ionograms, some of them can still left after the RFIM and FACS. Figure 4 presents examples of the ionospheric signals, clutter and background noise of the ionogram that are, respectively, processed by RFIM (Figure 4a) and FACS (Figure 4b) algorithms and then analyzed by using the statistical method to identify and separate them from the original ionogram, as shown in Figure 3. The neighboring range cells employed for FACS in this example are 16. A comparison between Figure 3 and Figure 4 shows that the RFIs left in RFIM- and FACS-processed ionograms are much weaker than those in the original ionogram, validating the capability of suppressing RFIs in ionograms.
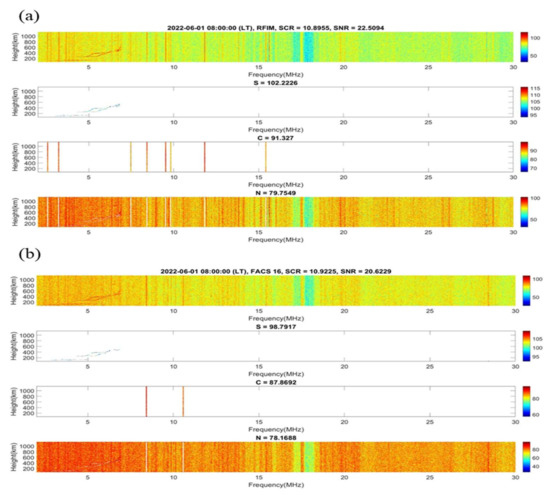
Figure 4.
(a) The same as Figure 3, but for the ionogram shown in the top panel that has been processed by the RFIM algorithm before using statistical methods to identify and separate the signal, clutter and noise; and (b) The results obtained from the FACS-processed ionogram.
In order to investigate the difference in the performances of RFI suppression between RFIM and FACS, we compare the differences between the range-averaged echo intensities before and after RFI suppression, as shown in Figure 5, in which the red (blue) curve represents the difference between the original ionogram and the RFI-suppressed ionogram with the RFIM (FACS) algorithm. The difference in the data between the top and bottom panels of Figure 5 is that the numbers of the neighboring range cells used for the FACS algorithm are, respectively, 10 for the upper and 40 for the lower panels. As shown in Figure 5, RFIM and FACS can both effectively suppress narrow-band RFI with very large intensities, namely, the RFIs at 9.6 MHz, 15.5 MHz, and 28.4 MHz. The RFIs at these frequencies are, respectively, suppressed by about 28, 32 and 22.5 dB for RFIM, and 35.5, 29 and 23 dB for FACS, with the use of 40 neighboring range cells. For the RFIs with relatively weak intensities, FACS can still suppress them effectively, while RFIM does not. A comparison between the upper and lower panels of Figure 4 indicates that the number of neighboring range cells employed in FACS algorithms plays a role not only in weakening the intensities of the ionospheric echoes (or traces) that are present in a frequency range of about 3–7 MHz, but also decreasing the background noise level. On average, the echo intensities reduced by FACS for range cells of 10 and 40 are, respectively, about 0.85 and 2.5 dB.
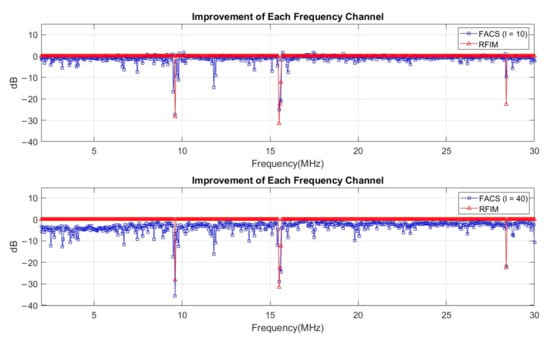
Figure 5.
(Upper) The mean value of each frequency component for the different situations on 1 June 2022 at 08:00 LT; and (Bottom) the difference of each frequency component mean value relative to the original situation.
4. Comparisons in SNR and SCR
As shown in Figure 4 and Figure 5, for the present case, both RFIM and FACS algorithms can effectively suppress RFIs in ionograms. They also display that the degree of the RFI suppression performed by FACS appears to be qualitatively better than that by RFIM, while SNR of the ionospheric echoes of the former seems to be worse than the latter. Nevertheless, we will show later that the number of neighboring range cells selected for FACS algorithms plays a crucial role in the determination of the corresponding SNRs and SCRs. The data employed for the quantitative examinations of the performances of RFI suppressions and the resultant SNR and SCR of FACS and RFIM are taken from the Chung-Li ionosonde for the period from 1 June 2022 at 08:00 LT to 6 June 2022 at 20:00 LT. Because the time spent for the Chung-Li ionosonde obtaining an ionogram was 6 min, there were 1200 ionograms available in total for the examinations. Figure 6 presents the temporal variations of the ionospheric signal intensities (top panel), background noise levels (middle panel) and RFI clutter (bottom panel) as a function of the numbers of neighboring range cells from 1 to 141 in increments of 5 for the FACS-processed ionograms. In addition, the signals, clutter and background noise obtained from original ionograms and from RFIM-processed ionograms are also shown in the leftmost 2 columns in the respective panels for comparison. It is obvious that the signal, background noise and RFI clutter of the FACS ionograms all decline in intensity with increasing neighboring range cells. It is noteworthy that the RFI clutter that can be identified and separated in FACS ionograms becomes more and more sparsely distributed with neighboring range cell numbers larger than 20, implying that they are less representative compared to those with neighboring range cell numbers smaller than 20. Irrespective of the RFI suppression algorithms employed to process the ionogram, there are salient diurnal variations not only in ionospheric signal power, but also in the background noise level. For the ionospheric signal, the primary peaks occur at around 14 LT with minor peaks at around dawn. For the background noise, the primary peaks occur at around dawn with secondary minor peaks at an interval of 20–22 LT. On the whole, the ionospheric signal intensities during daytime are about 4–5 dB larger than those during nighttime, while the background noise levels at dawn are about 2–3 dB stronger than the levels at dusk. As for the RFI clutter, the signature of the diurnal variation of the RFI intensity of the RFIM-processed ionogram is vague and nearly indistinguishable and that is inconsistent with those of the original and FACS-processed ionograms. Detailed examination indicates that the FACS-estimated RFI clutter shows quasi-semidiurnal variation with peaks at around midnight and noon, respectively. The feature of semi-diurnal variations can also be found in the data from the original ionogram. However, the pattern of the temporal variation of the original ionogram is inconsistent with that of the FACS-process ionograms. The primary peaks of the RFI clutter of the original ionograms occurred at around 20 LT, which is out of phase with that of the FACS-processed ionogram.
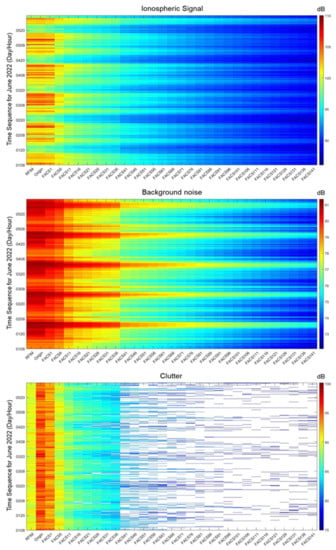
Figure 6.
Temporal variations of ionospheric signal intensity (top), background noise level (middle) and RFI clutter (bottom) of the ionograms processed by different approaches, in which the numbers attached to the FACS on abscissa are the neighboring range cells adopted for the FACS algorithm, and origin and RFIM represent the data computed from the original and RFIM-processed ionograms. The ionograms were observed by the Chung-Li ionosonde for the period from 1 June 2022 at 08:00 LT to 6 June 2022 at 20:00 LT.
From Figure 6, the RFI clutter suppressed by FACS is about 6 dB and 8 dB larger than that by RFIM and the original statistical method, respectively. However, this feature does not mean that the SNR and SCR of FACS-process ionograms are both worse than those of the original and RFIM ionograms. Figure 7 presents temporal variations of SNR (upper panel) and SCR (lower panel) of the original, RFIM-processed and FACS-processed ionograms. As indicated, irrespective of the neighboring range cells used for FACS, the SNRs of the FACS ionograms, which decreases with the number of neighboring range cells, is smaller than for the original and RFIM ionograms. However, regardless of daytime or nighttime, the SCRs of the FACS ionograms with neighboring range cells in a range of 10–40 are significantly larger than those of the original ionograms by about 5–10 dB, while 4–8 dB larger than the RFIM ionograms. Moreover, there is a tendency for the SCRs of FACS ionograms to be about 2–3 dB greater (0–2 dB smaller) than those of the RFIM ionogram during nighttime (daytime). It also indicates from Figure 7 that the amplitudes of the diurnal variations of the SCRs for the original, RFIM and FACS ionograms are very different. They are, respectively, roughly 8 dB, 6 dB, and 4 dB for the original, RFIM, and FACS ionograms. Therefore, the use of RFIM and FACS can greatly improve the SCR of the original ionogram. During the nighttime, the RFI clutter could hardly be distinguished from the background noise. Although RFIM can effectively identify and suppress RFIs during daytime, its capability of RFI suppression during nighttime is worse than that during daytime. With increasing neighboring range cells, the signal intensity, background noise level and RFI clutter of the FACS ionogram are all reduced accordingly.
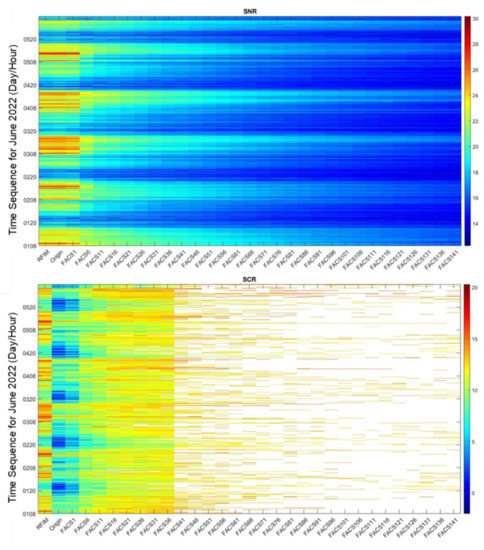
Figure 7.
Same as Figure 6, but for signal-to-noise ratio (SNR) (upper panel) and signal-to-scatter ratio (SCR) (lower panel).
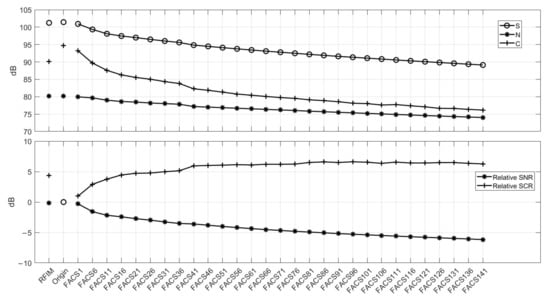
The upper panel of Figure 8 shows the mean values of signal power (S), background noise level (N) and RFI clutter intensity (C) for the data presented in Figure 6. Overall, the means of signal power and noise level of RFIM ionograms are very close to those of the original ionogram. However, the averaged clutter intensity of the original ionograms is much larger than those of the RFIM and FACS ionograms, with neighboring range cells of 1, by about 5 dB and 2 dB, respectively. The discrepancies in the RFI clutter intensities between the original and FACS ionograms increase with increasing number of neighboring range cells. In addition to the clutter, the signal power and background noise level also bear similar tendencies. The bottom panel of Figure 8 shows the averaged SNR and SCR of the RFIM and FACS ionograms with respect to the original ionogram. As indicated, the SCRs of the FACS ionograms approximate to a constant value of about 6 dB as neighboring range cells exceed 40. However, their SNRs, that are smaller than those of the RFIM and original ionograms, still decline with the increase in the neighboring range cells.
5. Comparisons of foF2 Scaling
In addition to the performances of RFI suppression and signal and noise extractions, the correlation and uncertainties of the critical frequency foF2 of ionospheric F layer scaled from the ionograms processed by RFIM and FACS algorithms are assessed and compared in this section. The autoscaling algorithm developed by Ke et al. [4] is employed for true height analysis. Figure 9 presents time sequences of foF2 autoscaled from original ionograms and RFI-suppressed ionograms with RFIM and FACS from the periods of the 20–24 June 2021 (left panel) and 1–5 June 2022 (right panel). The criteria of the standard deviation employed for RFIM and the neighboring range cells used for FACS are, respectively, shown in the legend, and A stands for autoscaling. In addition, the first and second figures separated by a slash shown in the legend are, respectively, the numbers of ionograms available for true height analysis to obtain foF2 (left), and the total ionograms recorded by the ionosonde during respective periods (right). A comparison of the time sequences of the foF2 values scaled from the original, RFIM and FACS ionograms shown in Figure 9 indicates that not only the magnitudes of the foF2 values, but also the patterns of their daily variations over time are highly consistent. This feature strongly suggests that the applications of RFIM and FACS to the ionograms for RFI suppression essentially do not pose an impact on the temporal variation and inherent characteristics of the foF2. Nevertheless, a number of individual data points scattered around the main trends of the respective foF2 daily variations can be seen in Figure 9. Detailed inspections indicate that the degrees of the spread of the scattered data points are related to the number of neighboring range cells for FACS and the threshold of standard deviation for RFIM. In the following, with the help of the root-mean-square-error (RMSE) and the mean bias, the effects of the number of neighboring range cells and the threshold of the standard deviation on the uncertainty and accuracy of the foF2 values scaled from the RFI-suppressed ionograms can be assessed.
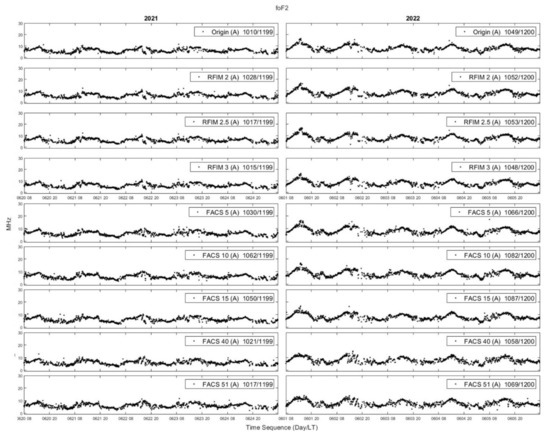
Figure 9.
Time sequences of foF2 autoscaled from original ionograms and RFI-suppressed ionograms with RFIM and FACS algorithms for the periods 20–24 June 2021 (left) and 1–5 June 2022 (right), in which the thresholds of the standard deviations selected for RFIM and the numbers of neighboring range cells employed by FACS for RFI suppression are shown in the legend. The first and second figures separated by a slash shown in the legend are the numbers of ionograms available for true height analysis and the total number of ionograms recorded by Chung-Li ionosonde during respective periods, respectively.
Table 1 compares the correlation coefficients (C.C.), root mean square errors (RMSE) and mean biases between foF2 values scaled from the original and RFIM ionograms with different thresholds of standard deviation for 2021 and 2022. It is clear that their correlations are all very high (0.9–0.96), RMSEs are low (0.67–0.74 MHz), and absolute mean biases are also small (0.0019–0.058 MHz). In addition, the correlations tend to increase with higher thresholds of standard deviation, and the RMSEs tend to decrease with higher thresholds. Table 2 is the same as Table 1, but for the comparisons between the original and FACS ionograms. As indicated, compared to Table 1, their correlations are slightly lower (0.74–0.92), RMSEs are higher (0.88–1.2 MHz), and mean bias are also larger (0.016–0.25 MHz). It is obvious from Table 2 that, with increasing neighboring range cells, the correlation tends to decrease, while the corresponding RMSE and the mean bias both increase. The results presented in Table 1 and Table 2 indicate that the uncertainty of RFIM ionograms for foF2 scaling are smaller than those of FACS.

Table 1.
Comparison of foF2 retrievals between RFIM and original algorithms.

Table 2.
Comparison of foF2 retrievals between FACS and original algorithms.
In light of the inherent discrepancy in the methodology of RFI suppression between RFIM and FACS, it is natural to expect that the statistical results of the foF2 values between the original and RFIM ionograms would be different from those between the original and FACS ionograms, as shown in Table 1 and Table 2. Nevertheless, it is noteworthy that the method of RFI suppression employed by RFIM bears a strong resemblance to that used by the original ionogram that was developed by Ke et al. [4], leading to potential bias in the assessment of performances of RFI suppression with RFIM and FACS based on the statistical results presented in Table 1 and Table 2. Therefore, the use of an objective, independent and uncorrelated data set to assess the uncertainty and accuracy of RFIM and FACS algorithms in foF2 scaling is required. Here, we use manually scaled foF2 to serve as a reference for the performance assessment, and the statistical results are presented in Table 3 and Table 4, in which M represents manual scaling and A stands for autoscaling. A comparison between Table 2 and Table 4 shows that the correlations between manual scaling and autoscaling for FACS are higher than those for the autoscaling, and the RMSEs for the former are also smaller than the latter. From Table 1 and Table 3, the correlations, RMSEs and mean biases between manual scaling and autoscaling for RFIM are overall slightly improved, compared to those for the autoscaling.

Table 3.
Comparison in foF2 retrievals between the RFIM (auto) and original algorithms (manual).

Table 4.
Comparison in foF2 retrievals between the FACS (auto) and original algorithms (manual).
On the basis of the statistical results presented in Table 3 and Table 4, we can assess the effects of RFIM and FACS algorithms on the quality of foF2 values scaled from the RFI-suppressed ionograms. As shown, the use of RFIM and FACS to suppress RFI in ionograms can conditionally improve the accuracy (mean bias) and uncertainty (RMSE) of the foF2 values, depending on the selection of number of neighboring range cells for FACS and the threshold of standard deviation for RFIM. Our results suggest that the use of 5–15 neighboring range cells for FACS and 2–2.5 times standard deviation for RFIM can result in optimal improvements in the uncertainty and accuracy of the scaled foF2. In comparison to the original ionogram, the FACS algorithm can result in about a 5–12% improvement in uncertainty and a 9–80% improvement in accuracy of the scaled foF2, and the RFIM algorithm can make improvements in uncertainty and accuracy of about 0.9–10% and 11–90%, respectively.
6. Discussion
Table 1 and Table 2 show that the correlation of autoscaled foF2 between the original and RFIM ionograms is systematically greater than that between the original and FACS ionograms. In addition, for the RMSE values, the former is significantly smaller than the latter. However, these features are not distinct for the manually scaled foF2 values as shown in Table 3 and Table 4. As described in Section 2, the method of RFI suppression employed for the RFIM algorithm is similar to that of the original ionogram. Therefore, it is evident that the correlation between the original and RFIM being greater than that between the original and FACS is due to the fact that the methodologies employed by RFIM ionograms for RFI suppression are very similar to those of the original ionograms with the statistical method developed by Ke et al. [4]. However, the methodology used by the FACS algorithm for RFI suppression is very different from the original ionogram. This fact accounts for the discrepancy in the correlation and RMSE of the autoscaled foF2 values between the original-RFIM and original-FACS ionograms. When the reference standard of the data sets for comparison are changed from autoscaled foF2 to manually scaled foF2, the correlation and RMSE is be biased by similarity in the methodologies, and much more objective statistical results will be obtained.
Table 2 and Table 4 both indicate that there is a marked tendency for the RMSE and mean bias between the manually scaled and autoscaled foF2 values to increase with increasing neighboring range cells. Note that the autocorrelation function plays a critical role in determining the weighting function to suppress RFIs in ionograms for FACS algorithms, which is a function of the neighboring range cells and essentially represents signal intensity. According to Equations (5) and (6), the more neighboring range cells are selected, the larger the autocorrelation function (or echo power) is, and the smaller the weighting function will be. As a result, the RFI-suppressed signal power and the corresponding SNR all decrease with the neighboring range cells in accordance with Equation (7), as shown in Figure 7 and Figure 8.
The performances of RFI suppression with RFIM and FACS algorithms applied to ionograms are assessed and compared in this study. In light of the theoretical approaches considered by RFIM and FACS are very different, their capabilities in the RFI suppressions are expected to be different. For RFIM algorithm, before performing RFI suppression, RFIs should be defined and shifted from the ionogram first in accordance with the thresholds and mentioned in Section 3. The larger the factor is, the less the sifted RFIs at specific frequency components from the ionogram will be. Therefore, RFIM algorithm is essentially applicable to narrow band RFIs with peak intensities. However, for the FACS algorithm, the optimal weighting function is computed from the ratio of cross-correlation function between RFI intensities at tested range cell and those in the selected neighboring range cells to autocorrelation function of the RFI intensities in the neighboring range cells selected for RFI suppression for all of the frequency components in the ionogram. This approach indicates that the FACS algorithm is much more appropriate to suppress broad band RFI clutter in ionograms.
Questions arise as to what the optimal numbers of neighboring range cells selected for FACS are to achieve the best performances in RFI suppression and foF2 scaling. From Figure 6 and Figure 7, it is evident that as the number of neighboring range cells exceeds 20, some RFI clutter starts to be incapable of being identified and separated by the FACS algorithm which leaves blanks in the plots of clutter and SCR distribution, as shown in the bottom panels of Figure 6 and Figure 7, respectively. When the neighboring range cells are greater than 40, the RFI clutter that can be identified by the FACS algorithm become much more sparse than those with range cells of less than 20 due to weak signal power and SNR. Moreover, from Table 2 and Table 4, it is evident that when the numbers of neighboring range cells are larger than 20, the RMSE and bias of the foF2 scaling become significantly larger than when smaller than 20. In addition, the correlation in the foF2 between manual and autoscaling is also decreased accordingly. Therefore, the results presented in Figure 6 and Figure 7 and Table 1, Table 2, Table 3 and Table 4 suggests that the use of 5–20 neighboring range cells for the FACS algorithm to suppress RFIs in ionograms not only can achieve better performances in the estimates of SNR and SCR, but also can obtain reliable and accurate scaled foF2 values with less uncertainty and smaller bias.
7. Conclusions
In summary, from the results obtained in this study, it is concluded that both of RFIM and FACS algorithms can effectively suppress the RFIs in ionograms. However, the applications of RFIM and FACS to ionograms significantly alter signal intensity, background noise level and RFI clutter. For the FACS algorithm, the more neighboring range cells that are selected, the smaller that the resulting SNR is, and the larger that the uncertainty of the scaled foF2 will be. Although FACS will degrade SNR, its performance in SCR is better than that of RFIM, provided that the neighboring range cells are adequately selected. In addition, the performances of FACS in RFI suppression and the corresponding SNRs and SCRs of the ionograms are dependent on the criteria selected for data processes that will affect the quality of the scaled foF2 from the respective ionograms. A comparison indicates that the accuracy and uncertainty of the foF2 scaled from the RFIM and FACS ionograms for RFI suppression are basically comparable to those scaled from the original ionograms with RFI suppression, based on the statistical method proposed by Ke et al. [4]. Our results suggest that the use of RFIM and FACS to suppress RFI in ionograms can conditionally improve the accuracy and uncertainty of the foF2 values, depending on the selections of neighboring range cell number for FACS and threshold of standard deviation for RFIM. Statistical analysis shows that the use of 5–20 neighboring range cells for FACS and 2–2.5 times standard deviation for RFIM can result in optimal improvements in the uncertainty and accuracy of the scaled foF2. On the whole, FACS algorithms can result in about a 5–12% improvement in uncertainty and a 9–80% improvement in accuracy, and the RFIM algorithm will make a 0.9–10% improvement in uncertainty and 11–90% in accuracy.
Author Contributions
Conceptualization, Y.-H.C., C.-L.S. and Z.-Y.C.; methodology, Y.-H.C., C.-L.S. and Z.-Y.C.; formal analysis, Y.-H.C., C.-L.S. and Z.-Y.C.; validation, Y.-H.C., C.-L.S., Z.-Y.C., K.-J.K., H.-S.L., Y.-L.L. and Y.L.; investigation, Y.-H.C., C.-L.S. and Z.-Y.C.; data curation, C.-L.S.; writing—original draft preparation, Z.-Y.C.; writing—review and editing, Y.-H.C. and C.-L.S.; supervision, Y.-H.C. and C.-L.S.; funding acquisition, Y.-H.C. and C.-L.S. All authors have read and agreed to the published version of the manuscript.
Funding
This research received no external funding.
Data Availability Statement
The data are available from the corresponding author upon request.
Acknowledgments
This work was partially supported by the Central Weather Bureau (CWB), Ministry of Transportation in Taiwan, under contract #1062302D.
Conflicts of Interest
The authors declare no conflict of interest.
References
- Nazari, M.E.; Huang, W.; Zhao, C. Radio Frequency Interference Suppression for HF Surface Wave Radar Using CEMD and Temporal Windowing Methods. IEEE Geosci. Remote Sens. Lett. 2020, 17, 212–216. [Google Scholar] [CrossRef]
- Chen, G.; Zhao, Z.; Zhu, G.; Huang, Y.; Li, T. HF Radio-Frequency Interference Mitigation. IEEE Geosci. Remote Sens. Lett. 2010, 7, 479–482. [Google Scholar] [CrossRef]
- Reinisch, B.W.; Galkin, I.A.; Khmyrov, G.M.; Kozlov, A.V.; Bibl, K.; Lisysyan, I.A.; Cheney, G.P.; Huang, X.; Kitrosser, D.F.; Paznukhov, V.V.; et al. New Digisonde for research and monitoring applications. Radio Sci. 2009, 44, RS0A24. [Google Scholar] [CrossRef]
- Ke, K.-J.; Su, C.-L.; Kuong, R.-M.; Chen, H.-C.; Lin, H.-S.; Chiu, P.-H.; Ko, C.-Y.; Chu, Y.-H. New Chung-Li Ionosonde in Taiwan: System Description and Preliminary Results. Remote Sens. 2022, 14, 1913. [Google Scholar] [CrossRef]
- Chen, Z.; Wang, S.; Fang, G.; Wang, J. Ionograms denoising via curvelet transform. Adv. Space Res. 2013, 52, 1289–1296. [Google Scholar] [CrossRef]
- Zhou, H.; Wen, B.; Wu, S. Dense Radio Frequency Interference Suppression in HF Radars. IEEE Signal Process. Lett. 2005, 12, 361–364. [Google Scholar] [CrossRef]
- Luo, H. Target Detection Method in Short Coherent Integration Time for Sky Wave Over-The-Horizon Radar. Sådhanå 2020, 45, 179. [Google Scholar] [CrossRef]
Disclaimer/Publisher’s Note: The statements, opinions and data contained in all publications are solely those of the individual author(s) and contributor(s) and not of MDPI and/or the editor(s). MDPI and/or the editor(s) disclaim responsibility for any injury to people or property resulting from any ideas, methods, instructions or products referred to in the content. |
© 2023 by the authors. Licensee MDPI, Basel, Switzerland. This article is an open access article distributed under the terms and conditions of the Creative Commons Attribution (CC BY) license (https://creativecommons.org/licenses/by/4.0/).
