Abstract
Traditional two-step localization methods and direct localization methods have practical problems when they are used for underwater acoustic source localization. In this paper, a localization method based on the feature-level information fusion is proposed, in which the Hough Transform is exploited to detect the line characteristics of the spatial features of the target. A secondary accumulation procedure is proposed to extract and fuse the good features instead of fusing all features. The possibility to produce a ghost target is greatly reduced. Hence, the robustness of the proposed method in low SNR scenarios is improved. Experimental results validate the efficiency of exploiting the Hough Transform to eliminate interfering spatial features without sacrificing the localization accuracy.
1. Introduction
Localization of emitting sources is a fundamental task in many fields, such as sonar, radar, sensor networking, wireless communications and many others. Localization tasks are conducted utilizing the target-related information obtained by the sensing platforms. For passive sonar systems, the radiation noise of acoustic sources (e.g., ships, unmanned underwater vehicles (UUVs), and submarines, etc.) are received by hydrophones, and the target-related information can be extracted by processing the received data [1,2,3]. The digitalized information will then be transmitted to a central processing center for a further fusion procedure using an appropriate means of communication.
Generally speaking, data can be transmitted through undersea cables [4], by wireless communication (through air) [5], or by underwater acoustic wireless communication [6]. The cables and wireless communication both support high-speed transmission in appropriate situations. However, the cables are commonly used in shore-based localization systems, while wireless communication is only applicable when the communication apparatus of the sonar systems is above the ocean surface. For sonar systems that stay underwater, such as those deployed on the submarines and UUVs, the underwater acoustic wireless communication is the better choice. Nevertheless, the underwater acoustic wireless communication falls short in performance when compared with the other two methods because of the limited frequency bandwidth and the large time delay of the underwater propagation channel [7,8]. Such characteristics have to be taken into consideration when designing the signal processors of the sonar systems [9].
Current distributed source localization methods can be categorized into two main classes: the two-step methods and the direct localization methods. Traditional two-step localization methods are based on the intermediate measurements, such as angle of arrival (AOA) and time difference of arrival (TDOA). This issue has been extensively investigated for decades, leading to diverse research on bearings-only [10], TDOA-based [11], and hybrid [12] source localization methods. First proposed by Weiss [13,14,15] and Bosse [16,17], the direct localization methods, or specifically the direct position determination (DPD) methods jointly process all the received signals, bypassing the parameter estimation step of the conventional two-step methods. From the perspective of data transmission, the two-step methods can be easily implemented in real tasks, while the communication burden is heavy when the direct localization methods are used since raw data is to be transmitted from the sensing platforms to the central station. On the other hand, the latter have higher localization accuracy, since more information about the target source is contained in the transmitted data [18,19].
To achieve a better balance between the localization accuracy and the communication burden, the authors proposed a method that was based on the spatial features of the target [20]. The spatial features of the target are extracted from the received data of each array, and then transmitted to the fusion center. The target location can be estimated from the fusion of the spatial features. This method works in two steps, but more information about the target is transmitted to the inputs of the fusion process compared with a DOA/TDOA measurement. Additionally, the communication burden of the proposed method is much lower compared to that of the direct localization methods. This feature-level fusion-based method achieves better performance compared with the traditional two-step methods when the received signal-to-noise ratio (SNR) is medium to high. However, it may make mistakes when the SNR is low, owing to the interference of useless features. In this paper, the authors propose to improve the robustness of the method in low SNR scenarios by introducing the Hough Transform [21] technique to the extraction of the spatial features.
The Hough Transform [22] is a well-known algorithm used to identify line features in pattern recognition and image processing. The algorithm and its variants have many applications in diverse fields [23]. For our problems of interest, the Hough Transform was first used in 1980 by Smith [24] to separate the tracks of multiple targets. Later, in 1994, Carlson et al. elaborated the system design concepts, implementation and detection performance of using the Hough Transform to extract detections and tracks from search radar data maps in a series of papers [25], and noted that this concept is similar to Track-Before-Detect (TBD) algorithms [26]. Based on these works, the Hough Transform and its modified versions have been widely used in radar systems for target track initiation [27,28] and the detection of low observable targets [29,30,31,32], and have achieved better performance compared with conventional track initiation algorithms and Detect-Before-Track (DBT) algorithms.
In this paper, the Hough Transform is used to detect and extract useful spatial features of the target from the primary features extracted by the feature-level fusion localization method (called the Basic-FLFL method in the following context) proposed by the authors in [20]. The primary spatial features extracted at each frequency bin by the Basic-FLFL method are seen as the image space, and are then transformed to the parameter space. The useful features are incoherently summed in the accumulating matrix, while the useless features are averaged down. By inversely transforming the peak in the parameter space to the image space, the useful spatial features are recovered, and the useless features are eliminated. With the help of such a “filtering” process, the triangulating pattern of the arrays is highlighted, hence the localization method is more robust in low SNR scenarios. The main contribution of this paper is the introduction of the Hough Transform to the underwater acoustic target localization problems, which provide a new insight into the classification and extraction of the spatial features of the targets.
The paper is organized as follows: Section 2 introduces the Hough Transform-based Feature-Level Fusion Localization (HT-FLFL) method. Section 3 evaluates the performance of the Basic-FLFL method and the proposed HT-FLFL method by numerical and experimental simulations. In Section 4, we summarize the characteristics of the proposed method and present some discussions.
2. Theory Development
In this section, we try to address the target localization problem based on a distributed multi-array sonar system exploiting the spatial features of the target. Based on the spatial features extracted using the Basic-FLFL method proposed by the authors in [20], the Hough Transform is exploited to detect and extract the useful features and eliminate the interfering features. We first introduce the array data model for a multi-array system in Section 2.1. Then, we provide a brief introduction of the Basic-FLFL method in Section 2.2. Next, the application of the Hough Transform to the localization problem is presented in Section 2.3 and Section 2.4.
2.1. Array Data Model
Assume that the sonar system consists of L spatially distributed hydrophone arrays, each composed of elements. The total number of hydrophones is . Consider a target located in the far-field of each array, and its location denoted by , where denotes transpose. The radiating noise of the target is the source signal of interest, which is received by the hydrophone arrays and is modeled as a random process. Using complex (analytic) signal representation, the received data of the ith element of the lth array can be expressed as
where is an unknown complex parameter representing the channel attenuation, and is the unknown source signal. is the propagation time of the source signal to the ith element of the lth array. The additive noise vector is white Gaussian, uncorrelated with the signals, of zero mean and with covariance matrix . is the unknown noise variance at the lth array. It is worth noting that the channel attenuation parameter is time-varying and frequency-dependent, and is different for each element of an array. However, this parameter is not exploited in the developed algorithm and is therefore a nuisance parameter. To simplify the data model, we assume that this parameter is the same for all elements of an array.
The wideband matrix representation of the received data of the lth array for the jth frequency bin is
where
and are the Fourier coefficients of the source signal and the noise, respectively. Equation (4) shows that the propagation time of the source to an array element consists of two parts. The first part is the propagation time of the source signal to the reference element of the lth array represented by , and the second part is the inter-element time delay indicated by the steering vector of the lth array with respect to the source , where denotes the time delay of the ith element to the reference element of the lth array.
The ideal spatial covariance matrix (SCM) for the jth frequency bin can be approximated by [33]
where is the spectral power of the source signal. It can also be approximated by averaging across multiple snapshots
where M is the number of snapshots, and denotes the mth snapshot for the jth frequency bin.
2.2. The Basic-FLFL Method
The spatial features extracted by the Basic-FLFL method are used in this paper as the primary spatial features, based on which the Hough Transform is performed to detect and extract the useful features. Here, we briefly introduce the concept and procedure for extracting the spatial features by the Basic-FLFL method. Consider a monitoring area that is quantized by a space resolution along the x and y directions. The Steered Response Power (SRP) [34] of the Capon beamformer [35] for the jth frequency bin of the lth array can be written as
where is a generic grid position in the monitoring area, and is the inverse of the sample covariance matrix .
is the steered vector or the lth array toward the grid point . is the propagation time from the grid point to the ith hydrophone of the lth array:
where is the position of the ith hydrophone of the lth array, and c is the underwater propagation speed of the sound. The sound speed in real ocean environments is not constant. However, the sound speed is set to be 1500 m/s to simplify the data model. Although the propagation channel parameters are not considered and exploited when developing the algorithm, the performance of the proposed method is evaluated with real ocean experimental data, as shown in Section 3.2.
Now, we can obtain the narrowband SRP map at the jth frequency bin, and the broadband SRP map when the SRP metric is evaluated over a certain frequency band. Next, we briefly introduce the spatial feature extraction and fusion process of the Basic-FLFL method, which is the core of our previous paper and hence is not provided here. The proposed method in this paper is developed based on the extracted spatial features. For more details, please refer to [20]. By applying the Subband Peak Energy Detection concept to the narrowband SRP maps, the Peak Distribution (PD) patterns for all frequency bins are obtained. The peaks appear in the form of straight lines and indicate the directivity of the mainlobe and sidelobes of the SRP maps, and hence are useful spatial features for source localization. Owing to the spatial coherence of the SRP metric for different frequencies, the directivity of the mainlobes for different frequency bins barely changes, while the sidelobes approach the mainlobe as the frequency increases. Therefore, the peaks extracted from the mainlobes overlap and highlight when the narrowband peak distribution patterns are fused, while the sidelobe peaks become background noise. The source location can then be obtained from the intersection pattern of the mainlobe peaks by searching for the maximum point within the monitoring area.
2.3. The Hough Transform
The Hough Transform is a method that converts the global curve detection problem into a peak detection problem in the parameter space, and can be used to detect straight lines, circles, ellipses, hyperbolas, parabolas, and so on. In this paper, the Hough Transform is exploited to detect the line features that are formed by the peaks, and simultaneously serves as a “filter” to keep the useful mainlobe features and eliminate the noisy sidelobe features.
Figure 1 shows a line determined by three points A, B and C in the data space. The line can be defined by the angle of its perpendicular from the origin and the distance from the origin to the line along the perpendicular. The equation of the line corresponding to this geometry is [21]
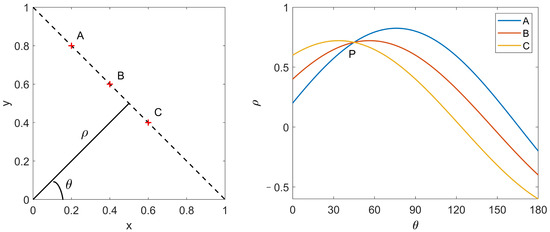
Figure 1.
(Color online) Geometric plot of the Hough Transform in the data space and in the parameter space. A, B and C indicated by the red plus markers are three points in the data space; the three curves in the parameter space are the transformed results of the three points; the three curves have a common intersection P.
If is restricted to , each line in the plane corresponds to a unique parameter pair . For a fixed point (point A), Equation (10) is equivalent to
which means that a point A in the data space (the space) is transformed into a sinusoidal curve in the parameter space (the space) with an amplitude and phase dependent on the and value of the point. When points B and C in the plane are transformed, it is shown that the three curves have a common point of intersection P. Hence, we can see that colinear points in the data space correspond to concurrent curves in the parameter space . Thus, the problem of detecting lines can be solved by finding concurrent curves with the Hough Transform, and the parameters of the lines can be decided by the intersection of the concurrent curves. Based on this, the Hough Transform can be used to detect and locate the lines of peaks in the Peak Distribution (PD) patterns extracted from the narrowband SRP maps, as described in Section 2.2.
2.4. The Detecting and Filtering of Line Features
Next, we describe the detecting and filtering process of the lines of peaks based on the Hough Transform. Let us begin with the Peak Distribution (PD) pattern. Assume the monitoring area is quantized into grids along the x-axis and grids along the y-axis. The PD pattern is a matrix with non-zeros elements as peaks, and the elements are the “observation data” to be processed. It is worth noting that thresholding of the data, which is a common procedure for search radars, is not needed, since we are concerned with the distribution of the peaks instead of their values.
The mapping from the data space into the parameter space is implemented by matrix multiplication. A data matrix can be defined by selecting and arranging the non-zero elements of the PD pattern of the jth frequency bin of the lth array as
where the columns are the grid positions (or matrix subscripts) of the K non-zero elements. A transformation matrix , composed as the sines and cosines from Equation (10) can be defined as
where the values are the discrete values from to in the parameter space. Then, using matrix multiplication, we get
The subscripts of the values indicate the index of the peaks and the quantized s. Each column in corresponds to a peak in the data space and forms a sinusoidal curve in the parameter space.
In order to detect and locate different lines of peaks in the data space, we need to determine the position of the intersections of the curves in the parameter space. To do this, the parameter space is quantized so that the position of the intersection can be better marked. Hence, the -axis is quantized into grids from to with a interval , and the relationship between and K depends on the size of the quantized cells. The quantized parameter space is then treated as a two-dimensional array of accumulators. Denoting the accumulating array for the jth frequency bin of the lth array as , for each point in the data matrix , the corresponding sinusoidal curve given by Equation (11) (i.e., the values of the kth column of ) is marked in the accumulating array.
Binary integration [36] is used here to record the count in each accumulating cell. Elements of the accumulating array are initialized as zeros. Then, the values in will be examined one by one along the columns. For the kth column of , the value in the th accumulating cell will be added by one if the corresponding value fits the cell:
The “voting” process described by Equation (15) will be applied to all frequency bins of interest of the lth array, after which we can obtain J accumulating arrays , which will be referred to as the narrowband accumulating arrays in the following context.
For a narrowband accumulating array , there will be multiple intersections, since there are multiple lines of peaks corresponding to the mainlobe and every sidelobe of the SRP map. We cannot distinguish among intersections for different frequency bins since we have not yet found any mathematical characteristics relating to the difference between the number of peaks extracted from the mainlobe and the sidelobes. However, the intersection corresponding to the mainlobe peaks can be easily identified by applying a secondary accumulation process. In ideal scenarios, the mainlobe line of peaks appears at similar positions in the data space for different frequency bins, and hence the corresponding intersections in the parameter space may enter into the same (or neighboring) accumulating cells. Based on this, if the narrowband accumulating arrays are summed, the cell(s) corresponding to the intersection will further accumulate, while the accumulation of the cells corresponding to the sidelobe lines of peaks is much lower. Hence, the next step is to carry out the secondary accumulation and obtain the wideband accumulating array
The intersection corresponding to the mainlobe lines of peaks can then be identified by finding the maximum of . Note that the fundamental assumption for the proposed method (as well as the Basic-FLFL method) is that the mainlobe lines of peaks overlap for different frequency bins. However, this assumption may be challenged in bad scenarios in which the sound channel has severe frequency-selection characteristics or when the array elements have different frequency responses. The proposed method may not work in such cases because the wideband gain cannot be obtained.
Now that the intersection corresponding to the mainlobe lines of peaks has been identified, the mainlobe lines can be obtained by reversely transforming the intersection in the parameter space to the data space. Theoretically, a point on the parameter plane corresponds to a straight line on the data plane [21]. When the reverse transformation for all L arrays is completed, L straight lines can be obtained on the data plane. The intersection of the L lines is the estimate of the target location. Such a reverse transformation procedure is easy to implement, but the information expressed by these lines is different from that contained in the peaks extracted from the SRP maps, which may lead to localization performance loss.
Therefore, we choose another way to manage the localization procedure. In order to maintain as much target information as possible, all data points that contribute to the intersection should be “recovered” instead of us “producing” a line that represents the mainlobe directivity. To achieve this goal, a marking operation is necessary when computing the narrowband accumulating arrays. A matrix is needed to record the subscripts of the data points contributing to the count of each accumulating cell. When the cell of the wideband accumulating matrix with the maximum count is identified, the corresponding data points are maintained, while the other data points can be eliminated according to the values of . The target location can then be estimated by finding the maximum of the intersection of the recovered mainlobe peaks. Compared with the above-mentioned reverse transformation procedure, all the peaks extracted from the mainlobe of each frequency of all arrays are retained; these contain much original feature-level target information.
Now, we summarize the procedure of the proposed Hough Transform based Feature-Level Fusion Localization (HT-FLFL) method as shown in Figure 2. The method consists of four steps:
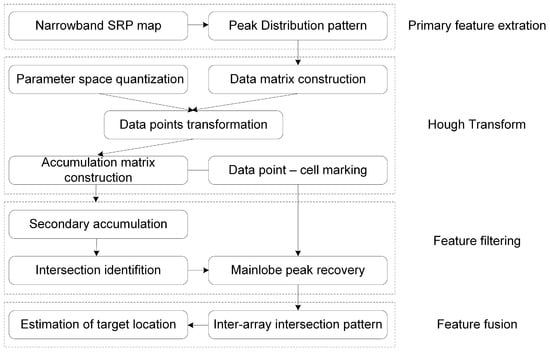
Figure 2.
Flow chart of the proposed method.
- (1)
- Extract the primary spatial features from the narrowband SRP maps.
- (2)
- Construct the data space from the primary features and apply the Hough Transform to the data points. Construct the narrowband accumulating arrays and record the data point contributions.
- (3)
- Construct the wideband accumulating array through secondary accumulation. Identify the intersection and recover the mainlobe peaks of each array.
- (4)
- Construct the inter-array intersection pattern of the mainlobe peaks, and find the maximum point as the estimate of the target location.
As we have stated in the Introduction, the proposed method (as well as the Basic-FLFL method) can achieve a better balance between localization accuracy and communication burden compared with the two-step and direct methods. There are two ways to transmit the information when considering a distributed sonar system. The first is to transmit the narrowband SCMs from each receiving array to the processing center. Then, the whole process outlined in Figure 2 is conducted at the processing center. The data transfer volume depends on the number of array elements and the number of frequency bins processed. The second way is to transmit the primary spatial features, namely the narrowband PD patterns. The processing center then begins with the Hough Transform. The data transfer volume depends on the number of grids quantizing the monitoring area and the number of frequency bins processed. Next, we analyze the data transfer volume of one array. Assume the number of elements is , and the number of frequency bins processed is . The data amount for transmitting the SCMs is in bits (for double data length). Once again, assume that the number of grids in the monitoring area is , and the data amount needed to transmit the PD patterns is in bits. If T-s raw data are to be transmitted and the sampling frequency is , the data amount is in bits. For small aperture arrays, for simplicity, it is reasonable to assume the number of array elements is approximately equal to the number of frequency bins processed, namely . Then, when we compare the data amount for the three means of communication, we only need to compare , , and . We can see that the data amount used for transmiting the SCMs is the smallest. The difference between the other two depends on the quantized step size of the monitoring area and the sampling frequency. However, note that the data amount for transmitting the PD patterns can be largely reduced by a scale of 64 if the value of the peaks is transmitted as one or zero. Based on the above analysis, we can conclude that the communication burden of the proposed method is greatly reduced compared with the direct localization methods transmitting raw data. Additionally, the localization accuracy has increased (as is thoroughly analyzed in [20]) compared with the two-step method with a certain amount of increased communication burden.
3. Numerical and Experimental Simulations
In this section, the localization performance of the proposed HT-FLFL method is examined and compared with the Basic-FLFL method in terms of RMSE in a simulated shallow-water scenario similar to the SWellEx-96 experiment environment [37]. Then data from the SWellEx-96 experiment are processed to verify the applicability and performance of the proposed method.
3.1. Numerical Simulations
As shown in Figure 3, assume the sonar system consists of three 16-element horizontal linear uniform arrays with half-wavelength inter-element spacing, and the working frequency is 250 Hz. The line-of-bearing of each array is clockwise from north, and the distance between neighboring arrays is 1500 m. In the simulations, we use a shallow-water scenario similar to the SWellEx-96 experiment environment. The SWellEx-96 experiment was conducted between 10 and 18 May 1996, approximately 12 km from the tip of Point Loma near San Diego, California. A model environment is built with a measured sound speed profile (SSP) in the water column (collected on 13 May 1996 at 16:18 GMT) and a fluid seabed model consisting of two sediment layers with gradient sound speeds (constant density and attenuation) over a homogeneous half-space. The seabed geoacoustic model parameters can be found in [38]. A 10 km × 10 km monitoring area with a 50 m grid spacing is considered, which is 1000 m to 11,000 m along the x-axis, and m to 5000 m along the y-axis.
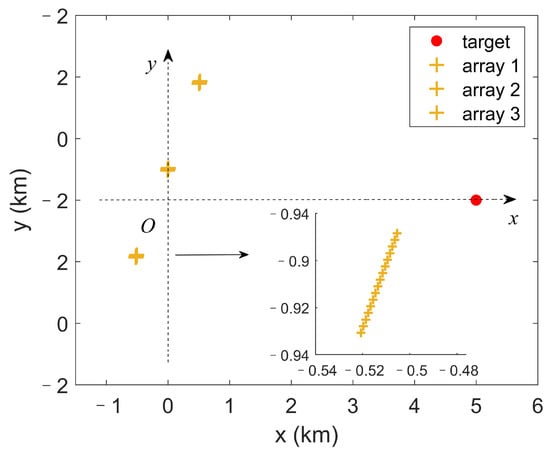
Figure 3.
(Color online) Geometric plot of the receiving system.
Assume a target is located at m and radiating a wideband signal with center frequency 250 Hz and bandwidth 300 Hz. The in-band SNR at the middle array is set to 0 dB, which is defined as
where is the jth noise-free frequency vector of the ith hydrophone of the middle array, and represents the noise frequency vector of the ith hydrophone of the middle array. Simulated acoustic data at the hydrophone arrays are computed using the normal-mode propagation software KRAKEN [39]. A total of 15 s data, sampled at 3276.8 Hz, are transformed to the frequency domain. Results are presented from processing with 10 frequencies from 100 to 400 Hz.
Figure 4 show the narrowband SRP maps, Peak Distribution (PD) patterns and the corresponding accumulating matrices of 112 Hz and 176 Hz of array 1. We can see that one mainlobe and two sidelobes appear in the monitoring area in Figure 4a, and three lines of peaks are formed in Figure 4c after the SPED process. The lines formed by the peaks extracted from the narrowband SRP maps indicate the directivity of the mainlobe and the sidelobes, i.e., from the receiving array toward the target location. Therefore, they are the spatial features used in the Basic-FLFL method to estimate the target location. In this paper, they are seen as the primary spatial features, which will be further processed with the help of the Hough Transform. The non-zero values in Figure 4c are arranged in the data matrix in Equation (12), and are then transformed to the parameter space as in Equation (14). The values in the accumulating matrix record the count of the values in entering into the cells of the parameter space, as shown in Figure 4e. The three lines in Figure 4c correspond to the three intersections of sinusoidal waves in Figure 4e. Note that in Figure 4e,f the intersection corresponding to the shortest line appears at approximately , which is not as clear as the other intersections since the number of peaks is the smallest. Comparing Figure 4c,d, we can see that more sidelobe lines come into the monitoring area. The direction of the mainlobe line does not change with frequency, while the distribution of the sidelobe lines does not show any explicit pattern with different frequency bins. Therefore, the mainlobe line is the useful spatial feature, while the sidelobe lines are interfering features. It is also easily seen that we cannot distinguish the mainlobe line from the sidelobe lines from the narrowband PD pattern or the accumulation matrix, and that is why a secondary accumulation is needed to highlight the mainlobe lines, as shown in Figure 5.
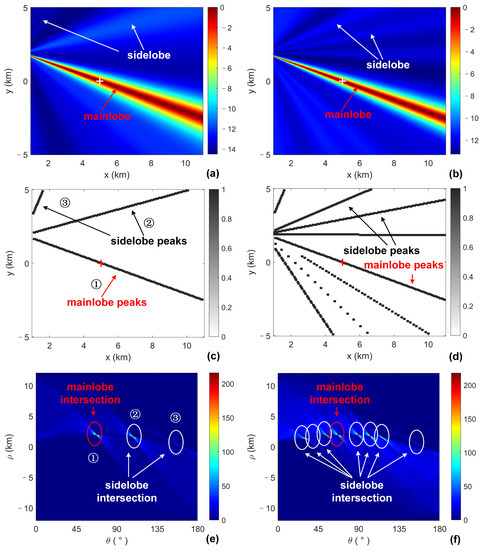
Figure 4.
(Color online) (a,b) Narrowband SRP maps of 112 Hz and 176 Hz of array 1; (c,d) Narrowband Peak Distribution (PD) patterns of 112 Hz and 176 Hz of array 1; (e,f) Narrowband accumulating matrices of 112 Hz and 176 Hz of array 1. The white or red plus markers indicate the true position of the target.
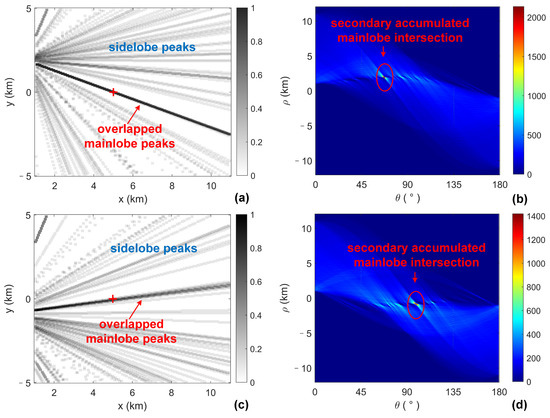
Figure 5.
(Color online) (a,c) Wideband Peak Distribution (PD) patterns of array 1 and 3; (b,d) The secondary accumulating matrices of array 1 and 3. The red plus markers indicate the true position of the target.
Figure 5 show the wideband PD patterns and the results of the secondary accumulating matrices. Comparing Figure 4 and Figure 5, we can find that the mainlobe lines of different frequencies overlap and highlight, while the values of the sidelobe lines are much lower than the mainlobe lines. Likewise, there appears a prominent intersection in the secondary accumulating matrix, which indicates the integration of the primary accumulating matrices. Based on the results of the secondary accumulation, the intersection corresponding to the mainlobe lines is easily identified, and the narrowband mainlobe peaks can be recovered.
Figure 6 shows the recovered narrowband mainlobe peaks of 112 Hz and 176 Hz of array 1 in Figure 6a,b. We can see that the recovered mainlobe lines of peaks are consistent with the previously extracted mainlobe lines of peaks in Figure 4c,d. Figure 6 also shows the fusion of the recovered narrowband mainlobe peaks of array 1 and 3 in Figure 6c,d, which are consistent with the results shown in Figure 5a,c as well.
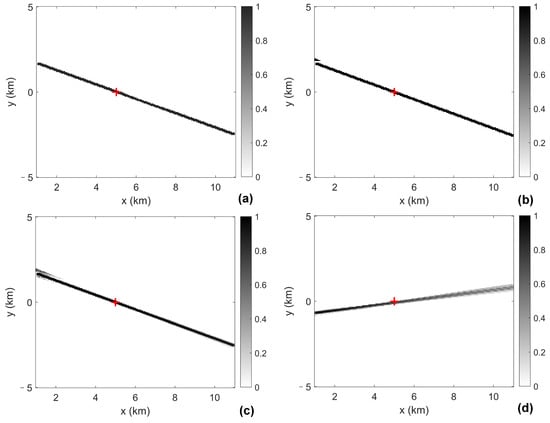
Figure 6.
(Color online) (a,b) The recovered narrowband mainlobe peaks of 112 Hz and 176 Hz of array 1; (c,d) The fusion of the recovered narrowband mainlobe peaks of array 1 and 3. The red plus markers indicate the true position of the target.
The next step is to construct the inter-array intersection pattern with the recovered wideband mainlobe lines of peaks. Figure 7a shows the inter-array intersection pattern of the Basic-FLFL method. The advantage of applying a “filtering” process to the spatial features with the Hough Transform is prominent as shown in Figure 7b. Firstly, the background is made much clearer by eliminating the sidelobe peaks, and the intersection area of the mainlobe lines is easier to identify. Secondly, the chance to produce a “ghost target” indicated by the intersection of the mainlobe line and sidelobe line is decreased. It is worth noting that the localization results of the two methods are the same in this scenario: m with a 70.7 m localization error. This indicates that the above-discussed advantage is not realized by sacrificing the localization accuracy, which is verified by the following Monte Carlo simulation results.
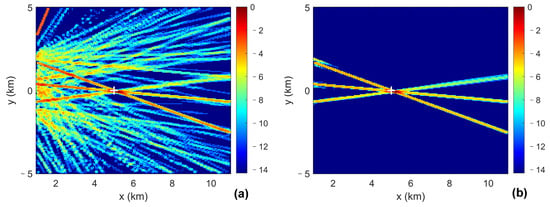
Figure 7.
(Color online) (a) The inter-array intersection pattern of the Basic-FLFL method; (b) the inter-array intersection pattern of the proposed HT-FLFL method. The white plus markers indicate the true position of the target.
Figure 8a shows the localization performance of the Basic-FLFL method and the proposed HT-FLFL method in terms of RMSE (root-mean-squared error) with the SNR level ranging from dB to 4 dB. Next, 3000 Monte Carlo trials are conducted to obtain the RMSE results of the two methods. We can see that the two methods have similar localization accuracy in medium to high-SNR scenarios, while the localization performance of the Basic-FLFL method decreases quickly in low-SNR scenarios. This phenomenon can be explained with the results in Figure 8b and Figure 9. Correct localization means the estimate of the target location lies within the intersection area of the mainlobe lines of peaks, and the probability of correct localization is defined as the percentage of correct localization for the 3000 trials. It is shown that the probability of correct localization is 1 for both methods when the SNR is above dB, where the two methods have equivalent localization accuracy. For SNRs below dB, the Basic-FLFL method may be interfered by the sidelobe peaks and get wrong localization results (as shown in Figure 9), leading to larger RMSE results. On the contrary, the proposed HT-FLFL method has stable performance with decreased SNR owing to the elimination of the sidelobe peaks. It is worth noting that when considering the RMSE of the correct localization results, the two methods have comparable localization accuracy. This indicates that the application of the Hough Transform improves the robustness in low-SNR scenarios without sacrificing the localization accuracy.
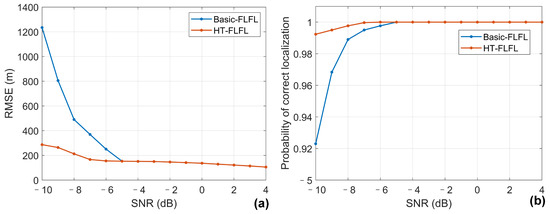
Figure 8.
(Color online) (a) Localization performance and (b) probability of correct localization comparison of the Basic-FLFL method and the proposed HT-FLFL method.
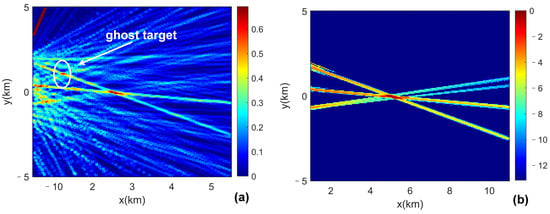
Figure 9.
(Color online) (a) The inter-array intersection pattern of the Basic-FLFL method; (b) The inter-array intersection pattern of the proposed HT-FLFL method. The SNR is set to be −10 dB in this simulation.
3.2. Experimental Evaluation
In the SWellEx-96 experiment, two 32-element horizontal line arrays (HLAs), whose apertures are 255 m and 240 m, respectively, were deployed on the sea bed at about 200 m depth. During processing, 27 elements of each array were used after removing the bad elements. The geometric plot of the 27-element subsets of the two HLAs is shown in Figure 10. The inter-element spacing varies significantly from 3.3 m to 43.5 m, and we divide each large array into two small-aperture arrays to eliminate the largest inter-element spacing. Another advantage of subarray processing in such a scenario is that it can effectively mitigate the performance degradation due to the plane wave assumption. As shown in [40], the propagation modeled by the normal mode solution to the wave equation is different from a plane wave when the range from each hydrophone to the source varies across the array. Hence, when subarray processing is applied, the wave front can be approximately modeled by a plane wave, since the range differences for the elements in a subarray are largely decreased compared to those of the previous large aperture array.
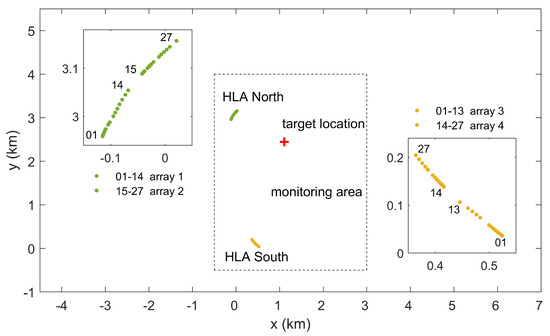
Figure 10.
(Color online) Geometric plot of the 27-element subsets of the two horizontal line arrays and the source location to be estimated. Filled green and yellow circles indicate HLA North and HLA South, respectively. The four small-aperture arrays 1 to 4 are indicated by element indices. The red plus mark indicates true source location investigated. The box with dotted lines marks the edge of the monitoring area.
In Event S59, two multi-tone acoustic sources were towed and transmitting numerous tones between 49 Hz and 400 Hz. The two sources were towed at depths of about 54 m and 9 m, respectively, and the tow speed was 5 knots. In this section, the location of the shallow source is to be estimated as shown in Figure 10. The nine tones transmitted by the shallow source were at 109, 127, 145, 163, 198, 232, 280, 335, and 385 Hz. A segment of duration 15 s data sampled at 3276.8 Hz is transformed to the frequency domain, and the SCMs for each frequency bin are formulated. The 2D search area is km along the x-axis, and km along the y-axis with 20 m spacing.
Figure 11 shows the wideband Peak Distribution (PD) pattern and the secondary accumulating matrix of array 1 in Figure 11a,b, and the fusion of the recovered narrowband mainlobe peaks of array 1 and 3 in Figure 11c,d. Compared with the wideband PD patterns shown in Figure 5, we can see that the number of sidelobe peaks increases greatly due to the change in the array element number from 12 to 27. Besides, the sidelobe lines move closer to the mainlobe line, and the intersection corresponding to the sidelobe lines may lie near the intersection corresponding to the mainlobe line. Therefore, some sidelobe lines of peaks are also recovered as shown in Figure 11c. Figure 12 shows the inter-array intersection patterns of the two methods. We can see that the intersection pattern of the mainlobe lines becomes difficult to identify with the presence of the growing number of sidelobe peaks in Figure 12a. Besides, some intersections of the sidelobe lines of peaks have high values, which may become a potential “ghost target” in some situations. On the contrary, the clear background and the explicit intersection pattern of four mainlobe lines in Figure 12b fundamentally reduce the possibility of producing the ghost targets. The localization errors for the two methods are 285 m. It is noticed that the deviation from the true direction of the mainlobe lines of the two arrays in the south is larger than that of the north arrays. This may be because the source lies near the endfire of the south arrays and the range to the south arrays is larger. The experimental results validate the efficiency of exploiting the Hough Transform to eliminate interfering spatial features and improve the robustness of the method.
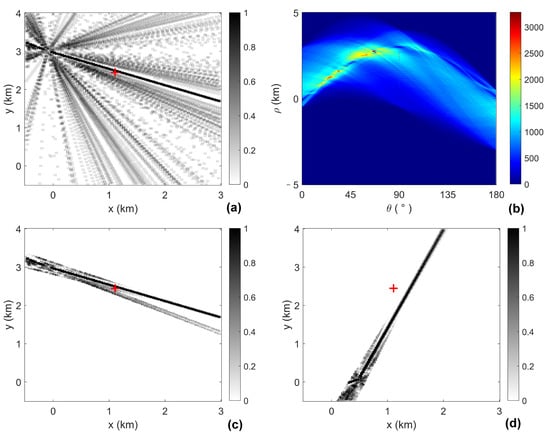
Figure 11.
(Color online) (a,b) The wideband Peak Distribution (PD) pattern and the secondary accumulating matrix of array 1; (c,d) The fusion of the recovered narrowband mainlobe peaks of array 1 and 3. The red plus markers indicate the true position of the target.
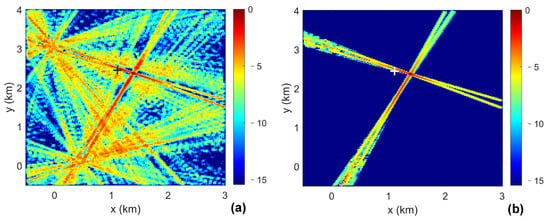
Figure 12.
(Color online) (a) The inter-array intersection pattern of the Basic-FLFL method; (b) The inter-array pattern of the proposed HT-FLFL method. The black or white plus markers indicate the true position of the target.
4. Conclusions
This paper introduced a feature-level fusion-based source localization method which exploits the Hough Transform to detect and extract the contributing spatial features. The method distinguishes the mainlobe feature from the sidelobe feature with the Hough Transform and the application of a secondary accumulation. The useful mainlobe feature is maintained in the final inter-array intersection pattern, while the interfering sidelobe feature is eliminated. The possibility of producing a ghost target is greatly reduced, and hence the robustness of the method in low SNR scenarios is improved.
One hidden concept behind the secondary accumulation is to fuse good features instead of all features. Only the overlapped mainlobe lines of peaks will be recovered and used in the localization step. If the detected direction of arrival of a certain frequency bin is deviated from the others (and we assume that the information contained in this bin is less reliable), the information contained in the extracted peaks cannot contribute to the fusion process.
The Hough Transform is considered to have some unstable characteristics or disadvantages, but it is suitable for our requirements. There are many modified Hough Transform algorithms, but not all of them can be used to solve our problem. For example, the Random HT (RHT) uses many-to-one mapping instead of one-to-one mapping to improve the processing speed. This renders RHT unsuitable for our application, since our goal is not only to detect the features, but also to recover the features. Therefore, all peaks instead of some randomly chosen peaks need to be Hough transformed so that all useful information will be maintained and exploited.
Author Contributions
Conceptualization, L.W. and S.F.; methodology, L.W. and X.L.; investigation, M.W.; writing—original draft preparation, L.W.; writing, review and editing, S.F. and Y.Y.; funding acquisition, L.W. All authors have read and agreed to the published version of the manuscript.
Funding
This research was supported in part by the National Natural Science Foundation of China under Grant No. 12204100, in part by the State Key Laboratory of Acoustics, Chinese Academy of Sciences under Grant No. SKLA202205, and in part by the Fundamental Research Funds for the Central Universities under Grant No. 2242022K30016.
Data Availability Statement
The SWellEx96 shallow water experimental data set used in this study is publicly available at: http://dx.doi.org/10.6075/J0MW2F21 (accessed on 20 December 2022).
Conflicts of Interest
The authors declare no conflict of interest.
References
- Baggeroer, A.B. Sonar Arrays and Array Processing. In Proceedings of the AIP Conference Proceedings, Golden, CO, USA, 25–30 July 2004; Volume 760. [Google Scholar]
- Zhu, C.; Fang, S.; Wu, Q.; An, L.; Luo, X.; Cao, H. A Time-Frequency Joint Time-Delay Difference Estimation Method for Signal Enhancement in the Distorted towed Hydrophone Array. Remote Sens. 2021, 13, 4586. [Google Scholar] [CrossRef]
- Zhu, C.; Seri, S.G.; Mohebbi-Kalkhoran, H.; Ratilal, P. Long-Range Automatic Detection, Acoustic Signature Characterization and Bearing-Time Estimation of Multiple Ships with Coherent Hydrophone Array. Remote Sens. 2020, 12, 3731. [Google Scholar] [CrossRef]
- Lu, F.; Zhou, H.; Yue, J.; Peng, X.; He, B.; Wu, Z. Design of an undersea power system for the East China Sea experimental cabled seafloor observatory. In Proceedings of the 2013 OCEANS, San Diego, CA, USA, 23–27 September 2013; pp. 1–6. [Google Scholar]
- Wood, J.; Irish, J. A Compliant Surface Mooring System for Real-Time Data Acquisition. In Proceedings of the OCEANS ’87, Halifax, NS, Canada, 28 September–1 October 1987; pp. 652–657. [Google Scholar]
- Han, G.; Jiang, J.; Sun, N.; Shu, L. Secure communication for underwater acoustic sensor networks. IEEE Commun. Mag. 2015, 53, 54–60. [Google Scholar] [CrossRef]
- Stojanovic, M.; Preisig, J. Underwater acoustic communication channels: Propagation models and statistical characterization. IEEE Commun. Mag. 2009, 47, 84–89. [Google Scholar] [CrossRef]
- Zhou, Y.; Tong, F.; Yang, X. Research on Co-Channel Interference Cancellation for Underwater Acoustic MIMO Communications. Remote Sens. 2022, 14, 5049. [Google Scholar] [CrossRef]
- Wang, J.; Liu, K. High-frequency Active Sonar Real-time Signal Processing System Based on FPGA. In Proceedings of the 2018 IEEE International Conference on Signal Processing, Communications and Computing (ICSPCC), Qingdao, China, 14–16 September 2018; pp. 1–4. [Google Scholar]
- Nguyen, N.H.; Dogancay, K. Closed-Form Algebraic Solutions for Angle-of-Arrival Source Localization With Bayesian Priors. IEEE Trans. Wirel. Commun. 2019, 18, 3827–3842. [Google Scholar] [CrossRef]
- Wang, G.; Ho, K.C. Convex Relaxation Methods for Unified Near-Field and Far-Field TDOA-Based Localization. IEEE Trans. Wirel. Commun. 2019, 18, 2346–2360. [Google Scholar] [CrossRef]
- Wang, D.; Yin, J.; Zhang, T.; Jia, C.; Wei, F. Iterative constrained weighted least squares estimator for TDOA and FDOA positioning of multiple disjoint sources in the presence of sensor position and velocity uncertainties. Digit. Signal Process. 2019, 92, 179–205. [Google Scholar] [CrossRef]
- Weiss, A.J. Direct position determination of narrowband radio frequency transmitters. IEEE Signal Process. Lett. 2004, 11, 513–516. [Google Scholar] [CrossRef]
- Weiss, A.J.; Alon, A. Direct Position Determination of Multiple Radio Signals. EURASIP J. Adv. Signal Process. 2005, 2005, 37–49. [Google Scholar]
- Weiss, A.; Arikan, T.; Vishnu, H.; Deane, G.B.; Singer, A.C.; Wornell, G.W. A Semi-Blind Method for Localization of Underwater Acoustic Sources. IEEE Trans. Signal Process. 2022, 70, 3090–3106. [Google Scholar] [CrossRef]
- Bosse, J.; Ferréol, A.; Germond, C.; Larzabal, P. Passive geolocalization of radio transmitters: Algorithm and performance in narrowband context. Signal Process. 2012, 92, 841–852. [Google Scholar] [CrossRef]
- Bosse, J.; Ferréol, A.; Larzabal, P. A Spatio-Temporal Array Processing for Passive Localization of Radio Transmitters. IEEE Trans. Signal Process. 2013, 61, 5485–5494. [Google Scholar] [CrossRef]
- Wax, M.; Kailath, T. Decentralized processing in sensor arrays. IEEE Trans. Acoust. Speech Signal Process. 1985, 33, 1123–1129. [Google Scholar] [CrossRef]
- Tan, H.P.; Diamant, R.; Seah, W.K.; Waldmeyer, M. A survey of techniques and challenges in underwater localization. Ocean Eng. 2011, 38, 1663–1676. [Google Scholar] [CrossRef]
- Wang, L.; Yang, Y.; Liu, X. A distributed subband valley fusion (DSVF) method for low frequency broadband target localization. J. Acoust. Soc. Am. 2018, 143, 2269–2278. [Google Scholar] [CrossRef]
- Duda, R.O.; Hart, P.E. Use of the Hough Transformation to Detect Lines and Curves in Pictures. Commun. ACM 1972, 15, 11–15. [Google Scholar] [CrossRef]
- Hough, P.V. Methods and Means for Recognizing Complex Patterns. U.S. Patent US3069654A, 18 December 1962. [Google Scholar]
- Mukhopadhyay, P.; Chaudhuri, B.B. A survey of Hough Transform. Pattern Recognit. 2015, 48, 993–1010. [Google Scholar] [CrossRef]
- Smith, M.C. Feature space transform for multitarget detection. In Proceedings of the 1980 19th IEEE Conference on Decision and Control including the Symposium on Adaptive Processes, Albuquerque, NM, USA, 10–12 December 1980; pp. 835–836. [Google Scholar]
- Carlson, B.; Evans, E.; Wilson, S. Search radar detection and track with the Hough Transform, I. System concept. IEEE Trans. Aerosp. Electron. Syst. 1994, 30, 102–108. [Google Scholar] [CrossRef]
- Tonissen, S.; Evans, R. Peformance of dynamic programming techniques for Track-Before-Detect. IEEE Trans. Aerosp. Electron. Syst. 1996, 32, 1440–1451. [Google Scholar] [CrossRef]
- Hu, Z.; Leung, H.; Blanchette, M. Statistical performance analysis of track initiation techniques. IEEE Trans. Signal Process. 1997, 45, 445–456. [Google Scholar]
- Yankowich, S.W.; Farooq, M. Hough Transform based multisensor, multitarget, track initiation technique. Opt. Eng. 1998, 37, 2064–2077. [Google Scholar]
- Moyer, L.R.; Spak, J.; Lamanna, P. A Multi-Dimensional Hough Transform-based Track-Before-Detect technique for detecting weak targets in strong clutter backgrounds. IEEE Trans. Aerosp. Electron. Syst. 2011, 47, 3062–3068. [Google Scholar] [CrossRef]
- Pengzheng, L.; Chongyi, F.; Xiaotao, H.; Jiahua, Z. Weak moving target detection with multipath clutter suppression based on Hough transform. In Proceedings of the 2013 14th International Radar Symposium (IRS), Dresden, Germany, 19–21 June 2013; Volume 2, pp. 774–778. [Google Scholar]
- Sahin, G.; Demirekler, M. A Multi-dimensional Hough Transform Algorithm based on Unscented Transform as a Track-Before-Detect method. In Proceedings of the 17th International Conference on Information Fusion (FUSION), Salamanca, Spain, 7–10 July 2014; pp. 1–8. [Google Scholar]
- Rao, B.; Zhou, Y.; Nie, Y. Detection and Tracking of Weak Exoatmospheric Target with Elliptical Hough Transform. Remote Sens. 2022, 14, 491. [Google Scholar] [CrossRef]
- Wax, M.; Shan, T.J.; Kailath, T. Spatio-temporal spectral analysis by eigenstructure methods. IEEE Trans. Acoust. Speech Signal Process. 1984, 32, 817–827. [Google Scholar] [CrossRef]
- Salvati, D.; Drioli, C.; Foresti, G.L. Exploiting a geometrically sampled grid in the steered response power algorithm for localization improvement. J. Acoust. Soc. Am. 2017, 141, 586–601. [Google Scholar] [CrossRef]
- Capon, J. High-resolution frequency-wavenumber spectrum analysis. Proc. IEEE 1969, 57, 1408–1418. [Google Scholar] [CrossRef]
- Carlson, B.; Evans, E.; Wilson, S. Search radar detection and track with the Hough transform. III. Detection performance with binary integration. IEEE Trans. Aerosp. Electron. Syst. 1994, 30, 116–125. [Google Scholar] [CrossRef]
- Booth, N.O.; Hodgkiss, W.S.; Ensberg, D.E. SWellEx-96 Experiment Acoustic Data, UC San Diego Library Digital Collections. 2015. Available online: https://library.ucsd.edu/dc/collection/bb3312136z (accessed on 20 December 2022).
- Tollefsen, D.; Gerstoft, P.; Hodgkiss, W.S. Multiple-array passive acoustic source localization in shallow water. J. Acoust. Soc. Am. 2017, 141, 1501–1513. [Google Scholar] [CrossRef]
- Porter, M. The KRAKEN Normal Mode Program; SACLANT Undersea Research Centre Mem.: La Spezia, Italy, 1992. [Google Scholar]
- Wilson, J.H.; Veenhuis, R.S. Shallow water beamforming with small aperture, horizontal, towed arrays. J. Acoust. Soc. Am. 1997, 101, 384–394. [Google Scholar] [CrossRef]
Disclaimer/Publisher’s Note: The statements, opinions and data contained in all publications are solely those of the individual author(s) and contributor(s) and not of MDPI and/or the editor(s). MDPI and/or the editor(s) disclaim responsibility for any injury to people or property resulting from any ideas, methods, instructions or products referred to in the content. |
© 2023 by the authors. Licensee MDPI, Basel, Switzerland. This article is an open access article distributed under the terms and conditions of the Creative Commons Attribution (CC BY) license (https://creativecommons.org/licenses/by/4.0/).