Abstract
Surface reflectance is an important indicator for the physical states of the Earth’s surface. The Moderate Resolution Imaging Spectroradiometer (MODIS) surface reflectance product at 500 m resolution (MOD09A1) includes seven spectral bands and has been widely used to derive many high-level parameter products, such as leaf area index (LAI) and fraction of absorbed photosynthetically active radiation (FAPAR). However, the MODIS surface reflectance product at 250 m resolution (MOD09Q1) is only available for the red and near-infrared (NIR) bands, which greatly limits its applications. In this study, a downscaling reflectance convolutional neural network (DRCNN) is proposed to downscale the surface reflectance of the MOD09A1 product and derive 250 m surface reflectance in the blue, green, shortwave infrared (SWIR1, 1628–1652 nm) and shortwave infrared (SWIR2, 2105–2155 nm) bands for generating high-level parameter products at 250 m resolution. The surface reflectance of the MOD09A1 and MOD09Q1 products are preprocessed to obtain cloud-free continuous surface reflectance. Additionally, the surface reflectance in the blue, green, SWIR1 and SWIR2 bands from the preprocessed MOD09A1 product were upsampled to obtain surface reflectance in the corresponding bands at 1 km resolution. Then, a database was generated from the upsampled surface reflectance and the preprocessed MOD09A1 product over the On Line Validation Exercise (OLIVE) sites to train the DRCNN. The surface reflectance in the blue, green, SWIR1 and SWIR2 bands from the preprocessed MOD09A1 product and the surface reflectance in the red and NIR bands from the preprocessed MOD09Q1 product were entered into the trained DRCNN to obtain the surface reflectance in the blue, green, SWIR1 and SWIR2 bands at 250 m resolution. The downscaled surface reflectance from the DRCNN were compared with the surface reflectance from the MOD09A1 product and Landsat 7. The results show that the DRCNN can effectively downscale the surface reflectance of the MOD09A1 product to generate the surface reflectance at 250 m resolution.
1. Introduction
Surface reflectance estimated from satellite observations has been widely used in land classification, atmospheric monitoring and inversion of surface parameters [1]. Various surface reflectance products with different spatial resolutions have been generated from satellite observations. Among them, the two surface reflectance products generated from the Moderate Resolution Imaging Spectroradiometer (MODIS) sensor aboard the Terra satellite (MOD09A1 and MOD09Q1) are the most widely used in the scientific community. The MOD09A1 product contains surface reflectance of MODIS bands 1 through 7 at a resolution of 500 m, whereas the MOD09Q1 product only contains red and NIR surface reflectance with a resolution of 250 m [2]. Many remote sensing parameter products have been developed based on the MOD09A1 product [3]. With the demands for higher-resolution remote sensing data, the importance of 250 m surface reflectance has also been emphasized in recent years [4]. Higher-resolution surface reflectance can more accurately describe the state and changes of the Earth’s surface and can be further utilized to generate many high-level remote sensing parameter products with higher spatial resolution. In particular, the remote sensing data with a resolution of 250 m are considered most suitable for detecting changes in land cover at the regional and global scales [5]. The development of a 250 m land cover change product is conducive to understanding the changes in surface vegetation after human activities and natural disasters [6]. However, due to the limitation of the bands for the MOD09Q1 product, the algorithm originally developed for the MOD09A1 product cannot be directly employed for the MOD09Q1 product. Therefore, some studies were carried out to generate 250 m surface reflectance.
There are several methods for downscaling the MODIS surface reflectance from 500 m to 250 m. Trishchenko et al. [7] developed an adaptive regression model to downscale the MODIS surface reflectance from 500 m to 250 m by combining the surface reflectance of each band at 500 m resolution with the existing surface reflectance at 250 m resolution. However, this method requires the participation of surface reflectance of all bands and is only effective for the MODIS surface reflectance [8]. Similarly, Che et al. [9] proposed an automated regression method based on the nonlinear correlation between MODIS surface reflectance for each band and normalized difference vegetation index (NDVI) at 500 m resolution. The regression model obtained at the 500 m resolution was applied to obtain the surface reflectance at the 250 m resolution. Furthermore, geostatistical methods such as the kriging method and the improved adaptive regression model are also applied to generate 250 m surface reflectance [10,11]. These relatively traditional methods inspire us to simultaneously use surface reflectance data with different spatial resolutions to downscale the surface reflectance data at coarse resolutions. Furthermore, the spatial information of adjacent pixels is also valuable when downscaling the surface reflectance.
In recent years, data-driven algorithms represented by machine learning and deep learning have been widely utilized. Random forest regression, as a common machine learning algorithm, is applied to downscale land surface temperature [12]. With the development of deep learning methods, many artificial intelligence algorithms have also entered the field of remote sensing [13]. Specifically, deep learning algorithms based on convolutional neural networks (CNNs) have been applied to solve many classic remote sensing problems, such as land use mapping [14], object detection [15] and crop classification [16]. Much work has been performed on non-classified tasks such as downscaling spatial resolution [17,18]. This problem of improving the spatial resolution of images is a typical super-resolution problem, which is one of the hot spots of deep learning research. The super-resolution convolutional neural network (SRCNN) is the pioneering work of deep learning in image super-resolution [19]. It successfully uses deep learning algorithms to solve the super-resolution problem of a single image. Subsequently, more deep learning algorithms, especially those with convolutional neural networks as the main architecture, have become an important means to solve the problem of image super-resolution. These improved algorithms have led to innovation in various aspects such as the depth or local structure of the network, the sampling method of the input image, the activation function, etc. The efficient sub-pixel convolutional neural network (ESPCN) is important for progress in solving the problem of image super-resolution efficiency in deep convolutional neural networks. Moreover, the ESPCN directly operates on the original low-resolution image and can flexibly set the magnification [20]. Similar to the image super-resolution problem, the spatial resolution of surface reflectance data can also be downscaled using deep learning algorithms. The spatial resolution of the surface reflectance data of the Sentinel-2 satellite at each band is not uniform. Lanaras et al. [21] proposed a deep convolutional neural network model to downscale surface reflectance data at coarse resolutions, such as 20 m and 60 m to surface reflectance data at 10 m resolutions. Similarly, convolutional neural networks can also downscale surface reflectance data for individual bands by fusing surface reflectance data at different resolutions. Shao et al. [22] used convolutional neural networks to fuse the surface reflectance data of Landsat 8 and Sentinel-2. This deep learning framework combines the advantages of Landsat 8 and Sentinel-2 surface reflectance data, which helps generate continuous surface reflectance data with higher time frequencies. However, the development of these super-resolution methods based on deep convolutional neural networks has been extensively studied so far, but there are relatively few studies using deep convolutional networks for downscaling the surface reflectance data. Moreover, the surface reflectance data has its particularity: it has a lot of information in time and space. Due to the different accuracy required for application, it is not suitable to directly use the existing super-resolution deep convolution neural network.
In this study, a downscaling reflectance convolutional neural network (DRCNN) is developed to downscale the MOD09A1 product and to generate surface reflectance in the blue, green, shortwave infrared (SWIR1, 1628–1652 nm) and shortwave infrared (SWIR2, 2105–2155 nm) bands at 250 m resolution. The DRCNN is a deep neural network composed of three convolutional layers specially designed to downscale the MOD09A1 product. Two experiments were designed in this paper to evaluate the performance of the DRCNN.
This paper is organized as follows. In Section 2, we introduce the DRCNN proposed in this paper and illustrate the composition of the dataset. Training of the DRCNN is introduced in this section. We also introduce the strategies and methods used to evaluate the performance of the DRCNN. Section 3 presents the results of two experiments to evaluate the DRCNN. In Section 4, we elaborate the discussions. The final section illustrates the conclusions.
2. Materials and Methods
This paper develops a DRCNN to downscale the MOD09A1 product and to generate surface reflectance at 250 m resolution. The flowchart of downscaling surface reflectance using the DRCNN is shown in Figure 1. The MODIS surface reflectance products (MOD09A1 and MOD09Q1) are preprocessed to obtain cloud-free continuous surface reflectance. Then, surface reflectance in the blue, green, SWIR1 and SWIR2 bands from the preprocessed MOD09A1 product were upsampled to obtain surface reflectance in the corresponding bands at 1 km resolution. A database was generated from the upsampled surface reflectance and the preprocessed MOD09A1 product over global sites to train the DRCNN. The trained DRCNN was then used to downscale the MOD09A1 product. The surface reflectance in the blue, green, SWIR1 and SWIR2 bands from the preprocessed MOD09A1 product and the surface reflectance in the red and NIR bands from the preprocessed MOD09Q1 product were entered into the trained DRCNN to obtain the surface reflectance in the blue, green, SWIR1 and SWIR2 bands at 250 m resolution.
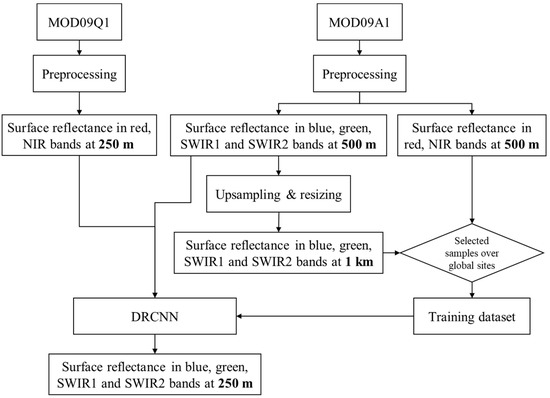
Figure 1.
Flowchart of downscaling the MOD09A1 product to generate surface reflectance at 250 m resolution using the DRCNN.
2.1. Downscaling Reflectance Convolutional Neural Network
2.1.1. Network Structure
Deep learning is an end-to-end representation learning algorithm, which is one of the main features that distinguishes deep learning from other machine learning algorithms. End-to-end learning means that a deep network can directly mine features from large-scale input data. Convolutional neural networks are one of the most commonly employed deep neural networks, as it can mine local spatial feature information very well. These networks are mainly composed of three parts: a convolutional layer, a pooling layer and an activation function. A fully convolutional network (FCN) is a special kind of convolutional neural network. Each layer of the FCN is composed of convolutional layers. The FCN can accept input images of any size without requiring all training images and test images to have the same size. In addition, the calculation of the FCN is more efficient, as it avoids the problem of repeated storage and calculation convolution due to the use of pixel blocks.
This paper develops a DRCNN to increase the spatial resolution of MODIS surface reflectance data with 500 m spatial resolution to 250 m. The structure of the DRCNN is shown in Figure 2. The DRCNN is essentially a fully convolutional neural network that consists of three convolutional layers, and the output of each layer is calculated by a rectified linear unit (ReLU) as activation function, namely , with the exception of the last output layer. The filter is the convolution kernel, the kernel size of each layer is 3 and the depth of each convolution kernel is consistent with the depth of the corresponding layer. The activation function is the key to providing the deep network with strong nonlinear capabilities. The formula of the is shown in Equation (1).
where is the output of corresponding layer.

Figure 2.
The structure of the DRCNN. The m and n of the input part represent the dimensions of the input coarse reflectance and fine reflectance, respectively.
The depth of the three-layer convolutional network is 64, 32 and 1. Other parameters, such as step size and padding, are set to 1.
2.1.2. Training Data
The training data were extracted from the surface reflectance of the MOD09A1 product. The MOD09A1 product is widely utilized in various remote sensing applications, but there are some cloud-contaminated surface reflectance values in the product. In this study, the temporally continuous vegetation indices-based land-surface reflectance reconstruction (VIRR) method [23] was used to preprocess the surface reflectance of the MOD09A1 product. The surface reflectance of the MOD09A1 product were used to calculate NDVI, and a robust smoothing algorithm was used to reconstruct continuous and smooth NDVI upper envelopes, which were used to identify cloud-contaminated surface reflectance values. Moreover, the surface reflectance was reconstructed according to cloud-free surface reflectance values by incorporating the upper envelopes of the NDVI time series as constraints.
Then, surface reflectance in the blue, green, SWIR1 and SWIR2 bands from the preprocessed MOD09A1 product were upsampled to obtain surface reflectance in the corresponding bands at 1 km resolution. In this study, the upsampled surface reflectance and the preprocessed MOD09A1 product were used to construct the training dataset of the DRCNN.
In this paper, the construction strategy of the training data is to select sample points worldwide, which can enhance the generalizability of the DRCNN. The selection of the sample points is based on the On Line Validation Exercise (OLIVE) platform [24]. The OLIVE platform is dedicated to the validation of global biophysical products such as the LAI and fraction of absorbed photosynthetically active radiation (FAPAR). There are a total of 558 sites which aims to provide a good sampling of biome types and conditions throughout the world. In this study, the 558 points were selected as the training data sampling points.
Then, we used the coordinate of each sampling point as the center to extract the surface reflectance in the blue, green, SWIR1 and SWIR2 bands over a 16 pixel × 16 pixel area from the upsampled surface reflectance with a resolution of 1 km and the surface reflectance in the red and NIR bands over a 32 pixel × 32 pixel area from the preprocessed MOD09A1 product with a resolution of 500 m to form the input part of the training data. The output parts of the training data were also extracted from the preprocessed MOD09A1 product, and included the surface reflectance in the blue, green, SWIR1 and SWIR2 bands over the corresponding 32 pixel × 32 pixel area. In deep learning, the sample size in the training dataset is considered to be a hyperparameter. In other words, the size of the data block affects the efficiency and even the final accuracy of the calculation; 16 pixel × 16 pixel or 32 pixel × 32 pixel were the sizes selected for this study. To ensure the diversity of the training data, the surface reflectance in 5 years (2002, 2006, 2010, 2014 and 2018) were extracted for each sampling points. Since there are 46 data days in a year, the entire training dataset consisted of 126,040 samples.
2.1.3. Training of the DRCNN
Deep learning uses the backpropagation mechanism to learn knowledge from the training dataset. Under the constraints of the loss function, the parameters of the entire network were fixed through multiple iterations. During the training process, the loss function of the DRCNN was the root mean square error (RMSE) and the batch size was 64. The input of the DRCNN consisted of two parts: coarse resolution reflectance and fine resolution reflectance. The coarse resolution reflectance can be employed as a priori information to ensure that the output accuracy will not have a large deviation, and the fine resolution data provide high-resolution spatial details for the DRCNN. The fine resolution data are the key to improving the resolution of the coarse data.
In the training state, the surface reflectance in the blue, green, SWIR1 and SWIR2 bands from the upsampled surface reflectance with a resolution of 1 km are the coarse resolution data, and the surface reflectance in the red and NIR bands from the preprocessed MOD09A1 product with a resolution of 500 m are the fine resolution data. The training process of the DRCNN is to construct a twofold downscaling algorithm through 1 km data and 500 m data. We suggest that models with the same transformation scale have the same ability to improve resolution. Similar to the principle of the SRCNN, a deep learning method for single image super-resolution, the DRCNN uses the same bicubic algorithm as the SRCNN to resample 500 m surface reflectance data to 1 km surface reflectance data.
2.2. Performance Evaluation of the DRCNN
The trained DRCNN was used to downscale the surface reflectance of the MOD09A1 product to generate the surface reflectance with a resolution of 250 m. In this study, seven MODIS tiles were selected as validation regions to evaluate the performance of the DRCNN. The seven tiles were h26v04, h19v04, h17v05, h21v09, h12v04, h12v08 and h27v12. Figure 3 shows the distribution locations of these tiles. At the same time, this paper also selected seven sites in the above seven tiles. They are the Zhangbei site at h26v04, the Collelongo site at h19v04, the Barrax site at h17v05, the Maragua site at h21v09, the Counami site at h12v08, the Larose site at h12v04 and the Camerons site at h27v12. The coordinates of the Zhangbei site are (41.29°N, 114.67°E) and the land cover is grassland. The coordinates of the Collelongo site are (41.85°N, 13.59°E) and the land cover is cropland. The coordinates of the Barrax site are (39.06°N, 2.1°W) and the coordinates of the Maragua site are (0.77°S, 36.97°E). The land cover of the Barrax and Maragua sites is cropland. The coordinates of the Counami site are (5.34°N, 53.23°W) and the land cover is tropical forest. The coordinates of the Larose and Camerons sites are (45.38°N, 75.21°W) and (32.59°S, 116.25°E), and the land cover of these two sites are boreal forest and broadleaf forest, respectively.
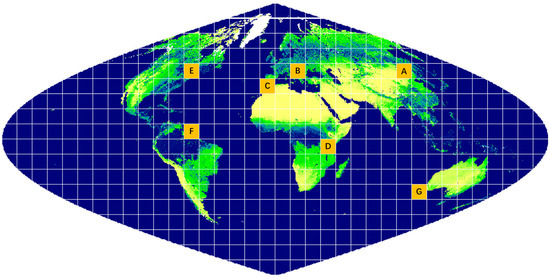
Figure 3.
Seven tiles selected as validation regions. A: h26v04, B: h19v04, C: h17v05, D: h21v09, E: h12v04, F: h12v08, G: h27v12.
To better establish the advantages and disadvantages of the DRCNN approach, the bicubic interpolation method and the ESPCN method are selected as the comparison methods. The bicubic interpolation method is traditional spatial interpolation. It obtains an interpolated image by calculating the weighted average of the nearest 16 sampling points in the image. The ESPCN method is a classic deep convolution neural network super-resolution method. It uses sub-pixel convolution to improve image resolution. The bicubic interpolation method and the ESPCN method were used to directly downscale 500 m spatial resolution surface reflectance data from MOD09A1 to obtain 250 m surface reflectance data for comparison with the DRCNN method in this paper.
Considering only the 250 m surface reflectance data in the red and NIR bands, two experiments were designed to evaluate the performance of the DRCNN in this paper.
2.2.1. Experiment 1: Downscaling 500 m Surface Reflectance in the Red Band to 250 m
Experiment 1 used the DRCNN to downscale the surface reflectance in the red band from the MOD09A1 product to 250 m and the surface reflectance in the red band from the MOD09Q1 product as reference data to evaluate the performance of the DRCNN. In the training process, the upsampled surface reflectance in the red band with a resolution of 1 km and the surface reflectance in the NIR band from the preprocessed MOD09A1 product with a resolution of 500 m were applied as the input of the DRCNN, and the surface reflectance in the red band from the preprocessed MOD09A1 product with a resolution of 500 m were applied as the output of the DRCNN. In the prediction process, the surface reflectance in the red band from the preprocessed MOD09A1 product with a resolution of 500 m and the surface reflectance in the NIR band from the preprocessed MOD09Q1 product with a resolution of 250 m were entered into the DRCNN to generate 250 m surface reflectance in the red band. Figure 4 shows the training and prediction processes of experiment 1.
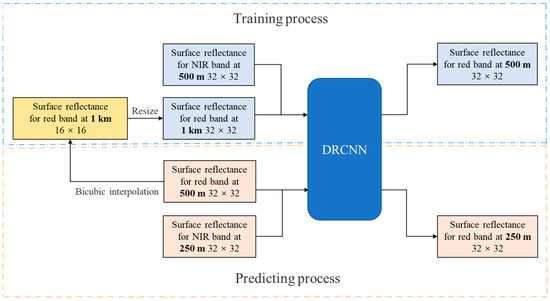
Figure 4.
Training and prediction processes of the DRCNN in experiment 1.
To evaluate the performance of the DRCNN, the downscaled surface reflectance in the red band at 250 m resolution from the DRCNN was compared with the surface reflectance in the red band from the preprocessed MOD09Q1 product, as well as with the surface reflectance in the red band downscaled by the bicubic interpolation method and by the ESPCN method. The time series curve can reflect the seasonal changes of vegetation. The vegetation index is a widely used monitoring measure that reflects the spectral characteristics of vegetation. Various vegetation index time series can also be applied to check whether the downscaled surface reflectance is reasonable. In experiment 1, time series of the normalized difference vegetation index (NDVI) was selected to evaluate the performance of the DRCNN. The formulas of NDVI are shown in Equation (2).
where R is the surface reflectance in the red band and NIR is the surface reflectance in the NIR band.
2.2.2. Experiment 2: Derive 250 m Surface Reflectance in the Blue, Green, SWIR1 and SWIR2 Bands Using the DRCNN
On the basis of the performance evaluation of the DRCNN in experiment 1, experiment 2 was carried out to derive 250 m surface reflectance in the blue, green, SWIR1 and SWIR2 bands from the MOD09A1 product using the DRCNN. Figure 5 shows the training and prediction process of experiment 2.
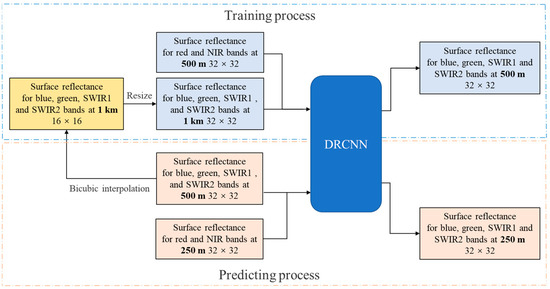
Figure 5.
Training and predicting processes of the DRCNN in experiment 2.
In the training process, the surface reflectance in the blue, green, SWIR1 and SWIR2 bands from the upsampled surface reflectance with a resolution of 1 km and the surface reflectance in the red and NIR bands from the preprocessed MOD09A1 product with a resolution of 500 m were employed as the input of the DRCNN, and the surface reflectance in the blue, green, SWIR1 and SWIR2 bands from the preprocessed MOD09A1 product were utilized as the output of the DRCNN. In the prediction process, the surface reflectance in the blue, green, SWIR1 and SWIR2 bands from the preprocessed MOD09A1 product with a resolution of 500 m and the surface reflectance in the red and NIR bands from the preprocessed MOD09Q1 product with a resolution of 250 m were entered into the DRCNN to generate 250 m surface reflectance in the blue, green, SWIR1 and SWIR2 bands.
In this study, the downscaled surface reflectance at 250 m resolution were compared with the surface reflectance of the MOD09A1 product and the downscaled surface reflectance by the bicubic interpolation method and the ESPCN method. For the time series analysis, we introduce the surface reflectance of Landsat 7 as reference data to evaluate the downscaled surface reflectance at 250 m resolution. The Landsat 7 has provided many years of global surface reflectance since its successful launch in 1999. The band specifications of Landsat 7 along with MODIS are shown in Table 1.

Table 1.
Band specifications for MODIS and Landsat 7.
Due to the different spectral response functions of the MODIS and Landsat 7 instruments, the surface reflectance needs to be converted when comparing the surface reflectance of the MODIS and Landsat 7 images. The canopy radiative transfer models can simulate the surface reflectance under different input conditions. In this article, the ProSAIL model [25] was used to generate a total of 120,960 surface reflectance samples with wavelengths ranging from 400 nm to 2500 nm. Then, the simulated surface reflectance was combined with the spectral response functions of MODIS and Landsat 7 to obtain the conversion relationships for different bands. The conversion relationships for the surface reflectance in the blue, green, red, NIR, SWIR1 and SWIR2 bands between MODIS and Landsat 7 are shown in Equation (3).
In addition, the enhanced vegetation index (EVI), mid-infrared burn index (MIRBI) and urban index (UI) were selected to check whether the downscaled surface reflectance from the DRCNN were reasonable. The formula for the EVI, MIRBI and UI are shown in Equations (4)–(6).
where R is the surface reflectance in the red band, NIR is the surface reflectance in the NIR band, B is the surface reflectance in the blue band and SWIR1 and SWIR2 represent the surface reflectance in the SWIR1 and SWIR2 bands, respectively.
3. Results
The DRCNN was applied to downscale the surface reflectance of MOD09A1 and generate surface reflectance with a spatial resolution of 250 m. The following sections present comparisons and analysis of the results of the two experiments.
3.1. Result of Experiment 1
In this section, the downscaled surface reflectance in the red band from the DRCNN was compared with the surface reflectance in the red band from the MOD09Q1 product, the surface reflectance in the red band from the preprocessed MOD09Q1 product, and the surface reflectance in the red band downscaled by the bicubic interpolation method and the ESPCN method, respectively Figure 6 shows the spatial distribution of the surface reflectance on days 65 and 193 in 2015 at tiles h26v04 and h19v04. The results demonstrate that the downscaled surface reflectance from the DRCNN maintain good consistency with the surface reflectance in the red band from the preprocessed MOD09Q1 product. Compared with the downscaled surface reflectance by the bicubic interpolation method and the ESPCN method, the spatial details of the surface reflectance obtained from the DRCNN were more obvious, and there were no significant patch effects in the surface reflectance obtained from the DRCNN.
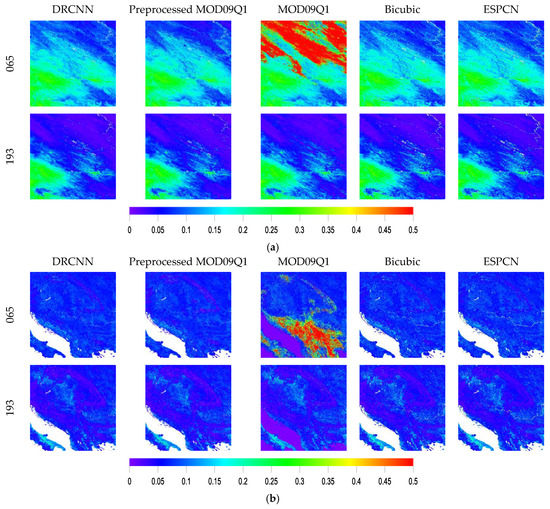
Figure 6.
Comparisons of the downscaled surface reflectance from the DRCNN with the surface reflectance in the red band from the MOD09Q1 product, the surface reflectance in the red band from the preprocessed MOD09Q1 product, and the surface reflectance in the red band downscaled by the bicubic interpolation method and the ESPCN method on days 65 and 193 in 2015 at (a) h26v04 and (b) h19v04.
Figure 7 shows the RGB images for the downscaled surface reflectance from the DRCNN, the surface reflectance from the MOD09Q1 product and the surface reflectance from the preprocessed MOD09Q1 product on day 265 in 2015 at tiles h26v04 and h19v04. The corresponding RGB images of the downscaled surface reflectance by the bicubic interpolation method and the ESPCN method are also shown in Figure 7. These images were produced with an RGB color scheme that employs the NIR band (as red color), red band (as green color) and red band (as blue color). The RGB images of the downscaled surface reflectance from the DRCNN, the bicubic interpolation method and the ESPCN method were shown in Figure 7a–c. These images were synthesized by the surface reflectance in the NIR band from the preprocessed MOD09Q1 product (as red color), the downscaled surface reflectance in the red band (as green color) and the downscaled surface reflectance in the red band (as blue color). Figure 7a indicates that the downscaled surface reflectance from the DRCNN is cloud-free, whereas there are obvious clouds in the upper right part of the RGB image of the surface reflectance from the MOD09Q1 product (Figure 7e). The RGB image of the surface reflectance from the preprocessed MOD09Q1 product (Figure 7d) shows that almost all contamination due to clouds was removed. It is obvious that the RGB image of the downscaled surface reflectance from the DRCNN has the same spatial distribution as the RGB image of the surface reflectance from the MOD09Q1 product, which demonstrates that the DRCNN developed in this paper can take advantage of the details provided by the input data to effectively downscale the surface reflectance of the MOD09A1 product. Figure 7f–j shows the RGB images of the surface reflectance on day 265 in 2015 at tile h19v04. Compared with h26v04, the land cover at h19v04 is covered with a large amount of water and mountainous areas, but this difference does not affect the performance of the DRCNN. The RGB image of the downscaled surface reflectance from the DRCNN also shows the same spatial distribution as the RGB image of the surface reflectance from the MOD09Q1 product.
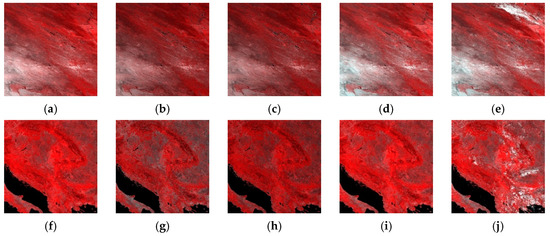
Figure 7.
RGB images of the downscaled surface reflectance by (a) the DRCNN, (b) the bicubic interpolation method, (c) the ESPCN method, (d) the surface reflectance from the preprocessed MOD09Q1 product and (e) the surface reflectance from the MOD09Q1 product on day 265, 2015 at h26v04; (f–j) are the corresponding RGB images at h19v04. The RGB images were produced with an RGB color scheme that employs the NIR band (as red color), red band (as green color) and red band (as blue color).
Scatterplot between the downscaled surface reflectance in the red band from the DRCNN and the surface reflectance in the red band from the preprocessed MOD09Q1 product over the OLIVE sites in 2015 is shown in Figure 8a. The results show that the downscaled surface reflectance in the red band from the DRCNN is in good agreement with the surface reflectance in the red band from the preprocessed MOD09Q1 product. The equation of the regression line is , where represents the surface reflectance in the red band from the preprocessed MOD09Q1 product, represents the downscaled surface reflectance in the red band from the DRCNN, and the RMSE = 0.00877, = 0.9938. The accuracies of the downscaled surface reflectance from the bicubic interpolation method (Figure 8b) and the ESPCN method (Figure 8c) were lower than that of the downscaled surface reflectance from the DRCNN.
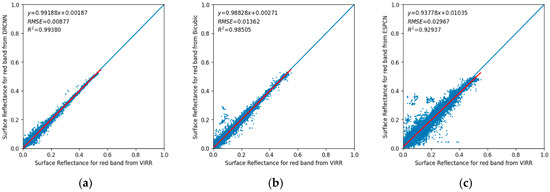
Figure 8.
Scatterplots of the downscaled surface reflectance in the red band by (a) the DRCNN, (b) the bicubic interpolation method and (c) the ESPCN method versus the surface reflectance in the red band from the preprocessed MOD09Q1 product over the OLIVE sites in 2015.
Figure 9 shows time series of the downscaled surface reflectance in the red band from the DRCNN, the bicubic interpolation method and the ESPCN method, and the surface reflectance in the red band from the preprocessed MOD09Q1 product in 2015, as well as the corresponding time series of NDVI at the Zhangbei, Collelongo, Barrax and Maragua sites. In Figure 9, the blue line represents the surface reflectance in the red band from the preprocessed MOD09Q1 product, and the red line represents the downscaled surface reflectance in the red band from the DRCNN. Excellent agreement was achieved between the time series of the downscaled surface reflectance in the red band from the DRCNN and the time series of the surface reflectance in the red band from the preprocessed MOD09Q1 product for the entire year at these sites, and the corresponding time series of NDVI were in good agreement, which further illustrates the good performance of the DRCNN to downscale the surface reflectance of the MOD09A1 product. However, the surface reflectance downscaled by the ESPCN method is not stable. For example, the time series of the surface reflectance downscaled by the ESPCN method at the Maragua site also showed significant fluctuations.
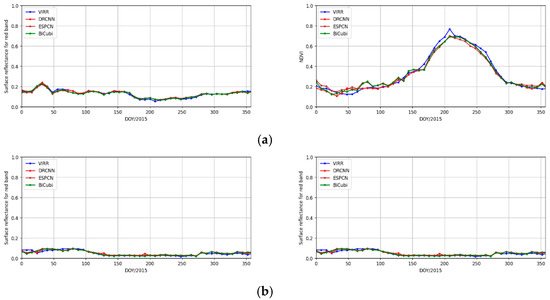
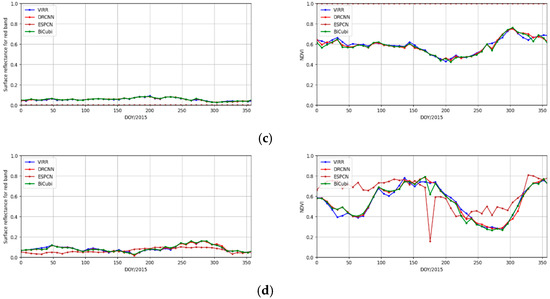
Figure 9.
Time series of the downscaled surface reflectance from the DRCNN, the bicubic interpolation method and the ESPCN method, the surface reflectance in the red band from the preprocessed MOD09Q1 product in 2015, and the corresponding time series of NDVI at (a) the Zhangbei site, (b) the Collelongo site, (c) the Barrax site and (d) the Maragua site. The left panel is the time series of surface reflectance in the red band and the right panel is the corresponding time series of NDVI.
3.2. Result of Experiment 2
In experiment 2, the surface reflectance in the blue, green, SWIR1 and SWIR2 bands from the MOD09A1 product were downscaled to derive surface reflectance in the corresponding bands at 250 m resolution using the DRCNN. Figure 10 shows the downscaled surface reflectance in the blue, green, SWIR1 and SWIR2 bands from the DRCNN on day 265 in 2015 at tiles h26v04 and h19v04. Since there is no 250 m surface reflectance in the corresponding bands, the downscaled surface reflectance in the blue, green, SWIR1 and SWIR2 bands from the DRCNN were compared with the surface reflectance in the corresponding bands from the MOD09A1 product, the preprocessed MOD09A1 product and the surface reflectance in the corresponding bands downscaled by the bicubic interpolation method and the ESPCN method. The results also demonstrate that the downscaled surface reflectance in the blue, green, SWIR1 and SWIR2 bands from the DRCNN show good consistency with the surface reflectance in the corresponding bands from the MOD09A1 product and the preprocessed MOD09A1 product. Moreover, the downscaled surface reflectance in the blue, green, SWIR1 and SWIR2 bands from the DRCNN were all cloud-free.
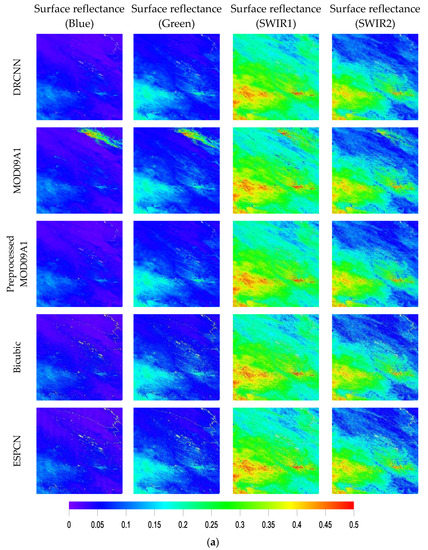
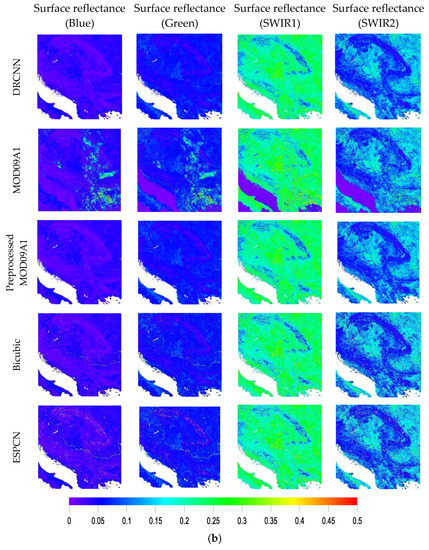
Figure 10.
Comparisons of the downscaled surface reflectance in the blue, green, SWIR1 and SWIR2 bands from the DRCNN with the surface reflectance in the corresponding bands from the MOD09A1 product and the preprocessed MOD09A1 product and the surface reflectance in the corresponding bands downscaled by the bicubic interpolation method and the ESPCN method on day 265 in 2015 at (a) h26v04 and (b) h19v04.
Time series of the downscaled surface reflectance from the DRCNN and the surface reflectance from Landsat 7 in the blue, green, SWIR1 and SWIR2 bands in 2002 at the Zhangbei, Collelongo, Barrax, Counami, Larose and Camerons sites are shown in Figure 11. In these figures, the blue dot represents the surface reflectance from Landsat 7 after projection conversion and quality control, and the red dot represents the downscaled surface reflectance from the DRCNN. The downscaled surface reflectance from the DRCNN achieved excellent agreement with the surface reflectance from Landsat 7, especially in the blue and green bands for the entire year at these sites.
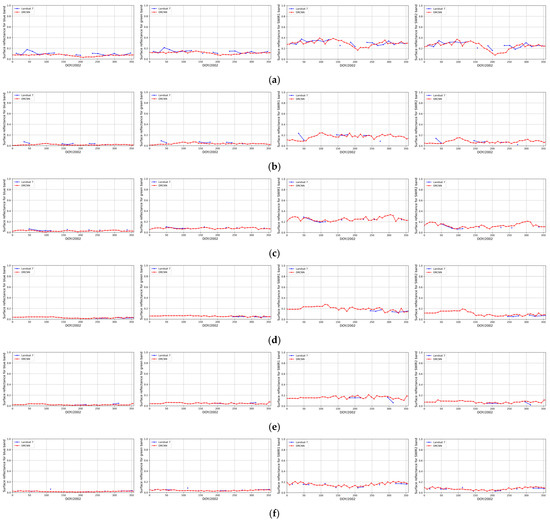
Figure 11.
Time series of the downscaled surface reflectance from the DRCNN and the surface reflectance from Landsat 7 in the blue, green, SWIR1 and SWIR2 bands in 2002 at (a) the Zhangbei site, (b) the Collelongo site, (c) the Barrax site, (d) the Counami site, (e) the Larose site and (f) the Camerons site.
Figure 12 show the time series of EVI, MIRBI and UI calculated from the downscaled surface reflectance from the DRCNN and the surface reflectance from Landsat 7 in 2002 at the Zhangbei, Collelongo, Barrax, Counami, Larose and Camerons sites. The blue lines in Figure 12 are the time series of the EVI, MIRBI and UI calculated from Landsat 7 surface reflectance, and the red lines are the time series of the EVI, MIRBI and UI calculated from the downscaled surface reflectance from the DRCNN. It is observed that the time series of EVI, MIRBI and UI calculated from the downscaled surface reflectance from the DRCNN agree well with the time series of EVI, MIRBI and UI calculated from Landsat 7 surface reflectance at these sites, which demonstrates that the downscaled surface reflectance from the DRCNN are reasonable at these sites.
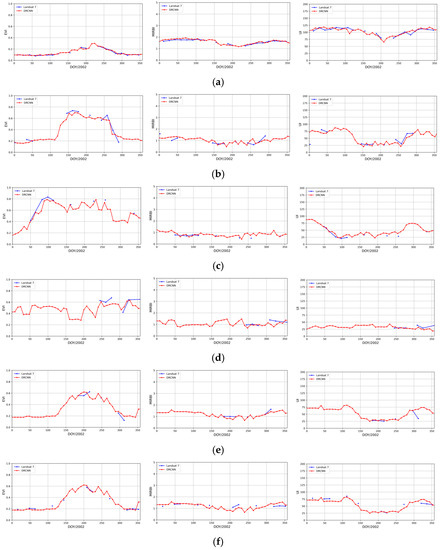
Figure 12.
Time series of EVI, MIRBI and UI calculated from the downscaled surface reflectance from the DRCNN and the surface reflectance from Landsat 7 at the (a) Zhangbei, (b) Collelongo, (c) Barrax, (d) Counami, (e) Larose and (f) Camerons sites in 2002.
4. Discussion
The DRCNN is a downscaling method based on the convolutional neural network. In contrast to addressing computer vision problems, applying deep learning to more complex remote sensing images requires targeted improvements in algorithms to fully utilize the powerful information mining capabilities of deep learning [26]. There are several important aspects that determine the performance of a neural network: the dataset, hyper-parameters and loss functions. For the regression problem in this paper, there are theoretically more options for the settings of these aspects. Especially for the loss function, the RMSE alone may be not enough and some special designs or even a combination with the radiative transfer model are required.
The DRCNN proposed in this paper is based on the idea of deep learning in solving the super-resolution problem. The DRCNN can combine surface reflectance at coarse and fine resolutions to improve the spatial resolution of the surface reflectance for certain bands. The assumption that the downscaling of surface reflectance from 1 km to 500 m is the same as that from 500 m to 250 m is common in the application of super-resolution, and many studies adopt this same assumption. This is a common assumption in the field of image super-resolution, since super-resolution problem is more concerned with how much magnification can be changed to the input image rather than the specific resolution [27]. The results demonstrate that the DRCNN achieved good performance when downscaling the surface reflectance of the MOD09A1 product in this study. Nevertheless, more studies are needed to justify the assumption, especially when applying the DRCNN to download the surface reflectance of the MOD09Q1 product to generate the surface reflectance with higher spatial resolutions.
Since there is no 250 m surface reflectance in the blue, green, SWIR1 and SWIR2 bands as validation data, this paper selected Landsat 7 surface reflectance with 30 m spatial resolution to evaluate the downscaled surface reflectance from the DRCNN. In fact, a lot of studies use the Landsat surface reflectance as reference data to compare and verify the MODIS surface reflectance [28]. This paper solves the difference caused by the spectral response function. However, aggregating surface reflectance from 30 m to 250 m may also introduce uncertainties, which has an impact on the performance evaluation of the DRCNN.
The DRCNN proposed in this paper was used to downscale surface reflectance of the MOD09A1 product. In fact, the DRCNN is a universal method. It can be applied to downscale any coarse resolution data by combining with fine resolution spatial information. The DRCNN is feasible for use in downscaling the TOA reflectance. Furthermore, the DRCNN proposed in this paper can also be applied to downscale advanced remote sensing parameter products, such as LAI and FAPAR.
5. Conclusions
This paper developed the DRCNN to downscale the surface reflectance of the MOD09A1 product. The DRCNN uses deep learning technology to establish a fully convolutional deep learning algorithm. It was applied to generate the surface reflectance with a resolution of 250 m in the blue, green, SWIR1 and SWIR2 bands. By using the surface reflectance in the red and NIR bands from the MOD09Q1 product at 250 m resolution to evaluate the performance of the DRCNN, the results show that the DRCNN can effectively downscale the surface reflectance from the MOD09A1 product to generate the surface reflectance at 250 m resolution. The downscaled surface reflectance from the DRCNN in the blue, green, SWIR1 and SWIR2 bands were compared with the Landsat 7 surface reflectance in the corresponding bands. The results showed that the DRCNN proposed in this paper is effective. Temporal and spatial comparisons show that the proposed DRCNN can effectively improve the spatial resolution of the MOD09A1 product.
In this study, the DRCNN only used the mono-temporal surface reflectance from the MOD09A1 product when generating the surface reflectance data at 250 m resolution. Notably, the surface reflectance of adjacent dates were also relevant. In the near future, we will extend this method and add the surface reflectance of adjacent dates to the model construction to further improve the accuracy of the downscaled surface reflectance from the DRCNN.
Author Contributions
Conceptualization, Y.Z. and Z.X.; methodology, Y.Z. and Z.X.; validation, Y.Z.; writing—original draft preparation, Y.Z.; writing—review and editing, Z.X. and Y.Z. All authors have read and agreed to the published version of the manuscript.
Funding
This research was funded by the National Natural Science Foundation of China under Grant 42192581.
Conflicts of Interest
The authors declare no conflict of interest.
References
- Liang, S.; Zhao, X.; Liu, S.; Yuan, W.; Cheng, X.; Xiao, Z.; Zhang, X.; Liu, Q.; Cheng, J.; Tang, H.; et al. A long-term Global LAnd Surface Satellite (GLASS) data-set for environmental studies. Int. J. Digit. Earth 2013, 61, 5–33. [Google Scholar] [CrossRef]
- Vermote, E.F.; El Saleous, N.Z.; Justice, C.O. Atmospheric correction of MODIS data in the visible to middle infrared: First results. Remote Sens. Environ. 2002, 83, 97–111. [Google Scholar] [CrossRef]
- Justice, C.O.; Townshend, J.; Vermote, E.F.; Masuoka, E.; Wolfe, R.E.; Saleous, N.; Roy, D.P.; Morisette, J.T. An overview of MODIS Land data processing and product status. Remote Sens. Environ. 2002, 83, 3–15. [Google Scholar] [CrossRef]
- Xiao, Z.; Song, J.; Yang, H.; Sun, R.; Li, J. A 250 m resolution global leaf area index product derived from MODIS surface reflectance data. Int. J. Remote Sens. 2022, 43, 1409–1429. [Google Scholar] [CrossRef]
- Townshend, J.R.G.; Justice, C.O. Selecting the spatial resolution of satellite sensors required for global monitoring of land transformations. Int. J. Remote Sens. 1988, 9, 187–236. [Google Scholar] [CrossRef]
- Zhan, X.; Sohlberg, R.A.; Townshend, J.R.G.; DiMiceli, C.; Carroll, M.L.; Eastman, J.C.; Hansen, M.C.; DeFries, R.S. Detection of land cover changes using MODIS 250 m data. Remote Sens. Environ. 2002, 83, 336–350. [Google Scholar] [CrossRef]
- Trishchenko, A.P.; Luo, Y.; Khlopenkov, K.V. A Method for Downscaling MODIS Land Channels to 250-M Spatial Resolution Using Adaptive Regression and Normalization; SPIE: Bellingham, WA, USA, 2006; Volume 6366, pp. 636607–636608. [Google Scholar]
- Luo, Y.; Trishchenko, A.; Khlopenkov, K. Developing clear-sky, cloud and cloud shadow mask for producing clear-sky composites at 250-meter spatial resolution for the seven MODIS land bands over Canada and North America. Remote Sens. Environ. 2008, 112, 4167–4185. [Google Scholar] [CrossRef]
- Che, X.; Feng, M.; Jiang, H.; Song, J.; Jia, B. Downscaling MODIS Surface Reflectance to Improve Water Body Extraction. Adv. Meteorol. 2015, 2015, 424291. [Google Scholar] [CrossRef]
- Wang, Q.; Shi, W.; Atkinson, P.M.; Zhao, Y. Downscaling MODIS images with area-to-point regression kriging. Remote Sens. Environ. 2015, 166, 191–204. [Google Scholar] [CrossRef]
- Che, X.; Yang, Y.; Feng, M.; Xiao, T.; Huang, S.; Xiang, Y.; Chen, Z. Mapping Extent Dynamics of Small Lakes Using Downscaling MODIS Surface Reflectance. Remote Sens. 2017, 9, 82. [Google Scholar] [CrossRef]
- Hutengs, C.; Vohland, M. Downscaling land surface temperatures at regional scales with random forest regression. Remote Sens. Environ. 2016, 178, 127–141. [Google Scholar] [CrossRef]
- Ma, L.; Liu, Y.; Zhang, X.; Ye, Y.; Yin, G.; Johnson, B.A. Deep learning in remote sensing applications: A meta-analysis and review. ISPRS J. Photogramm. Remote Sens. 2019, 152, 166–177. [Google Scholar] [CrossRef]
- Bo, H.; Bei, Z.; Song, Y. Urban land-use mapping using a deep convolutional neural network with high spatial resolution multispectral remote sensing imagery. Remote Sens. Environ. 2018, 214, 73–86. [Google Scholar]
- Han, J.; Zhang, D.; Cheng, G.; Guo, L.; Ren, J. Object Detection in Optical Remote Sensing Images Based on Weakly Supervised Learning and High-Level Feature Learning. IEEE Trans. Geosci. Remote Sens. 2015, 53, 3325–3337. [Google Scholar] [CrossRef]
- Zhong, L.; Hu, L.; Zhou, H. Deep learning based multi-temporal crop classification. Remote Sens. Environ. 2019, 221, 430–443. [Google Scholar] [CrossRef]
- Li, L.; Franklin, M.; Girguis, M.; Lurmann, F.; Wu, J.; Pavlovic, N.; Breton, C.; Gilliland, F.; Habre, R. Spatiotemporal imputation of MAIAC AOD using deep learning with downscaling. Remote Sens. Environ. 2020, 237, 111584. [Google Scholar] [CrossRef] [PubMed]
- Mukherjee, R.; Liu, D. Downscaling MODIS spectral bands using deep learning. GIScience Remote Sens. 2021; ahead-of-print. [Google Scholar]
- Dong, C.; Loy, C.C.; He, K.; Tang, X. Image Super-Resolution Using Deep Convolutional Networks. IEEE Trans. Pattern Anal. Mach. Intell. 2016, 38, 295–307. [Google Scholar] [CrossRef] [PubMed]
- Shi, W.; Caballero, J.; Huszar, F.; Totz, J.; Aitken, A.P.; Bishop, R.; Rueckert, D.; Wang, Z. Real-Time Single Image and Video Super-Resolution Using an Efficient Sub-Pixel Convolutional Neural Network. In Proceedings of the 2016 IEEE Conference on Computer Vision and Pattern Recognition (Cvpr), Las Vegas, NV, USA, 26 June–1 July 2016; pp. 1874–1883. [Google Scholar]
- Lanaras, C.; Bioucas-Dias, J.; Galliani, S.; Baltsavias, E.; Schindler, K. Super-resolution of Sentinel-2 images: Learning a globally applicable deep neural network. ISPRS J. Photogramm. Remote Sens. 2018, 146, 305–319. [Google Scholar] [CrossRef]
- Shao, Z.; Cai, J.; Fu, P.; Hu, L.; Liu, T. Deep learning-based fusion of Landsat-8 and Sentinel-2 images for a harmonized surface reflectance product. Remote Sens. Environ. 2019, 235, 111425. [Google Scholar] [CrossRef]
- Xiao, Z.; Liang, S.; Wang, T.; Liu, Q. Reconstruction of Satellite-Retrieved Land-Surface Reflectance Based on Temporally-Continuous Vegetation Indices. Remote Sens. 2015, 7, 9844–9864. [Google Scholar] [CrossRef]
- Weiss, M.; Baret, F.; Block, T.; Koetz, B.; Burini, A.; Scholze, B.; Lecharpentier, P.; Brockmann, C.; Fernandes, R.; Plummer, S.; et al. On Line Validation Exercise (OLIVE): A Web Based Service for the Validation of Medium Resolution Land Products. Application to FAPAR Products. Remote Sens. 2014, 6, 4190–41216. [Google Scholar] [CrossRef]
- Jacquemoud, S.; Verhoef, W.; Baret, F.; Bacour, C.; Zarco-Tejada, P.J.; Asner, G.P.; Francois, C.; Ustin, S.L. PROSPECT plus SAIL models: A review of use for vegetation characterization. Remote Sens. Environ. 2009, 1131, S56–S66. [Google Scholar] [CrossRef]
- Yuan, Q.; Shen, H.; Li, T.; Li, Z.; Li, S.; Jiang, Y.; Xu, H.; Tan, W.; Yang, Q.; Wang, J.; et al. Deep learning in environmental remote sensing: Achievements and challenges. Remote Sens. Environ. 2020, 241, 111716. [Google Scholar] [CrossRef]
- Muller, M.U.; Ekhtiari, N.; Almeida, R.M.; Rieke, C. Super-Resolution of Multispectral Satellite Images Using Convolutional Neural Networks. ISPRS Ann. Photogramm. Remote Sens. Spat. Inf. Sci. 2020, V-1-2020, 33–40. [Google Scholar] [CrossRef]
- Thome, K.; Whittington, E.; Smith, N. Radiometric calibration of MODIS with reference to Landsat-7 ETM+. Earth Obs. Syst. Vi 2002, 4483, 203–210. [Google Scholar]
Disclaimer/Publisher’s Note: The statements, opinions and data contained in all publications are solely those of the individual author(s) and contributor(s) and not of MDPI and/or the editor(s). MDPI and/or the editor(s) disclaim responsibility for any injury to people or property resulting from any ideas, methods, instructions or products referred to in the content. |
© 2023 by the authors. Licensee MDPI, Basel, Switzerland. This article is an open access article distributed under the terms and conditions of the Creative Commons Attribution (CC BY) license (https://creativecommons.org/licenses/by/4.0/).