Abstract
Most cross-view image matching algorithms focus on designing network structures with excellent performance, ignoring the content information of the image. At the same time, there are non-fixed targets such as cars, ships, and pedestrians in ground perspective images and aerial perspective images. Differences in perspective, direction, and scale cause serious interference with the cross-view matching process. This paper proposes a cross-view image matching method with feature enhancement, which first transforms the empty image to generate a transformation image aligned with the ground–aerial image domain to establish a preliminary geometric correspondence between the ground-space image. Then, the rich feature information of the deep network and the edge information of the cross-convolution layer are used to establish the feature correspondence between the ground-space images. The feature fusion module enhances the tolerance of the network model to scale differences, improving the interference problem of transient non-fixed targets on the matching performance in the images. Finally, the maximum pooling and feature aggregation strategies are adopted to aggregate local features with obvious distinguishability into global features to complete the accurate matching between ground images. The experimental results show that the proposed method has good advance and high accuracy on CVUSA, which is commonly used in public datasets, reaching 92.23%, 98.47%, and 99.74% on the top 1, top 5 and top 10 indicators, respectively, outperforming the original method in the dataset with a limited field of view and image center, better completing the cross-perspective image matching task.
1. Introduction
The cross-view geo-localization technology is gradually receiving wide attention due to its broad application value, such as target positioning under Global Navigation Satellite System (GNSS) rejection conditions, target tracking based on open-source information, and the construction of multi-level and full-space monitoring systems of remote sensing images. The cross-view image matching is the problem of using ground images with unknown locations to match aerial images with location information, obtaining specific location information of ground images by matching. This is in contrast to the traditional method of geolocation by image matching. Traditional matching methods rely on a database with geotags for ground-to-ground matching. However, human activities lead to a heterogeneous composition of the geodatabase, so the traditional matching method only applies to landmark architectural or famous scenic areas [1,2]. With the development of aerospace technology, aerial images have provided intensive global coverage, so cross-view image matching has a wide range of applicability. However, efficient cross-view matching still needs to be solved due to the differences in view, scale, and timing between ground and aerial images.
In this study, we investigate the problem of cross-view matching between ground and aerial images under the interference of redundant features. Specifically, it is an intrinsically difficult task due to the imaging patterns and huge viewpoint differences between aerial images and ground images. With the introduction of deep learning techniques, some methods have demonstrated feasibility in this area. Most of the current algorithms treat this problem as an image retrieval task, taking the ground image as the image to be queried and all aerial images as the database and then comparing the image to be queried with the database image to retrieve the image that is most similar to the image to be queried, using the location information that comes with the aerial image as the location result. Although this method solves the problem of the inability to match aerial images caused by the large image size and the large coverage, the huge difference in viewpoint causes drastic changes in the appearance of the object, and matching the two images accurately is still a problem that needs to be addressed. The redundant information in ground images and aerial images makes it more difficult to match, making the cross-view positioning of the ground and aerial images more challenging.
To address the above problems, a two-stage cross-view matching method using polar coordinate transformation and feature enhancement is proposed in this study. First, the aerial image is polar-transformed to obtain a transformed image aligned with the ground image domain, and then the transformed image and the ground image are input to Siamese Network for matching. In the first phase of our method, we borrowed from DSM and SAFA to establish the alignment of the geometric spatial domain of the ground image and the aerial image and the polar coordinate transformation of the aerial image to approximate the alignment with the panoramic ground image can simplify the complex task. In brief, the first stage of our method transforms all aerial images in the database to polar coordinates and performs the image retrieval task instead of the original database. The second stage of our method aims to establish the feature correspondence between images in the new database and ground images to complete the final retrieval task. Establishing feature correspondence between ground–aerial is much more complicated than aligning geometric domains by polar coordinate transformation. Because of the unavoidable differences in scale, viewpoint, and time between ground images and aerial images, matching the two images is not easy to achieve, even for researchers with specialized knowledge. To address the influence of these factors on the matching process, we developed a cross-convolution and depth feature fusion module. In detail, we extract the line features in the image by cross-convolution and add cross-attention to make the feature weights mainly focus on the ground part and then make better use of the multi-scale information of the image by the feature fusion module. In this way, our method can not only exclude the influence of the sky part of the ground image but also make the extracted features have better scale robustness.
The main contributions of this study are as follows:
- (1)
- A combination of cross-attention and cross-convolution is designed for images with complex backgrounds and redundant information in remote sensing images for cross-view geo-localization, which can effectively filter useless features such as cars and clouds in images by image edge information.
- (2)
- A deep network and feature fusion module are introduced, which can effectively enhance the model’s ability to utilize multi-scale information and improve the scale robustness of the extracted features. It is demonstrated that depth fusion features can play an important role in cross-viewpoint image matching.
- (3)
- A model that can effectively improve the accuracy of cross-view matching is proposed.
2. Related Work
In recent years, many researchers have actively explored cross-view geo-localization techniques. However, classical matching algorithms often fail to perform this task. With the introduction of deep learning, existing matching methods can be broadly classified into feature-based learning and perspective transformation-based methods. The feature-based learning methods focus on building a high-performing network structure to directly learn the feature correspondence between ground images and aerial images, which can obtain accurate matching results. For example, Where-CNN [3] uses a Siamese Network to convert the cross-view matching problem into an image retrieval problem. It uses two network branches to process ground-view and air-view images separately for matching purposes. DBL [4] proposed a loss function and small batch strategy using triplet and twin networks for better direct matching of ground–aerial images, making the triplet loss function the primary method for cross-view matching. CVM-net [5] used a combined structure of Siamese networks and NetVLAD [6] to solve the cross-view matching problem and used a weighted soft marginal ranking loss function to accelerate model convergence and improve the accuracy of the model. CVFT [7] developed a cross-view feature transfer module to reduce the domain gap between ground and aerial images based on the information about the spatial layout of features that can play an essential role in cross-view matching. LPN [8], a self-learning model that can extract features from airspace and territory, paid attention to the information of image neighborhoods and used a square-loop partitioning strategy to divide the features, which better accomplished cross-view matching. Liu [9] and Zhu [10,11] argue that orientation information can play an essential role in cross-view geo-localization and propose a twin neural network that can simultaneously learn image representation and orientation information. Although these methods solve the complex problem of matching ground and aerial images by directly learning viewpoint invariant features and orientation invariant features, the scale and spatial domain differences between ground and aerial images limit their matching performance.
The viewpoint conversion-based method converts aerial and ground images into one another to eliminate the complex matching problem caused by the considerable viewpoint difference between ground and aerial images. DSM [12] proposed a polar coordinate transformed viewpoint conversion method for networks that are difficult to learn geometric relationships and feature correspondence simultaneously. The method aligns the aerial with the ground image in the spatial domain by polar coordinate transformation, and then the image orientation information is calculated by circular convolution. SAFA [13] also used the idea of polar coordinate transformation and added a spatial attention mechanism to overcome the image deformation problem caused by polar coordinate transformation. CDtE [14] used Generative Adversarial Networks to transform aerial into ground images and accomplished the image synthesis and matching tasks at the same time. The literature [15,16] uses the results of semantic segmentation as auxiliary information to accomplish better the distortion transformation of aerial images to ground images. However, how to design a network model with excellent performance is the focus of most current methods, and the content information of the image itself is ignored: (1) there are often non-fixed targets, such as cars and pedestrians, which interfere with the matching process between ground and aerial images. (2) There are inevitably large-scale differences between ground and aerial images, so keeping the scale invariance of features must be considered in cross-view geo-localization. In this study, new modules are proposed that can effectively solve the above problems.
3. Methods
To explore the geometric configuration of the image scene and significantly reduce the ambiguity of cross-view image matching, the model first performs a polar coordinate transformation on the aerial to establish the spatial correspondence between the ground image and aerial image. Then, the model constructs the Siamese Network and adds the cross-convolution module and feature fusion strategy based on the residual network [17] to discard the useless features while obtaining the fused features with spatial and semantic information. After that, the feature map is input to the improved VGG-style [18] convolution block to reduce its height. This structure makes the features more tolerant of image vertical distortion deformation; then, the maximum pooling and feature aggregation strategies are used to aggregate the local features into global features, and the weighted soft marginal triple loss function is used for training. Finally, the L2 distance is used as the similarity measure to complete the matching between the ground–aerial images and obtain the high-precision cross-view matching results. The model structure is shown in Figure 1.

Figure 1.
Overall architecture of the model.
3.1. Polar Coordinate Transformation and Cross-Attention
It is difficult for current deep-learning networks to learn geometric relations and feature correspondences. If the transformation of spatial relationships can be implemented in advance, the network can face relatively simple matching tasks, thus significantly improving the accuracy of matching results. Shi et al. [13] proposed that the pixels located on the same azimuth in the aerial image approximately correspond to the vertical image columns in the ground image, so the spatial correspondence between the aerial image and the ground image can be established by polar coordinate transformation to avoid the adverse effects of geometric gaps on the model.
The overall transformation process can be described in this way. Firstly, considering that the north direction of the aerial image is usually known, the center point of the aerial image can be used as the origin of polar coordinates, and the north direction can be used as the initial direction to establish the polar coordinate system. Then, the height of the aerial image and the angle of each column of the polar-transformed image are aligned with the ground image. Finally, the innermost and outermost circles of the aerial image are mapped to the bottom and top of the transformed image, respectively, using the uniform sampling strategy to complete the spatial correspondence between the aerial image and the ground image. Specifically, we need to polar transform all aerial images and build a new image database as an intermediate transition between ground and aerial images, allowing us to establish the correspondence between ground and aerial images more easily. It is worth noting that the size of the aerial images and ground images should be taken into account during the polar transformation process.
The transformation relationship of corresponding points before and after aerial image transformation is shown in (1) and (2).
where denotes the edge length of the aerial image, and denote the height and width of the image after polar transformation, and denote the coordinates of the original aerial image points, and and denote the coordinates of the image points after polar transformation.
The similar geometric position relationship between the aerial and ground images after polar transformation (shown in Figure 2) allows the model to focus on learning the feature correspondence between images without focusing too much on the geometric relationship, making the network simpler to fit. However, some deformations inevitably cannot be eliminated by explicit methods after polar coordinates transform the ground–aerial images, so this paper introduces cross-attention [19] to strengthen the feature correlation between the ground and aerial images.
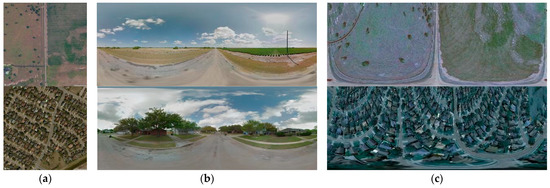
Figure 2.
The example of ground–aerial and polar images. (a)Aerial image; (b) Ground image; (c) Polar image.
Cross-attention is a method that borrows from the human matching process. When humans match two images, they compare back and forth between the two images to find associations between them. The image features are weighted using contextual information to find distinct distinguishable features. The process of cross-attention is similar to database retrieval, where the value of some element is retrieved by the query based on the attribute key of an element, and its weight is the normalization process of the similarity between the query and the retrieved object key value. The process is shown in (3)–(5).
where W is a fixed value, b is a bias term, and x denotes the feature point.
3.2. Image Cross-Feature Enhancement and Multi-Scale Information Fusion
By analyzing the image data, we found much useless or interfering information in ground and aerial images, such as the sky, clouds, cars, and pedestrians. Such targets are usually not present in aerial images, but in ground images, such information occupies a certain proportion of the whole image (shown in Figure 3). Aerial images usually contain a greater extent than ground images, and there is redundant information at the spatial extent level. If the images are directly fed into the network, these factors will inevitably affect the network performance and reduce the matching accuracy. In this paper, we propose an improved feature extraction strategy by selecting Resnet50 as the backbone network, adding a cross-feature enhancement module, and retaining the way DSM modifies the last three layers of VGG. In addition, introduce a feature fusion strategy to fuse the features extracted from the cross-convolution layer with the features extracted from block 2, block 3, and block 4 in Resnet50 and then input the fused features into the modified three convolution layers to output the final features. Specifically, we use ResNet50 as the base feature extractor to obtain shallow features after initial convolution while extracting edge information from the image content through the cross-convolution module. The result of feature visualization is shown in Figure 4. We know that the pixel values range from 0 to 255, where 0 corresponds to black and 255 corresponds to white; when the input image undergoes affine transformation, the white-biased pixels are more active in that part of the image, implying that the dark blocks have lower weights than the bright blocks. As shown in Figure 4b,c, the sky part occupies a considerable portion of the weights after the base convolution, while the cross-convolution extracts the edge features in the image content more accurately. After that, the redistribution of weight values is completed by the cross-attention mechanism, as described in Section 3.1. Unlike the elements queried by cross-attention in Section 3.1, the cross-attention in this section is queried based on the weight values between the two features. A low weight is assigned when the difference between the pixel values of the two features is large, and a high weight is assigned when the difference is small so as to achieve the purpose of reassigning weights to the features. In this way, the weight value of the ground part is much larger than the weight value of the sky part, thus eliminating the influence of the excess information in the sky on the matching process, and the resulting features are shown in Figure 4d.

Figure 3.
Example of Useless features in images.
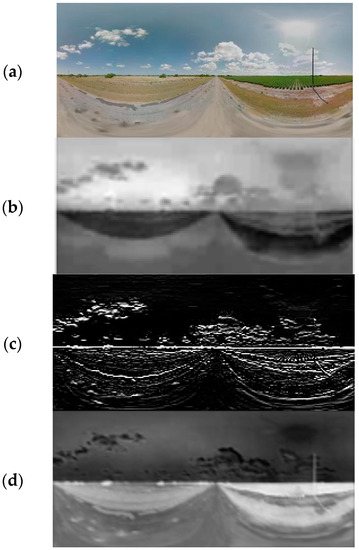
Figure 4.
Feature visualization schematic. (a) Original image; (b) Basic convolutional extraction of features; (c) Cross-convolutional extraction of features; (d) Final features.
The edge enhancement module is introduced in this paper to eliminate the interference of superfluous features such as sky clouds and cars in the ground image and enhance the feature availability. The module mainly includes cross-convolution, feature normalization, nonlinear activation function, channel attention, cross-attention, and others. The edge enhancement module can obtain accurate edge information and effectively focus on the intrinsic correlation between edge features by layering the input features using four cross-convolution modules and then performing nonlinear activation and convolution after superposition and aggregation.
The cross-convolution module is a method for exploring effective structural information, emphasizing edge information by using both vertical and horizontal gradient information, and the structure is shown in Figure 5. The main difference between cross-convolution and normal convolution is that cross-convolution uses two asymmetric vertical filters, denoted as and . Then, the perceptual field sizes are and . Continuous convolution output features focus only on the main gradient direction of the feature, while cross-convolution can focus on more gradient directions and therefore retain more potential information. In general, the formula of the edge enhancement module is shown in (6)–(8).
where and denote the input features and output features, respectively. Denotes the convolution operation, b denotes the bias term, and x denotes the input image.

Figure 5.
Cross conv module. The plus sign indicates the Add operation.
Cross-convolution mainly emphasizes the relevance of edge information and its underlying information [20,21]. The feature information provided by the cross-convolution module alone cannot support the cross-view geo-localization task. The semantic information in the features extracted by the deeper network plays a critical role in cross-view image matching. Theoretically, the deeper the network, the better the result. In fact, the results obtained by traditional deep neural networks are not satisfactory due to the training difficulty, network degradation, and other problems. The residual network can be an excellent solution to this problem, so the feature fusion module (FFM) is used to fuse the cross-convolutional module with the residual network to obtain fused features that contain both edge feature information and cover rich semantic information. The features extracted by the cross-convolution module are denoted as C1, and the features extracted by the four residual blocks of Resnet are denoted as Block-X. Taking the ground image network branching processing as an example, the ground image is input to the residual network, and the 7 × 7 convolution layer of the residual network first extracts the initial features. Then, input to the cross-convolution and residual network modules to obtain the features C1, Block 1, Block 2, Block 3, and Block 4, respectively. Finally, the FFM is used to fuse C1, Block 2, Block 3, and Block 4 to eliminate the redundant information in the ground image and aerial images and improve the availability of image features. The feature fusion method is shown in Figure 6, and the equations of the FFM are shown in Equations (9) and (10).
where and denote the features and intermediate features of the residual network output, respectively, denotes the upsampling operation, denotes the convolution operation, and y denotes the fused features of the output.
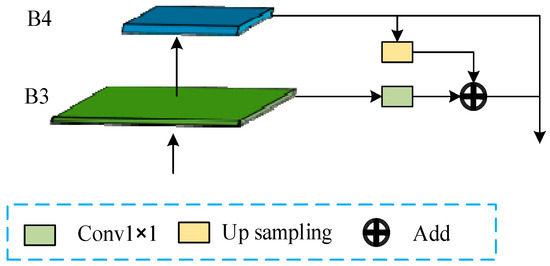
Figure 6.
Structure of the FFM.
3.3. Cross-View Image Matching Strategy
Since the polar transformation may distort the vertical direction of the image, the fused features are convolved four times to reduce the height of the feature map while maintaining its width to obtain fused features that are more tolerant of vertical distortion. After that, the target features are embedded into a discriminable global descriptor. The final matching is completed with L2 distance as the similarity measure, and this process can be briefly expressed as Equation (11).
where Conv denotes the convolution operation, P denotes the given location embedding, denotes the feature descriptor, and c denotes the No.c channel of activation.
When the local view image is in the same direction as the polar-transformed null view image, we can directly use this set of images for matching. However, the direction information of the ground image is not always available, especially when the direction of the ground image is unknown and the field of view is limited, reducing the accuracy of image matching. In the real world, people use a map to determine their location by first determining the direction of the north and then comparing the map to their surroundings to find the desired marker. The method in this paper borrows this idea. It uses the features of the ground image as a sliding window to calculate the inner product between the ground and aerial features in all possible directions, and its correlation is calculated as shown in (12). The desired result is at the maximum of the calculated result similarity score. Its conceptual diagram is shown in Figure 7. Firstly, because the panoramic ground image is 360° (the figure can be represented by a black ring), there must be a direction corresponding to the north direction of the satellite image, and the direction with the maximum calculated similarity score is the north direction.
where and denote the aerial images features and ground image features, respectively. H denotes the image height, C denotes the number of channels, and denote the width of the aerial and ground features, respectively, and denotes the feature response at the index .

Figure 7.
Conceptual map for estimating direction using the inner product of features between ground and aerial images.
During training, the network learns feature representations about the matched pairs and finds the best feature similarity for matching. For non-matching pairs, we need to minimize the similarity of their features to make it easier for the network to distinguish non-matching pairs. According to the idea above, the model is selected from the traditional cross-view localization strategy and trained using weighted soft-margin triplet loss. The formula is shown in (13).
where is the query ground feature, and denote the cropped aerial features of matched aerial images and non-matched aerial images, and denotes the F-parameter. The parameter controls the convergence rate of the training process.
4. Experimental Data and Evaluation Metrics
4.1. Datasets and Experimental Details
To verify the validity of the model developed in this study, experiments were conducted on four widely used publicly available datasets: CVUSA [22], Vo and Hays [4], VIGOR [11], and CVUSA- [23]. The datasets have images of multiple regions and have correspondence between ground and aerial images. CVUSA- is a dataset built by Zhai et al. by further optimizing the original CVUSA- dataset, providing 35,532 image pairs for training and 8884 image pairs for testing. CVUSA is currently the standard dataset in cross-view geo-localization, and domestic and international researchers have established test protocols on this dataset [9,10]. The experimental dataset was image data from all over the U.S., mainly containing urban, suburban, and waterfront areas, among others. Among them, targets such as buildings and roads, with more redundant targets such as vehicles, dominate the images of urban areas. Targets such as fields and trees dominate suburban areas with low background complexity but many repetitive features. Targets such as ports and docks dominate waterfront areas, with redundant targets such as ships. Select one-to-one L18-level satellite images and ground images from the CVUSA dataset. Select one-to-one corresponding ground images and satellite images of the Boston and Houston areas from the VH dataset. In addition, 40,000 pairs of images are randomly selected from VIGOR, and the satellite images may correspond to multiple ground images. The CVUSA dataset was selected following the established test protocol and contained 35,532 training pairs and 8884 test pairs. The details of the selected dataset are shown in Table 1 and Figure 8 and Figure 9. The experiments were run on Windows with i9-9900-64 Gb CPU and NVIDIA GeForce RTX 3090 24 Gb GPU. The GPUs we use are made by NVIDIA, an artificial intelligence computing company. The company was founded in 1993 and is headquartered in Santa Clara, California, USA. The deep learning network was implemented using the TensorFlow framework with Adam optimizer, the initial learning rate was set to 0.0001, and the batch size was 64.

Table 1.
Dataset details.
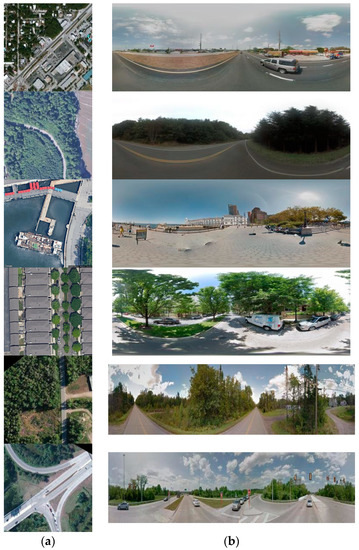
Figure 8.
Cross-view image pairs from CVUSA (top two rows), VIGOR (mid two rows), and CVUSA- (bottom two rows) datasets. (a) aerial images; (b) ground images.
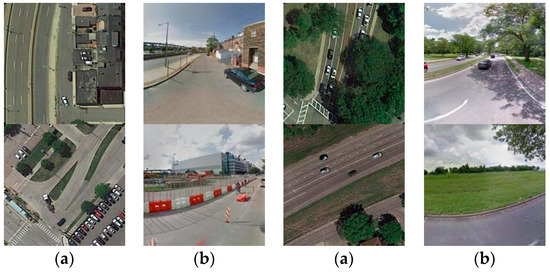
Figure 9.
Cross-view image pairs from the VH dataset. (a) Aerial images; (b) ground images.
4.2. Evaluation Metrics
In this paper, we choose top@K (r@K) [13,14,23,24,25,26,27,28] and Hit Rat-K as evaluation metrics to test the network performance, widely used in cross-view localization. Taking top@10 as an example and the ground image as the reference, suppose there are n aerial view images corresponding to it, and match the ten images with the highest similarity to each reference image according to the L2 distance of the global descriptor between the ground and aerial images, where the result of correct matching is m, then m/n is top@10. It is worth mentioning that r@1% indicates that 1% of the entire test set is taken. Hit Rate-K means matching the top K images with the highest similarity based on the L2 distance of the global descriptors between ground and space images. As long as they contain the correct image, they are considered hits, and the percentage of the Hit Rate to the overall is calculated as Hit Rate-K. The aerial images in the Vo and Hays dataset are cropped satellite images rather than panoramic images. The correspondence between ground and aerial images in VIGOR is not one-to-one but one-to-many, so the validity and generalization of the model can be better verified by testing on these datasets.
5. Result
5.1. Comparison with State-of-the-Art Methods
In order to verify the effectiveness and practical effect of the method in this paper, we used the CVUSA dataset to train the model and then used several datasets to test and calculate the model accuracy: the training set, a test set of CVUSA divided into 8:2, and only test on VIGOR and VH datasets. The model was trained with CVUSA as the base dataset, and the validity of the model was verified by its performance on the VH and VIGOR datasets. The ground-view image in the VH dataset is not a complete panoramic image, so the model performance on the VH dataset verified whether the cross-view localization task could be accomplished under the limited image field of view condition. One aerial image in the VIGOR dataset corresponds to four ground-view images, and the ground-view image is not at the center of the aerial image, so the model performance on the VIGOR dataset verified whether the images could be matched under the non-center matching effect under the correspondence condition. Finally, top@K curves, Hit Rat-K curves, and visualization examples of matching results are plotted based on the experimental results, as shown in Figure 10, Figure 11 and Figure 12.
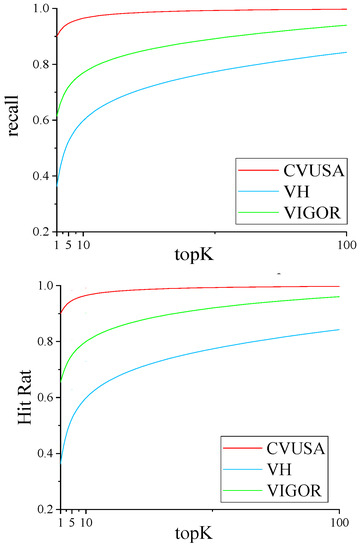
Figure 10.
The quantitative results of the method in this paper are based on CVUSA, VH, and VIGOR datasets.
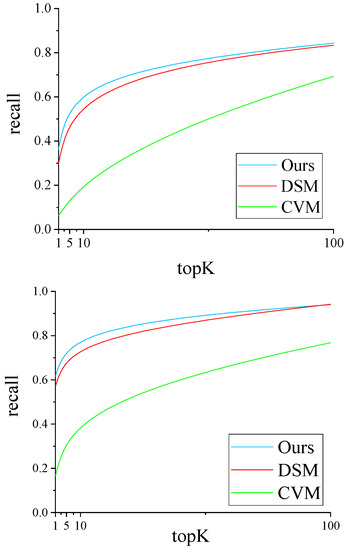
Figure 11.
Comparison graph of the quantification results of the three methods on different datasets. The upper panel shows the results on the VH dataset, and the lower panel shows the results on the VIGOR dataset.
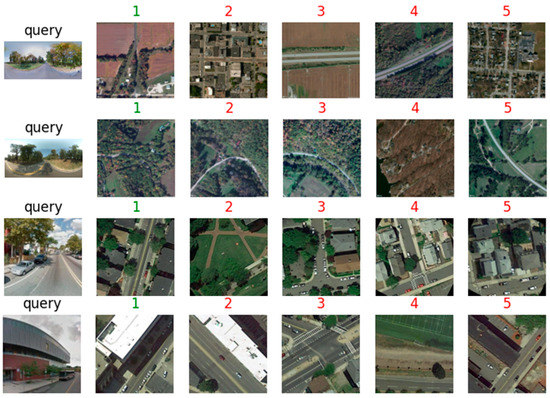
Figure 12.
Visualized matching results. The number represents the ranking of the similarity of the matching results; the smaller the number means that the model considers the higher the similarity. The green title represents the true ground image corresponding to the aerial images, and the red represents the error images.
As shown in Figure 10, the model can achieve the top@1 criterion on all three datasets. The accuracy of the model on the CVUSA test set is above 90% for each metric, while the accuracy of the model on the VH dataset and the VIGOR dataset decreases to varying degrees for each metric. The top@1 metric suffers the most, dropping to about 39% in the VH dataset and to about 61% in the VIGOR dataset. The top@1% metric suffers the least, still 90% in the VIGOR dataset, but drops more in the VH dataset, to about 80%. This indicates that our method can satisfy the high-precision cross-view localization in the case of ground-space image center correspondence; nevertheless, the model is more general in its generality. Our model is strongly affected in the case of a restricted image field of view, and the case of non-correspondence between ground and aerial image centers has less impact on the model compared to the case of a restricted image field of view.
We compared our method with two previous studies using open-source code and models provided by the authors. CVM is one of the earliest algorithms for cross-view localization and is typically representative. Our approach uses the same polar coordinate transformation method as DSM for domain alignment of ground–aerial images. Moreover, DSM is one of the most advanced methods with high positioning accuracy. Therefore, we choose these two methods to compare with our method. We have retrained the three methods, including our method, on VH and VIGOR datasets, and the results are shown in Figure 11.
From the results shown in Figure 11, it can be concluded that all three methods are negatively affected in the case of ground–aerial image center non-correspondence and in the case of the restricted image field of view, resulting in the average accuracy of each method on the evaluation metrics. Among them, CVM basically fails on the top@1 to top@5 metrics. In the VH dataset, our method outperforms the DSM method in all metrics, and in the VIGOR dataset, the accuracy of our method is almost the same as that of the DSM except around top@1%, both being about 89%. Our method outperforms the DSM method in the rest of the metrics. It indicates that our cross-feature enhancement module and multi-scale FFM can be effective in enhancing the generality of the model but still has greater possibilities in enhancing the model generality.
To verify the performance of the model designed in this paper, the recall rates given by the established test protocol on the CVUSA- dataset were compared with those given by some existing methods. The comparison results are shown in Table 2. Workman, Zhai, Vo, and Hays are early deep learning-based cross-view localization algorithms that do not consider too much the difference in the field of view and orientation between ground and aerial images, only metric learning from feature description perspective through the network to complete the matching. CVM-NET, Liu&Li, Siam-FCANet34, and CVFT focus on designing robust network structures and introducing auxiliary information to expect better matching. However, it is difficult for the networks to learn geometric relationships and correspondence between features simultaneously, thus making it more challenging to improve network performance. Regmi and Shah use an adversarial network to switch the viewpoint between ground and aerial images; however, generated images are simulated scenes with more apparent differences than natural scenes. DSM and CVM are two-stage algorithms that first perform a polar coordinate transformation to establish the geometric correspondence between ground and aerial images, reducing the network burden and obtaining excellent matching results. RK-Net [27] extracts more representative key points by using keypoint detection and model representation learning to promote each other to complete cross-view localization. TransGeo [28] is a recently proposed cross-view localization method, which differs from other methods in that it uses a Transformer instead of a traditional convolution module to reduce the computational cost. Our model replaces the deeper backbone network and introduces a cross-convolutional module with feature fusion. This allows the model to use edge features better and improve the scale difference tolerance while eliminating the interference of useless features as much as possible to improve the model performance. From the results, the method in this paper outperforms other methods in both r@5 and r@10 metrics and is only lower than TransGeo in other metrics.

Table 2.
Comparison test results of our method in this paper with some methods. Values in bold font are the optimal values for each column; — indicates that the method is unavailable for this indicator.
5.2. Ablation Experiments
To verify the effectiveness of the method proposed in this paper, ablation experiments were conducted in the same experimental environment, and the algorithm of this paper was compared with that of removing the corresponding module. The experimental results are shown in Table 3. The results in the table show that the deep network, FFM, and cross-convolution modules we introduced can improve the model accuracy, and the combined effect of each module significantly improves the model performance. Our method improves by approximately 7.94 % on the r@1 metric and has various degrees of improvement on the r@5 and r@10 metrics, which helps to accomplish cross-view positioning better.

Table 3.
Ablation experiment results. Values in bold font are the optimal value for each column. Res stands for the base feature extractor: ResNet; VGG stands for the base feature extractor: VGGNet.
6. Discussion
6.1. Comparison with Other Methods in Different Datasets
As can be seen from Figure 10 and Figure 11, whether the center of the ground–aerial image is aligned or not will have some influence on the model’s accuracy. In this paper, image pairs were randomly selected from the VIGOR dataset as the test set. The ground images are inevitably located at the edge of the aerial images. In contrast, the ground images in the CVUSA dataset are located at the center of the aerial images. The model does not consider this problem better during the training process. Compared with whether the center of the ground-space image is aligned, the restricted field of view of the image has a more significant impact on the accuracy of the model because: (1) under the restricted field of view of the image, the available features of the image are insufficient to provide valuable features for ground-space image matching. (2) The size and geometric properties of the aerial image have been changed to a certain extent after the polar coordinate conversion, which is more similar to the projection of the panoramic image. In contrast, although the ground-view images in the VH data set are obtained by cropping the panoramic images, there are still specific projection errors. (3) When the image field of view decreases, the matching ambiguity increases dramatically, so similar ground-view images can seriously interfere with the matching accuracy of the model.
6.2. Comparison with State-of-the-Art Methods
From the results presented in Table 2, it can be concluded that our method is in the leading position at present. In general, compared with algorithms such as CVM that are not designed with view conversion modules, algorithms that have carried out view conversion-related designs have higher accuracy. Particularly, when performing cross-view matching, it is essential to first perform viewpoint unification between ground and aerial images. However, the algorithm with view conversion has a significantly higher computational complexity, inevitably requiring a relatively longer computational cost. In addition, our method offers a significant improvement in terms of accuracy after adding modules such as cross-feature enhancement and multi-scale information fusion. This indicates that the exclusion of redundant features in the image and the use of multi-scale information of the image can play a pivotal role in the cross-view matching task.
6.3. Discussion Related to Ablation Experiments
The results in Table 3 show that the deep network improves the model significantly in the r@1 metric. The addition of the FFM alone does little to improve the model. Adding the cross-convolution module alone will negatively affect the model’s accuracy. However, the combination of cross-convolution and feature fusion modules added to the network can significantly improve the network performance. The reasons for this are: (1) one of the advantages of deep networks is that they can represent complex features, and the deeper the layers of the network, the richer the features extracted at different levels, and more semantic information is available. (2) The combination of cross-convolution and feature fusion modules effectively filters useless features and preserves the spatial information of shallow features while using in-depth features. Thus, fused features can more accurately complete the matching between ground and space. (3) Since the cross-convolution module we designed is based on shallow features, adding only cross-convolution is equivalent to reassigning weights to shallow features using line features. However, the network loses a large amount of semantic information at this point, leading to a lack of global information that can be utilized at a later stage. Therefore, adding cross-convolution alone leads to some degradation in model accuracy.
7. Conclusions
This study proposes a two-stage cross-view matching method using a combination of polar coordinate transformation and deep neural networks. The deep neural network part uses the cross-convolution and feature fusion modules to effectively filter the useless features while combining the rich information possessed by the features at different levels of the deep network to improve the model accuracy. The experimental results show that the method in this paper can reach 92.23% and 98.41% in the r@1 and r@5 indexes of the established test protocols, respectively, and has different degrees of improvement in the remaining indexes compared with other methods. In addition, the matching accuracy of this method is better than the more advanced methods when the image field of view is limited and when the centers of the ground image and aerial image do not correspond, indicating that filtering useless features and using fusion can play a crucial role in the field of cross-view matching. At present, the success rate of a cross-view matching task in the case of the image field of view limitation and center non-correspondence is low, and there is still much room for improvement. However, in practical application scenarios, ground images and the centers of aerial images do not usually correspond. Therefore, further research is needed in future work on effectively performing cross-view geo-localization tasks in the cases of the image field of view limitation, non-corresponding ground–aerial image centers, and matching ground images with aerial images in larger frame sizes in order to further improve the applicability of the method.
Author Contributions
Conceptualization, J.L. and H.G.; methodology, Z.R. and J.L.; software, Z.R.; formal analysis, Z.R. and C.L.; writing—original draft preparation, Z.R. and C.L.; writing—review and editing, J.L. All authors have read and agreed to the published version of the manuscript.
Funding
This research was funded by the National Science Foundation of China, grant number 42201443.
Data Availability Statement
All studies in this paper are based on publicly available datasets.
Conflicts of Interest
The authors declare no conflict of interest.
References
- Choi, J.; Friedland, G. Multimodal Location Estimation of Videos and Images; Springer: Cham, Switzerland, 2014. [Google Scholar] [CrossRef]
- Hays, J.; Efros, A.A. IM2GPS: Estimating geographic information from a single image. In Proceedings of the IEEE Conference on Computer Vision and Pattern Recognition, Anchorage, AK, USA, 23–28 June 2008; pp. 1–8. [Google Scholar] [CrossRef]
- Lin, T.-Y.; Cui, Y.; Belongie, S.; Hays, J. Learning deep representations for ground-to-aerial geolocalization. In Proceedings of the IEEE Conference on Computer Vision and Pattern Recognition, Boston, MA, USA, 7–12 June 2015; pp. 5007–5015. [Google Scholar] [CrossRef]
- Vo, N.N.; Hays, J. Localizing and Orienting Street Views Using Overhead Imagery. In European Conference on Computer Vision (ECCV); Leibe, B., Matas, J., Sebe, N., Welling, M., Eds.; Springer International Publishing: Cham, Switzerland, 2016; pp. 494–509. [Google Scholar]
- Hu, S.; Feng, M.; Nguyen, R.M.H.; Lee, G.H. CVM-net: Cross-view matching network for image-based ground-to-aerial geo-localization. In Proceedings of the IEEE/CVF Conference on Computer Vision and Pattern Recognition, Salt Lake City, UT, USA, 18–23 June 2018; pp. 7258–7267. [Google Scholar] [CrossRef]
- Arandjelovic, R.; Gronat, P.; Torii, A.; Pajdla, T.; Sivic, J. NetVLAD: CNN architecture for weakly supervised place recognition. IEEE Trans. Pattern Anal. Mach. Intell. 2017, 40, 1437–1451. [Google Scholar] [CrossRef] [PubMed]
- Shi, Y.; Yu, X.; Liu, L.; Zhang, T.; Li, H. Optimal feature transport for cross-view image geo-localization. Proc. Conf. AAAI Artif. Intell. 2020, 34, 11990–11997. [Google Scholar] [CrossRef]
- Wang, T.; Zheng, Z.; Yan, C.; Zhang, J.; Sun, Y.; Zheng, B.; Yang, Y. Each part matters: Local patterns facilitate cross-view geo-localization. IEEE Trans. Circuits Syst. Video Technol. 2021, 32, 867–879. [Google Scholar] [CrossRef]
- Liu, L.; Li, H. Lending Orientation to Neural Networks for Cross-View Geo-Localization. In Proceedings of the IEEE/CVF Conference on Computer Vision and Pattern Recognition, Long Beach, CA, USA, 20 June 2019; pp. 5617–5626. [Google Scholar] [CrossRef]
- Zhu, S.J.; Yang, T.; Chen, C. VIGOR: Cross-view image geo-localization beyond one-to-one retrieval. In Proceedings of the IEEE/CVF Conference on Computer Vision and Pattern Recognition, Nashville, TN, USA, 20–25 June 2021; pp. 5316–5325. [Google Scholar] [CrossRef]
- Zhu, S.J.; Yang, T.; Chen, C. Revisiting street-to-aerial view image geo-localization and orientation estimation. In Proceedings of the IEEE Winter Conference on Applications of Computer Vision, Waikoloa, HI, USA, 3–8 January 2021; pp. 756–765. [Google Scholar] [CrossRef]
- Shi, Y.; Yu, X.; Campbell, D.; Li, H. Where am I looking at? Joint location and orientation estimation by cross-view matching. In Proceedings of the Institute of Electrical and Electronics Engineers (IEEE)/CVF Conference on Computer Vision and Pattern Recognition (CVPR), Seattle, WA, USA, 14–19 June 2020. [Google Scholar]
- Shi, Y.; Liu, L.; Yu, X.; Li, H. Spatial-aware feature aggregation for image based cross-view geo-localization. Adv. Neural Inf. Process. Syst. 2019, 32, 10090–10100. [Google Scholar]
- Toker, A.; Zhou, Q.; Maximov, M.; Leal-Taixe, L. Coming down to earth: Satellite-to-street view synthesis for geo-localization. In Proceedings of the IEEE/CVF Conference on Computer Vision and Pattern Recognition, Nashville, TN, USA, 20–25 June 2021; pp. 6484–6493. [Google Scholar] [CrossRef]
- Mousavian, A.; Kosecka, J. Semantic image based geolocation given a map. arXiv 2016, arXiv:1609.00278. [Google Scholar]
- Regmi, K.; Borji, A. Cross-view image synthesis using conditional gans. In Proceedings of the IEEE Conference on Computer Vision and Pattern Recognition, Salt Lake City, UT, USA, 18–22 June 2018; pp. 3501–3510. [Google Scholar]
- He, K.; Zhang, X.; Ren, S.; Sun, J. Deep residual learning for image recognition. In Proceedings of the IEEE Conference on Computer Vision and Pattern Recognition, Las Vegas, NV, USA, 27–30 June 2016; pp. 770–778. [Google Scholar]
- Simonyan, K.; Zisserman, A. Very deep convolutional networks for large-scale image recognition. arXiv 2014, arXiv:1409.1556. [Google Scholar]
- Sarlin, P.E.; DeTone, D.; Malisiewicz, T.; Rabinovich, A. Superglue: Learning feature matching with graph neural networks. In Proceedings of the IEEE/CVF Conference on Computer Vision and Pattern Recognition, Seattle, WA, USA, 13–19 June 2020; pp. 4938–4947. [Google Scholar]
- Liu, Y.; Jia, Q.; Fan, X.; Wang, S.; Ma, S.; Gao, W. Cross-SRN: Structure-Preserving Super-Resolution Network with Cross Convolution. IEEE Trans. Circuits Syst. Video Technol. 2021, 32, 4927–4939. [Google Scholar] [CrossRef]
- Lin, T.Y.; Dollár, P.; Girshick, R.; He, K.; Hariharan, B.; Belongie, S. Feature pyramid networks for object detection. In Proceedings of the IEEE Conference on Computer Vision and Pattern Recognition, Honolulu, HI, USA, 21–26 July 2017; pp. 2117–2125. [Google Scholar]
- Workman, S.; Souvenir, R.; Jacobs, N. Wide-area image geolocalization with aerial reference imagery. In Proceedings of the IEEE International Conference on Computer Vision, Santiago, Chile, 7–13 December 2015; pp. 3961–3969. [Google Scholar] [CrossRef]
- Zhai, M.; Bessinger, Z.; Workman, S.; Jacobs, N. Predicting ground-level scene layout from aerial imagery. In Proceedings of the IEEE Conference on Computer Vision and Pattern Recognition, Honolulu, HI, USA, 21–26 July 2017; pp. 867–875. [Google Scholar]
- Sun, B.; Chen, C.; Zhu, Y.; Jiang, J. Geocapsnet: Aerial to ground view image geo-localization using capsule network. arXiv 2019, arXiv:1904.06281. [Google Scholar]
- Regmi, K.; Shah, M. Bridging the domain gap for ground-to-aerial image matching. In Proceedings of the IEEE/CVF International Conference on Computer Vision, Seoul, Republic of Korea, 27 October–2 November 2019; pp. 470–479. [Google Scholar]
- Cai, S.; Guo, Y.; Khan, S.; Hu, J.; Wen, G. Ground-to-aerial image geo-localization with a hard exemplar reweighting triplet loss. In Proceedings of the IEEE International Conference on Computer Vision (ICCV), Seoul, Republic of Korea, 27 October–2 November 2019. [Google Scholar]
- Lin, J.; Zheng, Z.; Zhong, Z.; Luo, Z.; Li, S.; Yang, Y.; Sebe, N. Joint Representation Learning and Keypoint Detection for Cross-view Geo-localization. IEEE Trans. Image Process. 2022, 31, 3780–3792. [Google Scholar] [CrossRef] [PubMed]
- Zhu, S.; Shah, M.; Chen, C. Transgeo: Transformer is all you need for cross-view image geo-localization. In Proceedings of the IEEE/CVF Conference on Computer Vision and Pattern Recognition, New Orleans, LA, USA, 18–24 June 2022; pp. 1162–1171. [Google Scholar]
Disclaimer/Publisher’s Note: The statements, opinions and data contained in all publications are solely those of the individual author(s) and contributor(s) and not of MDPI and/or the editor(s). MDPI and/or the editor(s) disclaim responsibility for any injury to people or property resulting from any ideas, methods, instructions or products referred to in the content. |
© 2023 by the authors. Licensee MDPI, Basel, Switzerland. This article is an open access article distributed under the terms and conditions of the Creative Commons Attribution (CC BY) license (https://creativecommons.org/licenses/by/4.0/).