Communication

Problems with and Improvement of HCHO/NO2 for Diagnosing Ozone Sensitivity—A Case in Beijing

1
Institutes of Physical Science and Information Technology, Anhui University, Hefei 230601, China
2
State Key Laboratory of Atmospheric Boundary Layer Physics and Atmospheric Chemistry, Institute of Atmospheric Physics, Chinese Academy of Sciences, Beijing 100029, China
3
State Environmental Protection Key Laboratory of Sources and Control of Air Pollution Complex, Beijing 100084, China
4
University of Chinese Academy of Sciences, Beijing 100049, China
5
Beijing Key Laboratory of Airborne Particulate Matter Monitoring Technology, Beijing Municipal Environmental Monitoring Center, Beijing 100048, China
6
School of Environment, Key Laboratory for Yellow River and Huai River Water Environment and Pollution Control, Ministry of Education, Henan Normal University, Xinxiang 453007, China
7
China Meteorological Administration Institute for Development and Programme Design (CMAIDP), Beijing 100081, China
*
Author to whom correspondence should be addressed.
Remote Sens. 2023, 15(8), 1982; https://doi.org/10.3390/rs15081982
Submission received: 26 February 2023 / Revised: 28 March 2023 / Accepted: 6 April 2023 / Published: 9 April 2023
(This article belongs to the Section Atmospheric Remote Sensing)

Abstract

:
Rfn (formaldehyde/nitrogen dioxide) is a common indicator based on satellite observations used to classify ozone formation sensitivity. However, it may underestimate anthropogenic volatile organic compounds (VOCs) in heavily polluted cities when only formaldehyde (HCHO) is used in Rfn to measure VOCs, since it is mainly derived from natural sources worldwide. In this study, we used multiaxis differential optical absorption spectroscopy to acquire tropospheric observations of nitrogen dioxide (NO2), HCHO and glyoxal (CHOCHO) in Beijing from 1 April 2019 to 31 March 2020. Combined with VOCs detected simultaneously by gas chromatography—mass spectrometry and proton transfer reaction–time-of-flight/mass spectrometry near the ground, we evaluated the representativeness of HCHO column densities on total VOCs (TVOC) in equivalent propylene concentrations, which is called reactivity. The results showed that there were significant seasonal differences in the response of HCHO to TVOC reactivity, with fitting slopes of 2.3 (spring), 2.6 (summer), 2.9 (autumn) and 1.0 (winter) in the four seasons, respectively. Since CHOCHO can be used to partly characterize the contribution of anthropogenic VOC emissions and demonstrated a better response to TVOC reactivity in winter, with fitting slopes of 0.2 (spring), 0.2 (summer), 0.2 (autumn) and 0.5 (winter) in the four seasons, respectively, we introduced CHOCHO to construct a new indicator (HCHO + 6 × CHOCHO). The fitting slopes of the four seasons were more similar, being 3.2 (spring), 3.6 (summer), 4.0 (autumn) and 4.0 (winter). The ratio of the new indicator to NO2, Rmn ((HCHO + 6 × CHOCHO)/NO2), was used to reclassify the ozone formation sensitivity of urban areas in North China, revealing that it is a transition regime before 1300 LST (LST = UST + 8) and an NOx-limited regime afterwards. Rmn improved the sensitivity from the VOC-limited regime to the NOx-limited regime, enhancing the sensitivity of NOx and providing new robust support for ozone pollution prevention and control.

Graphical Abstract

1. Introduction

Since the implementation of the State Council’s Air Pollution Prevention and Control Action Plan in 2013, particulate pollution has been significantly improved in China [1]. However, the ozone level remains high, with the volume mixing ratio (VMR) concentration increasing from 64 to 79 ppb between 2013 and 2017 [1]. Ozone is associated with adverse health effects, including effects on respiratory and cardiovascular systems. It can also aggravate lung diseases and trigger asthma [2]. Therefore, controlling ozone pollution is an urgent matter. Since ozone has two precursors, volatile organic compounds (VOCs) and nitric oxide (NOx), it is necessary to determine which precursor it is more sensitive to [3]. In summary, the key to ozone reduction is the estimation of ozone formation sensitivity.
Recently, several methods have been adopted to determine ozone formation sensitivity. Through the indicator method [4], observation-based model [5], WRF-CMAQ model [6], and other methods, urban cities have been found to be sensitive to VOCs (i.e., VOC-limited), while rural areas were found to be sensitive to NOx (i.e., NOx-limited). Urban cities were found to be VOC-limited or in a transition regime (sensitive to both VOCs and NOx) in the morning and NOx-limited in the afternoon. However, these methods are only based on single-point measurement, and have not been studied when performed over a wide range, globally. Martin et al. [7] developed the ozone formation sensitivity indicator, which consists of a ratio of HCHO to nitrogen dioxide (NO2), called Rfn (HCHO/NO2), determined on the basis of satellite observations, which can produce global results over long time periods with stronger spatial representation and wider time spans. Subsequently, Ducan et al. [8] identified the following threshold: when Rfn < 1, it is VOC-limited; when 1 < Rfn < 2, it corresponds to the transition regime; and when Rfn > 2, it is NOx-limited. According to Rfn determined on the basis of satellite data, China is overall VOC-limited; more specifically, urban cities are mostly VOC-limited, while rural and remote areas are NOx-limited [9]. However, when considering of the vigorous NOx emission reductions, megacities, such as Beijing, Shanghai and Guangzhou, have shown an increasing NOx sensitivity in recent years [10,11,12,13,14].
Nevertheless, VOCs have different sources in different areas [13]. Studies have found that HCHO mainly comes from natural sources, among which isoprene oxidation accounts for the largest contribution, reaching 50% in strong source areas [15,16]. Moreover, changes in biogenic emissions have a strong driving effect on the seasonal regulation of HCHO [17]. Photolysis of alkenes yields HCHO at the fastest rate, while aromatics and alkanes yield HCHO at a lower rate [18]. In populated and industrialized areas, the anthropogenic source of VOCs contributes only 7% to HCHO, though they are significant [19]. In addition, the assumption that HCHO can represent VOCs may not apply to situations with high VOC levels [20]. Consequently, HCHO is not able to completely represent total VOCs (TVOC); in other words, it may underestimate contributions of anthropogenic VOCs (AVOCs) and thereby influence ozone reduction policies when using Rfn to ascertain ozone formation sensitivity. Instead, Liu et al. [21] reported that glyoxal (CHOCHO) is more suitable for characterizing TVOC than HCHO. Urban and suburban CHOCHO are primarily derived from the degradation of aromatics [22,23]. The amount of CHOCHO produced by isoprene oxidation is much less than that produced by oxidation of AVOCs such as aromatics [24]. Given the above, CHOCHO is a better indication of AVOCs than HCHO [25,26,27].
To address this limitation, our work utilized near-ground VOC data to evaluate the representative ability of HCHO to TVOC and then added CHOCHO to characterize AVOC emissions based on HCHO. We constructed a new indicator to differentiate ozone formation sensitivity, and further assessed the importance of the new indicator for distinguishing ozone formation sensitivity.

2. Materials and Methods

2.1. Sites

The ground observation was performed at the Tower branch of the Institute of Atmospheric Physics, Chinese Academy of Sciences, Beijing. The ground-based remote sensing apparatus was located on the roof of the Academy of Meteorology, Chinese Academy of Sciences, Beijing. Both stations are in the urban area of Beijing, where traffic is the main emission source. Moreover, the distance between the stations is approximately 9 km.

2.2. Ground Observation

In this work, we used two in situ observation methods to observe VOCs: gas chromatography—mass spectrometry (GC—MS, Model SE2010, Shimadzu, Kyoto, Japan) and proton transfer reaction–time-of-flight/mass spectrometry (PTR-TOF/MS, Model TOF4000, IONICON, Innsbruck, Austria). Because VOCs are evenly distributed in the boundary layer [28,29,30], ground VOCs can be used to substitute for space VOCs in related research. According to Method TO-15, as described by the American Environmental Protection Agency, we employed GC—MS to observe several ozone precursors specified at the Photochemical Assessment Monitoring Stations (PAMS, species presented in Table S1), among which dodecane and acetylene were not involved in the calculation due to the serious lack of data for the former and the lack of a constant rate with OH radicals for the latter. Alternatively, oxygenated VOCs (OVOCs), as a considerable subset of VOCs, play a vital role in the function of radicals, and are thus inevitably sensitive to atmospheric oxidation capacity [31]. As a result, OVOCs also need to be included in VOCs for further study. While GC—MS is deficient for the measurement of OVOCs due to its low separation efficiency and accuracy of measurement [32], PTR-TOF/MS presents more advantages for the measurement of OVOCs as a result of its high temporal resolution and soft ionization, facilitating a reduction in the underestimation of environmental OVOC levels and resulting in accurate detection [33]. As a result, we employed PTR-TOF/MS to observe OVOCs in this work. Furthermore, the dominant components of OVOCs are HCHO, acetaldehyde and acetone, which account for nearly 90% [34,35]. Even so, acetone contributes less to ozone formation [36], in contrast to other OVOCs. Consequently, in this work, only HCHO and acetaldehyde measured by PTR-TOF/MS are considered to be representative of OVOCs. In general, in this work, 57 different kinds of VOC are regarded as constituting TVOCs, including 55 kinds of VOC measured using GC—MS and two OVOCs measured using PTR-TOF/MS, in order to conduct the subsequent research. A supplementary introduction to methods of GC-MS and PTR-TOF/MS are presented in Text S1. In addition, an in situ instrument called the NO-NO2-NOx analyzer (Model 42i, Thermo, Waltham, MA, USA) was used to acquire NO2 levels. For a further description of above instruments, see Yao et al. [37] and Yuan et al. [38]. Finally, the amount of data analyzed in this work amounted to 1587 corresponding to TVOCs from April 2019 to January 2020, 2855 corresponding to in situ NO2 from April 2019 to March 2020 and 1598 corresponding to in situ HCHO from May 2019 to March 2020.

2.3. Ground-Based Remote Sensing

A MAX-DOAS (multiaxis differential optical absorption spectroscopy) system instrument, which can be used to stereoscopically monitor air pollutants, was used to observe NO2, HCHO and CHOCHO in the troposphere [39]. The detailed observations and subsequent processing are presented in Text S2, and more specific settings of the retrieval approach are provided in Text S3. To obtain vertical column densities (VCDs), we converted differential slant column densities retrieved using the HEIPRO inversion algorithm (Heidelberg Profile, developed by the IUP of Heidelberg University, Heidelberg, Germany) using differential air mass factors acquired using the radiation transfer model. In addition, because clouds greatly influence the detection of MAX-DOAS, we deleted data that were obtained under cloud cover. For further details, see Kang et al. [40]. Due to the fact that MAX-DOAS can only make observations in the presence of sunlight, data were only acquired between 0800 LST and 1700 LST (LST = UTC + 8). Finally, the volumes of VCD data analyzed in this work were 1309 for HCHO, 1525 for NO2 and 1084 for CHOCHO from April 2019 to March 2020.

3. Results

3.1. Validation of MAX-DOAS

To verify the accuracy of the MAX-DOAS measurements, we compared the values of NO2 and HCHO measured using MAX-DOAS to VMR concentrations measured using in situ instruments. The time series are shown in Figure S1. The correlation analysis (Figure 1) shows that the Pearson’s correlation R values in different seasons were 0.7 (spring), 0.5 (summer), 0.8 (autumn) and 0.8 (winter) for NO2 and 0.9 (spring), 0.5 (summer), 0.9 (autumn) and 0.7 (winter) for HCHO. These are both strong correlations, revealing that MAX-DOAS was highly consistent with ground observations. As a result, data from MAX-DOAS observations can be used for subsequent related studies.

3.2. Representativeness of HCHO on TVOC during Different Seasons

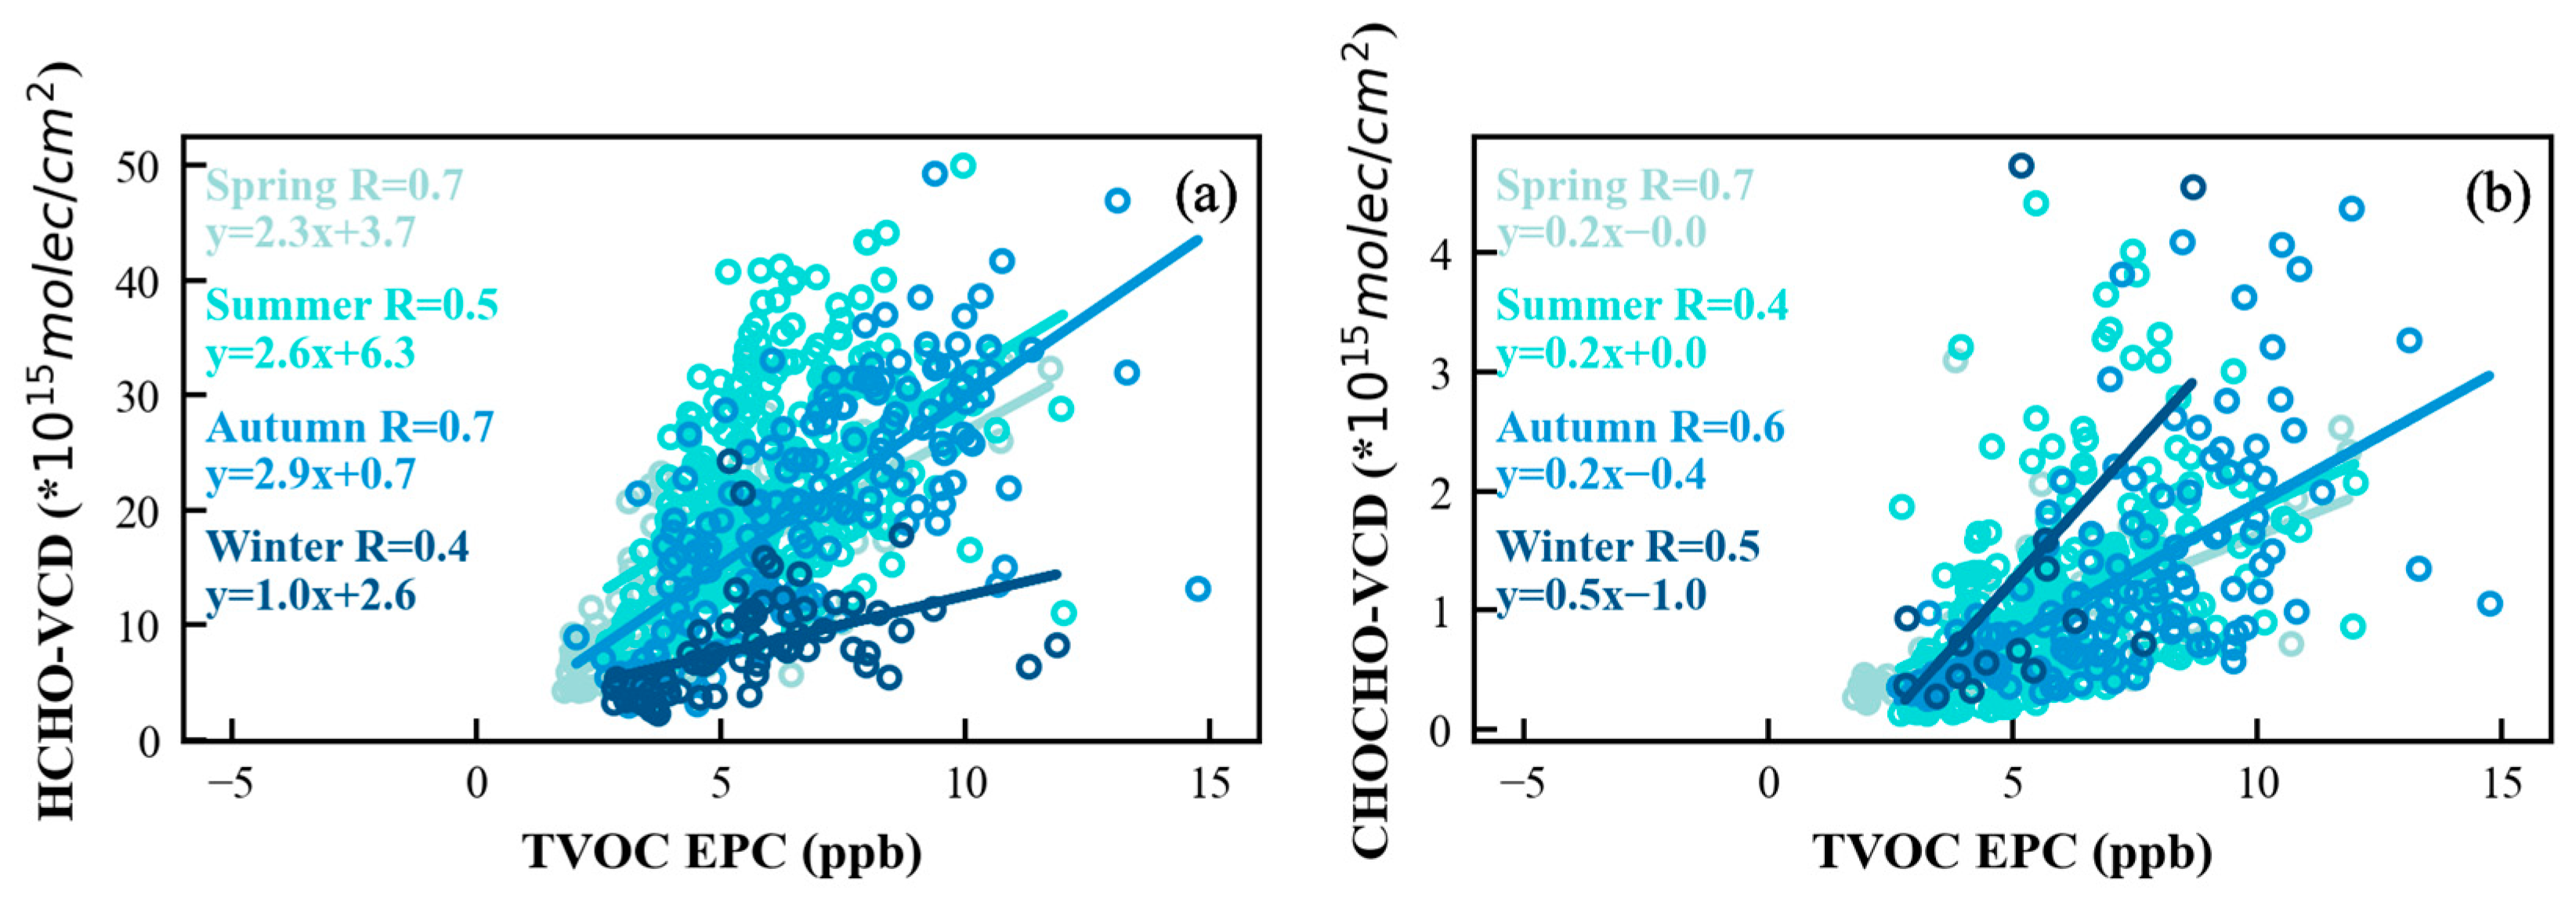
The equivalent propylene concentration (EPC, where the calculation method is shown in Text S4) represents the reactivity of VOCs; thus, in this work, we used correlation analysis between HCHO concentration and TVOC EPC in different seasons to illustrate the degree to which HCHO is representative of TVOC. Theoretically, the level of slope reflects the magnitude of TVOC reactivity represented by HCHO, while the level of correlation reflects the accuracy of HCHO’s characterization of TVOC reactivity. On this basis, whether or not HCHO is always applicable for representing TVOC reactivity can be estimated by comparing the fitting slopes for the four seasons, which will only be positive when the level of the fitting slopes in different seasons are close. As shown in Figure 2a, the correlations for the four seasons were 0.7 (spring), 0.5 (summer), 0.7 (autumn) and 0.4 (winter), and the fitting slopes for the four seasons were 2.3 (spring), 2.6 (summer), 2.9 (autumn) and 1.0 (winter), respectively. Namely, HCHO exhibited a seasonally discrepant response to TVOC reactivity, with a distinctly low magnitude of TVOC reactivity being represented by HCHO in winter, with inaccurate HCHO characterization of TVOC. In other words, a single HCHO is not able to accurately reflect TVOC.
Similarly, we calculated the correlation between CHOCHO and TVOC EPC (Figure 2b). The results showed that the slopes for the different seasons were 0.2 (spring), 0.2 (summer), autumn (0.2) and 0.5 (winter), respectively. The slope for winter was twice as high as that for any other season, which was opposed to HCHO, implying that its representativeness of TVOC reactivity might be improved through the combination of HCHO and CHOCHO.

3.3. Study of New Indicator of Ozone Formation Sensitivity

3.3.1. Establishment of Indicator

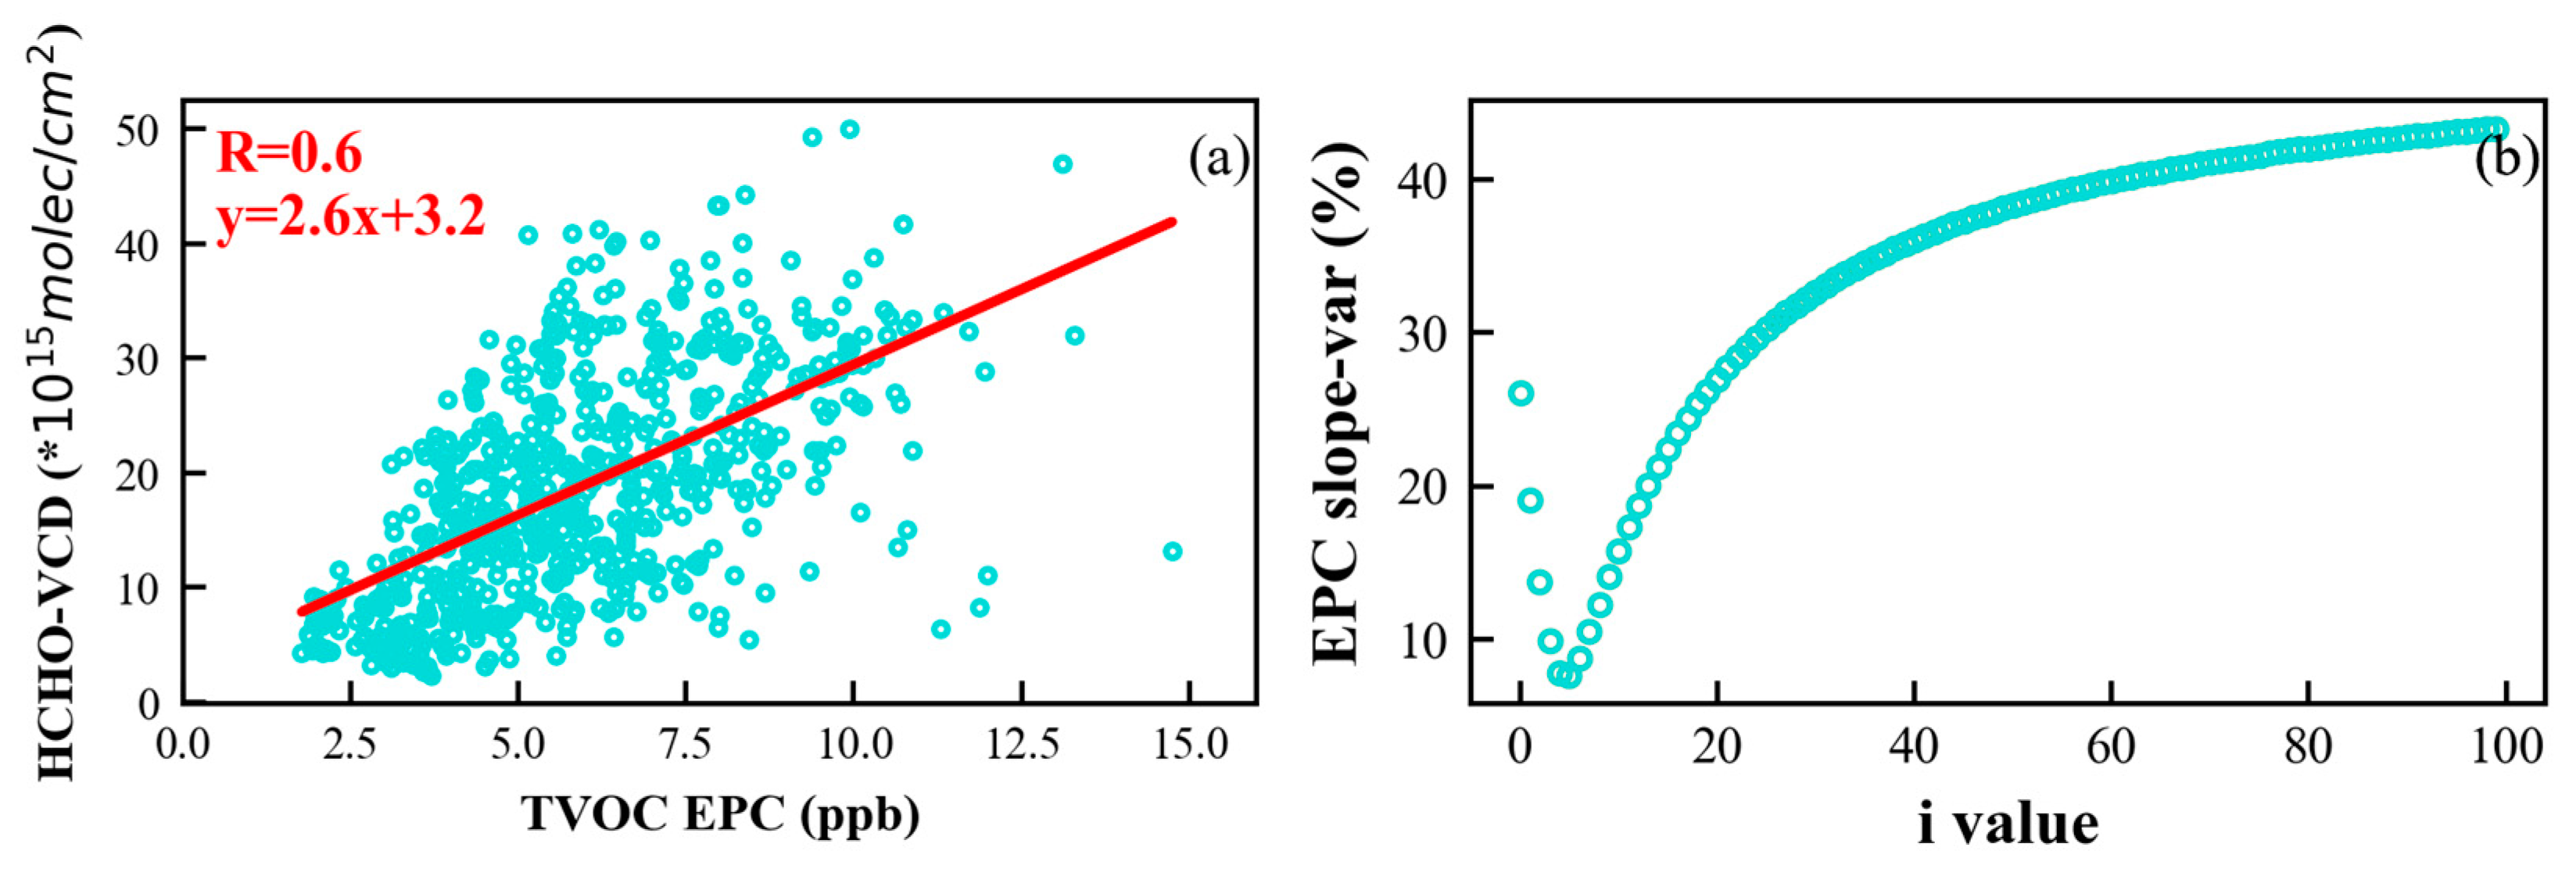
Considering the strength of Rfn, in this work, VCD data observed using MAX-DOAS were used to further improve ozone formation sensitivity. The correlation R between HCHO and TVOC reactivity (Figure 3a) was 0.6. Next, we imported CHOCHO based on HCHO and performed a multivariate linear fitting analysis with TVOC reactivity (Table S4). The correlation R was 0.7, displaying a higher relationship, indicating that the addition of CHOCHO enables TVOC reactivity to be better reflected. Remarkably, the coefficient ratio i of CHOCHO and HCHO in this multivariate equation was 6. To verify the i value, we established a new indicator, Mix, by adding i CHOCHO cycles based on a single HCHO cycle:
Mix = HCHO + i × CHOCHO
Subsequently, we calculated the variability of the fitting slopes between Mix corresponding to different values of i and TVOC reactivity for different seasons (Figure 3b). The smaller the variability, the more similar the ability of HCHO to represent TVOC among the different seasons. From 1 to 100, the variability was distributed within 10% only when i was equal to 3, 4, 5, or 6, revealing that the magnitudes of TVOC represented by HCHO were the closest among the four seasons. In combination with the ratio in the multivariate equation described above, in this work, a value i = 6 was adopted, and a new indicator, Mix = HCHO + 6 × CHOCHO, was established to improve the insufficient representation of TVOC obtained using a single HCHO.

3.3.2. Validation of the New Indicator

To validate the spatial representation of Mix with respect to TVOC, we calculated the correlations of Mix and TVOC reactivity for the different seasons (Figure 4). The correlation R values were 0.7 (spring), 0.6 (summer), 0.7 (autumn), and 0.5 (winter), and the fitting slopes were 3.2 (spring), 3.6 (summer), 4.0 (autumn), and 4.0 (winter), respectively. Compared to using a single HCHO (Figure 2a), the fitting slope of Mix and TVOC reactivity demonstrated a prominent enhancement in winter, as did the correlation. In conclusion, the addition of CHOCHO effectively promoted the magnitude and accuracy of the representation of TVOC by HCHO in winter.

4. Discussion

4.1. Changes in Ozone Formation Sensitivity Evaluated Using the New Indicator

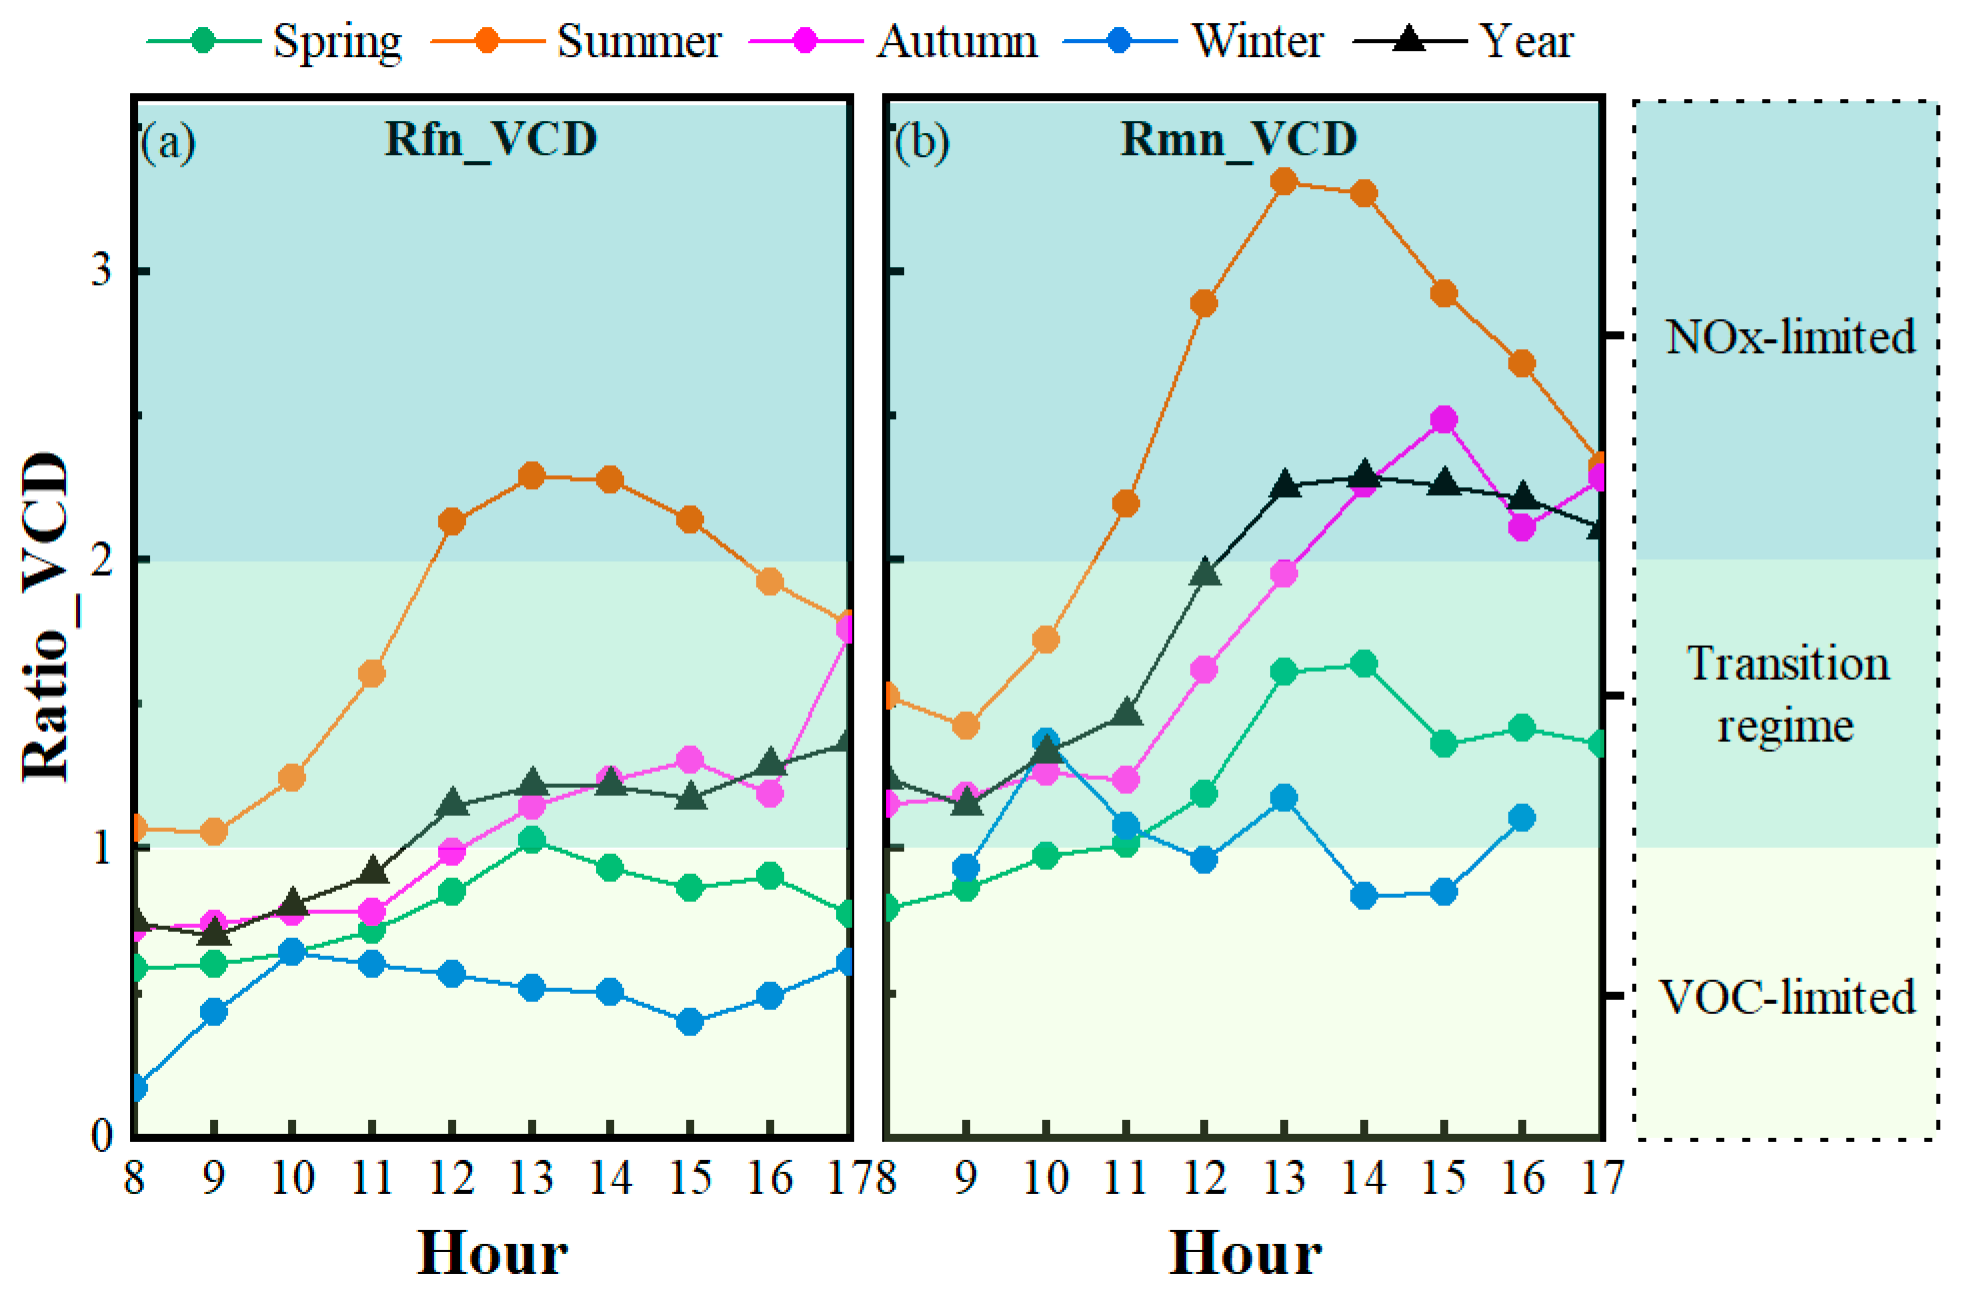
By substituting Mix, we constructed a new indicator, Rmn (Rmn = Mix/NO2), for distinguishing ozone formation sensitivity, and the time series of both Rfn and Rmn are shown in Figure S2. In line with the division method used for Rfn (Section 1), Rmn was used to evaluate the ozone formation sensitivity of North China, and compared with the sensitivity indicated by Rfn (Figure 5). The whole year was VOC-limited before 1200 LST, while it belonged to the transition regime afterward, as determined by Rfn, while it belonged to the transition regime before 1300 LST and NOx-limited afterward, as determined by Rmn, with the sensitivity conversion being delayed by one hour. In terms of the seasons, when using Rfn, winter and spring were both VOC-limited; summer was transition regime, except for the period with the strongest light (1200–1500 LST), which was NOx-limited; autumn was VOC-limited before 1200 LST and transition regime afterward. In contrast, the diurnal variation in sensitivity indicated when using Rmn increased more evidently in the afternoon, placing the sensitivity close to the transition regime and the NOx-limited regime, especially in spring and autumn. Spring was VOC-limited before 1100 LST and transition regime afterward; autumn was transition regime before 1300 LST and NOx-limited afterward; summer was transition regime during 0800 and 1000 LST and NOx-limited afterward; in winter, the sensitivity fluctuated between the VOC-limited regime and the transition regime, but was more inclined toward the transition regime around noon (1000, 1100, 1300 and 1600 LST were transition regime). Overall, the ozone formation sensitivity categorized by Rmn was more sensitive to NOx, with its change being more apparent in the afternoon.

4.2. Limitations

There are two limitations to this work. First, Mix is not necessarily applicable in all regions. Second, as yet, no threshold has been specified for Rmn.
With respect to the first limitation, the compositions of VOCs vary in different regions and the distinct proportions of biogenic and anthropogenic contributions will result in changes in the corresponding i values. Therefore, specialized studies need to be conducted for different regions.
With respect to the second limitation, at present, this study only addresses the problem of using HCHO/NO2 for determining the sensitivity of ozone formation and provides a preliminary solution. As such, this study does not provide a threshold value of Rmn, which can only be determined through a complete air quality model simulation. Therefore, research on the threshold value will be performed in future work.

5. Conclusions

In this work, we conducted a single-site study in Beijing, combining ground observations with ground-based remote sensing observations, to illustrate the deficiency of the original satellite-based indicator Rfn of ozone formation sensitivity estimation, and thereby established a new indicator. First, we evaluated the representativeness of HCHO for TVOC and discovered that HCHO was not able to characterize TVOC reactivity equally in different seasons. The fitting slopes were 2.3 (spring), 2.6 (summer), 2.9 (autumn) and 1.0 (winter), with a considerable underestimation in winter. Since CHOCHO can be used to partly symbolize AVOCs, we also calculated the correlation between it and TVOC reactivity. The fitting slopes were 0.2 (spring), 0.2 (summer), 0.2 (autumn) and 0.5 (winter), with a much better response to TVOC reactivity in winter, thus making up for the lack of the representativeness of HCHO for TVOC in winter. Therefore, we introduced this and performed innovations to establish a new indicator, Rmn ((HCHO + 6 × CHOCHO)/NO2).
When reassessing ozone formation sensitivity using Rmn, it was found to belong to a transition regime before 1300 LST, and a NOx-limited afterward in North China. In spring, it was VOC-limited before 1100 LST and transition regime afterward; in summer, it was a transition regime before 1100 LST and NOx-limited afterward; in autumn, it was a transition regime before 1300 LST and NOx-limited afterward; and in winter, it was VOC-limited in general, but belonged to a transition regime around noon. Compared to the sensitivity determined using Rfn, the sensitivity determined using Rmn was more sensitive to NOx, implying that ozone prevention and control should be focused more on reducing NOx emissions. Rfn relegates part of the NOx-limited regime and transition regime to the transition regime and VOC-limited regime, respectively, while Rmn corrects this bias and is more appropriate for the classification of ozone formation sensitivity in urban cities. Moreover, because both satellite and MAX-DOAS are able to detect HCHO and CHOCHO, Rmn can be applied to determine ozone formation sensitivity using these two observation methods at the same time, providing a broader application and more specific support for the prevention and control of atmospheric ozone pollution.

Supplementary Materials

The following supporting information can be downloaded at: https://www.mdpi.com/article/10.3390/rs15081982/s1. Text S1: Methods supplementary introduction [41]. Text S2: Detailed observation and subsequent processing [42,43]. Text S3: Specific settings for the retrieval [44]. Text S4: Equivalent propylene concentration [45,46]. Table S1: Ozone precursors in PAMs. Table S2: MDL (pptv) of VOCs selected in this study. Table S3: DOAS spectrum analysis settings of O4, NO2, HCHO and CHOCHO [42,47,48,49,50,51,52,53,54,55]. Table S4: Multivariate linear fitting results. Figure S1: Time series of in situ VMR VS MAX-DOAS VMR (a) NO2 (b) HCHO. Figure S2: Time series of Rfn and Rmn.

Author Contributions

Conceptualization, Y.K. and G.T.; methodology: Y.K.; software, Y.K.; Validation: G.T.; formal Analysis, Y.K.; investigation, Y.K.; data curation, Y.K., Q.L., D.Y. and Y.W. (Yiming Wang); writing—original draft preparation, Y.K. and G.T.; Writing—review and editing, Y.K. and G.T.; Writing—review and editing, Y.K., G.T., Q.L., B.L., D.Y., Y.W. (Yiming Wang), Y.W. (Yinghong Wang), Y.W. (Yuesi Wang) and W.L., visualization, Y.K.; supervision, G.T., project and administration, G.T.; funding acquisition, G.T. All authors have read and agreed to the published version of the manuscript.

Funding

This research was funded by the National Natural Science Foundation of China (Nos. 42177081 and 41877312), the Beijing Major Science and Technology Project (No. Z211100004321006), the Beijing Municipal Natural Science Foundation (No. 8222075), the Youth Cross Team Scientific Research Project of the Chinese Academy of Sciences (No. JCTD-2021-10), and the National Research Program for Key Issues in Air Pollution Control (No. DQGG202101).

Data Availability Statement

The data presented in this study are available on request from the corresponding author.

Conflicts of Interest

The authors declare no conflict of interest.

References

  1. Wang, Y.; Gao, W.; Wang, S.; Song, T.; Gomg, Z.; Ji, D.; Wang, L.; Liu, Z.; Huo, Y.; Tan, S.; et al. Contrasting trends of PM2.5 and surface-ozone concentrations in China from 2013 to 2017. Natl. Sci. Rev. 2020, 7, 1331–1339. [Google Scholar] [CrossRef] [PubMed] [Green Version]
  2. Nuvolone, D.; Petri, D.; Voller, F. The effects of ozone on human health. Environ. Sci. Pollut. Res. 2018, 25, 8074–8088. [Google Scholar] [CrossRef] [PubMed]
  3. Tang, G.; Liu, Y.; Huang, X.; Wang, Y.; Hu, B.; Zhang, Y.; Song, T.; Li, X.; Wu, S.; Li, Q.; et al. Aggravated ozone pollution in the strong free convection boundary layer. Sci. Total Environ. 2021, 788, 147740. [Google Scholar] [CrossRef] [PubMed]
  4. Liu, Y.; Song, M.; Liu, X.; Zhang, Y.; Hui, L.; Kong, L.; Zhang, Y.; Zhang, C.; Qu, Y.; An, J.; et al. Characterization and sources of volatile organic compounds (VOCs) and their related changes during ozone pollution days in 2016 in Beijing, China. Environ. Pollut. 2020, 257, 113599. [Google Scholar] [CrossRef]
  5. Su, R.; Lu, K.; Yu, J.; Tan, Z.; Jiang, M.; Li, J.; Xie, S.; Wu, Y.; Zeng, L.; Zhai, C.; et al. Exploration of the formation mechanism and source attribution of ambient ozone in Chongqing with an observation-based model. Sci. China Earth Sci. 2018, 61, 23–32. [Google Scholar] [CrossRef]
  6. Sharma, S.; Chatani, S.; Mahtta, R.; Goel, A.; Kumar, A. Sensitivity analysis of ground level ozone in India using WRF-CMAQ models. Atmos. Environ. 2016, 131, 29–40. [Google Scholar] [CrossRef]
  7. Martin, R.V.; Fiore, A.M.; Van Donkelaar, A. Space-based diagnosis of surface ozone sensitivity to anthropogenic emissions. Geophys. Res. Lett. 2004, 31, L06120. [Google Scholar] [CrossRef] [Green Version]
  8. Duncan, B.N.; Yoshida, Y.; Olson, J.R.; Sillman, S.; Martin, R.V.; Lamsal, L.; Hu, Y.; Pickering, K.E.; Retscher, C.; Allen, D.J. Application of OMI observations to a space-based indicator of NOx and VOC controls on surface ozone formation. Atmos. Environ. 2010, 44, 2213–2223. [Google Scholar] [CrossRef] [Green Version]
  9. Jin, X.; Holloway, T. Spatial and temporal variability of ozone sensitivity over China observed from the Ozone Monitoring Instrument. J. Geophys. Res. Atmos. 2015, 120, 7229–7246. [Google Scholar] [CrossRef]
  10. Jin, X.; Fiore, A.M.; Murray, L.T.; Valin, L.C.; Lamsal, L.N.; Duncan, B.; Boersma, K.; De Smaedt, I.; Abad, G.; Chance, K.; et al. Evaluating a space-based indicator of surface ozone-NOx-VOC sensitivity over midlatitude source regions and application to decadal trends. J. Geophys. Res. Atmos. 2017, 122, 10439–10461. [Google Scholar] [CrossRef]
  11. Tang, G.; Liu, Y.; Zhang, J.; Liu, B.; Li, Q.; Sun, J.; Wang, Y.; Xuan, Y.; Li, Y.; Pan, J.; et al. Bypassing the NOx titration trap in ozone pollution control in Beijing. Atmos. Res. 2021, 249, 150333. [Google Scholar] [CrossRef]
  12. Tang, G.; Wang, Y.; Li, X.; Ji, D.; Hsu, S.; Gao, X. Spatial-temporal variations in surface ozone in Northern China as observed during 2009–2010 and possible implications for future air quality control strategies. Atmos. Chem. Phys. 2012, 12, 2757–2776. [Google Scholar] [CrossRef] [Green Version]
  13. Liu, C.; Hu, Q.; Zhang, C.; Xia, C.; Yin, H.; Su, W.; Wang, X.; Zhang, Z. First Chinese ultraviolet–visible hyperspectral satellite instrument implicating global air quality during the COVID-19 pandemic in early 2020. Light Sci. Appl. 2022, 11, 1–12. [Google Scholar] [CrossRef] [PubMed]
  14. Liu, Y.; Tang, G.; Liu, B.; Zhang, X.; Li, Q.; Hu, Q.; Yu, M.; Ji, D.; Sun, Y.; Wang, Y.; et al. Decadal changes in ozone in the lower boundary layer over Beijing, China. Atmos. Environ. 2022, 275, 119018. [Google Scholar] [CrossRef]
  15. Curci, G.; Palmer, P.I.; Kurosu, T.P.; Chance, K.; Visconti, G. Estimating European volatile organic compound emissions using satellite observations of formaldehyde from the Ozone Monitoring Instrument. Atmos. Chem. Phys. 2010, 10, 11501–11517. [Google Scholar] [CrossRef] [Green Version]
  16. Li, X.; Brauers, T.; Hofzumahaus, A.; Lu, K.; Li, Y.P.; Shao, M.; Wahner, T.; Wahner, A. MAX-DOAS measurements of NO2, HCHO and CHOCHO at a rural site in Southern China. Atmos. Chem. Phys. 2013, 13, 2133–2151. [Google Scholar] [CrossRef] [Green Version]
  17. Hoque, H.; Sudo, K.; Irie, H.; Damiani, A.; Fatmi, A.M. MAX-DOAS observations of formaldehyde and nitrogen dioxide at three sites in Asia and comparison with the global chemistry transport model CHASER. Atmos. Chem. Phys. Discuss. 2021, 1–56. [Google Scholar] [CrossRef]
  18. Bhardwaj, N.; Kelsch, A.; Eatough, D.J.; Thalman, R.; Daher, N.; Kelly, K.; Isabel, C.; Hansen, J.C. Sources Formaldehyde Bountiful. Utah. Atmos. 2021, 12, 375. [Google Scholar]
  19. Stavrakou, T.; Müller, J.F.; De Smedt, I.; Van Roozendael, M.; van der Werf, G.R.; Giglio, L.; Guenther, A. Evaluating the performance of pyrogenic and biogenic emission inventories against one decade of space-based formaldehyde columns. Atmos. Chem. Phys. 2009, 9, 1037–1060. [Google Scholar] [CrossRef] [Green Version]
  20. Souri, A.; Nowlan, C.; Wolfe, G.; Lamsal, L.; Miller, C.; Abad, G.; Janz, S.; Fried, A.; Blake, D.; Weinheimer, A.; et al. Revisiting the effectiveness of HCHO/NO2 ratios for inferring ozone sensitivity to its precursors using high resolution airborne remote sensing observations in a high ozone episode during the KORUS-AQ campaign. Atmos. Environ. 2020, 224, 117341. [Google Scholar] [CrossRef]
  21. Liu, J.; Li, X.; Tan, Z.; Wang, W.; Yang, Y.; Zhu, Y.; Yang, S.; Song, M.; Chen, S.; Wang, H.; et al. Assessing the Ratios of Formaldehyde and Glyoxal to NO2 as Indicators of O3–NOx–VOC Sensitivity. Environ. Sci. Technol. 2021, 55, 10935–10945. [Google Scholar] [CrossRef] [PubMed]
  22. Volkamer, R.; San Martini, F.; Molina, L.T.; Salcedo, D.; Jimenez, J.L.; Molina, M.J. A missing sink for gas-phase glyoxal in Mexico City: Formation of secondary organic aerosol, Geophys. Res. Lett. 2007, 34, L19807. [Google Scholar] [CrossRef] [Green Version]
  23. Washenfelder, R.; Young, C.; Brown, S.; Angevine, W.; Atlas, E.; Blake, D.; Bon, D.; Cubison, M.; de Gouw, J.; Dusanter, S.; et al. The glyoxal budget and its contribution to organic aerosol for Los Angeles, Cali- fornia, during CalNex 2010. J. Geophys. Res. 2011, 116, D00V02. [Google Scholar] [CrossRef] [Green Version]
  24. Guo, Y.; Wang, S.; Zhu, J.; Zhang, R.; Gao, S.; Saiz-Lopez, A.; Zhou, B. Atmospheric formaldehyde, glyoxal and their relations to ozone pollution under low- and high-NOx regimes in summertime Shanghai, China. Atmos. Res. 2021, 258, 105635. [Google Scholar] [CrossRef]
  25. Cao, H.; Fu, T.-M.; Zhang, L.; Henze, D.K.; Miller, C.C.; Lerot, C.; Abad, G.G.; De Smedt, I.; Zhang, Q.; van Roozendael, M.; et al. Adjoint inversion of Chinese non-methane volatile organic compound emissions using space-based observations of formaldehyde and glyoxal. Atmos. Chem. Phys. 2018, 18, 15017–15046. [Google Scholar] [CrossRef] [Green Version]
  26. Gratsea, M.; Vrekoussis, M.; Richter, A.; Wittrock, F.; Schönhardt, A.; Burrows, J.; Kazadzis, S.; Mihalopoulos, N.; Gerasopoulos, E. Slant column MAX-DOAS measurements of nitrogen dioxide, formaldehyde, glyoxal and oxygen dimer in the urban environment of Athens. Atmos. Environ. 2016, 135, 118–131. [Google Scholar] [CrossRef]
  27. Chen, Y.; Su, W.; Xing, C.; Yin, H.; Lin, H.; Zhang, C.; Liu, H.; Hu, Q.; Liu, C. Kilometer-level glyoxal retrieval via satellite for anthropogenic volatile organic compound emission source and secondary organic aerosol formation identification. Remote Sens. Environ. 2022, 270, 112852. [Google Scholar] [CrossRef]
  28. Wu, S.; Tang, G.; Wang, Y.; Yang, Y.; Yao, D.; Zhao, W.; Gao, W.; Sun, J.; Wang, Y. Vertically decreased VOC concentration and reactivity in the planetary boundary layer in winter over the North China Plain. Atmos. Res. 2020, 240, 104930. [Google Scholar] [CrossRef]
  29. Wu, S.; Tang, G.; Wang, Y.; Mai, R.; Yao, D.; Kang, Y.; Wang, Q.; Wang, Y. Vertical evolution of boundary layer VOCs in summer over the North China Plain and differences between winter and summer. Adv. Atmos. Sci. 2021, 38, 1165–1176. [Google Scholar] [CrossRef]
  30. Mo, Z.; Huang, S.; Yuan, B.; Pei, C.; Song, Q.; Qi, J.; Wang, M.; Wang, B.; Wang, C.; Shao, M. Tower-based measurements of NMHCs and OVOCs in the Pearl River Delta: Vertical distribution, source analysis and chemical reactivity. Environ. Pollut. 2022, 292, 118454. [Google Scholar] [CrossRef]
  31. Tang, G.; Chen, X.; Li, X.; Wang, Y.; Yang, Y.; Wang, Y.; Gao, W.; Wang, Y.; Tao, M.; Wang, Y. Decreased gaseous carbonyls in the North China Plain from 2004 to 2017 and future control measures. Atmos. Environ. 2019, 218, 117015. [Google Scholar] [CrossRef]
  32. Majchrzak, T.; Wojnowski, W.; Lubinska-Szczygeł, M.; Różańska, A.; Namieśnik, J.; Dymerski, T. PTR-MS and GC-MS as complementary techniques for analysis of volatiles: A tutorial review. Anal. Chim. Acta 2018, 1035, 1–13. [Google Scholar] [CrossRef] [PubMed]
  33. Cui, L.; Zhang, Z.; Huang, Y.; Lee, S.; Blake, D.; Ho, K.; Wang, B.; Gao, Y.; Wang, X.; Louie, P. Measuring OVOCs and VOCs by PTR-MS in an urban roadside microenvironment of Hong Kong: Relative humidity and temperature dependence, and field intercomparisons. Atmos. Meas. Tech. 2016, 9, 5763–5779. [Google Scholar] [CrossRef] [Green Version]
  34. Huang, X.F.; Zhang, B.; Xia, S.Y.; Han, Y.; Wang, C.; Yu, G.H.; Feng, N. Sources of oxygenated volatile organic compounds (OVOCs) in urban atmospheres in North and South China. Environ. Pollut. 2020, 261, 114152. [Google Scholar] [CrossRef] [PubMed]
  35. Wang, Y.; Wang, Y.; Tang, G.; Yang, Y.; Li, X.; Yao, D.; Wu, S.; Kang, Y.; Wang, M.; Wang, Y. High gaseous carbonyl concentrations in the upper boundary layer in Shijiazhuang, China. Sci. Total Environ. 2021, 799, 149438. [Google Scholar] [CrossRef]
  36. Han, Y.; Huang, X.; Wang, C.; Zhu, B.; He, L. Characterizing oxygenated volatile organic compounds and their sources in rural atmospheres in China. J. Environ. Sci. 2019, 81, 148–155. [Google Scholar] [CrossRef]
  37. Yao, D.; Tang, G.; Wang, Y.; Yang, Y.; Wang, L.; Chen, T.; He, H.; Wang, Y. Significant contribution of spring northwest transport to volatile organic compounds in Beijing. J. Environ. Sci. 2021, 104, 169–181. [Google Scholar] [CrossRef]
  38. Yuan, B.; Koss, A.R.; Warneke, C.; Coggon, M.; Sekimoto, K.; de Gouw, J.A. Proton-transfer-reaction mass spectrometry: Applications in atmospheric sciences. Chem. Rev. 2017, 117, 13187–13229. [Google Scholar] [CrossRef]
  39. Liu, C.; Xing, C.; Hu, Q.; Li, Q.; Liu, H.; Hong, Q.; Tan, W.; Ji, X.; Lin, H.; Lu, C.; et al. Ground-based hyperspectral stereoscopic remote sensing network: A promising strategy to learn coordinated control of O3 and PM2.5 over China. Engineering 2021, 19, 71–83. [Google Scholar] [CrossRef]
  40. Kang, Y.; Tang, G.; Li, Q.; Liu, B.; Cao, J.; Hu, Q.; Wang, Y. Evaluation and Evolution of MAX-DOAS-observed Vertical NO2 Profiles in Urban Beijing. Adv. Atmos. Sci. 2021, 38, 1188–1196. [Google Scholar] [CrossRef]
  41. Warneke, C.; Veres, P.; Holloway, J.S.; Stutz, J.; Tsai, C.; Alvarez, S.; Alvarez, S.; Rappenglueck, B.; Fehsenfeld, C.; Graus, M.; et al. Airborne formaldehyde measurements using PTR-MS: Calibration, humidity dependence, inter-comparison and initial results. Atmos. Meas. Tech. 2011, 4, 2345–2358. [Google Scholar] [CrossRef] [Green Version]
  42. Chance, K.; Kurucz, R.L. An improved high-resolution solar reference spectrum for earth’s atmosphere measurements in the ultraviolet, visible, and near infrared. J. Quant. Spectrosc. Radiat. Transf. 2010, 111, 1289–1295. [Google Scholar] [CrossRef]
  43. Stutz, J.; Platt, U. Numerical analysis and estimation of the statistical error of differential optical absorption spectroscopy measurements with least-squares methods. Appl. Opt. 1996, 35, 6041–6053. [Google Scholar] [CrossRef] [PubMed] [Green Version]
  44. Xing, C.; Liu, C.; Hu, Q.; Fu, Q.; Lin, H.; Wang, S.; Su, W.; Wang, W.; Javed, Z.; Liu, J. Identifying the wintertime sources of volatile organic compounds (VOCs) from MAX-DOAS measured formaldehyde and glyoxal in Chongqing, southwest China. Sci. Total Environ. 2020, 715, 136258. [Google Scholar] [CrossRef]
  45. Chameides, W.L.; Fehsenfeld, F.; Rodgers, M.O.; Cardelino, C.; Martinez, J.; Parrish, D.; Lonneman, W.; Lawson, R.; Rasmussen, A.; Zimmerman, P.; et al. Ozone precursor relationships in the ambient atmosphere. J. Geophys. Res. Atmos. 1992, 97, 6037–6055. [Google Scholar] [CrossRef]
  46. Atkinson, R.; Arey, J. Atmospheric degradation of volatile organic compounds. Chem. Rev. 2003, 103, 4605–4638. [Google Scholar] [CrossRef]
  47. Vandaele, A.C.; Hermans, C.; Simon, P.C.; Carleer, M.; Colin, R.; Fally, S.; Mérienne, F.; Jenouvrier, A.; Coquart, B. Measurements of the NO2 absorption cross-section from 42 000 cm−1 to 10 000 cm−1 (238–1000 nm) at 220 K and 294 K. J. Quant. Spectrosc. Radiat. Transf. 1998, 59, 171–184. [Google Scholar] [CrossRef] [Green Version]
  48. Serdyuchenko, A.; Gorshelev, V.; Weber, M.; Chehade, W.; Burrows, J.P. High spectral resolution ozone absorption cross-sections—Part 2: Temperature dependence. Atmos. Meas. Tech. 2014, 7, 625–636. [Google Scholar] [CrossRef] [Green Version]
  49. Thalman, R.; Volkamer, R. Temperature dependent absorption cross-sections of O2-O2 collision pairs between 340 and 630 nm and at atmospherically relevant pressure. Phys. Chem. Chem. Phys. 2013, 15, 15371–15381. [Google Scholar] [CrossRef]
  50. Meller, R.; Moortgat, G.K. Temperature dependence of the absorption cross sections of formaldehyde between 223 and 323 K in the wavelength range 225–375 nm. J. Geophys. Res. Atmos. 2000, 105, 7089–7101. [Google Scholar] [CrossRef]
  51. Volkamer, R.; Spietz, P.; Burrows, J.; Platt, U. High-resolution absorption cross-section of glyoxal in the UV–vis and IR spectral ranges. J. Photochem. Photobiol. A Chem. 2005, 172, 35–46. [Google Scholar] [CrossRef]
  52. Fleischmann, O.C.; Hartmann, M.; Burrows, J.P.; Orphal, J. New ultraviolet absorption cross-sections of BrO at atmospheric temperatures measured by time-windowing Fourier transform spectroscopy. J. Photochem. Photobiol. A Chem. 2004, 168, 117–132. [Google Scholar] [CrossRef]
  53. Rothman, L.S.; Gordon, I.E.; Barbe, A.; Benner, D.C.; Bernath, P.F.; Birk, M.; Boudon, V.; Brown, L.R.; Campargue, A.; Champion, J.-P.; et al. The HITRAN 2008 molecular spectroscopic database. J. Quant. Spectrosc. Radiat. Transf. 2009, 110, 533–572. [Google Scholar] [CrossRef] [Green Version]
  54. Chance, K.V.; Spurr, R.J.D. Ring effect studies: Rayleigh scattering, including molecular parameters for rotational Raman scattering, and the Fraunhofer spectrum. Appl. Opt. 1997, 36, 5224–5230. [Google Scholar] [CrossRef] [Green Version]
  55. Aliwell, S.R.; Van Roozendael, M.; Johnston, P.V.; Richter, A.; Wagner, T.; Arlander, D.W.; Burrows, J.P.; Fish, D.J.; Jones, R.L.; Tørnkvist, K.K.; et al. Analysis for BrO in zenith-sky spectra: An intercomparison exercise for analysis improvement. J. Geophys. Res. Atmos. 2002, 107, ACH 10-1–ACH 10-20. [Google Scholar] [CrossRef]
Figure 1. Correlation analysis of MAX-DOAS and in situ observations: (a) NO2; (b) HCHO.
Remotesensing 15 01982 g001
Figure 2. Correlations between VCD and TVOC reactivity in different seasons: (a) HCHO; (b) CHOCHO.
Remotesensing 15 01982 g002
Figure 3. (a) Correlation analysis between HCHO VCD and TVOC reactivity; (b) slope-variability with different i values.
Remotesensing 15 01982 g003
Figure 4. Correlations of Mix and TVOC EPC.
Remotesensing 15 01982 g004
Figure 5. Distribution of ozone formation sensitivity: (a) determined by Rfn and (b) determined by Rmn.
Remotesensing 15 01982 g005
Disclaimer/Publisher’s Note: The statements, opinions and data contained in all publications are solely those of the individual author(s) and contributor(s) and not of MDPI and/or the editor(s). MDPI and/or the editor(s) disclaim responsibility for any injury to people or property resulting from any ideas, methods, instructions or products referred to in the content.