Article

A Remote Sensing and GIS Analysis of Rockfall Distributions from the 5 July 2019 Ridgecrest (MW7.1) and 24 June 2020 Owens Lake (MW5.8) Earthquakes

by
Louis A. Scuderi
*,
Evans A. Onyango
and
Timothy Nagle-McNaughton
Department of Earth and Planetary Sciences, University of New Mexico, Albuquerque, NM 87131, USA
*
Author to whom correspondence should be addressed.
Remote Sens. 2023, 15(8), 1962; https://doi.org/10.3390/rs15081962
Submission received: 3 March 2023 / Revised: 28 March 2023 / Accepted: 3 April 2023 / Published: 7 April 2023

Abstract

:
We examine the coseismic influence of the 5 July 2019, MW7.1 Ridgecrest and the 24 June 2020 MW5.8 Owens Lake earthquakes on rockfall distributions in two undisturbed high-altitude areas of the southern Sierra Nevada Mountains, California, USA. These events occurred within the geologically recent (<2 Mya) Walker Lane/eastern California shear zone. While both study areas are characterized as plutonic, the Owens Lake event largely affected terrain that was formerly glaciated and oversteepened while the Ridgecrest event affected non-glaciated terrain. Our inventory of rockfall locations was derived from analysis of Sentinel-2 images acquired just prior to and immediately after the events. This difference mapping approach using readily-available Sentinel-2 imagery allows for rapid rockfall and landslide mapping. GIS analysis shows that even though the total area assessed for both earthquakes was similar (~1500 km2), the significantly lower magnitude Owens Lake event produced nearly twice as many (102) mappable rockslides as the significantly stronger Ridgecrest event (58), a difference likely due to slope oversteepening in the formerly glaciated area. Significant seismic amplification by topography and reactivation of preexisting failures was apparent for both areas. Inclusion of these factors may improve failure predictions and rockfall probability estimation.

Graphical Abstract

1. Introduction

Rockfalls, driven by in situ processes such as rainfall, snow melt, freeze-thaw, weathering, and local or distant coseismic forcing from earthquakes [1,2], are a widespread phenomenon in the world’s mountain ranges and are an important geomorphic process driving the evolution of mountainous landscapes [3,4]. Driving factors weaken the rock mass and over time produce events where individual blocks or small rock masses detach from steep slopes with little or no shear displacement occurring [5,6,7]. These rockfall and rockslide slope failures from near-vertical cliffs have been suggested to account for as much as 5–50% of erosion in mountain environments [3,8,9,10,11] and are important factors in landscape evolution [12,13,14]. In some regions, coseismic rockfalls may supply a major portion of local sediment loads [10] and their contribution may be especially enhanced in tectonically active areas [15,16].
Crustal stretching and deformation prior to seismic activity may also affect local geomorphology [17]. Earthquake sequences related to the crustal rotation, possibly accompanied by the presence of fluids around a source region [18,19], may lead to pre-event production of subsurface stress fields [20] and surface deformation that eventually results in rockfalls.
Rockfall inventories are valuable tools for improving understanding of coseismic events [21]. However, high-resolution regional scale rockfall inventories from individual events are scarce and approaches that can rapidly produce inventories of these failures are lacking, especially so in remote areas. Furthermore, these inventories are critical to understanding how episodic, large-scale events accumulate into long-term erosion rates [22] and their relationship to near-real-time maps of ground motion and shaking intensity [23].
The objective of this paper is to document rockslides produced by the eastern California Ridgecrest MW7.1 (5 July 2019) and Owens Lake MW5.8 (24 June 2020) earthquakes utilizing a low-cost Sentinel-2 satellite image differencing approach that can be rapidly applied within days of an event. For our contrasting study areas, this approach allows an assessment of underlying geomorphic forcing from prior glacial activity and slope oversteepening as well as the influence of topographic amplification of the seismic signal on rockfall distributions. Further, the study uses these distributions to evaluate ShakeMap [23] near-real-time maps of ground motion and shaking intensity to assess whether this tool may be useful in predicting potential rockfall and rockslide areas. While shaking from these two earthquakes was experienced over a wide area, we confine our rockfall analysis in this paper to the batholith regions of Sierra Nevada.

1.1. Study Area

The study covers two separate subareas (Figure 1); a northern site, hereafter termed the High Sierra site (HS) and a southern site hereafter termed the Low Sierra site (LS) (site names refer to their relative elevation). Each site covers an area of ~1500 km2 and both expose Mesozoic granitic rocks of California’s Sierra Nevada mountains [24,25]. The sites straddle the main Sierra Nevada crest and encompass parts of its high relief (~3000 m) eastern escarpment. They also fall within, or on the border of, the Walker Lane/eastern California Shear Zone (WL/ECSZ), an area that appears to be a geologically recent (<2 Mya) response to reorganization of faulting in California. An uplift of ~0.2–0.3 mm/year along this steep NNW striking eastern escarpment of the Sierra Nevada is controlled by the Sierra Nevada frontal fault [26]. This fault zone, along with significant activity on the adjacent Owens Valley and Lone Pine faults, is responsible for the continuing rise of the Sierra Nevada mountains [26].
The region is organized into three major structural elements [27] (Figure 2); (1) high, coherent mountain blocks that form the eastern and western boundaries (the Argus and Inyo blocks on the east and the Sierran Block on the west); (2) the high-standing Coso extended mountain block in the center of the region comprised of Mesozoic and older bedrock largely covered by Quaternary volcanic rocks, and (3) deep structural basins (Indian Wells, Rose and Owens basins). The large bedrock blocks that make up the deep structural basins have been faulted down from the surrounding blocks [27]. The Sierran Block, composed primarily of batholitic granites and granodiorites, is traditionally treated as a single unit even though it is broken by several significant faults [27].
The northern HS site contains the highest elevations with peaks ranging from ~3000 to 4400 m above sea level. On the east, elevations rise rapidly from the Owens Valley (~1100 m) to the Sierra Nevada crest at Mount Whitney (4421 m) over a distance of ~25 km. The eastern escarpment of the HS is characterized by many steep fluvially formed drainages above large alluvial fans in the lower elevations grading into glacially eroded basins in their upper reaches above ~3000 m. To the west of the main Sierra crest, the HS was heavily glaciated [28].
Currently the HS is dominated by strong seasonality with a significant snow pack and strong freeze-thaw cycling in the winter. While a large portion of the HS is dominated by conifer forests, a significant portion is above current treeline (~3600 m) [29]. This portion of the HS study area is characterized by bare bedrock surfaces, oversteepened slopes and debris derived from rockfall events that occurred after the late-Pleistocene Tioga (14–28 ka) and Recess Peak (13 ka) glacial stages [29,30].
The southern LS site, while only displaying ~50% of the magnitude of total relief of the HS, is characterized by steep fluvial canyons to the east and lower relief surfaces to the west of the main Sierra Nevada crest. Uplift along this portion of the Sierra Nevada is also controlled by the Sierra Nevada frontal fault [26]. The Sierra Nevada escarpment to the west of the Ridgecrest rises rapidly from 800 m at the western edge of Indian Wells Valley to 2576 m at Owens Peak (35.74°N, 117.99°W) over a distance of ~10 km. Over 1000 m of this elevation difference occurs over the last 3 km of this transect. To the north of Owens Peak, the main crest at Sawtooth Peak (35.82°N, 117.99°W) rises to 2444 m and displays similarly high relief. The eastern watershed of the region from north to south is composed of three main drainages: Sand Canyon, Grapevine Canyon, and Indian Wells Canyon. In contrast to the HS, the LS typically experiences significantly warmer temperatures in the summer and a light snow cover most winters. While the upper elevations of the LS are characterized by low-density conifer forest, most of the remaining LS area is either bare bedrock or has a sparse brush cover. As in the HS, the LS shows evidence of a large number of rockfalls with a significant number of talus cones and steep debris chutes.
Epicenters for both earthquake events studied are offset to the east of the Sierra Nevada batholith (~25 and 20 km to the east for the HS and LS, respectively). However, the smaller northern Owens Lake event affected high altitude oversteepened formerly-glaciated terrain, while the significantly larger southern Ridgecrest event primarily affected unglaciated terrain. The higher elevations of the HS were heavily glaciated during the Pleistocene, resulting in oversteepened landforms and the production of numerous cliff faces as glaciers retreated [28]. Even though the LS was not glaciated during the Pleistocene, because of its high relief and significant fluvial dissection there are a significant number of steep near-vertical faces in the granodiorite bedrock.

1.2. Historic Rockfall Events in the Sierra Nevada

Earthquakes in eastern California within the Walker Lane/eastern California Shear Zone (WL/ECSZ) have a long history of producing significant rockfall events. The 26 March 1872 7.8 MW Lone Pine quake had an estimated total rupture length between 90 and 130 km [31,32] with an average right-lateral slip of 6 m and a total oblique slip of 6.1 m [31]. This event, with an epicenter ~20 km north of the 2020 Owens Lake shock and felt across all of California [32], is known to have produced large rockfalls as far away as Yosemite Valley (~175 km). This event, along with earlier undocumented large earthquakes, may be responsible, as postulated by Matthes [8], for many of the pre-historic rockfall features across the range.
John Muir observed a rockfall event with an estimated volume ~20,000 m3 [33,34] in Yosemite Valley at the time of the 1872 Lone Pine earthquake. Other recent earthquakes have triggered at least 20 historic rockfalls in Yosemite Valley [35,36,37] and four events in a sequence near Mammoth Lakes triggered thousands of rockfalls and rockslides from the 25th to the 27th May in 1980 [38,39].
Exposure dating of boulders in a rock avalanche in Yosemite Valley suggests a massive failure at ~3.6 ± 0.2 ka [4] corresponding to a ca.~3.3–3.8 ka estimated late Holocene rupture of the Owens Valley fault and/or White Mountain fault of ≥MW7.0 [40,41,42]. Additional OSL dating revealed an earlier event of similar magnitude between 6.0 and 8.2 ka [40]. These earlier ca. 3.6 and ca. 7.0 ka events each had ~4 m of offset while the 1872 rupture offset was ~4.9 m. A recent estimate [43] of the total extension rate of 0.7 ± 0.2 mm/year resolved in the N72°E direction across all faults in the Owens Lake area suggests that this extension has been constant for at least 100 years.
This suggests a recurrence interval of great earthquakes on this system of between ~3000 and 4000 years [4]. However, lichenometric dating of coseismic deposits in southern Sierra Nevada [44] captured both the rockfall signal of the 1872 event and a significant rockfall distribution pattern of smaller magnitude earthquake events on timescales as short as 20 years. If correct, the extreme hazard posed by seismically-induced rockfall in the glacially oversteepened slopes of the Sierra Nevada across a range of timescales may be significantly underestimated.
The percentage of rockfall events associated with earthquakes in the Sierra Nevada has been estimated at ~5 to 50% [3,8,9,10,11], however, the record is short and incomplete and information on the signals from more numerous but smaller events is poorly constrained. The estimation of rockfall numbers associated with smaller Sierran events has been shown to have similar magnitude–frequency relationships [7], suggesting that the frequency of large unrecorded events can be estimated by extrapolating the power law obtained for the small-size events, provided the record of the latter is complete [45,46,47,48,49].

1.3. Ridgecrest and Owens Lake Earthquakes

The Ridgecrest and Owens Lake earthquakes, while much smaller than the 1872 Lone Pine event, produced a number of large rockfalls across their shake areas. Mapping these features allows us to quantify the total number of rockfalls from these smaller events, to compare their spatial distribution to estimates made with ShakeMap [50,51] and ultimately to improve our estimate of areas with potential rockfall/landslide hazard. This enhanced knowledge can also allow for the construction of models that can be used to anticipate the impact of future events [52,53,54].
The 5 July 2019 MW7.1 Ridgecrest and 24 June 2020 MW5.8 Owens Lake earthquakes occurred within the southern portion of the WL/ECSZ (Figure 1 and Figure 2, Table 1). Seismograms for both shocks are shown in Figure 3. The WL/ECSZ is a network of primarily northwest-striking strike-slip faults that runs east of the San Andreas Fault system [55,56,57,58,59,60,61,62,63] paralleling the eastern front of California’s Sierra Nevada mountains that is part of a recent (<1.7 Mya) reorganization of faulting in Southern California [62,63].
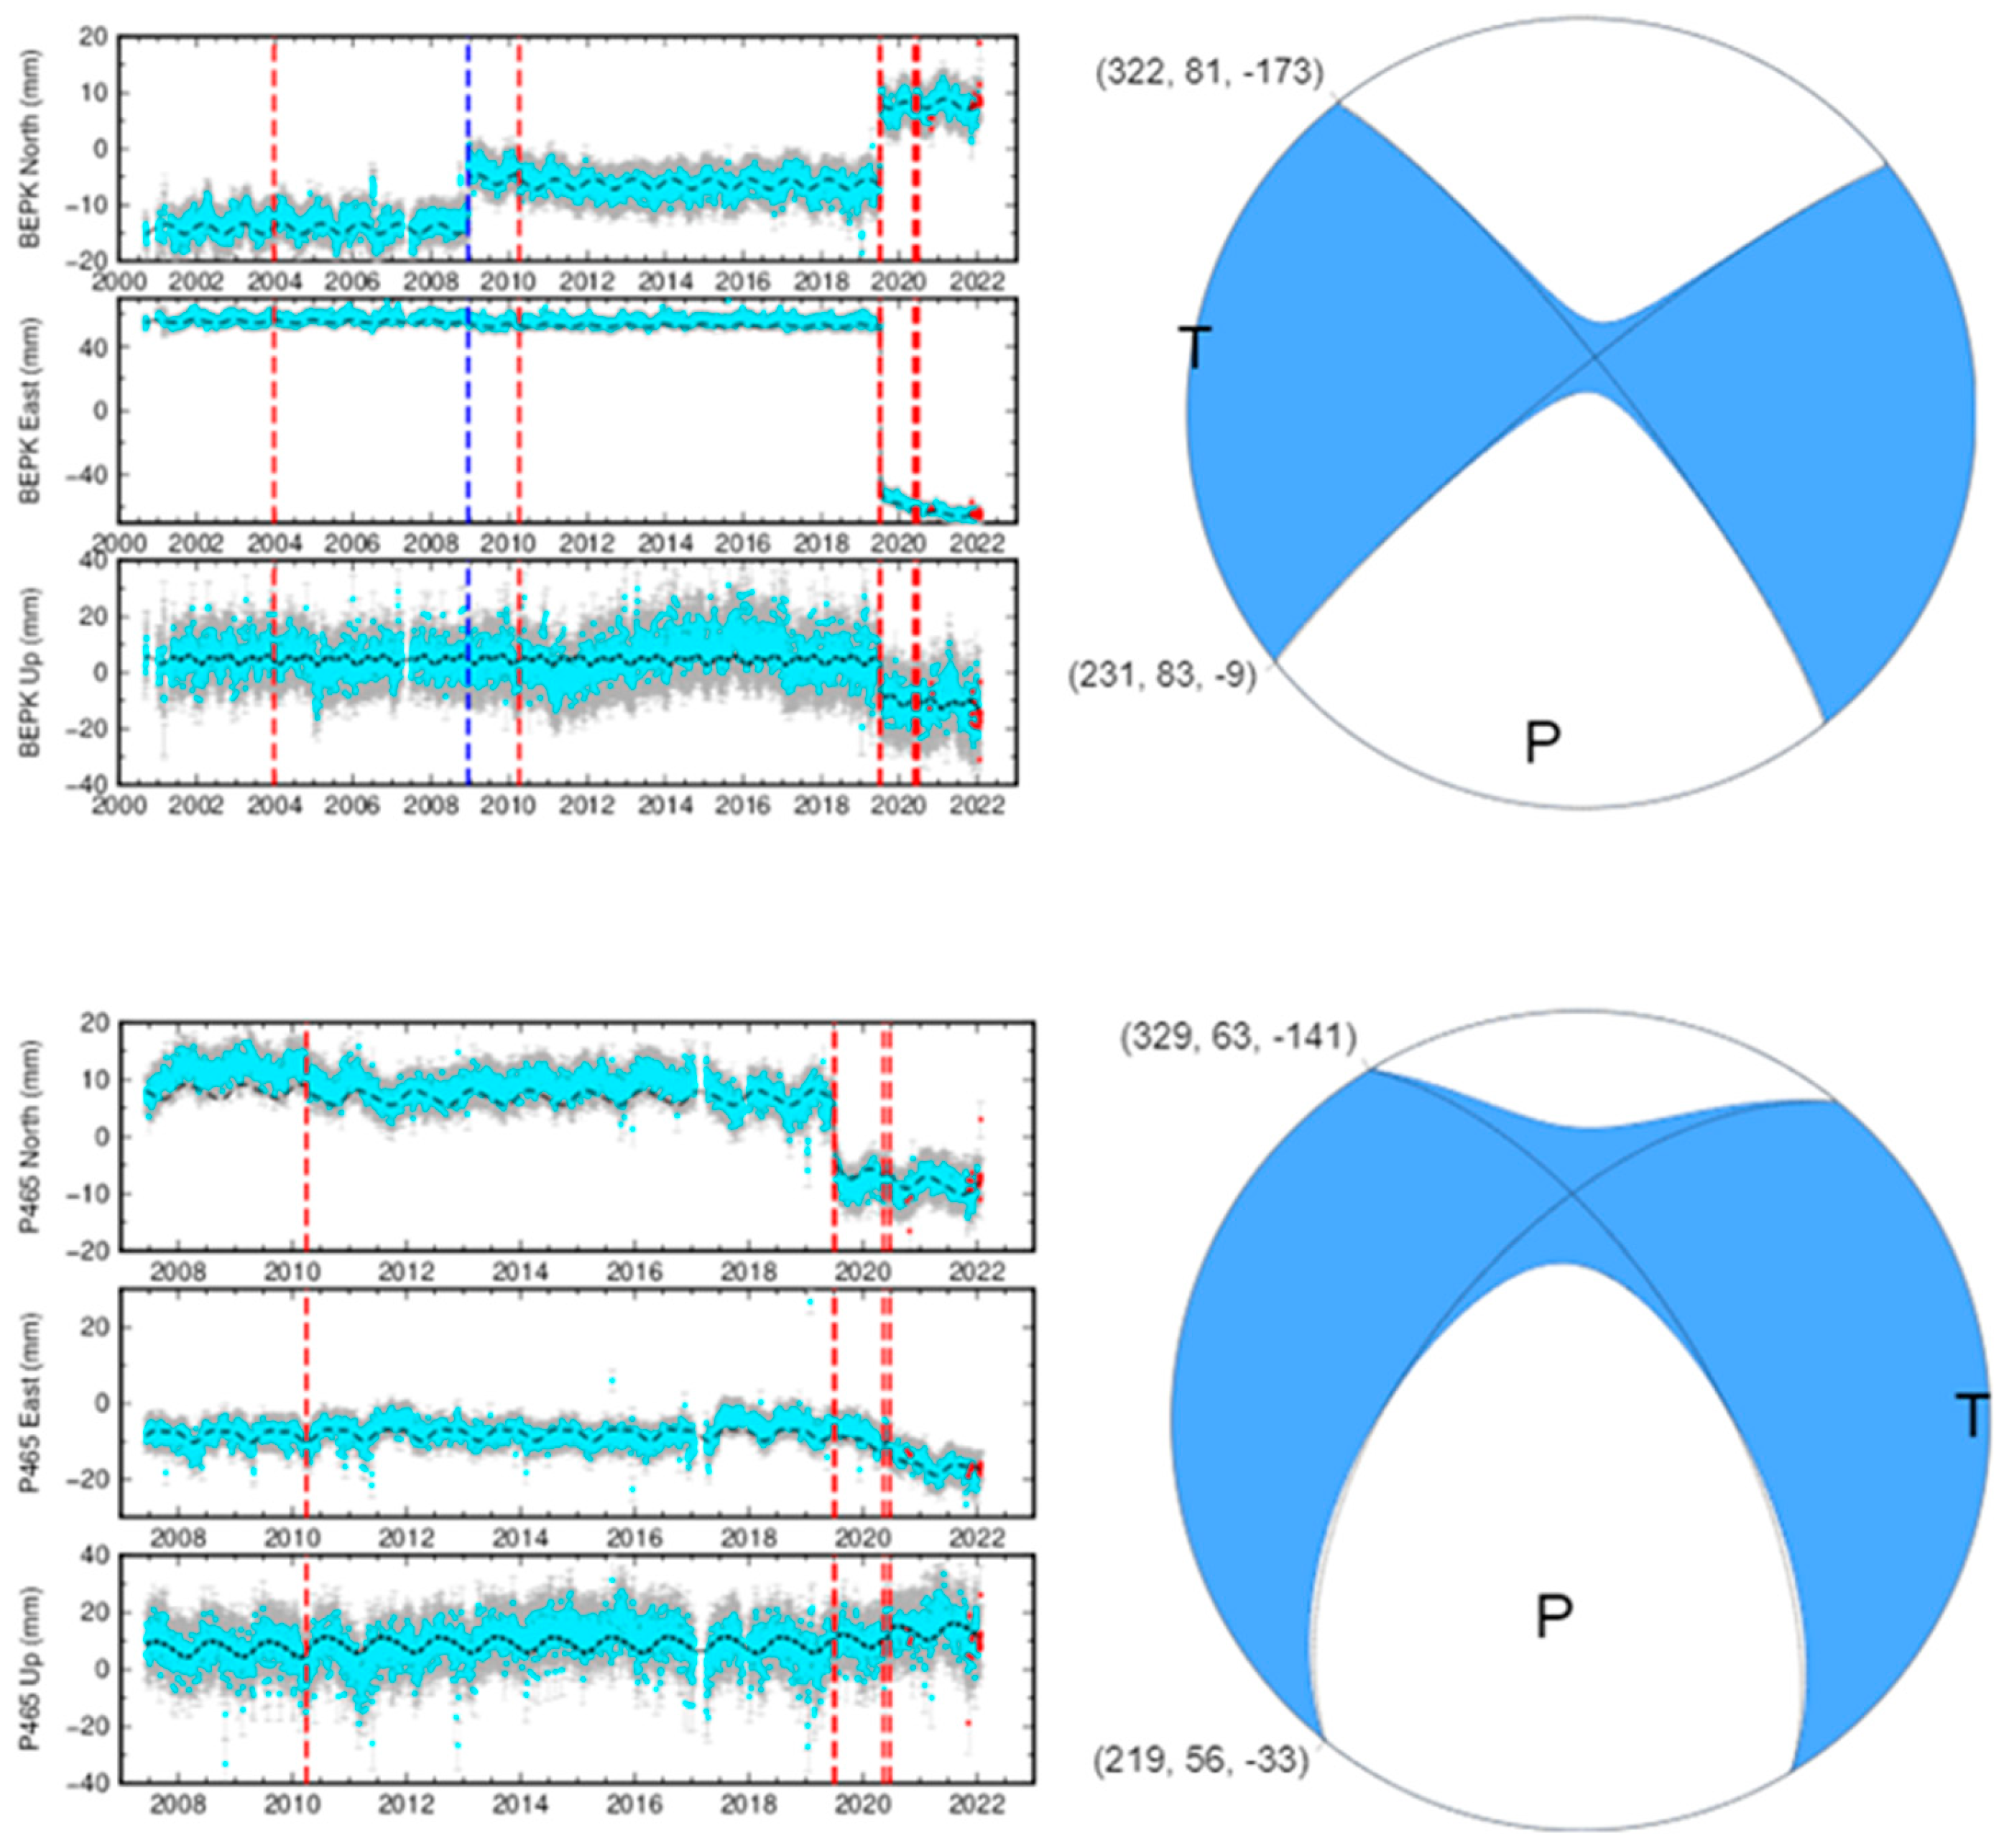
For the Ridgecrest MW7.1 right-lateral strike-slip rupture, the BEPK GPS station (35.8784°N, 118.0741°W, 2471.1 m), located 44.3 km WNW of the epicenter and on the western boundary of the LS study area, recorded north, east and up offsets of 8.21 ± 1.79 mm, −86.01 ± 1.7 mm, and −9.68 ± 6.3 mm, respectively (Figure 4 top). (See [64] for more detail on the measurement protocol for assessing these displacements). For the Owens Lake MW5.8 right-lateral strike-slip rupture, station P465 (36.46684°N, 118.13243°W, 2901.5 m), located 14.6 km W of the epicenter, recorded a north offset of 0.14 ± 0.64 mm, an east offset of −5.21 ± 0.73 mm and a vertical displacement of 0.58 ± 2.1 mm (Figure 4, bottom). We note that this station near the northern study area recorded an order of magnitude larger northward displacement (N −4.54 ± 1.93 mm) but a 40% smaller eastward displacement (−2.16 ± 2.14 mm) during the 5 July 2019 Ridgecrest MW7.1 earthquake with minimal to no rockfall reported from that event in the HS study area.
Free-field peak horizontal ground accelerations of about 133%g were recorded at some sites between the Ridgecrest epicenter and the Sierra Nevada crest (Station DFYI: 35.777°N 117.858°W) with high levels of ground shaking extending over a broad region. In contrast, the Owens Lake earthquake produced a strong motion over a restricted area and only a single station (44015 Lone Pine A: 36.601°N 118.061°W), recording accelerations as high as ~19.3% g.
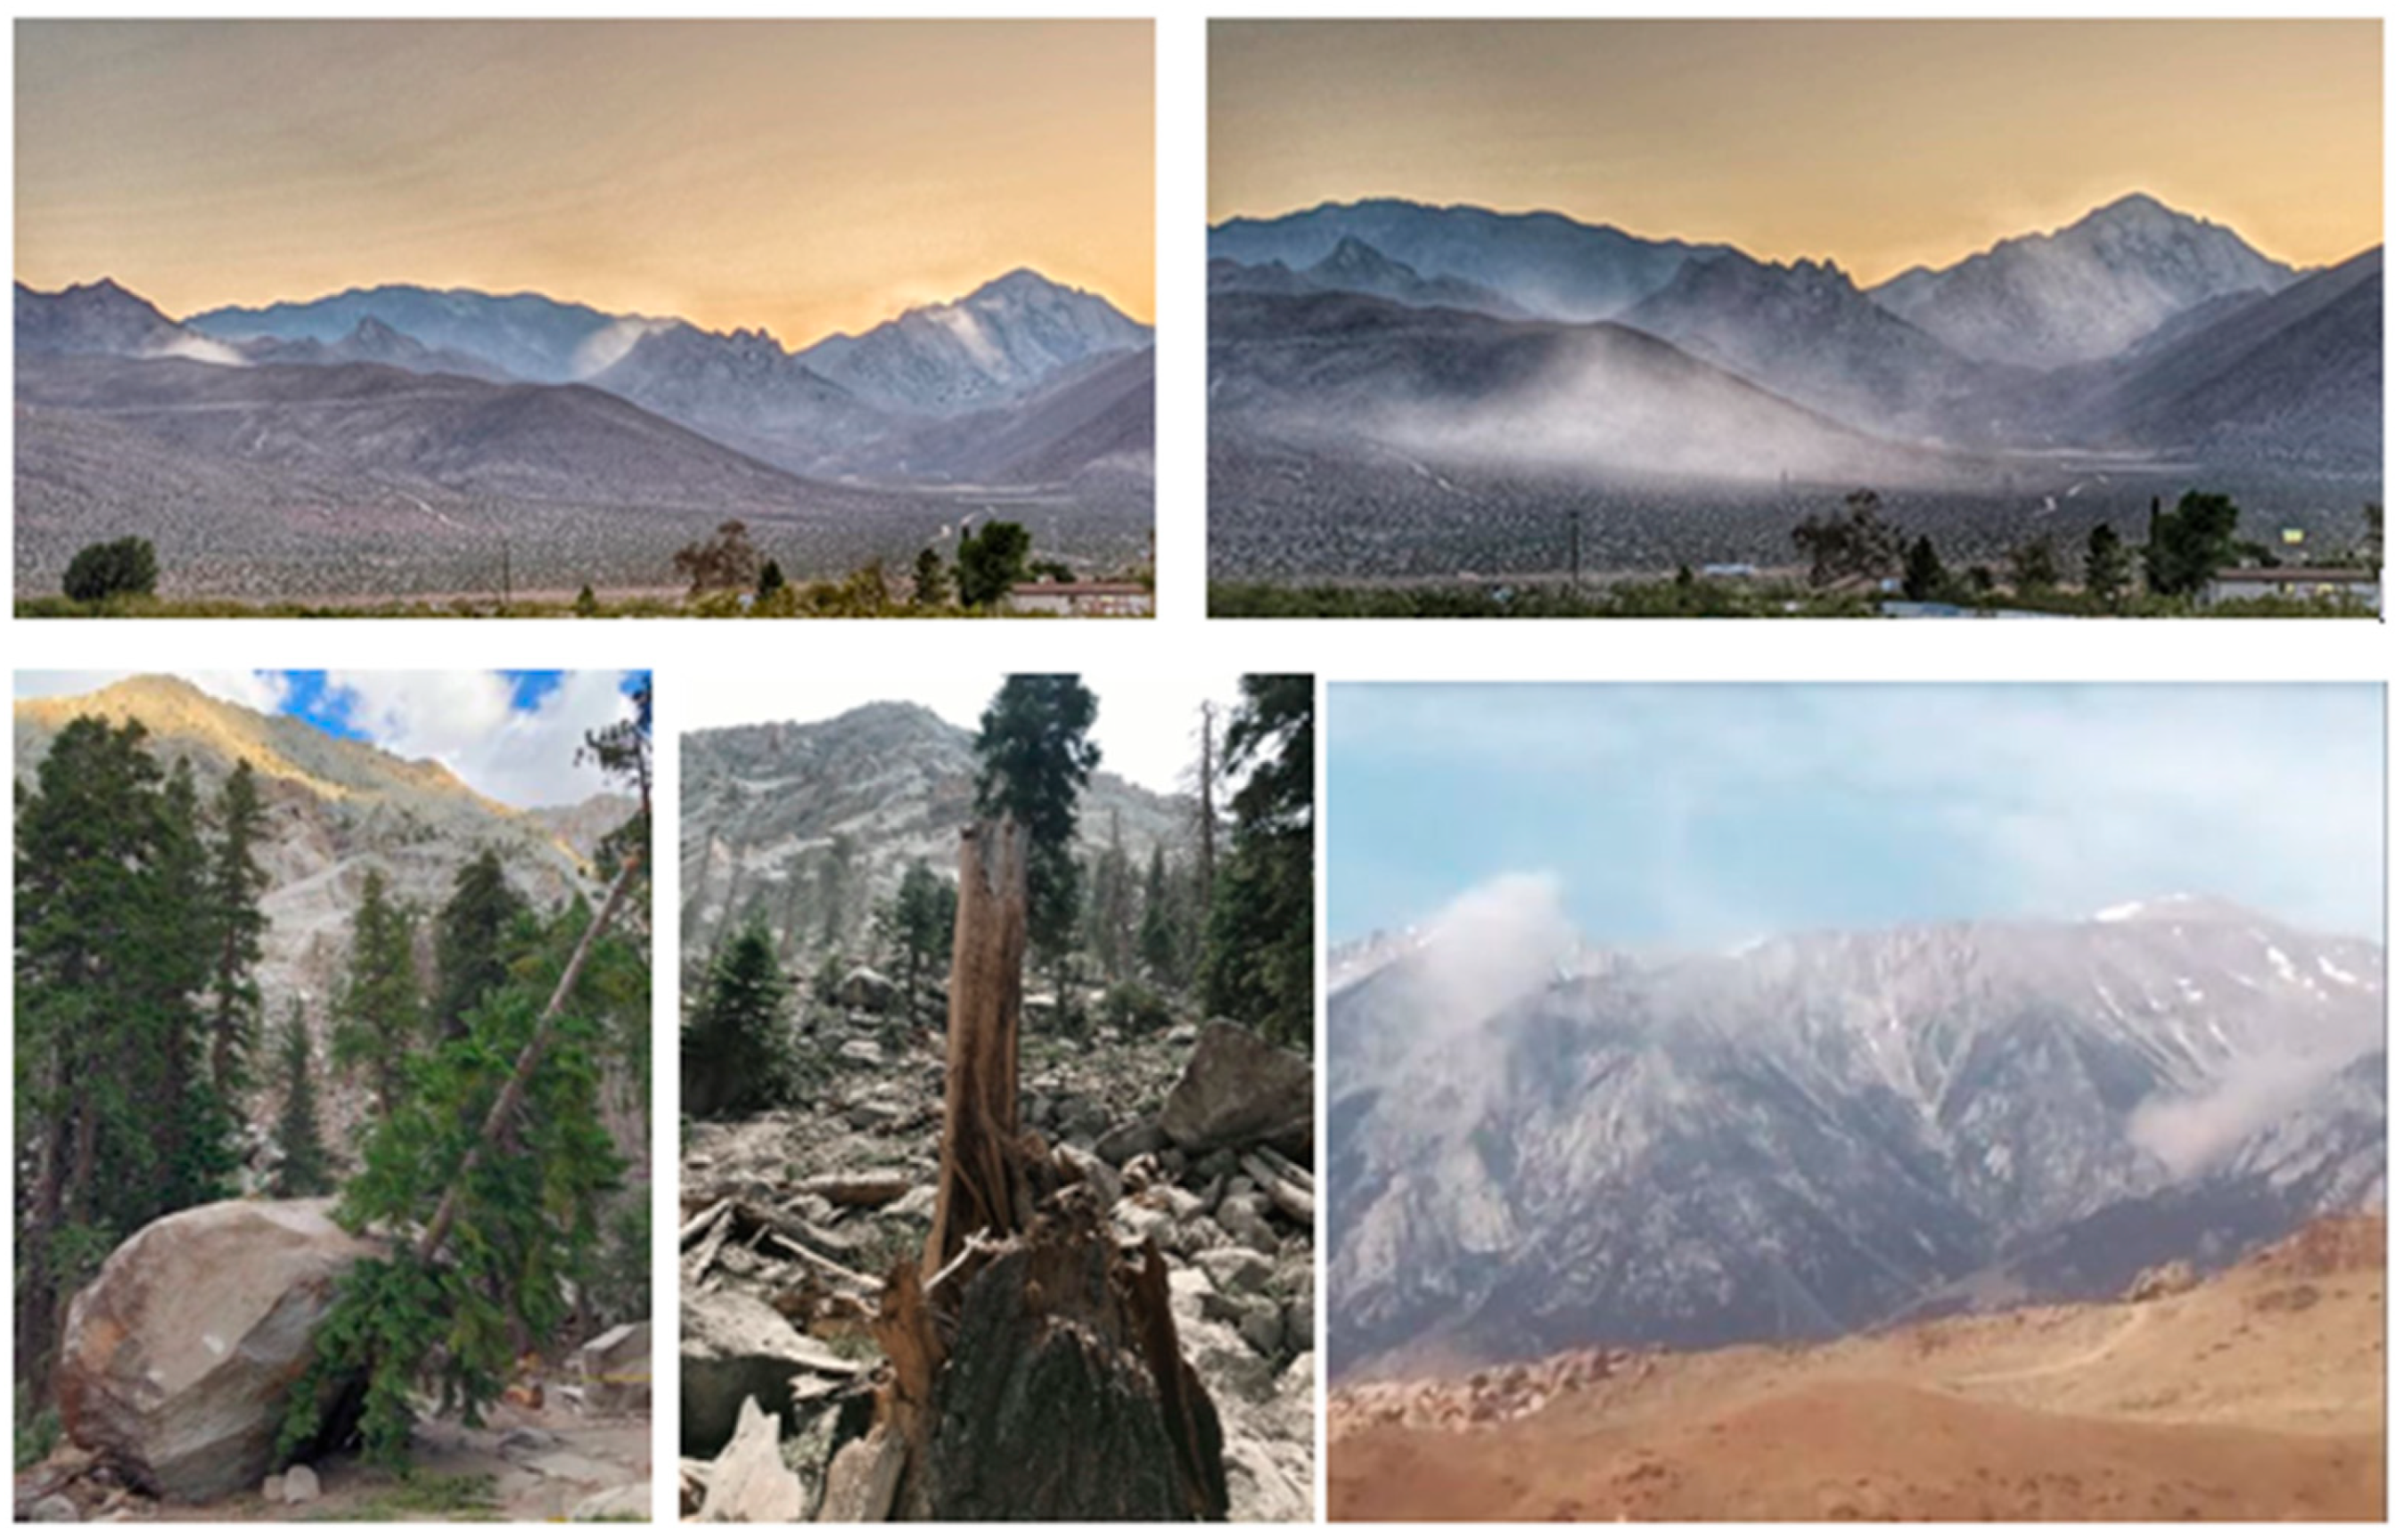
In southern Sierra Nevada, significant coseismic rockfalls associated with the Ridgecrest and Owens Lake earthquakes were visible from the Searles and Owens Valleys, respectively (Figure 5). Dust clouds drifted across the study areas and adjacent lowland areas for several minutes after each event. While neither earthquake resulted in fatalities, several injuries were reported for the Ridgecrest event, and both caused damage to structures and roadways. In the case of the Owens Lake event, coseismic rockfall events closed roads, trails and campgrounds.

2. Materials and Methods

To rapidly map and evaluate the distribution of large rockfalls from these earthquakes with an areal extent >1000 m2, we developed a mapping procedure utilizing easily and rapidly accessible time-differenced Sentinel-2 satellite data. The Copernicus Sentinel-2 satellites (2A and 2B) [65] are in the same sun-synchronous orbit, phased at 180° to each other and orbiting at an altitude 786 km. Imagery is acquired in the descending node at a mean Local Solar Time of ~10:30. Coverage is between 84°N and 56°S with repeat images available every five days at the equator and approximately every two to three days at the study area latitude.
Minor shifting was required before differencing due to slight image registration errors due to misregistration [65], satellite jitter or charge coupled device (CCD) alignment offsets between the different image acquisition dates and satellites [66]. We also note that minor shadowing differences caused by the ~6-day difference between pre- and post-earthquake imagery and snow cover melt off in the later image from the Owens Lake 2020 sequence can produce “false positive” differencing identifications that require subsequent manual assessment and removal. Differencing was completed in ArcMap 10.8.1 [67] using the raster calculator function.
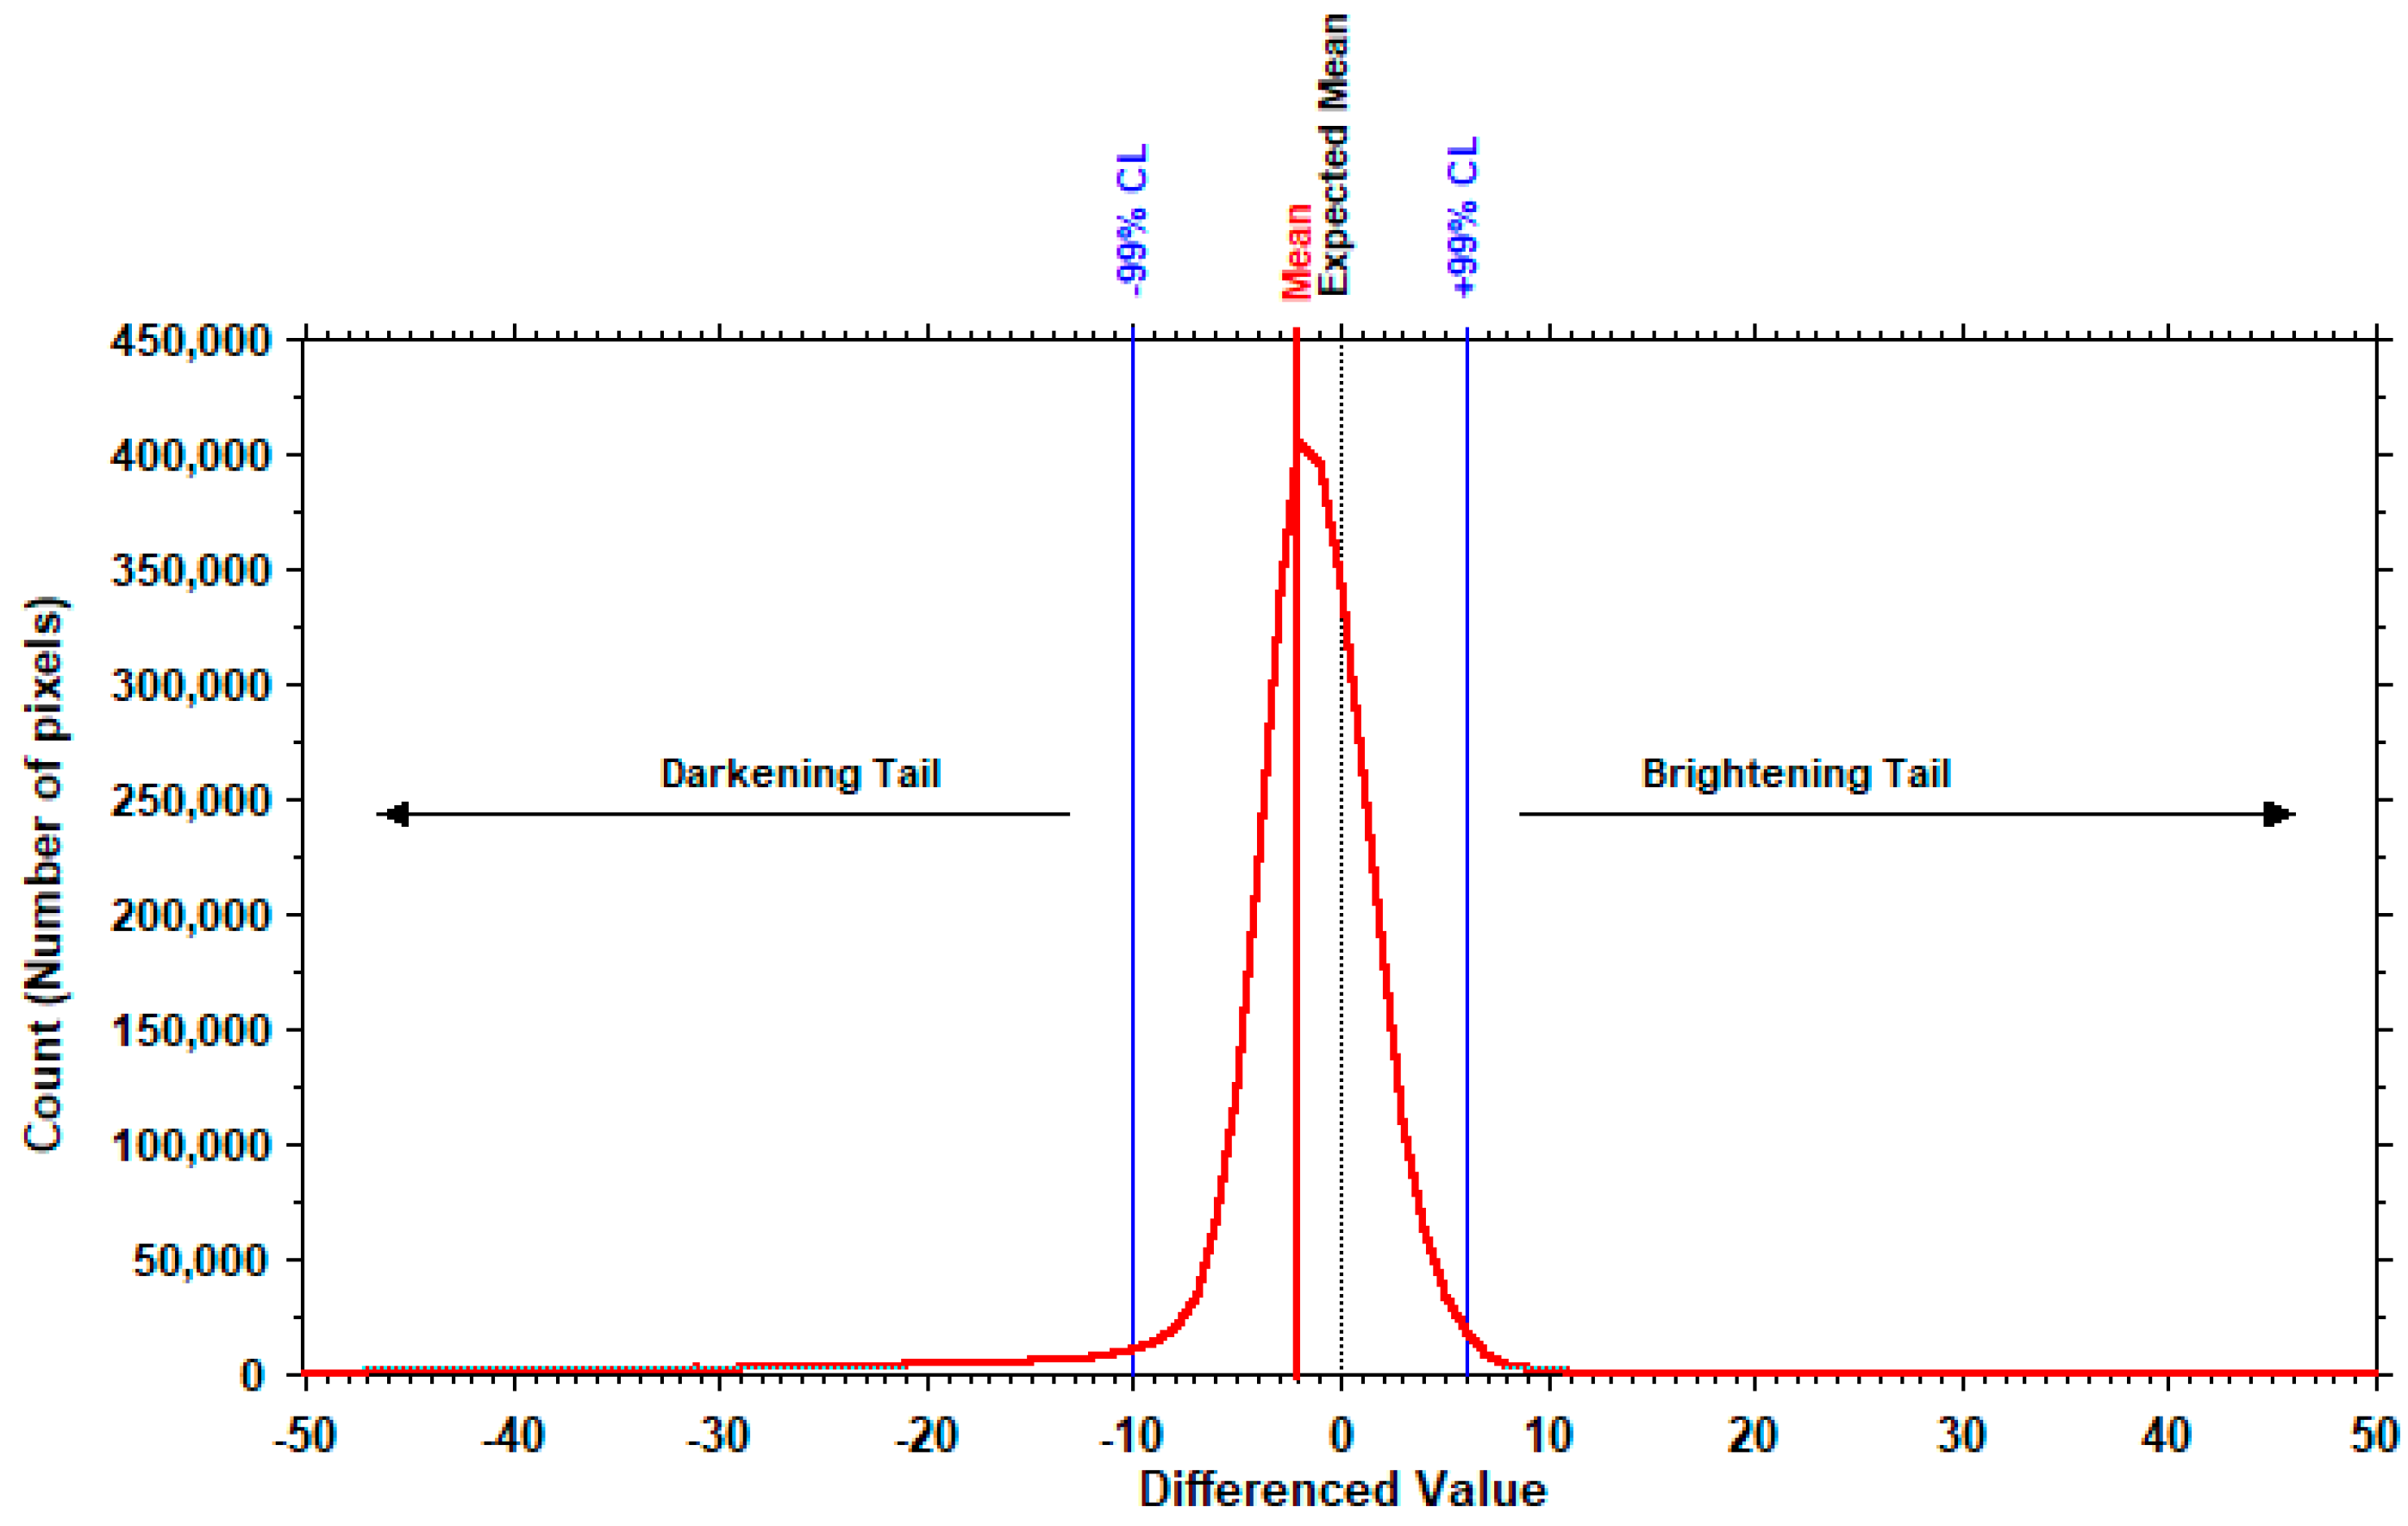
Each resulting differenced image was analyzed both at full image scale and in sub-regions within each area of interest. From the count distribution of the differenced values, we identified brightening and darkening tails (Figure 6). Significant brightening was associated with the exposure of fresh rock material resulting primarily from rockfall events. Significant darkening, especially in the higher elevation regions of the Sierra Nevada, was associated with melting of high albedo snowfields and exposure of relatively darker rock surfaces. In the example shown in Figure 6, taken from a 2.70-million-pixel subset in the higher elevations of the Sierra Nevada surrounding University Peak (centered on 36.747°N, 118.361°W).
We defined the cutoff for possible rockfall locations in the brightening tail of the distribution as difference values that exceed the positive 99% confidence level. Single pixel (100 m2 area) difference values fulfilling these criteria, while possibly small rockfalls, were considered noise and eliminated from further analysis. The remaining pixels were then converted to polygons and the area was computed for each. From this subset of brightening tail locations, we selected polygons with areas of >1000 m2 for further analysis. While smaller areas may contain valid rockfall signals, we believe that the 1000 m2 cutoff provides a pixel area large enough to detect rockfalls with high confidence from Sentinel-2 10 m resolution imagery. This process produced 760 candidate rockfall polygons for the Ridgecrest earthquake study area and 2905 candidate rockfall polygons for the Owens Lake earthquake study area.
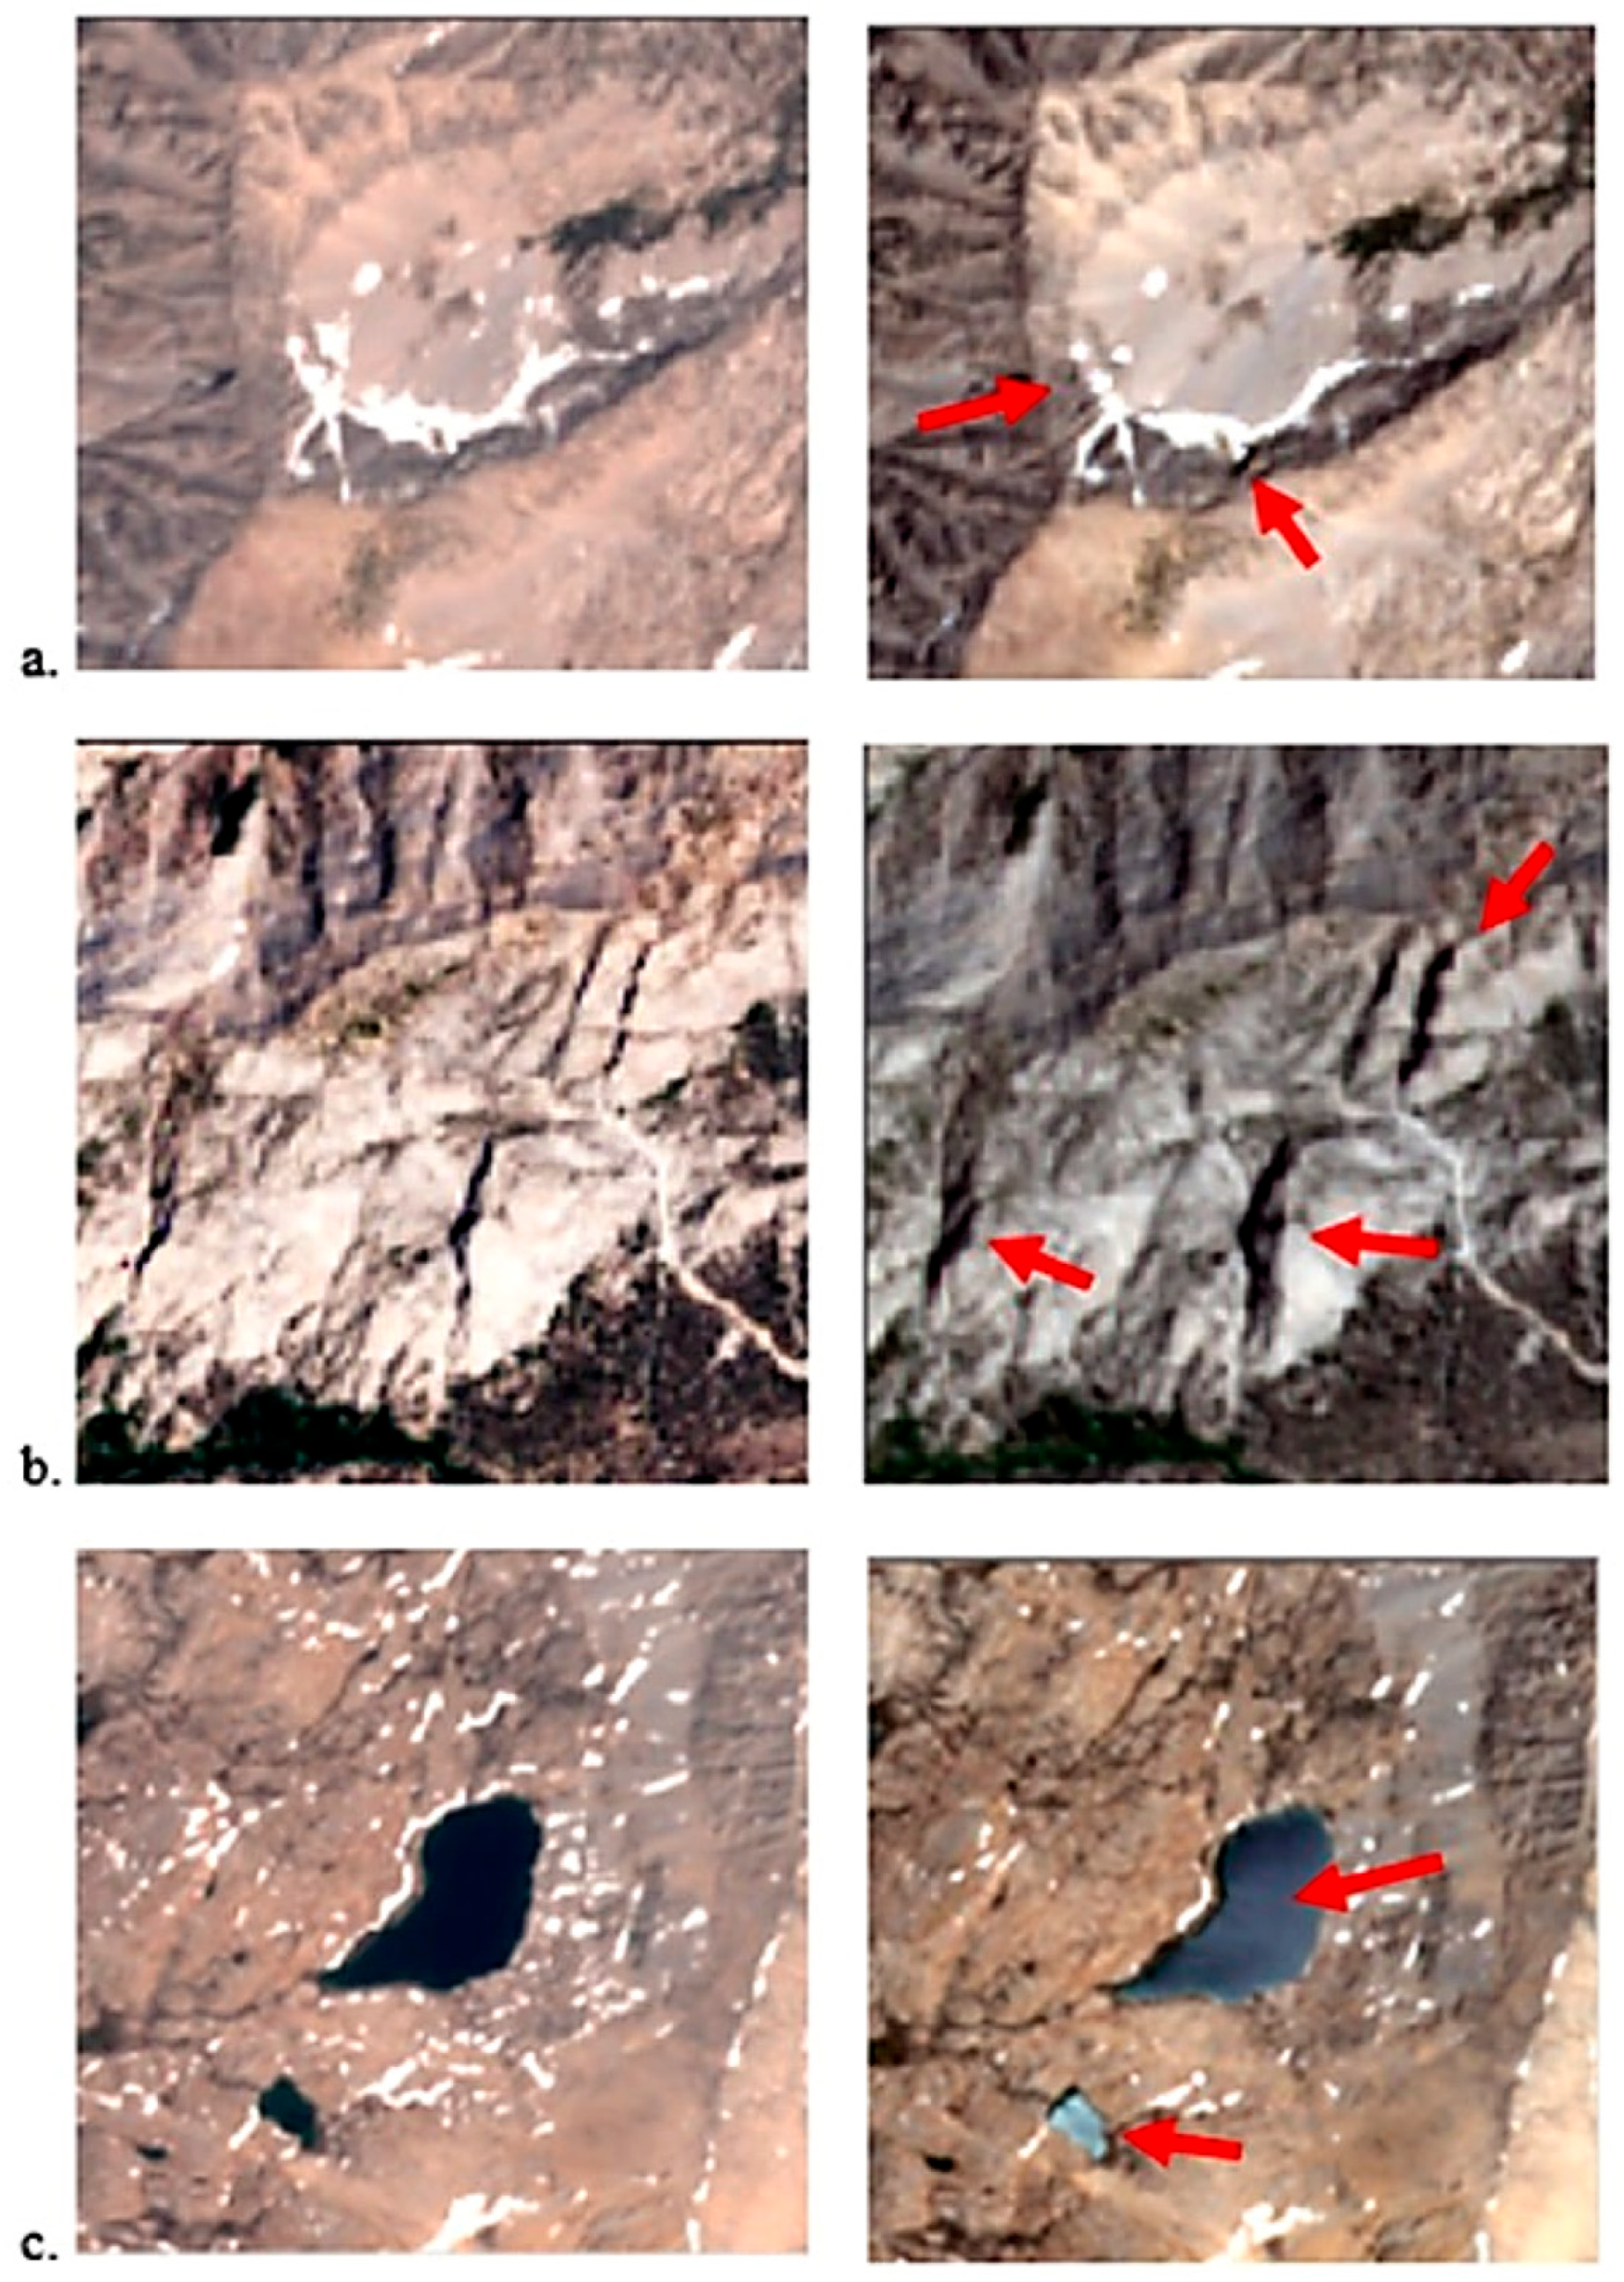
Each of the candidate polygons was visually evaluated for evidence of change. Polygons were eliminated from further consideration if they met any of three criteria (See Figure 7): if the change polygon was (1) at the edge of a snowfield, (2) associated with a change in shadowing, or (3) the result of a change in reflection off a lake surface. Additional polygons in the northern study area were eliminated because of the disappearance of small water bodies that changed a dark water signal to a brighter rock signal or an intermediate brightness wetland signal.
At the end of this process, 58 and 102 polygons remained in the Ridgecrest and Owens Lake study areas, respectively. For each of these remaining polygons, we captured the centroid coordinates and, using the ‘extract multivalues to points’ tool in ArcMap [63], extracted the elevation, slope and aspect of the features from a 10 m resolution digital elevation model of the area [68] for further analysis. We also extracted the estimated ground motion intensity for each point from their respective ShakeMap outputs [23]. This included peak ground acceleration (PGA) measured as % gravity and peak ground velocity (PGV) measured in cm/sec. PGA is the product of the high-frequency part of a seismogram’s spectrum while PGV is a robust measure of intensity for strong shaking [23]. Both are useful measures of shake intensity.
We used ShakeMap estimates of ground motion and slope failure potential maps [50,51] for both events (Table 2) as well as GPS measurements of coseismic displacements (Figure 4) in a Geographic Information System-based comparison of the distribution of predicted areas of failure potential (high ground motion) to the actual mapped large rockfall events. ShakeMap is currently the preferred model for earthquake-triggered hazard assessment. The model, with an output resolution of 250 m, was developed using historical earthquake landslide inventories and predictor variables in a logistic regression [51]. The model inputs include earthquake magnitude, ground motion, topographic slope, lithology, material and temporal wetness and land cover (See: [51] and references therein for model details). Model outputs represent the probability (0.00 to 1.00) of a landslide event occurring in any individual cell. We used this failure mapping, which was originally designed to assess landslide probabilities, to assess whether this approach can be used to predict locations with enhanced rockfall potential.

3. Results

3.1. Rockfall Distribution from the MW7.1 Ridgecrest Earthquake

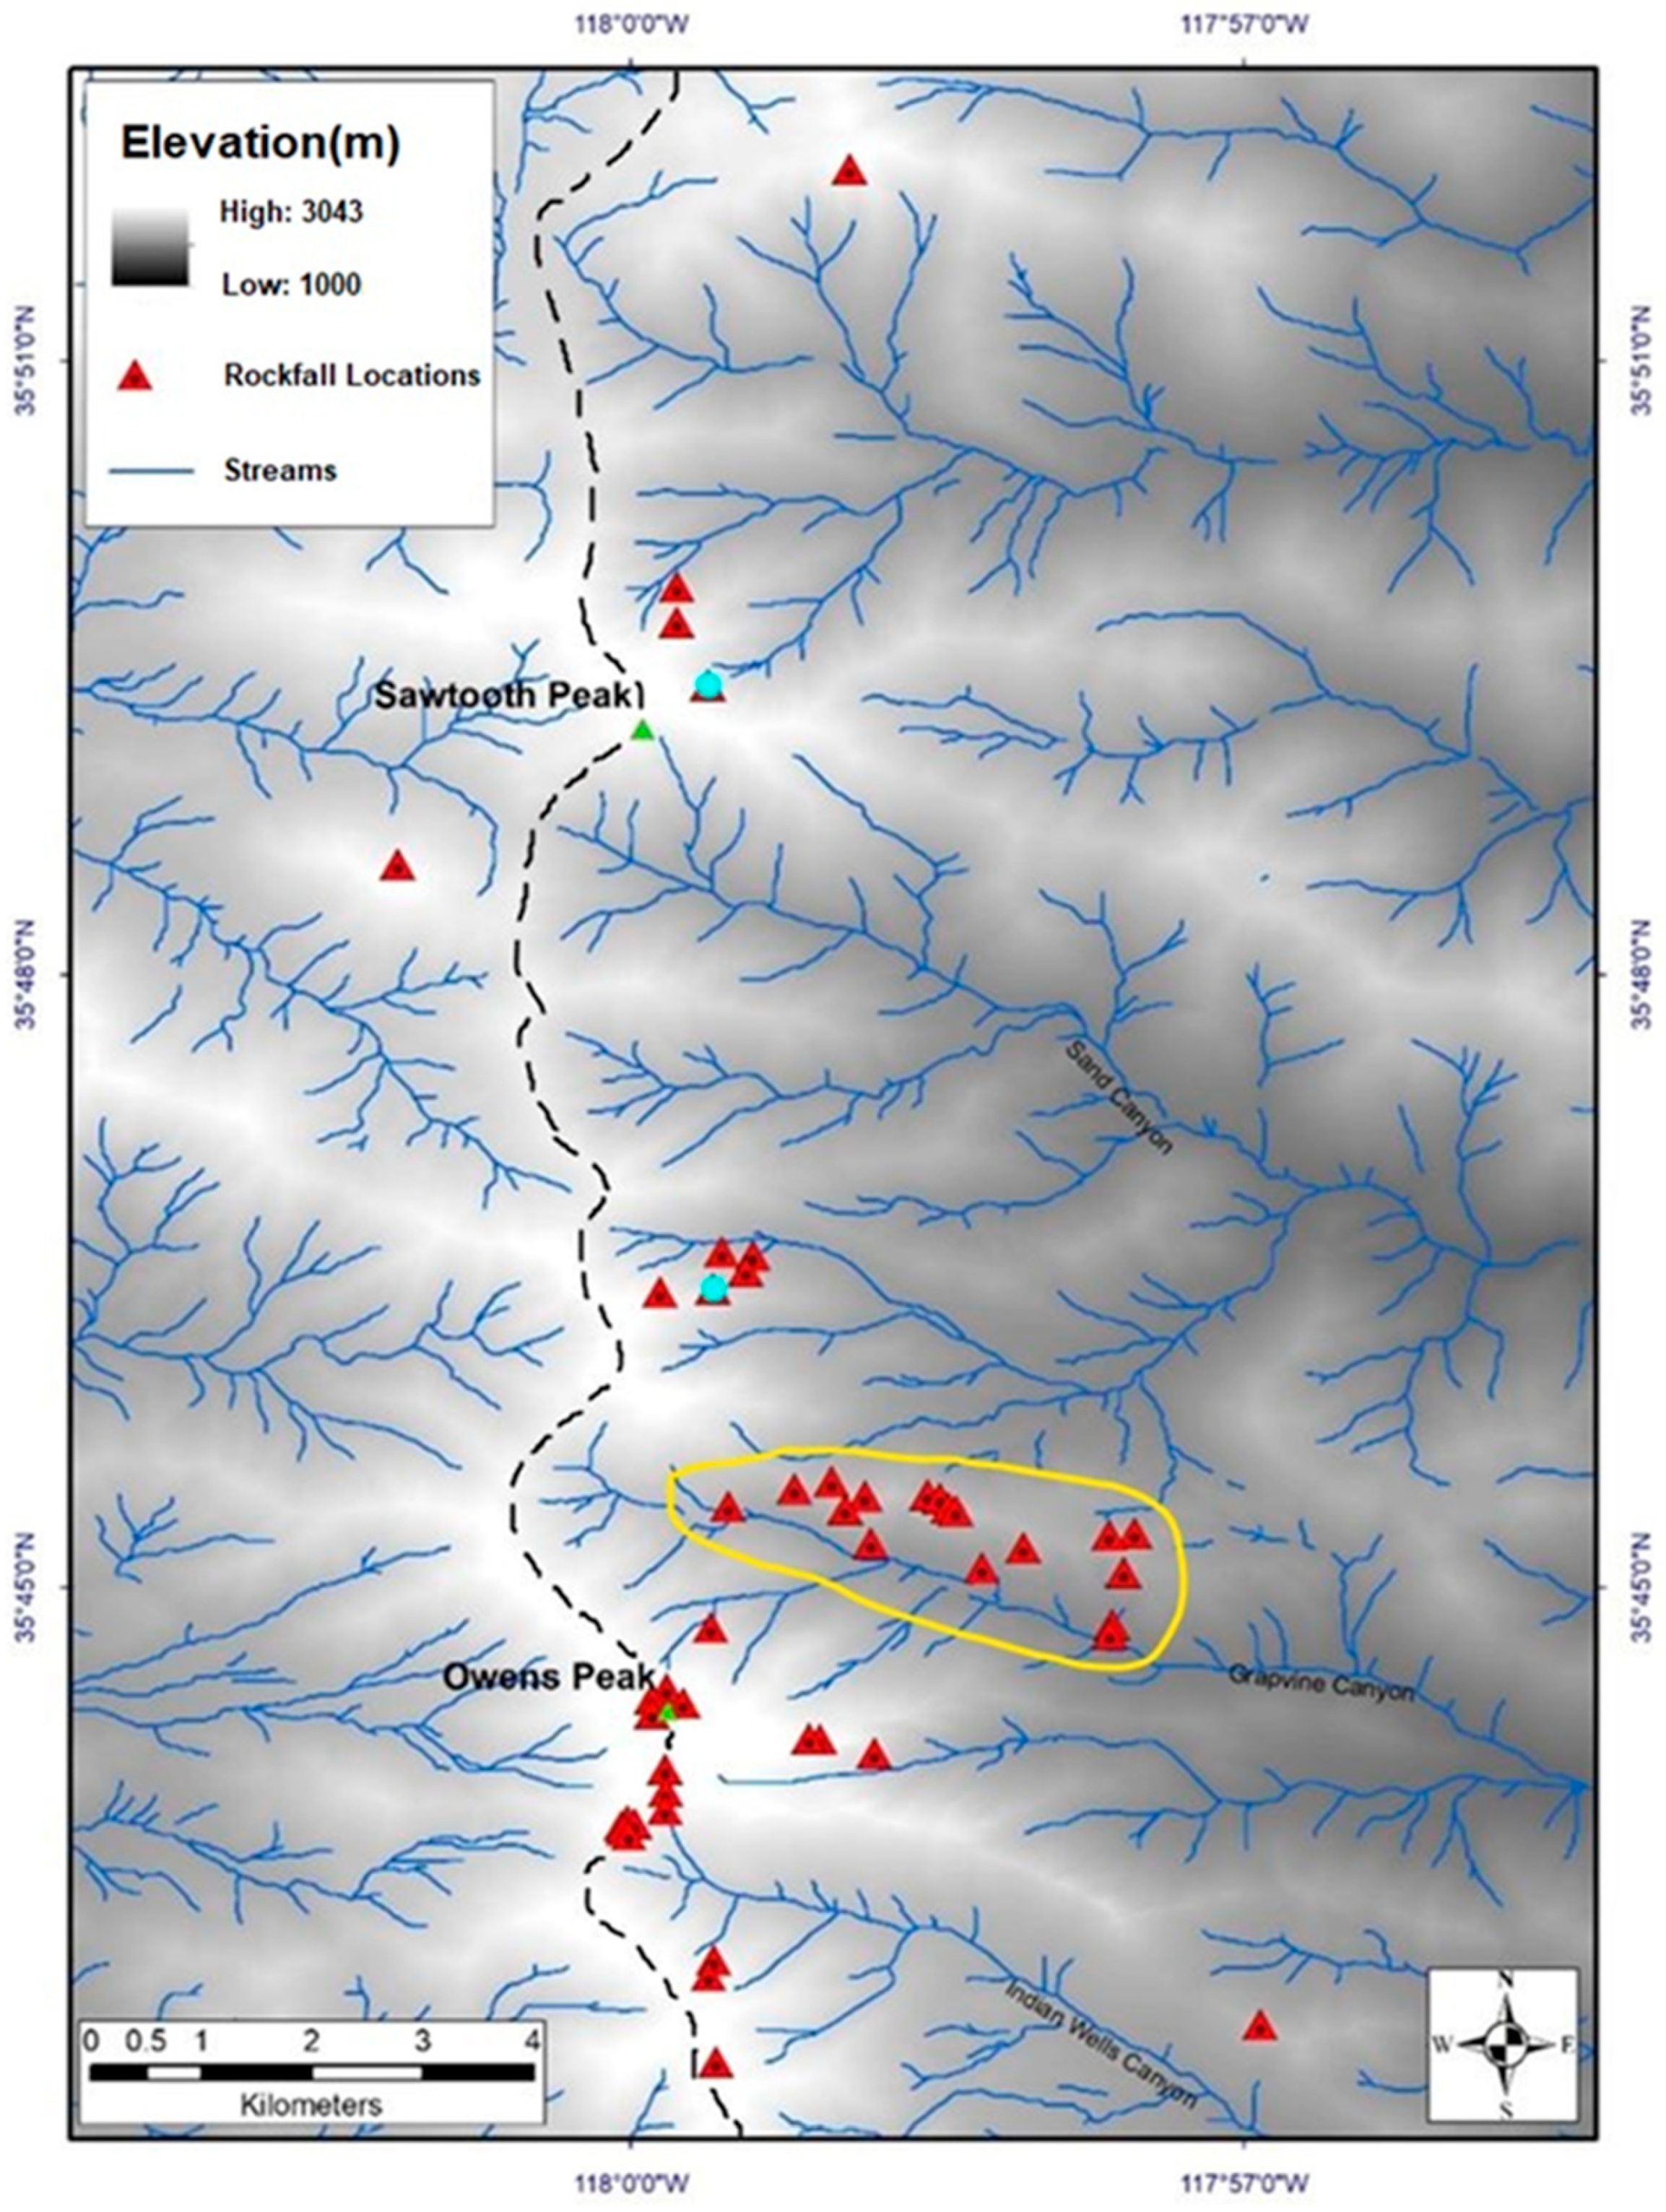
The Sierra Nevada front to the west of the Ridgecrest MW7.1 epicenter rises rapidly from 800 m at the western edge of Indian Wells Valley to 2576 m at Owens Peak (35.74°N, 117.99°W) over a distance of ~10 km. Over 1000 m of this elevation difference occurs over the last 3 km of this transect. To the north of Owens Peak, the main crest at Sawtooth Peak (35.82°N, 117.99°W) rises to 2444 m. The eastern watersheds of the region from north to south is composed of three main drainages: Sand Canyon, Grapevine Canyon, and Indian Wells Canyon (Figure 8). Because of this combination of high relief and significant fluvial dissection, there are a significant number of near-vertical faces in the granodiorite bedrock.
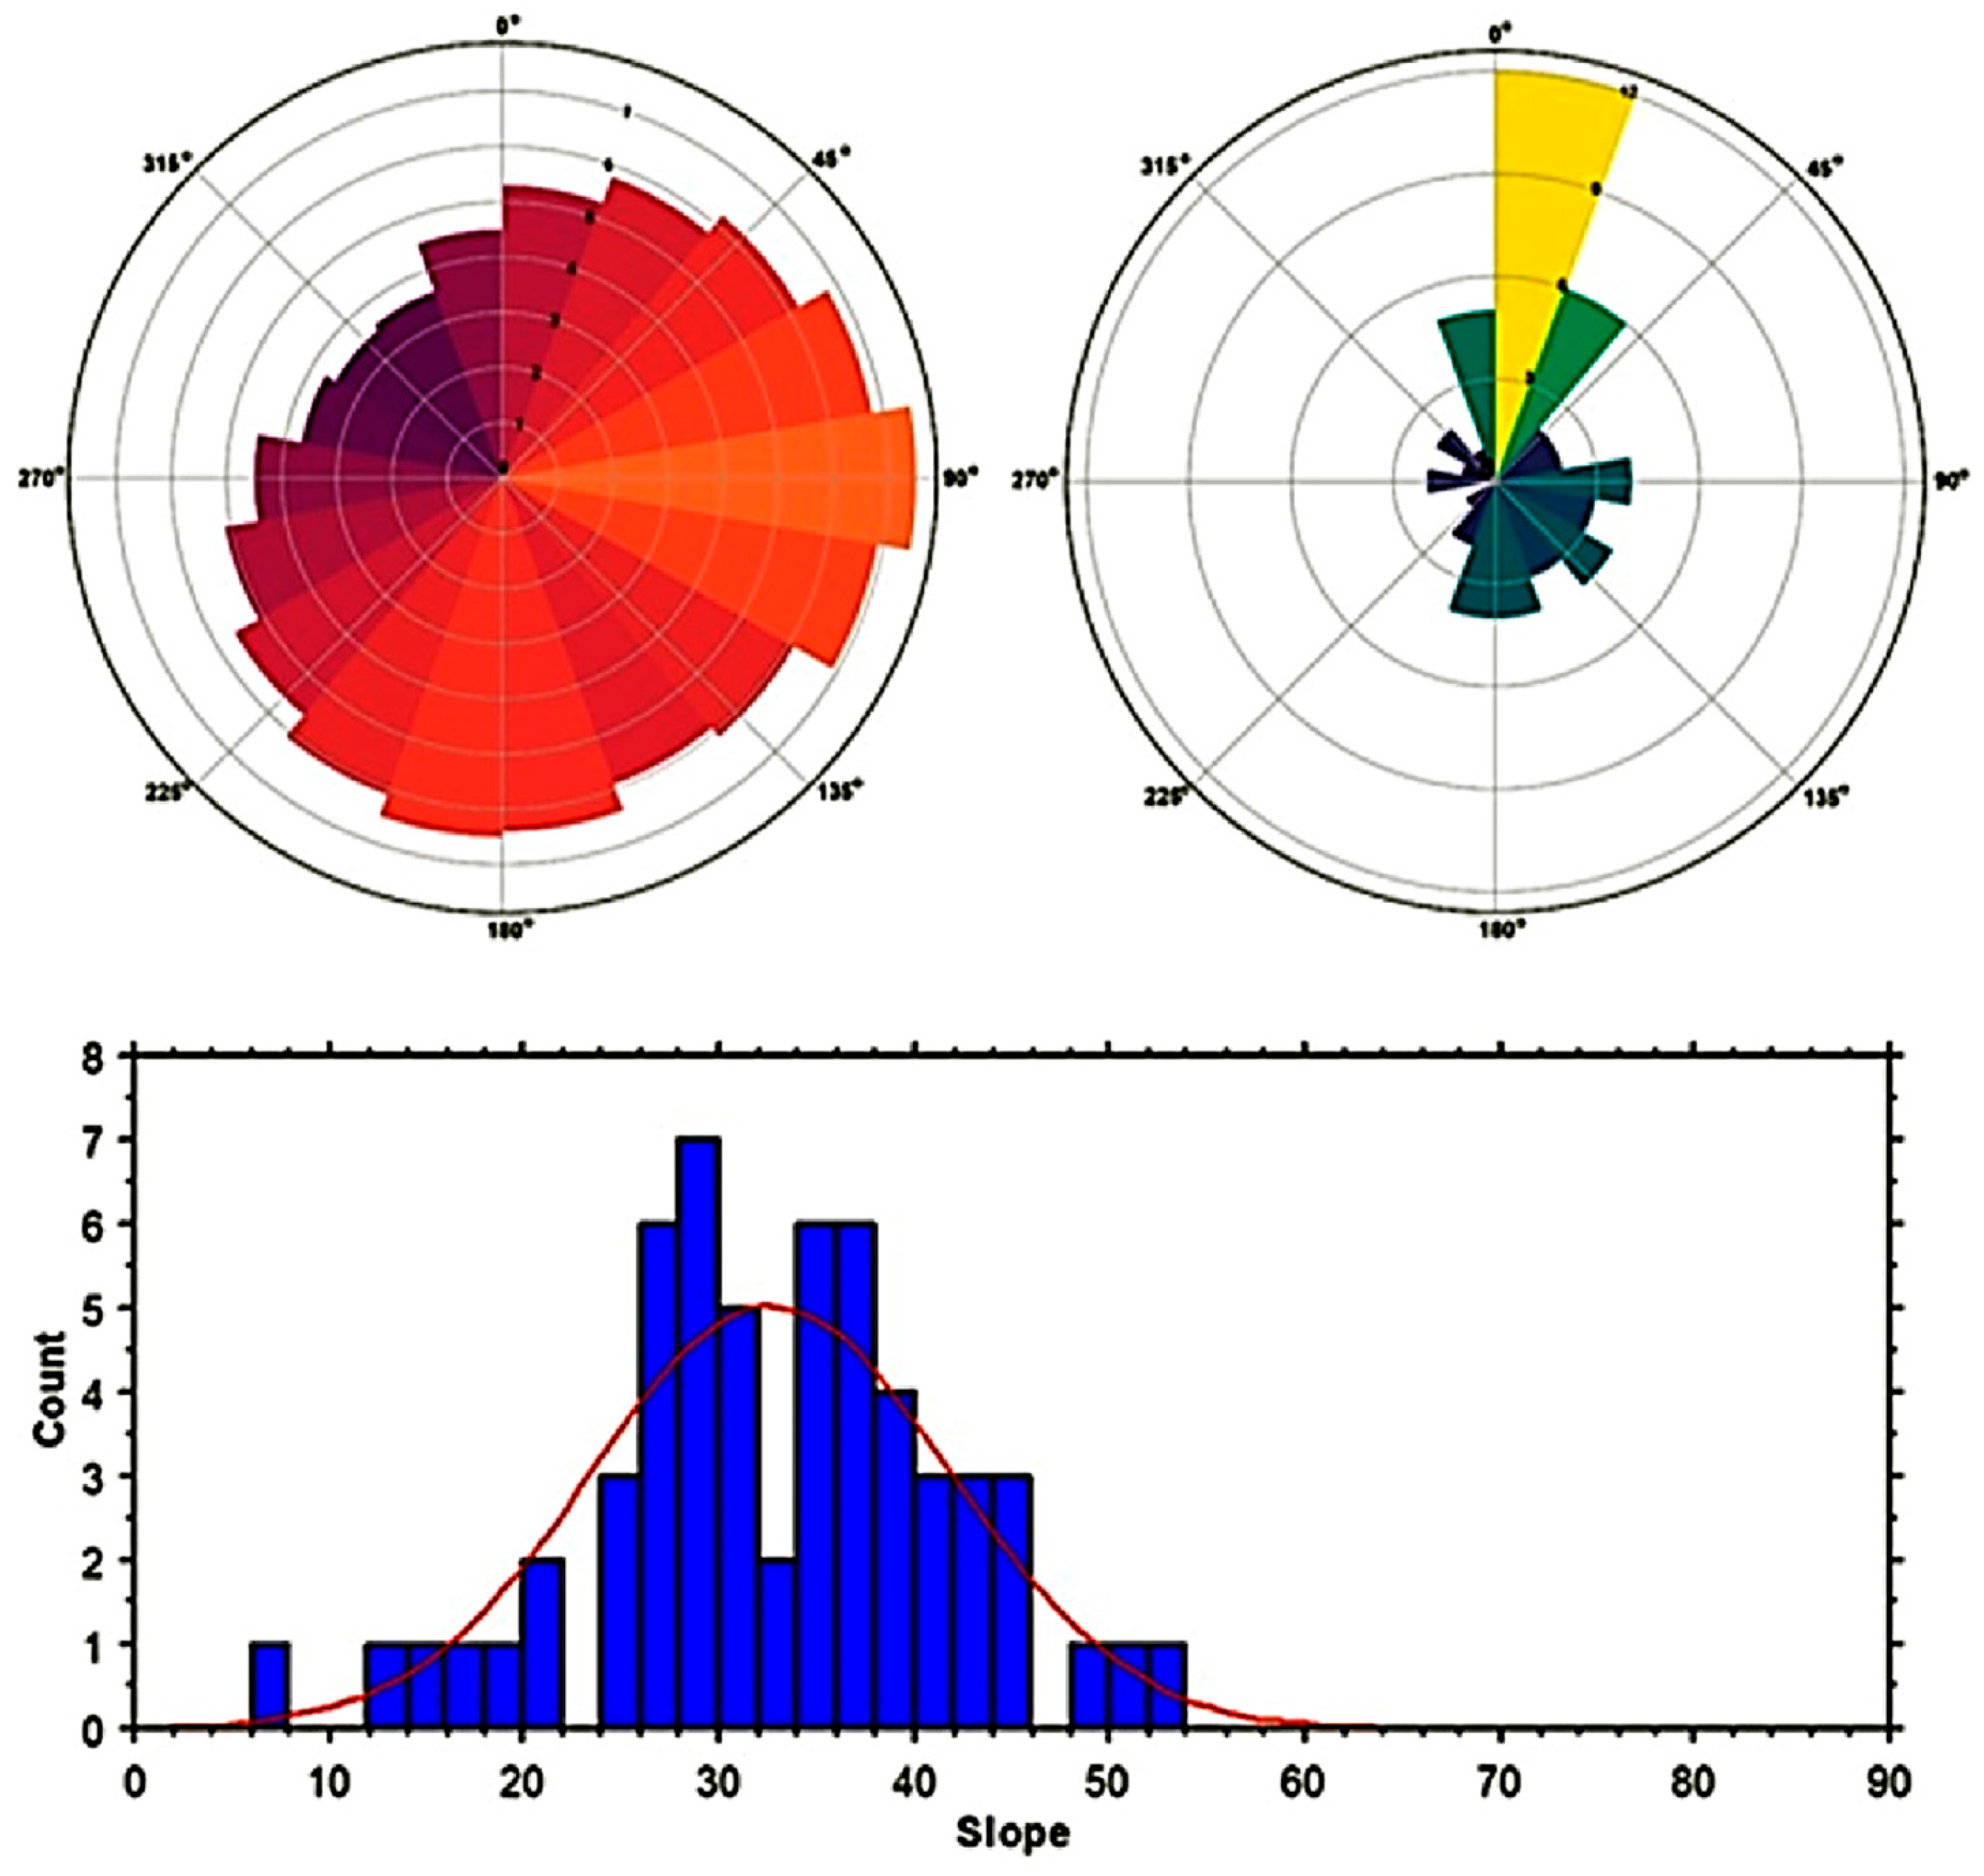
This rapid increase in elevation from Indian Wells Valley to the crest results in a number of east and northeast trending steep ridges descending from the main Sierra Nevada crest with a peak in slope orientations to the north (0–20°) and south (180–200°) (Figure 9 upper left). However, mapped rockfalls cluster significantly on aspects to the north (Figure 9 upper right). This is significantly above what would be expected from the aspect distribution of the region suggesting that ridge orientation to the earthquake moment tensor (Figure 4 top right), which in this case slightly to the north of due west (~275.5°), played a role in development of these features. The mean slope angle of these mapped rockfalls is ~34° (Figure 9 lower); however, we note that most of the mapped units are sourced from steeper slopes above the mean centroid location. The 10 m resolution of the DEM [68] may also be partially responsible for this offset and possible underestimation of the slope of failed units.
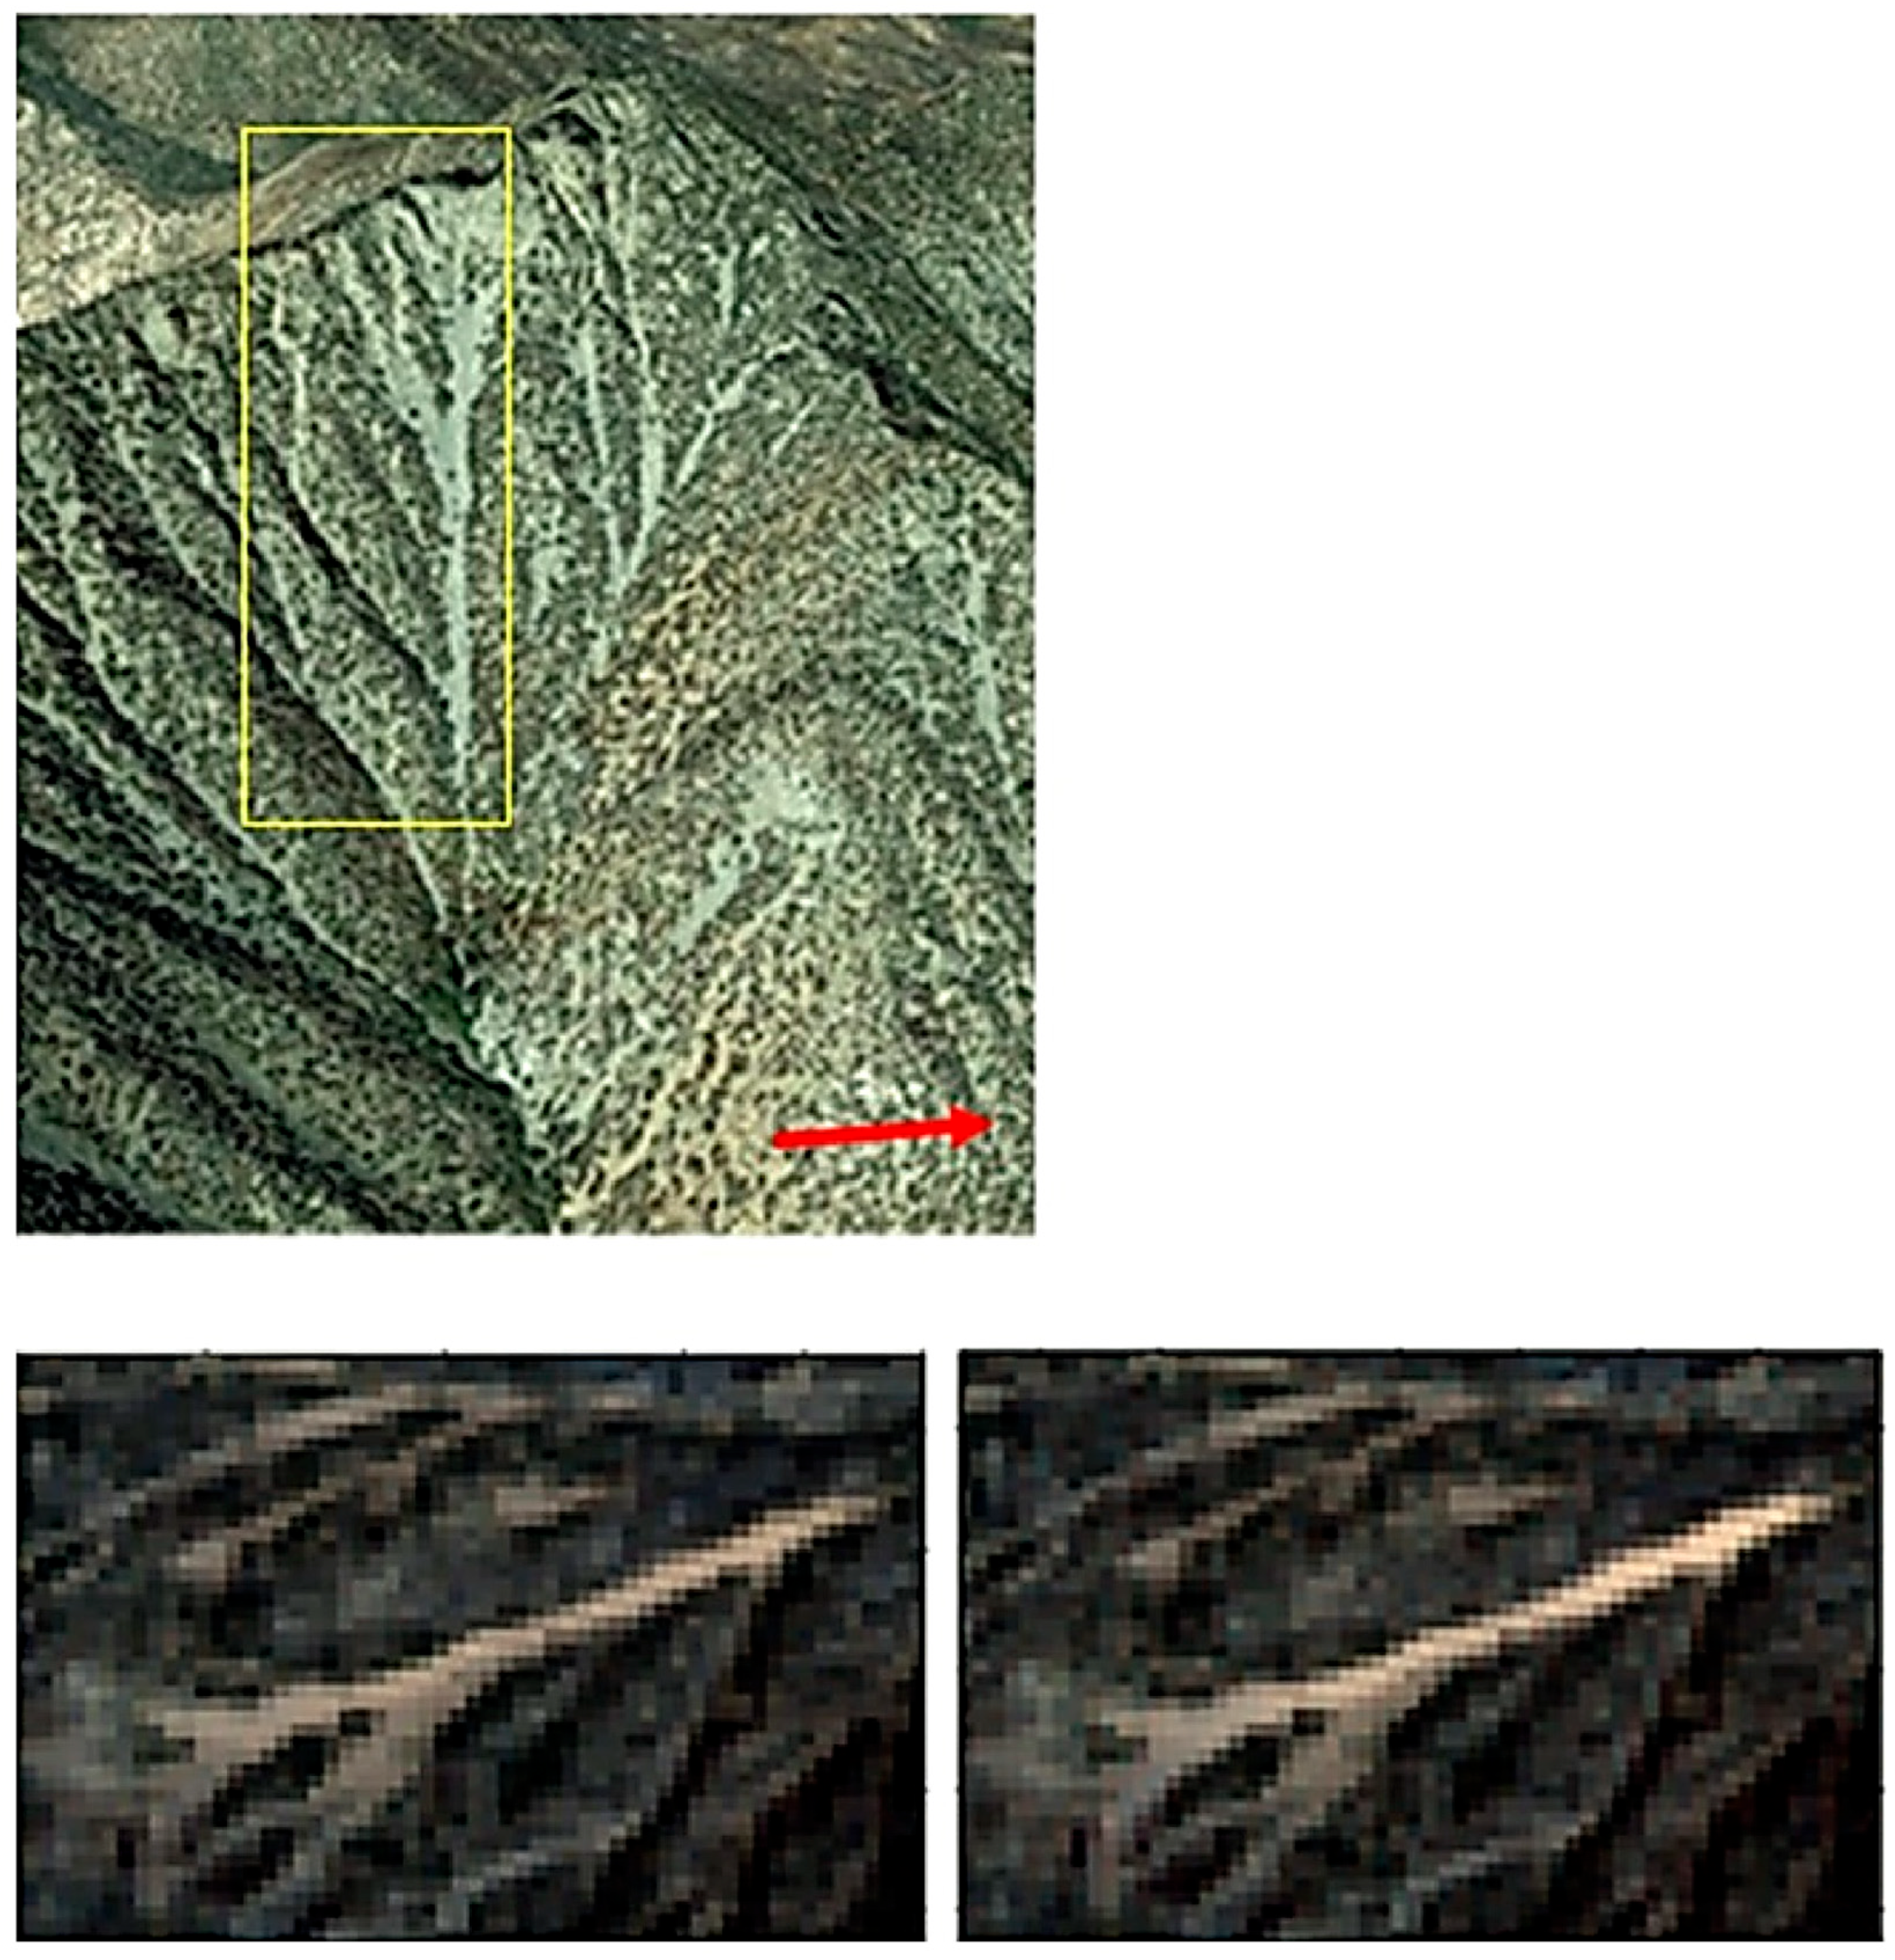
Analysis of the differenced pre- and post-earthquake images reveals rockfalls clustered primarily along the main Sierra Nevada crest and on both aspects (NE and SW) along a generally WNW to ESE ridge above Grapevine canyon (Figure 8). Most of the larger rockfalls traveled more than 100 m, however in a chute NE of Sawtooth Peak (Figure 10) the rockfall moved ~450 m, from its steep parent slope.
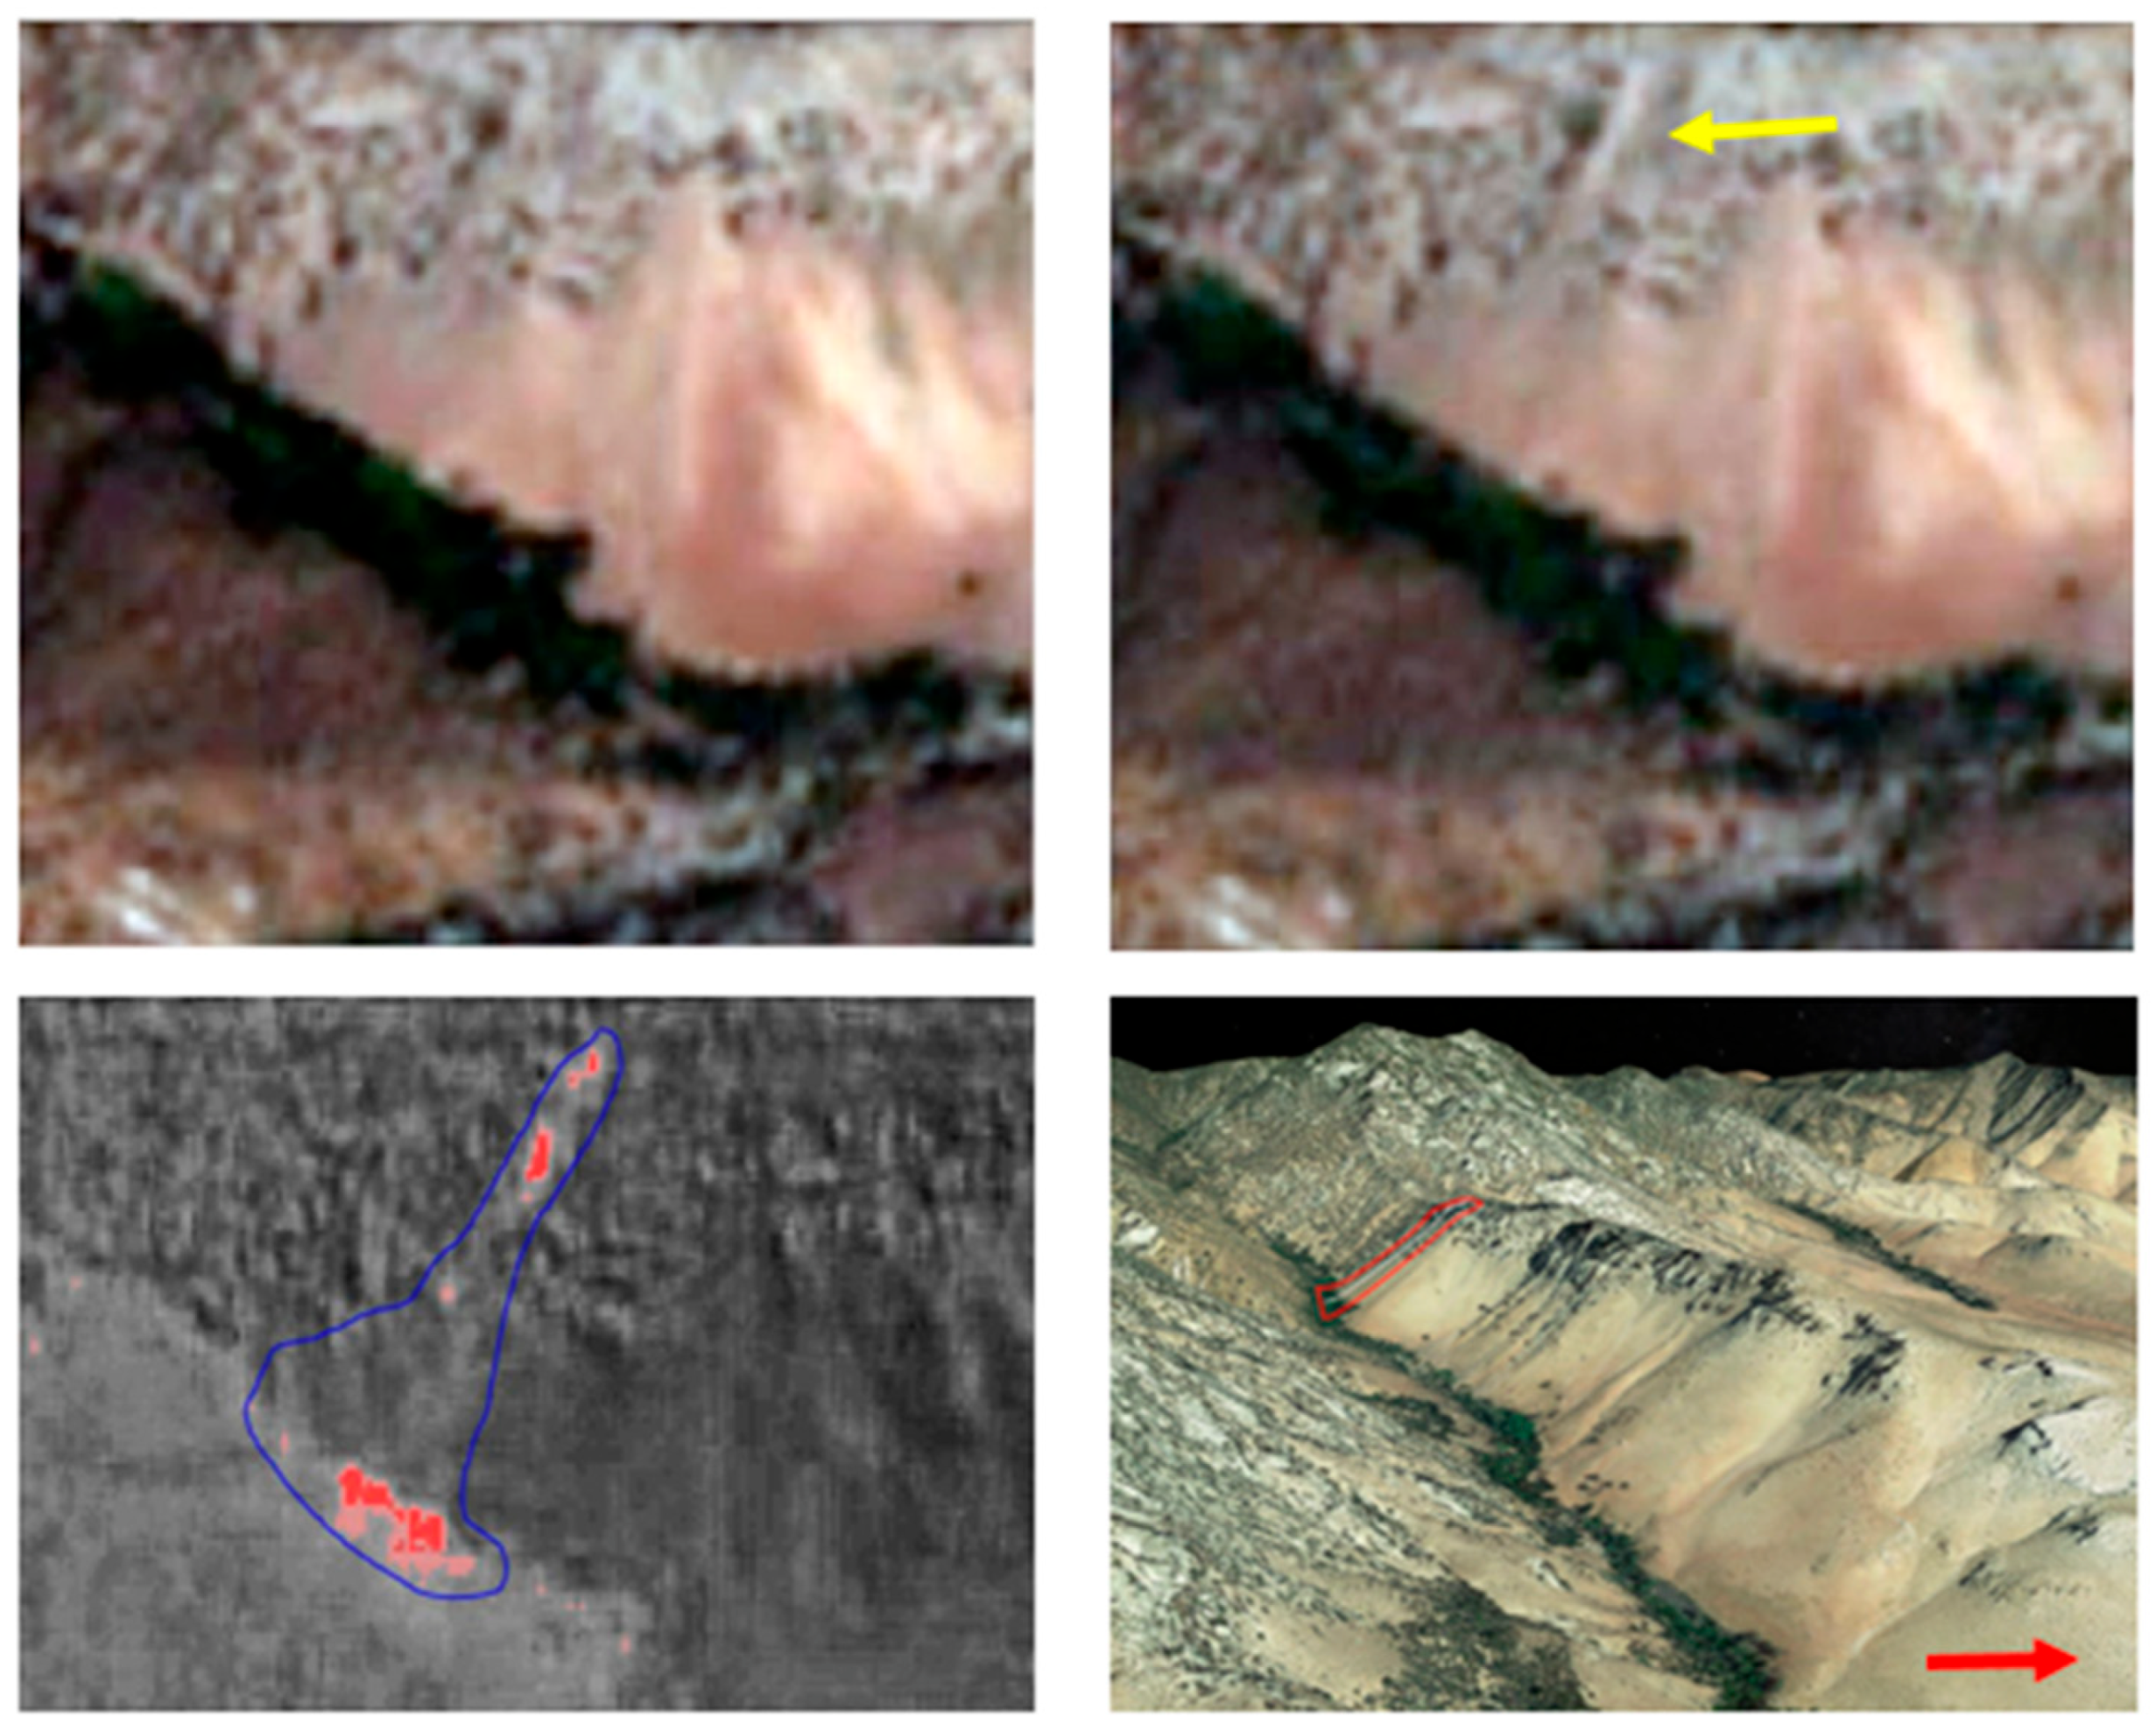
The 95% CL for this distribution shows a significant peak to the north (0–20°) and a weaker secondary peak to the south (180–200°), reflective of the general north/south trend of the range and east/west ridges. The general forms of the two distributions are significantly different (p > 0.002, chi-square = 38.77, df. = 17) and the large spike in rockfalls at aspects between 0 and 20° when analyzed separately is highly significant (p >> 0.0001, chi-square = 27.37, df. = 1). The 58 mapped rockfall features ranged from small (slightly above our minimum threshold of 1000 m2) to significant failures up to >~24,000 m2 in size. The largest occurred in a debris chute to the northeast of the summit of Sawtooth Peak that has a slope angle of ~50° at the failure point and an average slope angle of 43°. A brightness difference and widening in the chute between the before and after images (Figure 10, bottom left and right, respectively) suggests a failure towards the upper limit of the debris chute (2350 m) with rockfall debris extending along the entire 450 m length of the chute down to its lower limit at ~1920 m.

3.2. Rockfall Distribution from the MW5.8 Owens Lake Earthquake

The Sierra Nevada front to the west of the Owens Lake MW5.8 epicenter rises rapidly over a distance of ~8 km from ~1800 m at the western edge of Owens Valley to 4274 m at Mount Langley (36.52°N, 118.24°W) and 4421 m at Mount Whitney (36.58°N, 118.29°W) (Figure 11). The eastern watersheds of the region consist of over a dozen main drainages with steep and narrow V-shaped valleys in their lower reaches grading into glacially carved U-shaped canyons at higher elevations. Because of this high relief, fluvial dissection in the lower reaches and glacial oversteepening in the upper reaches produced a significant number of near-vertical faces in the granodiorite bedrock.
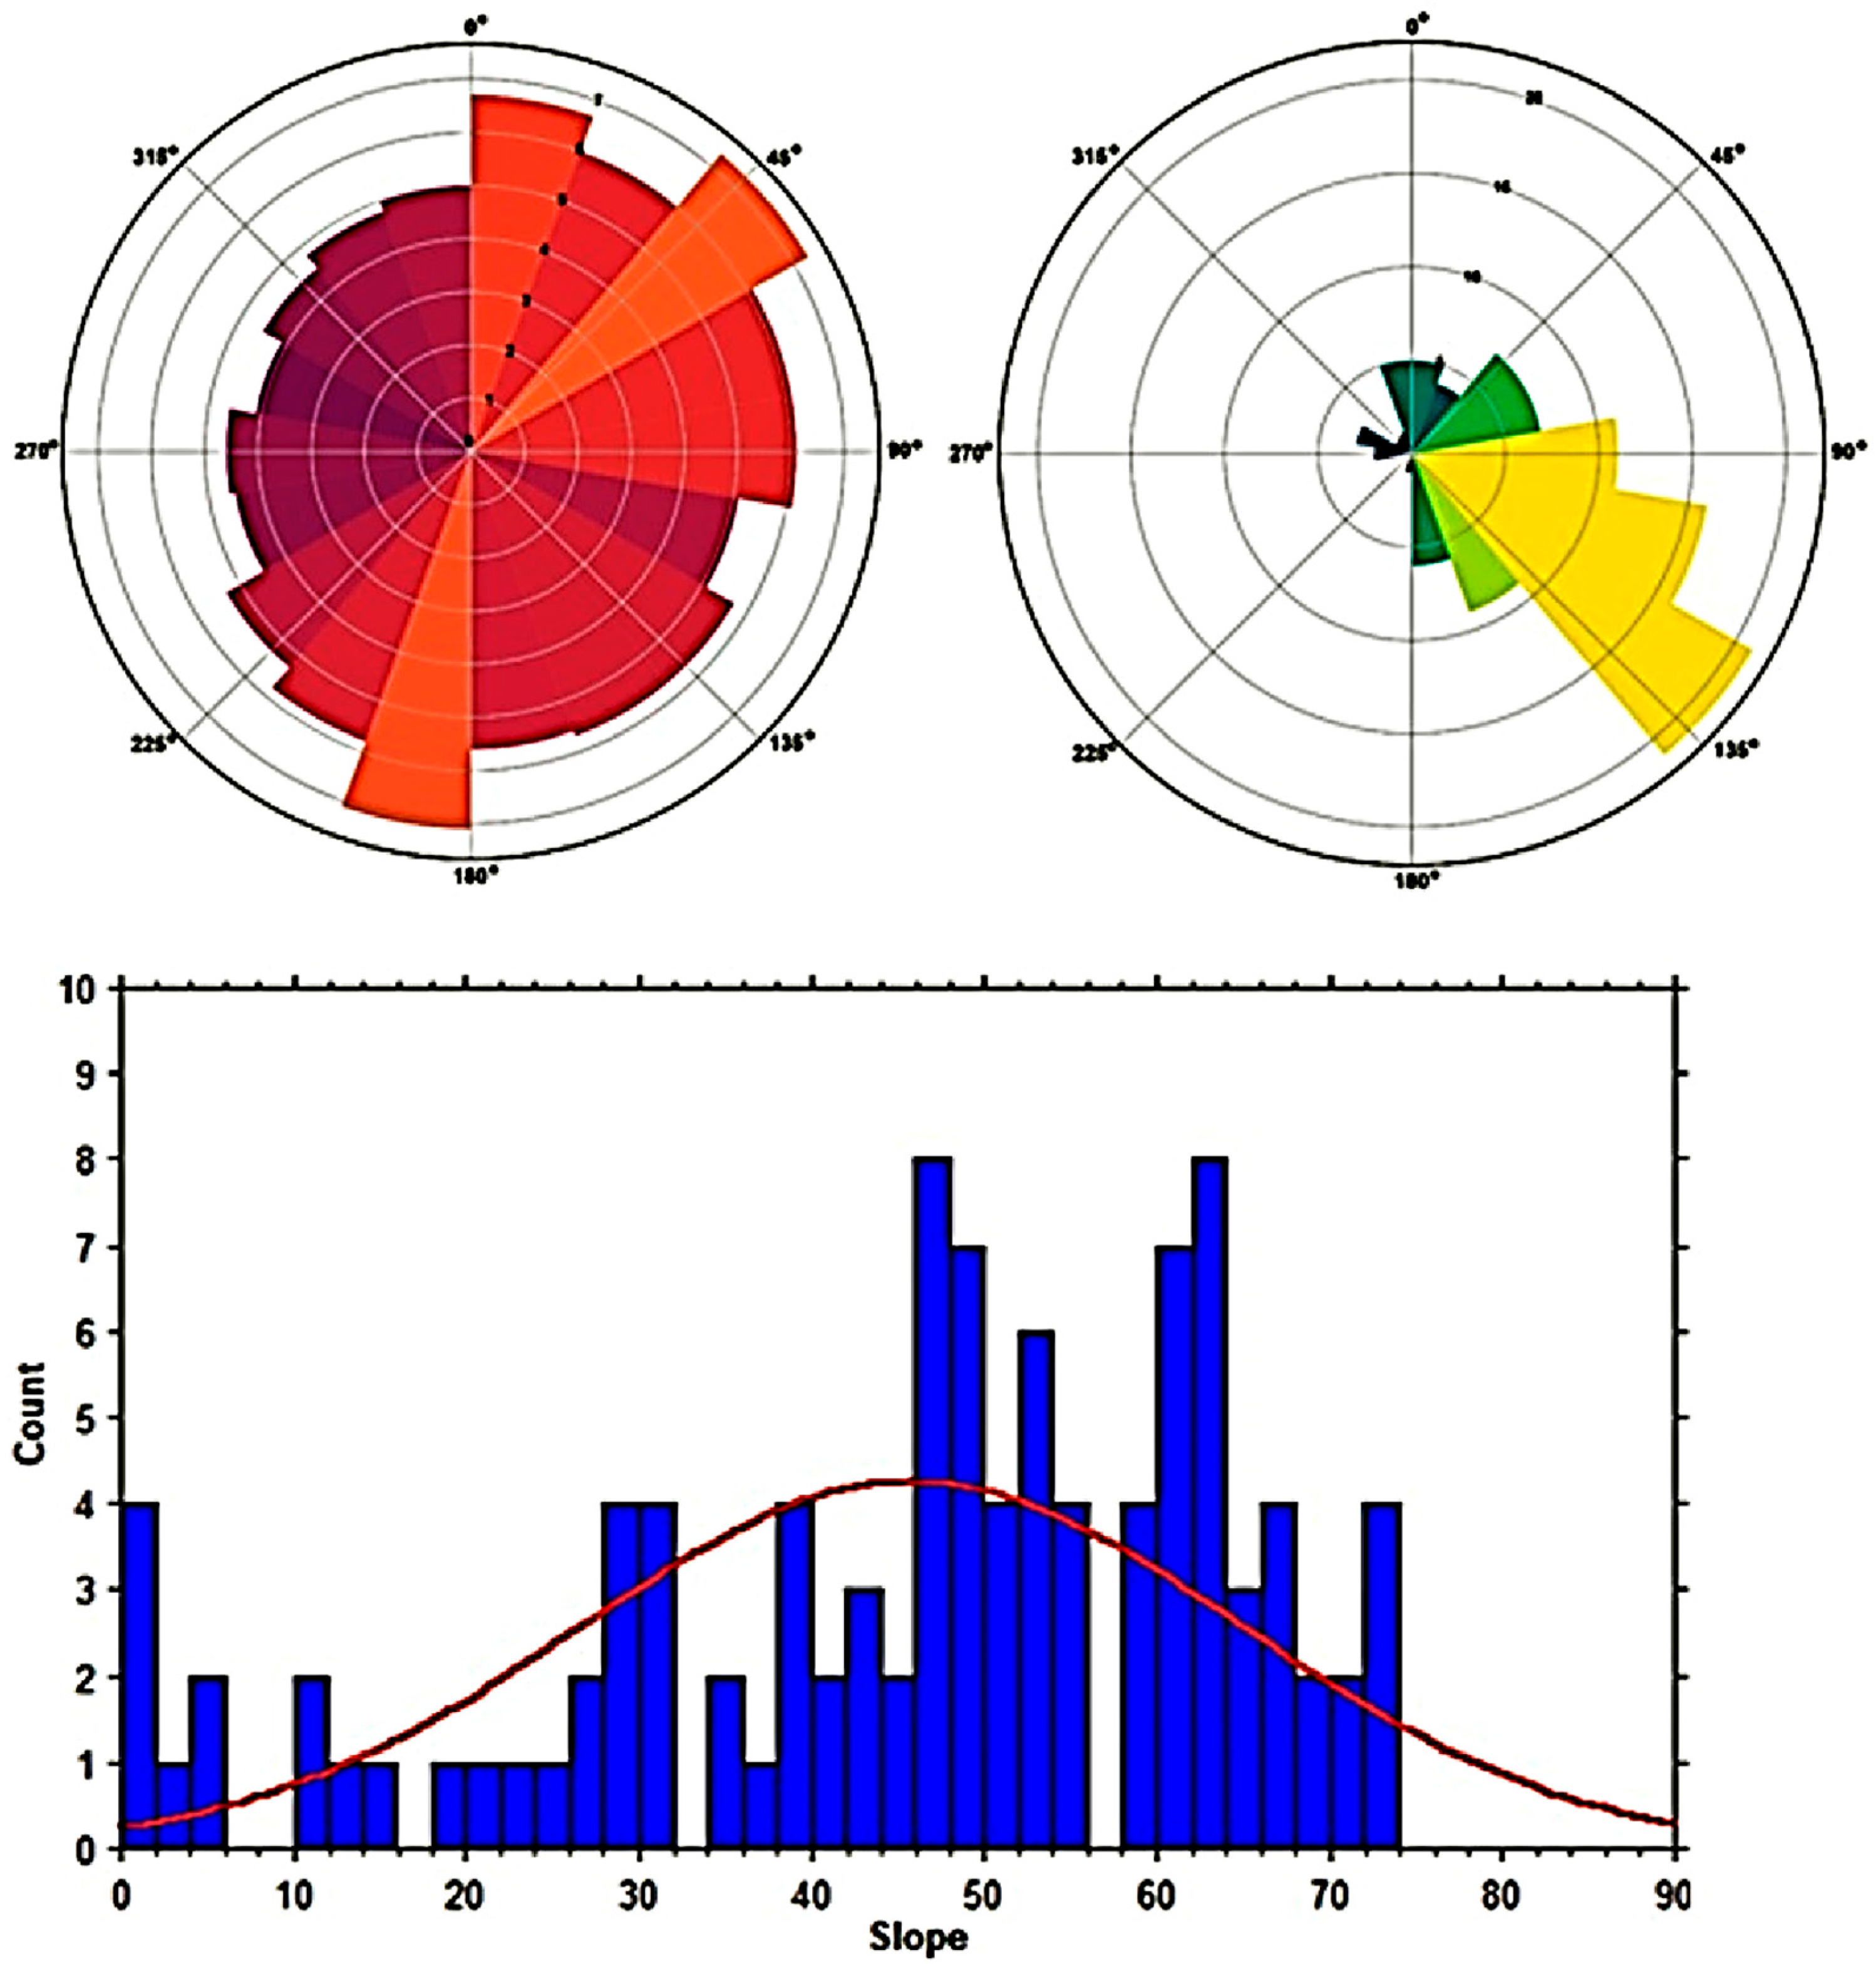
This rapid increase in elevation from Owens Valley to the Sierra crest results in a number of east and northeast trending steep ridges descending from the main Sierra Nevada crest with a peak in oversteepened slope orientations to the northeast and south (Figure 12 upper left). The 95% CL for this distribution shows significant peaks to the northeast (40–60°) and to the south (180–200°), reflective of the general north/south trend of the range with east/west oriented ridges. However, the mapped rockfalls cluster significantly on aspects to the southeast (100–140°) (Figure 12 upper right). The two aspect distributions are significantly different (p > 0.0001, chi-square = 100.82, df. = 17) with a strong peak in rockfalls between 110 and 130° (Figure 12, upper right). The mean slope angle of the centroids of these failures within the HS is ~50° (Figure 12, lower), however, there are a significant number of failures on slope angles between 46 and 64°. Most of the larger rockfalls traveled more than 200 m, and a significant rockfall SE of Whitney Portal (Figure 13) moved over 300 m from its steep parent slope.
This failure distribution between 110° and 140° is primarily found at elevations below 3400 m. A considerable number of these failures on the southeast facing slopes of Williamson Creek account for most of the excess. This distribution anomaly is significantly above what would be expected from the aspect distribution of the region suggesting that ridge orientation relative to the earthquake moment tensor (Figure 4, bottom right), and specifically orientation to the movement vector from the earthquake epicenter (from the WNW), was critical in failure on slopes oriented in this direction. For slopes above 3400 m, the relatively small number of failures captured are concentrated on slopes with aspects between 340° and 40° (north facing) associated with glacial oversteepened cirque headwalls which provide an increased proportion of possible rockfall detachment zones.

3.3. Ridgecrest Event Slope Failure Distribution

In order to understand the performance of slope failure predictions models, we compared the observed rockfall distributions derived from our study with modeled results from ShakeMap [51]. We note that no area within either study area exceeds a probability of slope failure greater than ~0.10. This is likely due to the bedrock nature of the two areas studied.
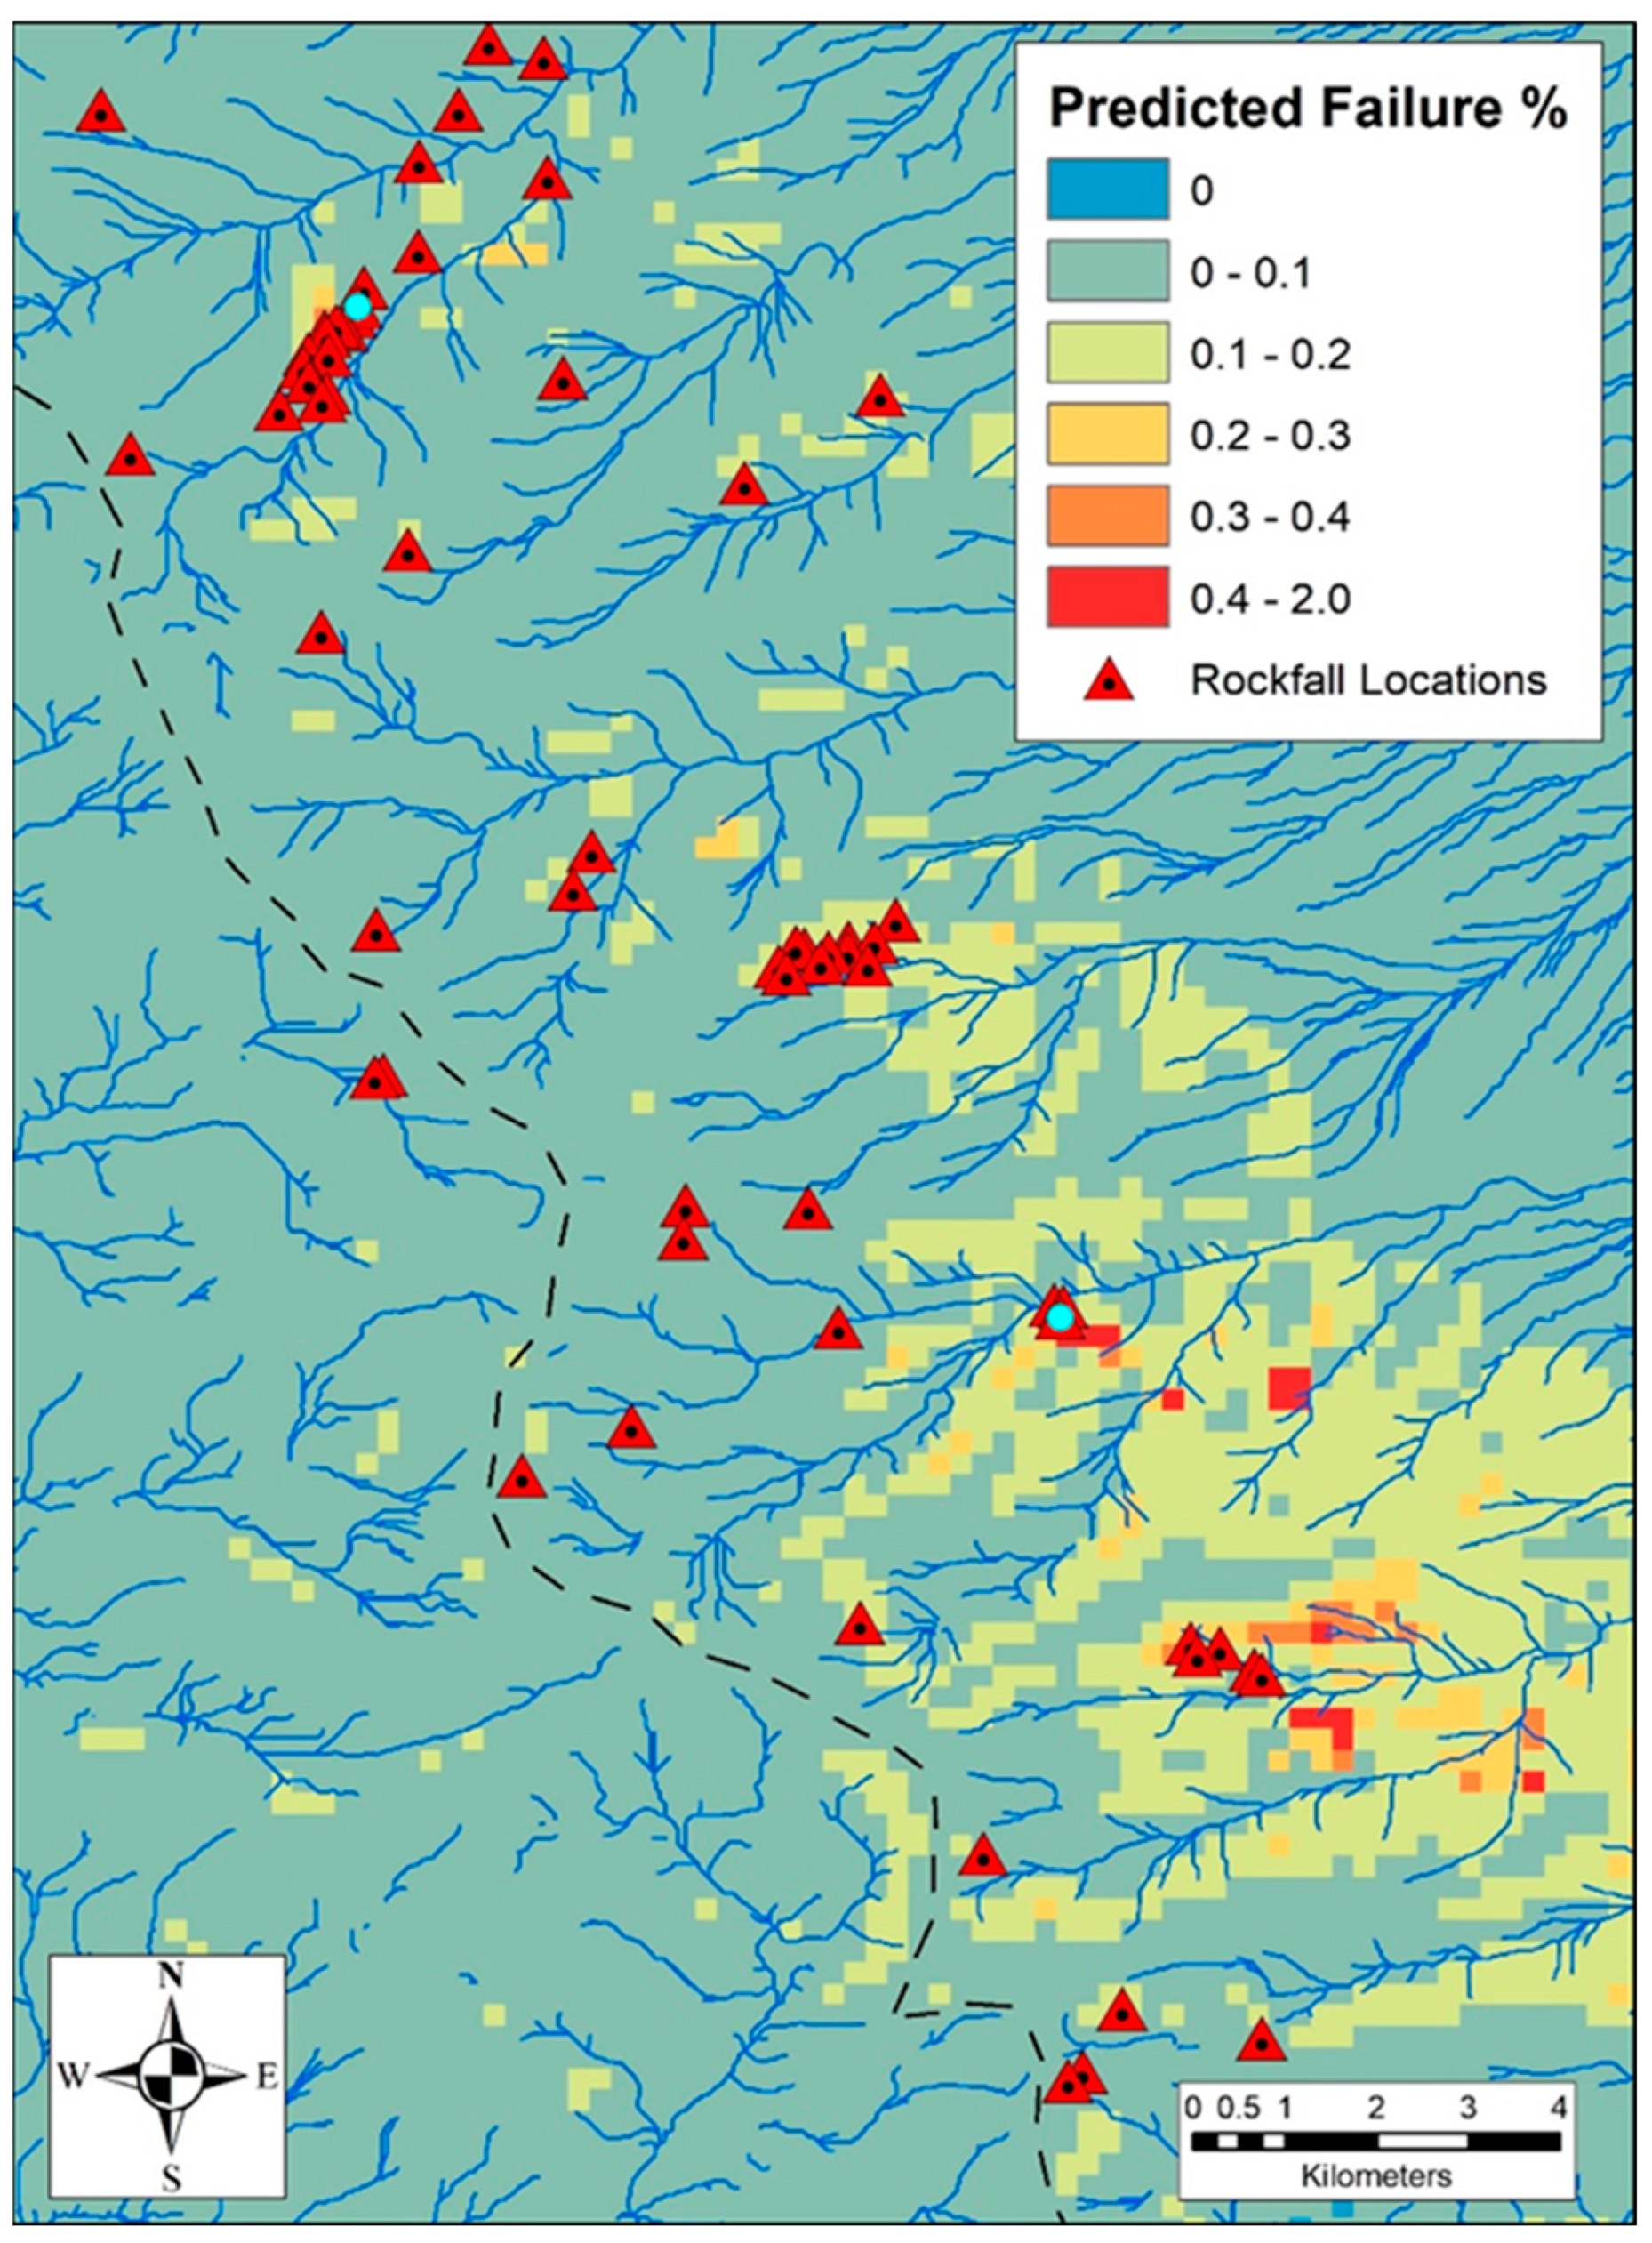
Figure 14 illustrates the co-occurrence of mapped rockfalls with ShakeMap slope failure predictions (https://earthquake.usgs.gov/earthquakes/eventpage/ci39493944/shakemap/intensity, accessed on 18 December 2022). In the LS study area, ShakeMap failure probability mapping appears to be primarily driven by the locations of cliff faces and is likely forced by the topographic slope input of the model. At the most basic level, ShakeMap correctly identified “enhanced probability” areas where we mapped rockfalls. Most of our mapped rockfalls clustered in areas where ShakeMap predicts a slightly higher probability of failure. Only two out of 58 mapped rockfalls occurred within pixels that the algorithm identifies as ~0.0 probability of slope failure.
It has been noted [51] that the model does not account for local or regional variations in slope characteristics, nor does it incorporate possible seismic focusing [14,69,70,71,72,73,74,75,76]. Most of the mapped rockfalls are found along the main Sierra Nevada crest in the LS area with seven out of the ten largest in areas the ShakeMap algorithm predicts as having the highest probability of failure (Figure 14). A significant spike in failures oriented to the north along with a clustering of rockfalls (42 out of 58 mapped) along the main crest at Owens Peak, an intermediate unnamed peak (35.76°N, 118.00°W, 2347 m), Sawtooth Peak, and along two ridgelines descending eastward from these peaks. This distribution suggests that a degree of seismic focusing may have taken place at these localities. Clustering is especially pronounced near Owens Peak and the ridgelines extending north and south from it. This section of the main crest is both closest to the epicenter and along a ridgeline that is oriented perpendicular to the primary seismic wave.
Interestingly, and somewhat in contrast to model predictions of failure areas, a significant number of Ridgecrest event coseismic rockfall features are found along the south side of an eastward trending ridge in upper Grapevine Canyon (Figure 14 black circled area). Figure 15 illustrates a large failure that was not in a high probability predicted failure area. A steep 50° rock face oriented to the southwest (~200°) failed with the rockfall falling down a steep chute containing prior rockfall debris. This material, with a volume estimated at ~4000 m3, fanned out across a talus cone with debris reaching the cone base ~200 m below the bottom of the failure. The rockfall debris, with a total runout of ~340 m, crossed a small stream at the base of the talus cone (Figure 15, bottom left, indicated with red highlighting at the base of the debris cone).
The upper failure point is part of a southwest facing 70 to 100 m rock face that extends ~2 km along the northern side of Grapevine Canyon (Figure 15, bottom right). A continuous ~25–30° talus slope with numerous large boulders derived from former rockfalls extends along the entire 2 km section from the base of the rock face down to the stream. The step rock face in this canyon produced a large number of failures both to the SW and NE (16 of the 58 mapped in the LS). None of these failures fell within a ShakeMap enhanced failure prediction cell.

3.4. Owens Lake Event Slope Failure Distribution

Figure 16 illustrates the co-occurrence of mapped rockfalls with ShakeMap slope failure predictions (https://earthquake.usgs.gov/earthquakes/eventpage/ci39493944/shakemap/intensity, accessed on 18 December 2022). Similarly to the ShakeMap results for the LS study area, in the HS study area, ShakeMap probability mapping suggests a minor (<2%) probability of slope failure throughout the region. Unlike the LS area, the co-occurrence of rockfalls with higher failure prediction areas is only weakly correlative. There are distinct differences between co-occurrence in the fluvially dominated lower elevations of the eastern escarpment well to the east of the main Sierra Nevada crest where there is a better match and those found in the higher glacially oversteepened areas. In both cases, ShakeMap failures for the Owens Lake event appear to be primarily driven by the topographic slope input [51]. However, and unlike rockfalls associated with the much stronger Ridgecrest event, there does not appear to be significant amplification along the Sierra Nevada main crest.
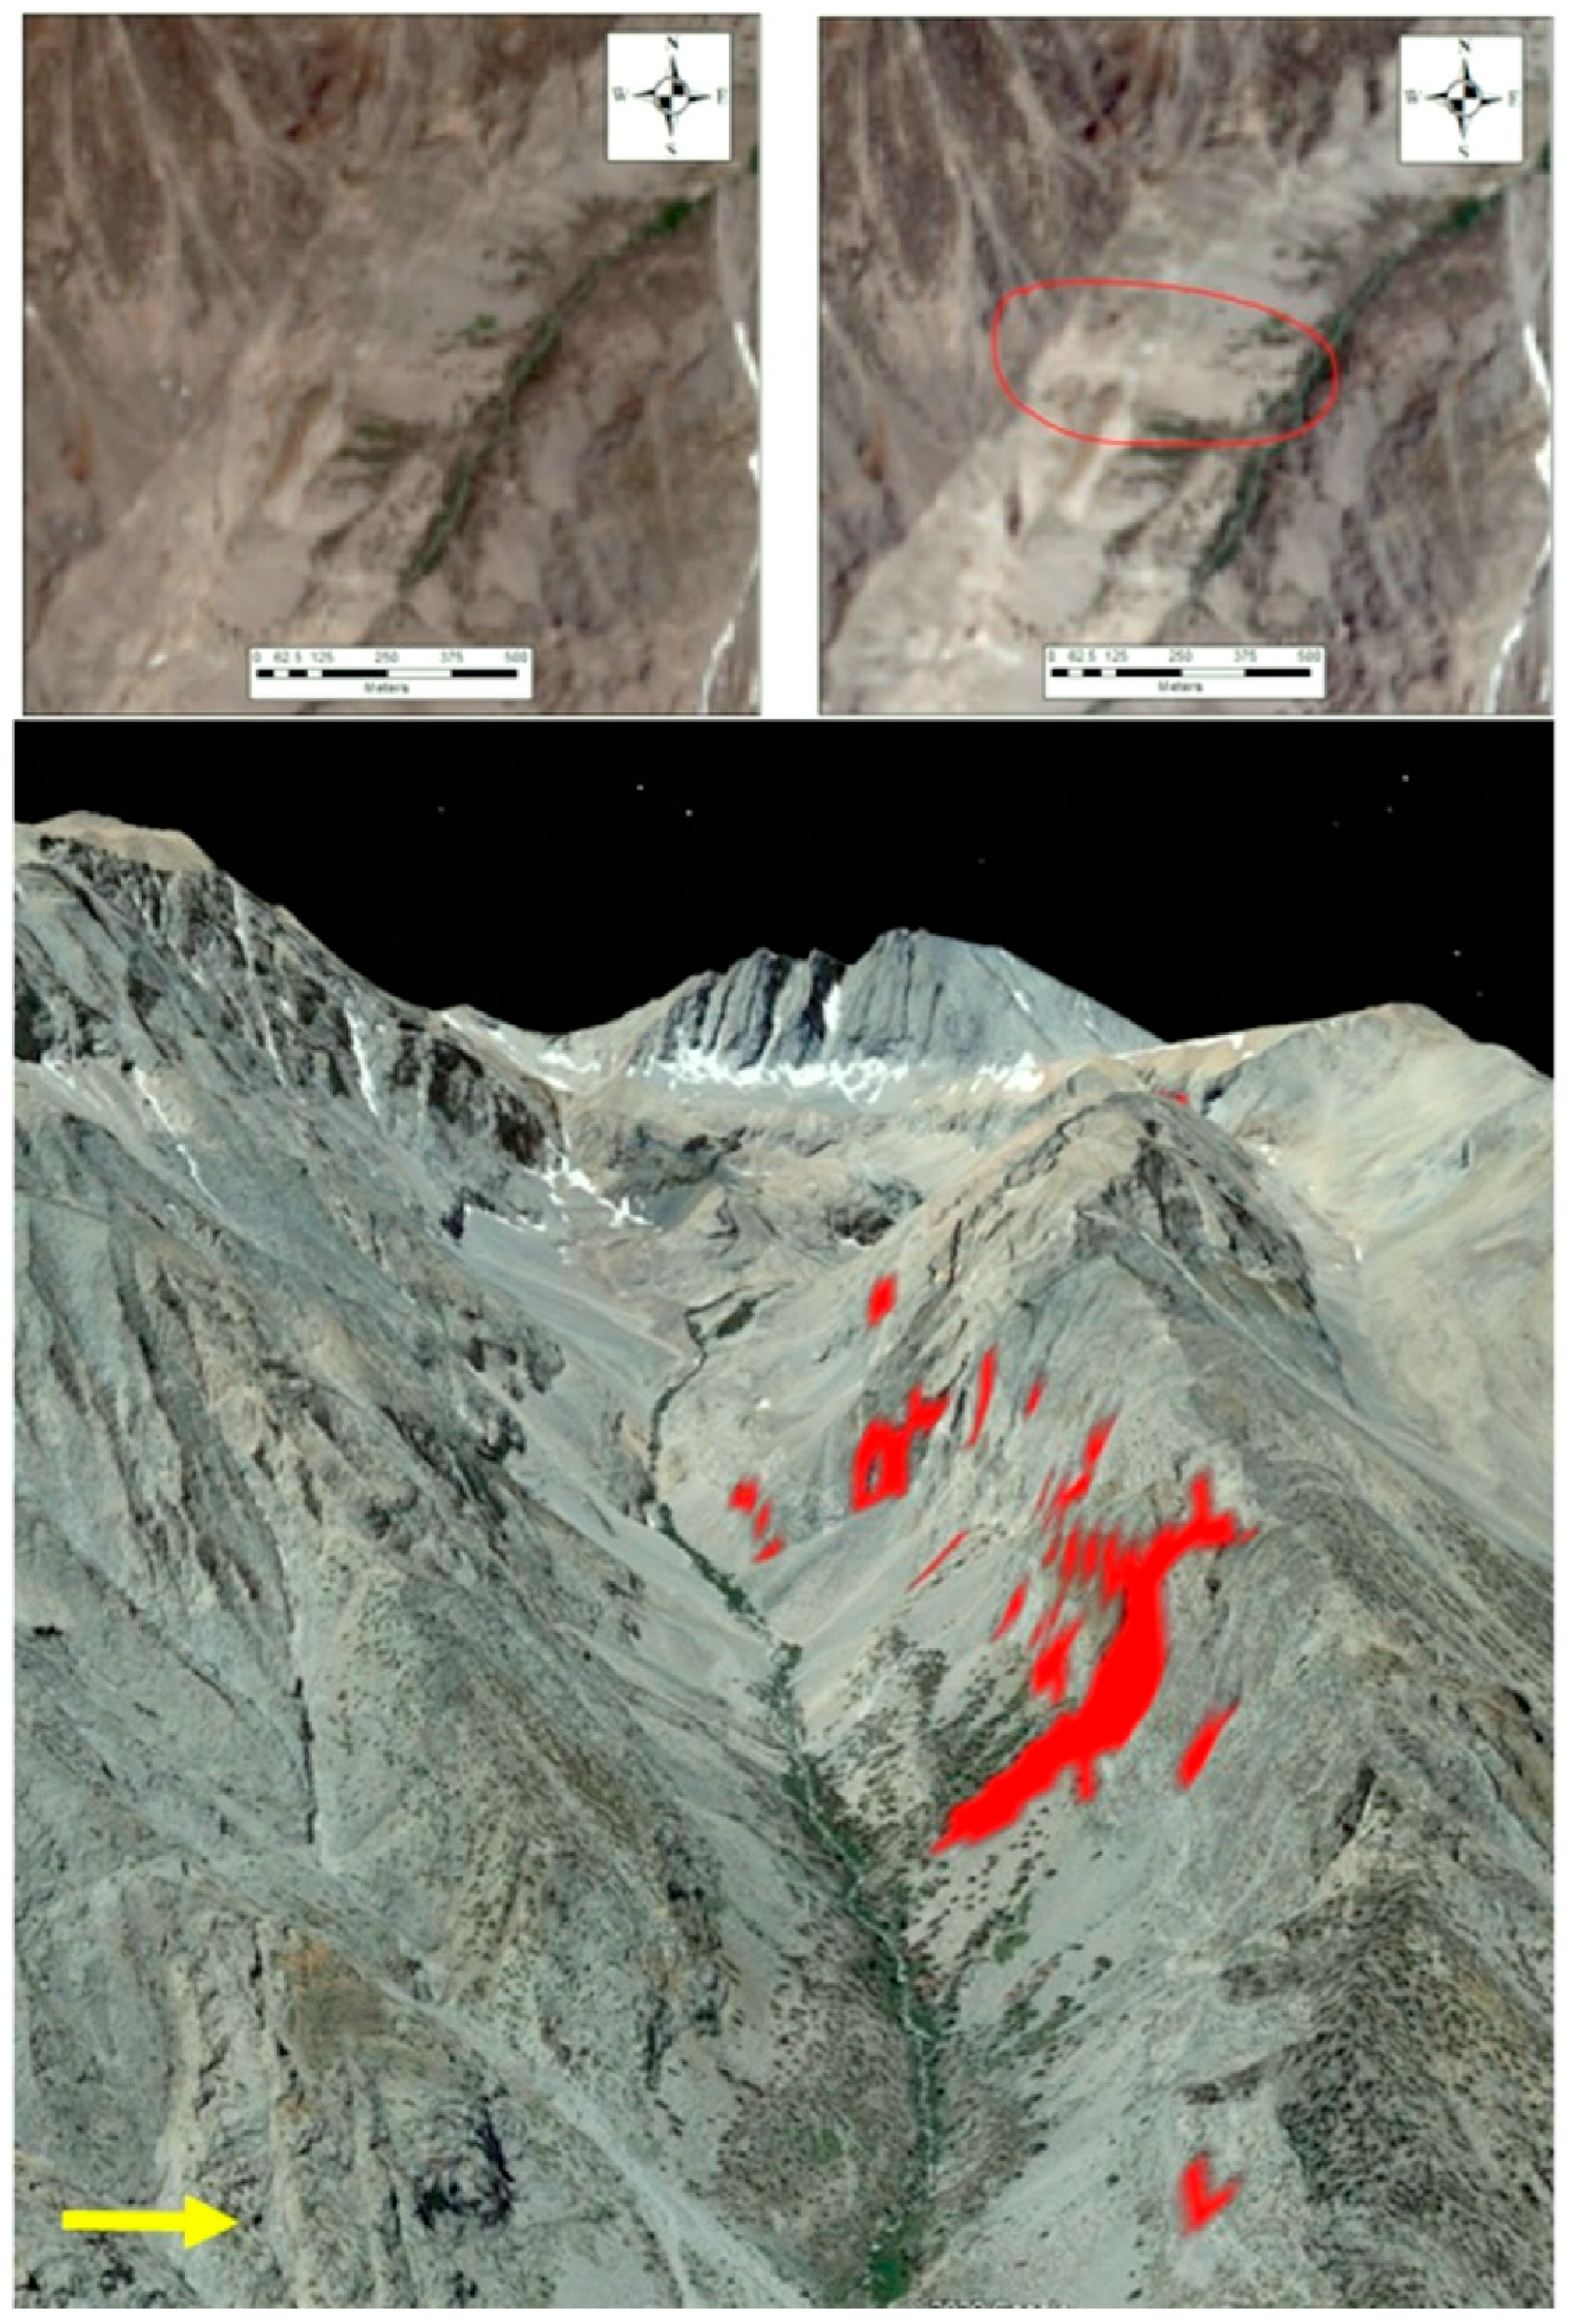
Most of the rockfalls in Upper Williamson Canyon (Figure 17) originated in a zone just below the SW/NE trending ridge crest. The source area is a 250 m high cliff face with an average angle of 55° and in places approaching 75°. Similarly to the talus slope at Grapevine Canyon in the LS study area, a 30° talus fan slopes down to the Williamson Creek below this rock face. Talus cones in both areas are slightly below the initial yield angle of repose for talus fans [77], suggesting that they are not continuously fed by new material and hence relax through weathering and creep over time (angle of rest) and only add new debris through intermittent events [78,79].

4. Discussion

In the absence of other factors, the spatial density of coseismic rockfall and landslide events is determined primarily by the intensity of ground shaking [71]. However, seismic wave attenuation and site effects can influence the spatial distribution of these failures [72,73]. Research has shown that topographic scattering [69,80,81,82,83] is an important and sometimes large source of seismic amplification. This amplification occurs near the top of a hill or mountain and along the crest of a ridge and occurs over a broad range of frequencies [69]. This topographic relief effect has a profound influence on the propagation of seismic waves, giving rise to zones of amplification or damping of ground acceleration in specific topographic locations resulting in clustering of failures [72].
Past work [72,81,82] has shown a distinct preference for failures on slopes facing away rather than toward the earthquake source. Distal slopes facing away from the seismic source in the Finisterre Mountains of Papua New Guinea and in central west Taiwan were found to be four- to five-times more likely to fail [72]. However, we found that a large percentage of rockfall failures in both study areas did not follow this pattern and rather the distributions we mapped appear to be highly influenced by seismic amplification by topography. The most favorable condition for triggering this type of rockfall is when the direction of vibration is orthogonal to the direction of propagation of the wave [83].
It has been noted [69] that the presence of shattered rock at the top of prominences and disruptions of rocks and boulders near hill crests also indicate the occurrence of past intense shaking in elevated areas of rugged topography. Peak ground acceleration at the scale of individual ridges also produces a pattern of earthquake induced slope failure that is elevated in proportion to the amplitude and duration of shaking [72].
This “hillcrest” effect was especially pronounced in the LS region, which was impacted by the larger Ridgecrest MW7.1 event. In Figure 18, we illustrate the topography of Owens Peak and Grapevine Canyon that drains the eastern slopes of Owens Peak. Of the 58 rockfalls mapped for the Ridgecrest event, 33 were located in this area. A cluster of failures occurs along the main Sierra Crest north and south of Owens Peak, a ridge that is perpendicular to the incoming earthquake source wave (Figure 18). This amplification, with failures perpendicular to the incoming seismic waves, is also apparent in the HS region, with pronounced failure clusters on slopes in Williamson Canyon (Figure 17).

5. Conclusions

Compared to the European Alps and the Himalayas, California’s Sierra Nevada mountains generate relatively infrequent massive rockfalls and rockslides. Documenting these distributions is important since, unlike the rich rockfall distribution records from other regions, only a small number of rockfall inventories exist for specific Sierran earthquakes. The outcome of the rockfall mapping two moderately large (MW7.1 and MW5.8) recent earthquakes in the Sierra Nevada Mountains suggests that they exhibited somewhat different behaviors. Specifically;
  • While both epicenters were in valley bottoms ~20–25 km from the north-south trending main Sierran crest, the smaller Owens Lake event produced approximately two-times as many recognizable rockfalls greater than 1000 m2 in size than the stronger Ridgecrest event.
  • The anomaly in intensity between the two earthquakes and the resultant rockfall totals suggests that the glacially oversteepened slopes of the HS may have a lower threshold for failure.
  • While both areas experienced some degree of seismic amplification, in the southern LS area, these effects were far more pronounced likely due to the significantly higher displacements from the Ridgecrest event and the orientation of ridgelines.
  • In both areas, amplification of ground motion by local topography likely generated self-triggering processes that reactivated existing rockfall source areas.
Finally, we note that the incorporation of past rockfall distributions, along with estimates of earthquake magnitude and loss of seismic wave energy with source distance, may be a means by which ShakeMap can be modified beyond its original purpose of predicting coseismic landslides to aid the development of and/or improve current predictive rockfall models. The application of our approach may provide a temporally and spatially complete dataset for smaller sized earthquakes that can be used in the assessment of magnitude-frequency relationships for current, historic and pre-historic rockfall events in the Sierra Nevada and other understudied mountain regions globally.

Author Contributions

Conceptualization, L.A.S.; methodology, L.A.S. and E.A.O.; validation, L.A.S., E.A.O. and T.N.-M.; formal analysis, L.A.S., E.A.O. and T.N.-M.; investigation, L.A.S., E.A.O. and T.N.-M.; resources, L.A.S.; data curation, L.A.S.; writing—original draft preparation, L.A.S.; writing—review and editing, L.A.S., E.A.O. and T.N.-M.; visualization, L.A.S.; supervision, L.A.S.; project administration, L.A.S. All authors have read and agreed to the published version of the manuscript.

Funding

This research received no external funding.

Data Availability Statement

All processed data sets available at University of New Mexico Digital Repository (https://digitalrepository.unm.edu/). (Final stable Web address to be provided upon publication). Earthquake event data and ShakeMap predictions can be accessed from sites listed in Table 2. Original Sentinel-2 imagery available and downloadable at https://apps.sentinel-hub.com/ or from the USGS at https://earthexplorer.usgs.gov/.

Acknowledgments

The authors would like to thank Elaine Jackson for images of the Ridgecrest event rockfalls and resultant dust cloud images (Accessed 8 July 2019), Steven Wheeler for images of dust clouds generated by the Owens Lake event (Accessed 8 July 2020), and Carma Roper of the Inyo County Sheriff’s Department (Accessed 10 August 2020) for images of rockfall debris in and around Whitney Portal. Thanks also to the University of New Mexico Department of Earth and Planetary Sciences for computing access and to the University of New Mexico Digital Repository for storage and providing access to datasets.

Conflicts of Interest

The authors declare no conflict of interest.

References

  1. Lacasse, S.; Eidsvik, U.; Nadim, F.; Hoeg, K.; Blikra, L.H. Event Tree Analysis of Aknes Rock Slide Hazard. In Proceedings of the 4th Canadian Conference on Geohazards, Quebec City, QC, Canada, 20–24 May 2008; pp. 20–24. [Google Scholar]
  2. Sättele, M.; Krautblatter, M.; Bründl, M.; Straub, D. Forecasting rock slope failure: How reliable and effective are warning systems? Landslides 2016, 13, 737–750. [Google Scholar] [CrossRef]
  3. Keefer, D.K. The importance of earthquake-induced landslides to long-term slope erosion and slope-failure hazards in seismically active regions. In Geomorphology and Natural Hazards; Elsevier: Amsterdam, The Netherlands, 1 January 1994; pp. 265–284. [Google Scholar] [CrossRef]
  4. Stock, G.M.; Uhrhammer, R.A. Catastrophic rock avalanche 3600 years BP from El Capitan, Yosemite Valley, California. Earth Surf. Process. Landforms 2010, 35, 941–951. [Google Scholar] [CrossRef]
  5. Cruden, D.M.; Varnes, D.J. Landslide types and processes. In Landslides: Investigation and Mitigation; Turner, A.K., Schuster, R.L., Eds.; Special Report; Transportation Research Board: Washington, DC, USA, 1996; Volume 247, pp. 36–75. [Google Scholar]
  6. Hungr, O.; Leroueil, S.; Picarelli, L. The Varnes classification of landslide types, an update. Landslides 2014, 11, 167–194. [Google Scholar] [CrossRef]
  7. Corominas, J.; Mavrouli, O.; Ruiz-Carulla, R. Magnitude and frequency relations: Are there geological constraints to the rockfall size? Landslides 2018, 15, 829–845. [Google Scholar] [CrossRef]
  8. Matthes, F. Geologic history of the Yosemite Valley. U.S. Geol. Surv. Prof. Pap. 1930, 160, 137. [Google Scholar]
  9. Adams, J. Contemporary Uplift and Erosion of the Southern Alps, New Zealand. GSA Bull. 1980, 91, 1–114. [Google Scholar] [CrossRef]
  10. Pearce, A.J.; Watson, A.J. Effects of earthquake-induced landslides on sediment budget and transport over a 50-yr period. Geology 1986, 14, 52–55. [Google Scholar] [CrossRef]
  11. Wieczorek, G.F.; Snyder, J.B.; Alger, C.S.; Isaacson, K.A. Rock Falls in Yosemite Valley, California; US Geological Survey: Menlo Park, CA, USA, 31 December 1992; pp. 92–387. [Google Scholar]
  12. Hovius, N.; Meunier, P.; Lin, C.-W.; Chen, H.; Chen, Y.-G.; Dadson, S.; Horng, M.-J.; Lines, M. Prolonged seismically induced erosion and the mass balance of a large earthquake. Earth Planet. Sci. Lett. 2011, 304, 347–355. [Google Scholar] [CrossRef]
  13. Li, G.; West, A.J.; Densmore, A.L.; Jin, Z.; Parker, R.N.; Hilton, R.G. Seismic mountain building: Landslides associated with the 2008 Wenchuan earthquake in the context of a generalized model for earthquake volume balance. Geochem. Geophys. Geosystems 2014, 15, 833–844. [Google Scholar] [CrossRef]
  14. Marc, O.; Hovius, N.; Meunier, P.; Gorum, T.; Uchida, T. A seismologically consistent expression for the total area and volume of earthquake-triggered landsliding. J. Geophys. Res. Earth Surf. 2016, 121, 640–663. [Google Scholar] [CrossRef]
  15. Malamud, B.D.; Turcotte, D.L.; Guzzetti, F.; Reichenbach, P. Landslides, earthquakes, and erosion. Earth Planet. Sci. Lett. 2004, 229, 45–59. [Google Scholar] [CrossRef]
  16. Broeckx, J.; Rossi, M.; Lijnen, K.; Campforts, B.; Poesen, J.; Vanmaercke, M. Landslide mobilization rates: A global analysis and model. Earth-Sci. Rev. 2020, 201, 102972. [Google Scholar] [CrossRef]
  17. Sboras, S.; Lazos, I.; Mouzakiotis, E.; Karastathis, V.; Pavlides, S.; Chatzipetros, A. Fault modelling, seismic sequence evolution and stress transfer scenarios for the 20 July 2017 (MW 6.6) Kos–Gökova Gulf earthquake, SE Aegean. Acta Geophys. 2020, 68, 1245–1261. [Google Scholar] [CrossRef]
  18. Tong, P.; Yao, J.; Liu, Q.; Li, T.; Wang, K.; Liu, S.; Cheng, Y.; Wu, S. Crustal Rotation and Fluids: Factors for the 2019 Ridgecrest Earthquake Sequence? Geophys. Res. Lett. 2021, 48, e2020GL090853. [Google Scholar] [CrossRef]
  19. Yang, Z.; Zhao, D.; Cheng, B.; Dong, Y. Structural control on the 2019 Ridgecrest earthquake from local seismic tomography. Phys. Earth Planet. Inter. 2022, 324, 106853. [Google Scholar] [CrossRef]
  20. Nanjo, K.Z. Were changes in stress state responsible for the 2019 Ridgecrest, California, earthquakes? Nat. Commun. 2020, 11, 3082. [Google Scholar] [CrossRef]
  21. Stock, G.M.; Collins, B.D.; Santaniello, D.J.; Zimmer, V.L.; Wieczorek, G.F.; Snyder, J.B. Historical Rock Falls in Yosemite National Park, California (1857–2011); US Department of the Interior, US Geological Survey: Menlo Park, CA, USA, 2013; p. 17. Available online: https://pubs.usgs.gov/ds/746/ (accessed on 3 June 2022).
  22. Benjamin, J.; Rosser, N.; Brain, M. Emergent characteristics of rockfall inventories captured at a regional scale. Earth Surf. Process. Landforms 2020, 45, 2773–2787. [Google Scholar] [CrossRef]
  23. Worden, C.; Thompson, E.; Hearne, M.; Wald, D.B. ShakeMap Manual Online: Technical Manual., User’s Guide, and Software Guide, U.S. Geological Survey. 2020. Available online: http://usgs.github.io/shakemap/ (accessed on 3 June 2022).
  24. Bateman, P.C.; Wahrhaftig, C.; Bailey, E.H. Geology of the Sierra Nevada. In Geology of Northern California: California Division of Mines and Geology Bulletin; California Division of Mines & Geology: Sacramento, CA, USA, 1966; Volume 190, pp. 107–172. [Google Scholar]
  25. Bateman, P.C.; Eaton, J.P. Sierra Nevada Batholith: The batholith was generated within a synclinorium. Science 1967, 158, 1407–1417. [Google Scholar] [CrossRef]
  26. Le, K.; Lee, J.; Owen, L.A.; Finkel, R. Late Quaternary slip rates along the Sierra Nevada frontal fault zone, California: Slip partitioning across the western margin of the Eastern California Shear Zone-Basin and Range Province. GSA Bull. 2007, 119, 240–256. [Google Scholar] [CrossRef]
  27. Stevens, C.H.; Stone, P.; Blakely, R.J. Structural Evolution of the East Sierra Valley System (Owens Valley and Vicinity), California: A Geologic and Geophysical Synthesis. Geosciences 2013, 3, 176–215. [Google Scholar] [CrossRef]
  28. Moore, J.G.; Moring, B.C. Rangewide glaciation in the Sierra Nevada, California. Geosphere 2013, 9, 1804–1818. [Google Scholar] [CrossRef]
  29. Scuderi, L.A. Late-Holocene upper timberline variation in the southern Sierra Nevada. Nature 1987, 325, 242–244. [Google Scholar] [CrossRef]
  30. Scuderi, L.A.; Fawcett, P.J. Holocene environmental change resets lichen surface dates on Recess Peak glacial deposits in the Sierra Nevada, California. Quat. Res. 2013, 80, 180–188. [Google Scholar] [CrossRef]
  31. Beanland, S.; Clark, M.M. The Owens Valley Fault Zone, Eastern California, and Surface Faulting Associated with the 1872 Earthquake; US Geological Survey: Menlo Park, CA, USA, 1994. [Google Scholar] [CrossRef]
  32. Hough, S.E.; Hutton, K. Revisiting the 1872 Owens Valley, California, Earthquake. Bull. Seism. Soc. Am. 2008, 98, 931–949. [Google Scholar] [CrossRef]
  33. Muir, J. The Yosemite: New York; The Century Company: Lewistown, MT, USA, 1912. [Google Scholar]
  34. Wieczorek, G.F. Catastrophic rockfalls and rockslides in the Sierra Nevada, USA. CatastRophic Landslides: V. Effects, Occurrence and Mechanisms; Evans, S., DeGraff, J., Eds.; Reviews in Engineering Geology XV.; Geological Society of America: Boulder, CO, USA, 2002; pp. 165–190. [Google Scholar] [CrossRef]
  35. Wieczorek, G.F.; Jäger, S. Triggering mechanisms and depositional rates of postglacial slope-movement processes in the Yosemite Valley, California. Geomorphology 1996, 15, 17–31. [Google Scholar] [CrossRef]
  36. Wieczorek, G.F.; Morrissey, M.M.; Iovine, G.; Godt, J. Rock-Fall Potential in the Yosemite Valley, California; US Geological Survey Open-File Report; US Geological Survey: Menlo Park, CA, USA, 1999; Volume 99, p. 1. [Google Scholar]
  37. Wieczorek, G.F.; Snyder, J.B. Historical Rock Falls in Yosemite National Park, California; US Geological Survey Open-File Report; US Geological Survey: Menlo Park, CA, USA, 2004; Volume 3, p. 491. [Google Scholar]
  38. Given, J.W.; Wallace, T.C.; Kanamori, H. Teleseismic analysis of the 1980 Mammoth Lakes earthquake sequence. Bull. Seism. Soc. Am. 1982, 72, 1093–1109. [Google Scholar] [CrossRef]
  39. Harp, E.; Tanaka, K.; Sarmiento, J.; Keefer, D. Landslides from the 25–27 May 1980, Mammoth Lakes, California, Earthquake Sequence; US Geological Survey Miscellaneous Investigations Series Map I-1612; US Geological Survey: Menlo Park, CA, USA, 1984. [Google Scholar]
  40. Lee, J.; Spencer, J.; Owen, L. Holocene slip rates along the Owens Valley fault, California: Implications for the recent evolution of the Eastern California Shear Zone. Geology 2001, 29, 819–822. [Google Scholar] [CrossRef]
  41. Lee, J.; Stockli, D.; Schroeder, J.; Tincher, C.; Bradley, D.; Owen, L.; Gosse, J.; Finkel, R.; Garwood, J. Fault Slip Transfer in the Eastern California Shear Zone-Walker Lane Belt: Geological Society of America Penrose Conference Field Trip Guide; US Geological Survey: Menlo Park, CA, USA, 2006; 26p, (Kinematics and Geodynamics of Intraplate Dextral Shear in Eastern California and Western Nevada, Mammoth Lakes, California, 21–26 April 2005). [Google Scholar] [CrossRef]
  42. Cordes, S.E.; Stock, G.M.; Schwab, B.E.; Glazner, A.F. Supporting Evidence for a 9.6 1 ka Rock Fall Originating from Glacier Point in Yosemite Valley, California. Environ. Eng. Geosci. 2013, 19, 345–361. [Google Scholar] [CrossRef]
  43. Bacon, S.N.; Bullard, T.F.; Keen-Zebert, A.K.; Jayko, A.S.; Decker, D.L. Spatiotemporal patterns of distributed slip in southern Owens Valley indicated by deformation of late Pleistocene shorelines, eastern California. GSA Bull. 2020, 132, 1681–1703. [Google Scholar] [CrossRef]
  44. Bull, W.; King, J.; Kong, F.; Moutoux, T.; Phillips, W. Lichen dating of coseismic landslide hazards in alpine mountains. Geomorphol. Nat. Hazards 1994, 10, 253–264. [Google Scholar] [CrossRef]
  45. Dussauge-Peisser, C.; Helmstetter, A.; Grasso, J.-R.; Hantz, D.; Desvarreux, P.; Jeannin, M.; Giraud, A. Probabilistic approach to rock fall hazard assessment: Potential of historical data analysis. Nat. Hazards Earth Syst. Sci. 2002, 2, 15–26. [Google Scholar] [CrossRef]
  46. Guzzetti, F.; Malamud, B.D.; Turcotte, D.L.; Reichenbach, P. Power-law correlations of landslide areas in central Italy. Earth Planet. Sci. Lett. 2002, 195, 169–183. [Google Scholar] [CrossRef]
  47. Guzzetti, F.; Reichenbach, P.; Wieczorek, G.F. Rockfall hazard and risk assessment in the Yosemite Valley, California, USA. Nat. Hazards Earth Syst. Sci. 2003, 3, 491–503. [Google Scholar] [CrossRef]
  48. Picarelli, L.; Oboni, F.; Evans, S.; Mostyn, G.; Fell, R. Hazard characterization and quantification. In Landslide Risk Management; Hungr, O., Fell, R., Couture, R., Eberthardt, E., Eds.; Taylor and Francis: London, UK, 2005; pp. 37–61. [Google Scholar] [CrossRef]
  49. Tanyaş, H.; Allstadt, K.E.; van Westen, C.J. An updated method for estimating landslide-event magnitude. Earth Surf. Process. Landforms 2018, 43, 1836–1847. [Google Scholar] [CrossRef]
  50. Nowicki, M.A.; Wald, D.J.; Hamburger, M.W.; Hearne, M.; Thompson, E.M. Development of a globally applicable model for near real-time prediction of seismically induced landslides. Eng. Geol. 2014, 173, 54–65. [Google Scholar] [CrossRef]
  51. Nowicki Jessee, M.A.; Hamburger, M.W.; Allstadt, K.; Wald, D.J.; Robeson, S.M.; Tanyas, H.; Hearne, M.; Thompson, E.M. A Global Empirical Model for Near-Real-Time Assessment of Seismically Induced Landslides. J. Geophys. Res. Earth Surf. 2018, 123, 1835–1859. [Google Scholar] [CrossRef]
  52. Allstadt, K.E.; Jibson, R.W.; Thompson, E.M.; Massey, C.I.; Wald, D.J.; Godt, J.W.; Rengers, F.K. Improving Near-Real-Time Coseismic Landslide Models: Lessons Learned from the 2016 Kaikōura, New Zealand, Earthquake Improving Near-Real-Time Coseismic Landslide Models. Bull. Seism. Soc. Am. 2018, 108, 1649–1664. [Google Scholar] [CrossRef]
  53. Massey, C.; Townsend, D.; Rathje, E.; Allstadt, K.E.; Lukovic, B.; Kaneko, Y.; Bradley, B.; Wartman, J.; Jibson, R.W.; Petley, D.N.; et al. Landslides Triggered by the 14 November 2016 Mw 7.8 Kaikōura Earthquake, New Zealand. Bull. Seism. Soc. Am. 2018, 108, 1630–1648. [Google Scholar] [CrossRef]
  54. Robinson, T.R.; Rosser, N.J.; Davies, T.R.; Wilson, T.M.; Orchiston, C. Near-Real-Time Modeling of Landslide Impacts to Inform Rapid Response: An Example from the 2016 Kaikōura, New Zealand, Earthquake. Bull. Seism. Soc. Am. 2018, 108, 1665–1682. [Google Scholar] [CrossRef]
  55. Evans, E.L.; Thatcher, W.R.; Pollitz, F.F.; Murray, J.R. Persistent slip rate discrepancies in the eastern California (USA) shear zone. Geology 2016, 44, 691–694. [Google Scholar] [CrossRef]
  56. Chen, K.; Avouac, J.-P.; Aati, S.; Milliner, C.; Zheng, F.; Shi, C. Cascading and pulse-like ruptures during the 2019 Ridgecrest earthquakes in the Eastern California Shear Zone. Nat. Commun. 2020, 11, 1–8. [Google Scholar] [CrossRef] [PubMed]
  57. Sauber, J.; Thatcher, W.; Solomon, S.C.; Lisowski, M. Geodetic slip rate for the eastern California shear zone and the recurrence time of Mojave desert earthquakes. Nature 1994, 367, 264–266. [Google Scholar] [CrossRef]
  58. Dixon, T.H.; Norabuena, E.; Hotaling, L. Paleoseismology and Global Positioning System: Earthquake-cycle effects and geodetic versus geologic fault slip rates in the Eastern California shear zone. Geology 2003, 31, 55–58. [Google Scholar] [CrossRef]
  59. Wallace, R.E. Patterns and timing of Late Quaternary faulting in the Great Basin Province and relation to some regional tectonic features. J. Geophys. Solid Earth 1984, 89, 5763–5769. [Google Scholar] [CrossRef]
  60. Nur, A.; Ron, H.; Beroza, G.C. The Nature of the Landers-Mojave Earthquake Line. Science 1993, 261, 201–203. [Google Scholar] [CrossRef]
  61. Thatcher, W.; Savage, J.C.; Simpson, R.W. The Eastern California Shear Zone as the northward extension of the southern San Andreas Fault. J. Geophys. Res. Solid Earth 2016, 121, 2904–2914. [Google Scholar] [CrossRef]
  62. Du, Y.; Aydin, A. Is the San Andreas big bend responsible for the Landers earthquake and the eastern California shear zone? Geology 1996, 24, 219–222. [Google Scholar] [CrossRef]
  63. Oldow, J.S.; Geissman, J.W.; Stockli, D.F. Evolution and Strain Reorganization within Late Neogene Structural Stepovers Linking the Central Walker Lane and Northern Eastern California Shear Zone, Western Great Basin. Int. Geol. Rev. 2008, 50, 270–290. [Google Scholar] [CrossRef]
  64. Murray, J.R.; Svarc, J. Global Positioning System Data Collection, Processing, and Analysis Conducted by the U.S. Geological Survey Earthquake Hazards Program. Seism. Res. Lett. 2017, 88, 916–925. [Google Scholar] [CrossRef]
  65. Gascon, F.; Cadau, E.; Colin, O.; Hoersch, B.; Isola, C.; Fernández, B.; Martimort, P. Copernicus Sentinel-2 Mission: Products, Algorithms and Cal/Val. In Proceedings of the SPIE 2018, Earth Observing Systems XIX, 92181E, San Diego, CA, USA, 26 September 2014; International Society for Optics and Photonics: Washington, DC, USA, 2014. [Google Scholar] [CrossRef]
  66. Avouac, J.; Leprince, S. Geodetic Imaging Using Optical Systems. In Treatise on Geophysics, 2nd ed.; Elsevier: Amsterdam, The Netherlands, 2015; pp. 387–424. [Google Scholar] [CrossRef]
  67. ESRI ArcGIS Desktop: Release 10.8.1.; Environmental Systems Research Institute: Redlands, CA, USA, 2022.
  68. USGS. U.S. Geological Survey National Geospatial Program: The National Map. Data. Available online: https://viewer.nationalmap.gov/advanced-viewer/ (accessed on 10 July 2019).
  69. Bouchon, M.; Schultz, C.A.; Toksöz, M.N. Effect of three-dimensional topography on seismic motion. J. Geophys. Res. Solid Earth 1996, 101, 5835–5846. [Google Scholar] [CrossRef]
  70. Parise, M.; Jibson, R.W. A seismic landslide susceptibility rating of geologic units based on analysis of characteristics of landslides triggered by the 17 January, 1994 Northridge, California earthquake. Eng. Geol. 2000, 58, 251–270. [Google Scholar] [CrossRef]
  71. Meunier, P.; Hovius, N.; Haines, A.J. Regional patterns of earthquake-triggered landslides and their relation to ground motion. Geophys. Res. Lett. 2007, 34, L20408. [Google Scholar] [CrossRef]
  72. Meunier, P.; Hovius, N.; Haines, J.A. Topographic site effects and the location of earthquake induced landslides. Earth Planet. Sci. Lett. 2008, 275, 221–232. [Google Scholar] [CrossRef]
  73. Meunier, P.; Uchida, T.; Hovius, N. Landslide patterns reveal the sources of large earthquakes. Earth Planet. Sci. Lett. 2013, 363, 27–33. [Google Scholar] [CrossRef]
  74. Yagi, H.; Sato, G.; Higaki, D.; Yamamoto, M.; Yamasaki, T. Distribution and characteristics of landslides induced by the Iwate–Miyagi Nairiku Earthquake in 2008 in Tohoku District, Northeast Japan. Landslides 2009, 6, 335–344. [Google Scholar] [CrossRef]
  75. Gorum, T.; Fan, X.; van Westen, C.J.; Huang, R.Q.; Xu, Q.; Tang, C.; Wang, G. Distribution pattern of earthquake-induced landslides triggered by the 12 May 2008 Wenchuan earthquake. Geomorphology 2011, 133, 152–167. [Google Scholar] [CrossRef]
  76. Gorum, T.; van Westen, C.J.; Korup, O.; van der Meijde, M.; Fan, X.; van der Meer, F.D. Complex rupture mechanism and topography control symmetry of mass-wasting pattern, 2010 Haiti earthquake. Geomorphology 2013, 184, 127–138. [Google Scholar] [CrossRef]
  77. Deganutti, A.M.; Tecca, P.R.; Genevois, R. The measure of friction angles for different types of granular material. J. Mt. Sci. 2019, 16, 769–777. [Google Scholar] [CrossRef]
  78. Van Burkalow, A. Angle of repose and angle of sliding friction: An experimental study. Geol. Soc. Am. Bull. 1945, 56, 669–707. [Google Scholar] [CrossRef]
  79. Carson, M.A. Angles of repose, angles of shearing resistance and angles of talus slopes. Earth Surf. Process. 1977, 2, 363–380. [Google Scholar] [CrossRef]
  80. Boore, D.M.; Joyner, W.B. Site amplifications for generic rock sites. Bull. Seism. Soc. Am. 1997, 87, 327–341. [Google Scholar] [CrossRef]
  81. Duan, Y.; Fu, L.-Y. Topographic scattering effects on seismic data: From seismic numerical modeling to field data. ASEG Ext. Abstr. 2001, 2001, 1–4. [Google Scholar] [CrossRef]
  82. Pilz, M.; Fäh, D. The contribution of scattering to near-surface attenuation. J. Seism. 2017, 21, 837–855. [Google Scholar] [CrossRef]
  83. Valagussa, A.; Frattini, P.; Crosta, G.B. Earthquake-induced rockfall hazard zoning. Eng. Geol. 2014, 182, 213–225. [Google Scholar] [CrossRef]
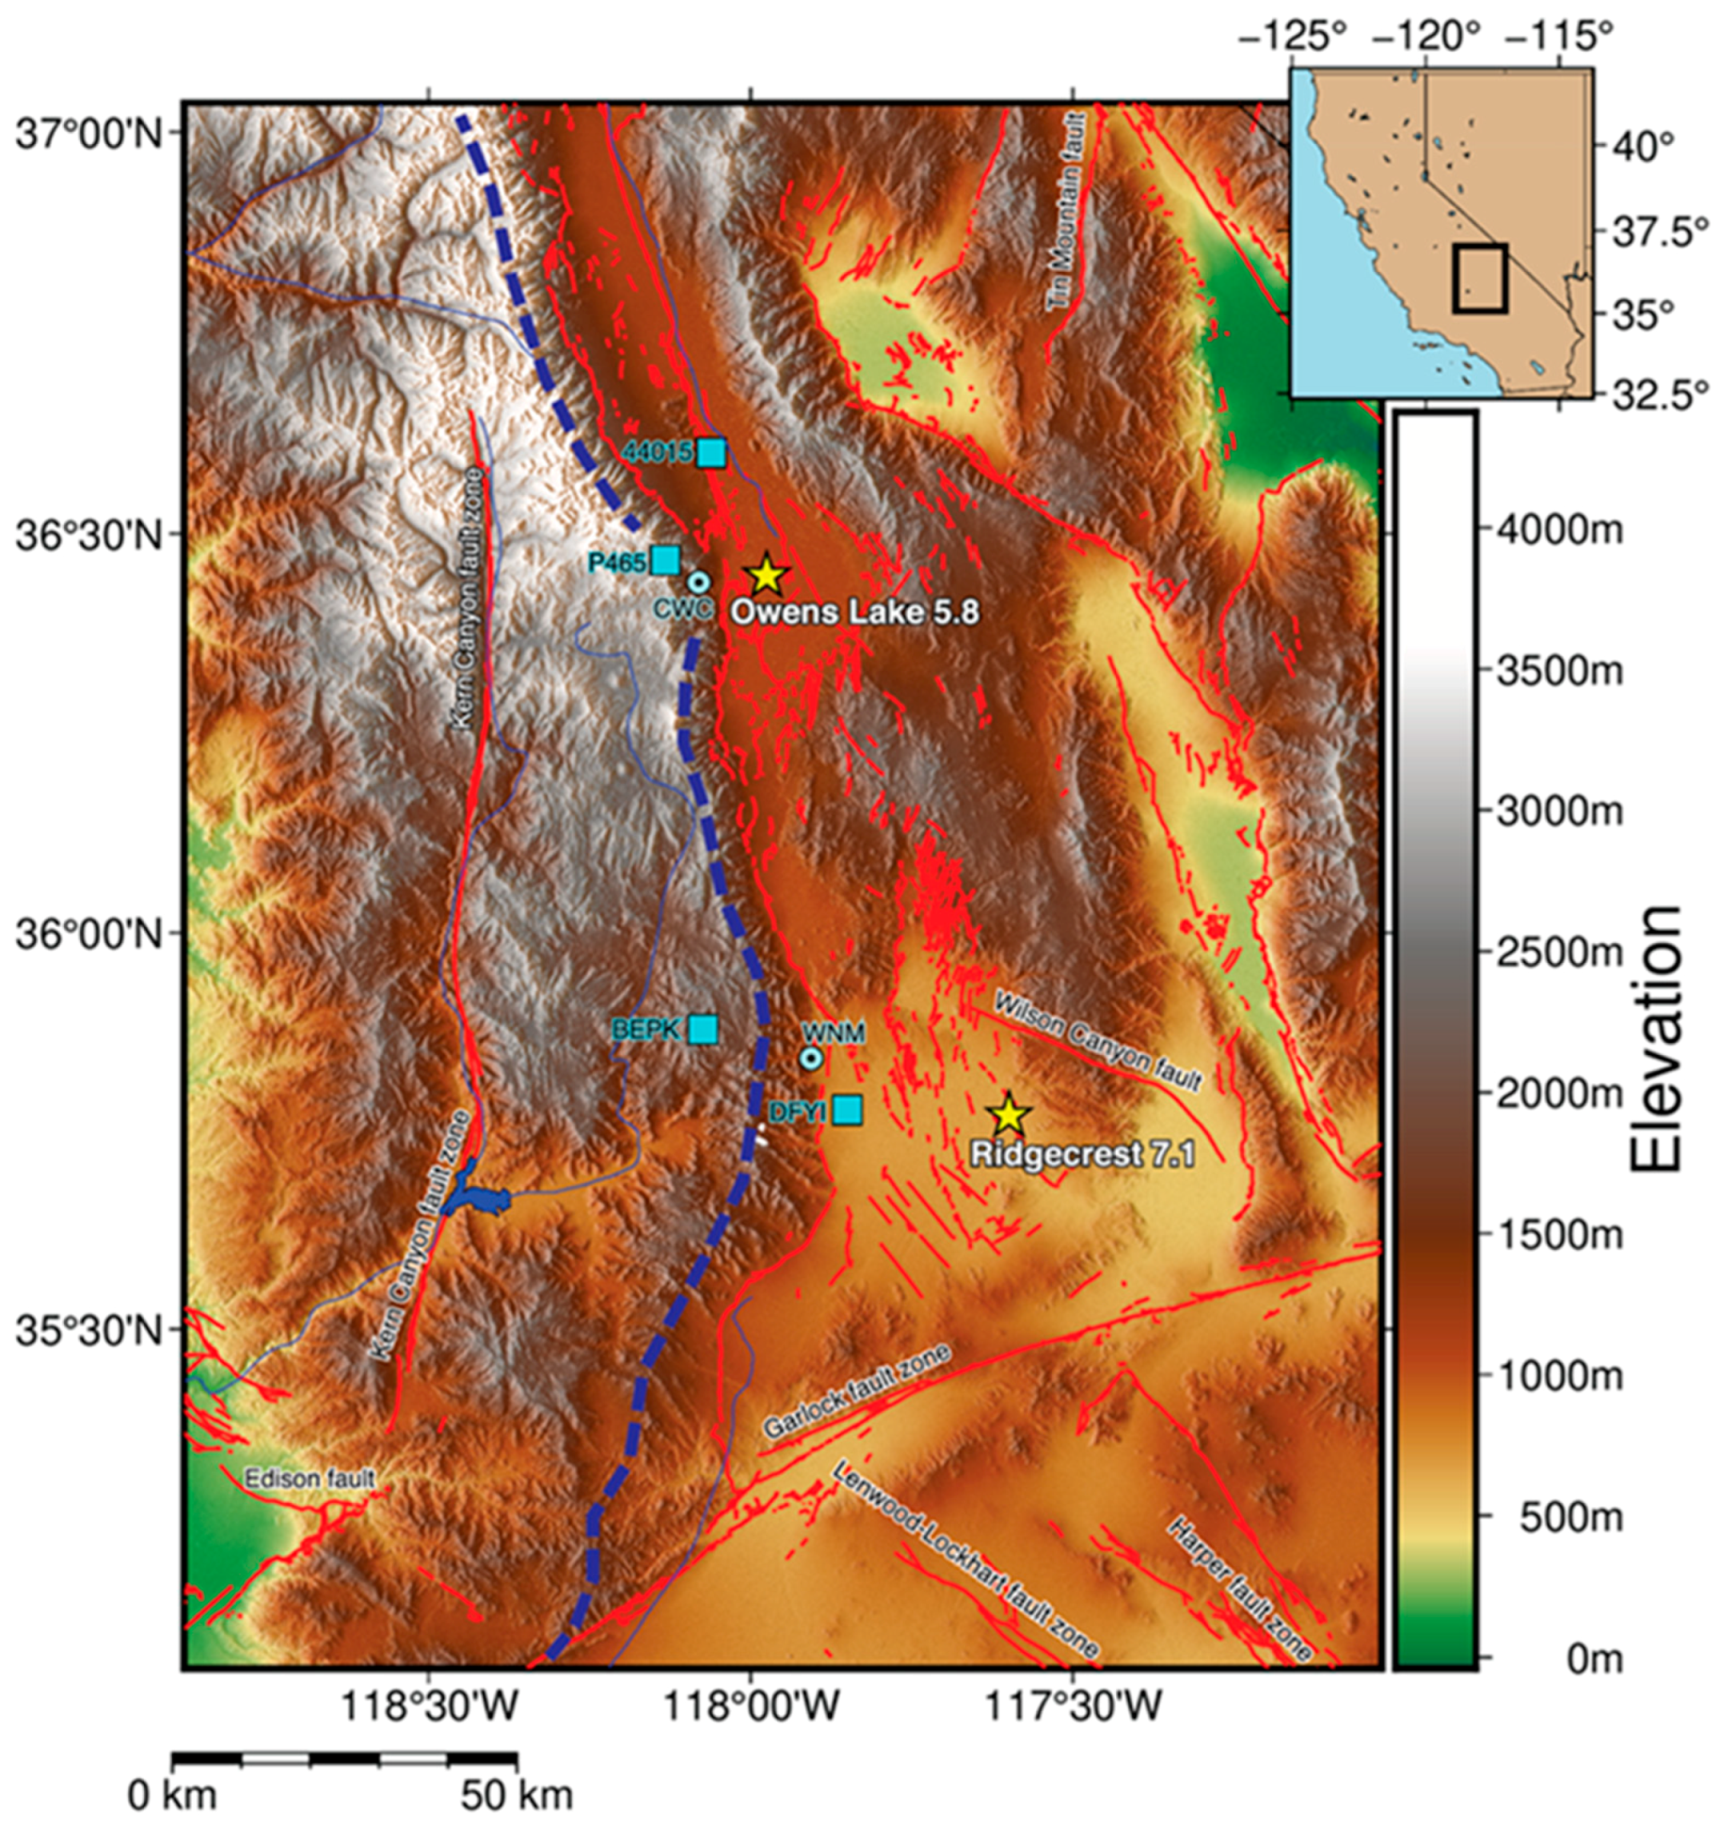
Figure 1. Study areas. Location of the 5 July 2019 MW7.1 Ridgecrest and 24 June 2020 MW5.8 Owens Lake earthquakes (Stars). The High Sierra (HS) and Lower Sierra (LS) study areas are found to the west of these two epicenters. Major faults and fault zones shown in red. GPS stations are shown with blue squares, broadband seismograph stations are shown with blue dotted circles. The approximate western boundary of the Walker Lane/eastern California Shear Zone is shown as a dashed blue line (after [27]).
Remotesensing 15 01962 g001
Figure 2. Southern Sierran structural types, major faults and lineaments. Red asterisks indicate approximate positions of the earthquake epicenters reported herein. Both earthquake shocks radiated across deep basins and produced severe shaking in the study areas in the Sierran Block (See Figure 1 for more detailed fault traces). The Sierra Nevada range front fault zone (not shown) runs along the western edges of the Indian Wells, Rose and Owens Basin Blocks (after [27]).
Remotesensing 15 01962 g002
Figure 3. Seismograms for both events. Top: raw seismograms for the MW5.8 Owens Lake earthquake recorded at station CWC: Southern California Seismic Network. Vertical, north, and east components as a function of time in seconds relative to 2020-06-24T17:40:48.9983. Bottom: raw seismograms for the MW7.1 Ridgecrest event recorded at station WNM: Southern California Seismic Network. Vertical, north, and east components as a function of time in seconds relative to 2019-07-06T03:19:53. The source of the waveform data for both events is provided in Table 2.
Remotesensing 15 01962 g003
Figure 4. Directional components and moment tensors of the two events. Top left: GPS station BEPK: Long Valley Network. North, east, and up components as a function of time over the last 15 years (start date 1 July 2007) for the MW7.1 Ridgecrest earthquake. Top right: Ridgecrest earthquake moment tensor. Principal axes (T = Tension, P = Pressure and N = Null) T 277°, P 186°, N 14°. Bottom left: GPS station P465: Long Valley Network. North, east, and up components of the station as a function of time over the last 15 years (start date 1 July 2007) for the MW5.8 Owens Lake earthquake. Bottom right: moment tensor. T 7°, 92°, P 46°, 190°. The sources of the directional offsets and moment tensors are provided in Table 2.
Remotesensing 15 01962 g004
Figure 5. Dust clouds and debris fields from both events. Top left: rockfalls coincident with the Ridgecrest earthquake. Top right: dust clouds from the Ridgecrest event moving across the region shortly afterwards. Bottom left: Whitney Portal rockfall with large boulder in campground. Bottom center: rockfall debris field just above and southwest of the Whitney Portal Campground. Bottom right: dust clouds from the Owens Lake earthquake rockfalls moving across the region. The dust cloud on the right is from failures on a 200 m high rock face on lower Diaz Creek. (Ridgecrest images with permission from of Elaine Jackson. Whitney Portal rockfall images with permission from Carma Roper of the Inyo County Sheriff’s Department. Owens Lake dust cloud image with permission from Steven Wheeler).
Remotesensing 15 01962 g005
Figure 6. Difference value distribution for the University Peak subarea. Distribution of ~2.7-million-pixel values. Darkening/brightening tail implies that individual pixels had a lower/higher Digital Number (DN) value in successive images. The expected difference of 0.0 (equal random brightening and darkening) differs from the population mean of all pixels of ~−4.0. This is primarily due to the impact of exposure of darker rock because of snowfield melt off. Shadowing differences between image pairs were responsible for both brightening and darkening in approximately equal proportions.
Remotesensing 15 01962 g006
Figure 7. Brightness change rejection examples from the Mount Whitney region. Left and right image pairs are pre- and post-earthquake, respectively. (a) Snowfield change, (b) shadowing change, (c) lake/water body reflection. Red arrows in right hand images illustrate examples of areas with brightness changes that were eliminated.
Remotesensing 15 01962 g007
Figure 8. Rockfall locations Ridgecrest MW7.1 event. The main Sierra Nevada crest (black dashed line) runs through the region between Owens and Sawtooth Peaks at an average elevation of ~2300 m. Failures with blue dots superimposed are the largest observed (>15,000 m2). The Sawtooth Peak failure (upper light blue dot) is shown in detail in Figure 10. An example from the Grapevine Canyon failure zone (yellow circled region) is shown in detail in Figure 15.
Remotesensing 15 01962 g008
Figure 9. Upper left: percent of LS study area in different aspects. Flat (no aspect) surfaces that occur in Indian Wells Valley have been removed. Upper right: number of recorded rockfall features in each 20° aspect class for the Ridgecrest event. Bottom: distribution of mapped rockfall features by slope (degrees) of the centroid of the mapped unit.
Remotesensing 15 01962 g009
Figure 10. Rockfall failure on Sawtooth Peak. Top: Google Earth perspective view of the impacted debris chute looking from the east towards the summit of Sawtooth Peak. Red arrow points north. Lower left: 6/28/19 pre-earthquake. Lower right: 7/08/19 post-earthquake. The latter image shows a significant brightening in the middle and lower portion of the debris chute. North is up on both lower images and they are 750 m across.
Remotesensing 15 01962 g010
Figure 11. Rockfall Distribution from the MW5.8 24 June 2020 Owens Lake Earthquake. Light blue dots represent major rockfalls within the area. Central blue dot represents the Whitney Portal rockfall illustrated in Figure 13. Upper blue dot represents the large Williamson Creek rockfall illustrated in Figure 17. Black dashed line approximates the Sierra Nevada crest.
Remotesensing 15 01962 g011
Figure 12. Top left: percent of HS study area in different aspects. Flat (no aspect) surfaces that occur in Owens Valley have been removed. Top right: number of recorded rockfall features in each 20° aspect class for the Owens Lake event. Bottom: distribution of mapped rockfall features by slope of the centroid of the mapped unit.
Remotesensing 15 01962 g012
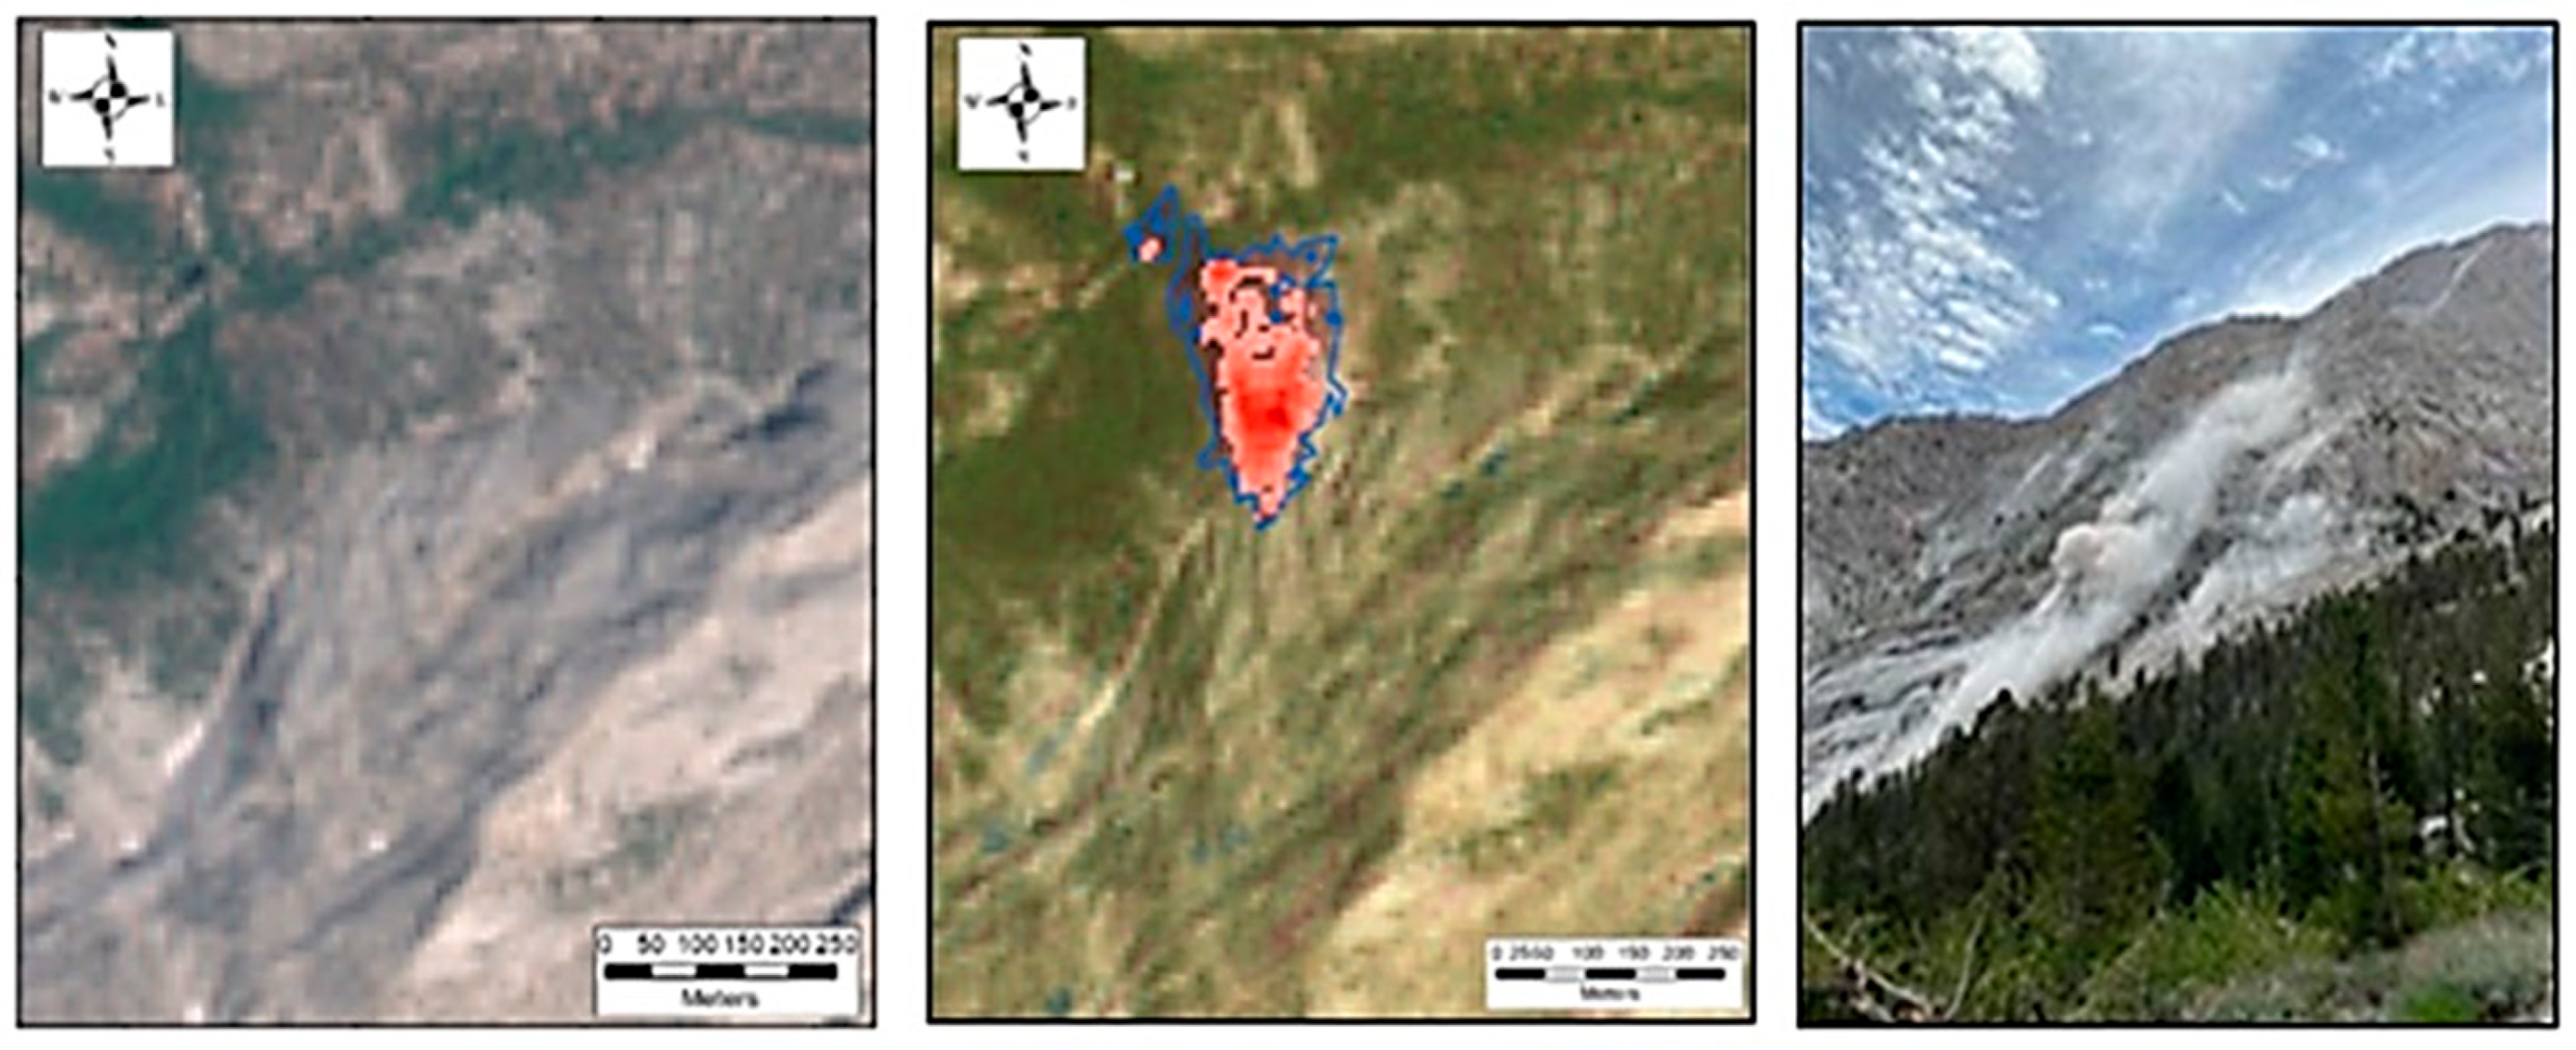
Figure 13. Whitney Portal rockfall (centered on 36.585°N 118.239°W). Left: 22 June 2020 pre-earthquake. Middle: differenced image post-earthquake. Red intensity reflects the level of difference change. Right: Whitney Portal rockfall from the Owens Lake event imaged to the ESE from Lone Pine Canyon along the Mount Whitney Trail at approximately 2800 m. Other small rockfalls can be seen to the left, right and above the main rockfall.
Remotesensing 15 01962 g013
Figure 14. ShakeMap results for the Ridgecrest earthquake LS study area. Predicted slope failure percentage computed using the Jesse et al. [51] model. Red cells indicate areas with up to a 2% probability of failure within that cell for the Ridgecrest event. Anomalously oriented rockfall features in upper Grapevine Canyon shown in black oval area circle. The largest of these failures is shown in Figure 15.
Remotesensing 15 01962 g014
Figure 15. Large rockfall event in an area not predicted by ShakeMap as having a high probability of failure. Upper left: 3 July Sentinel-2 image. Upper right: 10 July Sentinel-2 image. Yellow arrow points to the initial area of failure. Bottom left: stretched differenced results. Red pixels show large positive change in brightness. Bottom right: Google Earth view looking northwest up Grapevine Canyon with the Sierra Nevada crest forming the skyline (Sawtooth Peak to right) (Image date 1 July 2017). The red-boxed area contains the individual mapped feature shown in the bottom left box. North is to the top of all images except for the bottom right perspective view, where north is to the right and shown with a red arrow.
Remotesensing 15 01962 g015
Figure 16. ShakeMap results for the Owens Lake earthquake HS study area. Predicted slope failure percentage computed using the model from [51]. Lower central blue dot corresponds to the Whitney Portal failure shown in Figure 13, while the upper right blue dot corresponds to the Williamson Creek failure shown in Figure 17. The main Sierra Nevada crest is shown with black dashed line.
Remotesensing 15 01962 g016
Figure 17. Williamson Canyon rockfall. Upper left: pre-earthquake Sentinel-2 image (22 June 2020). Upper right: post-earthquake Sentinel-2 image (30 June 2020) with brighter disturbed area circled. Lower: perspective view looking northwest up canyon towards Mt. Tyndall (4272 m) (Google Earth Image date July 1 2017). Red areas indicate mapped failures. The largest red polygon area corresponds to the red-circled area in upper right figure. Yellow arrow points north. Upper images ~1500 m wide.
Remotesensing 15 01962 g017
Figure 18. Owens Peak failure locations LS study site. Google Earth image looking east (imagery date 1 July 2017). Owens Peak (yellow star) is the high point at the head of the southern branch of Grapevine Canyon. The large cluster of failures (red triangles) on the right of the scene are along the northern branch of Grapevine Canyon. A second large cluster of rockfalls is located close to the summit of Owens Peak along the main Sierra Nevada crest. The seismic source produced waveforms that were oriented at ~278° (green arrows) approximately perpendicular to the orientation of the main crest of the Sierra Nevada at this location. North is indicated with a red arrow at the lower right.
Remotesensing 15 01962 g018
Table 1. Data on primary shocks of the Ridgecrest July 2019 and Owens Lake June 2020 earthquakes.
Event NameDateTime
(UTC-06:00)
Magnitude
(MW)
Depth
(km)
LatitudeLongitude
Ridgecrest5 July 201921:19:537.18.035.770°N117.599°W
Owens Lake24 June 202011:40:495.84.736.447°N117.975°W
Table 2. Data sources for the Ridgecrest and Owens Lake earthquake events.
EarthquakeDownload Site
Waveforms for both eventsCalifornia Integrated Seismic Network: Southern California Seismic Network. Caltech, USGS Pasadena, and Partners, http://www.scsn.org (accessed on 18 December 2022) doi:10.7909/C3WD3xH1
Moment Tensors for both eventsCalifornia Integrated Seismic Network: Southern California Seismic Network. Caltech, USGS Pasadena, and Partners, http://www.scsn.org (accessed on 18 December 2022) doi:10.7909/C3WD3xH1
Ridgecrest directional offsetsUSGS Hazards Program, https://earthquake.usgs.gov/monitoring/gps/LongValley/bepk (accessed on 18 December 2022)
Ridgecrest ShakeMaphttps://earthquake.usgs.gov/earthquakes/eventpage/ci38457511/shakemap/intensity (accessed on 18 December 2022)
Owens Lake directional offsetsUSGS Hazards Program, https://earthquake.usgs.gov/monitoring/gps/LongValley/p465 (accessed on 18 December 2022)
Owens Lake ShakeMaphttps://earthquake.usgs.gov/earthquakes/eventpage/ci39493944/shakemap/intensity (accessed on 18 December 2022)
Disclaimer/Publisher’s Note: The statements, opinions and data contained in all publications are solely those of the individual author(s) and contributor(s) and not of MDPI and/or the editor(s). MDPI and/or the editor(s) disclaim responsibility for any injury to people or property resulting from any ideas, methods, instructions or products referred to in the content.