Article

Characterization of the East—West Spatial Uniformity for GOES-16/17 ABI Bands Using the Moon

1
Cooperative Institute for Satellite Earth System Studies (CISESS), University of Maryland, College Park, MD 20740, USA
2
NOAA/NESDIS/Center for Satellite Applications and Research, College Park, MD 20740, USA
3
Global Science & Technology, Inc., Greenbelt, MD 20774, USA
*
Author to whom correspondence should be addressed.
Remote Sens. 2023, 15(7), 1881; https://doi.org/10.3390/rs15071881
Submission received: 16 February 2023 / Revised: 22 March 2023 / Accepted: 22 March 2023 / Published: 31 March 2023

Abstract

:
The Advanced Baseline Imager (ABI) is the primary instrument onboard the NOAA Geostationary Operational Environmental Satellite-R Series (GOES-R) satellites, providing continuous weather imagery over the vast area in the Western Hemisphere. It is imperative to ensure consistent calibration accuracy within the instrument’s field of regard (FOR). This paper characterized the spatial uniformity in the east–west (EW) direction for the six ABI visible and near-infrared (VNIR) bands of the first two GOES-R satellites, GOES-16 (G16) and GOES-17 (G17), using a special collection of lunar chasing images during their post-launch testing and post-launch product testing (PLT/PLPT) periods. The EW response versus scan-angle (RVS) is examined with the normalized lunar irradiance ratios at varying scan angles combined from multiple lunar-chasing events. The impacts of straylight from the Earth were found in some of the B01–B03 lunar images. The straylight, including those scattered into the spacelook scenes near the polar regions and those leaked into space near the Moon, can cause RVS variation up to 1% for B01 and to a lesser magnitude for the other two bands. Straylight correction algorithms are applied for the accurate ABI lunar image irradiance calculation. After the corrections, the RVS variation is reduced to less than 0.3% for all the VNIR bands of both G16/17 in full-disk (FD) images. Results of this study also confirm that the Global Space-based Inter-Calibration System (GSICS) Implementation of the ROLO (GIRO) model has high relative accuracy for the ABI VNIR bands when the lunar images are collected within a relatively short time. The method described in this paper can be applied to validate the EW spatial uniformity for imagers on other geostationary satellites, including the recently launched GOES-18 and the future GOES-U satellites.

1. Introduction

GOES-16 (G16) and GOES-17 (G17) are the first two current generation Geostationary Operational Environmental Satellite-R Series (GOES-R) satellites operated by the National Oceanic and Atmospheric Administration (NOAA). G16 was launched on 19 November 2016 and became GOES-East at 75.2°W on 18 December 2017. G17 was launched on 1 March 2018 and became GOES-West at 137.2°W on 12 February 2019. Before they drifted to the operational mission positions, they were subjected to a series of intensive post-launch testing and post-launch product testing (PLT/PLPT) at the GOES-central position around 89.5°W. The Advanced Baseline Imager (ABI) is the primary instrument onboard the GOES-R satellites, providing continuous imagery of the Western Hemisphere from the geostationary orbit. This multispectral imaging radiometer consists of 16 spectral bands in the visible, near-infrared, mid-wave, and long-wave infrared portions of the electromagnetic spectrum. It can take images within its field of regard (FOR) at various time intervals with flexible scan mode and is able to scan the full disk (FD) of the Earth as fast as every five minutes. The nominal spatial resolutions of the images at different bands are 0.5, 1, and 2 km, and the radiance of all the bands are radiometrically and geometrically calibrated with state-of-the-art calibration devices and techniques [1,2]. With high spectral, spatial, and temporal resolutions and radiometric and geometric calibration accuracies, the ABI imagery is widely used for weather forecasting and environmental change studies in the Western Hemisphere. The observations from ABI in the visible and near-infrared (VNIR) wavelengths are important for many Earth science applications, such as aerosol detection, aerosol optical depth, clear-sky masks, cloud and moisture imagery, vegetation, insolation, snow, and many others [3,4].
Viewing from the geostationary orbit at about 36,000 km above the Earth Equator, each ABI, like its predecessor imager, can observe around 40 percent of the Earth’s surface. With such large spatial coverage, it is imperative to ensure consistent calibration accuracy within the ABI field of regard for the accurate interpretations and applications of the Earth surface changes derived from the ABI images. The ABI instrument has two scan mirrors that independently and simultaneously scan in the north–south (NS) and east–west (EW) directions. Radiations from different locations within ABI’s FOR impinge on the two scan mirrors at different angles before they are reflected to the telescope, resulting in angle of incidence (AOI)-dependent scan mirror reflectivity or emissivity for each ABI band. These variations were carefully characterized for all ABI bands on the ground before launch and properly accounted for during in-orbit calibration. To ensure uniform response to signal within ABI’s FOR, the spatial uniformity of the radiometric calibration accuracy should be validated with in-orbit measurements after the satellite launch.
NOAA used space as the uniform background for the IR bands to validate the scan mirror emissivity correction at all the scan angles, first at GOES Imagers and Sounders [5] and recently at the GOES-R ABI [6]. Yet, it is challenging to validate the in-orbit spatial uniformity for the solar reflective bands. Unlike the IR data, there is no such uniform bright target that appears within the FOR at VNIR bands. The Moon, however, frequently appears in the space away from the Earth but within the instrument FOR. Although the Moon has an extremely stable surface, the strong directional surface reflectance makes it challenging as a potential calibration target for the solar reflective bands. A common method is using a photometric model to simulate the lunar irradiance at varying viewing geometries. Over the past decades, the Robotic Lunar Observatory (ROLO) model [7] and its implementation by the Global Satellite Inter-Calibration System (GSICS) community, called the GSICS Implementation of the ROLO (GIRO) model [8] has been a lunar irradiance model commonly used for the satellite lunar calibration. Many studies have shown that the ROLO/GIRO model can accurately characterize the relative change in lunar irradiance for the gibbous Moon with controlled phase angles [9,10,11,12,13,14]. In 2010, NOAA used the ROLO model to characterize the EW spatial uniformity for the GOES-15 (G15) Imager visible band [15]. During the G15 satellite PLT/PLPT period, the spacecraft was once rolled northward to conduct a series of rapid scans of a bright moon when it passed through the space above the Earth’s North Pole. These intensively collected lunar images provided consecutive measurements of the lunar irradiance at varying angles to cover the whole full disk (FD) scan range in the EW direction. The ratio between the instrument measured irradiance and the ROLO simulation was used to characterize the responses versus scan-angle (RVS) performance for the Imager visible band [16].
A similar method with the Moon at varying incident angles across the GOES ABI FOR is used to assess the RVS performance for the six VNIR bands. Unlike the Imager which has one scan mirror to rotate in the east-to-west or west-to-east direction as it steps from north to south to form an image, ABI has two independent orthogonal scan mirrors with flexible scan mode to enable a quick frame refresh rate. When the Moon appears in the space within the FOR, the agile composition of the two scan mirrors can be pointed to the Moon without any special spacecraft maneuver. Figure 1 shows the ABI FOR which is a circle with a diameter of about 21°. The Moon can traverse the annulus space from west to east, and each transition covers a certain angle range in the EW direction. During the ABI PLT/PLPT periods, a series of ABI scans were conducted to collect highly intensive lunar images when the Moon at desirable phase angles passed through the FOR. In this study, these images are combined to characterize the east–west spatial uniformity of the G16 and G17 ABI VNIR bands over the full scan angle range of the FD images from −8.7° to +8.7° in the EW direction.
The paper is organized as follows. After the introduction in Section 1, Section 2 describes the lunar image collections. Section 3 introduces the ABI VNIR radiometric calibration and lunar image processing. Data analyses are explained in Section 4. The initial results are reported in Section 5. Section 6 describes the straylight correction for B01–B03. Section 7 reports the final results, followed by the final section of the conclusion in Section 8.

2. ABI Lunar Image Collections

2.1. ABI VNIR Bands

The ABI instrument consists of six VNIR bands and ten IR bands. The central wavelength of the VNIR bands ranges from 0.47 to 2.25 µm. Table 1 summarizes their main detector characteristics and the data applications. Each band has 372 to 1460 rows of the detector and each detector row consists of three or six detectors for redundancy, depending on the band. The detectors of Bands 1–3 (from 0.47 µm to 0.86 µm) are manufactured in Silicon and each row of these Silicon detectors has three columns. Bands 4–6 (from 1.38 to 2.25 µm) are fabricated with HgCdTe (MCT) [17] and each row of these MCT detectors has six columns. In operation, data collected by only one detector from each row is downlinked to the ground for data processing. The detector in use is called the best detector selected (BDS).
All the VNIR detectors are embedded in the VNIR focal plane modules (FPM), one of the three ABI FPMs. The Field of View (FOV) of the ABI VNIR FPM is about 0.9° in NS and 1.9° in EW [18]. Hence, the Moon, with the diameter of ~0.5°, can be scanned with one ABI swath.

2.2. Lunar Irradiance Model and ABI Lunar Phase Angle Range

In the 1990s, the United States Geological Survey (USGS) deployed a dedicated ground-based facility, the Robotic Lunar Observatory with 32 solar reflective bands ranging from 350 to 2450 nm from two CCD cameras, 23 bands at 0.35–0.95 µm and nine bands at 0.95–2.45 µm, for the radiometric observation of the Moon over seven years. Based on the thousands of multiple spectral lunar images obtained from the ROLO observatory, the USGS photometric lunar model, also called the ROLO model, was developed to predict the spectral irradiance of the gibbous Moon [7]. In 2016, EUMETSAT implemented the ROLO model and made it available to the GSICS community [8]. The GIRO model (v1.0.0) is used to estimate the lunar irradiance for ABI in this study.
Over the past two decades, results of the lunar irradiance calibration at the low Earth orbit (LEO) satellites indicate that the relative calibration accuracy of the GIRO/ROLO model can be less than 1% when the lunar images are collected within a certain range of phase angles, especially for the sensors at the wavelength less than 1 µm [19]. The Centre National D’Etudes Spatiales (CNES) reported that the irradiance ratio between the Pleiades measurements to the GIRO/ROLO simulations is relatively stable at an absolute phase angle between 5° and 60° [20]. Therefore, all the G16/17 lunar images collected in this study were conducted within this lunar phase range, with a brighter Moon preferred.

2.3. Lunar Image Collections

ABI routinely views the Earth and calibration targets in a sequence, called a timeline. An operational timeline usually consists of three sector areas of the Earth surface, which are interleaved with the observations of the radiometric and geometrical calibration targets for the accurate radiometric calibration and image navigation and registration [21]. The sector areas of the Earth surface include the 22-swath FD scans of the Earth, the 6-swath contiguous United States (CONUS) and the 2-swath mesoscale (MESO) which is the smallest in size. While the FD and CONUS scans are of fixed areas, the MESO scan can be located at any position within the FOR and the two MESO swaths are aligned adjacently in the NS direction.
The MESO scan is used for the lunar image collection. The Moon can be scanned with either one of the two swaths. The interval between two MESO scans is about 30 s. Any MESO in a timeline can be used to scan the Moon. The lunar images can thus be collected as frequently as every 30 s.
The EW scan angle range of a MESO swath is about 3.5°. A MESO frame with the exact pointing location for a series of MESO scans usually captures five to six nonclipped lunar images for each VNIR band. As the Moon moves from west to east in the space annulus, the MESO frames also move from west to east, following the Moon along its orbit path. These consecutive lunar image collections are called “lunar chasing”. The lunar chasing events used in this study are listed in Table 2 and Table 3 for G16 and G17, respectively. Unlike the chasing events in which the lunar images are collected in a short time at a relatively stable scan angle in the NS direction, there is no such event to collect the lunar images at similar scan angle in the EW direction during the satellite mission life. A different algorithm is then needed to examine the ABI VNIR spatial uniformity in the NS direction, which is beyond the scope of this paper.
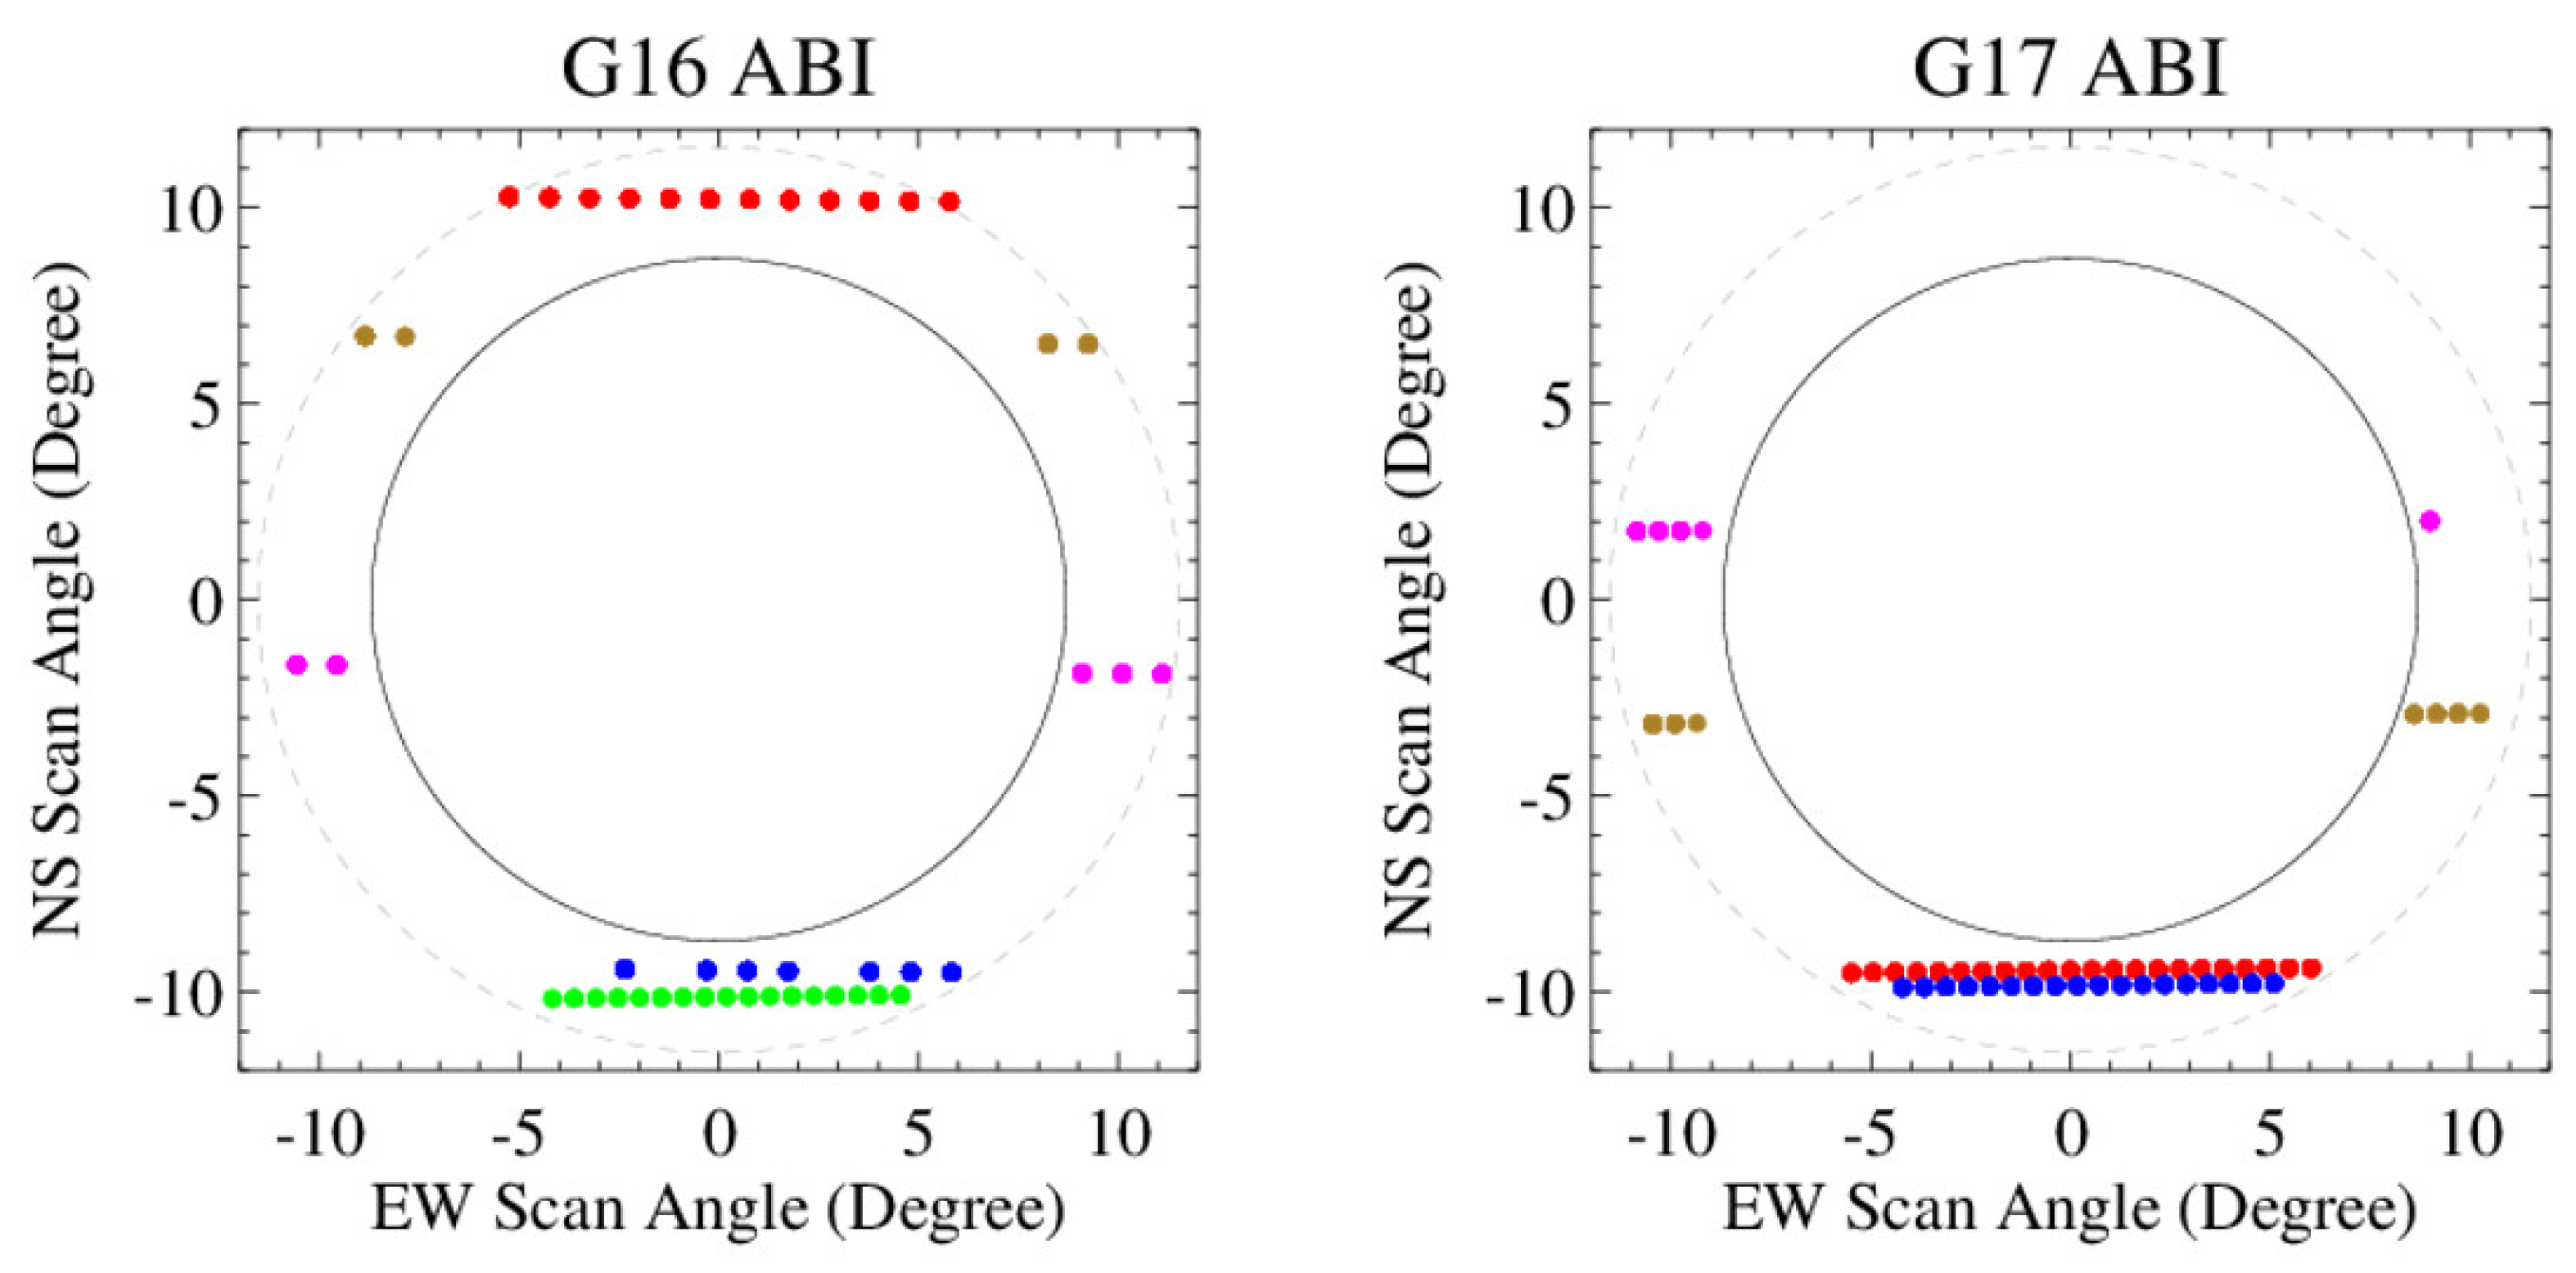
Figure 2 displays the central locations of the MESO frames for the lunar images used in this study. The images collected beyond the polar regions cover the central part of the EW scan range at the nadir, while those at the two sides to the Earth provide measurements near the two ends of the scan range. In this study, all the chasing events conducted beyond the polar regions are longer than those between the poles. G16 has three long chasing events on 11 February 2017, 12 April 2017, and 12 July 2017 and two short ones on 12 February 2017 and 14 February 2017, and G17 has two long chasing events on 30 July 2018 and 20 October 2018 and two short ones on 28 August 2018 and 29 August 2018. A combination of the chasing events thus provides the measurements covering the full EW scan range of the Earth scenes. The multiple chasings at different phase angles can provide robust results. All the chasing events were conducted when both satellites were located at the GOES-Center position of 89.5° W in their PLT/PLPT periods.

3. ABI VNIR Radiometric Calibration and Lunar Image Processing

3.1. ABI VNIR Radiometric Calibration

The ABI VNIR bands are calibrated onboard with the solar diffuser (SD) and the spacelook observations with the correction of incident-angle-dependent scan mirror reflectivity [22]. A quadratic function is used to account for the detector nonlinear response. The ABI image sample is calibrated with the following equation:
R s m p l = m Δ C s m p l + q Δ C s m p l 2 ρ E W s m p l ρ N S s m p l ,
where R s m p l is the radiance for an image sample; q is the fixed quadratic term for each detector; m is the linear calibration coefficient (also known as the gain in the ABI calibration), which is updated automatically after every solar calibration event; ρ N S s m p l   and   ρ E W s m p l are the reflectivity of the NS and EW scan mirrors at the AOI of the scanning sample, respectively; and Δ C s m p l is the sample delta count computed as:
Δ C s m p l = C s m p l C s p l k ,
where Csmpl is the sample count and Csplk is the space count.
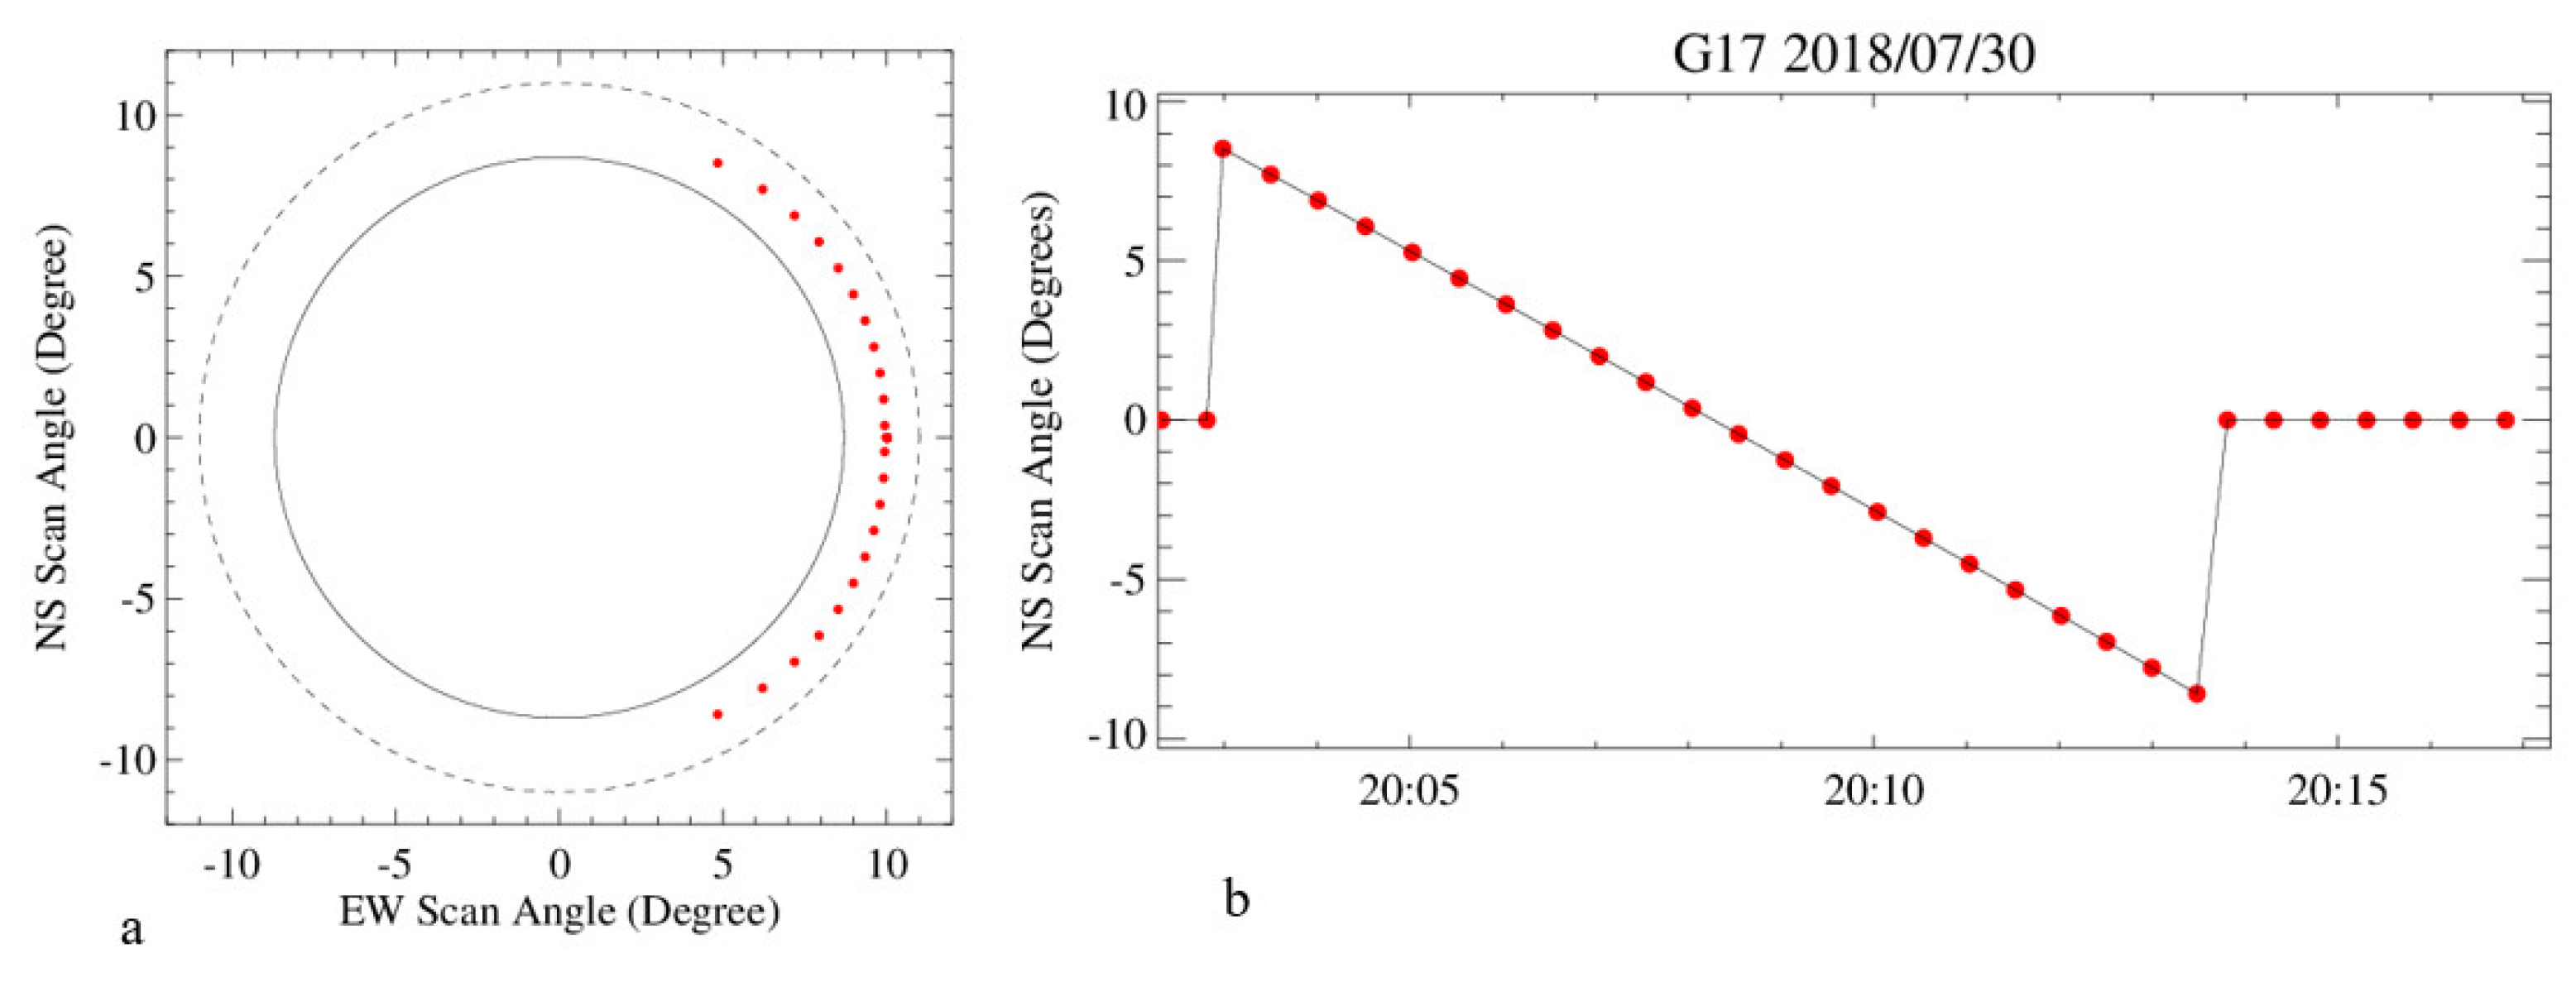
The location of the spacelook scenes to generate Csplk value in Equation (2) is not fixed. It changes within a timeline and switches between the space sides to the Earth twice in a day. The spacelooks of a timeline are interleaved with the 22-swath FD scans and the other calibration target scans. All the lunar images collected in this study are collected with Mode 3A timeline, which consists of 31 spacelooks. Figure 3 shows the spacelook positions of one G17 timeline executed at 20:02–20:17 UTC on 30 July 2018. The first two scenes are conducted at the Equator space with the NS scan angle close to zero, followed by the 22 spacelook scenes which are progressively located from north to south along with the 22-FD swath scans. The last seven spacelooks are again conducted at the Equator space. To avoid possible contamination by the Sun, ABI switches the spacelook positions twice a day. The spacelook is conducted at the eastern side to the Earth from satellite noon to midnight and then at the western side to the Earth from satellite midnight to noon.

3.2. Lunar Image Processing

3.2.1. Data Reprocessing for the Lunar Events

These lunar chasing events were conducted in the PLT/PLPT periods when the instrument and the ground segment (GS) were still under intensive testing to verify and validate the functions. The operational calibration algorithm and lookup tables (LUT) are often updated or corrected during this period, especially for G16 as the first ABI instrument in orbit. All the lunar images are reprocessed in this study. First, the solar calibration coefficients are recalibrated with the current ABI operational solar calibration algorithm and radiometric calibration LUTs for both satellites. The lunar images are then reprocessed with the new solar calibration coefficients. Unlike the ABI Level1B (L1B) data of the Earth observations that are disseminated in a fixed grid format after the radiometric calibration, navigation, and resampling processes, the lunar images are generated in L1alpha (L1α) format, which is radiometrically calibrated without navigation and resampling effort. Each point in an ABI L1alpha image is referred to as “sample”.

3.2.2. Lunar Image Screening and Subset

When the Moon is close to the Earth limb, a swath scan can contain the Moon and some part of the Earth. A subset of each swath image is executed to ensure only the Moon-related samples are analyzed. The images are subset with the Moon near the center of the image. A few images with the Moon clipped or too close to the image vertical edge (<0.2 degrees) are discarded. The subset size varies with different VNIR bands, depending on the spatial resolutions: 401 samples for B04 and B06; 801 samples for B01, B03, and B05; and 1601 samples for B02 along the scan direction. The center of each subset lunar image represents the scan angle for the Moon. Data from the detectors near the two horizontal edges of the focal plane array are not downlinked for the ground processing and these invalid lines are truncated for the further analysis. To reduce the impacts of the atmosphere and possible straylight from the Earth [15,16], images with the center of the Moon less than 1.0° from the Earth limb are not used in this study.
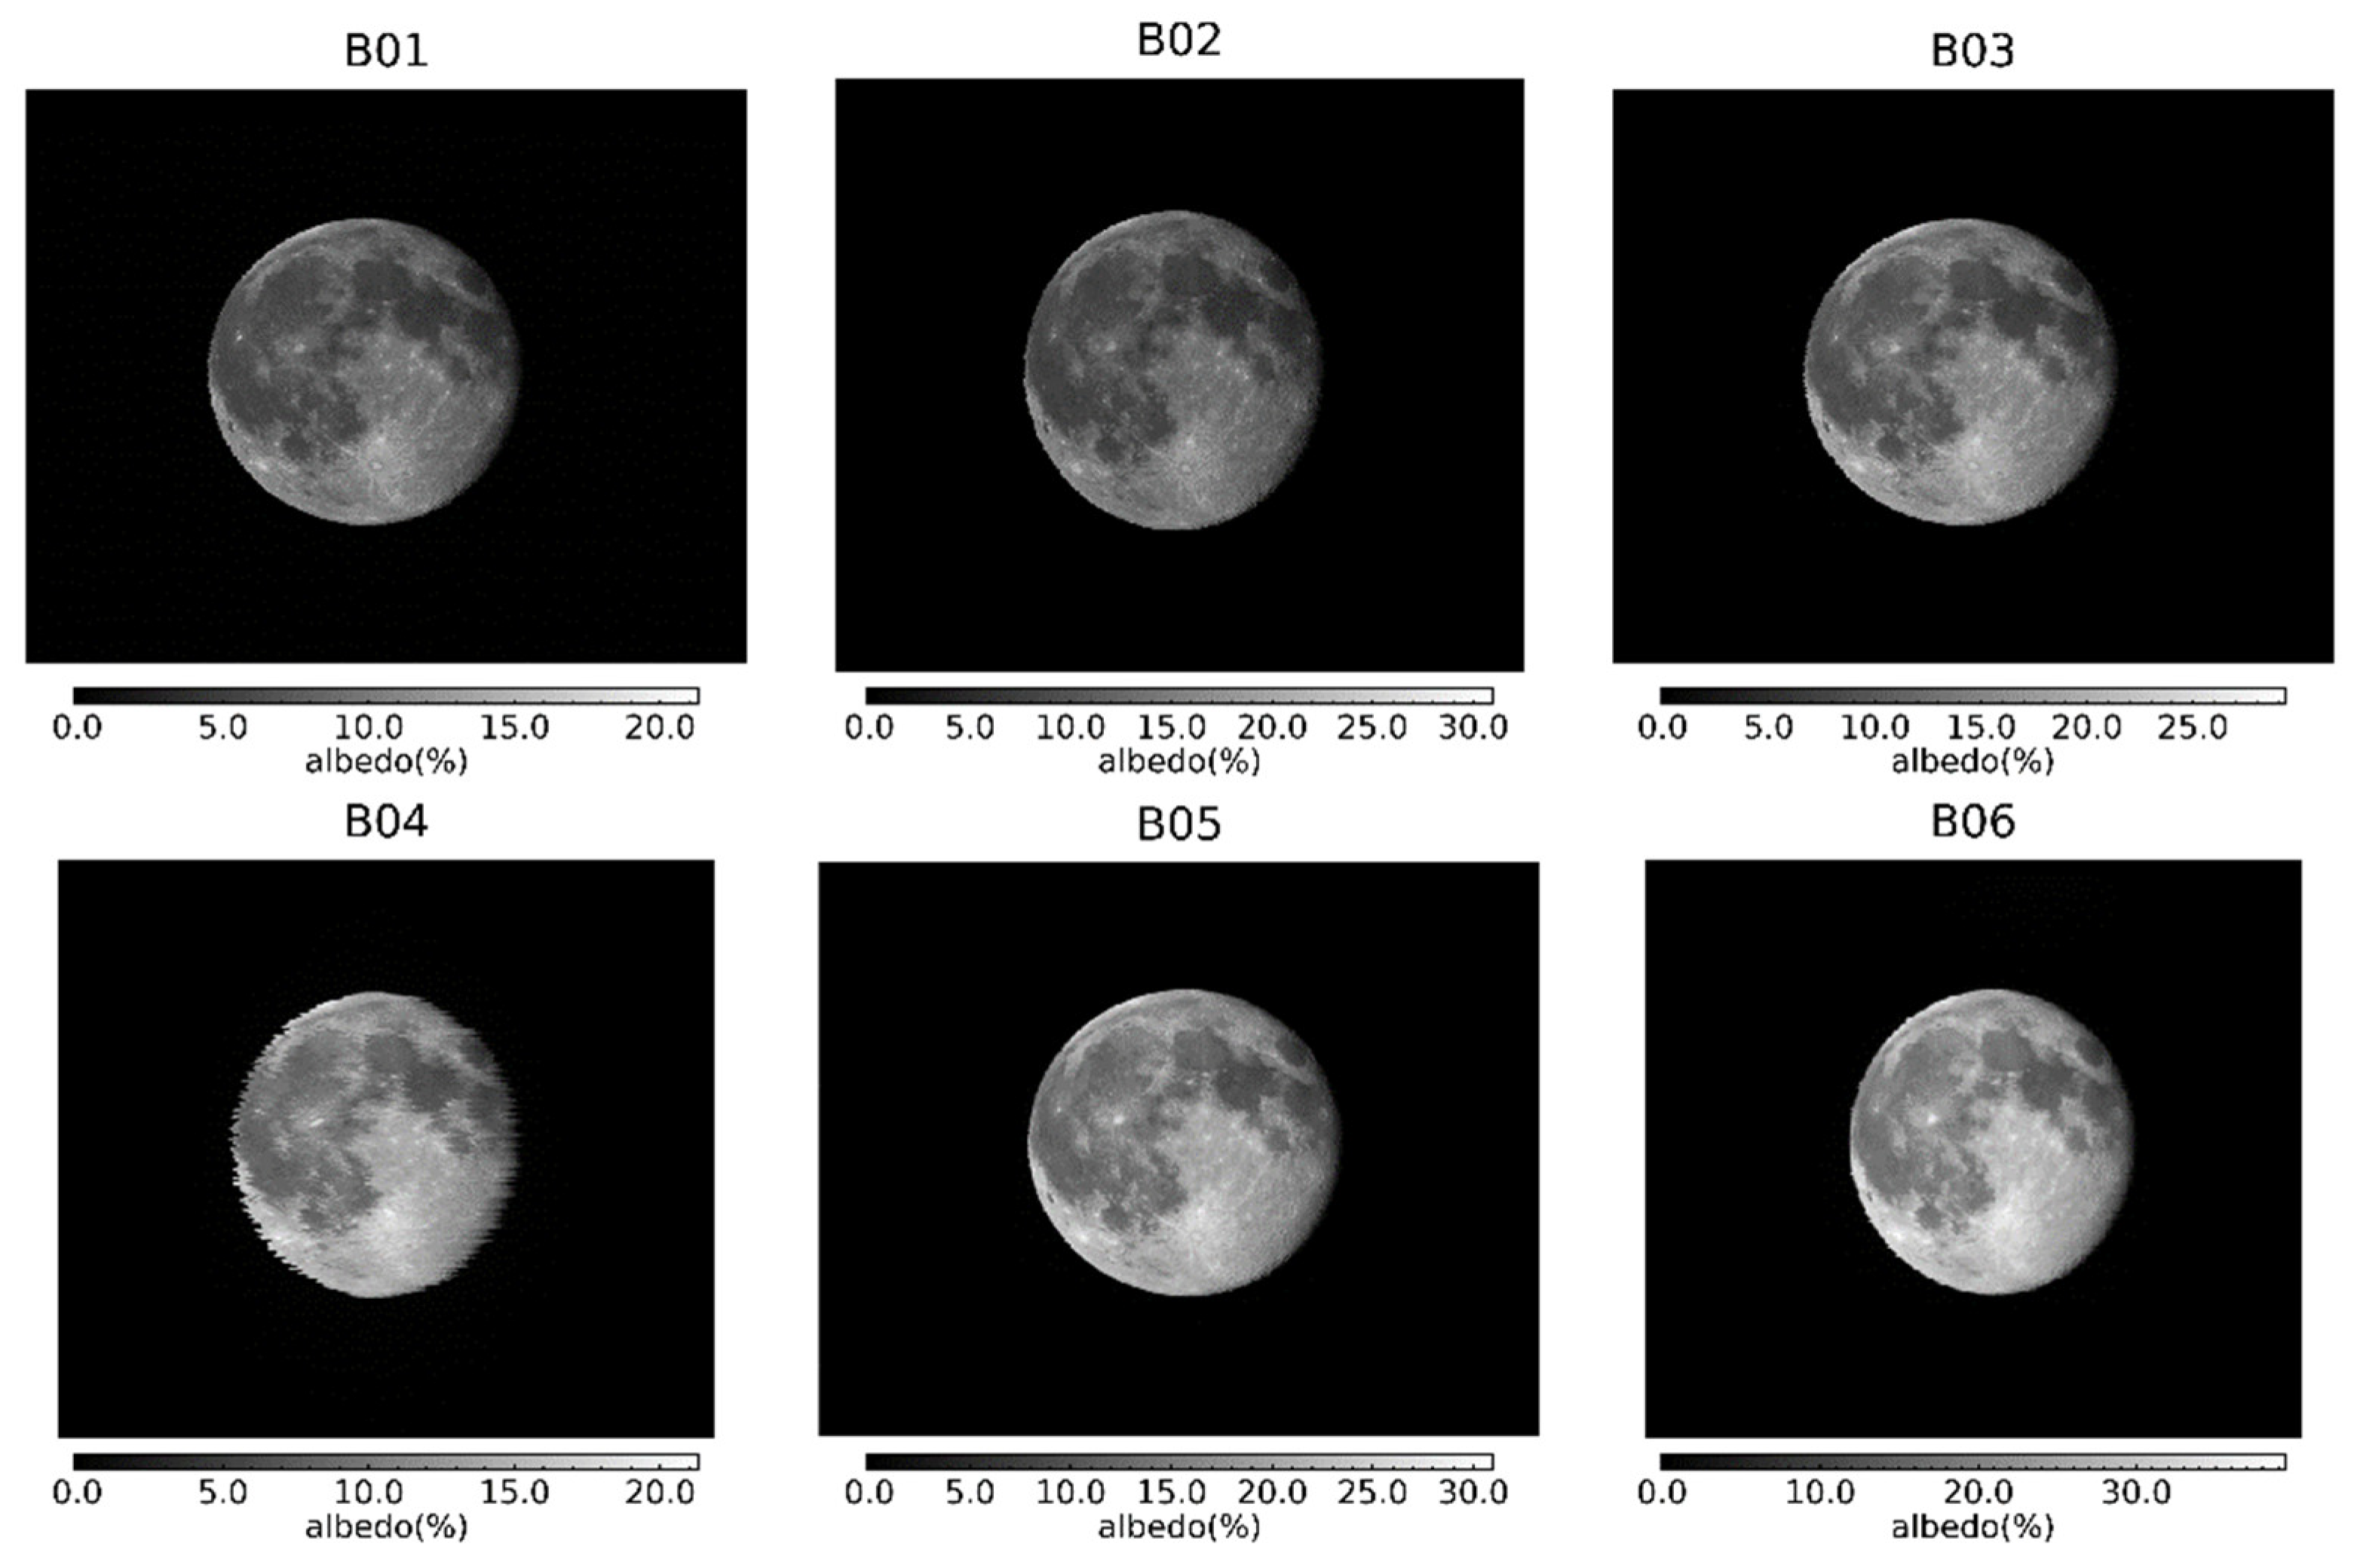
Figure 4 shows a set of subset lunar images for the six G16 VNIR bands collected on 12 April 2017. Small spikes can be seen at the edges of the illuminated Moon. This is because the BDS detectors are not from the same detector columns. The B04 BDS detectors are distributed irregularly across the six detector columns, making the Moon appear jagged at this band. As the detector instantaneous field of view (IFOV) varies at different VNIR bands (Table 1), the Moon shows different shapes at the different bands.
The lunar images in Figure 4 are shown in Figure 5 again, with different gray scales and with the illuminated lunar pixels (albedo greater than 0.33%) masked as −0.1%. As can be seen, there is no definitive boundary between the space and illuminated moon, especially for channels 4–6, and there is a faintly bright region (albedo < 0.25%) above the B06 lunar image. These are caused by scattered or reflected light that reaches the detectors when they point to space. Unlike the straylight from the Earth, which is discussed separately later, these lights originate from the Moon and should be accounted for as part of the lunar irradiance. Figure 5 shows that the subset used in this study is sufficient to cover all the light from the Moon, except that part of the ghosting for B06 is omitted. However, this omission should have little impact on the lunar irradiance variation partly because the omitted irradiance is negligible compared to the total lunar irradiance and partly because the omission is consistent for all lunar images. Finally, note the vertical stripes in most images, particularly those for channels 2, 5, 3, and 1, whose magnitudes are well within the ABI noise requirement and have little impact on the estimated lunar irradiance.

4. Data Analyses

4.1. ABI Lunar Irradiance Calculation

Each chasing event lasts from a few minutes to more than one hour. During this period, the lunar phase angle changed in less than 2° (Table 2 and Table 3). Assuming that the GIRO model can accurately simulate the relative change in the lunar irradiance within each event, the lunar irradiance ratio between the measured lunar irradiance to the modeled result is used to characterize the RVS performance of each VNIR band [16]. The lunar irradiance (I) for a given image can be calculated with Equation (3):
I = i j Ω i , j R i , j f o v e r s a m p l i n g , i , j ,
where Ri,j is the radiance for the sample at row i and column j in the subset image; Ωi,j and foversampling, i.j are the solid angle and the oversampling factor for the sample (i, j), respectively.
Examination of the ABI engineering data in the chasing events indicates that the scan rates of the ABI scan mirrors are stable within each chasing event. The solid angle (Ωi,j) and oversampling factor (foversampling, i.j) in Equation (3) can be considered as constant values for the ABI images. Equation (3) is then revised for the ABI lunar irradiance calculation:
I A B I = Ω f o v e r s a m p l i n g i r o w j c o l R i , j ,
where Ω and foversampling are the sample solid angle and oversampling factor for a given band; and row and column are the size of the subset image. The sample solid angle and oversampling factor can be calculated with the instrument parameters following the algorithms described in [23].

4.2. Normalized Ratios between the Measured and Simulated Lunar Irradiance

Lunar irradiance ratio is computed as:
R a t i o e ,   t   = I A B I , e , t I G I R O , e , t ,
where IABI,e,t and IGIRO,e,t are the lunar irradiance calculated from ABI measurements (Equation (4)) and simulated by GIRO, respectively, for the chasing event e at the time t.
It is challenging to accurately examine the RVS variations with the direct combination of the irradiance ratio from multiple chasing events. This requires that the GIRO calibration accuracy remains consistent across the multiple lunar events. However, analyses of the lunar images from satellites operated by different agencies have shown that the calibration accuracy of the GIRO model can be phase-angle dependent and the uncertainty is most apparent at wavelength > 1 µm [24,25,26,27]. Figure 6 exhibits the irradiance ratios of G16 B01-B06 for the five chasings with the phase angle ranging from +9° to 48° (Table 2). The gaps among the chasing events increase with the wavelength. Large gaps up to about 10% can be observed among the chasing events at B06, although the ratios within each event are very stable.
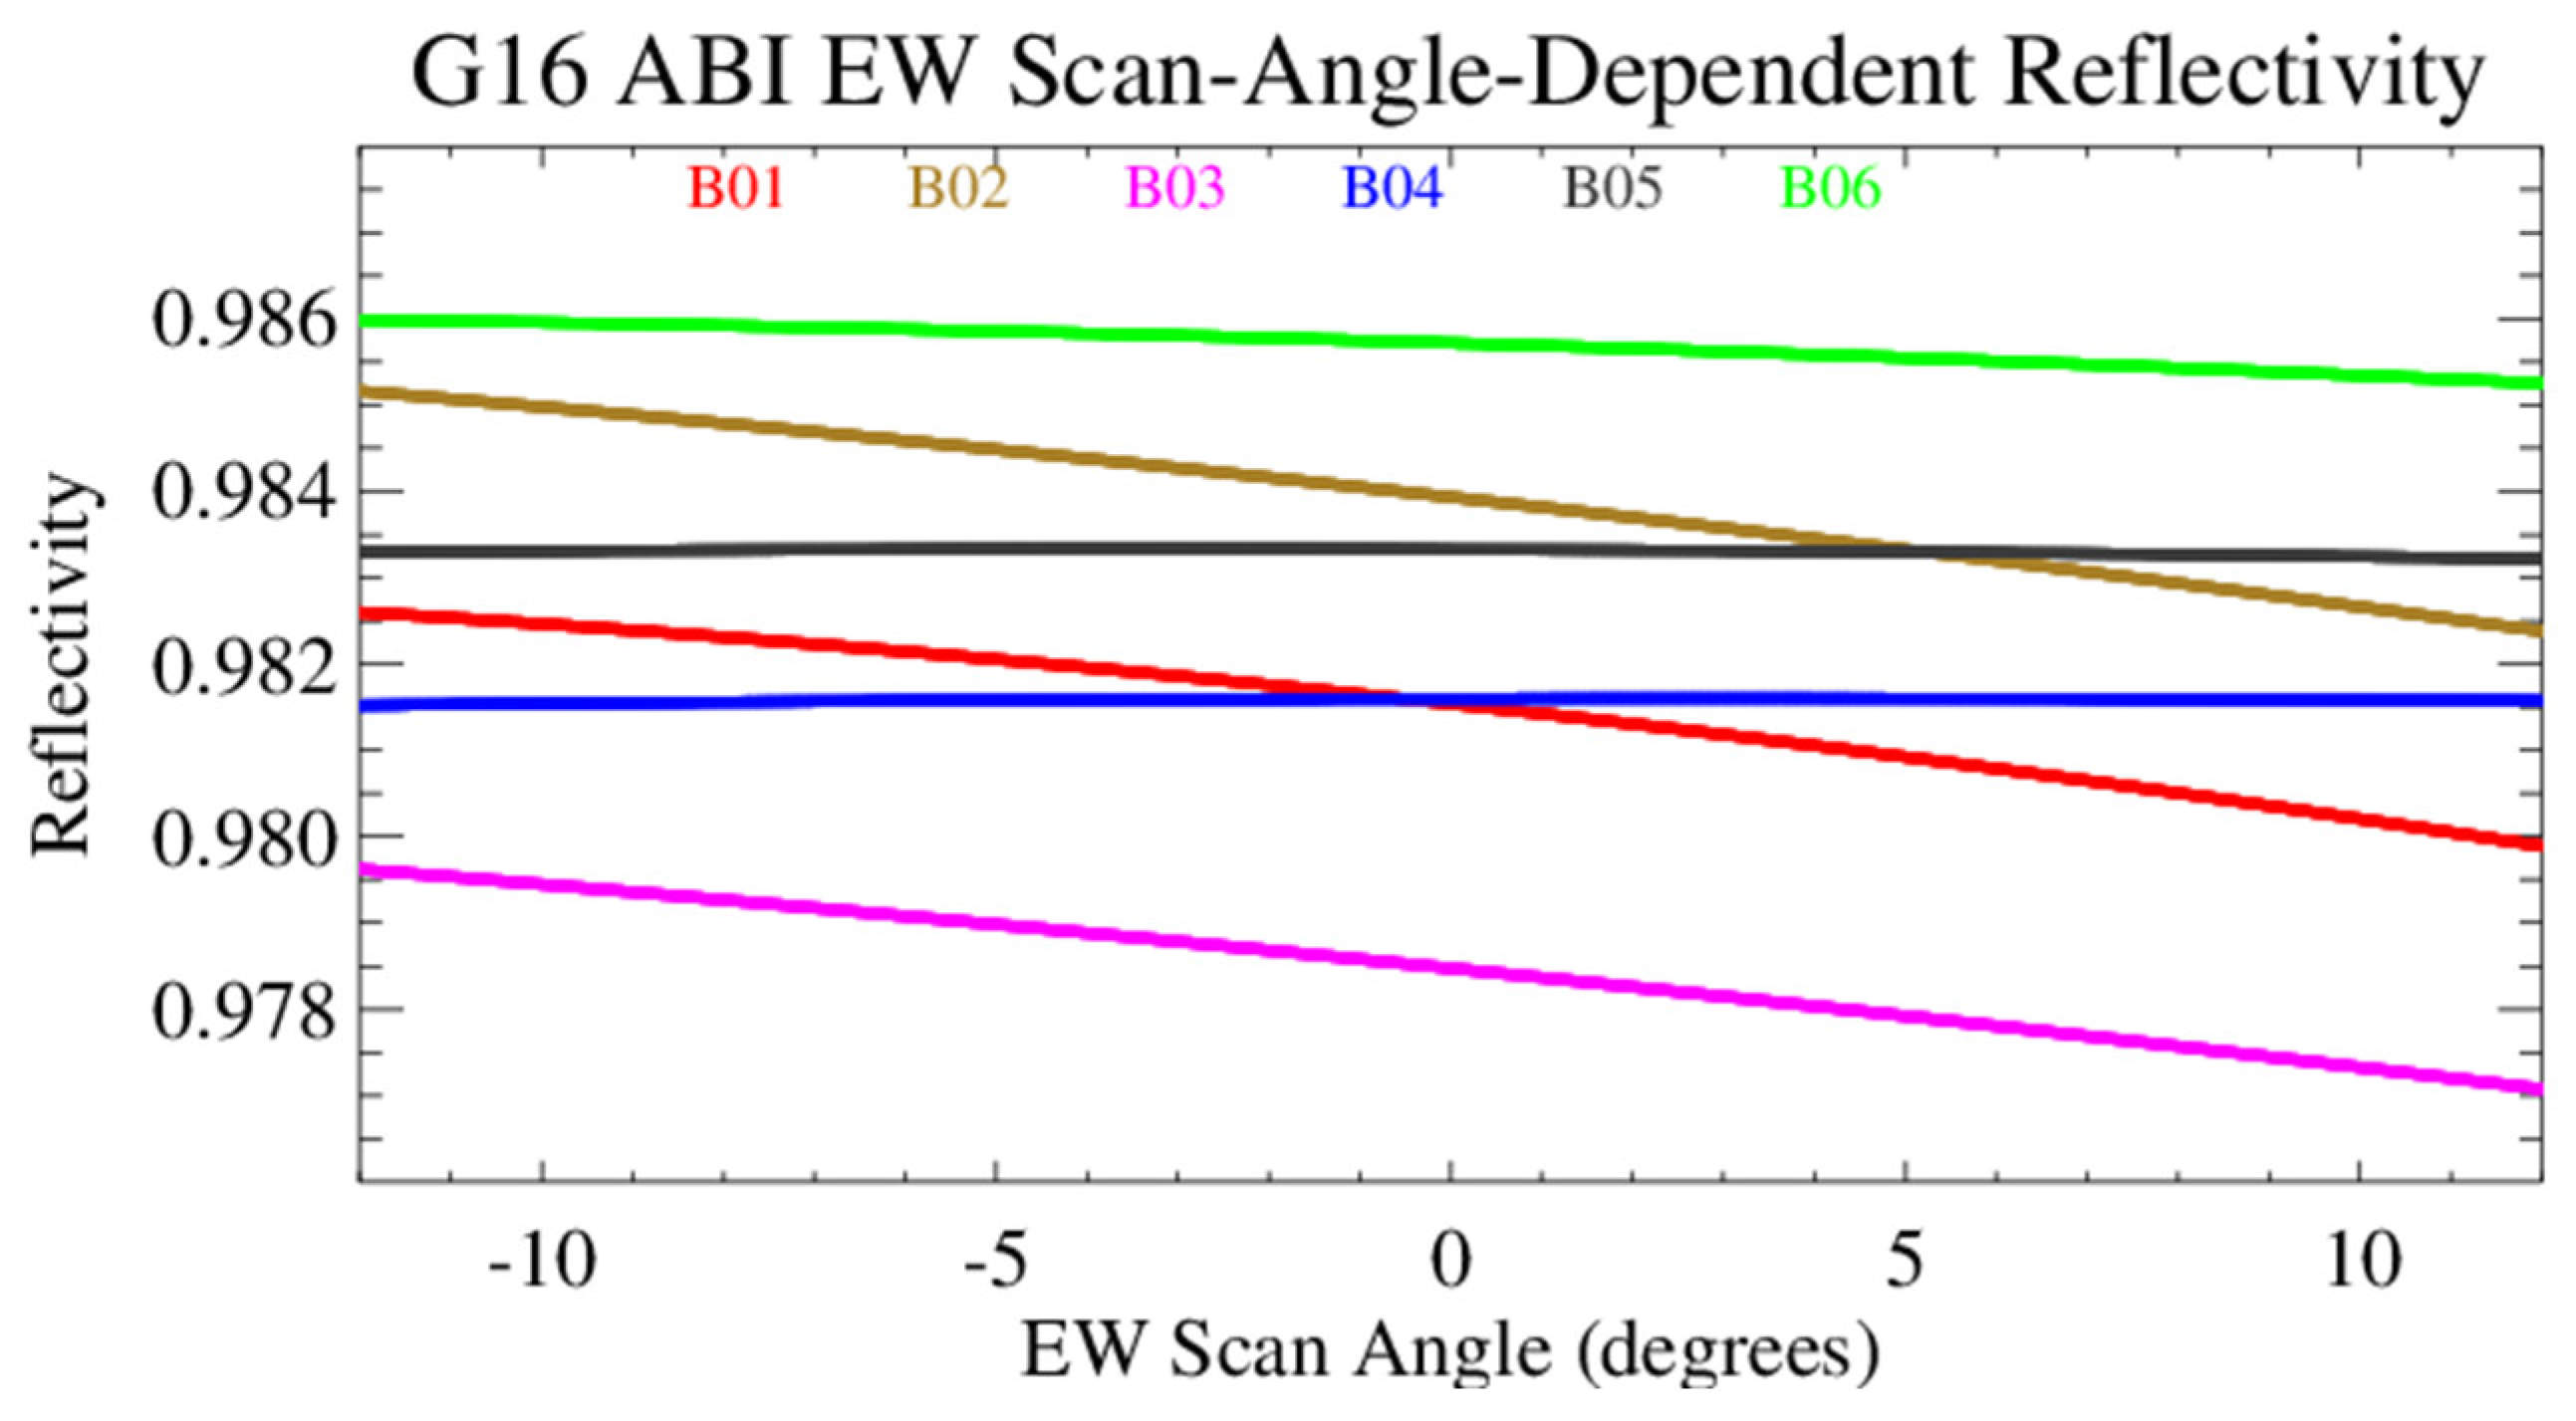
To overcome the different model bias among the chasing events, each irradiance ratio is normalized to the mean value of its chasing event at each band (Equations (6) and (7)). Note that the scan angle in the NS direction is very small within each chasing event, as shown in Table 2. This normalization can also greatly reduce the impacts of the possible different RVS in the NS direction and the possible different instrument calibration residuals among the chasing events. Figure 7 shows the EW scan-angle-dependent reflectivity for the six VNIR bands at G16. All the bands display a consecutive change in reflectivity within the scan angle range. Variations within and among the combined normalized ratios indicate the RVS change within the EW scan range and possible residual of the GIRO model within a chasing event.
R a t i o e ¯ = m e a n R a t i o e , t ,
N o r m _ R a t i o e , t = R a t i o e , t R a t i o e ¯ ,
where R a t i o e ¯ is the mean lunar irradiance ratio for the chasing event e; and N o r m _ R a t i o e , t is the normalized lunar irradiance ratio at the time t of the event e. Each measurement collected at time t corresponds to one unique scan angle.

5. Initial RVS Results

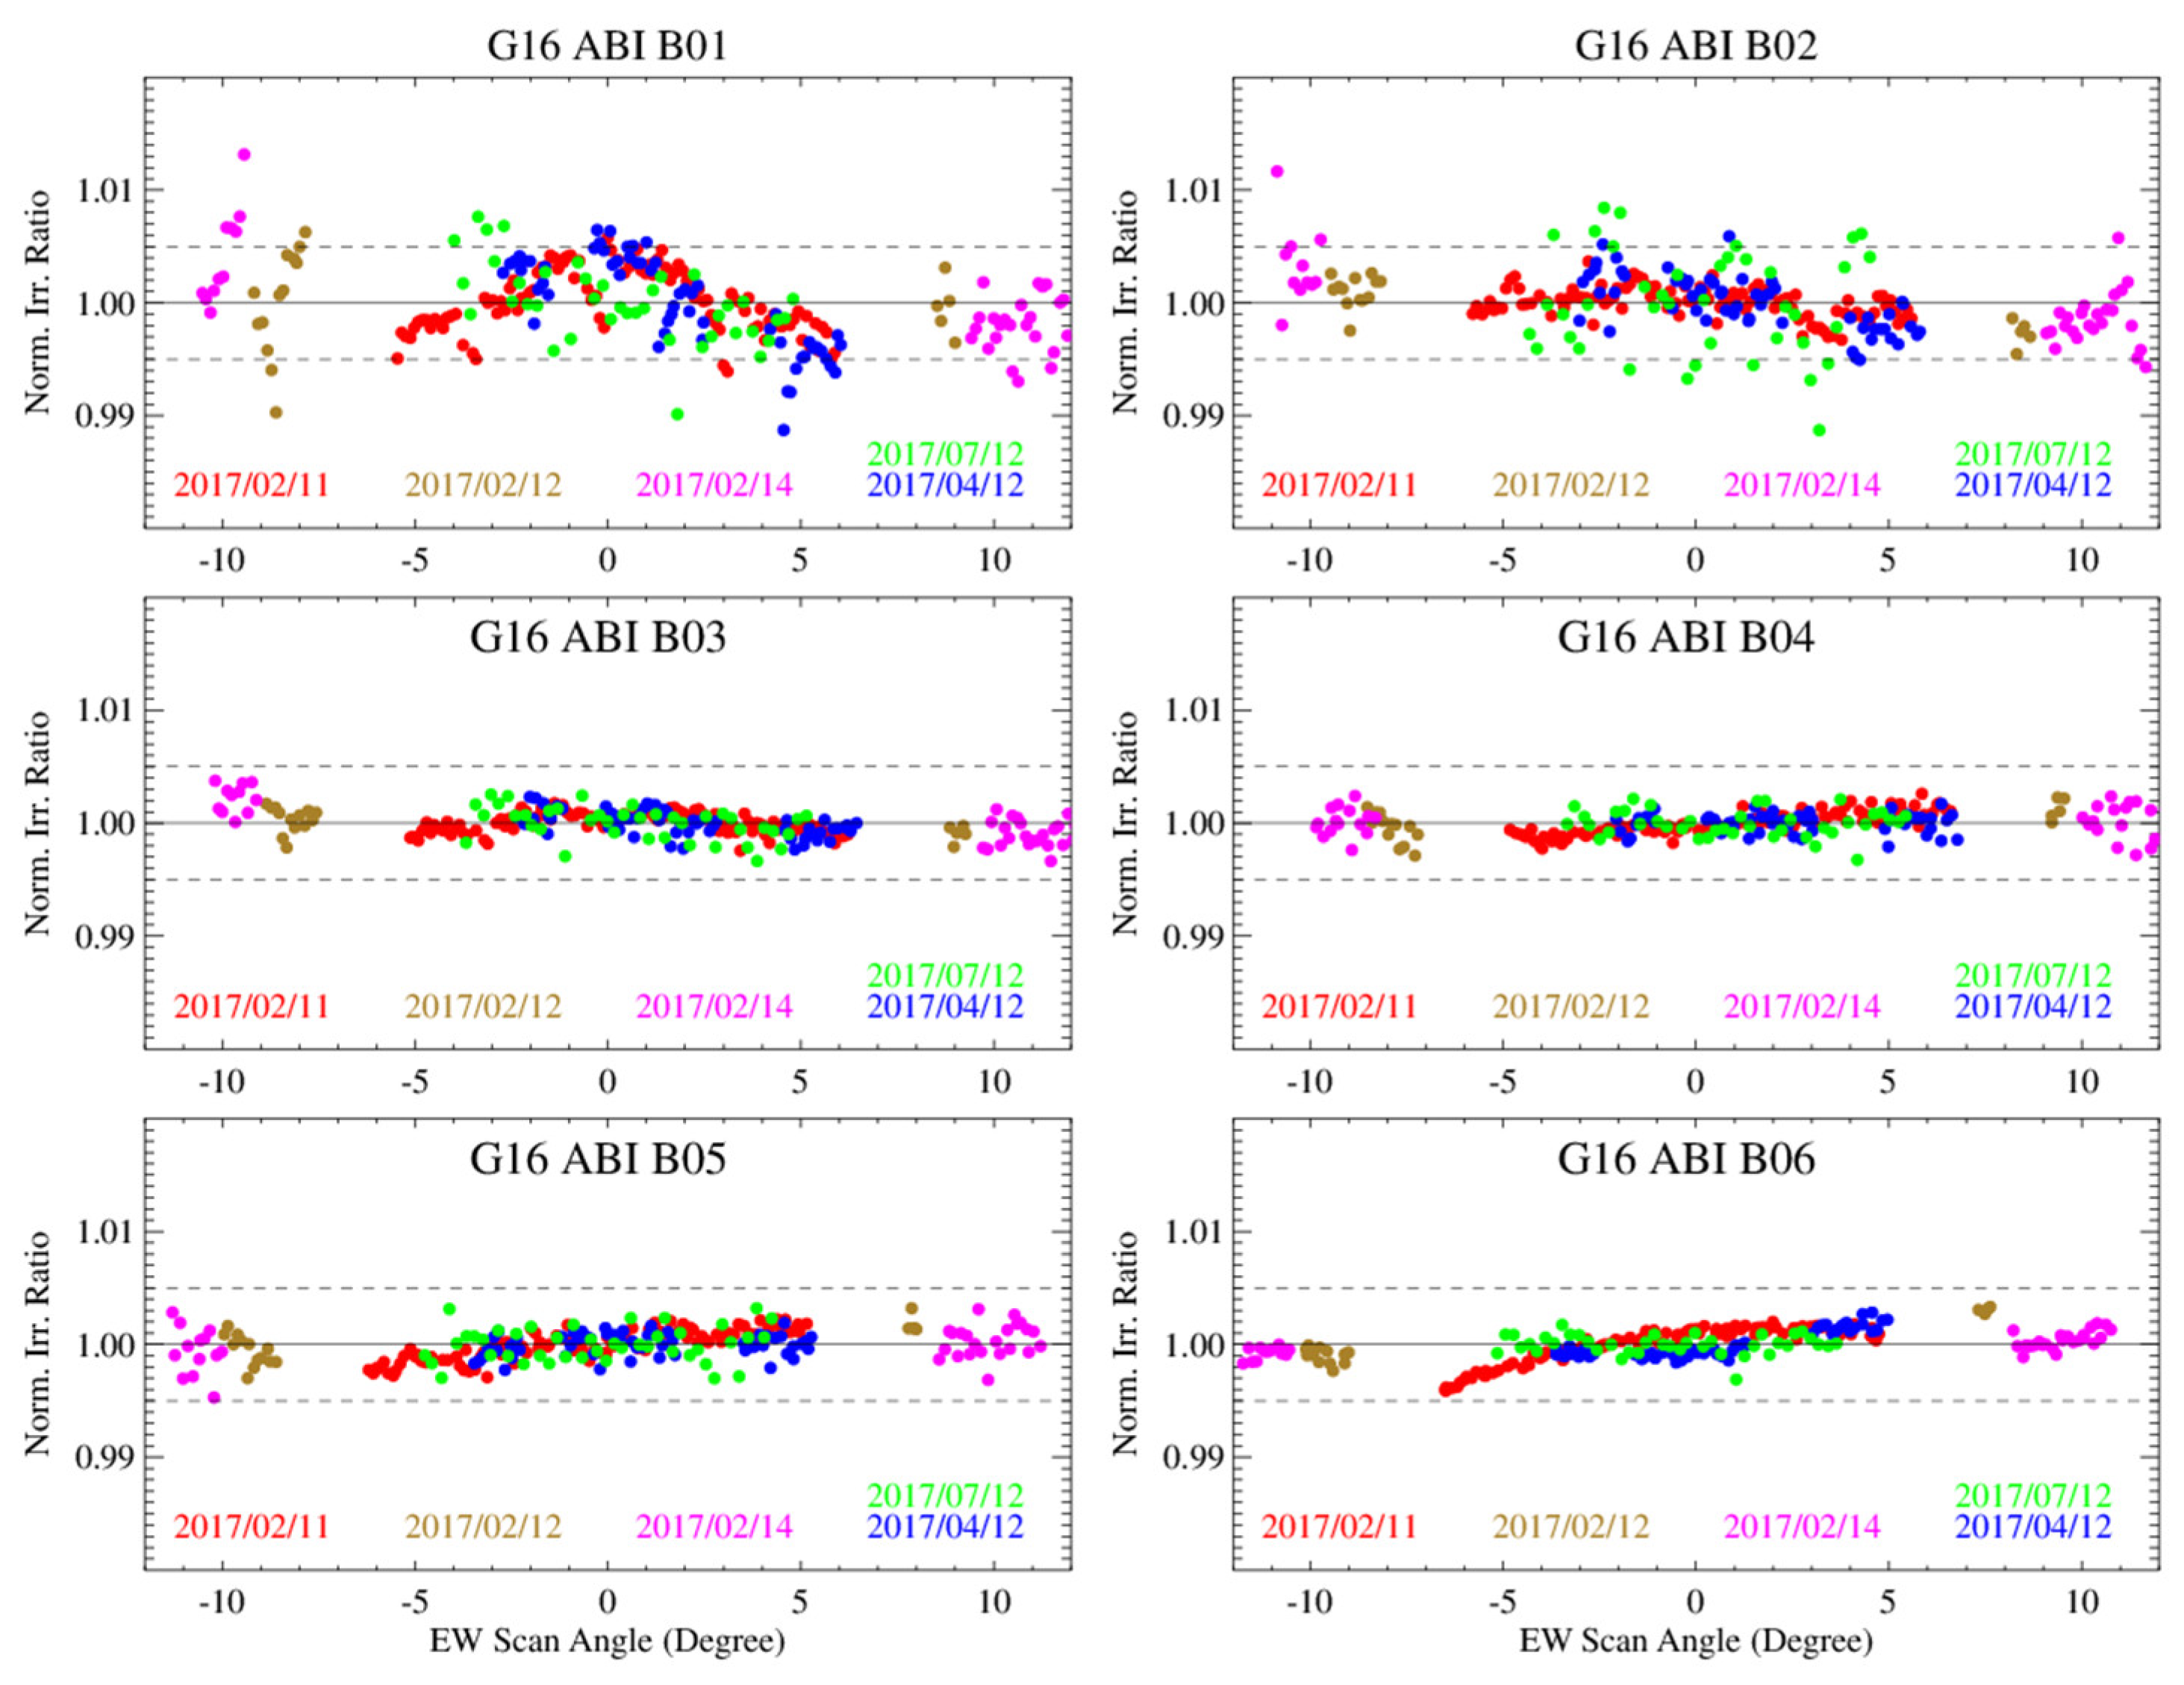
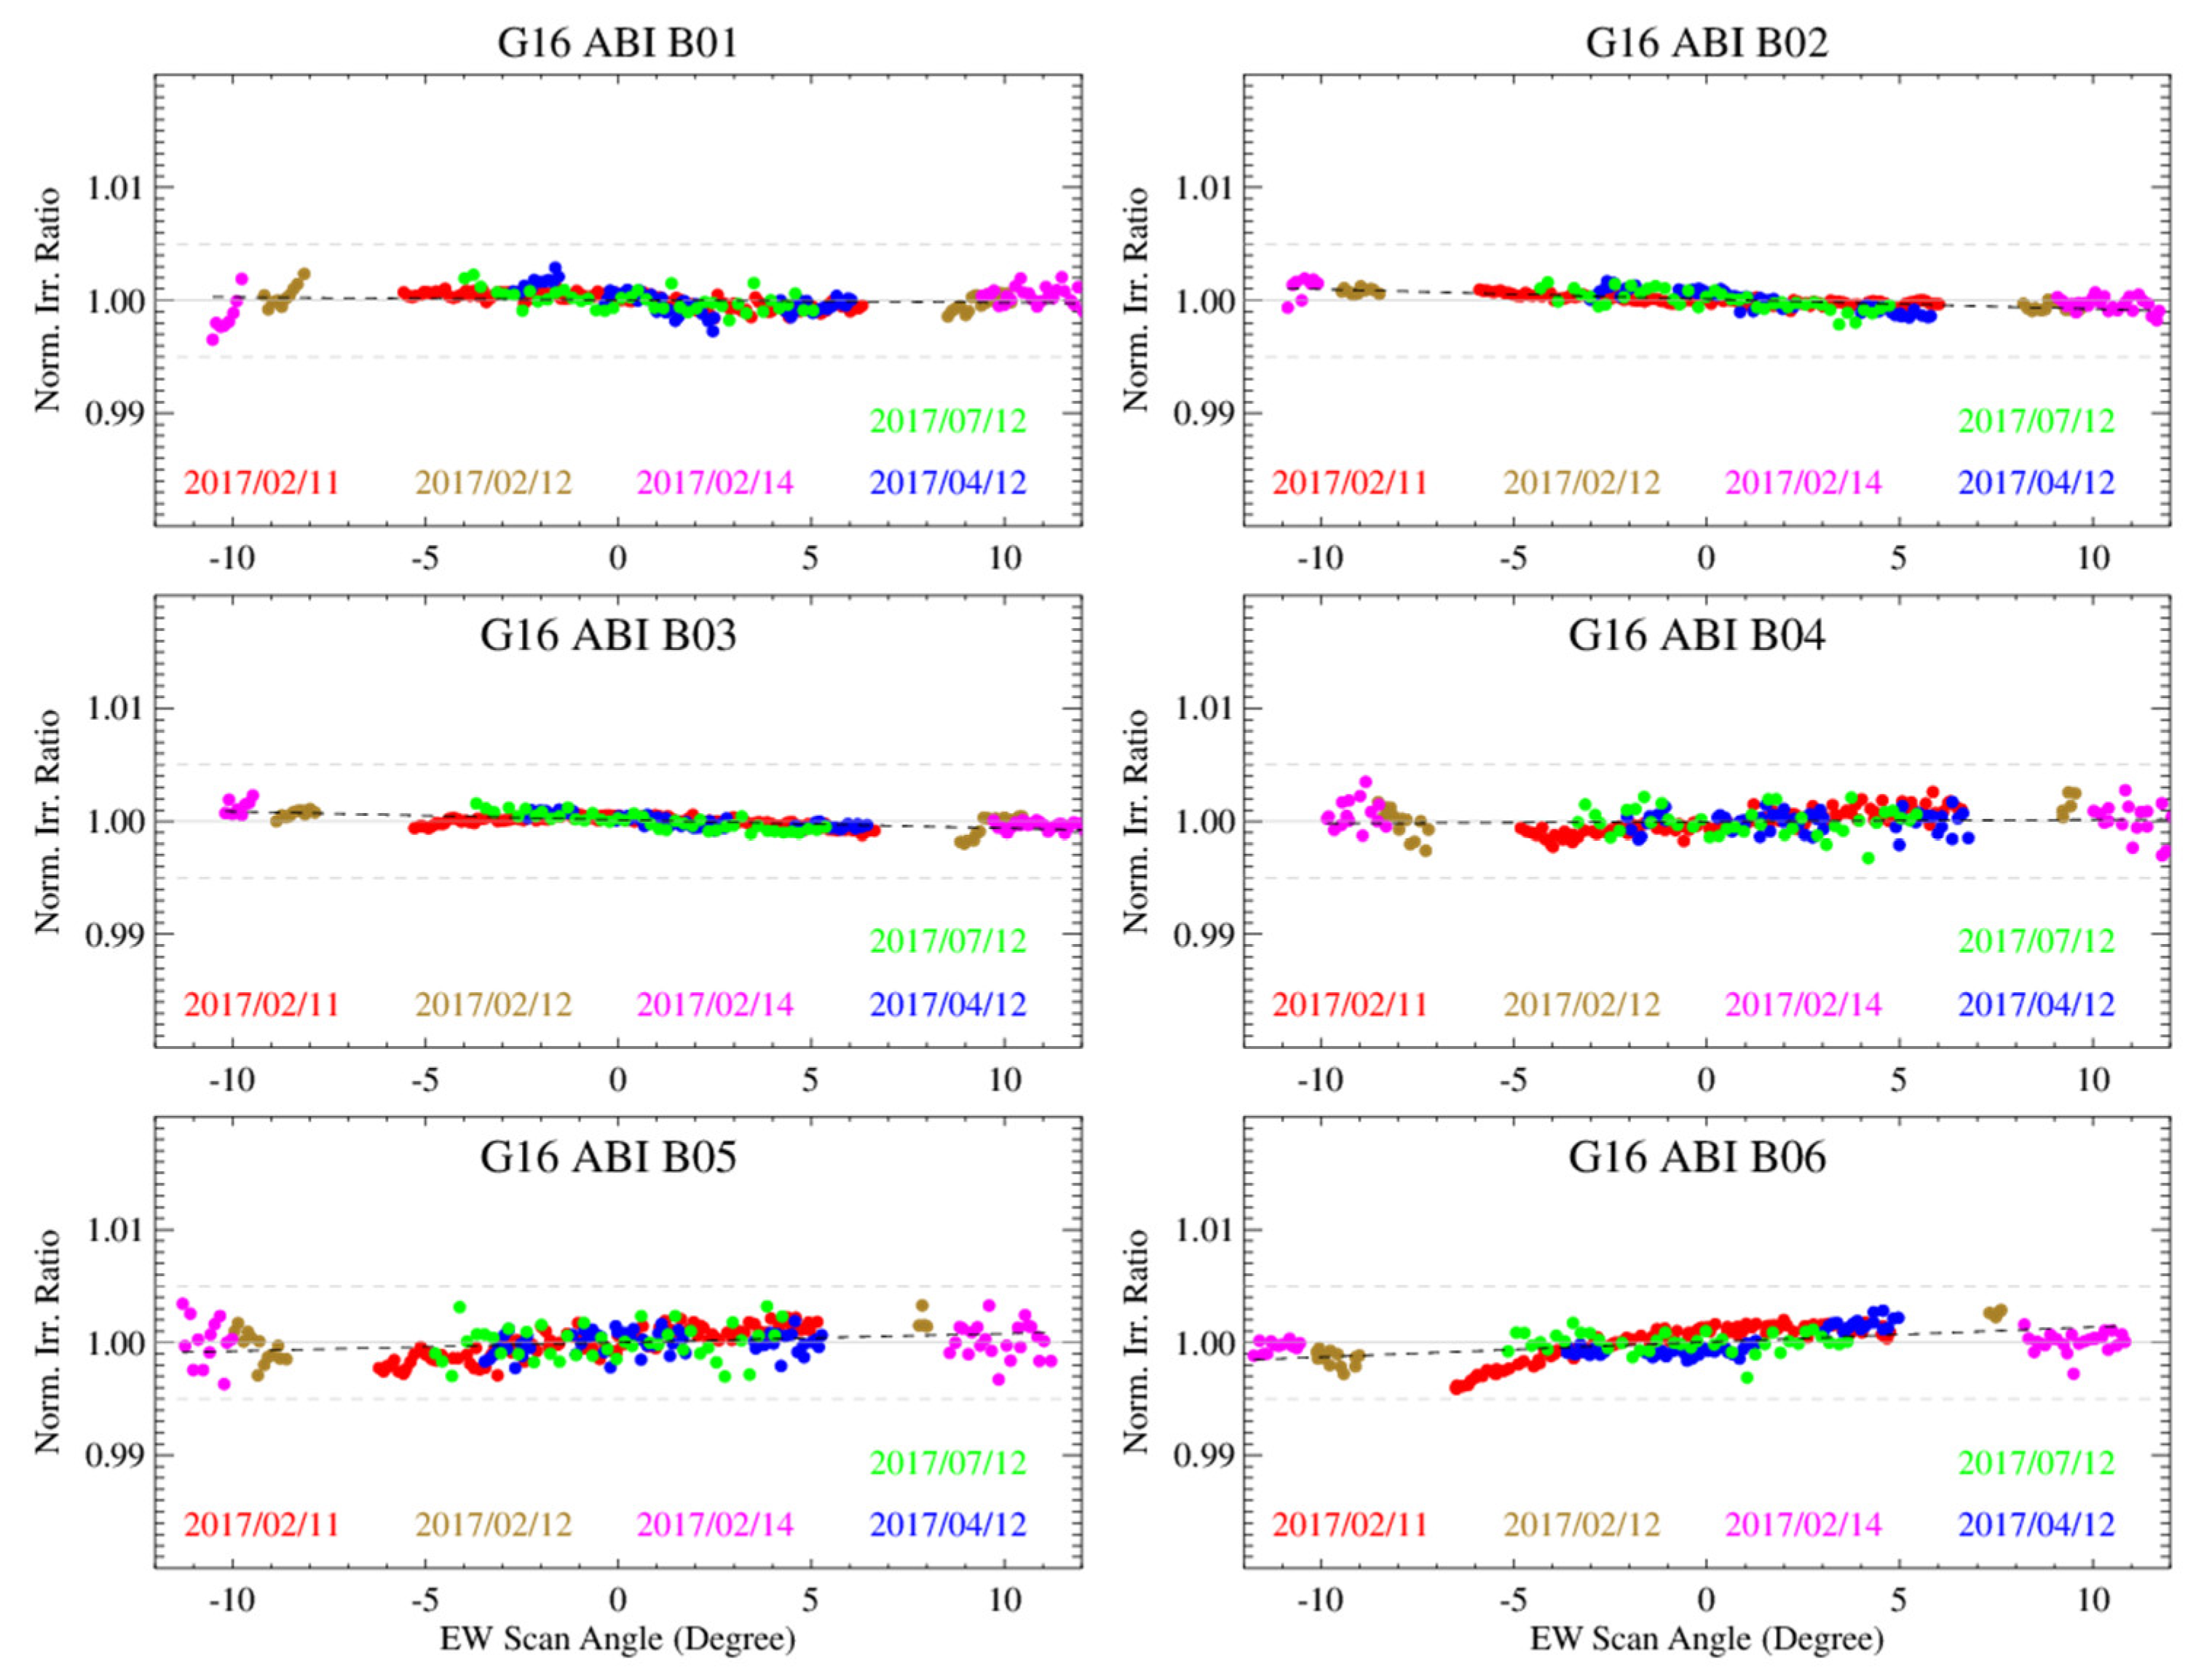
The initial RVS results for the six VNIR bands at G16 and G17 are shown in Figure 8 and Figure 9, respectively. As the detectors of each VNIR band are located at different FPM positions in the EW direction, there is a slightly different scan angle range for the same chasing event at different bands. All the bands exhibit intensive measurements of long chasing events covering a large central part of the FD images, and short chasing events near the edges.
Both satellites display the largest variation in the normalized ratios at B01 (>1%), followed by B02 to a less degree, and then within 0.5% at the long-wavelength bands, especially at B04–B06. Additionally, the long chasing events have distinguishably different trending patterns at B01 and B02, yet they generally agree with each other at the long-wavelength bands. The relatively large variations at the short-wavelength bands suggest need for investigation into the calibration data for the accurate lunar irradiance calculation.

6. Straylight Corrections for B01–B03

6.1. Spacelook Corrections

6.1.1. Time Series of Spacelook Count in the Chasing Events

On the report of the relatively large RVS variations observed at the G17 B01, the vendor reviewed the pre-launch straylight analysis and analyzed the G16/G17 in-orbit measurement data [28]. It was reported that light from either Earth or the Sun may be scattered into the ABI’s line of sight (LOS). The magnitude and location of light scattering vary with time, depending on the Sun–satellite–Earth geometry. Therefore, certain ABI spacelook scenes of the chasing events can experience slightly scattered light from the Earth when the Sun is far from the LOS. The magnitude of straylight is strongest at B01, much less at B02, and indiscernible at B03–B06 at both satellites. Since the G17 long-chasing data on 30 July 2018 shows the largest spacelook variations among all the long-chasing events, it was used by the vendor as an example to assess the straylight impact on the radiance calibration accuracy. The strongest straylight impact was found at the northernmost spacelook scene in each timeline, which elevated the B01 spacelook count by up to about 1.5 counts out of the 14-bit depth of the ABI calibration data. This small spacelook change leads a calibration error that contributes a negligible albedo of <0.01% for a typical 40% albedo of the Earth [28].
The impact of the contaminated spacelooks, however, cannot be ignored in the ABI lunar irradiance calculation. Our calculation shows that the elevated G17 B01 spacelook count on 30 July 2018 can result in reduced sample radiance by about 0.056 W/m2 Sr µm. With the average radiance of the subset images at about 5.33 W/m2 Sr µm, the elevated spacelook at the northernmost scenes can cause about 1.05% change in the irradiance and accordingly the same account of ratio variation at G17 B01 as observed in Figure 9.
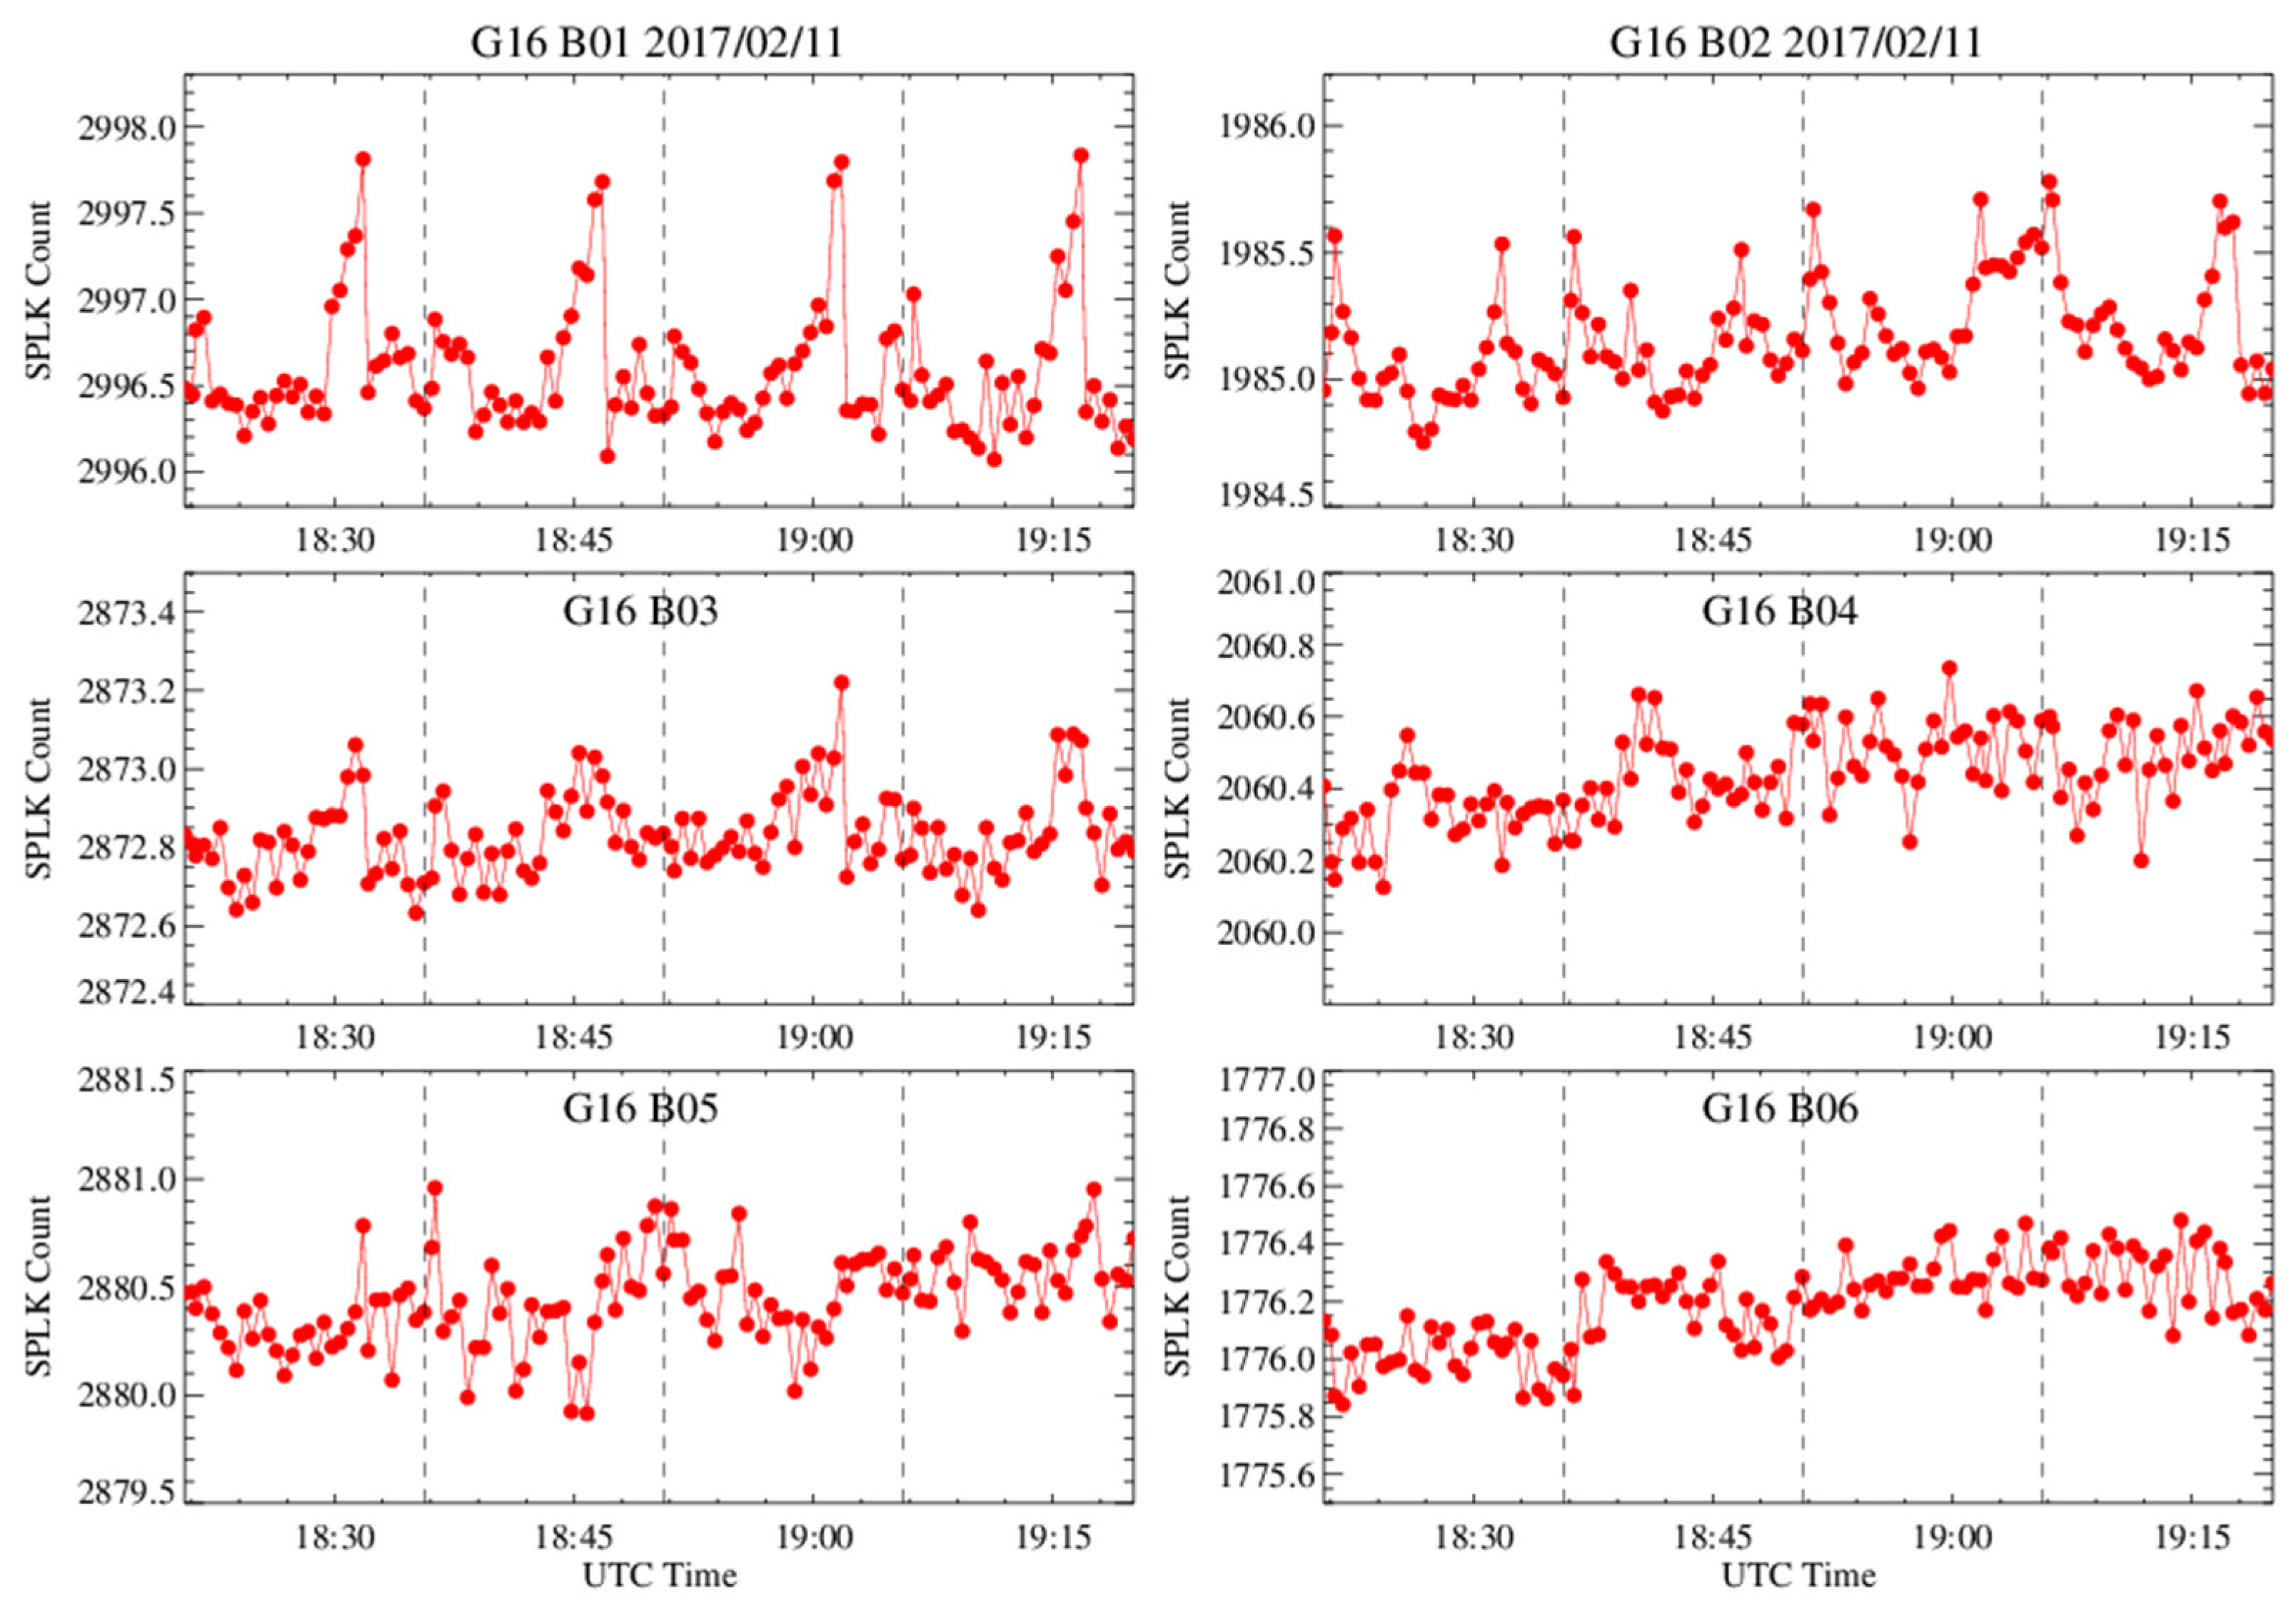
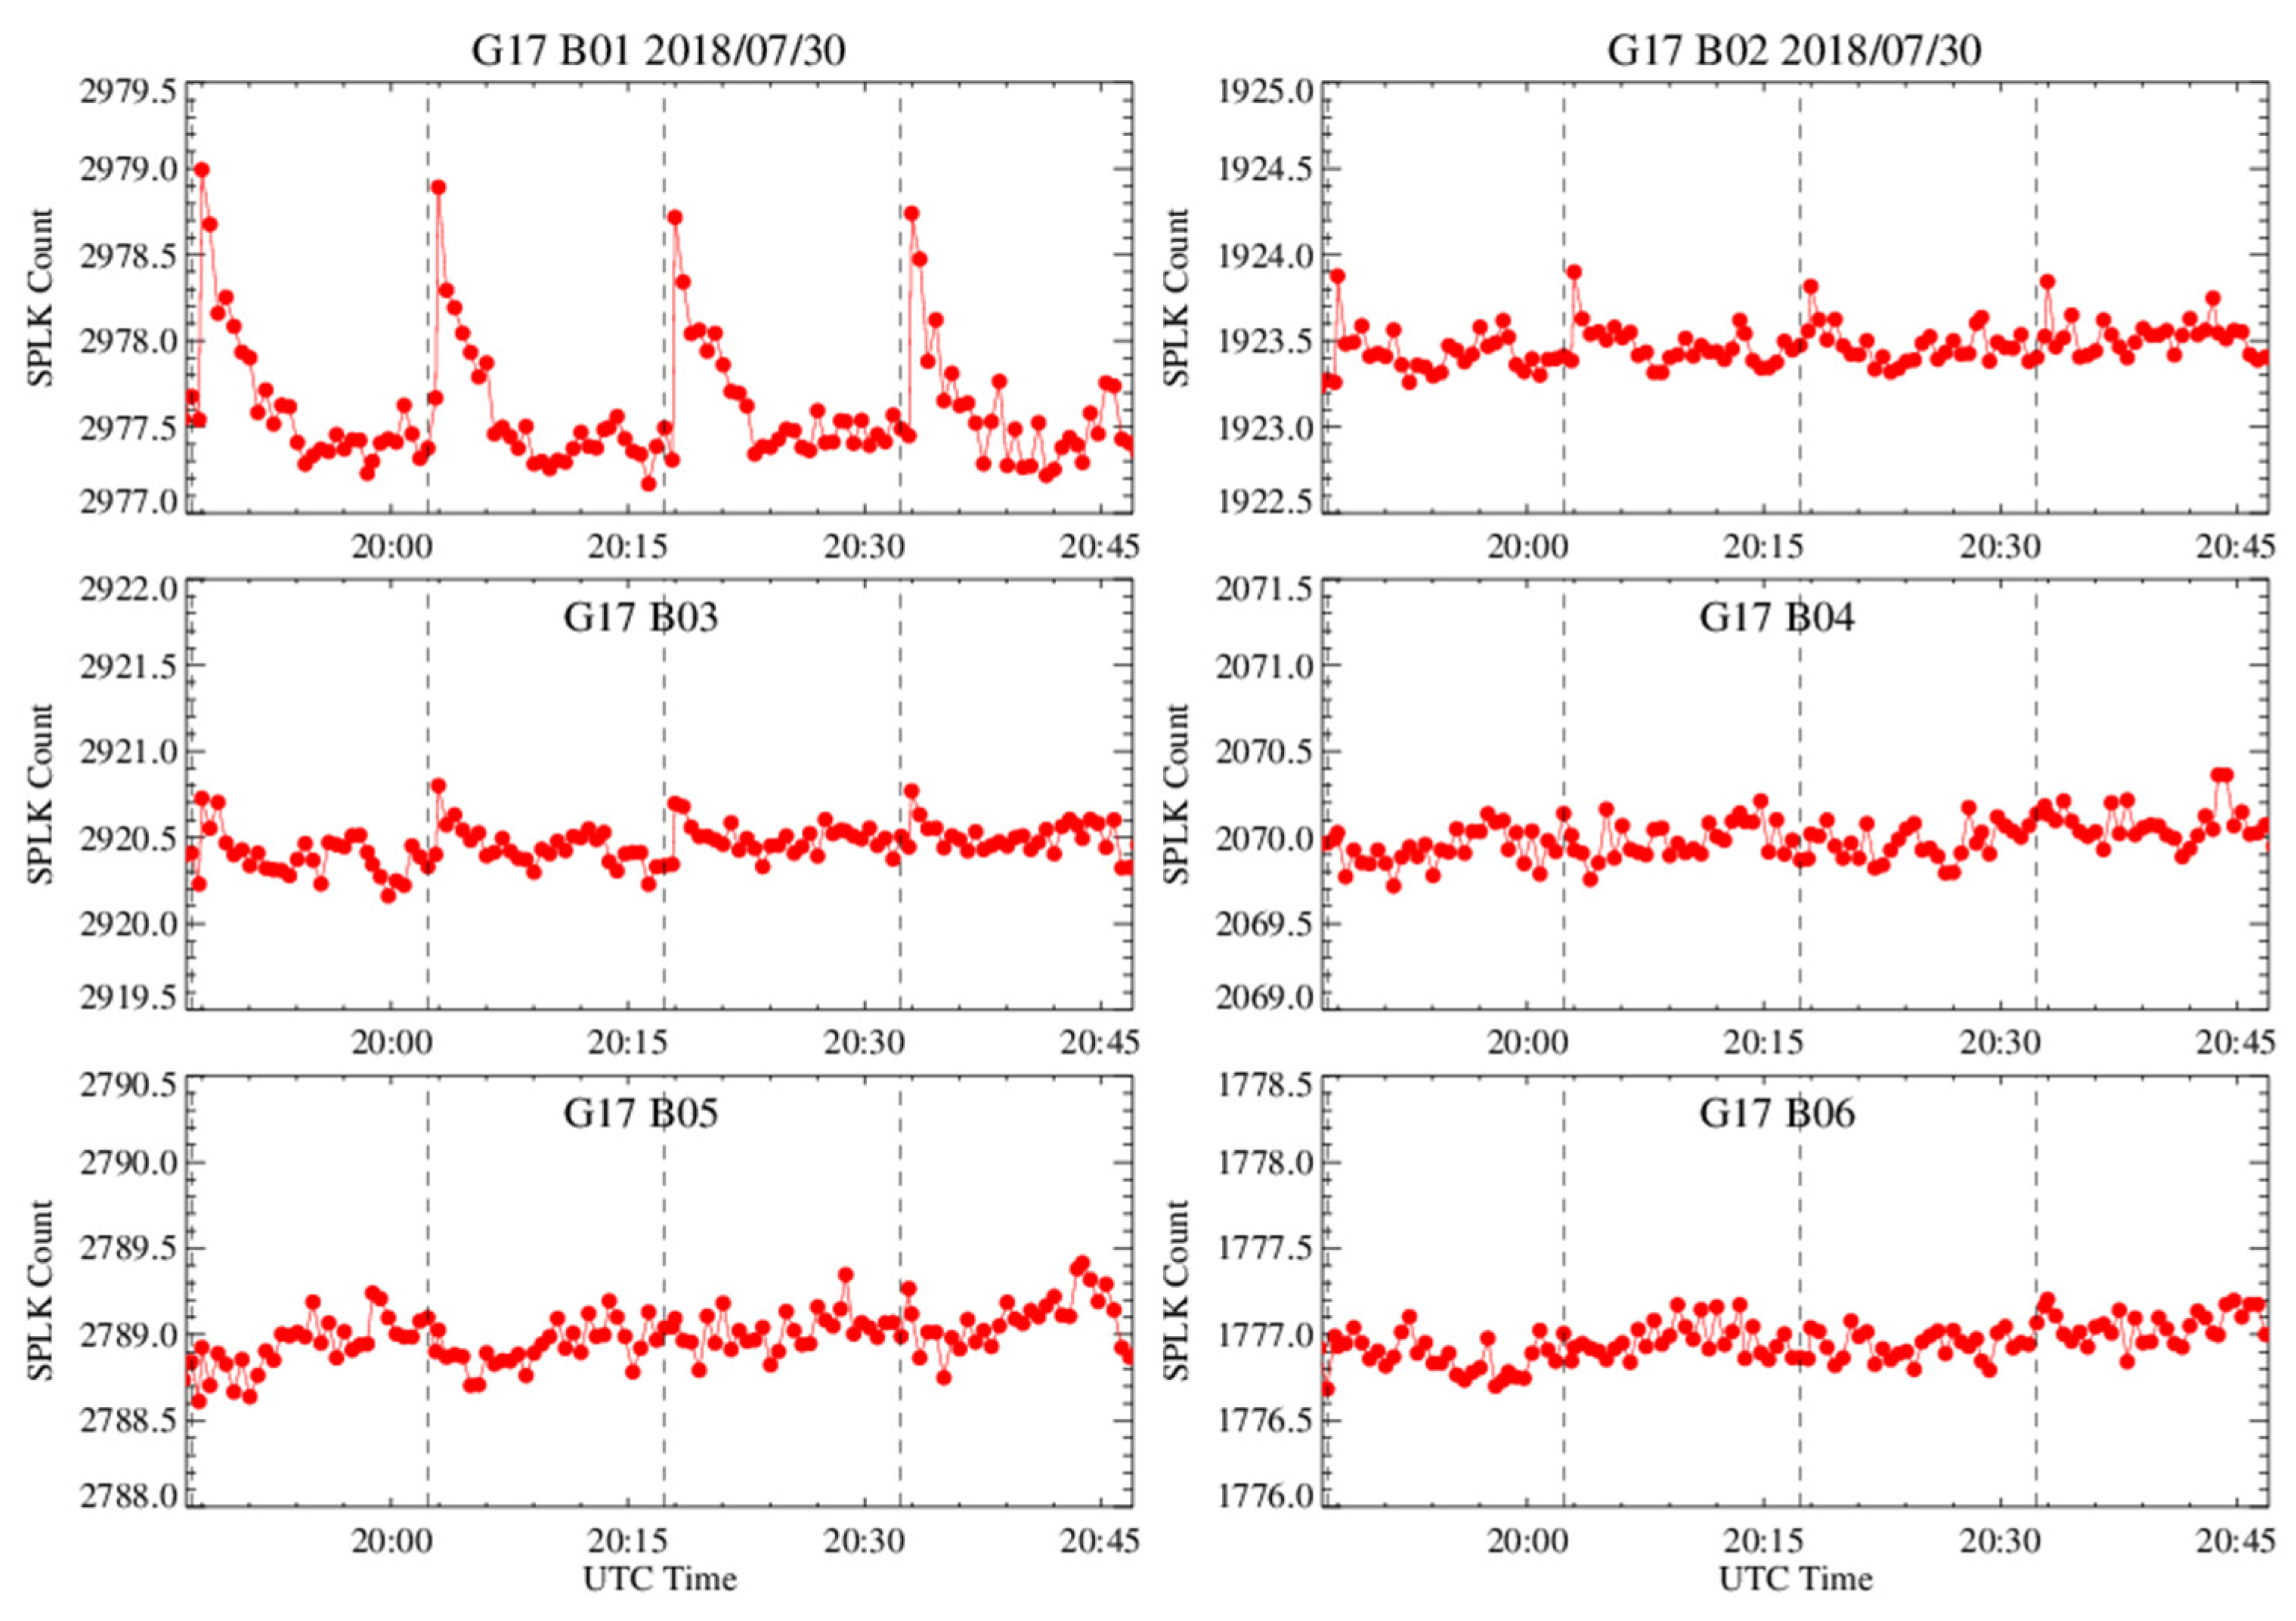
Examinations of the spacelook data during the chasing events indicate that the elevated data always occur near the polar regions. Figure 10 and Figure 11 are the time series of the spacelook values for the G16 chasing event on 11 February 2017 and the G17 chasing event on 30 July 2018, respectively. The vertical gray lines stand for the starting time of each Mode 3A timeline. The repetition of elevated spacelook count can be observed at B01, to a less degree at B02, barely detectable at B03, and not discernible at B04–06 at both satellites. For the G16 data collected on 11 February 2017, the elevated spacelooks occur at both polar regions with the relatively larger values near the South Pole, while the G17 data on 30 July 2018 show the elevated count near the North Pole. The distribution of elevated values implies that the contamination may be related to the viewing geometry of the polar regions.
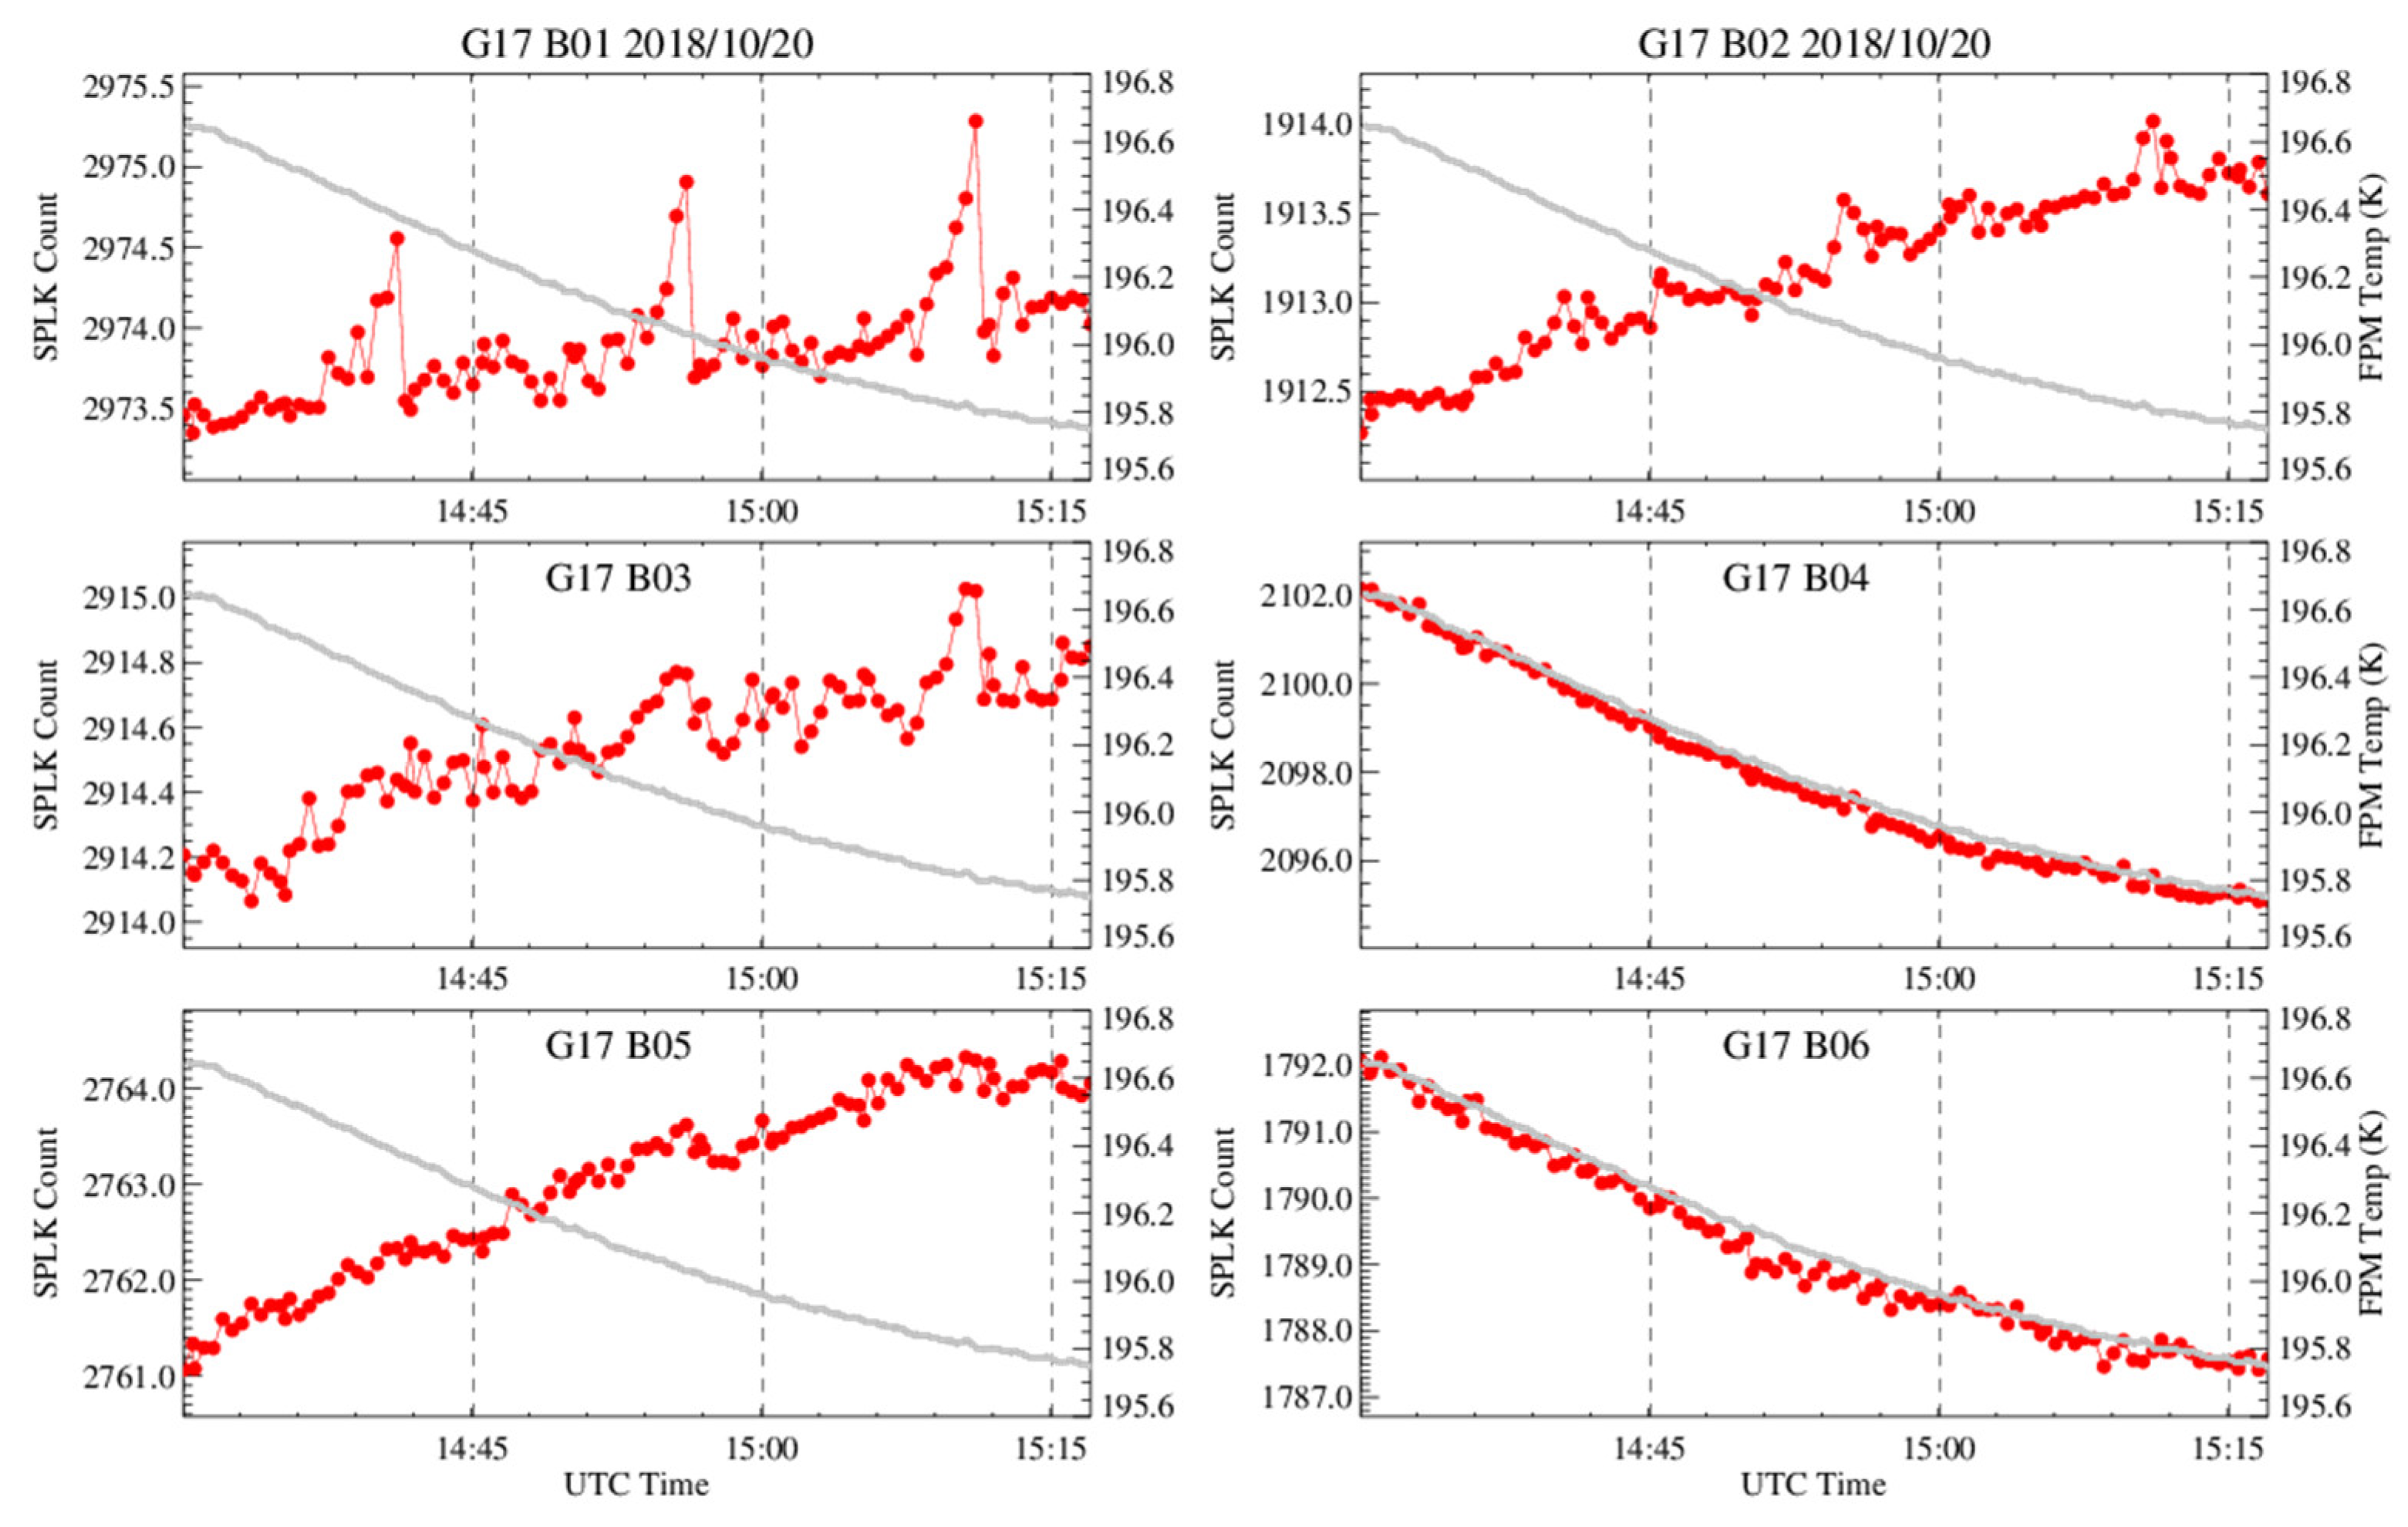
The ABI instruments at G16 and G17 have different operational configurations. G17 ABI has been suffering the cryocooler system anomaly due to the loop heat pipe (LHP) malfunction starting even before the PLT/PLPT started [29]. To save the limited cooling capacity of the cryocooler system, the G17 ABI VNIR FPM temperature is not controlled as G16. While the G16 VNIR FPM is being operated as designed at a stable temperature of about 180 K, the G17 VNIR FPM temperature can vary from several degrees to more than 10 K in a day, depending on the time in a year. With the controlled VNIR FPM temperature, there is no temperature correction term in the ABI operational calibration algorithm for the solar reflected bands [22]. However, detector response can change with the drifting FPM temperature [10,13,30]. Figure 12 displays the time series of spacelook of all the six VNIR bands for the G17 chasing event conducted at ~14:27–15:15 UTC on 20 October 2018, overplotted with the VNIR FPM temperature. During this period, G17 VNIR FPM temperature dropped by 0.9 K in about 50 min, driving the drifts of band-dependent spacelook responses. In addition to the drifting spacelook count, the repetitive elevated spacelook count can also be observed near the polar region at the short-wavelength bands. The FPM temperature change in each chasing event is given in Table 2 and Table 3 for G16 and G17, respectively. All five G16 chasing events and one G17 event on 30 July 2018 have the FPM temperature change within 0.1 K, which is required by the ABI nominal operation [31]. The FPM temperatures of the other three G17 events on 29 August 2018, 29 August 2018, and 20 October 2018 drift more than 0.4 K and the spacelook data for these events should be treated differently.

6.1.2. Spacelook Corrections for B01–B03

Two different algorithms are used to correct the contaminated detector spacelook of the B01–B03 data, depending on the VNIR FPM temperature change in the chasing events. For the events with the FPM temperature variation less than 0.1 K, the mean detector spacelook count from all the Equator spacelook scenes in each timeline is used for the radiometric calibration of the data collected within that timeline. This correction algorithm, which is applied to all five G16 chasing events and the one G17 chasing event conducted on 30 July 2018, is described in Section 6.1.2.1. For the other three G17 chasing events conducted on 28 August 2018, 29 August 2018, and 20 October 2018 with the FPM temperature variations larger than 0.1 K, the detector spacelook count is estimated with a linear relationship between the FPM temperature and the detector spacelook count, and the algorithm is described in Section 6.1.2.2.

6.1.2.1. Spacelook Correction for the Stable FPM Data

As described in Section 3.1, nine of thirty-one spacelook scenes of each Mode 3A timeline are conducted in the Equator space (Figure 3). This is based on the observation that the contaminated spacelook scenes are always near the polar regions. The mean spacelook count of each detector from the nine Equator scenes is used to replace the Csplk in Equation (2). Equation (1) is then modified to recalibrate the sample radiance in the B01-B03 lunar images, as shown with Equation (8). This spacelook correction algorithm is applied to all the G16 chasing events and G17 chasing data on 30 July 2018.
R s m p l = m C s m p l C s p l k ¯ + q C s m p l C s p l k ¯ 2 ρ e w ρ n s ,
where C s p l k ¯ is the detector mean spacelook value from the nine spacelook events at the Equator in a timeline.

6.1.2.2. Spacelook Correction for the Unstable FPM Data

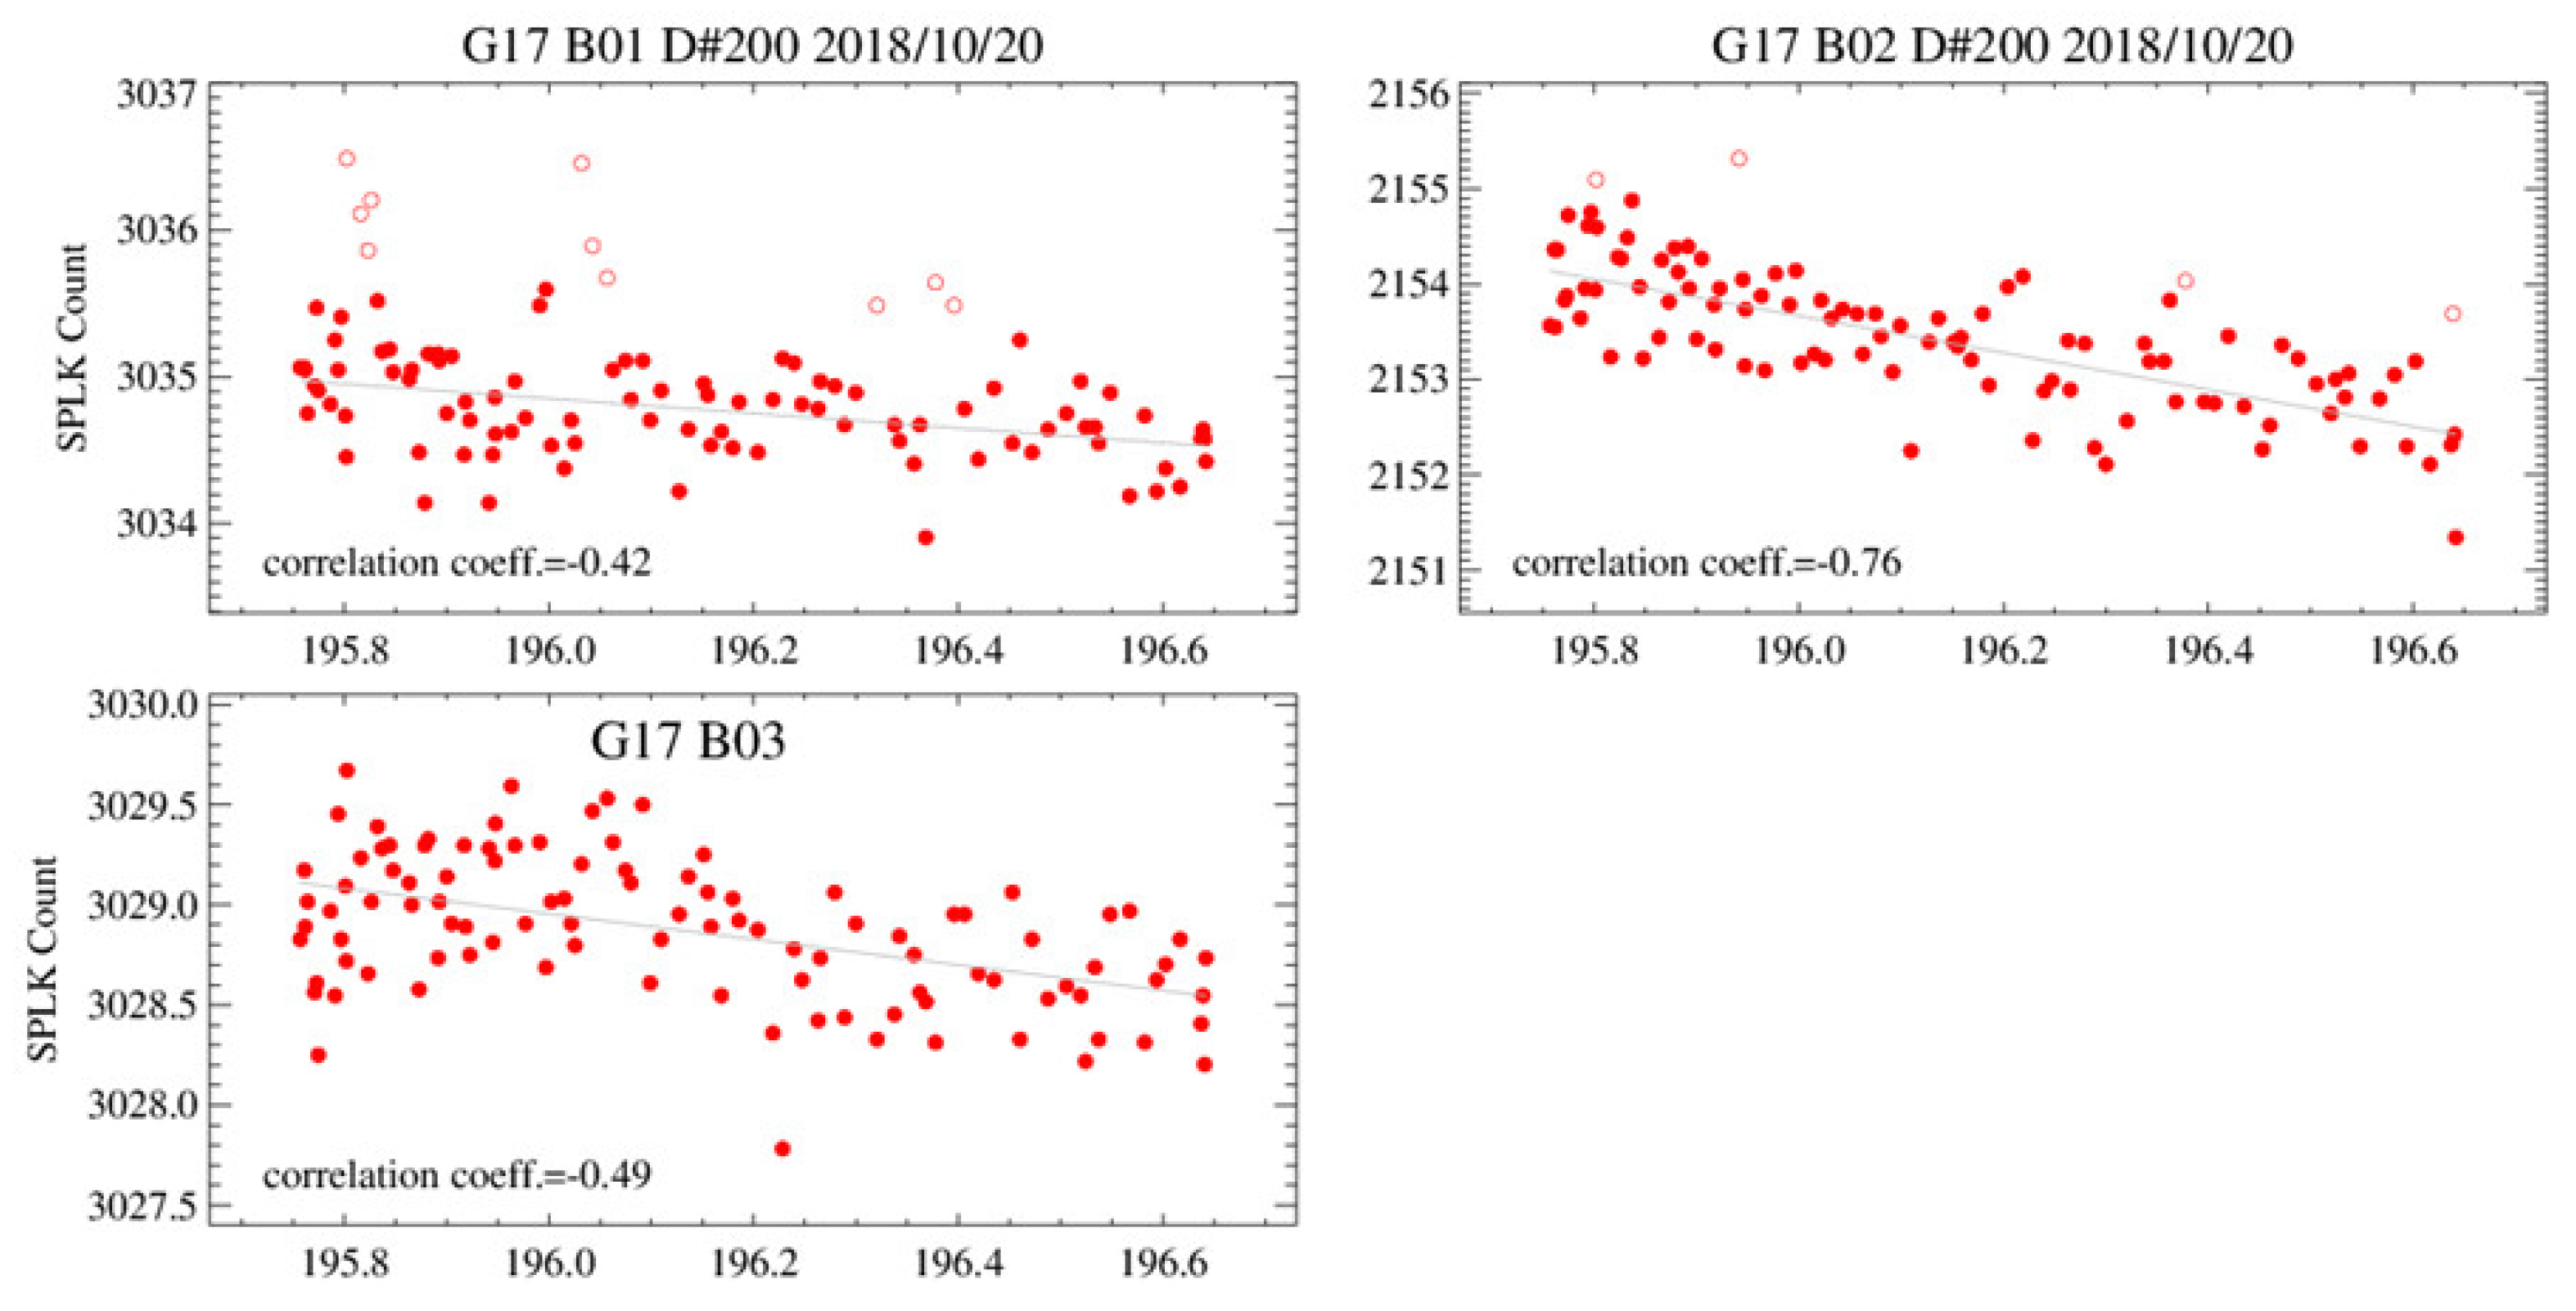
Figure 13 is an example of the spacelook data for Detector #200 versus the VNIR FPM temperature for the G17 chasing event on 20 October 2018. There is a strong linear relationship between the detector spacelook count and the VNIR FPM temperature at each band. In this study, a linear iteration fitting is used to identify the spacelook outliers [32]. Any spacelook count that deviates from the fitting regression at more than twice the standard deviation of the linear-fitting residuals is considered an outlier and not used in the next fitting calculation until no new outlier is detected. The detected outliers (shown as open circles in Figure 13) are associated with the abnormally elevated B01 and B02 values repetitively shown in Figure 12. The linear-fitting function of each detector is used to estimate the detector spacelook value for each spacelook time in the specific chasing event.
Qian et al. [30] reported that the mean detector m value change rate is less than 0.016% per Kevin for the G17 VNIR bands. As the FPM temperature drifts less than 1 K in all the G17 chasing events, the change in detector responsivity is thus very small and the detector first-order calibration coefficient (m value in Equation (1)) in this study is not adjusted with the FPM temperature. The sample radiance of the G17 B01-B03 images collected on 28 August 2018 and 29 August 2018 and 20 October 2018 are corrected with Equation (9).
R s m p l = m C s m p l C s p l k ^ + q C s m p l C s p l k ^ 2 ρ e w ρ n s ,
where C s p l k ^ is estimated with the linear regression between the FPM temperature and spacelook count at the spacelook observation time.

6.1.3. Results of Spacelook Correction at B01–B03

The normalized lunar irradiance ratios after the spacelook correction for B01–B03 are shown in Figure 14 and Figure 15 for G16 and G17, respectively. Compared to Figure 8 and Figure 9, the new normalized ratios are more consistent among the chasing events, especially at B01. The scattered outliers in the long chasing events are also removed. The improved consistency of normalized irradiation ratios indicates the success of the spacelook corrections.
Certain common variation patterns, however, still remain at both satellites. First, the normalized ratios of the short chasing events are generally larger at the western side (negative EW scan angles) than those at the eastern side (positive EW scan angles). All the short chasing data were collected after satellite noon when the Sun shines on the western side of the Earth. The increasing trend of the normalized ratio at the western side of the Earth implies an increase in lunar irradiance as the images approach the illuminated Earth limb. Secondly, all the long chasing events display a bulge pattern at the short-wavelength bands with the largest magnitude at B01. The bulge peaks occur near the illuminated side of the polar region, implying the straylight spilled into the space from the illuminated Earth.
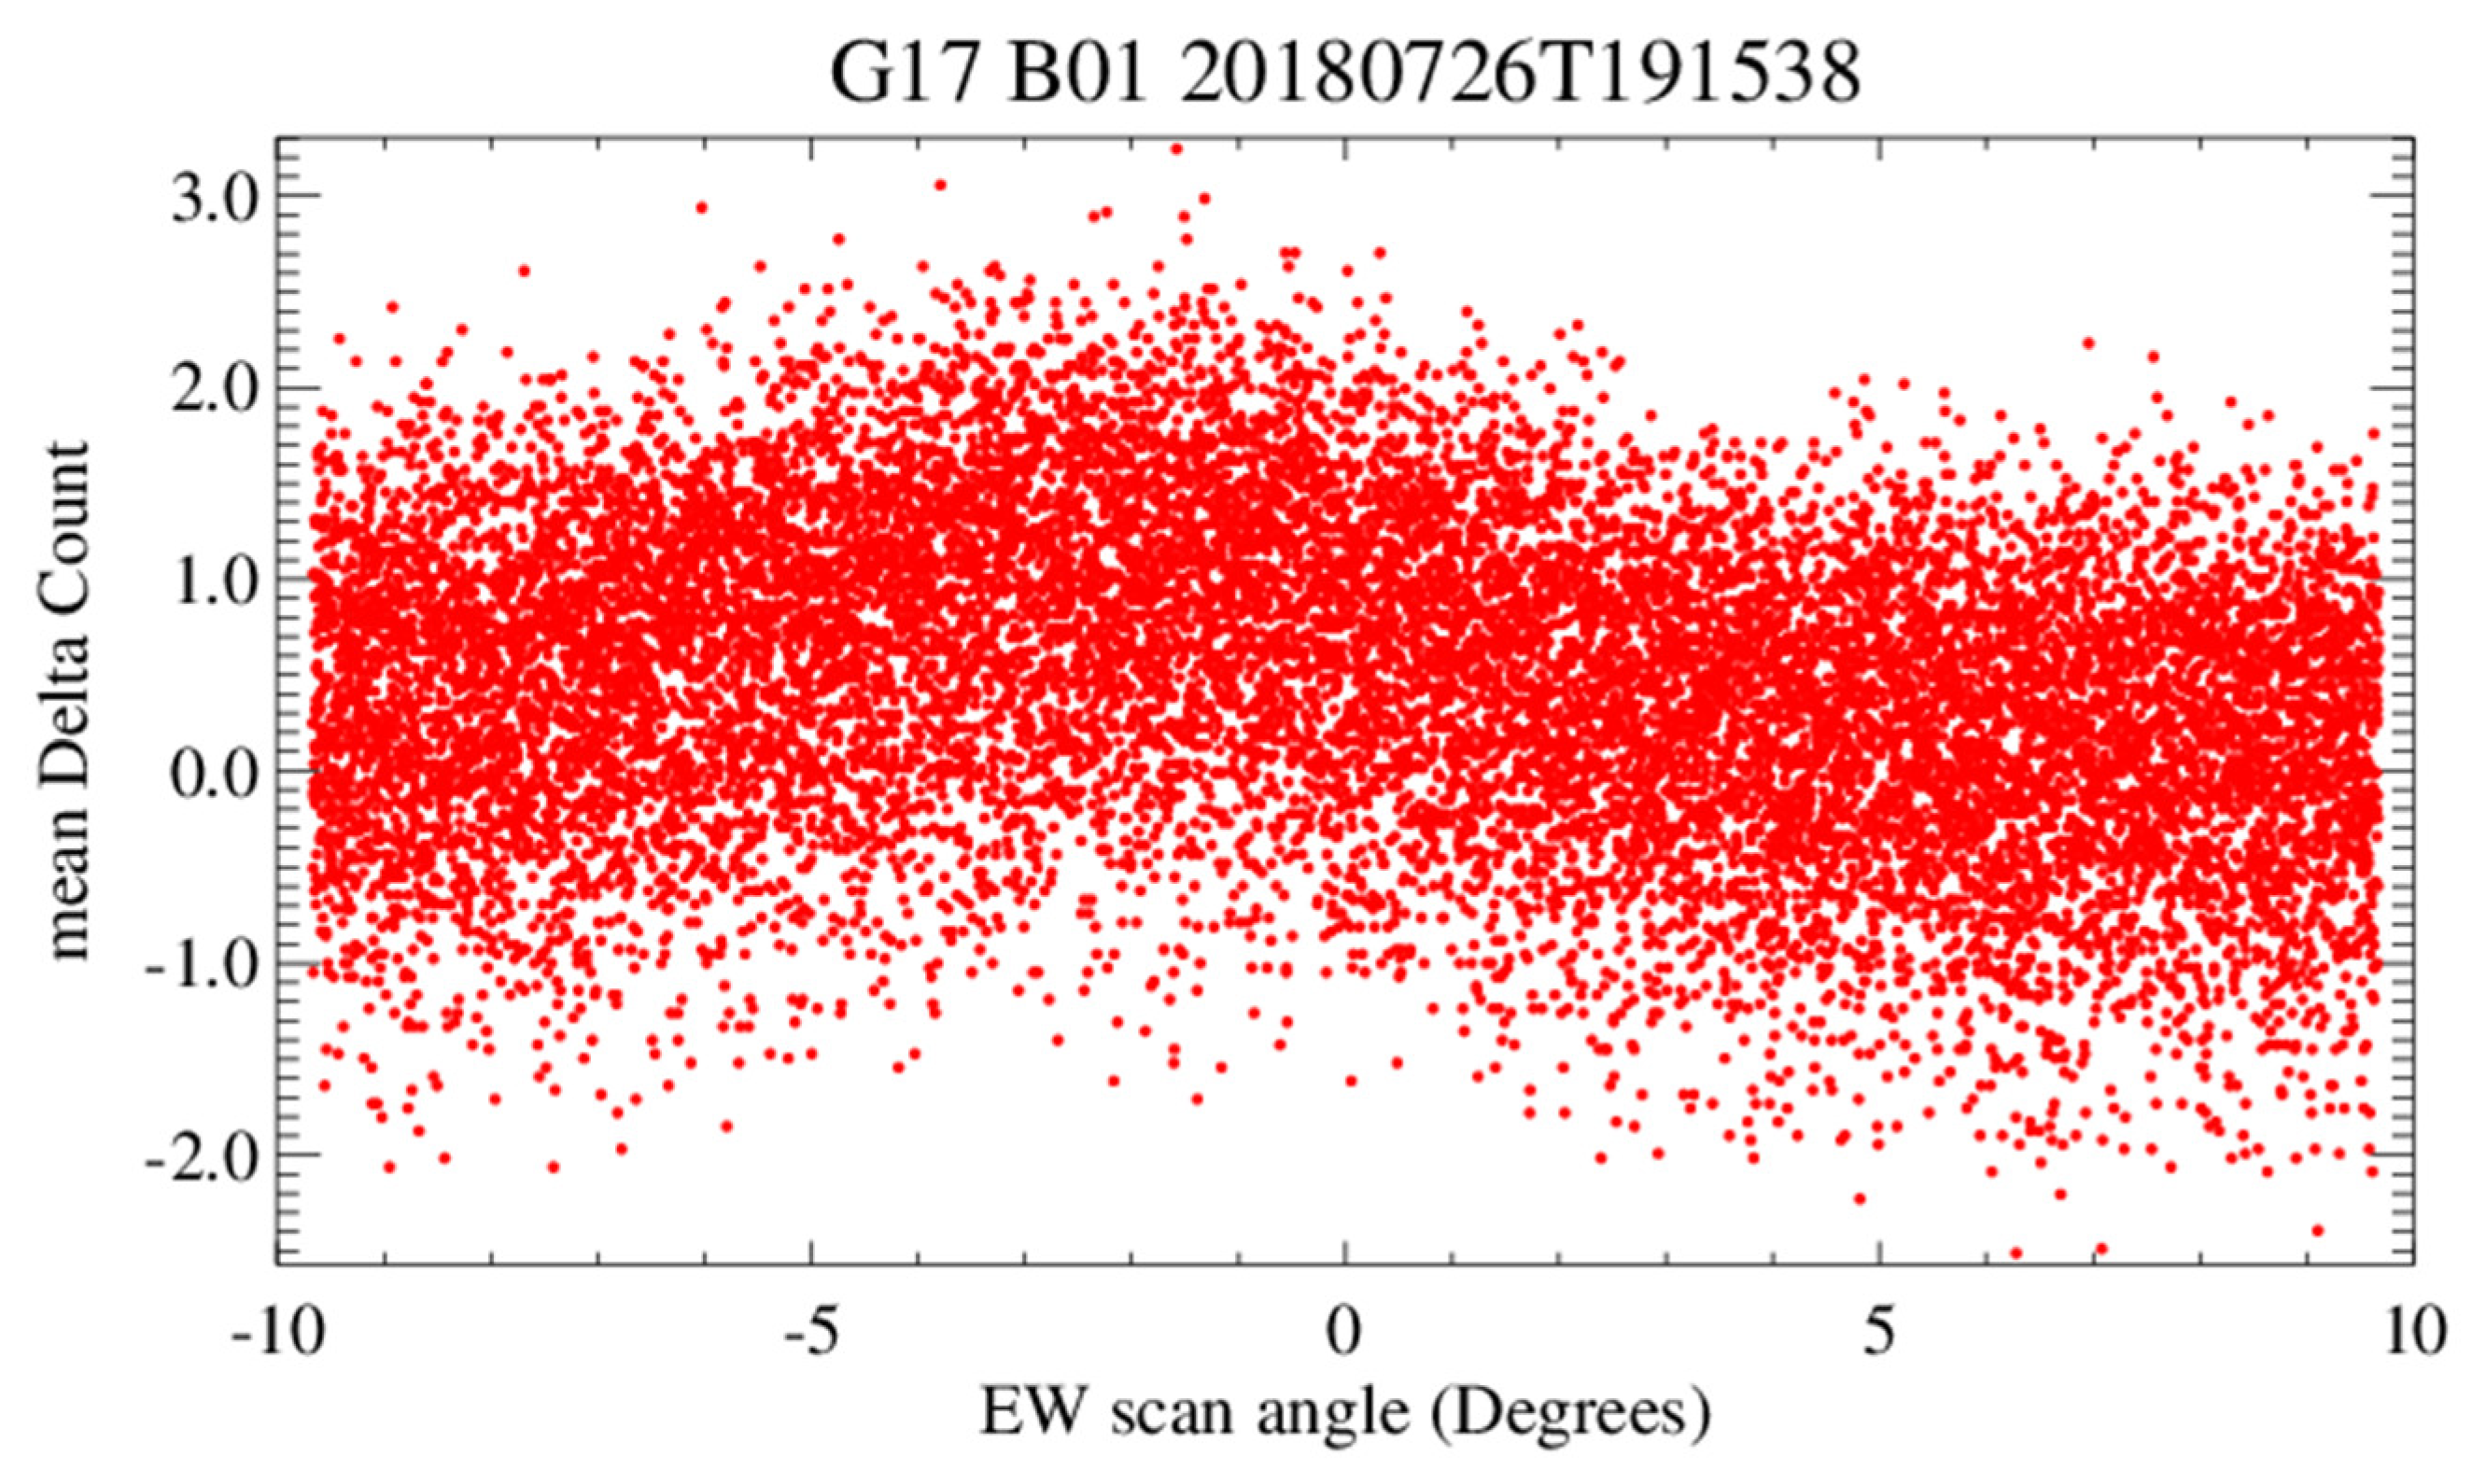
Another evidence of the presence of straylight from the Earth into the space vicinity can be exhibited with the G17 special maneuver data collected on 26 July 2018 before the G17 PLT/PLPT started. The spacecraft was rolled for one day to allow half of the FD images to scan the half hemisphere and the other half to scan the space beyond the pole. Figure 16 is the B01 albedo of the FD swath #11 in the timeline starting at 19:10 UTC. This is one of the longest swaths in an FD image and each line consists of 15,264 samples. To show the whole swath data, the figure is subsampled for every four samples in the EW direction. The Earth is below this swath. The light from the North Pole into the space vicinity can be observed near the central bottom of this swath (in red and cyan). Further away from the Earth, the straylight signal becomes weaker.
The samples from the northern half of this swath, which are about 0.45°–0.9° away from the North Pole, are used to display the impact of spilled light on the space samples away from the Earth. The delta count is referred to the sample response offset to the spacelook scene count calculated with Equation (2). Figure 17 is the profile of the delta count averaged from the half-swath samples at the same vertical line. A slight bulge is shown near the nadir above the North Pole. The small elevation of the delta count at ~1 count can cause an extra radiance of about 0.058 W/m2Srµm or 0.009% albedo at each sample. This error can contribute to ~1% B01 irradiance variation if the same amount of straylight is presented in the lunar images on 30 July 2018. Therefore, the light spilled from the Earth needs to be corrected at B01–B03 for an accurate lunar irradiance calculation.

6.2. Radiance Correction for B01–B03 Lunar Images

The average radiance from two 10 × N samples, each at the two edges of a lunar image, is used to correct the radiance spilled from the Earth on the lunar image. N is the number of valid detectors per swath for each band. It assumes that the spilled light gradually changes across a subset lunar image. The straylight correction equation can be described as follows:
R s m p l = R s m p l R s p a c e ¯ ,
where R s p a c e ¯ is the radiance averaged from the space samples at two edges of a lunar image, as described above, and R s m p l is the spacelook-corrected lunar sample radiance of the sample in the lunar image with Equation (8) or (9). The new derived Rsmpl in each B01-B03 lunar image is used to recalculate the lunar irradiance and the normalized lunar irradiance ratio with Equations (4)–(7).

7. Final Results

The final RVS results for B01–B03 after the straylight corrections, and the B04-B06 data (no straylight correction applied and thus the same as shown in Figure 8 and Figure 9) for G16 and G17, are shown in Figure 18 and Figure 19, respectively. All the normalized irradiance ratios are within 0.5% and the mean of the normalized ratios is 1.0 at each band. The trending of the long chasing data generally agrees well with each other and is consistent with those of the short chasing events. The consistent trending at all the multiple events indicates the robust RVS results. It also implies very high relative calibration accuracy of the GIRO model for the ABI lunar images collected in two hours used in this study.
A linear fitting is used to characterize the scan-angle-dependent RVS trend. Results are provided in Table 4. The difference at the two ends of an FD image, which ranges between −8.7° and +8.7°, is less than 0.3% for all the VNIR bands, indicating that the scan-mirror reflectivity in the EW direction is well calibrated for both satellites. All the bands, except for G16 B04, display a significant linear slope with the F-test significant at a 95% confidence interval. The linear-fitting slopes are all positive at B01–B03 and negative at B04–B06 for the two satellites. Considering that the chasing events were conducted at various phase angles, the significant linear-fitting slope may imply a small but significant residual of the spatial uniformity correction for these bands.

8. Conclusions

This study characterizes the spatial uniformity for the ABI VNIR radiance in the EW direction using a series of specially collected lunar images during the G16/17 PLT/PLPT periods. The GIRO model (v1.0.0), which is a derivative of the ROLO model and known for the high relative calibration accuracy at a certain phase-angle range for the short-wavelength bands, is used to account for the irradiance variation caused by the changes in lunar phase angle in each data collection event. The normalized lunar irradiance ratio is used to examine the ABI RVS variation across the EW scan mirror scan ranges. To accurately calculate the ABI lunar irradiance, each lunar image is subset with an appropriate window size covering the Moon and the space vicinity.
The initial RVS results indicate that B01 at both satellites has the largest RVS variation at >1%, to a less degree at B02, and within 0.5% for the long-wavelength bands. The relatively large variations in the short-wavelength bands are caused by slight straylight, which can only be detected for some of the B01–B03 data. The spacelook scenes conducted near the polar regions may be contaminated by the straylight scattered from the Earth. The impact on a typical Earth scene of 40% albedo is negligible (<0.01% albedo) for B01, but it can cause about 1% variation in the RVS variations within a timeline. Additionally, when the Moon approaches the illuminated Earth limb, the spilled light into the vicinity space can cause about 1% RVS variation in the B01 data in the chasing events.
The straylight on the spacelook count is carefully corrected in the B01–B03 lunar images using different methods based on the FPM temperature variation. For the chasing events with stable FPM temperature, including the five G16 events and one G17 event, the contaminated spacelook is corrected with the mean value from the nine spacelook scenes conducted near the Equator in a timeline. For the three G17 chasing events that experience a drifting FPM temperature larger than 0.1 K, the detector spacelook count value is estimated with a linear function between the detector spacelook count and the FPM temperature. All the B01–B03 lunar images are recalibrated with the corrected detector spacelook value. Afterward, the mean radiance from the two edges of each recalibrated lunar image is used to further correct the spilled straylight from the illuminated Earth.
After these corrections, the variations in normalized lunar irradiance ratios are within 0.5% for all the VNIR bands of the two satellites. A small but significant linear trend can be observed for all the VNIR bands, except at G16 B04. In fact, the trend is within 0.3% for all the VNIR FD images, indicating the high spatial uniformity of the ABI VNIR radiance in the EW direction at the two satellites. The consistent trending results for the chasing events with different phase angles also confirm that the GIRO model is very stable in a relatively short period for bright moons at the ABI VNIR bands. The same method described in this paper will be applied to validate the spatial uniformity of the VNIR data in the recently launched GOES-18 and future GOES-U ABI instruments. This method is also applicable to the other new generational geostationary satellites.
When the satellite is in the mission life after the PLT/PLPT testing, the Moon is regularly scanned with about eight MESO scans per month to validate the trend of solar calibration results. For this study, the lunar images conducted at the dark side of the Earth and calibrated with the spacelooks at low latitudes are preferred to reduce the impact of possible straylight on the lunar irradiance calculation. A smaller subset in each lunar image that covers the blooming and ghosting area may also be considered to reduce lunar trending uncertainty.

Author Contributions

Conceptualization, X.W. and F.Y.; methodology, data analysis, and investigation, F.Y.; data collection and software, F.Y. and X.S.; initial manuscript, F.Y.; constructive review comments and oversight of the research, X.W.; funding and coordination of the project, X.W.; solar calibration coefficients, H.Q.; manuscript revision, F.Y., X.W., X.S. and H.Q. All authors have read and agreed to the published version of the manuscript.

Funding

This work is funded by the NOAA GOES-R Program through grant NA19NES432002 (Cooperative Institute for Satellite Earth System Studies—CISESS) at the Earth System Science Interdisciplinary Center (ESSIC), University of Maryland.

Data Availability Statement

The lunar chasing data are available at NOAA Comprehensive Large Array-Data Stewardship System (CLASS) (https://www.avl.class.noaa.gov/saa/products/welcome, accessed on 15 February 2023).

Acknowledgments

The authors would like to thank GOES-R program office (PRO), Flight and Mission Operation Support Team (MOST) teams for helping to collect the special scan data, and EUMETSAT for sharing the GIRO model within the GSICS community. We are grateful to J. Fulbright for coordinating the ABI lunar image collections and the many valuable comments, D. Pogorzara for sharing the GOES-R ABI Trending and Data Analyst Toolkit (GRATDAT), H. Yoo for the help of downloading L0 data and using GRATDAT, Z. Wang for the coherent noise analysis, and B. Basnet for review comments. The L1A data were ingested with the GOES-R ABI GRATDAT.

Conflicts of Interest

The authors declare no conflict of interest. The scientific results and conclusion, as well as any reviews or opinions expressed herein, are those of the authors and do not necessarily reflect those of NOAA or Department of Commerce.

Abbreviations

ABIAdvanced Baseline Imager
AOIAngle of Incidence
BDSBest Detector Selected
CNESCentre National D’Etudes Spatiales
CONUSContiguous United Status
EWEast–West
FDFull Disk
FORField of Regard
FOVField of View
FPMFocal Plane Module
G16GOES-16
G17GOES-17
GIROGSICS Implementation of the ROLO
GOESGeostationary Operational Environmental Satellite
GSGround Segment
GSICSGlobal Space-Based Inter-Calibration System
IFOVInstantaneous Field of View
L1αL1alpha
L1bLevel1B
LOSLight of Sight
LUTLookup Table
MCTMercury Cadmium
MESOMesoscale
NOAANational Oceanographic and Atmospheric Administration
NSNorth–South
PLT/PLPTPost-Launch Test and Post-Launch Product Test
ROLORobotic Lunar Observatory
RVSResponse versus Scan Angle
SNRSignal-to-Noise Ratio
SPLKSpacelook
USGSUnited States Geological Survey
VNIRVisible and Near-Infrared

References

  1. Kalluri, S.; Alcala, C.; Carr, J.; Griffith, P.; Lebair, W.; Lindsey, D.; Race, R.; Wu, X.; Zierk, S. From photons to pixels: Processing data from the Advanced Baseline Imager. Remote Sens. 2018, 10, 177. [Google Scholar] [CrossRef] [Green Version]
  2. Gibbs, B. Improved GOES-R ABI image navigation and registration using maximum likelihood parameter estimation. J. Appl. Remote Sens. 2020, 14, 032404. [Google Scholar] [CrossRef]
  3. Schmit, T.; Gunshor, M.; Menzel, W.; Gurka, J.J.; Li, J.; Bachmeier, A.S. Introducing the next-generation advanced baseline imager on GOES-R. Bull. Am. Meteorol. Soc. 2005, 86, 1079–1096. [Google Scholar] [CrossRef]
  4. Schmit, T.; Griffith, P.; Gunshor, M.; Daniels, J.; Goodman, S.; Lebair, W. A closer look at the ABI on the GOES-R Series. Bull. Am. Meteorol. Soc. 2017, 98, 681–698. [Google Scholar] [CrossRef]
  5. Weinreb, M.; Jamieson, M.; Fulton, N.; Chen, Y.; Johnson, J.; Bremer, J.; Smith, C.; Baucom, J. Operational calibration of Geostationary Operational Environmental Satellite-8 and -9 images and sounders. Appl. Opt. 1997, 36, 6895–6904. [Google Scholar] [CrossRef] [PubMed]
  6. Yu, F.; Wu, X.; Qian, H.; Naarden, J.; Ramirez, M.; Lindsey, D.; Gravell, C.; Gunshor, M.; Schmit, T.; Shao, X.; et al. Validation of GOES-16 ABI infrared spatial response uniformity. Proc SPIE 2018, 10764, 107640F. [Google Scholar] [CrossRef]
  7. Kieffer, H.; Stone, T. The spectral irradiance of the Moon. Astron. J. 2015, 129, 2887–2901. [Google Scholar] [CrossRef] [Green Version]
  8. EUMETSAT. GIRO and GSICS Lunar Observation Dataset Usage Policy. 2015. Available online: http://gsics.atmos.umd.edu/pub/Development/LunarWorkArea/GSICS-EP-16_Doc_13_GIRO-GLOD-policy.pdf (accessed on 15 May 2015).
  9. Eplee, R.; Meister, G.; Patt, F.; Barnes, R.; Bailey, S.; Franz, B.; McClain, C. On-orbit calibration of SeaWiFS. Appl. Opt. 2012, 51, 8702–8730. [Google Scholar] [CrossRef] [PubMed]
  10. Xiong, X.; Sun, J.; Barnes, W.; Salomonson, V.; Esposito, J.; Erives, H.; Guenther, B. Multiyear on-orbit calibration and performance of Terra MODIS reflective solar bands. IEEE Trans. Geosci. Remote Sens. 2007, 45, 879–889. [Google Scholar] [CrossRef]
  11. Sun, J.; Xiong, X.; Barnes, W.; Guenther, B. MODIS reflective solar bands on-orbit lunar calibration. IEEE Trans. Geo. Remote Sens. 2008, 45, 2383–2393. [Google Scholar] [CrossRef]
  12. Wu, X.; Stone, T.; Yu, F.; Han, D. Vicarious calibration of GOES Imager visible channel using the Moon. In Proceedings of the SPIE 6296, Earth Observing Systems XI, San Diego, CA, USA, 14–16 August 2006. [Google Scholar] [CrossRef]
  13. Choi, T.; Shao, X.; Cao, C. On-orbit radiometric calibration of Suomi NPP VIIRS reflective solar bands using the Moon and solar diffuser. Appl. Opt. 2018, 57, 9533–9542. [Google Scholar] [CrossRef] [PubMed]
  14. Xiong, X.; Lacherade, S.; Aznay, O.; Fougnie, B.; Fulbright, J.; Wang, Z. Comparison of S-NPP VIIRS and PLEIDES lunar observation. In Proceedings of the SPIE 9639, Sensors, Systems, and Next-Generation Satellites XIX, Toulouse, France, 12 October 2015; p. 96390Y. [Google Scholar] [CrossRef]
  15. Wu, X.; Ryan-Howard, D.; Stone, T.; Sindic-Rancic, G.; Yu, F.; Weinreb, M.; Grotenhuis, M. Angular variation of GOES Imager scan mirror reflectance. In Proceedings of the SPIE, San Diego, CA, USA, 12–16 August 2011. [Google Scholar]
  16. Yu, F.; Wu, X.; Stone, T.; Sindic-Ranic, G. Angular Variation of GOES Imager scan mirror visible reflectivity. GSICS Q. 2013, 7, 9–10. [Google Scholar]
  17. D’Souza, A.; Robinson, E.; Masterjohn, S.; Khalap, V.; Bhargava, S.; Rangel, E.; Babu, S.; Smith, S. Detectors and focal plane modules for weather instruments. In Proceedings of the SPIE 9854, Image Sensing Technologies: Materials, Devices, Systems, and Applications III, Baltimore, MD, USA, 26 May 2016; p. 98540H. [Google Scholar] [CrossRef]
  18. Griffith, P. ABI’s unique calibration and validation capabilities. In Proceedings of the EUMETSAT, Toulouse, France, 23 September 2015. [Google Scholar]
  19. Stone, T. Radiometric calibration stability and inter-calibration of solar-band instruments in orbit using the Moon. In Proceedings of the SPIE 7081, Earth Observing Systems XIII, San Diego, CA, USA, 20 August 2008; p. 70810X. [Google Scholar]
  20. Lacherade, S.; Aznay, O.; Fougnie, B. POLO Pleiades Orbital Lunar Observations—Intensive study of the Moon and comparison to ROLO model. In Proceedings of the 22nd CALCON Technical Conference, Logan, UT, USA, 29 August–1 September 2013. [Google Scholar]
  21. GOES-R Series Product Definition and User’s Guide, Volume 3: Level 1B Products, Revision 2.2. 2019. Available online: https://www.goes-r.gov/users/docs/PUG-L1b-vol3.pdf/ (accessed on 15 May 2015).
  22. Dalta, R.; Shao, X.; Cao, C.; Wu, X. Comparison of the calibration algorithms and SI traceability of MODIS, VIIRS, GOES, and GOES-R ABI Sensors. Remote Sens. 2016, 8, 126. [Google Scholar] [CrossRef] [Green Version]
  23. Yu, F.; Wu, X.; Shao, X. GOES-16 ABI lunar data preparation to GIRO. In Proceedings of the 2nd GSICS/CEOS Lunar Calibration Workshop, Xi’an, China, 13–17 November 2017. [Google Scholar]
  24. Viticchie, B.; Wagner, S.; Hewison, T. EUMETSAT Moon data and GIRO calibration results. In Proceedings of the 1st GSICS/CEOS Lunar Calibration Workshop, Darmstadt, Germany, 1–4 December 2014. [Google Scholar]
  25. Takahashi, M. Lunar data preparation for Himawari-8/-9 AHI. In Proceedings of the 2nd GSICS/CEOS Lunar Calibration Workshop, Xi’an, China, 13–17 November 2017. [Google Scholar]
  26. Yu, F.; Wu, X. Some applications of ABI lunar irradiance calibration. In Proceedings of the 3rd GSICS/CEOS Lunar Calibration Workshop, Online, 16–20 November 2020. [Google Scholar]
  27. Oh, T. GK2A AMI lunar calibration results. In Proceedings of the 3rd GSICS/CEOS Lunar Calibration Workshop, Virtual, 16–20 November 2020; Available online: http://gsics.atmos.umd.edu/bin/view/Development/LunarCalibrationWS2020 (accessed on 20 November 2020).
  28. Harting, B. Closure memo for WR 6689—Observed lunar brightness changes west-to-east over FOR. In Harris Technical Memorandum; NASA/NOAA GOES-R Portal: Greenbelt, MD, USA, 2019. [Google Scholar]
  29. Van Naardan, J.; Lindsey, D. Saving GOES-17. Aerospace America. 2019. Available online: https://aerospaceamerica.aiaa.org/departments/saving-goes-17/ (accessed on 1 April 2019).
  30. Qian, H.; Yu, F.; Wu, X.; Yoo, H. Impact of GOES-17 ABI LHP anomaly on its VNIR calibration. In Proceedings of the SPIE 11501, Earth Observing Systems XXV, Online, 20 August 2020; p. 115011A. [Google Scholar]
  31. US DOC NOAA/NESDIS; NASA. GOES-R Series Mission Requirements Document (MRD). 6 January 2021. Available online: https://www.goes-r.gov/syseng/docs/MRD.pdf (accessed on 6 January 2021).
  32. Yu, F.; Wu, X. An integrated method to improve the GOES Imager visible radiometric calibration accuracy. Remote Sens. Environ. 2015, 164, 103–113. [Google Scholar] [CrossRef]
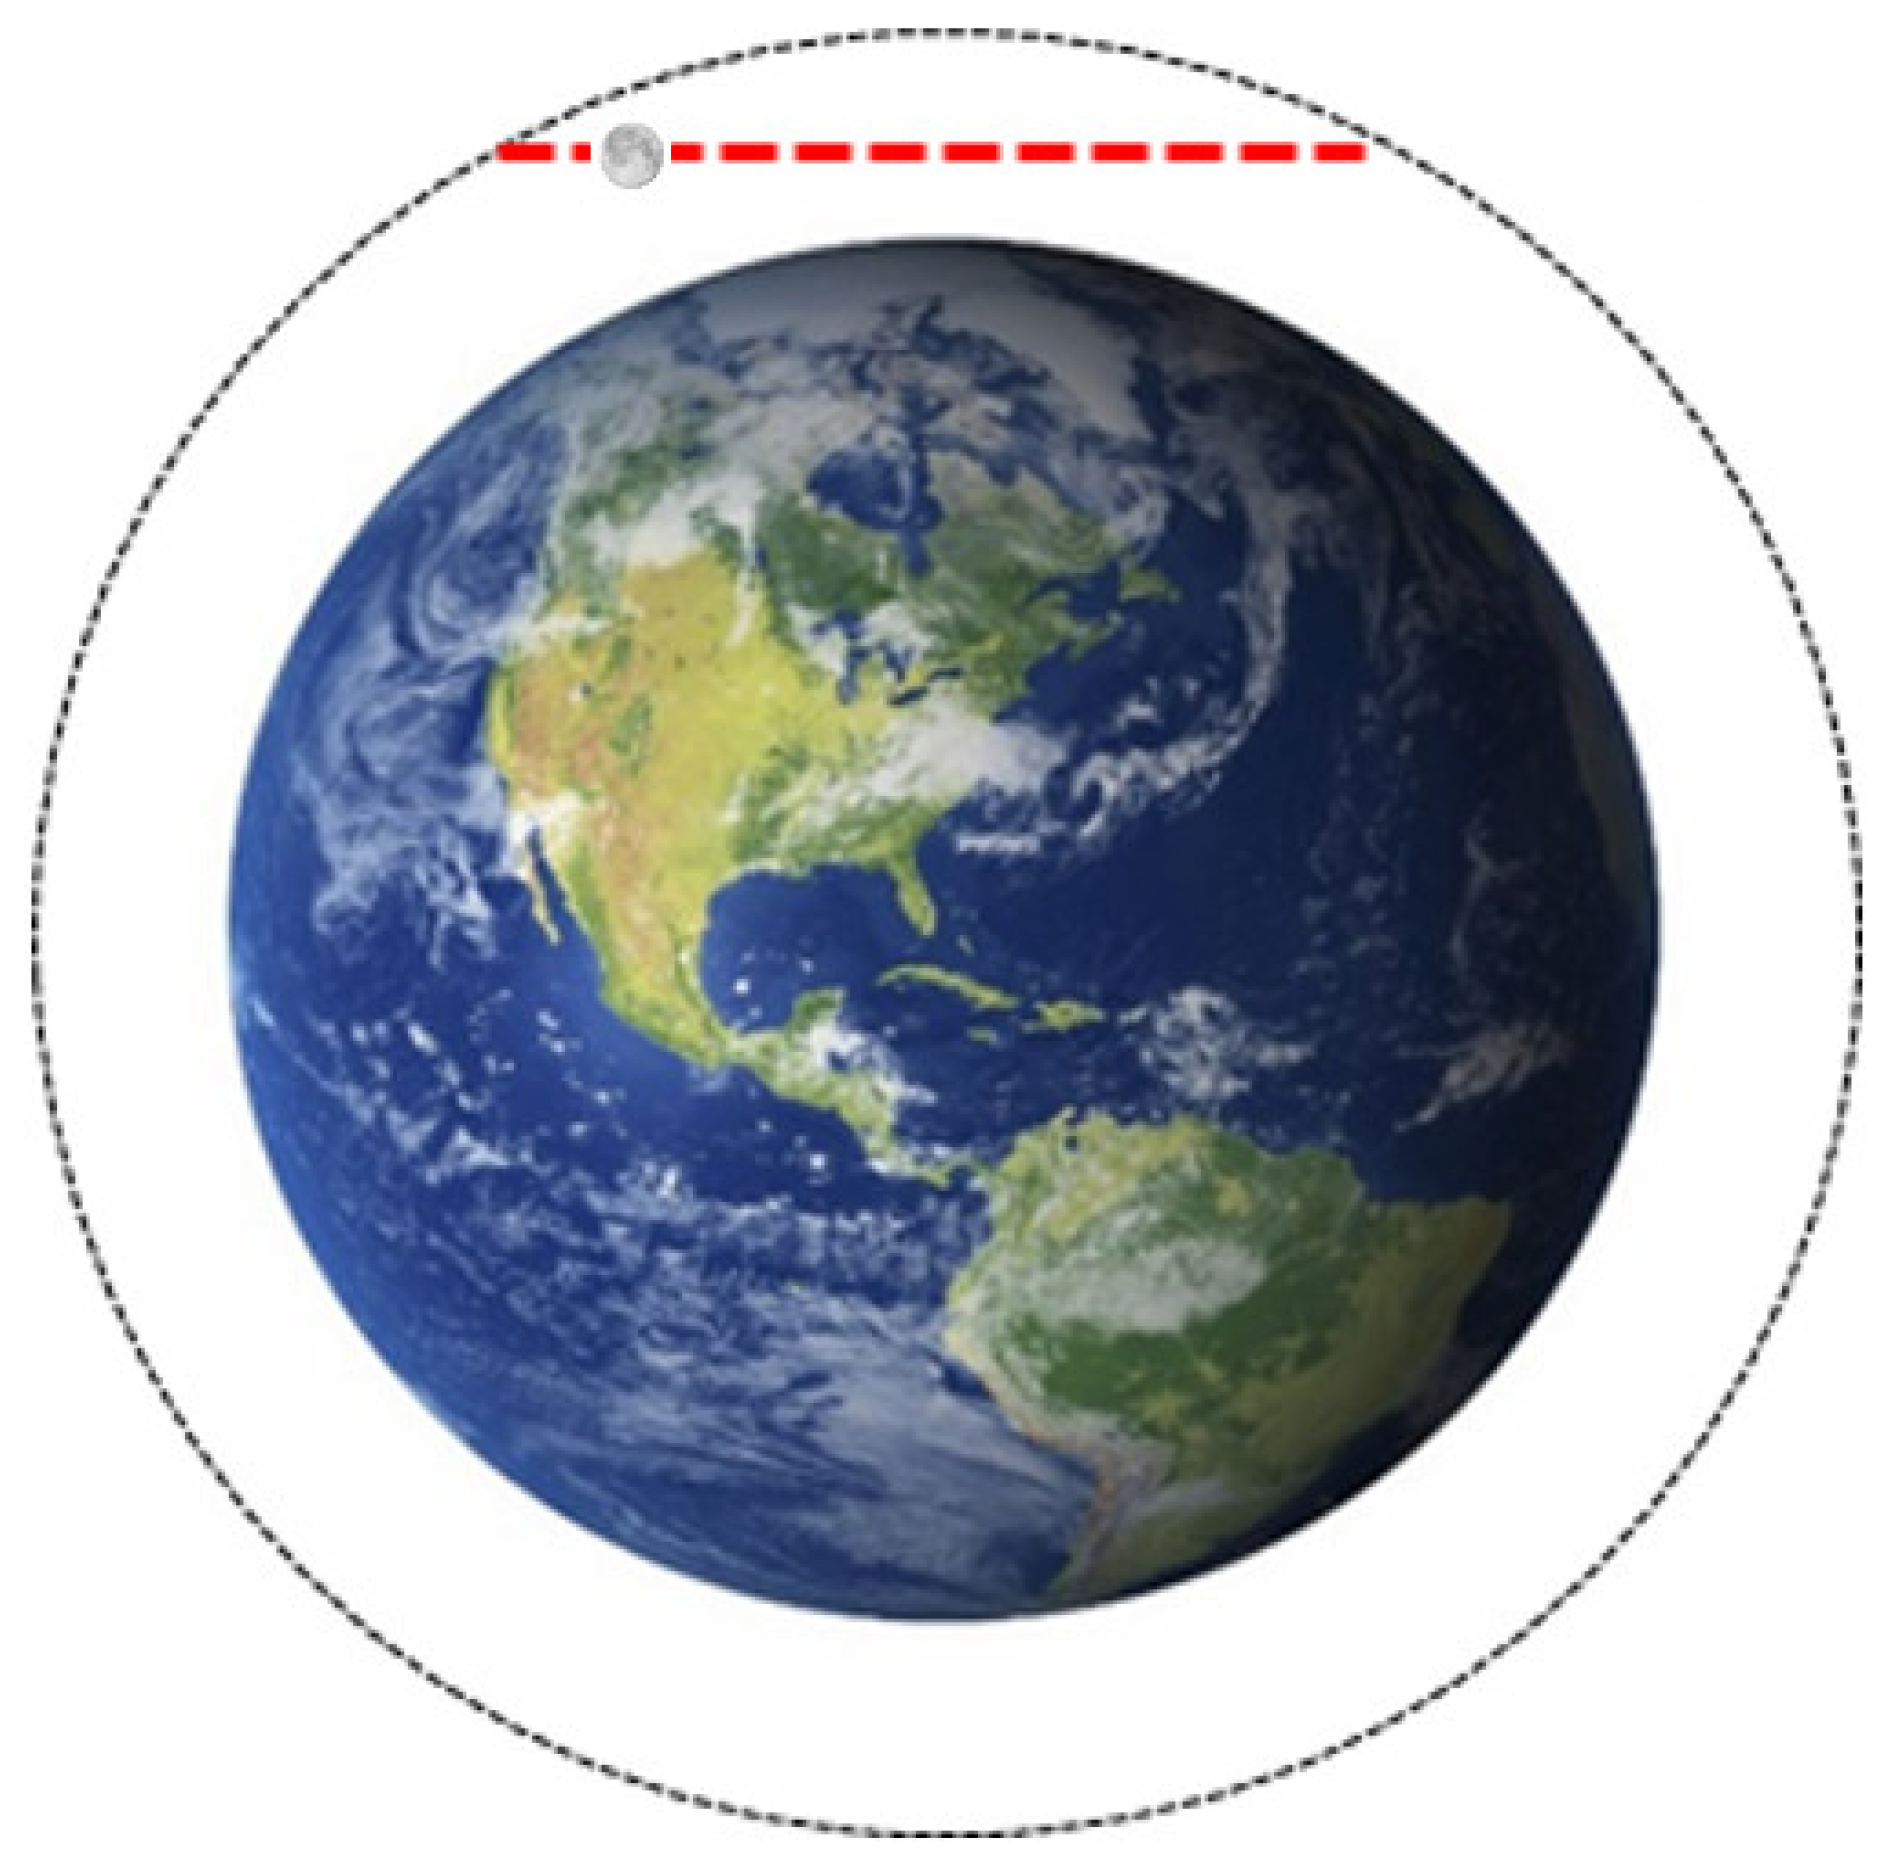
Figure 1. Illustration of ABI FOR (the circle in thin dotted line), with the Earth in the center and the Moon traversing along the red dashed line through part of ABI’s FOR.
Remotesensing 15 01881 g001
Figure 2. ABI field of regard (the outer circle in dashed gray line), Earth (the inner circle in solid black line), and the center locations of the MESO frames (dots with different colors) of the G16 (left) and G17 (right) lunar chasing events within the ABI FOR. G16 lunar chasing events: 11 February 2017 (in red), 12 February 2017 (in brown), 14 February 2017 (in pink), 4 December 2017 (in blue), and 12 July 2017 (in green); G17 lunar chasing events: 30 July 2018 (in red), 28 August 2018 (in brown), 29 August 2018 (in pink), and 20 October 2018 (in blue). Some of the G16 lunar images were not collected on 4 December 2017.
Remotesensing 15 01881 g002
Figure 3. (a) Locations of the G17 spacelook events (in red dots) for the timeline between 20:02 and 20:17 UTC on 30 July 2018. The spacelook positions are located east to the Earth for this timeline. (b) Time series of the NS scan angles for the spacelook scenes of this timeline.
Remotesensing 15 01881 g003
Figure 4. Subset GOES-16 ABI VNIR lunar images collected on 12 April 2017. The subsets are of comparable sizes in angle, with the number of samples in the B02 image about 2 × 2 times of that for B01, B03 and B05 and 4 × 4 times of that for B04 and B06.
Remotesensing 15 01881 g004
Figure 5. Same as Figure 4, with lunar samples (albedo larger than 0.33%) marked as −0.1%.
Remotesensing 15 01881 g005
Figure 6. Lunar irradiance ratio versus the EW scan angles for the G16 VNIR bands.
Remotesensing 15 01881 g006
Figure 7. The EW scan-angle-dependent ABI scan-mirror reflectivity for the six G16 VNIR bands.
Remotesensing 15 01881 g007
Figure 8. The normalized lunar irradiance ratio versus scan angles for G16 VNIR bands. The dashed gray lines are ±0.5% from the mean (in solid gray).
Remotesensing 15 01881 g008
Figure 9. Same as Figure 8, but for G17.
Remotesensing 15 01881 g009
Figure 10. Time series of the mean spacelook (SPLK) values for the G16 VNIR band during the lunar chasing event on 11 February 2017. The vertical dash line is the starting time for each 15 min timeline.
Remotesensing 15 01881 g010
Figure 11. As Figure 10, but for G17 on 30 July 2018.
Remotesensing 15 01881 g011
Figure 12. Time series of the mean SPLK values for the G17 VNIR band during the lunar chasing event on 20 October 2018. The vertical dash line is the starting time for each 15 min timeline. The gray line is refers to the second y-axis for the FPM temperature.
Remotesensing 15 01881 g012
Figure 13. Linear relationship between the SPLK count and the VNIR FPM temperature for G17 on 20 October 2018 using detector #200 as an example. The open circles detected at B01 and B02 are outliers, and the solid circles are used for the final linear regression calculation.
Remotesensing 15 01881 g013
Figure 14. The normalized lunar irradiance ratio versus the scan angle for G16 B01–B03, after the spacelook correction with Equation (8).
Remotesensing 15 01881 g014
Figure 15. The normalized lunar irradiance ratio versus the scan angle for G17 B01–B03. The spacelook count on 30 July 2018 is corrected with Equation (8). The data on 28 August 2018, 29 August 2018, and 20 October 2018 are corrected with Equation (9).
Remotesensing 15 01881 g015
Figure 16. Albedo (%) of the sample from FD Swath #11 collected on 26 July 2018 at 19:15 UTC. The image is subsampled for every four samples in the EW direction.
Remotesensing 15 01881 g016
Figure 17. Change in the delta count with the scan angle for the samples at the northern part of FD Swath #11. Delta count is the count difference between a swath sample and the corresponding spacelook calculated with Equation (2). Each dot is the mean value for the samples from the northern part of Swath #11 (lines #350–636 in Figure 12) at the same EW scan angle (vertical line). Data were collected at 19:15:38 UTC on 26 July 2018.
Remotesensing 15 01881 g017
Figure 18. Dependence of lunar irradiance ratio on EW scan angle for G16. The B01–B03 images are calibrated with the corrected spacelook and the L1alpha image straylight correction.
Remotesensing 15 01881 g018
Figure 19. Same as Figure 18, but for G17.
Remotesensing 15 01881 g019
Table 1. Characteristics of ABI VNIR bands. MCT = Mercury Cadmium Telluride (HgCdTe); Si = Silicone.
Band NameCentral Wavelength (µm)Detector TypeNominal IFOV
(µrad)
# Row# ColumnData Application Examples [3]
EWNS
B010.47Si22.922.96763Daytime aerosol over land, coastal water mapping
B020.64Si12.410.514603Daytime clouds fog, insolation, winds
B030.87Si22.922.96763Daytime vegetation/burn scar, and aerosol over water, winds
B041.38MCT51.5423726Daytime cirrus clouds
B051.61MCT22.922.96766Daytime cloud-top phase and particle size, snow
B062.25MCT51.5423726Daytime land/cloud properties, particle size, vegetation, snow
Table 2. GOES-16 lunar chasing information. The B01 central moon locations are used to represent the EW scan angles.
SatelliteGOES-16
DateDuration (UTC)Phase AnglesNS Scan AnglesEW Scan AnglesNo. of Nonclipped Images FPM Temp. Change
11 February 201718:19–19:17+9.1°–+10.8°+9.5°–+9.4°−6.5°–+4.7°1100.1 K
12 February 201718:54–19:04+21.0°–+21.4°+5.9°–+5.9°−10.1°–−9.0°13<0.1 K
20:12–20:22+23.4°–+23.8°+5.7 °–+5.7°+7.3°–+7.6°16
14 February 201720:20–20:27+44.9°–+45.1°−1.7°–−1.7°−10.5°–−11.7°11<0.1K
21:52–22:00+47.6°–+47.9°−1.9°–−1.9°+8.2°–+10.8°26
12 April 201718:57–19:38+17.0°–+18.7°−9.5°–−9.4°−3.6°–+5.0°57<0.1 K
12 July 201720:32–21:16+41.5°–+42.8°−10.2°–10.1°−5.1°–+3.6°43 *<0.1 K
* The MESOs at one-minute interval were used for lunar image collection on 12 July 2017.
Table 3. GOES-17 lunar chasing information.
SatelliteGOES-17
DateDuration (UTC)Phase Angle RangeNS Scan AnglesEW Scan AnglesNo. of Nonclipped ImagesFPM Temp. Change
30 July 201819:50–20:45+32.3°–+33.9°−9.6°–−9.4°−6.5°–+5.3°1120.1 K
28 August 201818:53–19:01+25.0°–+25.3°−3.2°–−3.1°−10.1°–−11.7°150.4 K
20:21–20:28+27.7°–+28.0 °−2.9°–−2.9°+7.7°–+9.3°14
29 August 201819:37–19:42+36.6 °–+36.9°+1.0°–1.0°−11.8°–−10.5°110.5 K
21:07–21:16+39.5°–+39.7°+1.3°–+1.3°+8.1°–+8.5°7
20 October 201814:27–15:15−48.1°–−46.7°−10.0°–−9.8°−3.3°–+6.4°91K
Table 4. Linear-fitting coefficients, root mean square error (RMSE), F-test value for the goodness-of-fit test, error probability, and EW RVS variation with scan angle ranging from −8.7° to +8.7° for G16 and G17.
SatelliteCoefficientsB01B02B03B04B05B06
G16offset1.000041.000111.000140.999981.000031.00003
slope−2.44 × 10⁻⁵−8.80 × 10⁻⁵−7.37 × 10−51.75 × 10−57.79 × 10−51.33 × 10−4
RMSE8.91 × 10−45.39 × 10−44.77 × 10−41.17 × 10−31.31 × 10−31.14 × 10⁻³
F-test5.60199.30178.191.5724.8895.40
Error Prob.0.020.000.000.210.000.00
EW RVS Variation (%)−0.04−0.15−0.130.030.140.23
G17offset0.999981.000000.999981.000011.000011.00008
slope−7.58 × 10⁻⁵−1.32 × 10⁻⁴−6.98 × 10−51.12 × 10−43.31 × 10−51.69 × 10−4
RMSE1.39 × 10−35.04 × 10−48.98 × 10−41.64 × 10−31.30 × 1031.14 × 10−3
F-test19.43388.5037.0933.454.65160.41
Error Prob.0.000.000.000.030.030.00
EW RVS Variation (%)−0.13−0.23−0.120.200.060.29
Disclaimer/Publisher’s Note: The statements, opinions and data contained in all publications are solely those of the individual author(s) and contributor(s) and not of MDPI and/or the editor(s). MDPI and/or the editor(s) disclaim responsibility for any injury to people or property resulting from any ideas, methods, instructions or products referred to in the content.