1. Introduction
Since narrowband ultrasonic sensors require lower voltages and are more cost-effective overall, they can be used to develop wearable sensors for motion tracking analysis [
1,
2]. The next generation of automobile lane control systems for lateral and longitudinal controls emphasizes Doppler sensing and range [
3]. Future generations of automobiles will have lane control systems that depend heavily on the sensing and range provided by Doppler [
4] for lateral and longitudinal controls. The Doppler shift impact is four times greater in a vehicle-to-vehicle (V2V) communication scenario than in a cellular connection scenario with the same velocity; this happens due to the relative velocities of the transmitter and receiver. The sub-carrier orthogonality and link performance of an orthogonal frequency-division multiplexing (OFDM) system is susceptible to severe intercarrier interference (ICI) caused by the significant Doppler shift at high vehicle speeds, and this significantly increases the mistake rate (BER). As a result, a thorough investigation into Doppler shift estimating (DSE) in high-dynamic V2V communication settings is necessary [
5].
Non-data-aided approaches for high-dynamic vehicular communication scenarios are proposed in [
6,
7], such as a matching chase algorithm based on compressed sensing techniques and a predictive sensor-based Doppler shift compensation method with tracking capabilities limited by the produced dictionary, sensing information, and computational complexity [
8]. These two methods are examples of non-data-aided approaches for high-dynamic vehicular communication scenarios.
Most research on the Doppler Effect on ultrasonic sensors focused on identifying uncommon medical symptoms [
9,
10]. Finding the highest frequency in the Doppler spectrum that can be distinguished from noise is frequently used to determine the peak velocity. The chosen frequency is then converted to velocity using the Doppler equation. The frequency choice, which depends on noise and is vulnerable to spectral broadening, is impacted by the uncertainty of the Doppler angle. The vector Doppler technique clarifies the angle ambiguity by applying the threshold to the Doppler spectra collected from two directions. However, this method is noise sensitive [
11], requires vast amounts of data to estimate, and cannot identify the azimuthal angle of the number of objects under a single beam. Additionally, it uses the Doppler shift techniques of pulse repetition frequency, Doppler spectrum method, vector method, and spatial interpolation methods to analyze an object’s velocity [
12,
13,
14,
15,
16,
17]. Most of the research comprises these two kinds of investigations: speech signal processing [
18,
19] and Internet of Things device control [
20] research updates.
The Doppler shift method detects the velocity of fluids at high temperatures, corrosive soils, and hazardous fumes. It also offers the advantages of a quick dynamic response, high spatial resolution, and a wide measurement range. In contrast to the above research, there has not been any research on calculating the azimuth angles of objects using the Doppler Effect.
This research describes a method for using the Doppler Effect to estimate the angle of objects detected by an ultrasonic sensor mounted on a moving vehicle. In this case, the ultrasonic sensor emits a continuous wave of ultrasound, which is reflected off objects in its path. The receiver collects the reflected signal, and the Doppler shift in frequency caused by the movement of the objects relative to the sensor is recorded using a Data Acquisition system (DAQ). By applying the Fast Fourier Transform (FFT) to the recorded signal, the data is transformed into the frequency domain, allowing for the estimation of the azimuthal angle of the objects. The azimuthal angle is the angle between the sensor’s line of sight and the object being detected. The recorded Doppler frequency peak is proportional to the number of objects within the ultrasonic sensor’s beam. The Doppler Effect is a wave’s frequency change when the source or observer moves relative to the other. This proposed method is validated by comparing the recorded Doppler shift to the expected Doppler shift caused by an object at a known angle. The actual angle of the detected objects is then estimated and compared, and the result is validated by comparing it to the actual angle of the objects. However, this research can be helpful in automotive applications where it is necessary to detect the angle of objects in the path of a moving vehicle, such as for collision avoidance systems.
The following outline illustrates the research that focuses on an ultrasonic sensor mounted on a moving car and its ability to estimate the azimuthal angle of objects using the Doppler frequency shift. It is divided into four sections:
Section 1 provides a theoretical background on the sensor and its construction,
Section 3 discusses the proposed method and its validation, and
Section 4 summarizes the outcomes and conclusions of the research.
2. Introduction to Doppler Shift and Sensors
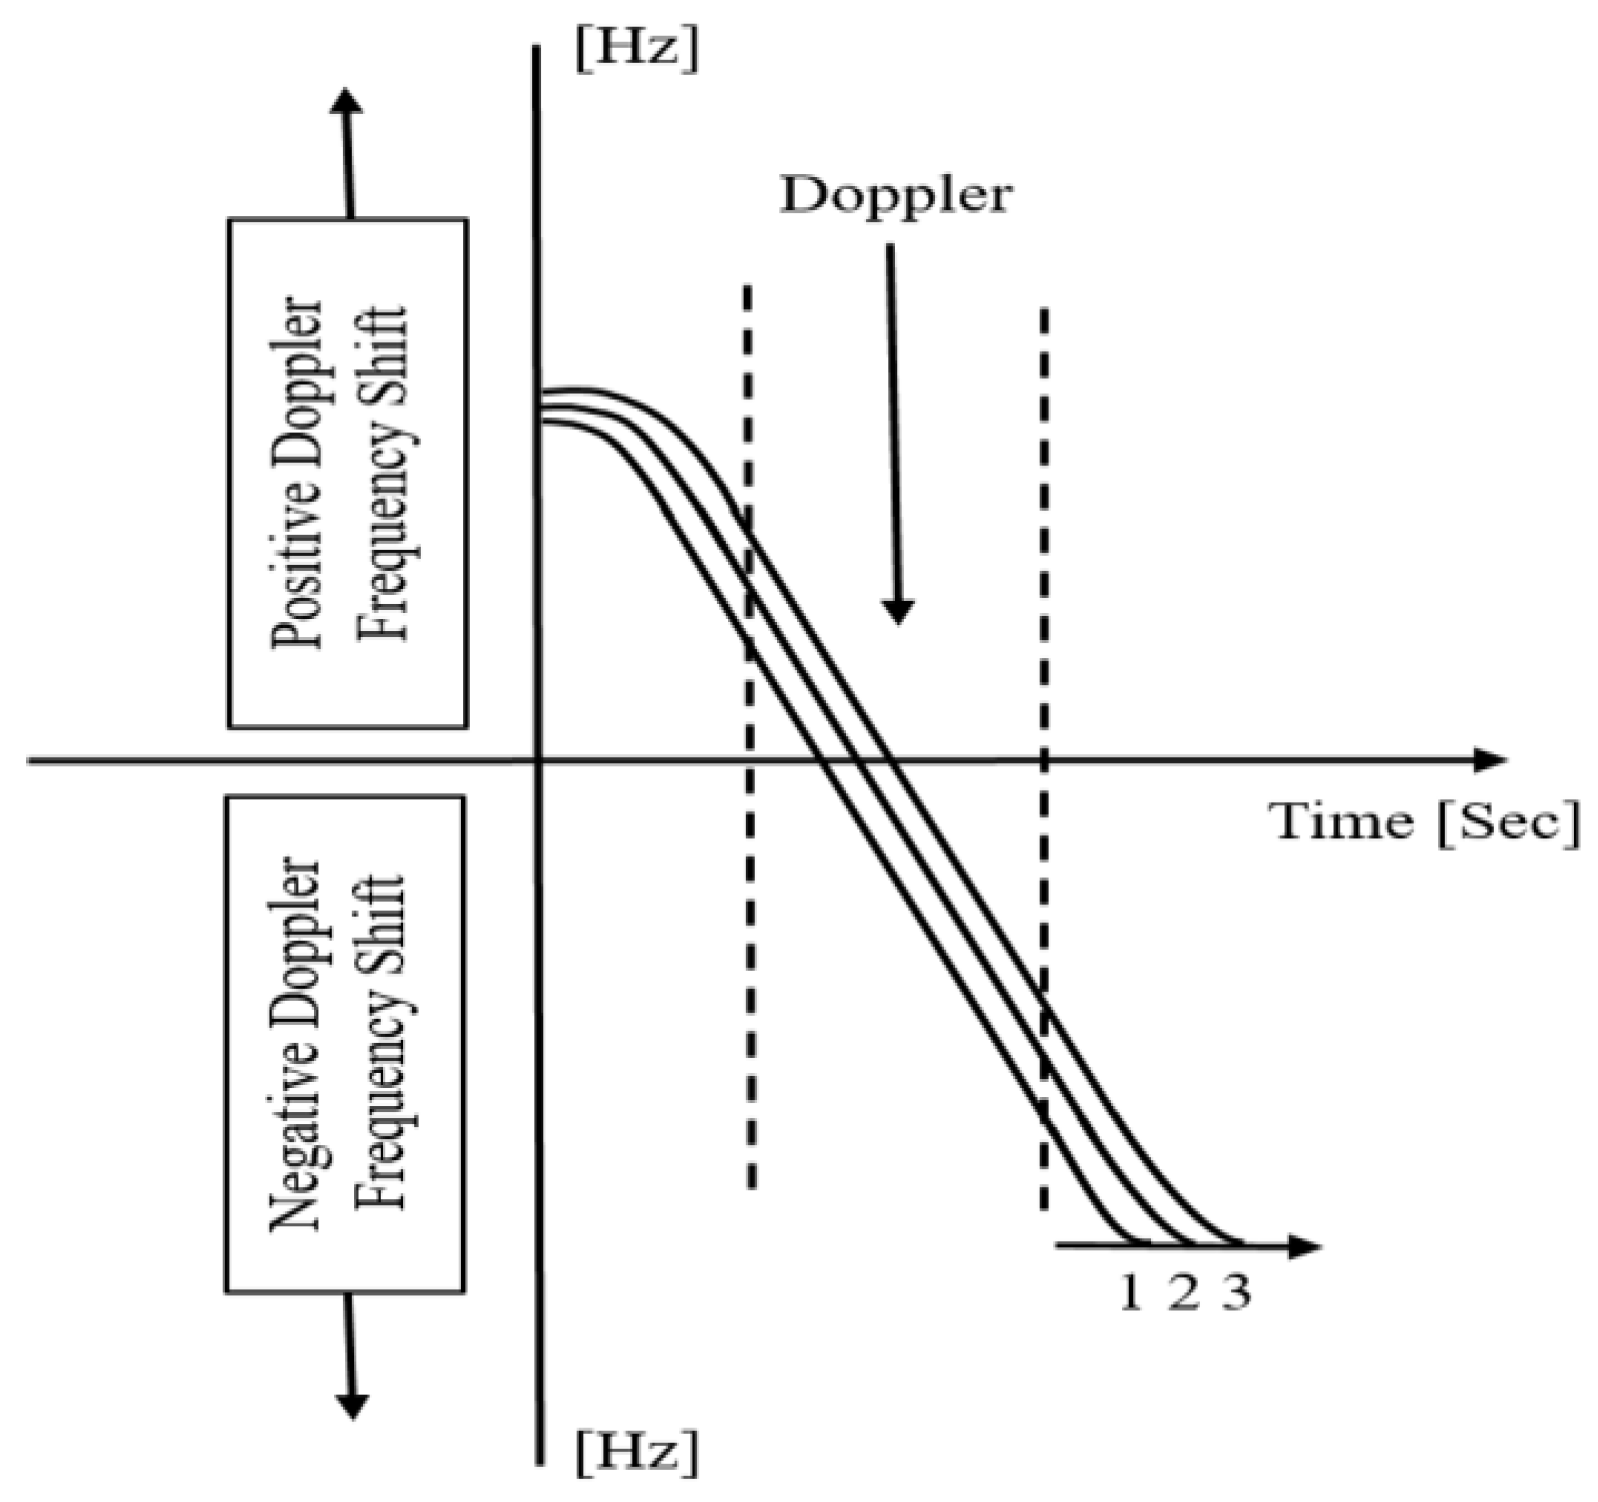
When the source and the wave are moving relative to one another, there is a change in frequency known as the Doppler Effect or Doppler shift. The shift in pitch that occurs when a vehicle’s horn approaches or recedes from the observer is a typical illustration of the Doppler Effect, as seen in
Figure 1. Any wave, such as light, a wave, or a wave in water, will exhibit the Doppler Effect. Most of the time, we encounter the Doppler Effect of sound in our daily lives. Doppler Effect is used in several scientific domains in the modern scientific world. The ADAS comprises various sensors whose primary function is to improve the safety of passengers and the vehicle, which justifies the development of Autonomous Vehicles (A V).
Autonomous vehicle localization involves different sensors, including vision sensors (cameras), LIDAR, RADAR, ultrasonic sensors, GPS/GNN, and more. Advanced Driver Assistance Systems (ADAS) rely on various sensors to function correctly, but these sensors can experience malfunctions that cause them to fail. For example, cameras can be affected by lens occlusion, environmental conditions, or faults in the optics. Incorrect data readings, electrical issues, or optical misalignment can cause LIDAR failures. RADAR failures can occur due to cyberattacks or environmental factors. GPS/GNN faults can happen due to issues with the receiver, clock, or satellite broadcast anomalies.
Ultrasonic sensors are used in ADAS for various purposes, such as parking assistance, blind spot detection, collision avoidance, and adaptive cruise control. These sensors detect objects near the vehicle and provide feedback to the driver through audible or visual warnings, alert the driver if there is a risk of collision, and help maintain a safe distance from the vehicle in front. Ultrasonic sensors are crucial in providing drivers with additional information about their surroundings and reducing the risk of accidents.
Each new wave is released from a location closer to the observer as the source moves toward the observer. Even if the velocity is constant, the waves appear to be grouped, resulting in a shortened time between successive wave crests arriving at the observer. This shortening of the wavelength increases the frequency. As the source moves away from the observer, the waves it emits have a longer wavelength and a lower frequency because they are emitted from progressively farther locations.
The conventional approach could only determine the object’s distance since the target was recognized as a single object within a beam.
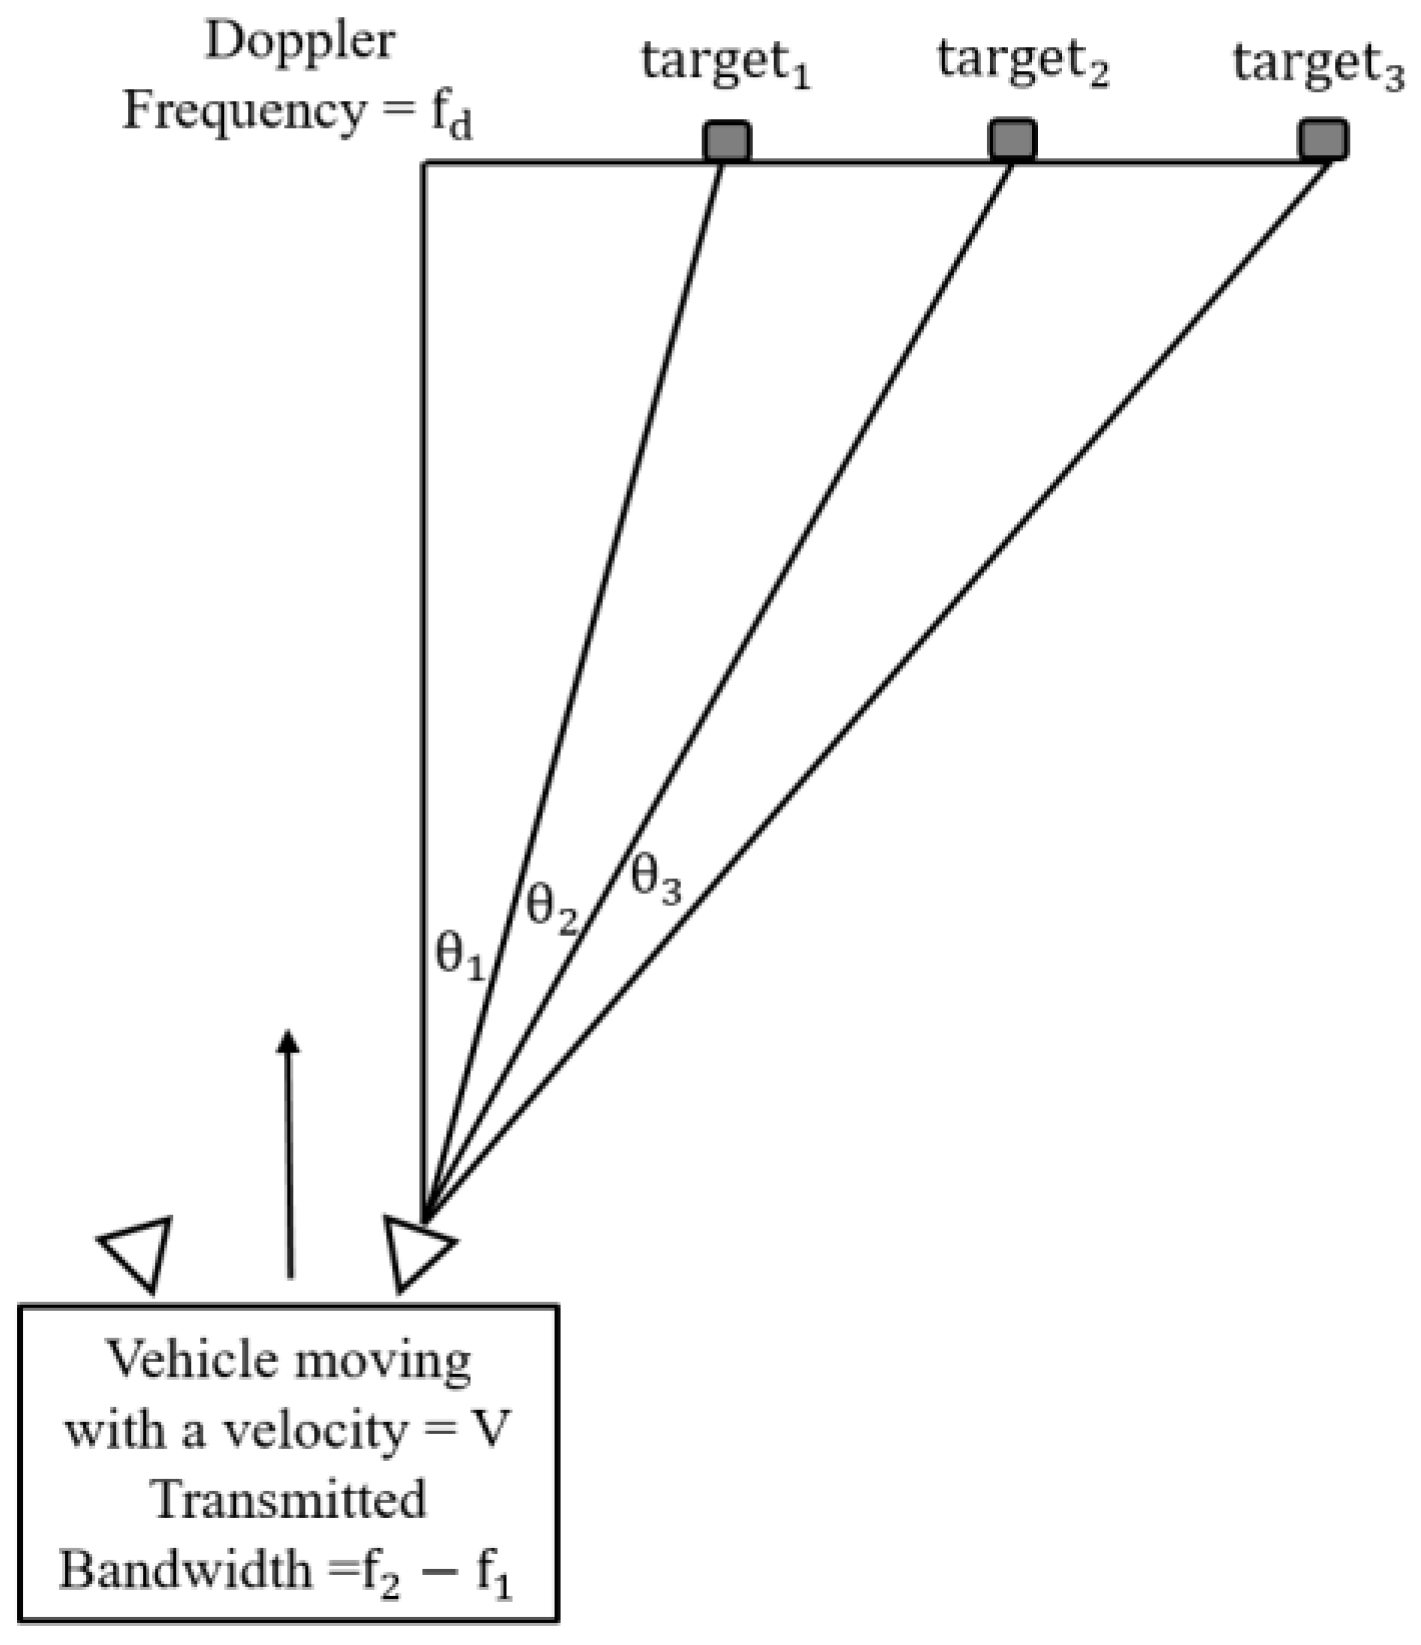
Figure 2 illustrates how the proposed method resolves the target in this study using the Doppler Effect, even with a small angle difference between the objects.
Figure 2 displays different objects under a single ultrasonic beam, corresponding to the detected peaks and their respective velocities of the objects. For a very long time, ultrasonic sensors have been used for object detection and distance measuring.
An ultrasonic sensor is a technology that uses ultrasonic sound waves to gauge the separation between two objects and then turns the sound’s reflection into an electrical signal. Ultrasonic waves are sound waves with a frequency higher than the upper limit of human hearing (typically above 20,000 Hz). Compared to regular audible sound waves, ultrasonic waves have shorter wavelengths and higher frequencies, which enable them to travel faster through a medium such as air or water. Sound speed depends on the medium’s properties, including density and elasticity. The denser and more elastic the medium, the faster sound waves can travel. Since ultrasonic waves have higher frequencies and shorter wavelengths than regular sound waves, they can travel faster through a medium with the same density and elasticity.
The two main parts of ultrasonic sensors are the transmitter and the receiver, which produce sound using piezoelectric crystals (which encounter the sound after it has traveled to and from the target). The ultrasonic wave’s wavelength is calculated by dividing its frequency by its propagation rate. It is also affordable and unaffected by the color or lighting of an object. Due to their capabilities and the fact that they can be produced in various ways, ultrasonic sensors are finding new applications as the market for self-driving robots, vehicles, and other related technology expands.
Table 1 lists various types of sensors categorized based on the factors that affect their stability. Although sensors have a range of applications in diverse industrial settings, ultrasonic sensors have limited angular resolution due to the principal lobe of their wide beam. This study proposed a Doppler Effect-based ultrasonic sensor to address the ultrasonic sensor’s angular resolution limitation.
This affordable solution can accurately determine the location of an object, providing better angular resolution. The suggested technique for estimating and acquiring azimuthal angles using the Doppler shift is beneficial in cases where the object cannot be resolved within the beam of an ultrasonic sensor. Overall, understanding the characteristics of different sensor types can help to determine the most appropriate sensor for a given application.
3. Experiment and Measurements
3.1. Velocity Estimation of an Automobile
Table 2 compares the advantages, disadvantages, and factors affecting the performance of different speed-measuring devices. The speedometer provides accurate speed readings but can be affected by tire size and wear and tear. The radar gun also provides accurate readings but can be affected by weather conditions. GPS speed has limitations in tracking systems, such as signal loss or lag issues, as well as potential controversies and errors associated with speed cameras. Additionally, the table mentions how Doppler radar can accurately measure speed but may also be impacted by weather conditions. Overall, this text highlights the monotony or lack of variety in the limitations of these devices. Proposed LIDAR methods provide highly accurate speed readings but can be expensive and require skilled operators. Performance factors include calibration, maintenance, operator skill, target size, distance, weather conditions, and vehicle design or modifications.
Using Doppler frequency shift, the estimated velocity of the vehicle was validated and compared as follows: for this experiment, we are using the DAQ (Data Acquisition) USB X series 6361 system, a multifunction input and output device with the following specifications: 24 digital inputs out, 16 AI (16-Bit, 2 MS/s), and 2 analog output (2.86 MS/s). Multifunctional USB I/O Device—the USB-6361 has digital I/O, 4 32-bit counters/timers, and analog I/O for PWM, encoder, frequency, and event counting applications, among others. Advanced timing capabilities are supplied by the onboard NISTC3 timing and synchronization technology, including distinct analog and digital timing engines and retrigger-able measurement workloads. The USB-6361 is suitable for various functions, including basic data recording, control, and test automation. The included NI-DAQmx driver and setup software makes measurements and configurations simpler.
In velocity estimation, the measurement circuit consists of an ultrasonic sensor (V40AW14B) at an operating frequency of 40k Hz with a transmitting sensitivity of 100 dB min and typical directivity of
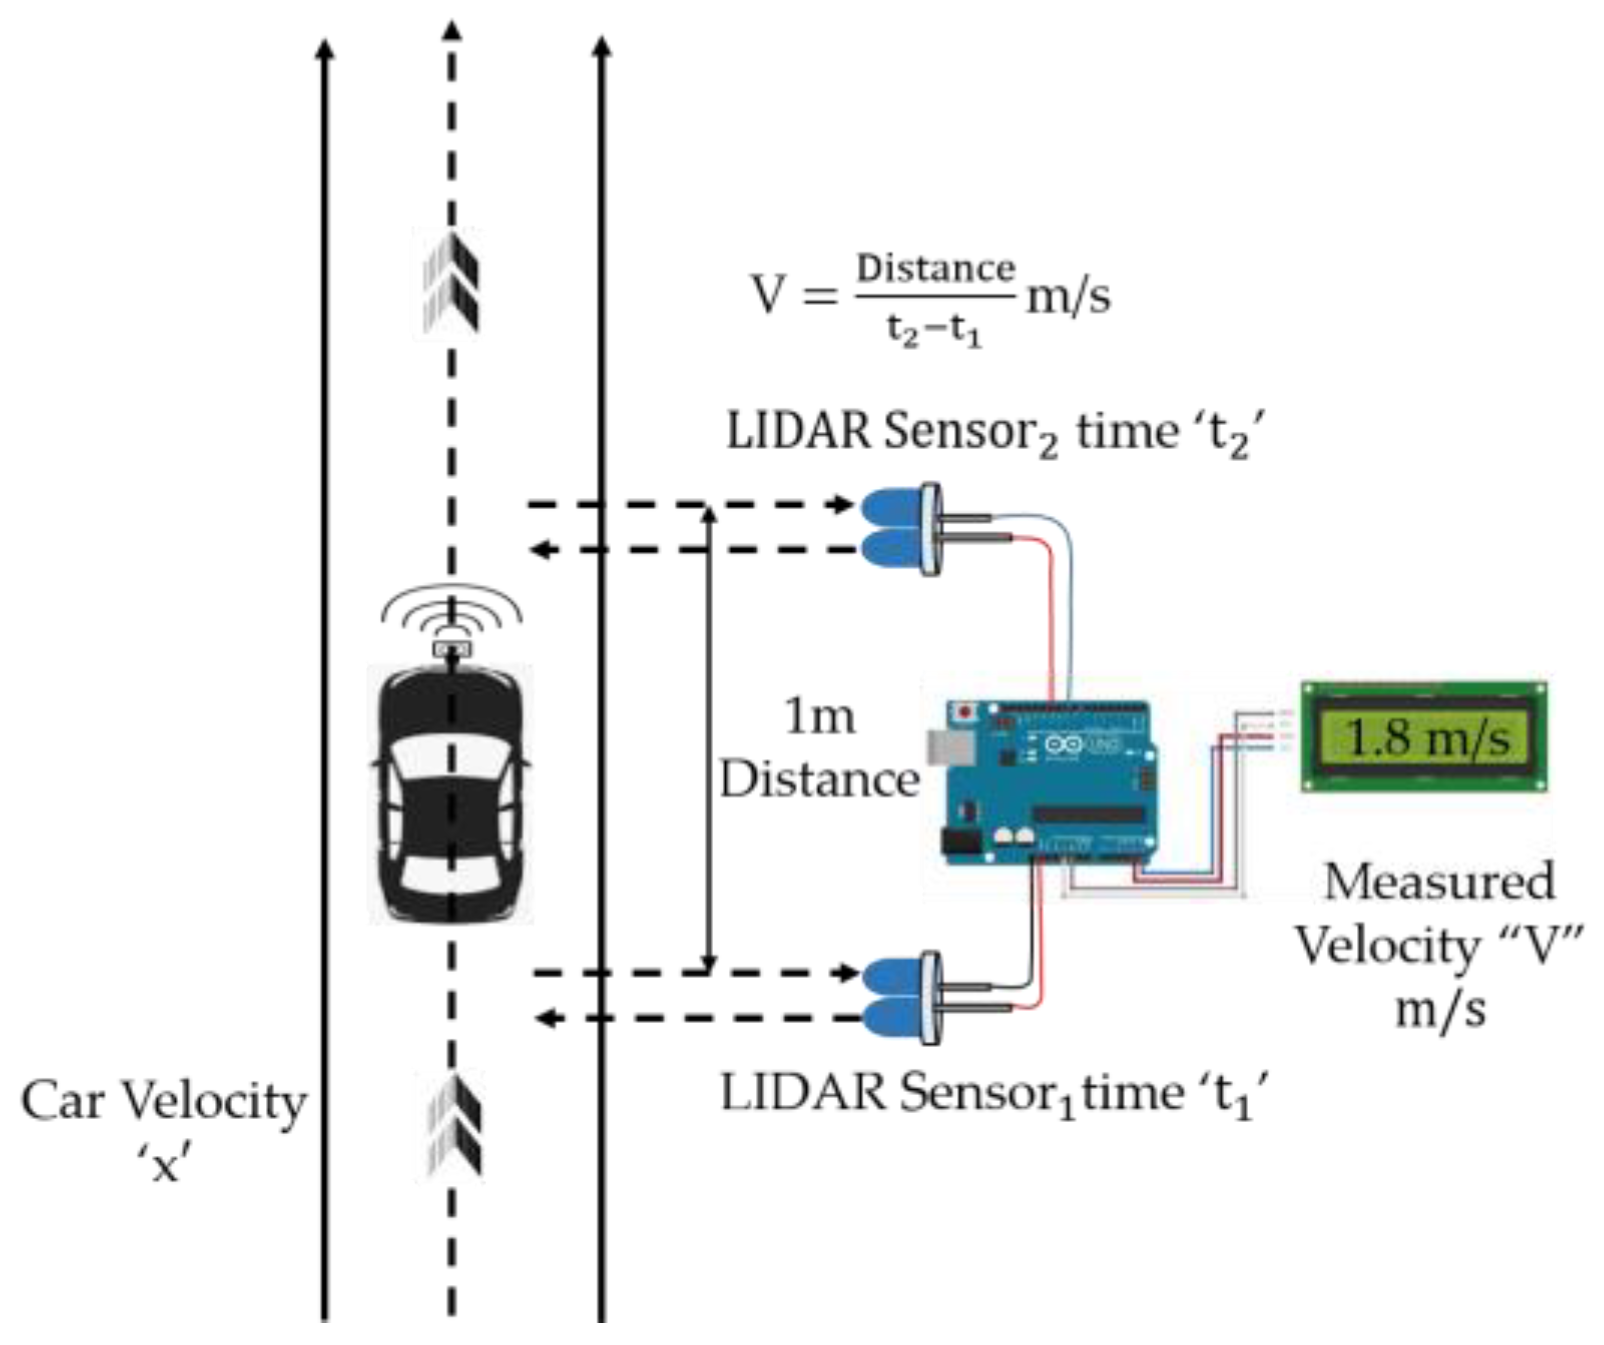
. As the vehicles travel, the car’s velocity is measured using LIDAR sensors and a microcontroller. The obtained values are tabulated by the device that measures velocity. The Arduino microcontroller interfaced with 2 LIDAR sensors placed 1 m apart from each other as the car passes through the 2 LIDAR sensors, time
and
are noted down, and velocity is calculated using Equation (1):
The DAQ Express 2021 generates a 40k Hz sinusoidal signal with 5V peak-peak and sends it to the ultrasonic sensor. The signal reflected from the objects was acquired in the time domain by the DAQ. The received signal is then transformed into the frequency domain using the Fourier transform. Doppler Effect is the acoustic effect discovered by the German scientist Doppler in the 19th century. When there is relative motion between the sound source and the receiver, the frequency that the receiver hears differs from the frequency that the sound source emits. This frequency difference is called the Doppler frequency shift Equation (2).
where
,
T = Temperature in degree Celsius,
= Transmitted frequency 40k Hz,
= Doppler shift in kHz,
= Velocity of the receiver and a positive value indicates the receiver is moving toward the source, and
= Velocity of the source and a positive value indicates the source moving away from the observer.
LM35 temperature sensor thermal indicator is used to measure temperature while conducting the experiments and noted. The method of calculating velocity is explained first. When velocity is calculated using Equation (3), the three parameters,
must be obtained in advance. In Equation (3), these parameters are functions of vehicle velocity,
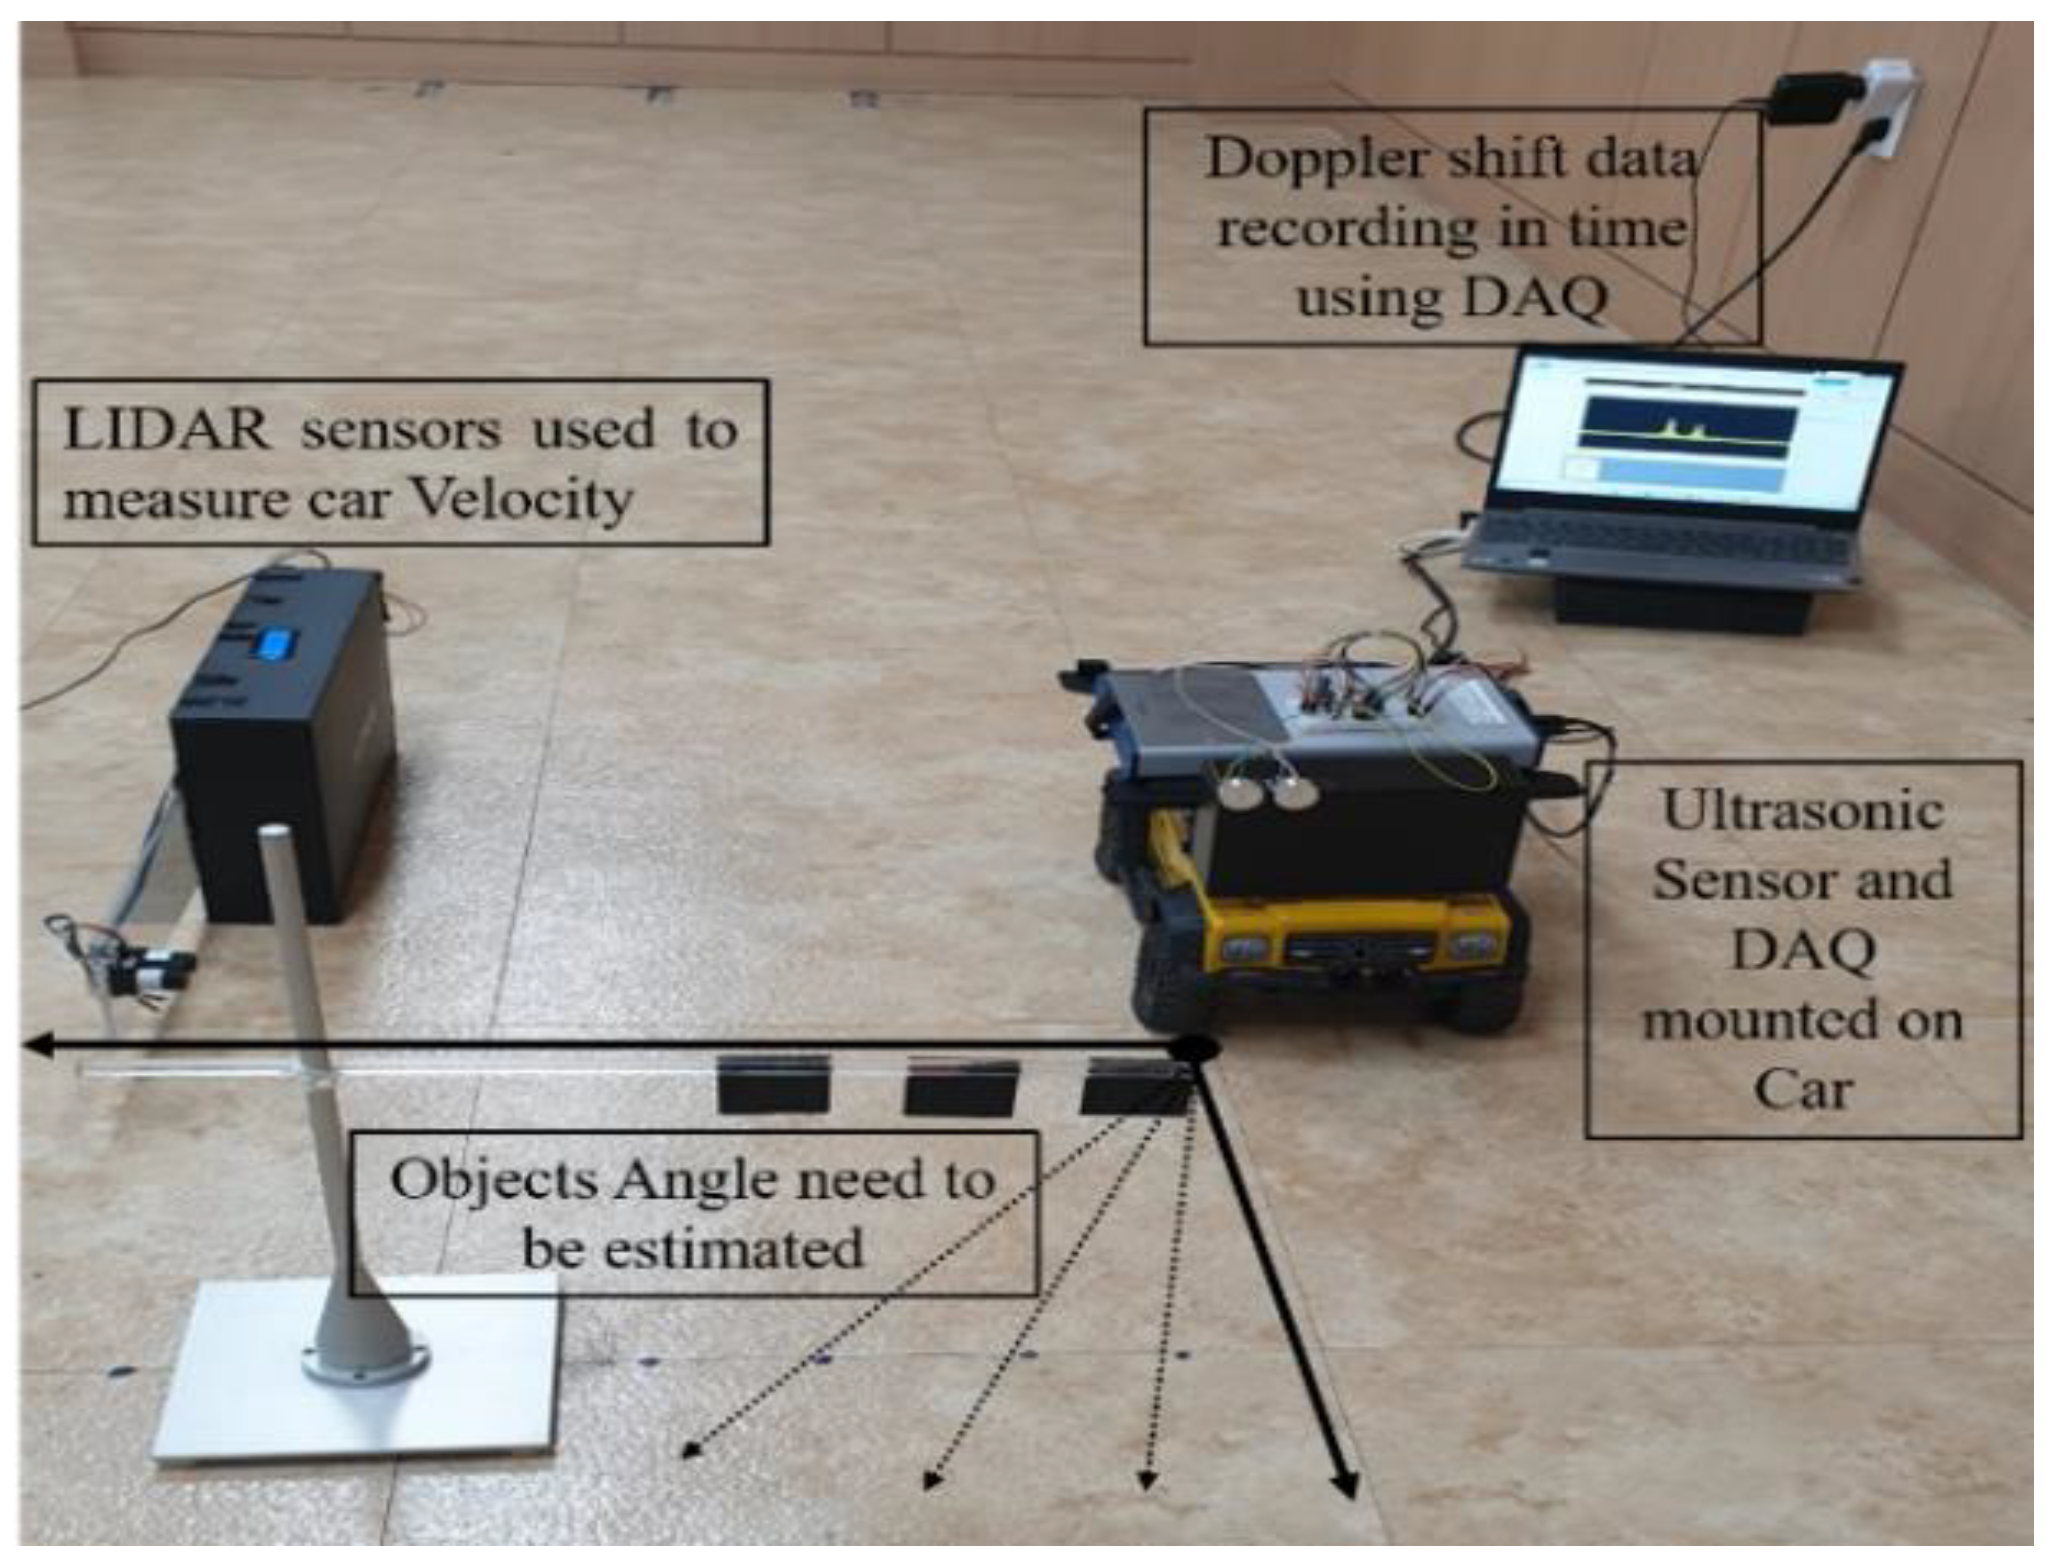
to calculate. Therefore, obtaining a relationship between these parameters in advance is necessary. The experiments are carried out as seen in
Figure 3, and
Table 3 lists the measured velocity and the calculated velocity value derived from the Doppler shift, obtained using Equation (3).
Table 3 offers convincing evidence that the measured and estimated vehicle velocities derived using the Doppler shift are identical. It is also suggested that this methodology can be employed by vehicles equipped with ultrasonic sensors to determine the azimuthal angle of objects.
3.2. Estimation of Azimuthal Angle Using Doppler Frequency Shift
This research examines the frequency shift of the ultrasonic sensor due to the Doppler Effect, which is mounted on a moving vehicle and describes a new calculation method for obtaining the azimuthal angle through the Doppler Effect with a high degree of accuracy. With a Fraunhofer distance of several millimeters, ultrasound transmissions are much smaller than regular audio signals. As a result, they meet the far-field criteria that enable plane wave approximation distant from the observer ( = system size, = ultrasonic wavelength).
The total phase shift in the transmission/reception bidirectional propagation channel is an equation when the distance to the target and the wavelength of the transmitted ultrasonic wave is given as Equation (4).
Equation (4) illustrates how the phase changes when the target moves concerning the observer, and the distance between them varies. Differentiating Equation (4) with respect to time, the phase change rate concerning time or angular frequency can be determined using (5), in which
represents the radial velocity given by
The Doppler frequency shit is given by
In this research, the object which needs to find the azimuthal angle is fixed, and the sensors are mounted on the car, which is subjected to move with respect to the object, as shown in
Figure 2 and represents the two-dimensional space as follows:
Equation (8) provides more evidence that the azimuth can be estimated by observing the Doppler frequency shift of the ultrasonic sensor, ambient temperature, transmitted frequency, and velocity.
where
is the velocity of the waves in the medium, and the Doppler frequency changes the speed of sound propagating in the air equal to (331 + 0.6 T).
Figure 2 and
Figure 3 demonstrate the complete setup of the proposed principle in estimating angular Doppler frequency when two objects are in one beam. The ultrasonic sensor is mounted to a vehicle transmitting ultrasound, and the objects are stationary. The car is moving at a speed of
the Doppler frequency of
is shifted by
, and similarly, the Doppler frequency of
is shifted by
. The angular is calculated using Equation (8), respectively.
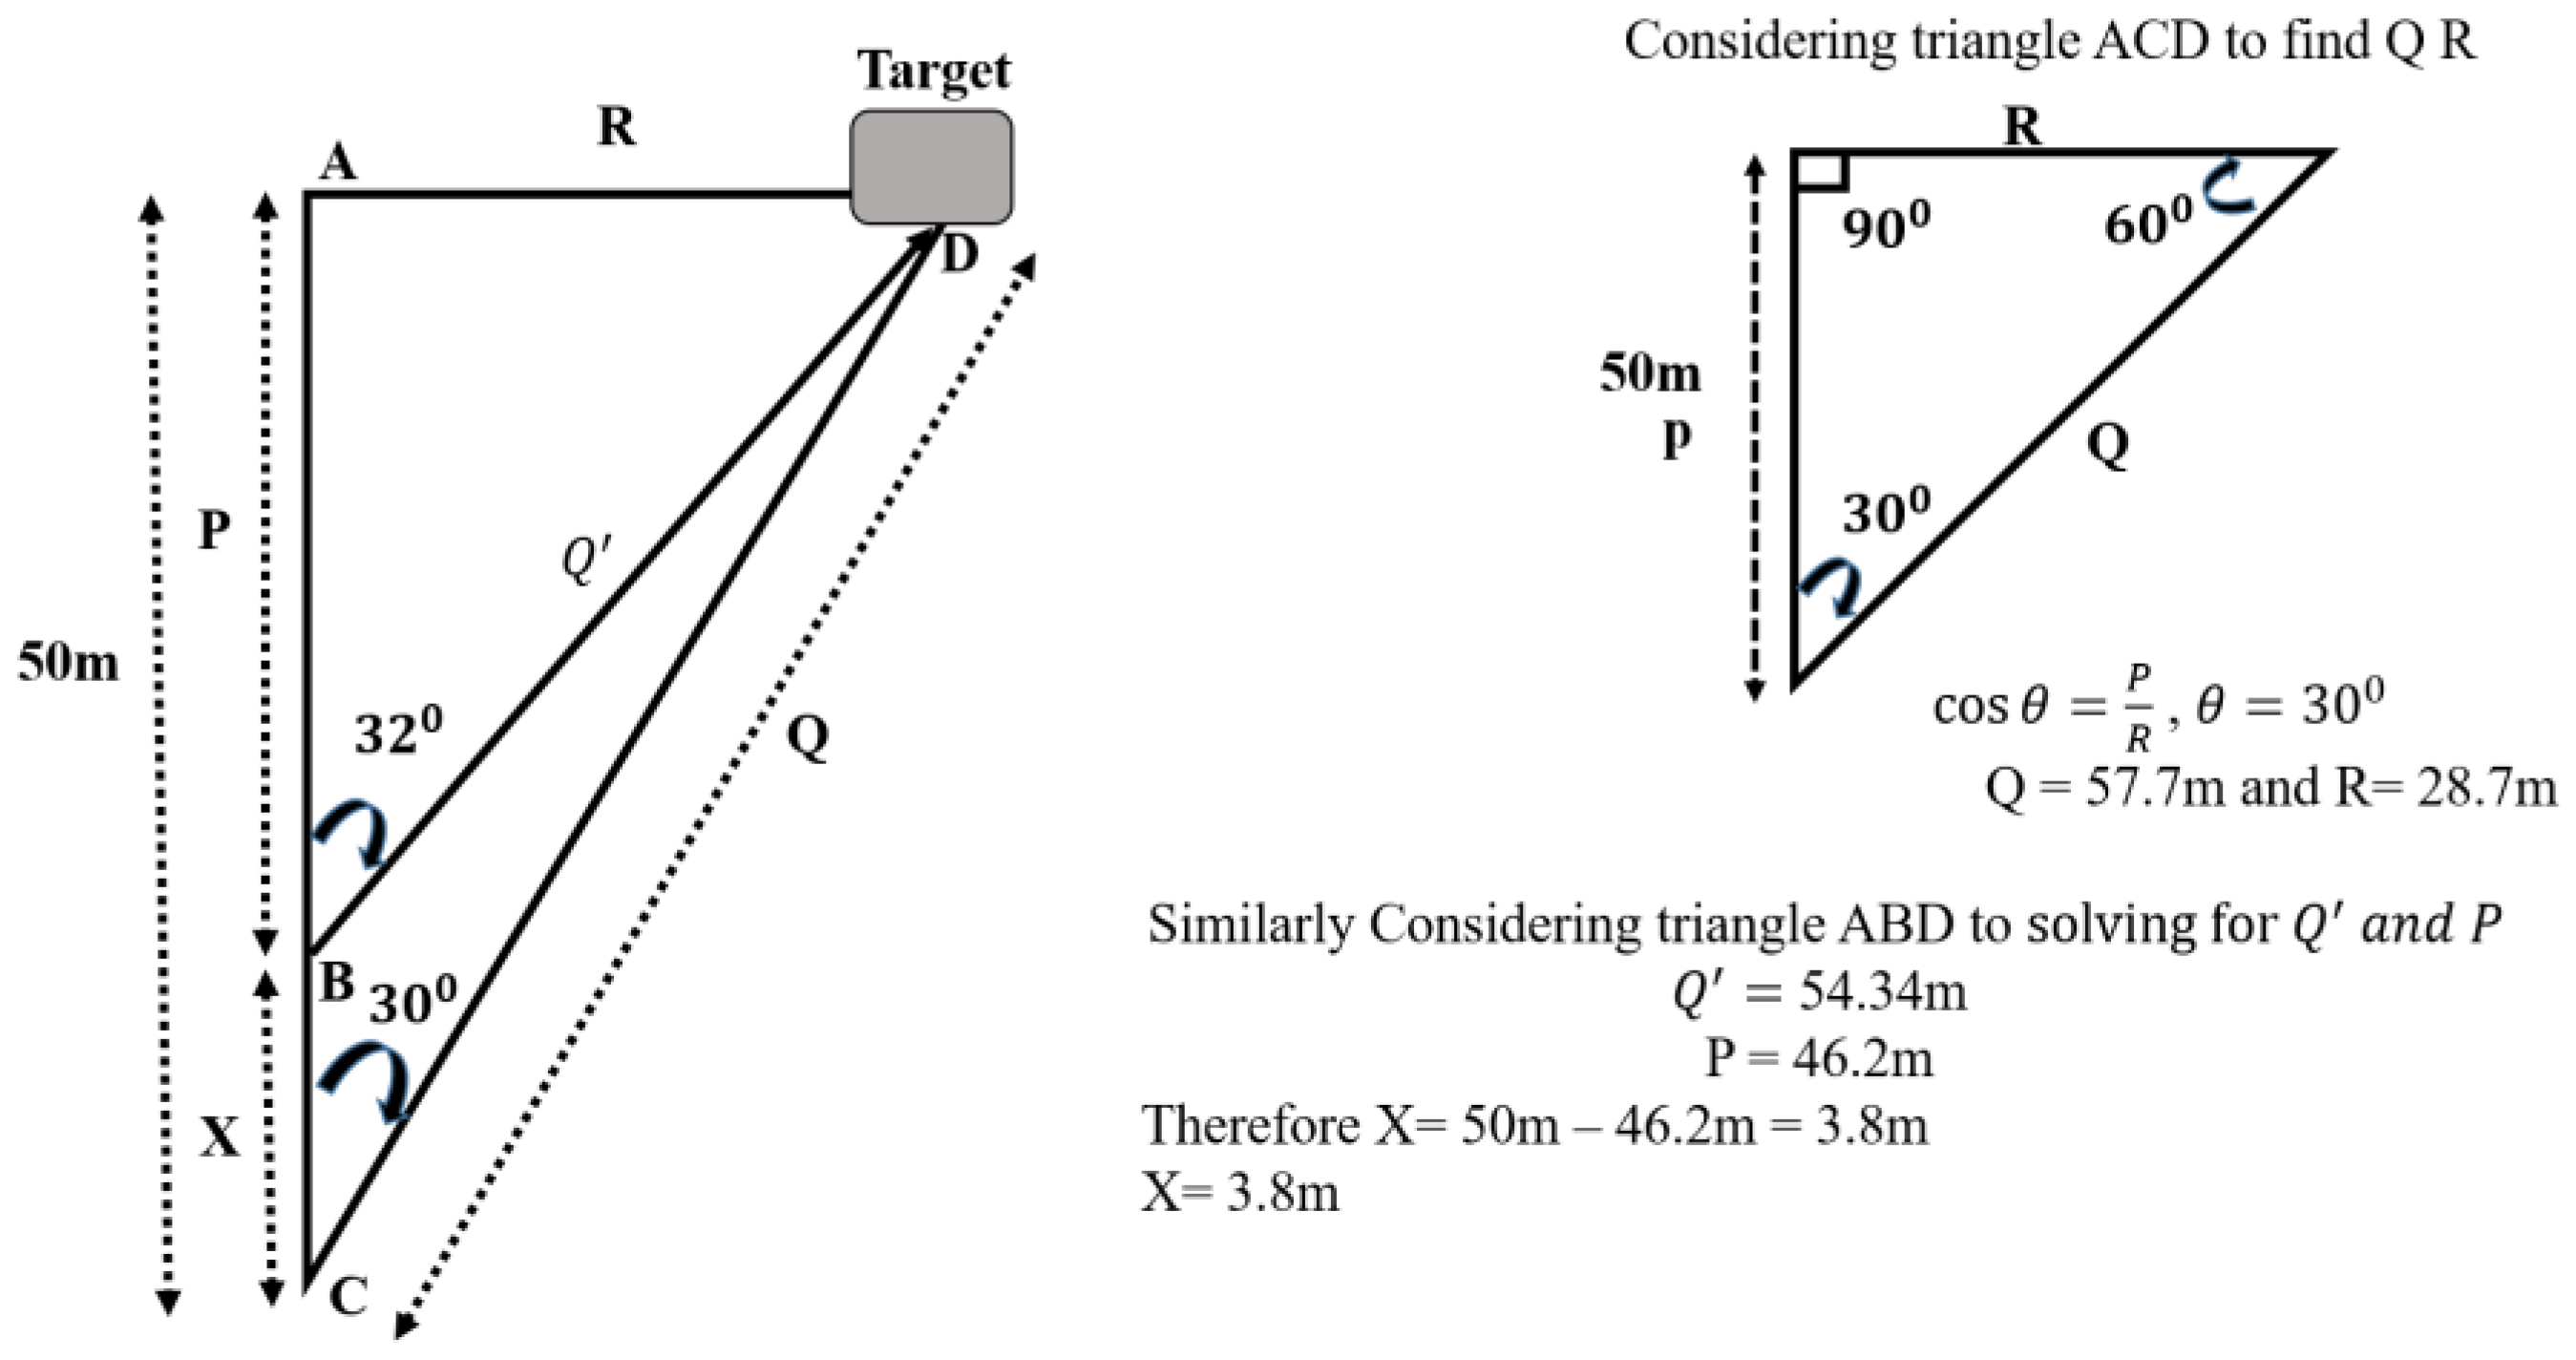
Figure 4 illustrates the mathematical model used to estimate the azimuthal angle of objects. The model uses the Doppler Effect to measure the frequency shift caused by the movement of objects relative to the ultrasonic sensor while the vehicle moves with a velocity of V m/s.
Figure 5 represents the results of an experiment measuring the minimum and maximum velocity at a distance of 3.8 m (X equals 3.8 m).
Figure 5 is a visual representation of how speed influences the experimental results. It likely shows a graph or chart that displays the measured velocities and how they vary with speed changes.
Figure 6 is a separate visual representation that plots the effect of speed variation on the error in the experimental results that displays how the level of error in the measurements changes as the speed varies. By examining the relationship between speed and error, researchers can gain insight into the reliability and accuracy of the experimental results.
Figure 7 depicts the real-time implementation of the proposed technique for estimating the azimuthal angle of objects using ultrasonic sensors and the Doppler frequency shift. This method involves generating a signal with a frequency of 40 kHz and a voltage of 5V_pp using the DAQ and transmitting it to the ultrasonic transmitter as part of the experiment. The echo signal received by the sensor from each of the objects located under a single beam is then processed to determine the angle of incidence, called the azimuthal angle.
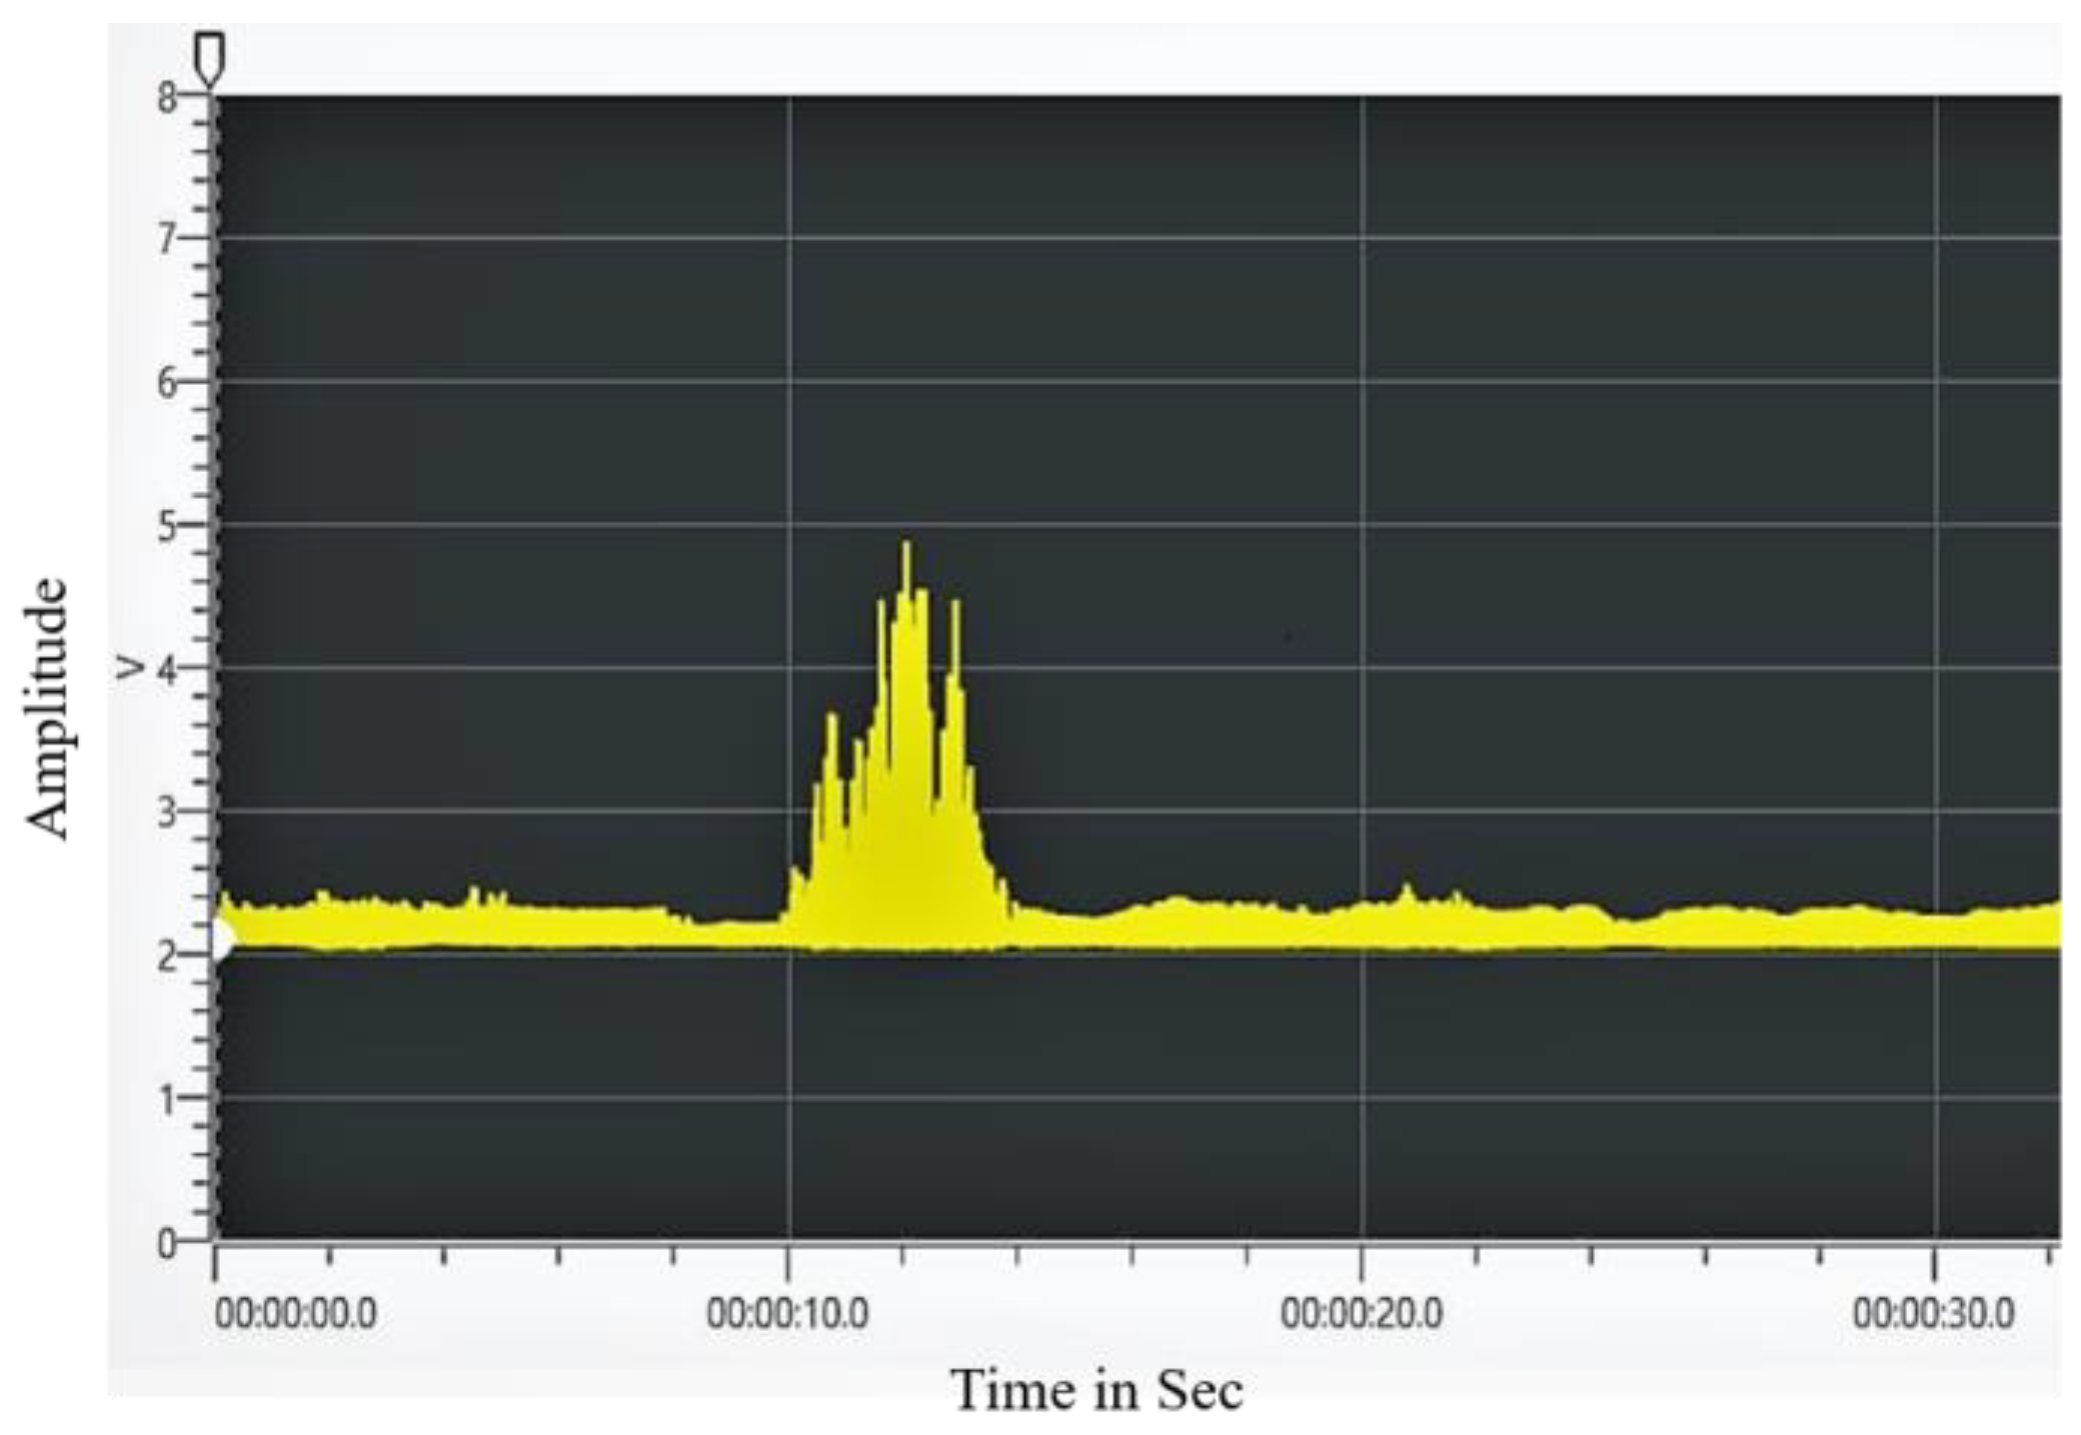
Figure 8 depicts the Doppler frequency shift of the received signal from the objects as DAQ acquired it in the time domain. This frequency shift may be attributed to the number of objects under a single beam. After that, the signal is processed to estimate the objects’ azimuthal angles accomplished by first transforming the signal into the frequency domain by applying the FFT. Then, the signal is processed to calculate the angle.
After applying FFT to the data collected from DAQ in the time domain,
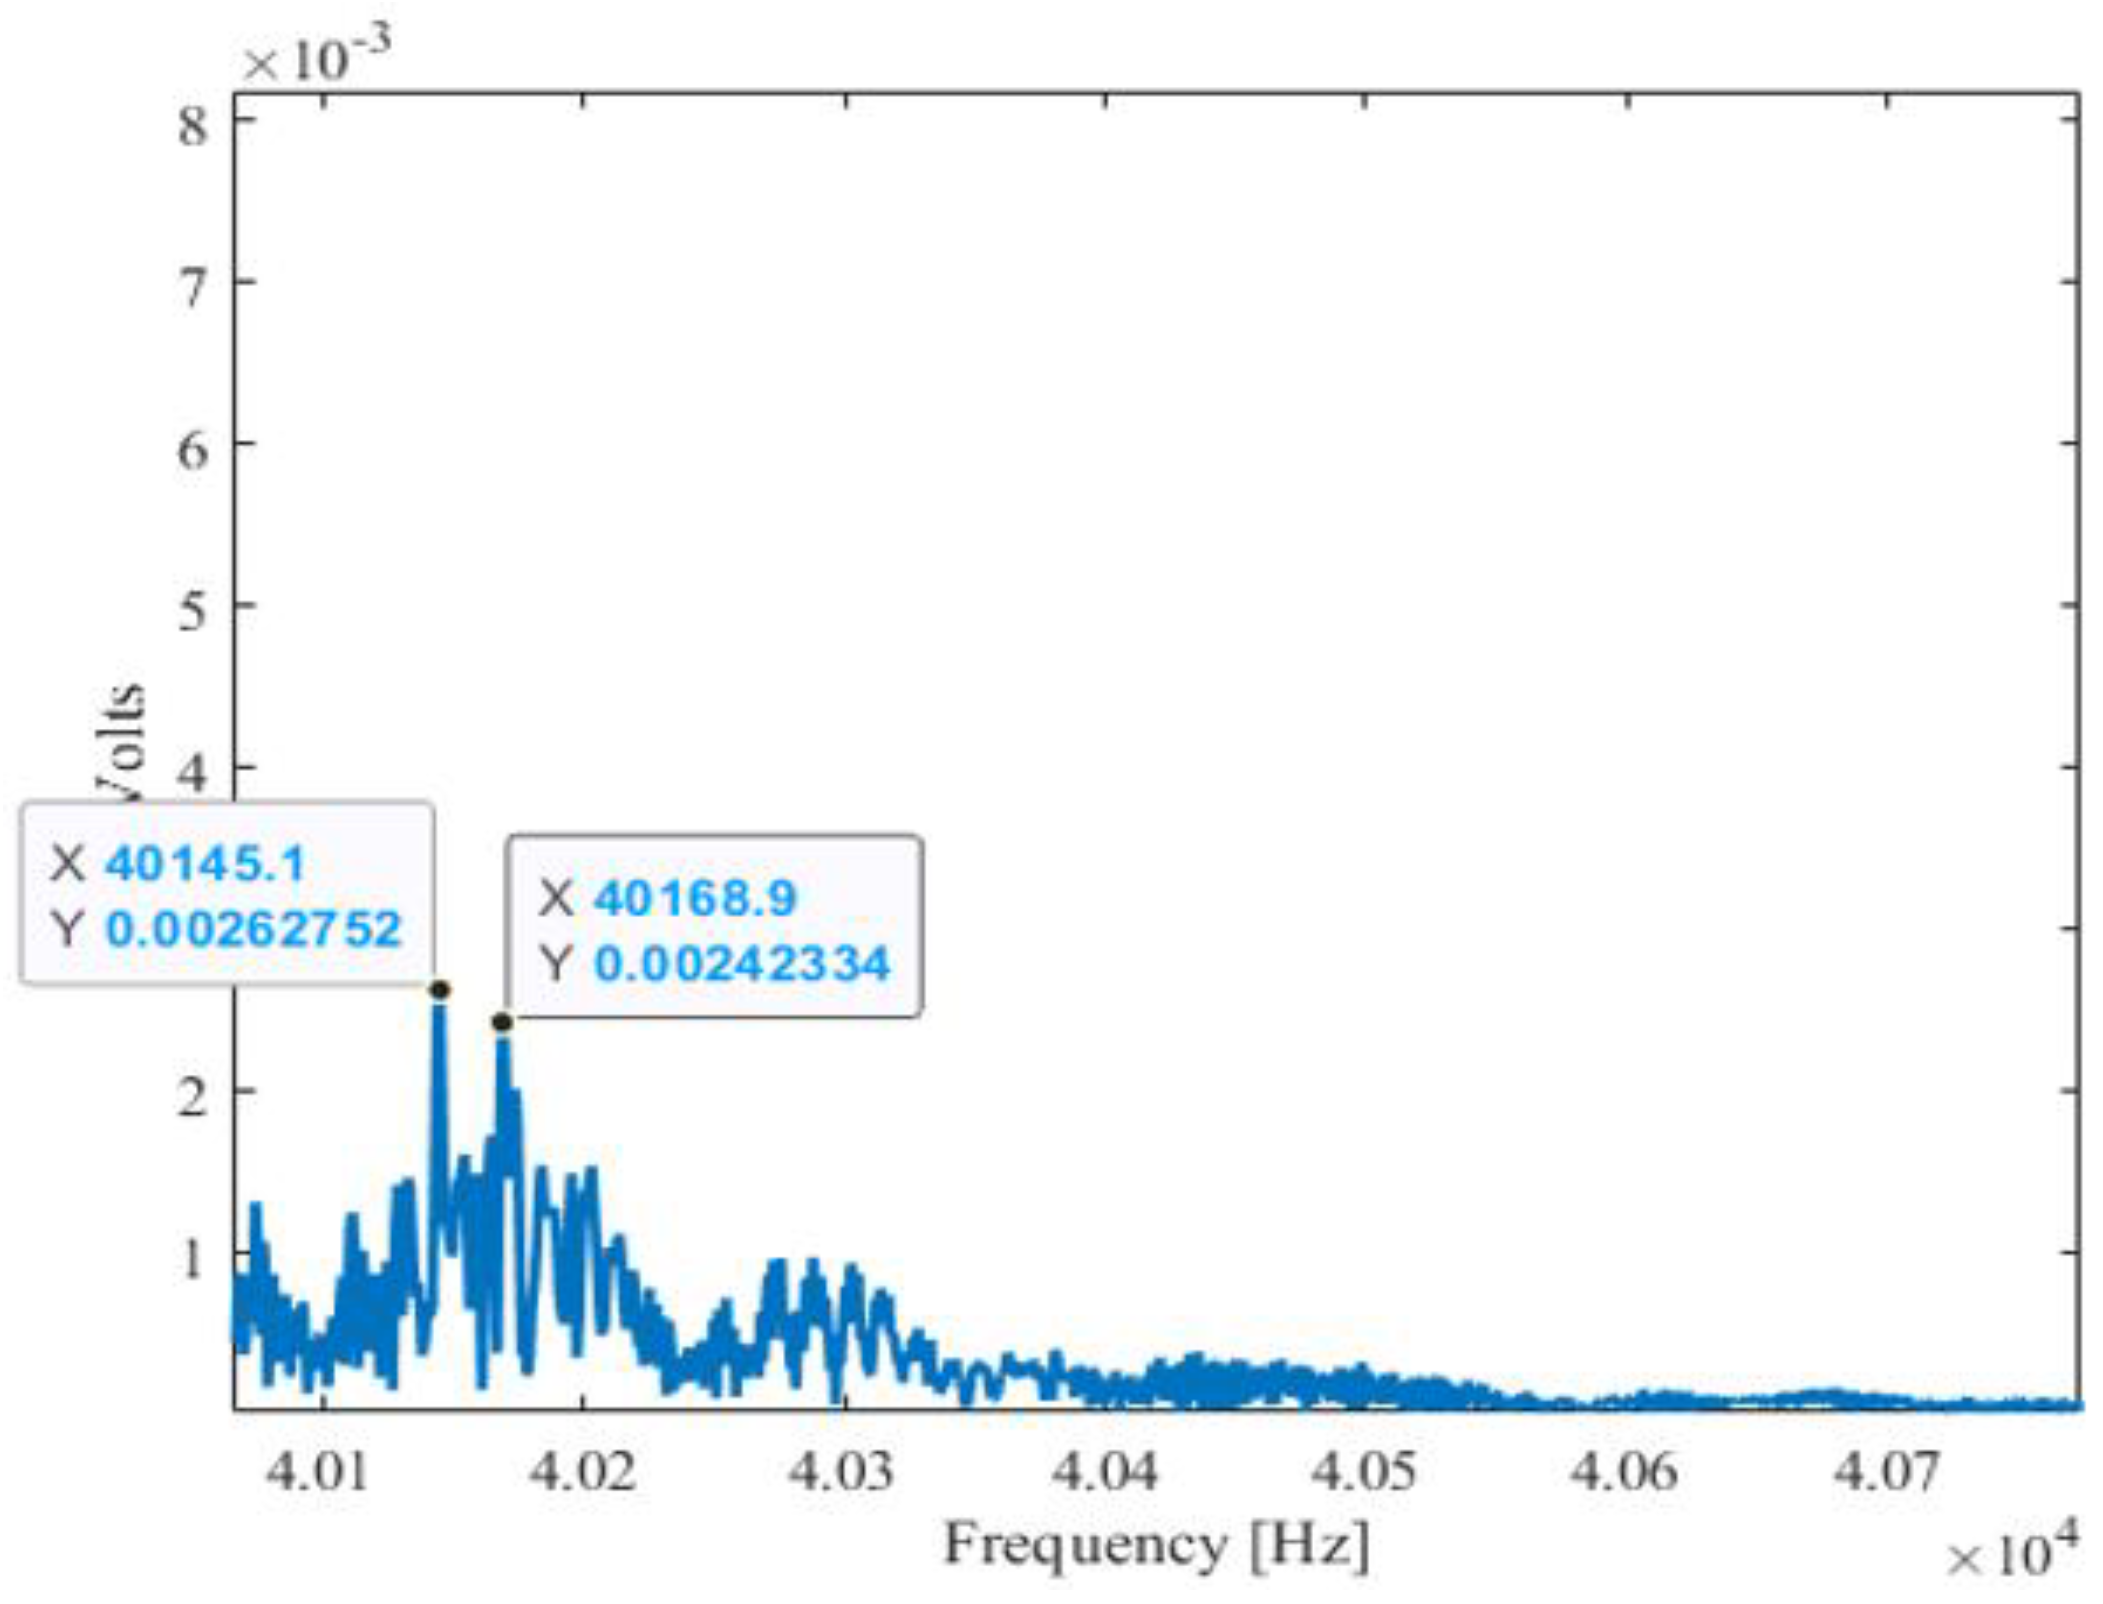
Figure 9 displays the Doppler frequency shift in the frequency domain.
Figure 9 shows the proposed method successfully identifying 2 objects by indicating the 2 Doppler frequency shifts at different frequency peaks due to the Doppler Effect, which corresponds to the 2 objects placed at
and
, respectively. Utilizing a methodology similar to that described above, we investigated using 3 objects oriented at angles of
, respectively. As illustrated in
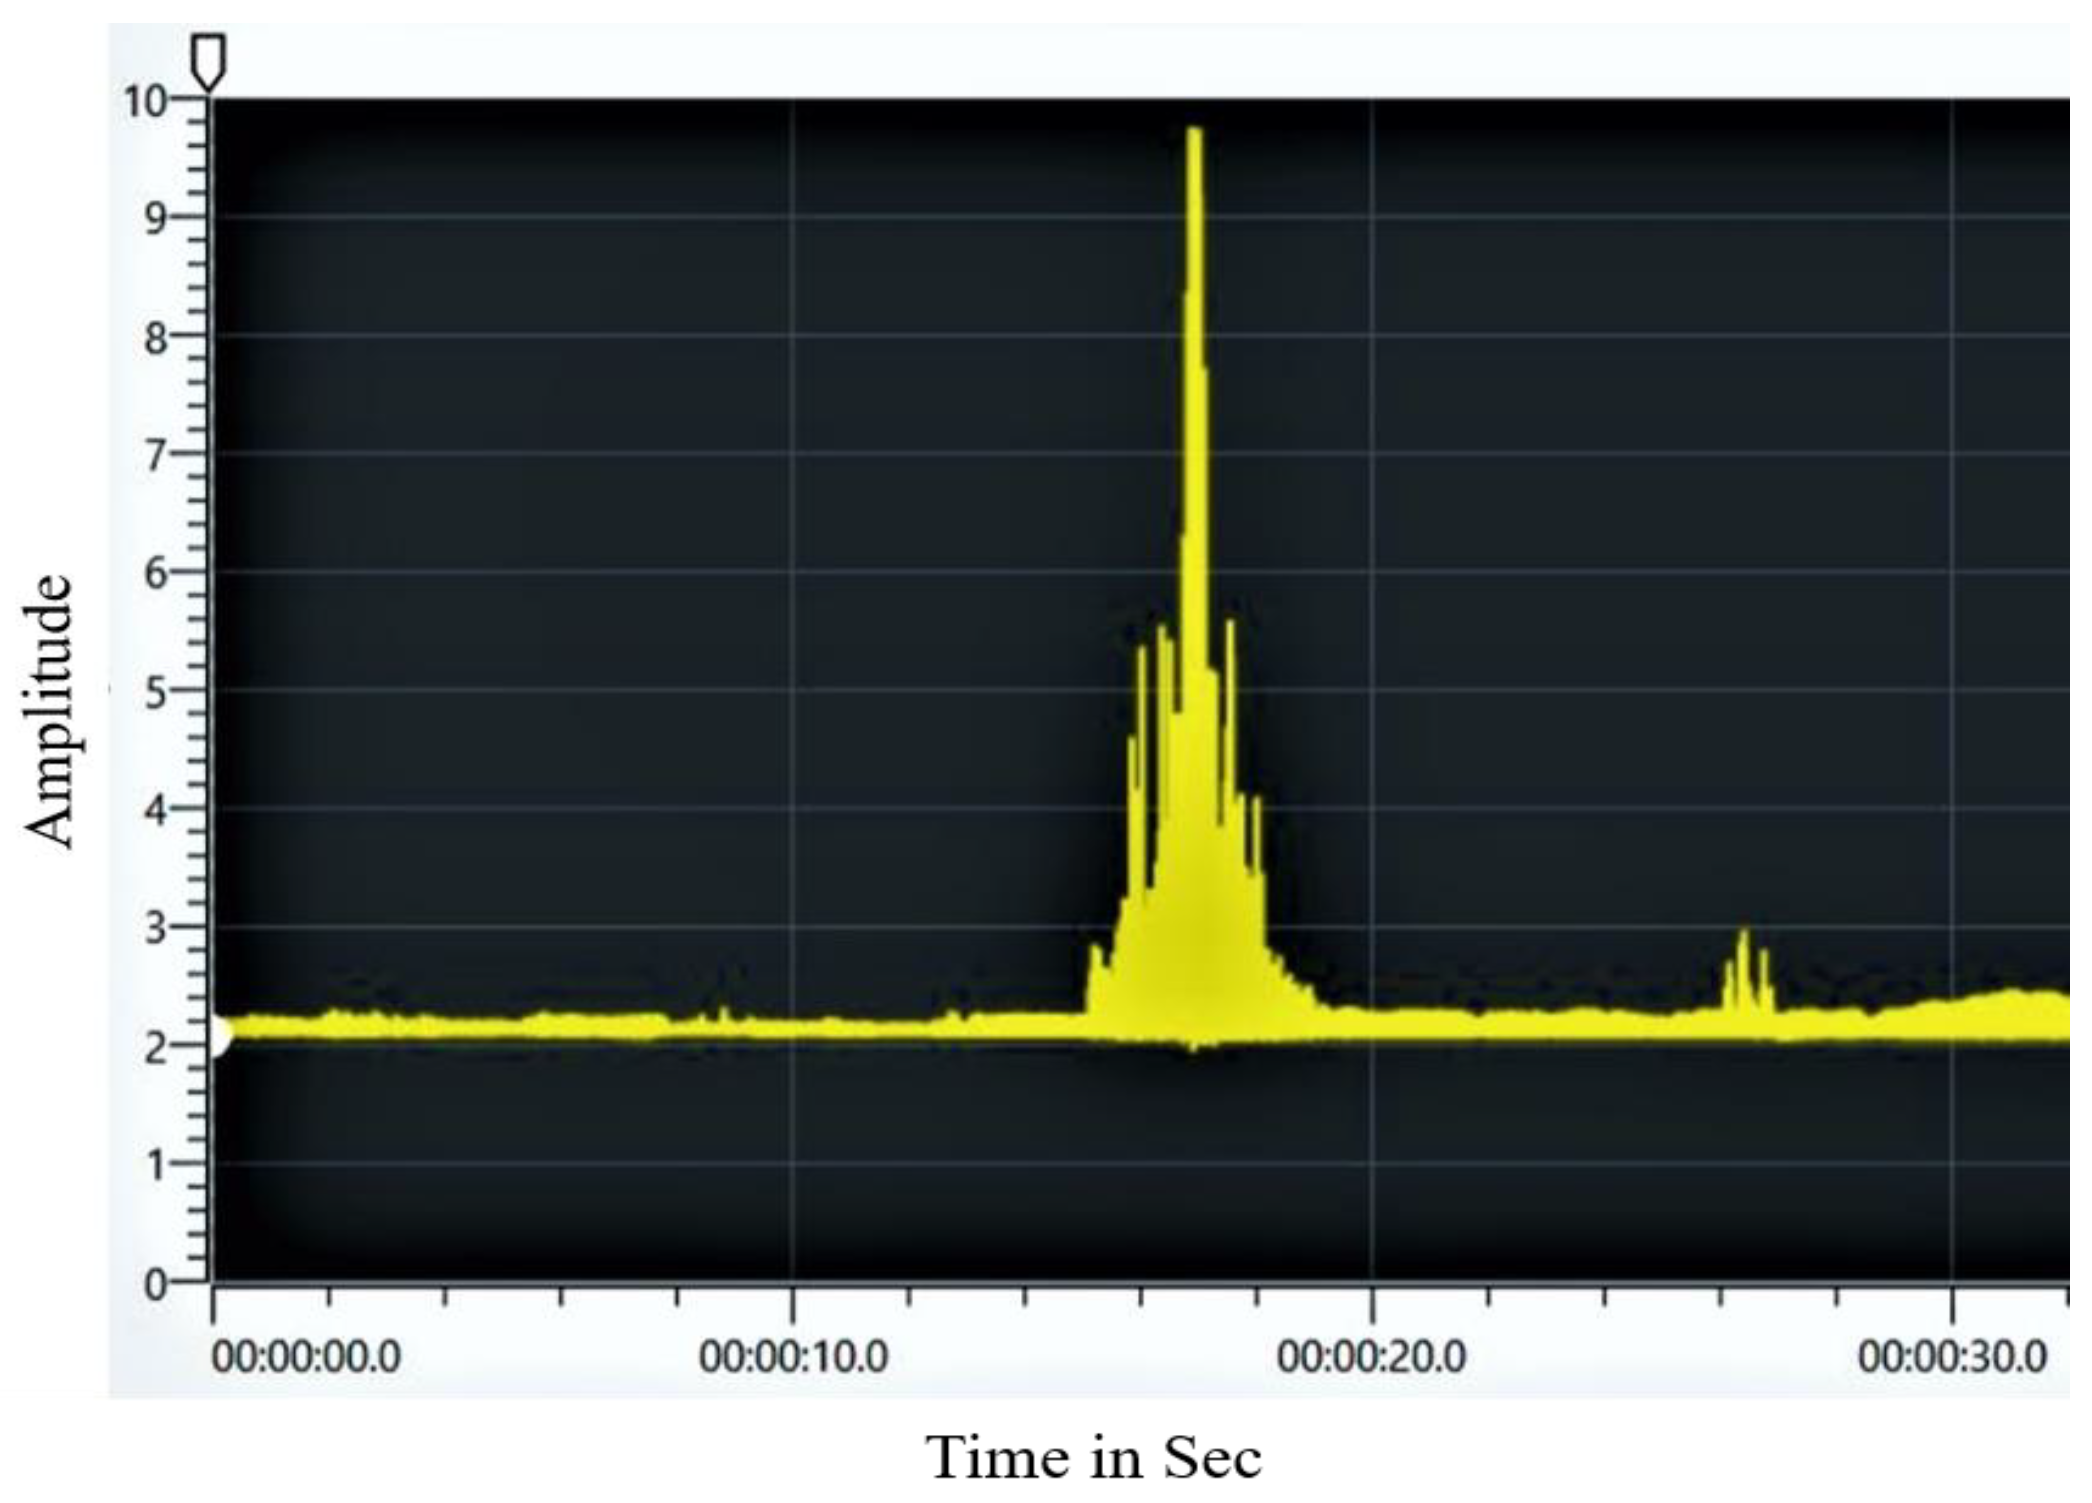
Figure 10, we first acquired the data in the time domain employing DAQ. Furthermore, we performed the FFT using signal processing to determine the equivalent frequency shift in the frequency domain by the Doppler Effect, as shown in
Figure 11.
We tested the method using 3 objects oriented at an angle of 20°, 35°, and 50° using a proposed methodology that was identical to those discussed in
Figure 8 and
Figure 9.
Figure 10 depicts the time-domain data obtained from the DAQ recording of the Doppler Effect of 3 items positioned at angles of 20°, 35°, and 50°.
Figure 11 illustrates how we used the FFT and signal processing to calculate the equivalent frequency shift caused by the Doppler Effect in the frequency domain. They distinguished the 3 objects by pointing out the various peaks in the 5 Hz frequency resolution. The findings obtained using this suggested technique are comparable, as shown in
Table 4, after tabulating and comparing the measured and estimated values of the automobile’s velocity and azimuthal angle.
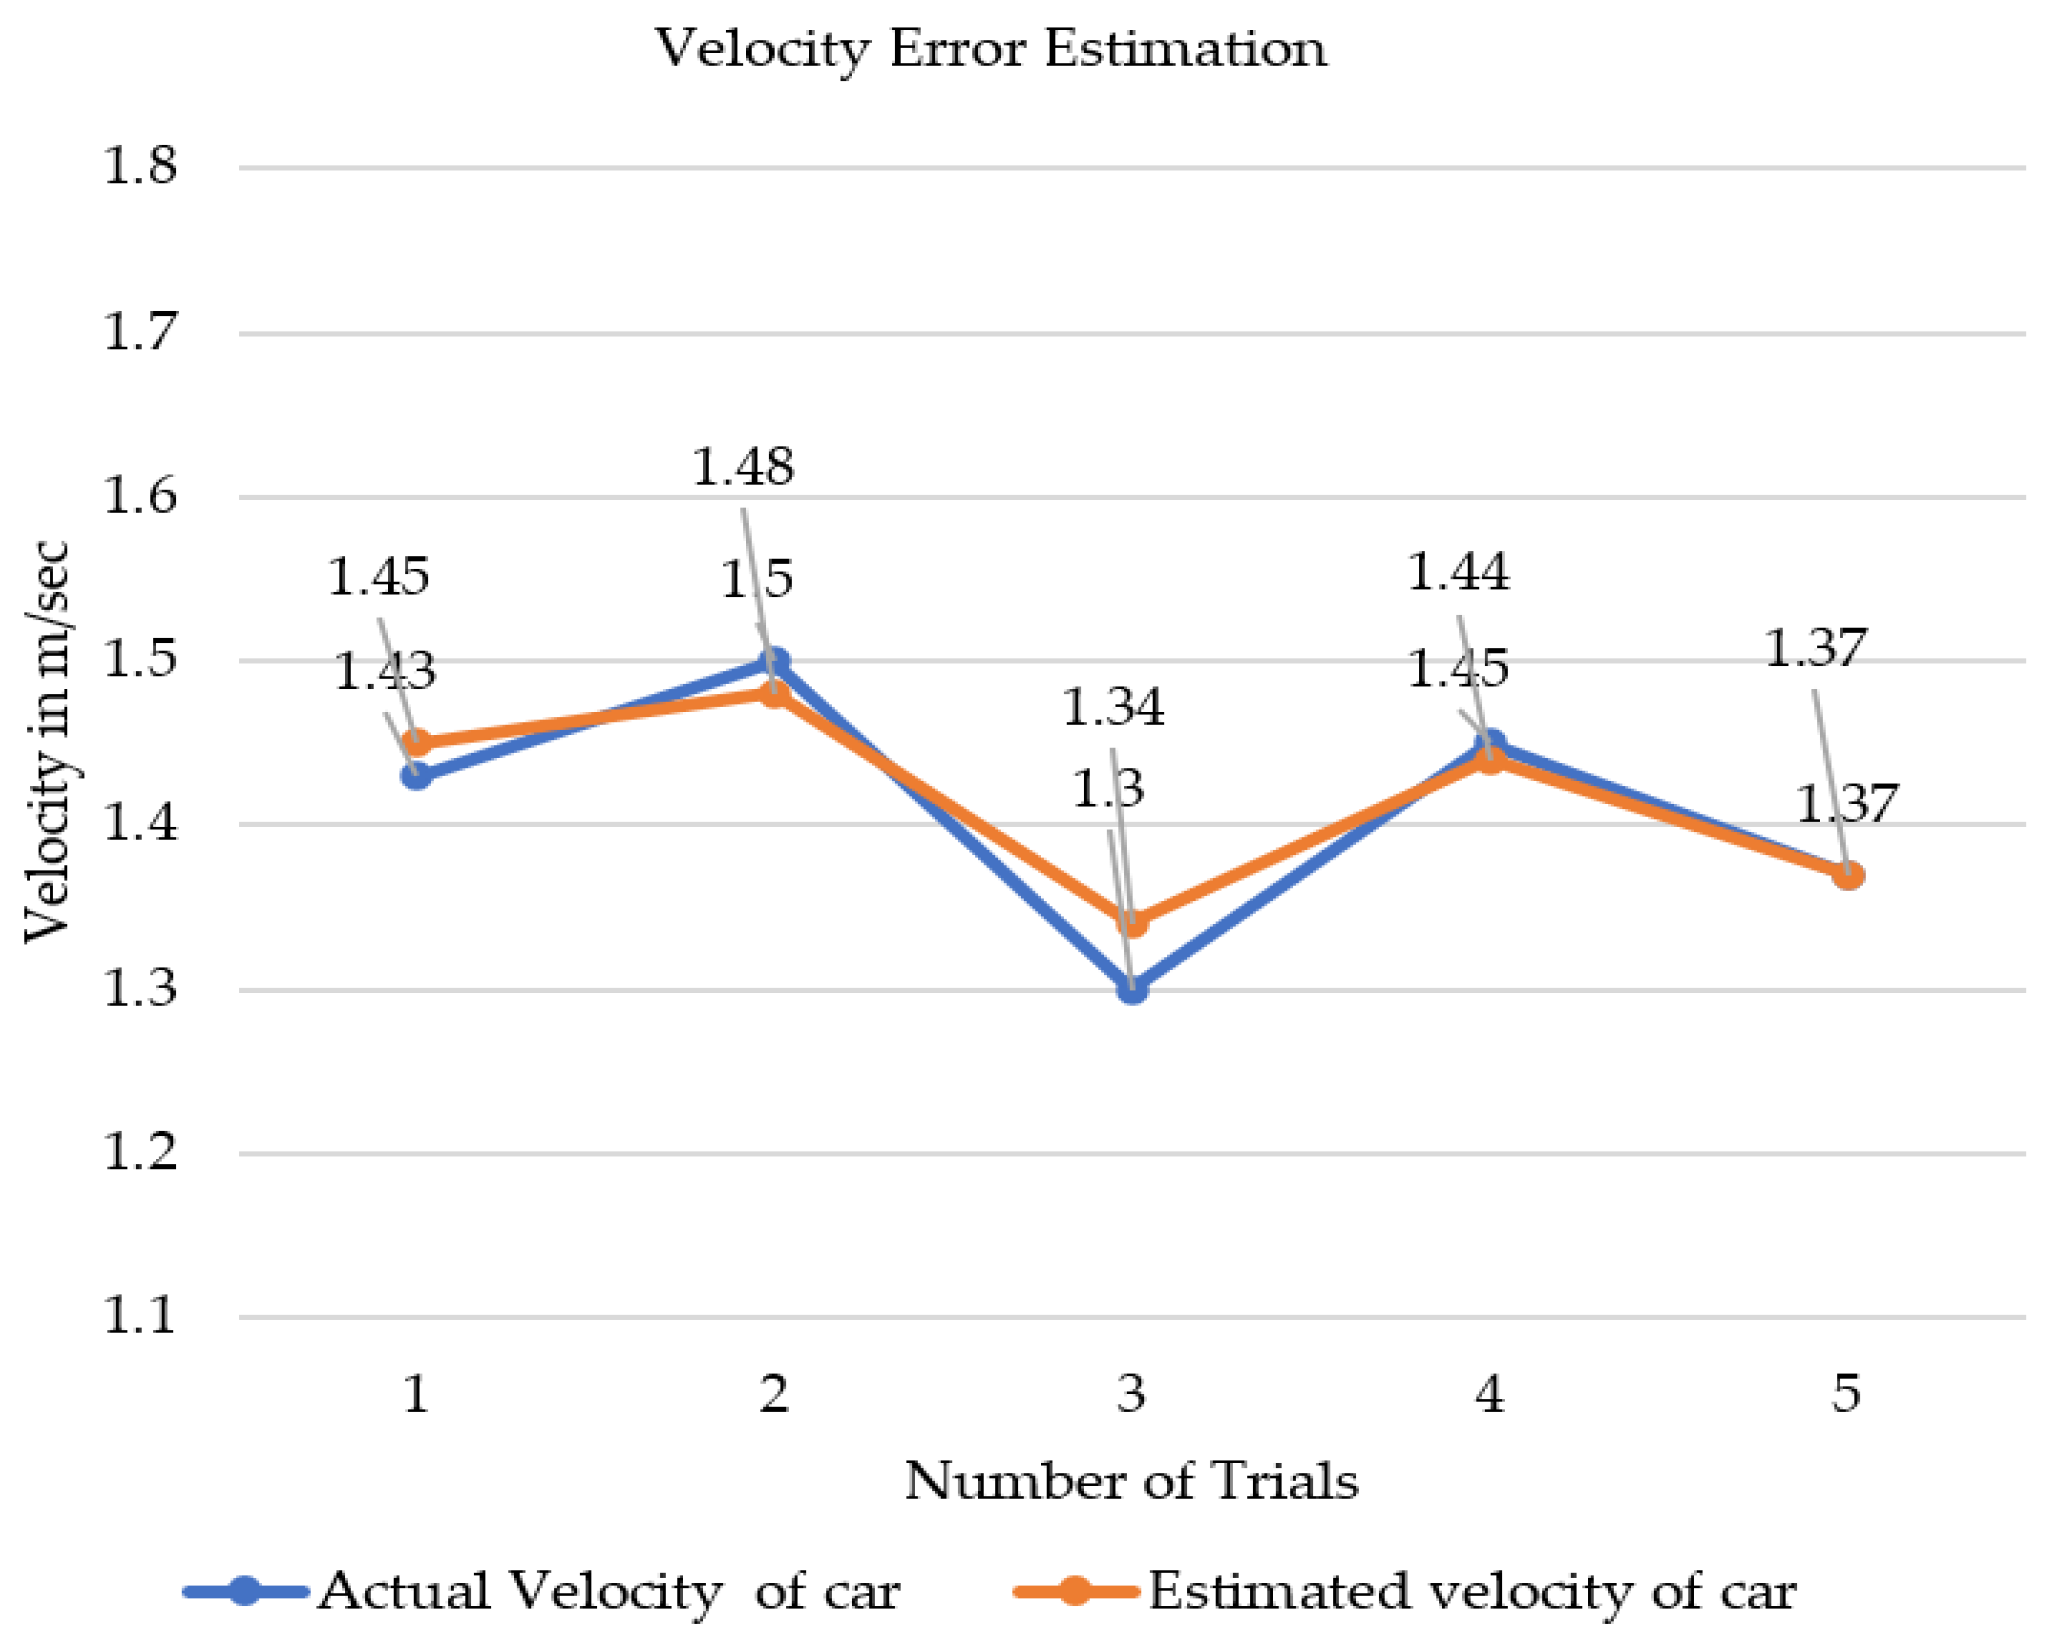
Figure 12 represents the results that were obtained through the above-described method. The actual and estimated velocity difference is less than a 3% error across the measurement velocity range.
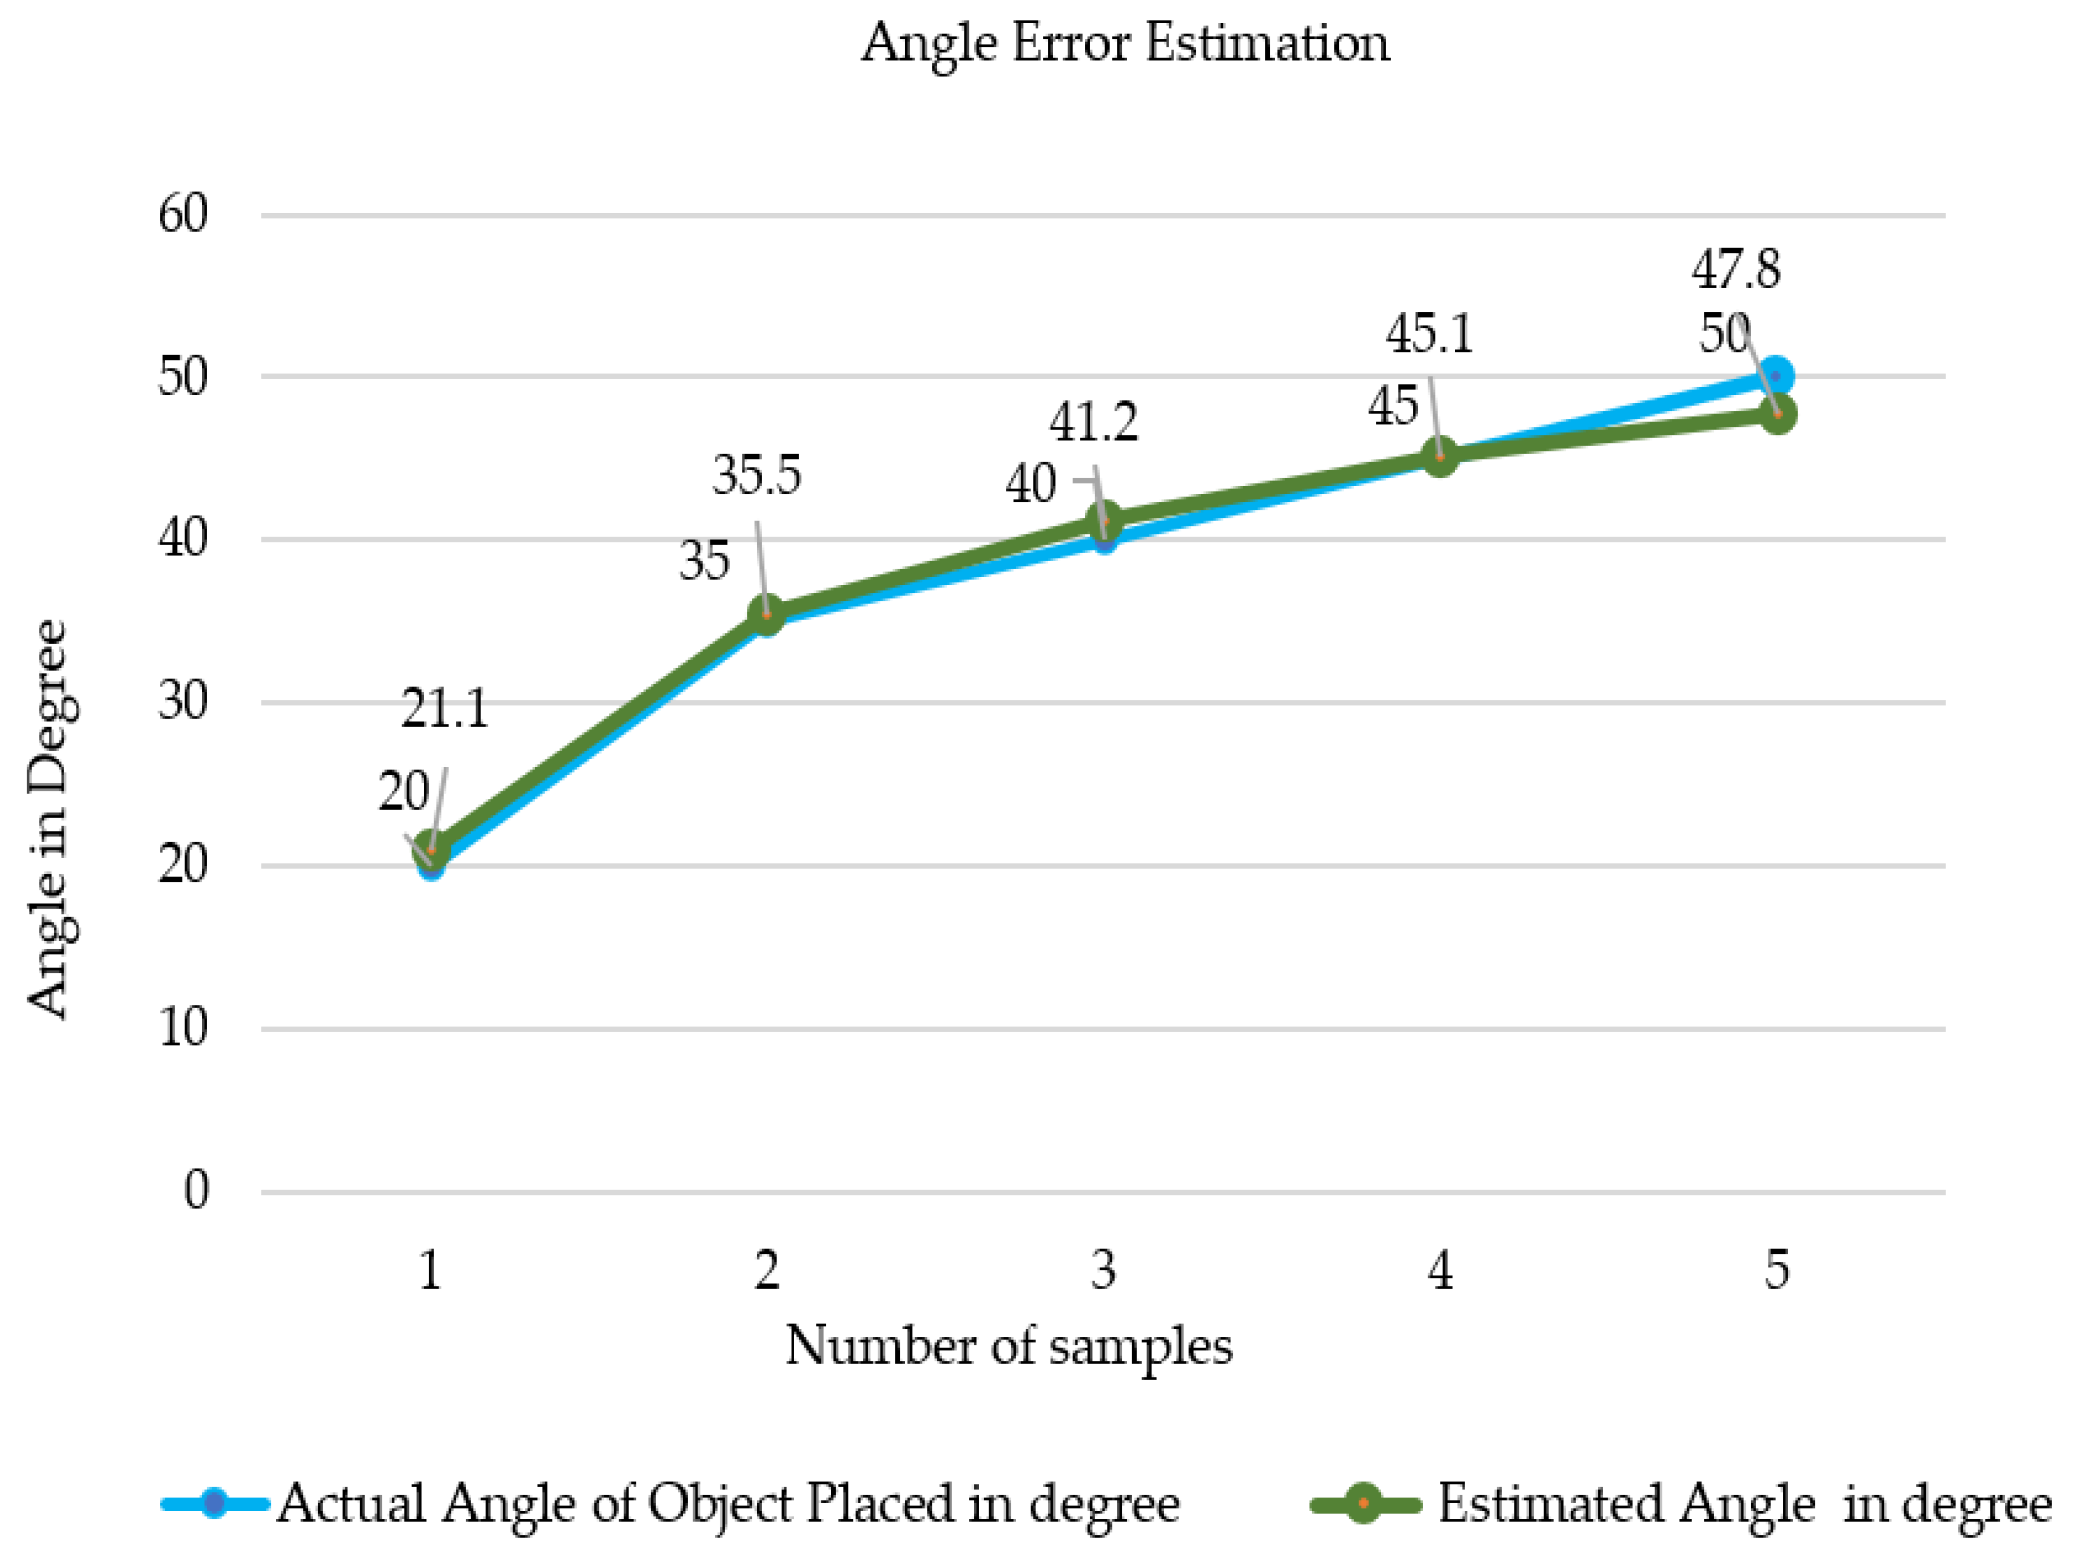
Figure 13 shows the angle error estimation of the proposed method of calculating the azimuthal angle through the Doppler shift. As a result of analyzing the acquired data, it was confirmed that values within the error range were obtained and that the number of objects and peak values were proportional and had a percentage error of less than 3%. The measured data and relative error in the azimuthal angle were summarized in
Table 4. We may conclude that a non-linear relationship exists between the actual and estimated angles obtained through signal processing. The data calculated are almost the same. Thus, with high accuracy, an automobile’s developed quantitative remote sensing model can measure the object’s azimuthal angle under a single ultrasonic beam. The experimental results verified that it is possible to classify objects and estimate the azimuth using the Doppler shift phenomenon when several objects are within one ultrasound beam. The findings suggest that the error in the measured and calculated values is less than three percent on average, as shown in
Table 5.
4. Conclusions
This study has introduced a new method for measuring objects’ azimuthal angles using ultrasonic waves’ Doppler effect. This method converts the different Doppler shift frequencies of each object into angles and has been examined from the perspective of ultrasonic wave propagation. The study has shown that when a car transmits ultrasonic waves toward objects on the road, each object reflects the wave at a unique angle based on the angle of incidence, shape, and position of the object. The ultrasonic wave creates an acoustical vibration that propagates toward the objects by moving the air around the transmitter. The direction of this vibration is determined by the speed of sound and the car’s velocity. Thus, the car’s movement affects the direction of the ultrasonic wave and the angle at which it is reflected.
By detecting the difference in the reflected wave angle for each object, sensors in the car can locate and identify objects on the road, making it useful for parking assistance and obstacle detection. This study has proposed a new calculation method that considers the above points, resulting in a more accurate measurement of the azimuthal angle. The experimental results indicate that this proposed method is practicable and practical, with an average error of less than three percent in the measured and estimated values.
