Article

Characteristics of Dust Weather in the Tarim Basin from 1989 to 2021 and Its Impact on the Atmospheric Environment

1
College of Ecology and Environment, Xinjiang University, Urumqi 830046, China
2
State key Laboratory of Desert and Oasis Ecology, Xinjiang Institute of Ecology and Geography, Chinese Academy of Sciences, Urumqi 830011, China
3
University of Chinese Academy of Sciences, Beijing 100049, China
*
Author to whom correspondence should be addressed.
Remote Sens. 2023, 15(7), 1804; https://doi.org/10.3390/rs15071804
Submission received: 20 February 2023 / Revised: 22 March 2023 / Accepted: 24 March 2023 / Published: 28 March 2023
(This article belongs to the Section Atmospheric Remote Sensing)

Abstract

:
Dust emission is a common catastrophic weather phenomenon in Northern China. This phenomenon not only causes environmental problems, such as air pollution, but also has an important impact on the global dust cycle and climate change. On the basis of the dust weather observation data of 44 surface meteorological stations in the Tarim Basin from 1989 to 2021, combined with the dust aerosol optical depth (DAOD), dust surface mass concentration (DUSMASS) and wind speed data, this paper analyses the spatial and temporal dust weather characteristics in the Tarim Basin over the past 33 years. Results show that the frequency of dust weather in the Tarim Basin has declined in the past 33 years. Dust weather mainly consisted of floating dust, followed by blowing dust and dust storm. This weather had a significant seasonal change, with more dust in spring and summer and less in autumn and winter. The dust weather was mainly distributed along the south edge of the Tarim Basin and the desert hinterland of Tazhong. The spatial distribution of the dust intensity (DI) index was basically consistent with the dust weather days. Moreover, the DAOD was obviously affected by dust weather and had a significant positive correlation with the number of dust weather days and the DI, suggesting the vertical concentration of dust particles to a certain extent. Wind is also one of the most important factors affecting the release of dust. The frequency of strong wind weather decreases from the northeast to the southwest, which corresponds to the distribution of the DUSMASS.

1. Introduction

Dust weather is a special type of disastrous weather in arid and semi-arid areas. Under specific conditions of underlying surface, large-scale circulation, and weather system, a weather phenomenon with a strong destructive force is formed due to the interaction of wind and dust of a certain intensity [1]. In terms of formation mechanism, occurrence intensity and damage degree, this natural disaster weather can be divided into three categories: blowing dust, floating dust and dust storm [2]. Dust weather is characterised by a high degree of harm, a wide range of influence and a large dangerous process. In particular, strong dust storms not only have a huge impact on people’s productivity and daily lives and the ecological environment, but also accelerate desertification through sand burial and blowing [3,4]. As a global ecological and environmental problem, the dust aerosols produced by dust weather have a serious impact on air quality and human health [5,6]. The radiation effect of dust particles plays a significant part in changing the energy balance of the earth, affecting the local weather and even the global climate [7,8]. The global dust sources are widely distributed, mainly in arid and semi-arid areas, and convey a large amount of dust to the atmosphere. In arid areas with a dry climate, the surface soil is loose and the vegetation is sparse, providing a rich material basis for dust formation [9]. Asian dust mainly comes from Northwest China and the deserts of Mongolia. As a region with frequent dust weather, its production is the largest in spring [10]. Asian dust is one of the most important sources of global dust emissions. The large amount of dust entrained from the deserts in Western China not only affects the interior of China but can also be transported thousands of kilometres away [11,12,13]. The research on dust weather includes climate change, aerosol monitoring, PM and so on; these topics have been studied for a long time here in China and abroad. Zheng et al. [14] analysed the variation characteristics of dust weather and aerosol by using surface meteorological observation data from Xiaotang and Tazhong Stations in the Taklimakan Desert from 1994 to 2016 and found that the frequency of dust aerosol presence and dust weather presented a linear function relationship. Tan et al. [15] used the WRF Chem model to study the influence of dust aerosols on the heat exchange of the ground air system during the occurrence of dust storms. It was found that the existence of dust aerosols would affect surface net radiation and further influence other components of surface air energy exchange. Gao and Washington [16] used the aerosol index (AI) to analysis the dust in the Tarim Basin, and found that the dust emission in the Tarim Basin was uneven, which was related to the accumulation of a large number of fine sandy sediments in hot spots and the transport path of dust controlled by topography. With the deepening of research, the dust weather monitoring methods include not only traditional ground observation but also multi-source satellite monitoring. Satellite remote sensing technology uses the spectral radiation characteristics of atmospheric particles and their relative differences with other environmental factors to extract dust information from the atmosphere, compensating for the lack of monitoring data on the occurrence, transmission and intensity change of dust in ground observation. Such a technology has been widely used [17,18,19].
In recent years, the frequency of dust weather in northern China has shown an overall downward trend, but in some years, the number of days of local strong dust storms and extremely strong dust storms increased [20,21]. In March 2021, two extremely strong dust storms triggered jointly by an abnormal strong Mongolian cyclone and the surface cold high pressure system affected most regions of China [22,23]. Dust weather is closely related to the adjustment of large-scale circulation and the outbreak of cold air. There is a great difference between the circulation background in the years with more dust weather and the years with less dust weather [24]. Chen et al. [25] analysed the temporal and spatial variation characteristics of dust weather in the Qaidam Basin and its influencing factors and found that the number of dust days was positively correlated with atmospheric pressure, number of gale days and area and intensity of the polar vortex in Asia. Under the influence of various environmental factors, the occurrence of dust has obvious seasonal and spatial changes. Yang et al. [26] studied the influence of summer precipitation in sensitive dust source areas on the trend of dust weather in Northern China in the spring of the next year and, on this basis, established a multi factor objective prediction model for the trend of dust weather in spring. Extreme wind speed mostly occurs before or after the beginning of rainfall, resulting in strong dust emissions. The highest dust concentration is from May to June, with the strongest wind speed and the lowest vegetation coverage [27]. From 1971 to 1996, Minqin and Hotan were the centres of high incidence of dust storms in Northern China [28]. From 2000 to 2006, dust storms frequently occurred at the southern edge of the Southern Xinjiang Basin and in North China [29]. It can be seen that the area where dust weather occurs is not fixed, and varies in different regions in different periods.
Xinjiang has a fragile ecological environment and strong wind sand activities. It is one of China’s regions with severe dust storm disasters [30]. As the largest and second largest mobile desert in China and in the world, respectively, the Taklimakan Desert in Southern Xinjiang is an area with an extremely sensitive response to climate change in inland arid areas and one of the main origins of dust [31]. Approximately 32% of the dust in Asia originates from the Taklimakan Desert, and the frequency of dust weather in the Tarim Basin is high. In many regions, the number of annual dust weather days exceeds 100 days, and even more than 200 days in some parts of Hotan [32]. The intensity, frequency and duration of dust weather transit significantly affect the air quality in terms of pollution level and the social and economic development and face challenges from many ecological and environmental problems. Therefore, ground observation and remote sensing data must be combined to study the dust weather in the Tarim Basin to further analyse the regional characteristics of dust.
This paper uses dust weather observations from 44 ground-based meteorological stations in the Tarim Basin from 1989 to 2021 including dust aerosol optical depth (DAOD), dust surface mass concentration (DUSMASS) and wind speed data to investigate the characteristics of the dust weather in the Tarim Basin over the past 33 years and achieve the following objectives: (1) to investigate the frequency and intensity of dust weather occurrence in the Tarim Basin and its spatial and temporal distribution characteristics, (2) to reveal the impact of dust weather on atmospheric particulate matter, (3) to elucidate the relationship between wind and dust.

2. Study Area

Tarim Basin (Figure 1) is located in southern Xinjiang, China and is the largest inland basin in China. This basin has a warm temperate climate. Precipitation in the basin is rare, and evaporation is large. The annual precipitation in the surrounding mountains reaches 200–400 mm. The northeast and northwest winds are dominant. The vegetation coverage is low, and basically no vegetation exists in the desert centre. The landform of the Tarim Basin is distributed in a ring shape between the Tianshan, Kunlun and Altun Mountains, and the terrain is high in the west and low in the east. The edge is formed by Gobi gravel connected with mountains, and the centre is a vast desert. Alluvial fans and plains exist between the edge and the desert, and oases are distributed. The Taklimakan Desert, the second largest mobile desert in the world, accounts for 26% of the total area of desert in China. The area of mobile dunes accounts for a large proportion, and the shape of dunes is complex.

3. Data and Methods

3.1. Dust Weather Observation Data

The daily dust observation data of 44 surface meteorological stations (See the appendix Table A1 for station information) in the Tarim Basin from 1989 to 2021 (data of Tazhong Station since 1999) were selected for this study and provided by the Xinjiang Meteorological Bureau. Floating dust, blowing dust and dust storms are classified according to the ground meteorological observation standard, namely, visibility < 10 km, 1 km < visibility < 10 km, and visibility < 1 km. The number of dust days mentioned in this article is not the sum of the three kinds of dust weather days. Dust weather is a general term for floating dust, blowing dust and dust storms. Taking floating dust weather as an example, if floating dust occurs at a station within one day, the frequency of floating dust occurrence is recorded as once. The statistical methods for dust storm and blowing dust weather are similar. If blowing dust, dust storm and floating dust occur at the same station on the same day during the statistics, the station will be recorded as having one dust day.

3.2. Assimilation Data

MERRA-2 is a new generation of Modern Era Retrospective Analysis for Research and Applications for the reanalysis of data sets developed by NASA using the GEOS- 5.12.4 system [33,34]. The assimilation system considers the AOD data from various satellites (i.e., AVHRR, MISR, MODIS and AERONET) and ground observations. The DAOD and DUSMASS (μg·m−3) data from 1989 to 2021 are used in this paper, with a spatial resolution of 0.5° × 0.625° and a temporal resolution of monthly.
The ERA5 reanalysis data are the latest generation assimilation data of the European Centre for Medium and Long-Term Weather Forecasting (https://www.ecmwf.int/, accessed on 20 June 2022) and has higher applicability and accuracy than the previous generation of assimilation data, ERA Intermediate [35]. In this paper, the ERA5 wind speed data (1989–2021) with a temporal resolution of 1 h at a height of 10 m is used to calculate the wind speed indicators.

3.3. Dust Intensity Index

The definition by Wang et al. (2005) is used to calculate the dust intensity (DI) index:
D I = F D + B D × 3 + D S × 9 ,
where FD is the number of floating dust days, BD is the number of blowing dust days, and DS is the number of dust storm days.

4. Results and Analysis

4.1. Temporal and Spatial Distribution Characteristics of Dust Weather

4.1.1. Time Variation in Dust Weather Frequency

Figure 2 shows that the number of days of dust weather in the Tarim Basin from 1989 to 2021 did not significantly decrease, although floating dust, blowing dust and dust storm did show a downward trend. This result is consistent with the trend of dust weather changes in China in recent years [20,36], but the reduction degree of different dust weather types is different. The dust weather in the Tarim Basin is dominated by floating dust, followed by blowing dust and dust storm. The change trend of floating dust and dust weather days is basically consistent. From 1989 to 2012, the number of dust weather days showed a decreasing trend, with a reduction rate of 0.84 ·a−1. The lowest number of dust weather days in 2012 was 41 days. Thereafter, there was a fluctuating upward trend, with a rate of 3.87 ·a−1. Figure 3 shows that the number of dust weather days changes obviously in several months, showing a single-peak trend that first increases and then decreases. The dust weather is concentrated from March to July, and dust weather occurs most frequently in April and May, with 10 and 9 days, respectively. There are few days of dust weather in winter, and the lowest is in December (1 days). Floating dust occurs every month, and dust storms are mostly concentrated in spring and summer, rarely in autumn and winter, especially in winter. This is due to the melting of snow in spring, low vegetation coverage and low precipitation, as well as the dry and loose soil surface, which directly provides a favourable material source for the occurrence of dust. In addition, frequent strong northwest wind cyclones in spring and unstable atmospheric stratification provide favourable dynamic conditions for the occurrence of dust weather [21,37].

4.1.2. Spatial Distribution of Dust Weather Days

The annual number of dust days in the entire Tarim basin is 60 days, including 52 days for floating dust, 21 days for blowing dust and 5 days for dust storm. Figure 4 shows that the number of days of dust weather is relatively high, mainly in Pishan, Hotan, Cele, Minfeng and Tazhong. The days of dust weather exceed 125 days, and the maximum is 156 days (in Minfeng). The loose soil on the surface of the Taklimakan Desert, as the material base, can easily produce dust weather [38,39]. The number of dust days in Shache, Luopu, Qiemo and Yutian is 100–125 days. The high value areas of these dust weather days are mainly distributed in the southern margin of the Tarim Basin and the stations in the hinterland of the desert. The area in the north near the southern foot of Tianshan Mountains has a low number of dust days at less than 50. The number of dust days in the Kashgar region in the west is slightly higher due to the influence of the westerlies. Except for several high-altitude stations near the Pamirs Plateau; the number of dust days is 75–100 days. Floating dust is the dust weather type with the highest frequency for many years. The distribution of floating dust with high frequency is similar to the spatial distribution of the total dust days. Hotan (149 days) and Minfeng (153 days) in the southern margin of the Tarim Basin have the highest floating dust frequency. Basically, floating dust exists in every dust weather. The annual average frequency of blowing dust is 0–82 days, with the highest occurrence recorded by Tazhong Station (82 days). The second highest is the line from Pishan to Ruoqiang, at which the frequency of blowing dust at most stations is 25 to 50 days. The lowest frequency of dust storms, with an annual average frequency of 0–27 days and the highest frequency of 27 days, was recorded by Minfeng Station. The frequency of three kinds of dust weather in Bayinbuluke, Baluntai, Hejing, Yanqi, Baicheng, Turgat and Tashkurgan is relatively small, and the frequency does not exceed 10 days. Particularly, Baluntai and Bayinbuluke are located on the southern slope of the Tianshan Mountains, and their special location and terrain conditions make them rarely affected by dust weather. Strong winds, dust sources and unstable weather conditions are important conditions for dust transmission, and terrain affects the airflow transmission path [10]. Affected by the topography and prevailing wind direction of the Tarim Basin, a small part of the dust is transported eastward, and most of it stays inside the basin and has greater impact on the southern edge of the basin [40].

4.2. Temporal and Spatial Distribution Change of DI

4.2.1. DI Annual Change and Monthly Change

From 1989 to 2021, the interannual change of DI in the Tarim Basin shows an overall trend of first decreasing and then increasing (Figure 5a). The DI was the lowest in 2012 (108.02) and the highest in 1994 (207), indicating a large interannual difference in DI in the Tarim Basin. From 1989 to 2012, there was a fluctuating downward trend, with a decline rate of 2.86 ·a−1. After 2012, there was a fluctuating growth trend, with an increase rate of 6.71 ·a−1. The monthly variation in DI (Figure 5b) shows a single-peak increasing first and then decreasing trend. However, due to the different proportions of each dust weather type, the monthly variation in DI and dust days are different. The DI exhibits an obvious seasonal difference; the strongest DI is 77.82 in spring, and the DI decreases in summer (56.97), autumn (18.34) and winter (7.33). The DI values in spring and summer are very high, and those from March to August are higher than the annual average DI (21.6). The Tarim Basin has frequent dust weather in spring. The surface temperature rises rapidly in spring, with a strong turbulence movement and an unstable atmospheric stratification. A strong upward movement is conducive to rolling up more dust and transporting them to higher places [41]. Dust weather occurs less frequently in autumn and winter than other seasons; the DI values recorded by most stations are very small, and some are even 0 for these times. Especially few dust storms occur in winter, resulting in the lowest DI value in the entire year.

4.2.2. DI Spatial Variation

Figure 6 shows the spatial distribution of DI in the Tarim Basin from 1989 to 2021. The spatial distribution of DI in the Tarim Basin is obviously different, and the dust intensity is generally high in the south and low in the north. The average annual DI of the Tarim Basin is 157.4. The DI values of Tazhong, Minfeng, Qiemo, Cele, Hotan and Pishan exceed 300. The highest DI is 570.12 for Minfeng, and the lowest is 2.24 for Baluntai. In addition, several stations in Kashgar have slightly high DI values, mostly exceeding 100. The distribution of the annual average DI value is basically consistent with the distribution of the dust weather frequency. The calculation of the DI value is affected by the weight of different dust weather types. The southern edge of the Tarim Basin and the hinterland of the desert are characterised by high DI. This area is located on the northern slope of the Kunlun Mountain. The river alluvium from the mountain area is weathered by wind erosion, and the underlying surface is rich in sediment. When the air flow is transported to the sky, the sand drift activity is strong. Wang’s [42] field monitoring and indoor analysis results show that the surface of Taitema Lake and the adjacent degraded land on the southeast edge of the Taklimakan Desert is the strongest area for PM10 release. The desert surface adjacent to the marginal degraded land and the surface of Pishan, Hotan, Yutian and Minfeng Gobi on the southwest edge of the desert are the sub strong areas of PM10 emission. These areas are the main sources of dust emission, which is consistent with the distribution of the high DI values.

4.3. DAOD Distribution Characteristics

Dust aerosol is suspended in the atmosphere in solid and liquid forms, with an aerodynamic particle size ≤ 10 μm [43]. When dust weather occurs, the dust aerosol concentration in the affected areas will increase greatly. Dust is superimposed by various synoptic systems of different scales under a specific large-scale circulation background and transported to the air through atmospheric turbulence. Some of the fine particles form dust aerosols, and the others are transported to a far dust fall area under the action of atmospheric horizontal transport. Wind erosion and dust weather process affect the distribution and transport of dust aerosols. Dust aerosol is the main aerosol type in Central Asia. The high value area of DAOD is in the Taklimakan Desert, Xinjiang. The frequency and intensity of dust weather are the main factors affecting the dust aerosol concentration in desert areas. Figure 7 shows a significant positive correlation between the annual average DAOD of 44 stations and the number of dust days and DI, and the correlation coefficients are 0.814 and 0.733, respectively, passing the significance test at 0.01 level. The DAOD increases with the dust weather frequency. However, due to the different influences of different dust weather types, the impact on the DAOD in the atmosphere is also different. The weight of the DI index to different dust weather types is different. The floating dust particles are smaller than the blowing dust, the small particles are likely to be carried up by the wind, resulting in an increase in aerosol concentration, and the coarse particles will settle due to gravity. During blowing dust and dust storm, the wind speed is high, and coarse particles are lifted and suspended in the atmosphere. Dust storms are especially strong and fast, and not only affect the air quality of the place where they occur, but may also cause high DAOD in the atmosphere of downwind areas. Dust storms are often accompanied by floating dust weather.
Figure 8a shows that the DAOD of the Tarim Basin is between 0.03 and 0.39, with an average value of 0.21. Dust aerosols are widely distributed throughout the entire basin, except for the surrounding mountains. The high DAOD value is mainly distributed in the line from Pishan to Minfeng in the south of the Tarim Basin, and Ruoqiang in the east and the surrounding areas. This is consistent with the high-frequency regional distribution of dust weather. The DAOD exhibits an obvious seasonal change (Figure 8b–e), i.e., spring (0.31) > summer (0.21) > autumn (0.13) > winter (0.1). In spring, the temperature begins to rise, the solar radiation increases, the air dries after the snow melts and the soil moisture decreases and gradually loosens under the action of wind. Meanwhile, the dust storm weather begins to rage, and the wind erosion is fierce. The wind sand flow carries many dust particles into the oasis area that finally settle on the surface. The DAOD value of the entire basin is relatively high in spring, especially in Hotan, Ruoqiang, Aksu in the north and the surrounding areas. The ratio of dust aerosol in summer to that in spring is significantly reduced, but more convective activity occurs in summer, which is conducive to the upward and remote transport of dust. The dry lake basin sediments of Taitema Lake provide a rich material base, making the DAOD in the surrounding areas high. In autumn and winter, the wind erosion activity is greatly weakened, especially in winter when the temperature is low and the underlying snow cover does not easily cause dust. The entire basin has little dust in the east.

5. Discussion

5.1. Surface Dust Distribution

Dust is a natural phenomenon in which the wind lifts the dust on the surface into the air, causing a sharp increase in the number of suspended particles in the near-ground atmosphere. The three processes of wind erosion, dust weather and aerosol mainly occur in desert and arid areas, and they complement and affect each other. The dust sources in Northwest China are mainly the marginal desert rich in dust and the Gobi ecotone at the edge of an alluvial–proluvial fan that contains dry riverbeds, dry lakes and degraded oasis lands. These areas have a high content of fine material components that easily release dust particles and spread and deposit to the surrounding surface through the local circulation process [44]. Under certain weather conditions, the dust in the Taklimakan Desert can be lifted to a height of 10 km. In spring and summer when the dust activity is most frequent, a large amount of dust can be lifted from the bottom of the Tarim Basin along the Kunlun Mountains to the Qinghai–Tibet Plateau [45]. The dust above the Tarim Basin is distributed on the ‘global dust transport belt’ that is also a typical source of dust [46,47]. The maximum frequency of dust usually appears on the near-surface and decreases with the increase in the height [48]. Figure 9 shows that the average annual DUSMASS of the Tarim Basin from 1989 to 2021 is 180.25 μg·m−3, ranging from 14.66 μg·m−3 to 482.26 μg·m−3. The DUSMASS exhibits a significant seasonal change, i.e., spring (260.14 μg·m−3) > summer (193.44 μg·m−3) > autumn (139.11 μg·m−3) > winter (128.32 μg·m−3). The centre of high DUSMASS values in spring is in the east of the Taklimakan Desert, and the high value covers most areas of the desert. In summer, the DUSMASS decreases significantly, and the area of the high value central area decreases greatly to the east. The high value centre disappears in autumn and winter, and the DUSMASS is greatly reduced. Influenced by the characteristics of the wind field near the surface, the DUSMASS has obvious regional characteristics.
In recent years, the climate has been dry, coupled with the unreasonable use of human water resources and vegetation damage, leading to the cut-off of the Tarim River and other inland rivers, the drying of lakes at the lower reaches of the river and serious land desertification [49]. In the east of the desert and its edge, strong degraded surface dust activity occurs near the Taitema Lake, where a high concentration centre of surface dust exists throughout the year. Under the action of east and northeast winds, this area can supply dust in the Ruoqiang and Minfeng areas of the southeast edge of the desert because the air flow from the direction of Lop Nur enters the desert hinterland, forming a ‘backward easterly wind’. The strong wind force, coupled with the thermal effect of the desert itself, causes the dust storm activity to move from the edge of the desert to the hinterland [50]. However, Shache and Alar on the northwest edge, as well as Luntai, Korla and Tieganrik on the northeast edge, are located in the upwind direction of the dominant wind, with weak near-surface dust activity and less contribution to dust. Wang [42] believes that the concentration of fine particles in the desert sand at the edge of the Taklimakan Desert is much higher than that in the hinterland of the desert during wind and sand activities because the desert hinterland can provide extremely few fine particles that can be transported remotely under the same background of wind and sand activities. The line from Pishan to Minfeng on the southwest edge of the desert is the Gobi surface of the alluvial fan in front of the Kunlun Mountains. The PM10 content on the surface is high, contributing greatly to the dust material in the dust activity. However, the dust release capacity is not only affected by the content of fine particles on the surface but also greatly limited by the intensity of windblown sand activity. In addition, the emission intensity of sand dust is significantly affected by factors such as sediment particle size composition, atmospheric circulation, topography and vegetation coverage [51]. Wei et al. [52] studied the grain size of desert surface sediments in northern China and found that the Taklimakan Desert has the finest surface sediments, with clay and silt contents of 6.7%. The total amount of dust emission in the Taklimakan Desert can reach 14.4 Tg y−1, which contains a large number of clay particles, providing a sufficient material basis for dust emission. However, the grain size composition of the Taklimakan Desert varies greatly from place to place. Sun et al. [53] found that in the north of the Taklimakan Desert, the amount of fine materials released is large, and the underlying surface features are relatively consistent, i.e., the surface is compact with a salt crust, flat and open, with a sparse vegetation coverage, and the surface sediment particles are fine. However, the coarse sand cover near the southern edge of the desert does not reduce the content of fine particles in the dust fall, perhaps because the easterly flow transported the fine particles on the surface of the ancient river channel in the southeast of the desert and the alluvial–proluvial fan at the foot of the Kunlun Mountains. Vegetation plays an important role in controlling the sand transported by wind in the Tarim Basin. In the vast oases in the north, vegetation significantly reduces the aeolian transport, but vegetation cannot completely eliminate dust transport [54]. This phenomenon also shows that the sand fraction of the sand dune sediments in the Taklimakan Desert is mainly from the Kunlun Mountains and not the Tianshan Mountains [55]. Wandionetal et al. [56] and Zhang et al. [57] also confirmed that the Taklimakan Desert is the main source of local dust, but the surrounding high mountains block the dust from flowing out of the basin, resulting in most of the dust deposition, so the dust discharged from the desert is mainly local. Only when the dust in the basin floats to a higher level can it become an important factor in long-term dust transport.

5.2. Influence of Wind on Dust Distribution

Wind is one of the basic forces that shape the landform and is also the dynamic basis of sand movement. The near-surface wind that causes sand movement always has turbulent characteristics [58]. The air pressure difference causes the air mass to move. The air mass moves from the high-pressure area to the low-pressure area. The greater the air pressure difference is, the greater the horizontal pressure gradient force and the wind force are. Wind intensity is a significant factor affecting dust emission, transportation and deposition. A direct linear correlation exists between the change in extreme wind speed and dust deposition [59]. The interannual variation in wind is the most important factor affecting the dust concentration in China. The strong wind behind the cold front caused by atmospheric circulation activities plays the most direct and important role in the occurrence of dust weather [60,61]. In the year when the East Asian monsoon was weakest, the strong northwest wind and westerly anomaly over the Gobi and Taklimakan deserts resulted in a large transport flux, thus increasing the dust concentration over China [62].
The wind speed of sand rising in the Tarim Basin is 6 m/s [63]. This paper classed gale weather as having a wind speed greater than 6 m/s and a duration of more than 12 h. Figure 10 shows the occurrence frequency and multi-year average wind speed of gale weather under these conditions. It can be seen from the figure that the frequency of gale weather for many years presents a stepwise decreasing trend from northeast to southwest. The most frequent gale weather is in the northeast. The frequency of gale weather is low at the southern foot of the Northern Tianshan Mountains, the northern foot of the Southern Kunlun Mountains and the Pamirs Plateau. This distribution is basically consistent with the spatial distribution of the DP and RDP of Sun and Gao [64]. The annual average wind speed and frequency distribution of gale weather are different, but the high average wind speed occurs at the tuyere in the northeast of the desert, followed by the Hotan area in the south of the basin and the edge of the desert. Whether from the frequency or intensity of strong wind weather, wind erosion in the eastern region is very strong. The unique geographical position of the Taklimakan Desert leads to the unique upper air circulation situation, determining the characteristics of the near-surface wind field. From the perspective of the planetary wind system, the upper air circulation in the Taklimakan Desert is mainly affected by the mid-latitude westerly belt. However, it is surrounded by mountains on three sides, and the impact of the Qinghai–Tibet Plateau leads to the destruction and reconstruction of the latitudinal circulation. The entire desert is mainly affected by the northeast and northwest wind systems. The east wind and northeast winds are strong, and the affected area is mainly the east of the desert, while the north is less affected by dust [65]. The direction and intensity change of the near-surface wind field is also related to the great difference in the thermal properties between the desert and the surrounding different underlying surfaces. In particular, the desert becomes a huge heat source in summer, forming a large temperature gradient with the edge areas, leading to the convergence trend of the surrounding wind system with the desert hinterland and the gradual increase in this process [66]. In spring and summer, the wind generated by the hot low pressure formed in the Taklimakan Desert and the invading cold air is the dynamic condition for the formation of dust weather. The cold high pressure enters the Southern Xinjiang basin from the Pamirs plateau, making the surface uneven in heat and cold and forming a westerly wind in the Southern Xinjiang basin. In recent years, the dust weather in Hotan has shown a decreasing trend, mainly because the temperature has increased year by year, the cold air invading from the Pamirs has decreased, and the weakening of the low pressure in Xinjiang has led to the reduction of the westerly wind in the Tarim Basin, decreasing the dust weather [67]. The seasonal variation in dust aerosols in the Tarim Basin is similar to that in the Aral Sea region, mainly because they are at the same latitude. The frequent occurrence of mineral dust and salt dust is caused by the cyclone activity and strong wind weather in spring [68]. The impact of wind on dust is complex and dynamic, rather than a simple linear relationship. In future research, we should further study the relationship between wind and dust release in a single dust event and intensively discuss the interaction between various meteorological factors in the process of dust weather to provide a theoretical basis for wind–sand control and prevention in arid and semi-arid regions.

6. Conclusions

The Tarim Basin has frequent dust weather which is one of the important sources of global dust release. On the basis of the dust weather observation data of 44 surface meteorological stations in the Tarim Basin from 1989 to 2021, this paper analyses the temporal and spatial characteristics of the sand dust weather over the past 33 years in the Tarim Basin and discusses the relationship between dust weather and the DAOD, DUSMASS and wind speed data. The results are as follows:
(1)
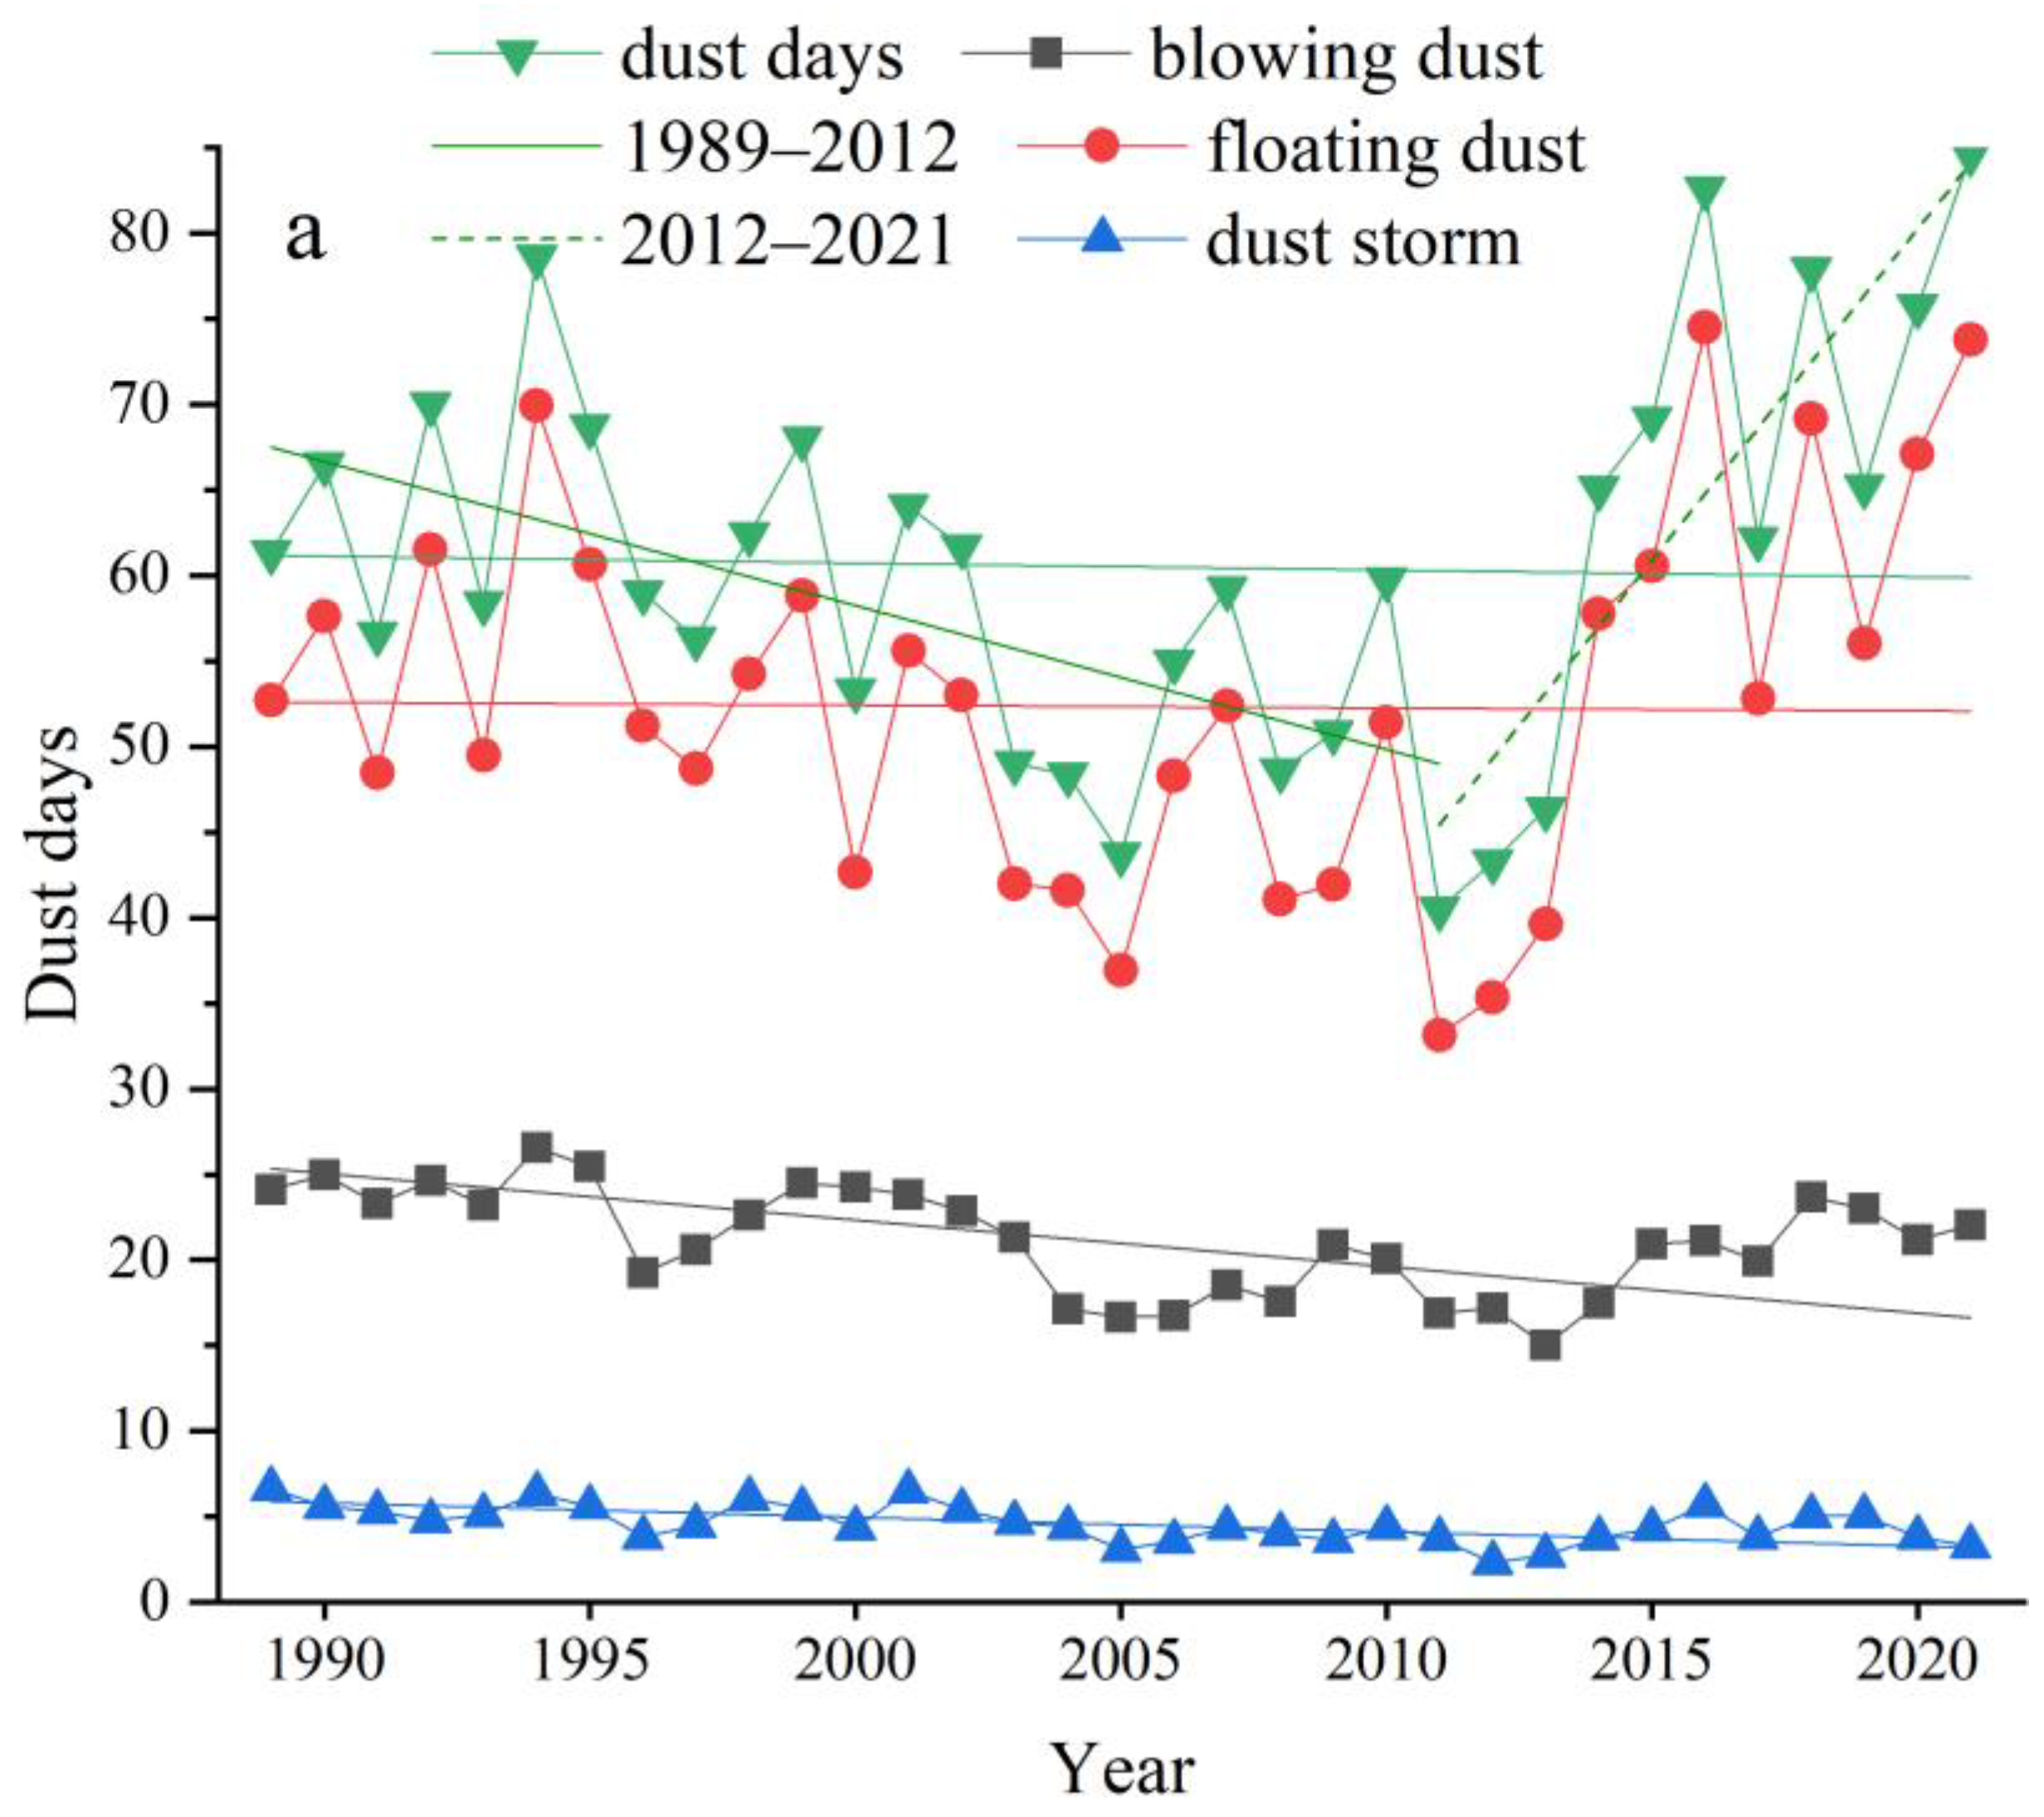
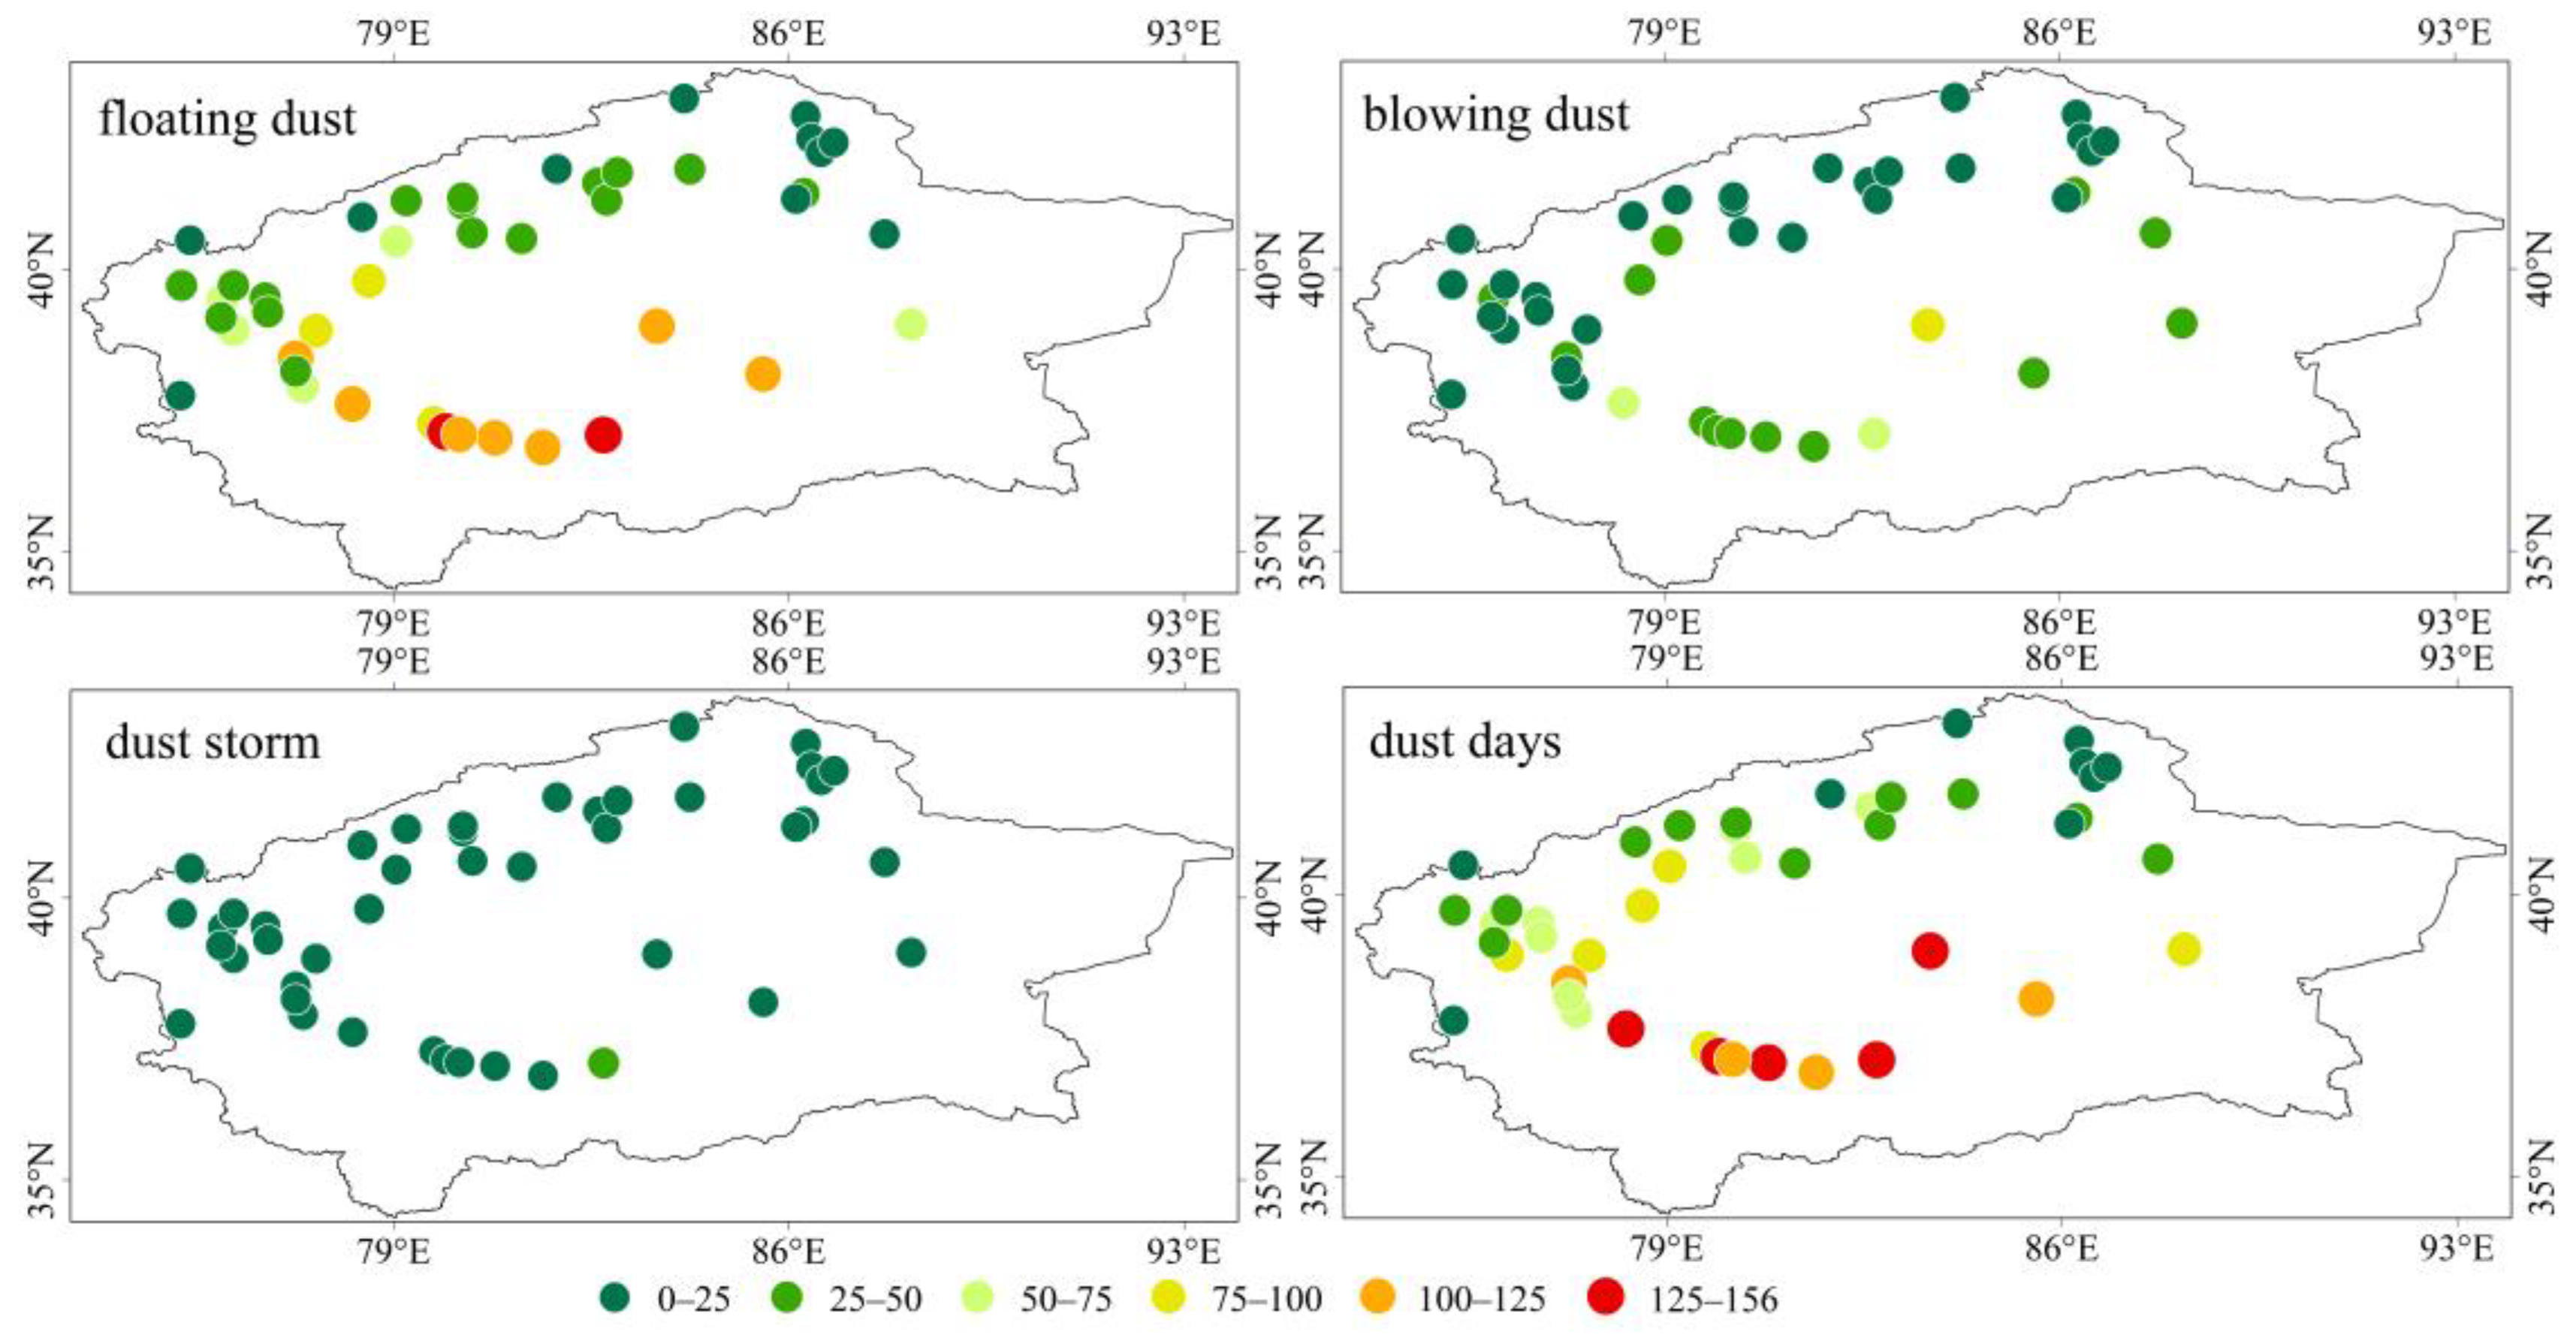
From 1989 to 2021, on average, there were 60 dust days/year in the Tarim Basin. The dust weather is mainly composed of floating dust, followed by blowing dust and dust storms. The interannual variation in different types of dust weather frequency shows a downward trend. In terms of spatial distribution, the dust weather in the Tarim Basin is mainly distributed in the southern edge of the basin and Tazhong Station in the hinterland of the desert, showing a spatial pattern of more in the south and less in the north.
(2)
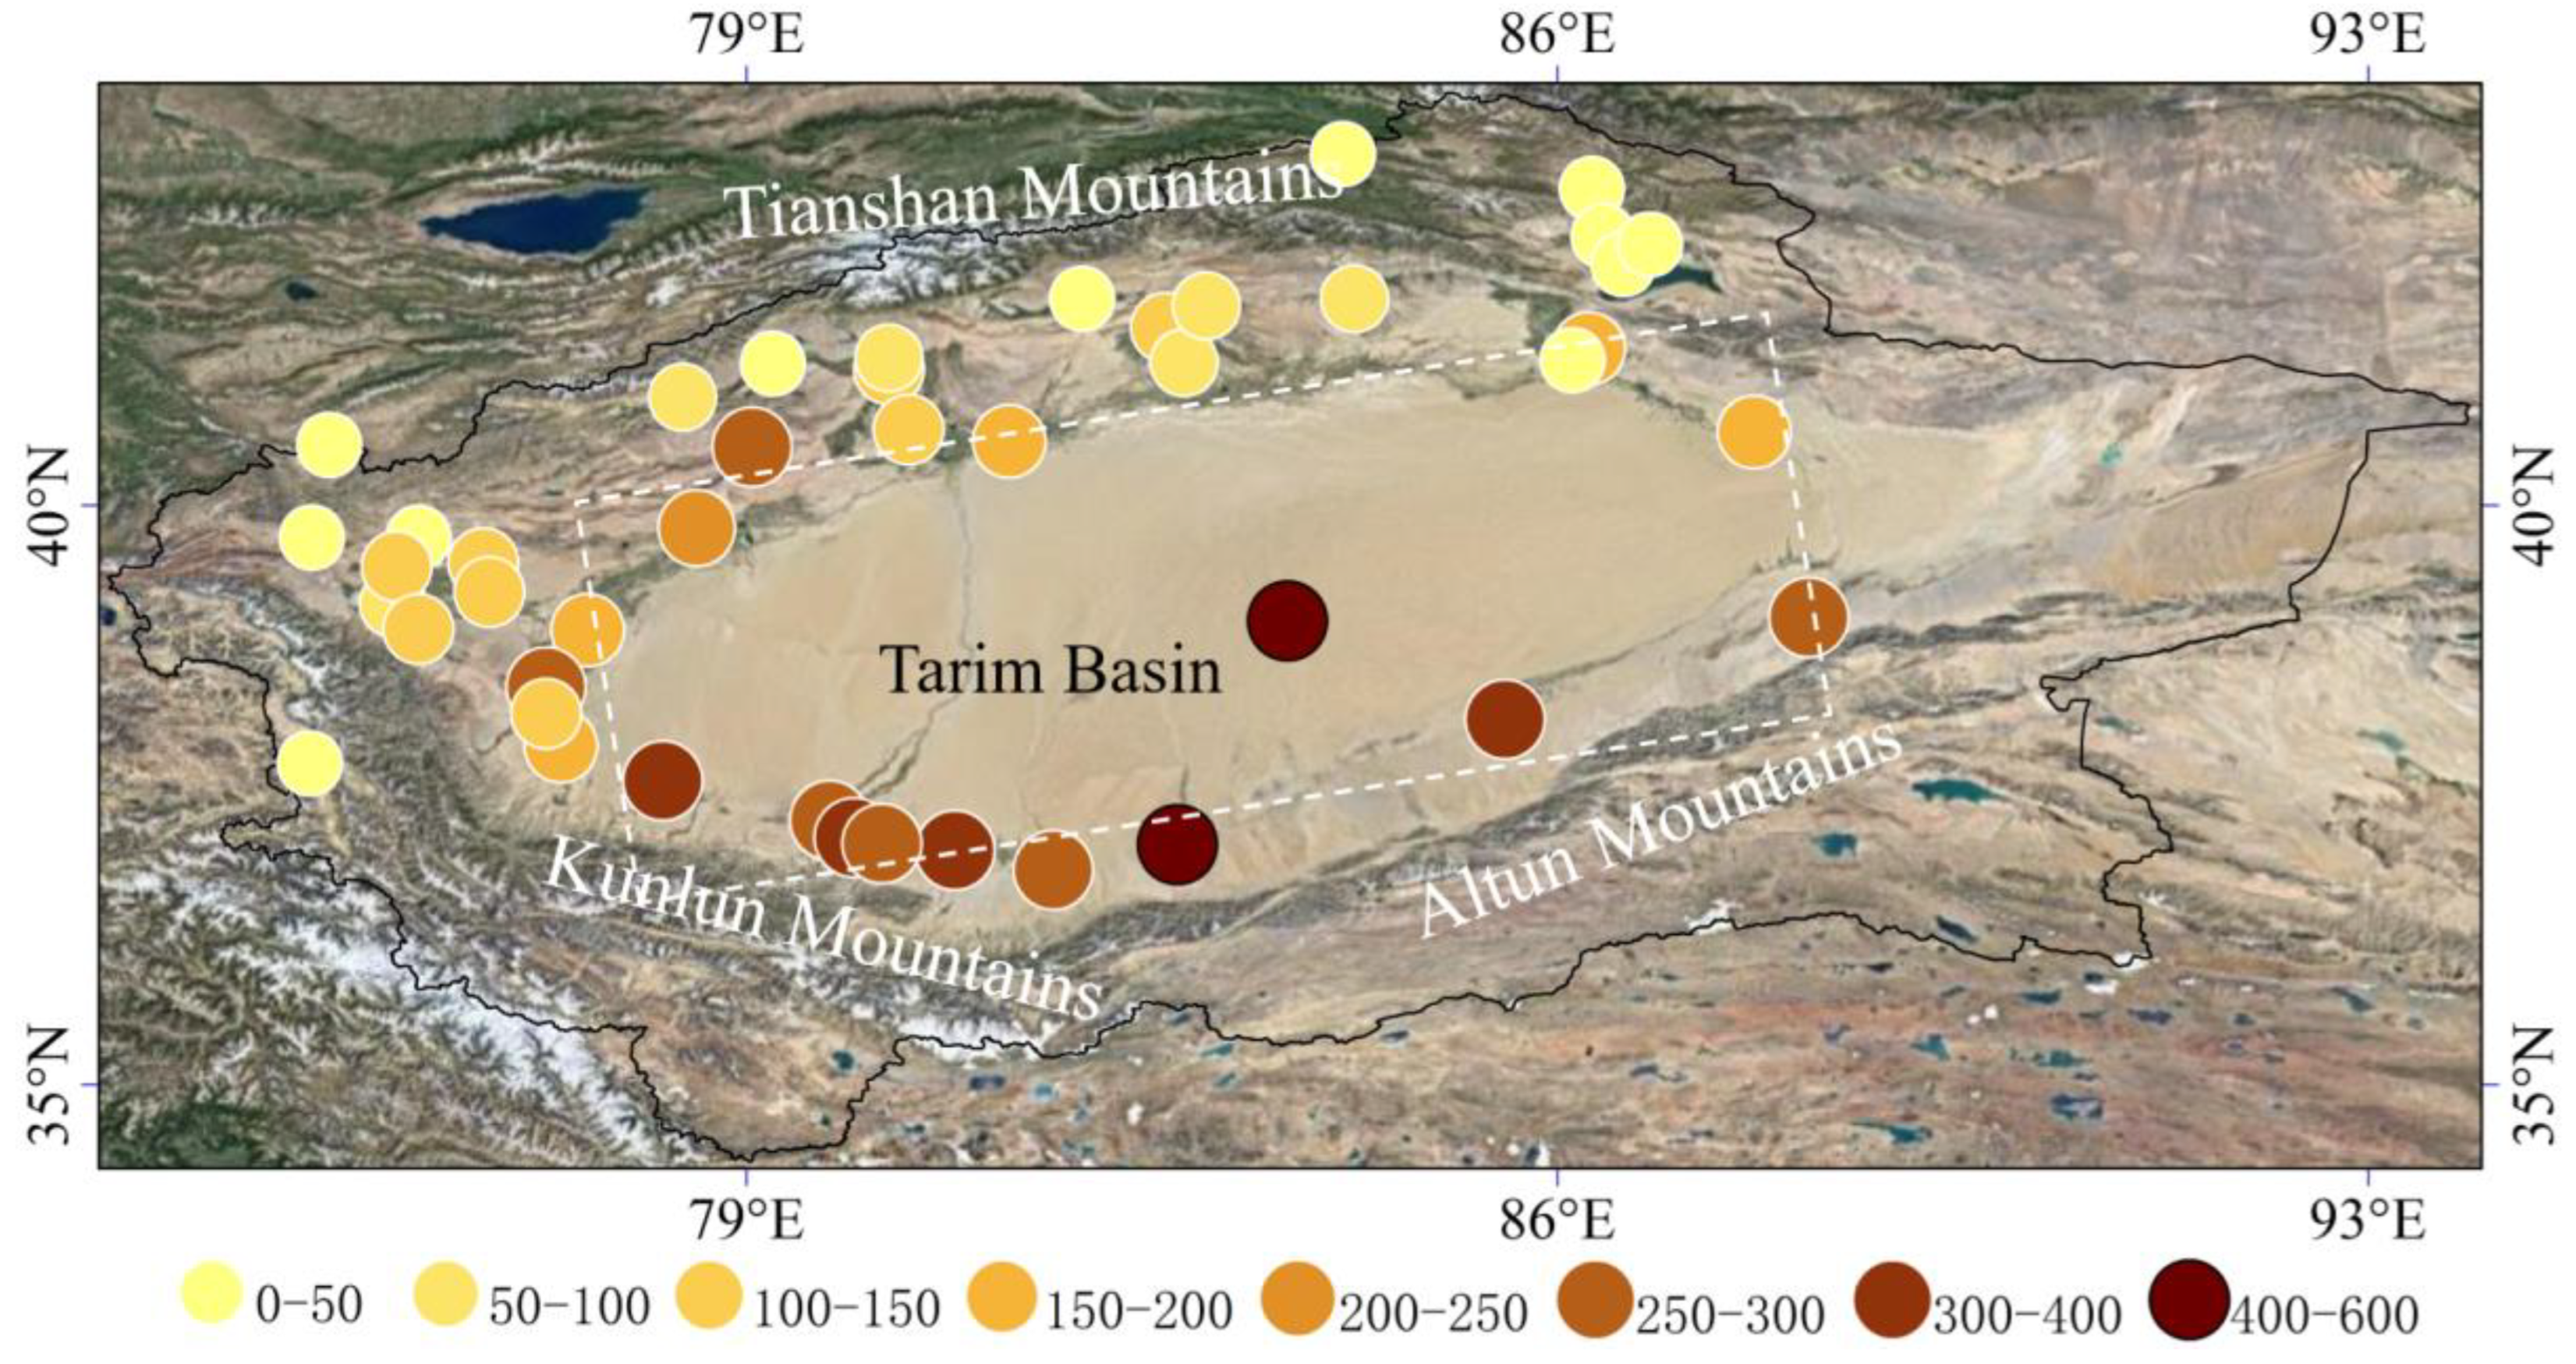
The interannual variation in DI shows no significant downward trend, and the spatial distribution of DI is basically consistent with that of dust weather days. The high-value area is mainly located in the line from Pishan to Ruoqiang and Tazhong in the south, while the DI value in the north is relatively low. The DI values have an obvious seasonal difference, i.e., spring (77.82) > summer (56.97) > autumn (18.34) > winter (7.33), and the DI values of most stations in autumn and winter are less than 20.
(3)
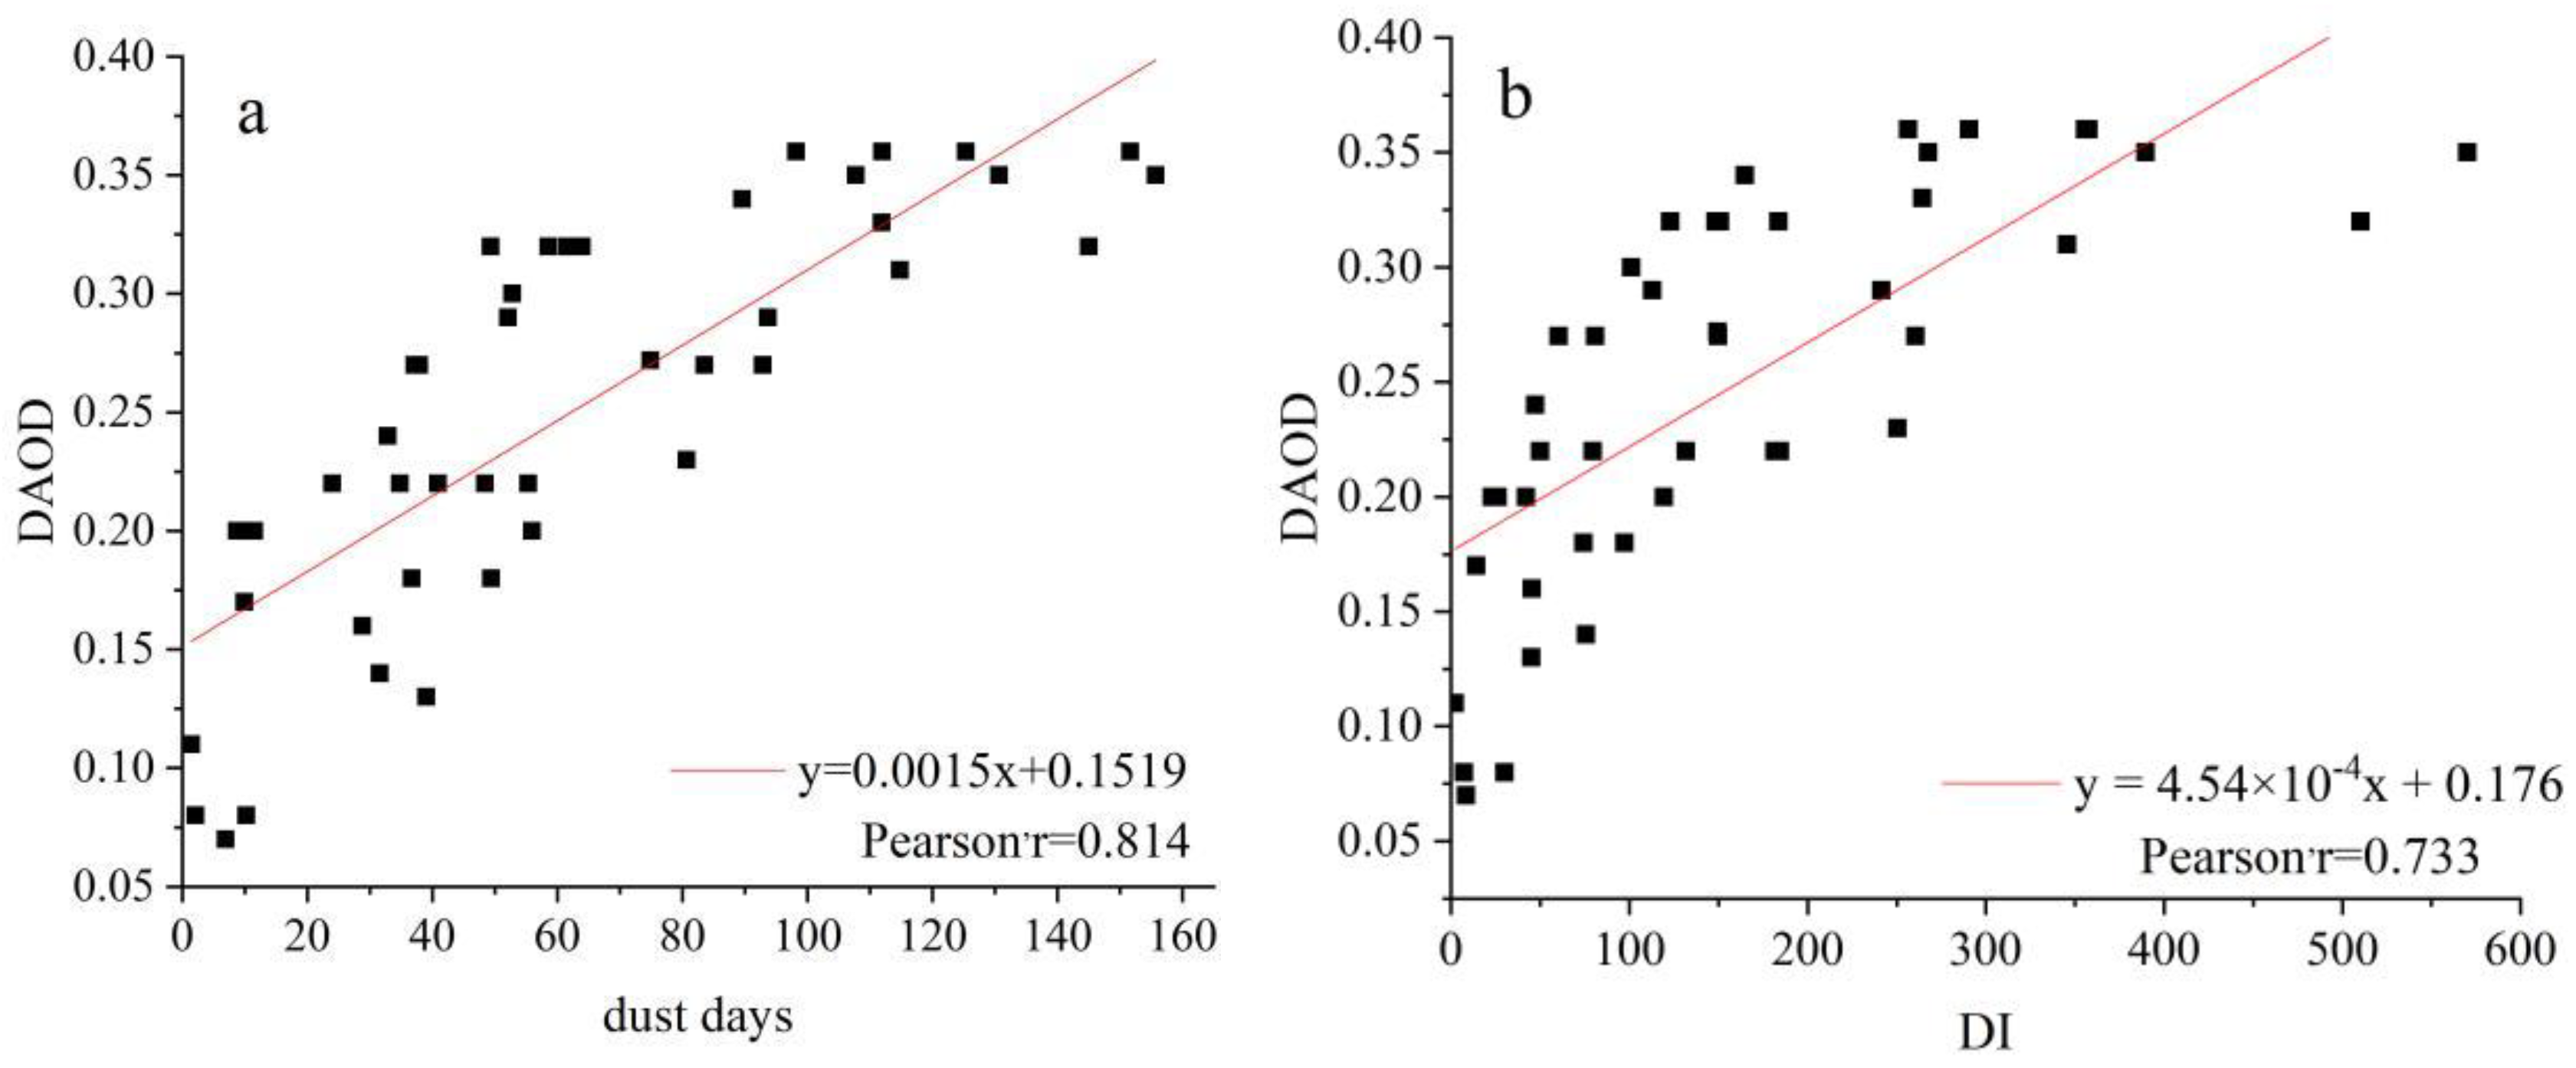
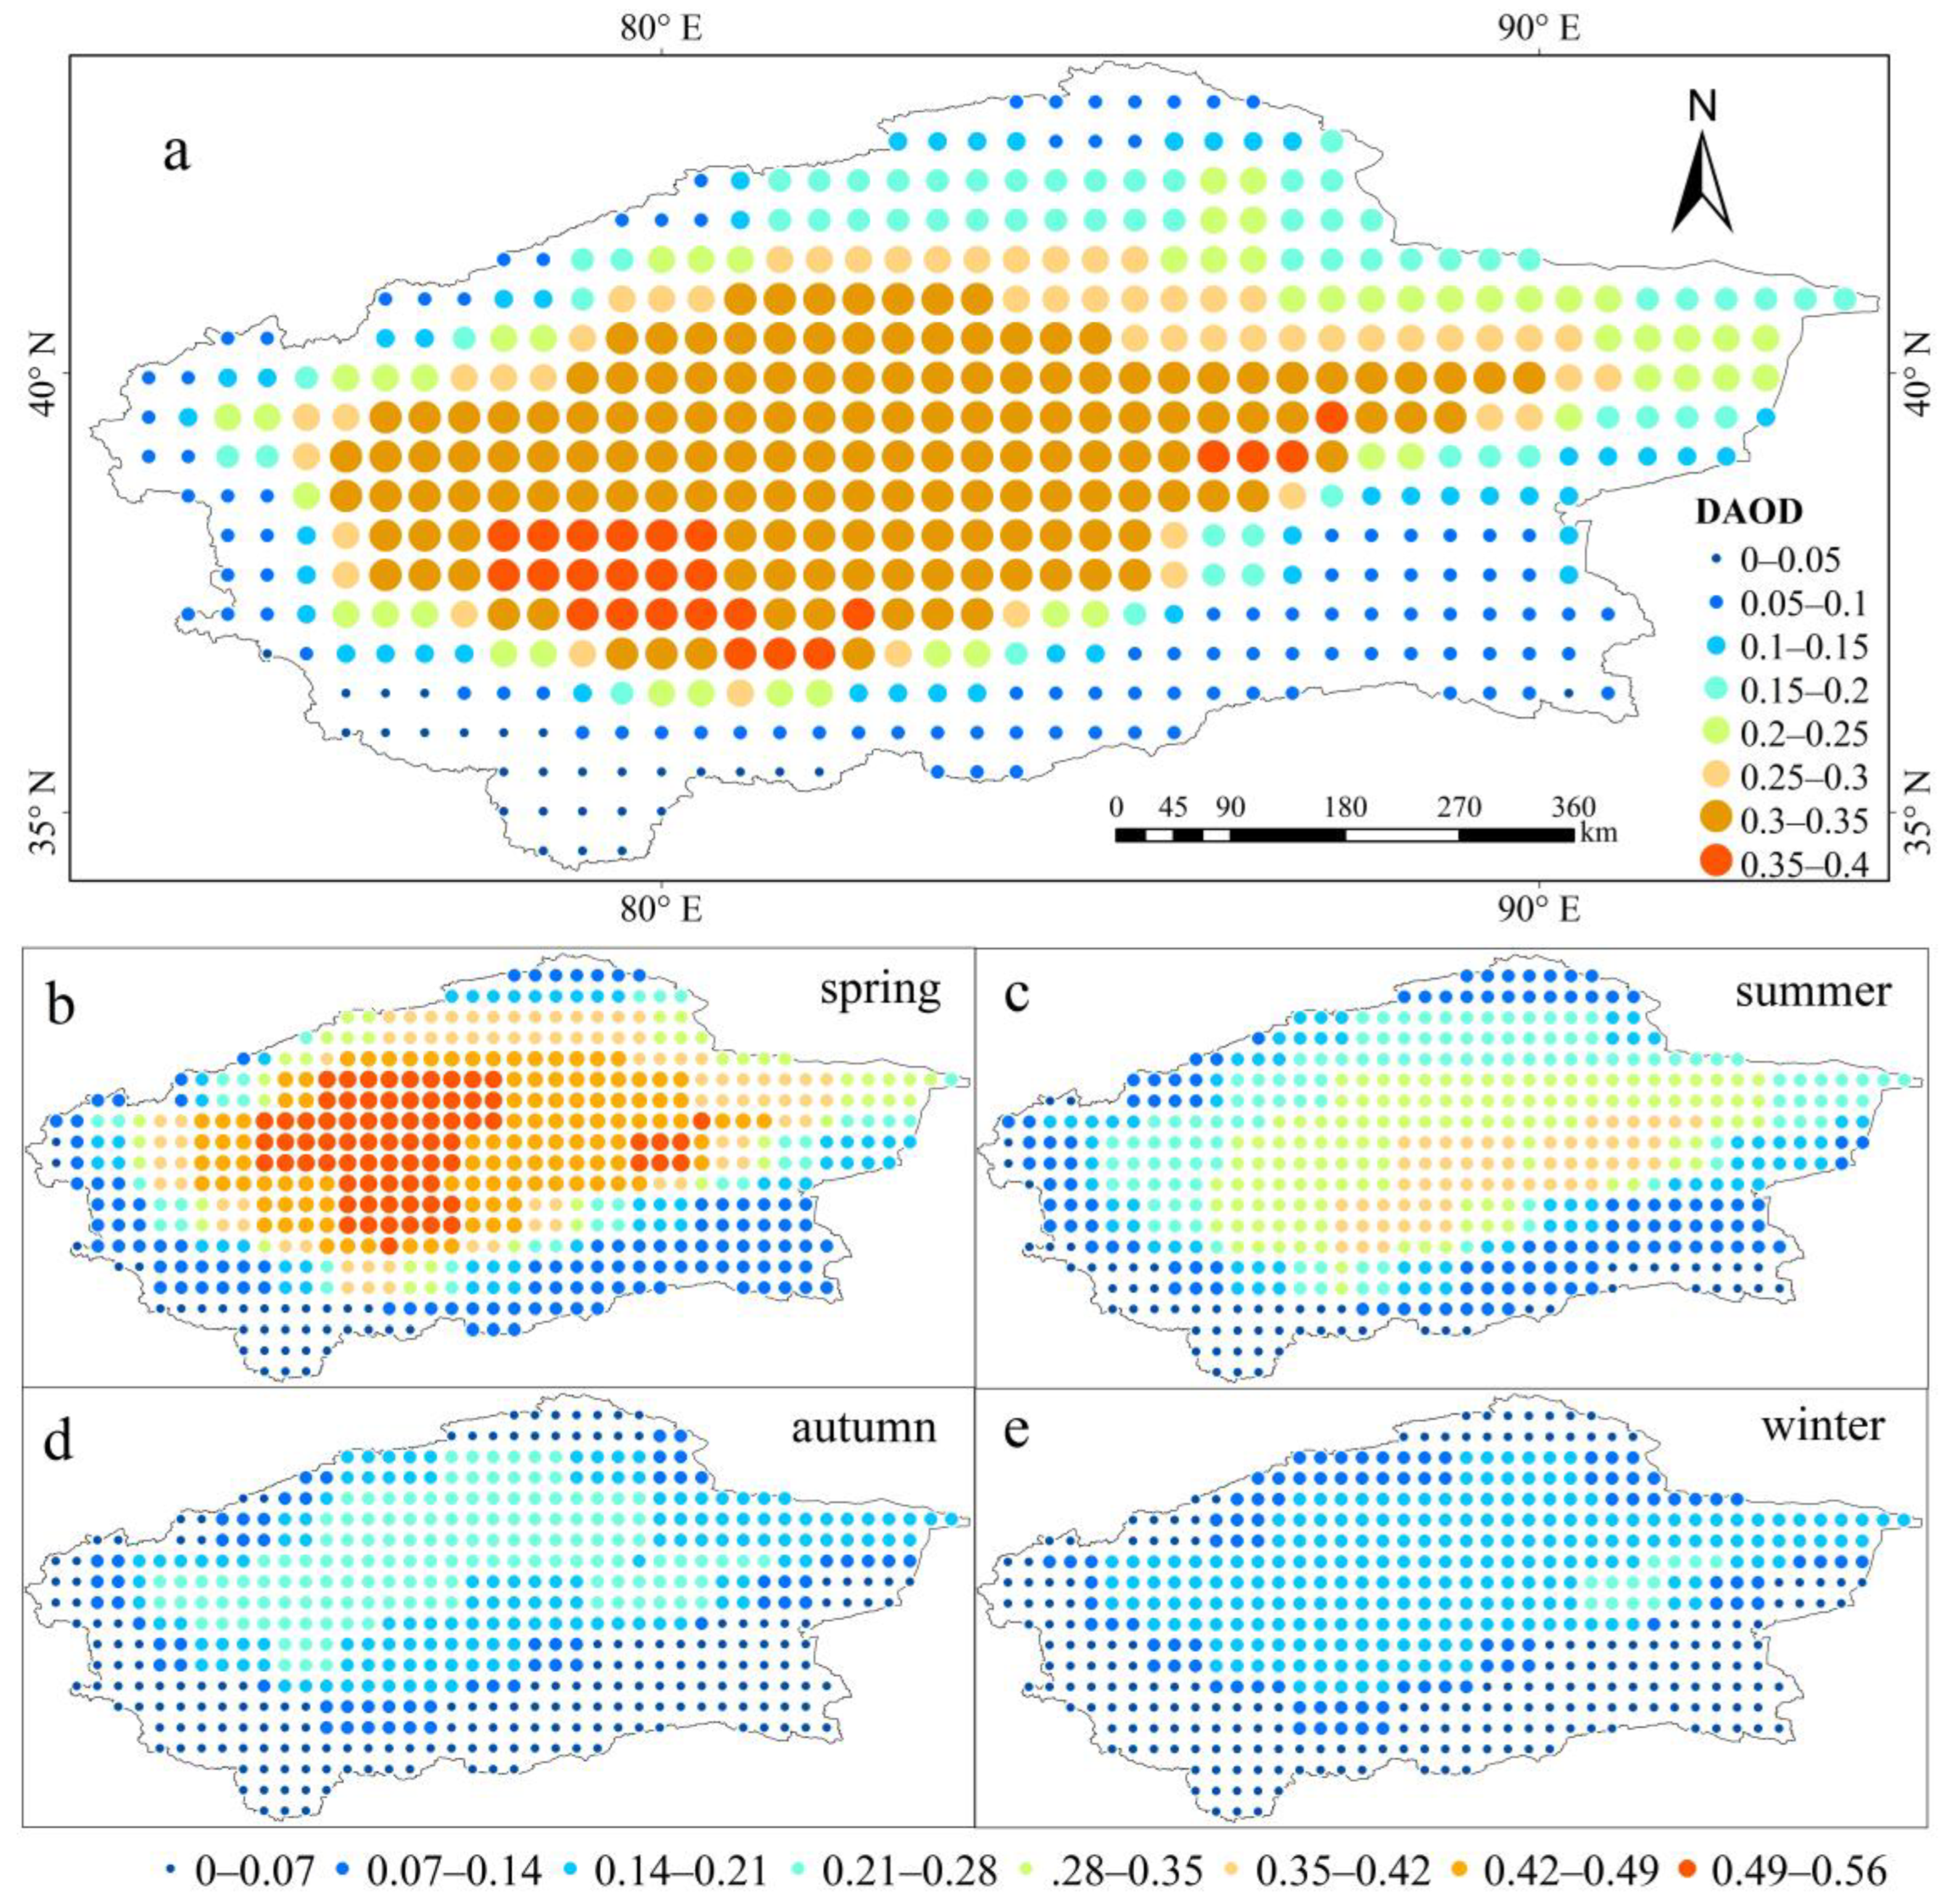
The DAOD in the Tarim Basin is obviously affected by dust weather and has a significant correlation with the dust weather days and the DI. The strong wind–sand activity in spring makes the DAOD of the entire basin generally high, especially in the Hotan area in the south of the basin, and Aksu and the surrounding areas in the north. In addition, the dry lake basin of the Eastern Taitma Lake provides a rich material base, making the DAOD of its surrounding areas high. The DAOD data have strong time continuity and a wide distribution range, compensating for the shortage of ground dust observation data.
(4)
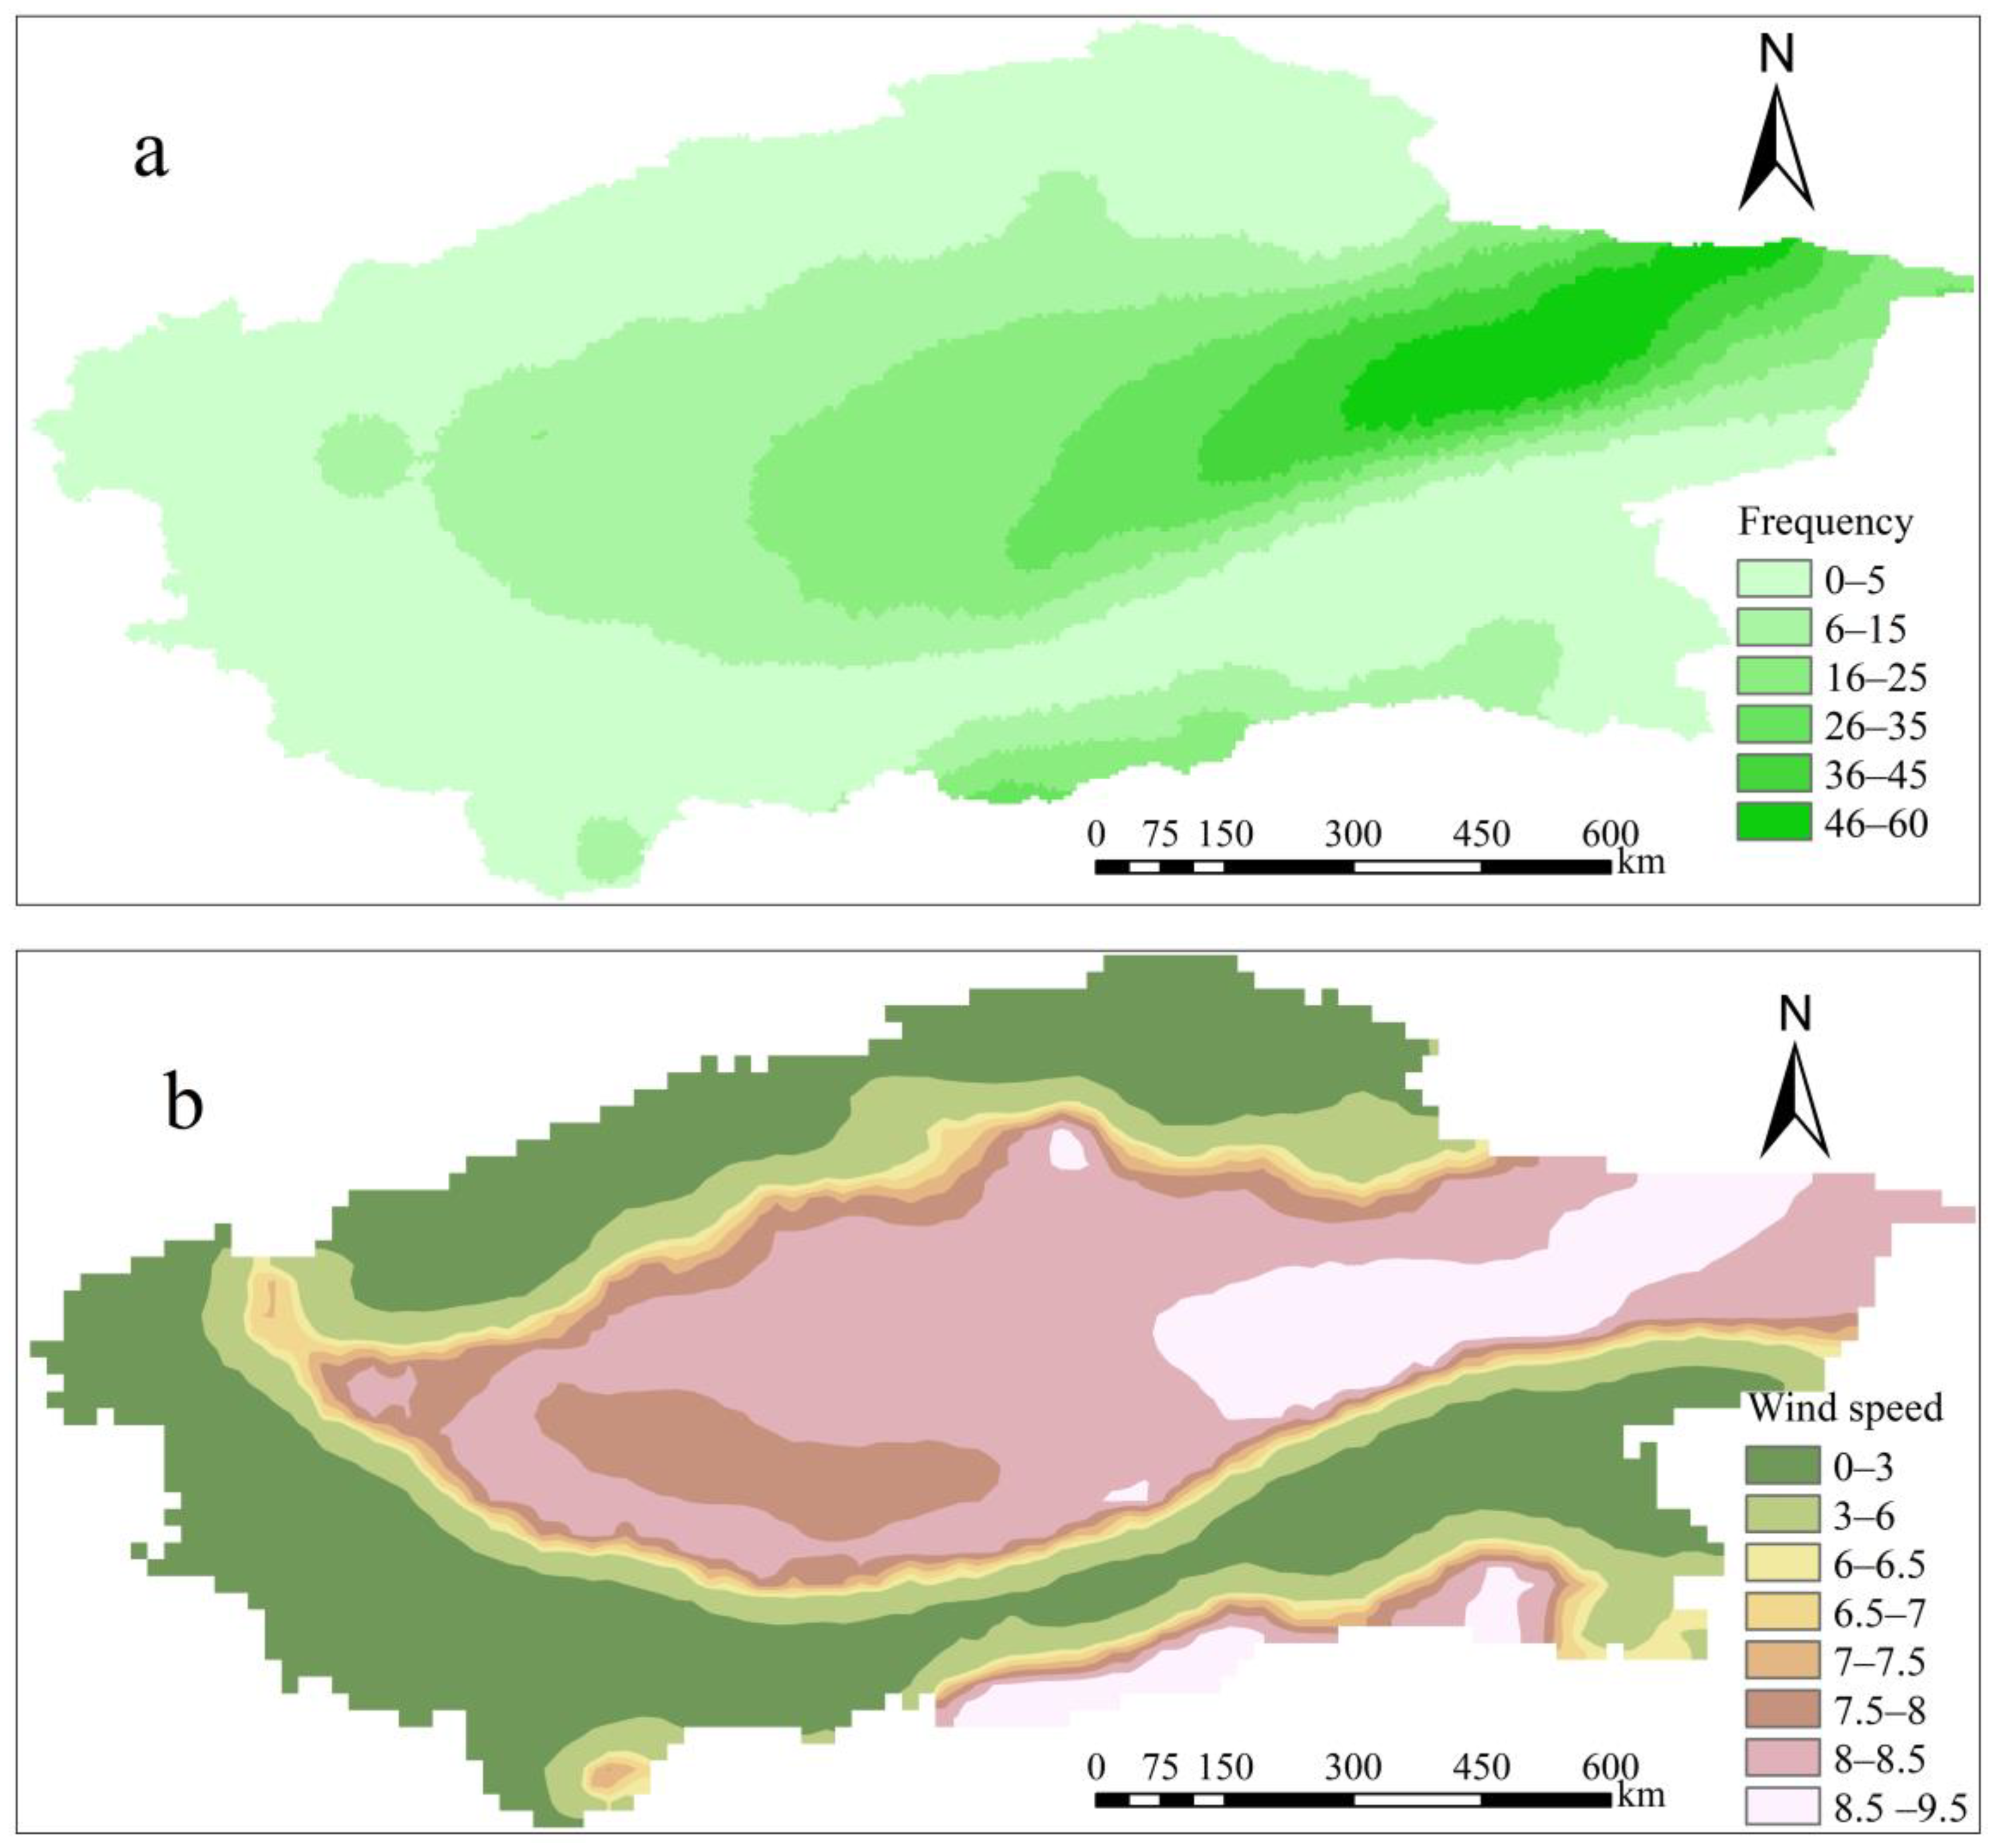
The DUSMASS is affected by many factors, such as terrain and atmospheric circulation, and its high value decreases from the east of the Taklimakan Desert to the hinterland of the desert. Wind is one of the important factors affecting the release of dust. The distribution of the gale weather frequency is similar to that of the DUSMASS, showing a stepwise decreasing trend from northeast to southwest. A high average wind speed was recorded in the northeast of the desert, followed by the southern edge of the basin.

Author Contributions

Y.Z.: Data curation, Methodology, Writing—original draft. X.G.: Conceptualization, Supervision, Writing—review and editing, Project Administration. J.L.: Supervision, Visualization. All authors have read and agreed to the published version of the manuscript.

Funding

This study was supported by the Third Xinjiang Scientific Expedition and Research Program—Investigation and Risk Assessment of Drought and Aeolian Disasters in Tarim River Basin (No. 2021xjkk0300).

Conflicts of Interest

The authors declare that they have no known competing financial interests or personal relationships that could have influenced the work reported in this paper.

Appendix A

Table A1. Surface meteorological station information.
StationLongitudeLatitudeStationLongitudeLatitude
Wushi79.2341.22Tazhong83.6739.00
Akesu80.2341.17Tieganlike87.740.63
Wensu80.2341.27Ruoqiang88.1739.03
Baichen81.9041.78Qiemo85.5538.15
Xinhe82.6241.53Pishan78.2837.62
Shaya82.7841.23Cele80.8037.02
Kuche82.9741.72Moyu79.7237.28
Keping79.0540.50Hetian79.9337.13
Awati80.4040.65Luopu80.1737.08
Alaer81.2740.55Minfeng82.7237.07
Baluntai86.3042.73Yutian81.6536.85
Bayinbuluk84.1543.03Tuergate75.4040.52
Hejing86.4042.32Jiashi76.7339.50
Yanqi86.5742.08Hashi75.9839.47
Heshuo86.8042.25Bachu78.5739.80
Luntai84.2541.78Yuepuhu76.7839.25
Yuli86.2741.35Yingjisha76.1738.93
Kuerle86.1341.25Tashikuergan75.2337.77
Atushi76.1739.72Maigaiti77.6338.92
Wuqia75.2539.72Shache77.2738.43
Aketao75.9539.15Yecheng77.4037.92
Aheqi78.4540.93Zepu77.2738.20

References

  1. Liu, Z. The Occurrence and Development of Sand and Dust Weather in the Typical Area of Southern Xinjiang, China. Master’s Thesis, Shihezi University, Xinjiang, China, 2016. [Google Scholar]
  2. China Meteorological Administration. Specifications for Ground Meteorological Observation; Meteorological Publishing House: Beijing, China, 1979; pp. 21–27.
  3. Tegen, L.; Lacis, A.A.; Fung, L. The influence on climate forcing of mineral aerosols from disturbed soil. Nature 1996, 380, 419–422. [Google Scholar] [CrossRef]
  4. Zhu, B.-Q.; Zhang, J.-X.; Sun, C. Potential links of gobi, dust, and desertification: A comprehensive understanding from aeolian landform evolution in a middle-latitude desert. Sediment. Geol. 2021, 428, 106049. [Google Scholar] [CrossRef]
  5. Kang, J.-H.; Liu, T.-C.; Keller, J.; Lin, H.-C. Asian dust storm events are associated with an acute increase in stroke hospitalisation. J. Epidemiol. Community Health 2013, 67, 125–131. [Google Scholar] [CrossRef]
  6. Karagulian, F.; Temimi, M.; Ghebreyesus, D.; Weston, M.; Kondapalli, N.K.; Valappil, V.K.; Aldababesh, A.; Lyapustin, A.; Chaouch, N.; Al Hammadi, F.; et al. Analysis of a severe dust storm and its impact on air quality conditions using WRF-Chem modeling, satellite imagery, and ground observations. Air Qual. Atmosphere Health 2019, 12, 453–470. [Google Scholar] [CrossRef]
  7. Sokolik, I.N.; Toon, O.B. Direct radiative forcing by anthropogenic airborne mineral aerosols. Nature 1996, 381, 681–683. [Google Scholar] [CrossRef]
  8. Huang, J.; Minnis, P.; Yan, H.; Yi, Y.; Chen, B.; Zhang, L.; Ayers, J.K. Dust aerosol effect on semi-arid climate over Northwest China detected from A-Train satellite measurements. Atmos. Chem. Phys. 2010, 10, 6863–6872. [Google Scholar] [CrossRef]
  9. Chen, X.; Ding, J.; Liu, J.; Wang, J.; Ge, X.; Wang, R.; Zuo, H. Validation and comparison of high-resolution MAIAC aerosol products over Central Asia. Atmos. Environ. 2021, 251, 118273. [Google Scholar] [CrossRef]
  10. Sun, J.; Zhang, M.; Liu, T. Spatial and temporal characteristics of dust storms in China and its surrounding regions, 1960–1999: Relations to source area and climate. J. Geophys. Res. Atmos. 2001, 106, 10325–10333. [Google Scholar] [CrossRef]
  11. Uno, I.; Amano, H.; Emori, S.; Kinoshita, K.; Matsui, I.; Sugimoto, N. Trans-Pacific yellow sand transport observed in April 1998: A numerical simulation. J. Geophys. Res. Atmos. 2001, 106, 18331–18344. [Google Scholar] [CrossRef]
  12. Chun, Y.; Boo, K.-O.; Kim, J.; Park, S.-U.; Lee, M. Synopsis, transport, and physical characteristics of Asian dust in Korea. J. Geophys. Res. Atmos. 2001, 106, 18461–18469. [Google Scholar] [CrossRef]
  13. Luo, X.; Zhang, Y. The Linkage between Upper-Level Jet Streams over East Asia and East Asian Winter Monsoon Variability. J. Clim. 2015, 28, 9013–9028. [Google Scholar] [CrossRef]
  14. Zheng, X.; Kang, D.; Yang, X.; Yang, F.; He, Q. Statistical Analysis of Dust Weather Frequency in Taklamakan Desert. Environ. Sci. Manag. 2021, 46, 133–137. [Google Scholar]
  15. Tan, Z.; Liu, Y.; Zhu, Q.; Bi, J. Effect of dust aerosols on the heat exchange over the Taklimakan Desert. Atmos. Environ. 2022, 276, 119058. [Google Scholar] [CrossRef]
  16. Gao, H.; Washington, R. The spatial and temporal characteristics of TOMS AI over the Tarim Basin, China. Atmos. Environ. 2009, 43, 1106–1115. [Google Scholar] [CrossRef]
  17. De Meij, A.; Bossioli, E.; Penard, C.; Vinuesa, J.; Price, I. The effect of SRTM and Corine Land Cover data on calculated gas and PM10 concentrations in WRF-Chem. Atmos. Environ. 2015, 101, 177–193. [Google Scholar] [CrossRef]
  18. Sujitha, P.; Santra, P.; Bera, A.; Verma, M.; Rao, S. Detecting dust loads in the atmosphere over Thar desert by using MODIS and INSAT-3D data. Aeolian Res. 2022, 57, 100814. [Google Scholar] [CrossRef]
  19. Wang, S.; Wang, J.; Zhou, Z.; Shang, K. Regional characteristics of three kinds of dust storm events in China. Atmos. Environ. 2005, 39, 509–520. [Google Scholar] [CrossRef]
  20. Kong, X.; Wang, Y.; Huang, K.; Jia, Y.; Wang, P. Spatio-Temporal Characteristics of Dust Weather in Spring 2021 in China. For. Resour. Manag. 2022, 3, 117–121. [Google Scholar] [CrossRef]
  21. Gui, K.; Yao, W.; Che, H.; An, L.; Zheng, Y.; Li, L.; Zhao, H.; Zhang, L.; Zhong, J.; Wang, Y.; et al. Record-breaking dust loading during two mega dust storm events over northern China in March 2021: Aerosol optical and radiative properties and meteorological drivers. Atmos. Chem. Phys. 2022, 22, 7905–7932. [Google Scholar] [CrossRef]
  22. Filonchyk, M. Characteristics of the severe March 2021 Gobi Desert dust storm and its impact on air pollution in China. Chemosphere 2022, 287, 132219. [Google Scholar] [CrossRef]
  23. He, Y.; Yi, F.; Yin, Z.; Liu, F.; Yi, Y.; Zhou, J. Mega Asian dust event over China on 27–31 March 2021 observed with space-borne instruments and ground-based polarization lidar. Atmos. Environ. 2022, 285, 119238. [Google Scholar] [CrossRef]
  24. Ding, R.; Wang, S.; Shang, K.; Yang, D. Analyses of sand storm and sand blowing weather trend and jump in China in recent 45 years. J. Desert Res. 2003, 23, 306–310. [Google Scholar]
  25. Chen, J.; Guo, X.; Bai, W.; Wen, X.; Yang, Y. Spatiotemporal characteristics and influencing factors of dust weather in Qaidam Basin in recent 60 years. Arid. Zone Res. 2021, 38, 1040–1047. [Google Scholar] [CrossRef]
  26. Yang, M.; Zhu, X.; Ai, W.; Song, W. Multi-factor prediction of spring dust weather frequency in northern China. Sci. Technol. Guide 2019, 20, 19–29. [Google Scholar] [CrossRef]
  27. Bergametti, G.; Rajot, J.; Marticorena, B.; Féron, A.; Gaimoz, C.; Chatenet, B.; Coulibaly, M.; Koné, I.; Maman, A.; Zakou, A. Rain, Wind, and Dust Connections in the Sahel. J. Geophys. Res. Atmos. 2022, 127, e2021JD035802. [Google Scholar] [CrossRef]
  28. Qiu, X.F.; Zeng, Y.; Miao, Q.L. Temporal-spatial distribution as well as tracks and source areas of sand-dust storms in China. Acta Geogr. Sin. 2001, 56, 316–322. [Google Scholar] [CrossRef]
  29. Shao, Y.; Yang, Y.; Wang, J.; Song, Z.; Leslie, L.M.; Dong, C.; Zhang, Z.; Lin, Z.; Kanai, Y.; Yabuki, S.; et al. Northeast Asian dust storms: Real-time numerical prediction and validation. J. Geophys. Res. Atmos. 2003, 108, 4691. [Google Scholar] [CrossRef]
  30. Shen, Y.-J.; Guo, Y.; Zhang, Y.; Pei, H.; Brenning, A. Review of historical and projected future climatic and hydrological changes in mountainous semiarid Xinjiang (northwestern China), central Asia. Catena 2019, 187, 104343. [Google Scholar] [CrossRef]
  31. Yassin, M.F.; Almutairi, S.K.; Al-Hemoud, A. Dust storms backward Trajectories’ and source identification over Kuwait. Atmos. Res. 2018, 212, 158–171. [Google Scholar] [CrossRef]
  32. Kamargul, A.; Mao, D.; Wang, X.; Cao, Y. Temporal and Spatial Variation Characteristics of Dust Weather in Hotan Area in Recent 60 Years. J. Gansu Agric. Univ. 2022, 57, 145–152+163. [Google Scholar] [CrossRef]
  33. Rienecker, M.M.; Suarez, M.J.; Gelaro, R.; Todling, R.; Bacmeister, J.; Liu, E.; Bosilovich, M.G.; Schubert, S.D.; Takacs, L.; Kim, G.-K.; et al. MERRA: NASA’s Modern-era retrospective analysis for research and applications. J. Clim. 2011, 24, 3624–3648. [Google Scholar] [CrossRef]
  34. Gelaro, R.; McCarty, W.; Suárez, M.J.; Todling, R.; Molod, A.; Takacs, L.; Randles, C.A.; Darmenov, A.; Bosilovich, M.G.; Reichle, R.; et al. The Modern-Era Retrospective Analysis for Research and Applications, Version 2 (MERRA-2). J. Clim. 2017, 30, 5419–5454. [Google Scholar] [CrossRef]
  35. Meng, X.; Guo, J.; Han, Y. Preliminarily assessment of ERA5 reanalysis data. J. Mar. Meteorol. 2018, 38, 91–99. [Google Scholar] [CrossRef]
  36. Kong, F. Spatial and temporal evolution characteristics of days of disastrous dust weather in China from 1961 to 2017. J. Arid. Land Resour. Environ. 2020, 34, 116–123. [Google Scholar] [CrossRef]
  37. Chen, S.; Huang, J.; Qian, Y.; Zhao, C.; Kang, L.; Yang, B.; Wang, Y.; Liu, Y.; Yuan, T.; Wang, T.; et al. An overview of mineral dust modeling over East Asia. J. Meteorol. Res. 2017, 31, 633–653. [Google Scholar] [CrossRef]
  38. Huang, J.; Wang, T.; Wang, W.; Li, Z.; Yan, H. Climate effects of dust aerosols over East Asian arid and semiarid regions. J. Geophys. Res. Atmos. 2014, 119, 11398–11416. [Google Scholar] [CrossRef]
  39. Liu, J.; Ding, J.; Li, X.; Zhang, J.; Liu, B. Identification of dust aerosols, their sources, and the effect of soil moisture in Central Asia. Sci. Total Environ. 2023, 868, 161575. [Google Scholar] [CrossRef]
  40. Jia, R.; Liu, Y.; Wu, C.; Zhu, Q.; Wang, B. Three-dimensional Distribution and Transport Process of Dust Aerosols over China from 2007 to 2017. J. Desert Res. 2019, 39, 108–117. [Google Scholar] [CrossRef]
  41. Li, J.; He, Q.; Jin, L.; Ge, X. Three-dimensional distribution of dust aerosols over the Tarim Basin and the Tibet Plateau during 2007–2021 derived from CALIPSO lidar observations. J. Clean. Prod. 2023, 400, 136746. [Google Scholar] [CrossRef]
  42. Wang, H. The Monitoring Study for Dust Emission of Wind Erosion Land Surface in the Taklimakan Desert; Cold and Arid Regions Environment and Engineering Research Institute, Chinese Academy of Sciences: Lanzhou, China, 2011. [Google Scholar]
  43. Charlson, R.J.; Schwartz, S.E.; Hales, J.M.; Cess, R.D.; Coakley, J.A., Jr.; Hansen, J.E.; Hofmann, D.J. Climate Forcing by Anthropogenic Aerosols. Science 1992, 255, 423–430. [Google Scholar] [CrossRef] [PubMed]
  44. Zhang, Y.; Wang, H.; Zuo, H.; Yan, M. Identify high frequent dust areas and their sources in spring in the Northwest of China. China Environ. Sci. 2019, 39, 4065–4073. [Google Scholar] [CrossRef]
  45. Ge, J.; Huang, J.; Xu, C.; Qi, Y.; Liu, H. Characteristics of Taklimakan dust emission and distribution: A satellite and reanalysis field perspective. J. Geophys. Res. Atmos. 2014, 119, 11772–11783. [Google Scholar] [CrossRef]
  46. Prospero, J.M.; Ginoux, P.; Torres, O.; Nicholson, S.E.; Gill, T.E. Environmental characterization of global sources of atmospheric soil dust identified with the nimbus 7 total ozone mapping spectrometer (toms) absorbing aerosol product. Rev. Geophys. 2002, 40, 2-1-2-31. [Google Scholar] [CrossRef]
  47. Kaufman, Y.J.; Koren, I.; Remer, L.A.; Tanré, D.; Ginoux, P.; Fan, S. Dust transport and deposition observed from the Terra-Moderate Resolution Imaging Spectroradiometer (MODIS) spacecraft over the Atlantic Ocean. J. Geophys. Res. Atmos. 2005, 110, D10S12. [Google Scholar] [CrossRef]
  48. Chen, Y.; Wang, T.; Han, Y.; Qiao, H.; Sun, M.; Hang, Z. Comparative Analysis of Aerosol Optical Properties in Typical Regions of Mineral Dust and Salt Dust. Plateau Meteorol. 2020, 39, 859–869. [Google Scholar] [CrossRef]
  49. Li, C.; Zhang, Y.; Liu, Z.; Wang, R. Response of desertification to climate change and Control Countermeasures in Xinjiang. Bull. Soil Water Conserv. 2014, 34, 264–268. [Google Scholar] [CrossRef]
  50. Han, Z.; Wang, T.; Dong, Z.; Wu, Q.; Yao, Z. Spatial-temporal distribution of blown sand activities along Taklimakan Desert Highway. Sci. Geogr. Sinica. 2005, 25, 455–460. [Google Scholar]
  51. Bullard, J.E.; Livingstone, I. Dust. In Geomorphology of Desert Environments; Parsons, A.J., Abrahams, A.D., Eds.; Springer: Dordrecht, The Netherlands, 2009; pp. 629–654. [Google Scholar]
  52. Wei, G.; Zhang, C.; Li, Q.; Wang, R.; Wang, H.; Zhang, Y.; Yuan, Y.; Li, W. Grain-size composition of the surface sediments in Chinese deserts and the associated dust emission. Catena 2022, 219, 106615. [Google Scholar] [CrossRef]
  53. Sun, Y.; Li, S.; Xu, X.; Li, Y.; Fan, D. Study on Grain Size Characteristics of Dustfall in the Taklimakan Desert—A Case Study along the Tarim Desert Highway. Arid. Zone Res. 2010, 27, 785–792. [Google Scholar] [CrossRef]
  54. Okin, G.S. Linked aeolian—Vegetation systems. In Treatise on Geomorphology: Aeolian Geomorphology; Shroder, J., Lancaster, N., Sherman, D.J., Baas, A.C.W., Eds.; Academic Press: San Diego, CA, USA, 2013; Volume 11, pp. 428–439. [Google Scholar]
  55. Jiang, Q.; Yang, X. Sedimentological and Geochemical Composition of Aeolian Sediments in the Taklamakan Desert: Implications for Provenance and Sediment Supply Mechanisms. J. Geophys. Res. Earth Surf. 2019, 124, 1217–1237. [Google Scholar] [CrossRef]
  56. Washington, R.; Todd, M.; Middleton, N.J.; Goudie, A.S. Dust-Storm Source Areas Determined by the Total Ozone Monitoring Spectrometer and Surface Observations. Ann. Assoc. Am. Geogr. 2003, 93, 297–313. [Google Scholar] [CrossRef]
  57. Zhang, B.; Tsunekawa, A.; Tsubo, M. Contributions of sandy lands and stony deserts to long-distance dust emission in China and Mongolia during 2000–2006. Glob. Planet. Chang. 2008, 60, 487–504. [Google Scholar] [CrossRef]
  58. Wu, Z. Aeolian Landform and Sand Control Engineering; Science Press: Beijing, China, 2003; pp. 16–21. [Google Scholar]
  59. Qiang, M.; Chen, F.; Zhou, A.; Xiao, S.; Zhang, J.; Wang, Z. Impacts of wind velocity on sand and dust deposition during dust storm as inferred from a series of observations in the northeastern Qinghai–Tibetan Plateau, China. Powder Technol. 2007, 175, 82–89. [Google Scholar] [CrossRef]
  60. Jiao, M.; Niu, R.; Zhao, L.; Yan, H. Comparative analysis on causing factors of dust events. J. Desert Res. 2004, 24, 696–700. [Google Scholar] [CrossRef]
  61. Chen, Y.; Shang, K.; Wang, S.; Li, Y. Characteristics of sand-dust weather in northern China from 2002 to 2010 and its relationship with surface wind speed and NDVI. J. Desert Res. 2012, 32, 1702–1709. [Google Scholar] [CrossRef]
  62. Lou, S.; Russell, L.M.; Yang, Y.; Xu, L.; Lamjiri, M.A.; DeFlorio, M.J.; Miller, A.J.; Ghan, S.J.; Liu, Y.; Singh, B. Impacts of the East Asian Monsoon on springtime dust concentrations over China. J. Geophys. Res. Atmos. 2016, 121, 8137–8152. [Google Scholar] [CrossRef]
  63. Chen, W.; Dong, Z.; Yang, Z.; Han, Z.; Zhang, J.; Zhang, M. Threshold velocities of sand-driving wind in the Taklamakan Desert. Acta Geogr. Sin. 1995, 4, 360–367. [Google Scholar]
  64. Sun, W.; Gao, X. Geomorphology of sand dunes in the Taklamakan Desert based on ERA5 reanalysis data. J. Arid. Environ. 2022, 207, 104848. [Google Scholar] [CrossRef]
  65. Zu, R.; Xue, X.; Qiang, M.; Yang, B.; Qu, J.; Zhang, K. Characteristics of near-surface wind regimes in the Taklimakan Desert, China. Geomorphology 2008, 96, 39–47. [Google Scholar] [CrossRef]
  66. Zu, R. Characteristics of Near-Surface Wind Regimes in the Taklimakan Desert, China; Cold and Arid Regions Environmental and Engineering Research Institute, Chinese Academy of Sciences: Lanzhou, China, 2003. [Google Scholar]
  67. Kang, L.; Ji, M.; Huang, J.; Guan, X. Impact of eurasian atmospheric circulation on spring dust events in spring over the northern China. J. Desert Res. 2013, 5, 1453–1460. [Google Scholar] [CrossRef]
  68. Xi, X.; Sokolik, I.N. Dust interannual variability and trend in Central Asia from 2000 to 2014 and their climatic linkages. J. Geophys. Res. Atmos. 2015, 120, 12175–12197. [Google Scholar] [CrossRef]
Figure 1. Overview of the study area and distribution of meteorological stations (desert distribution dataset is provided by National Cryosphere Desert Data Center (http://www.ncdc.ac.cn, accessed on 1 June 2022). The standard map No. GS(2017)1267.
Remotesensing 15 01804 g001
Figure 2. Frequency change of dust weather from 1989 to 2021.
Remotesensing 15 01804 g002
Figure 3. Average monthly variation in dust weather days.
Remotesensing 15 01804 g003
Figure 4. Annual average dust weather frequency in the Tarim Basin.
Remotesensing 15 01804 g004
Figure 5. Interannual and monthly variation in DI in Tarim Basin, (a) Interannual variation; (b) monthly variation.
Remotesensing 15 01804 g005
Figure 6. Spatial Distribution of DI in Tarim Basin.
Remotesensing 15 01804 g006
Figure 7. (a) Correlation analysis of annual average DAOD and dust weather days at 44 stations from 1989 to 2021; (b) Correlation analysis of multi-year average DAOD and DI.
Remotesensing 15 01804 g007
Figure 8. Spatial Distribution of DAOD in Tarim Basin from 1989 to 2021, (a): Multiyear average DAOD; (be): DAOD in different seasons.
Remotesensing 15 01804 g008
Figure 9. Distribution of dust surface mass concentration (μg·m−3) in the Tarim Basin from 1989 to 2021, (a) DUSMASS multi-year average distribution; (b) DUSMASS in spring; (c) DUSMASS in summer; (d) DUSMASS in autumn; (e) DUSMASS in winter.
Remotesensing 15 01804 g009
Figure 10. (a) Gale weather frequency; (b) Annual average wind speed in gale weather.
Remotesensing 15 01804 g010
Disclaimer/Publisher’s Note: The statements, opinions and data contained in all publications are solely those of the individual author(s) and contributor(s) and not of MDPI and/or the editor(s). MDPI and/or the editor(s) disclaim responsibility for any injury to people or property resulting from any ideas, methods, instructions or products referred to in the content.

