

Investigating Drought and Flood Evolution Based on Remote Sensing Data Products over the Punjab Region in Pakistan


Abstract
1. Introduction
2. Materials and Methods
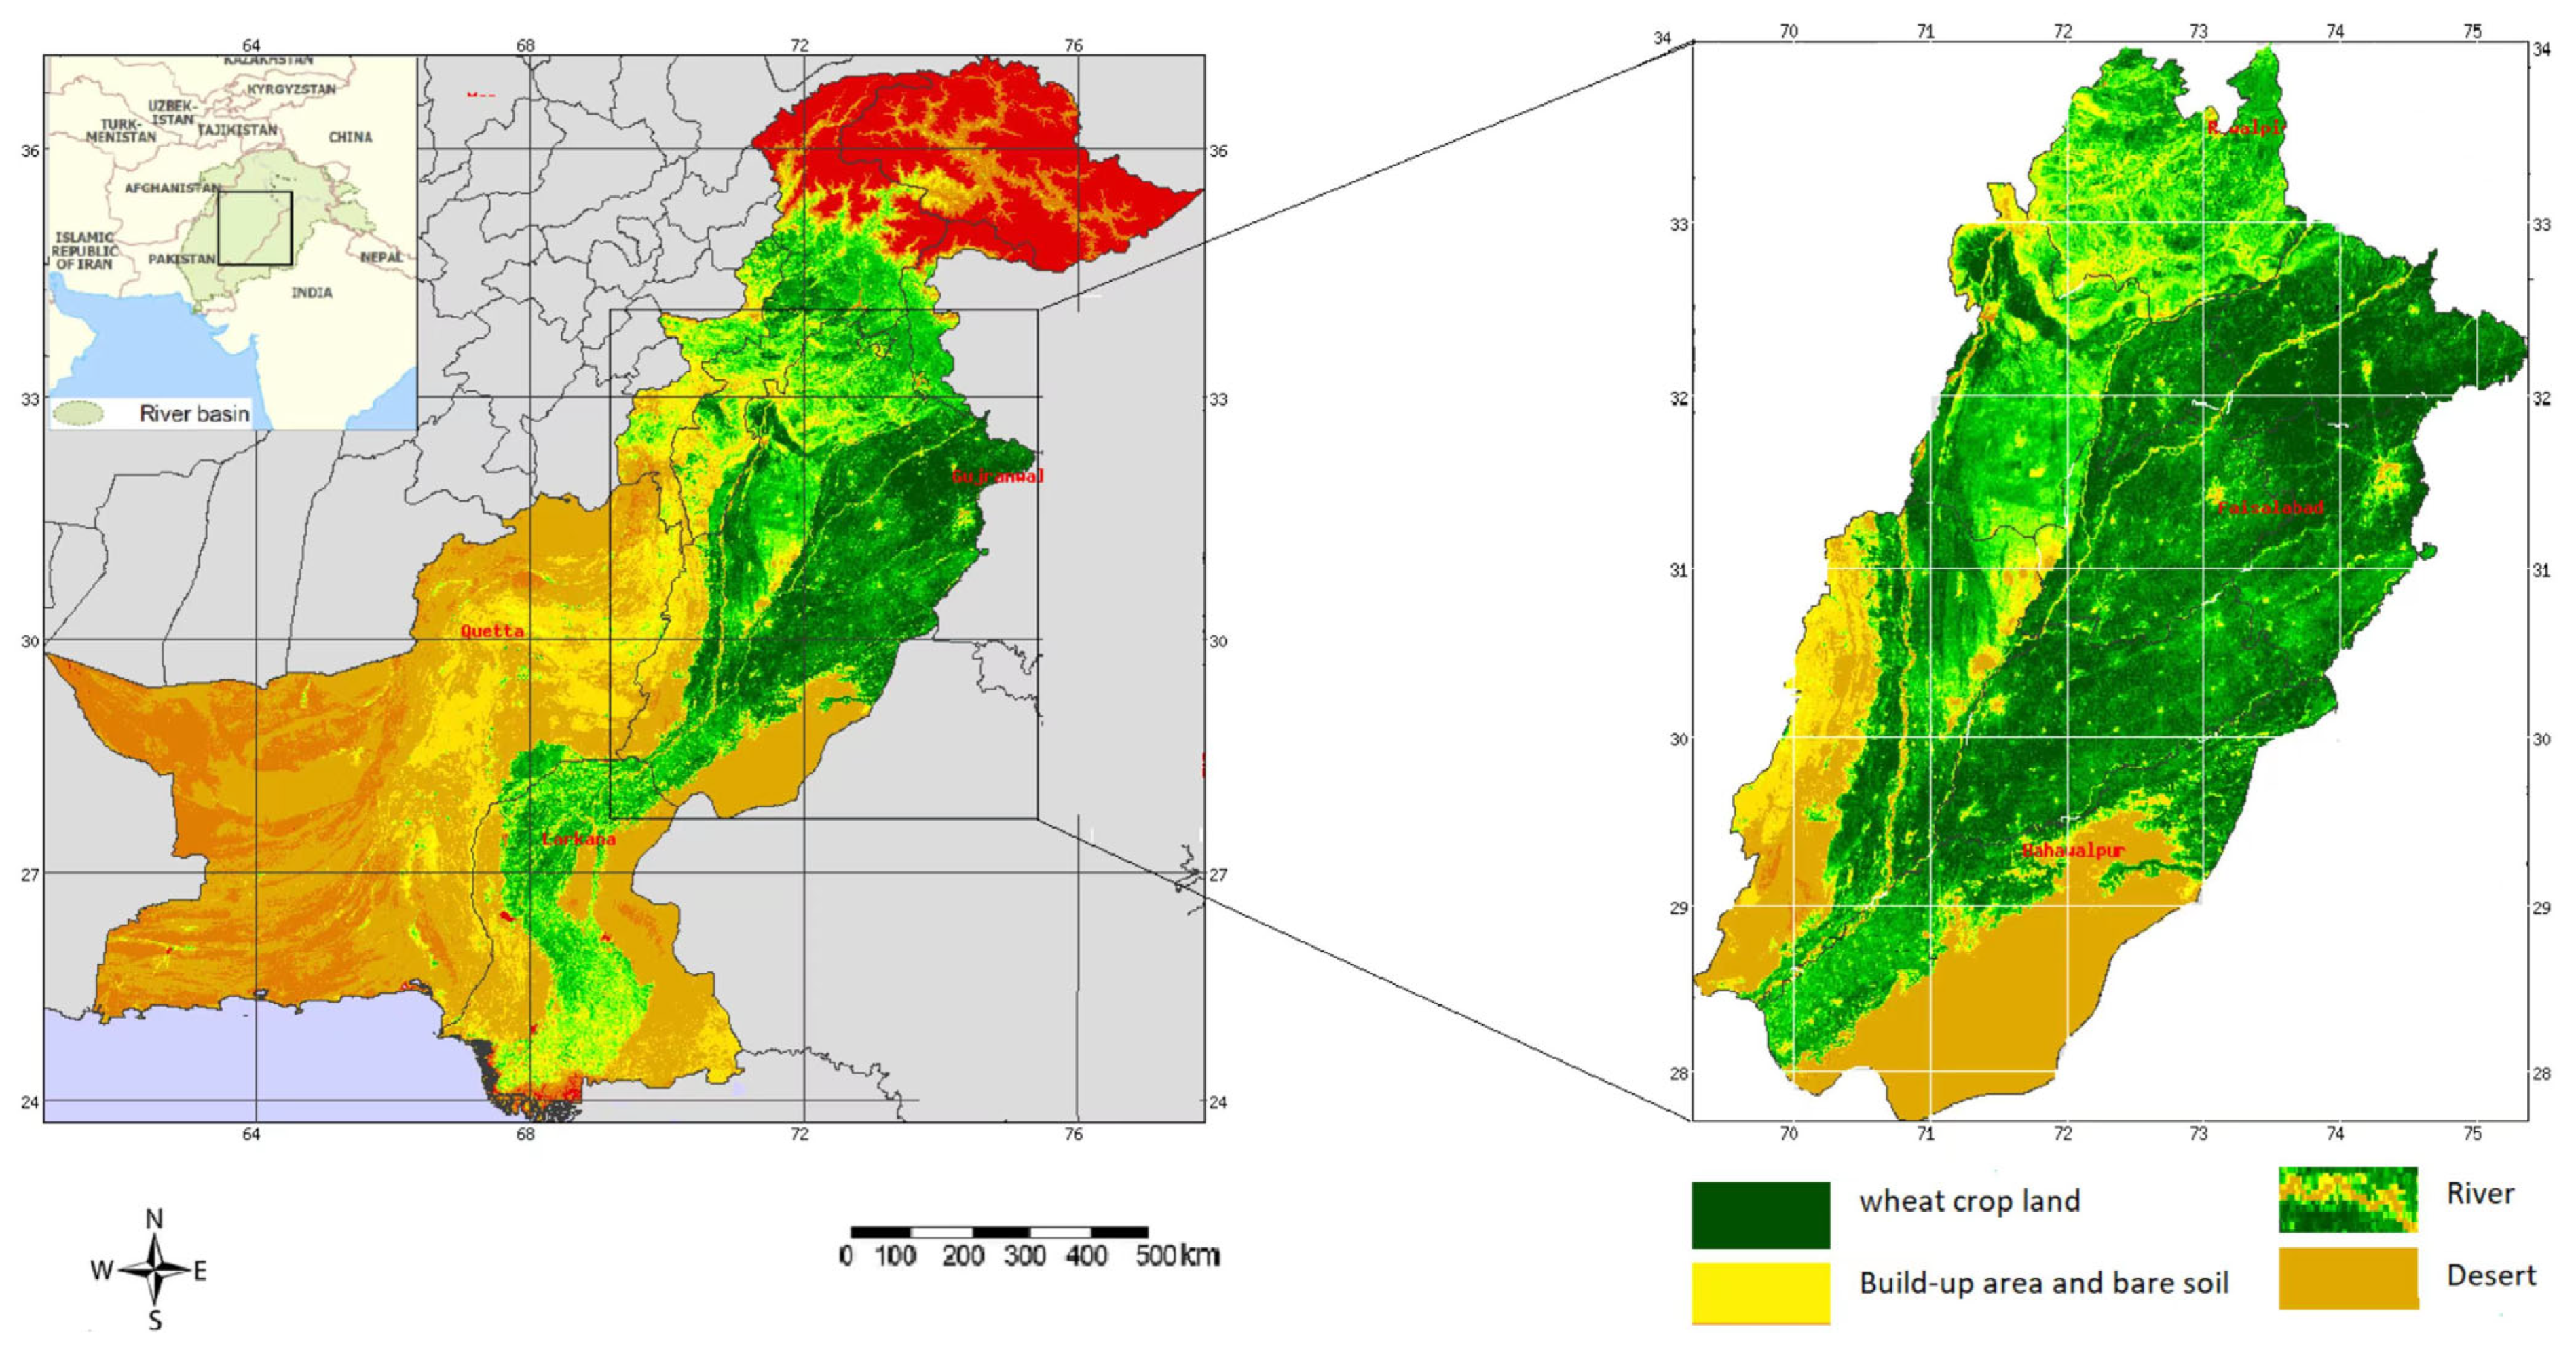
2.1. Study Area
2.2. Datasets
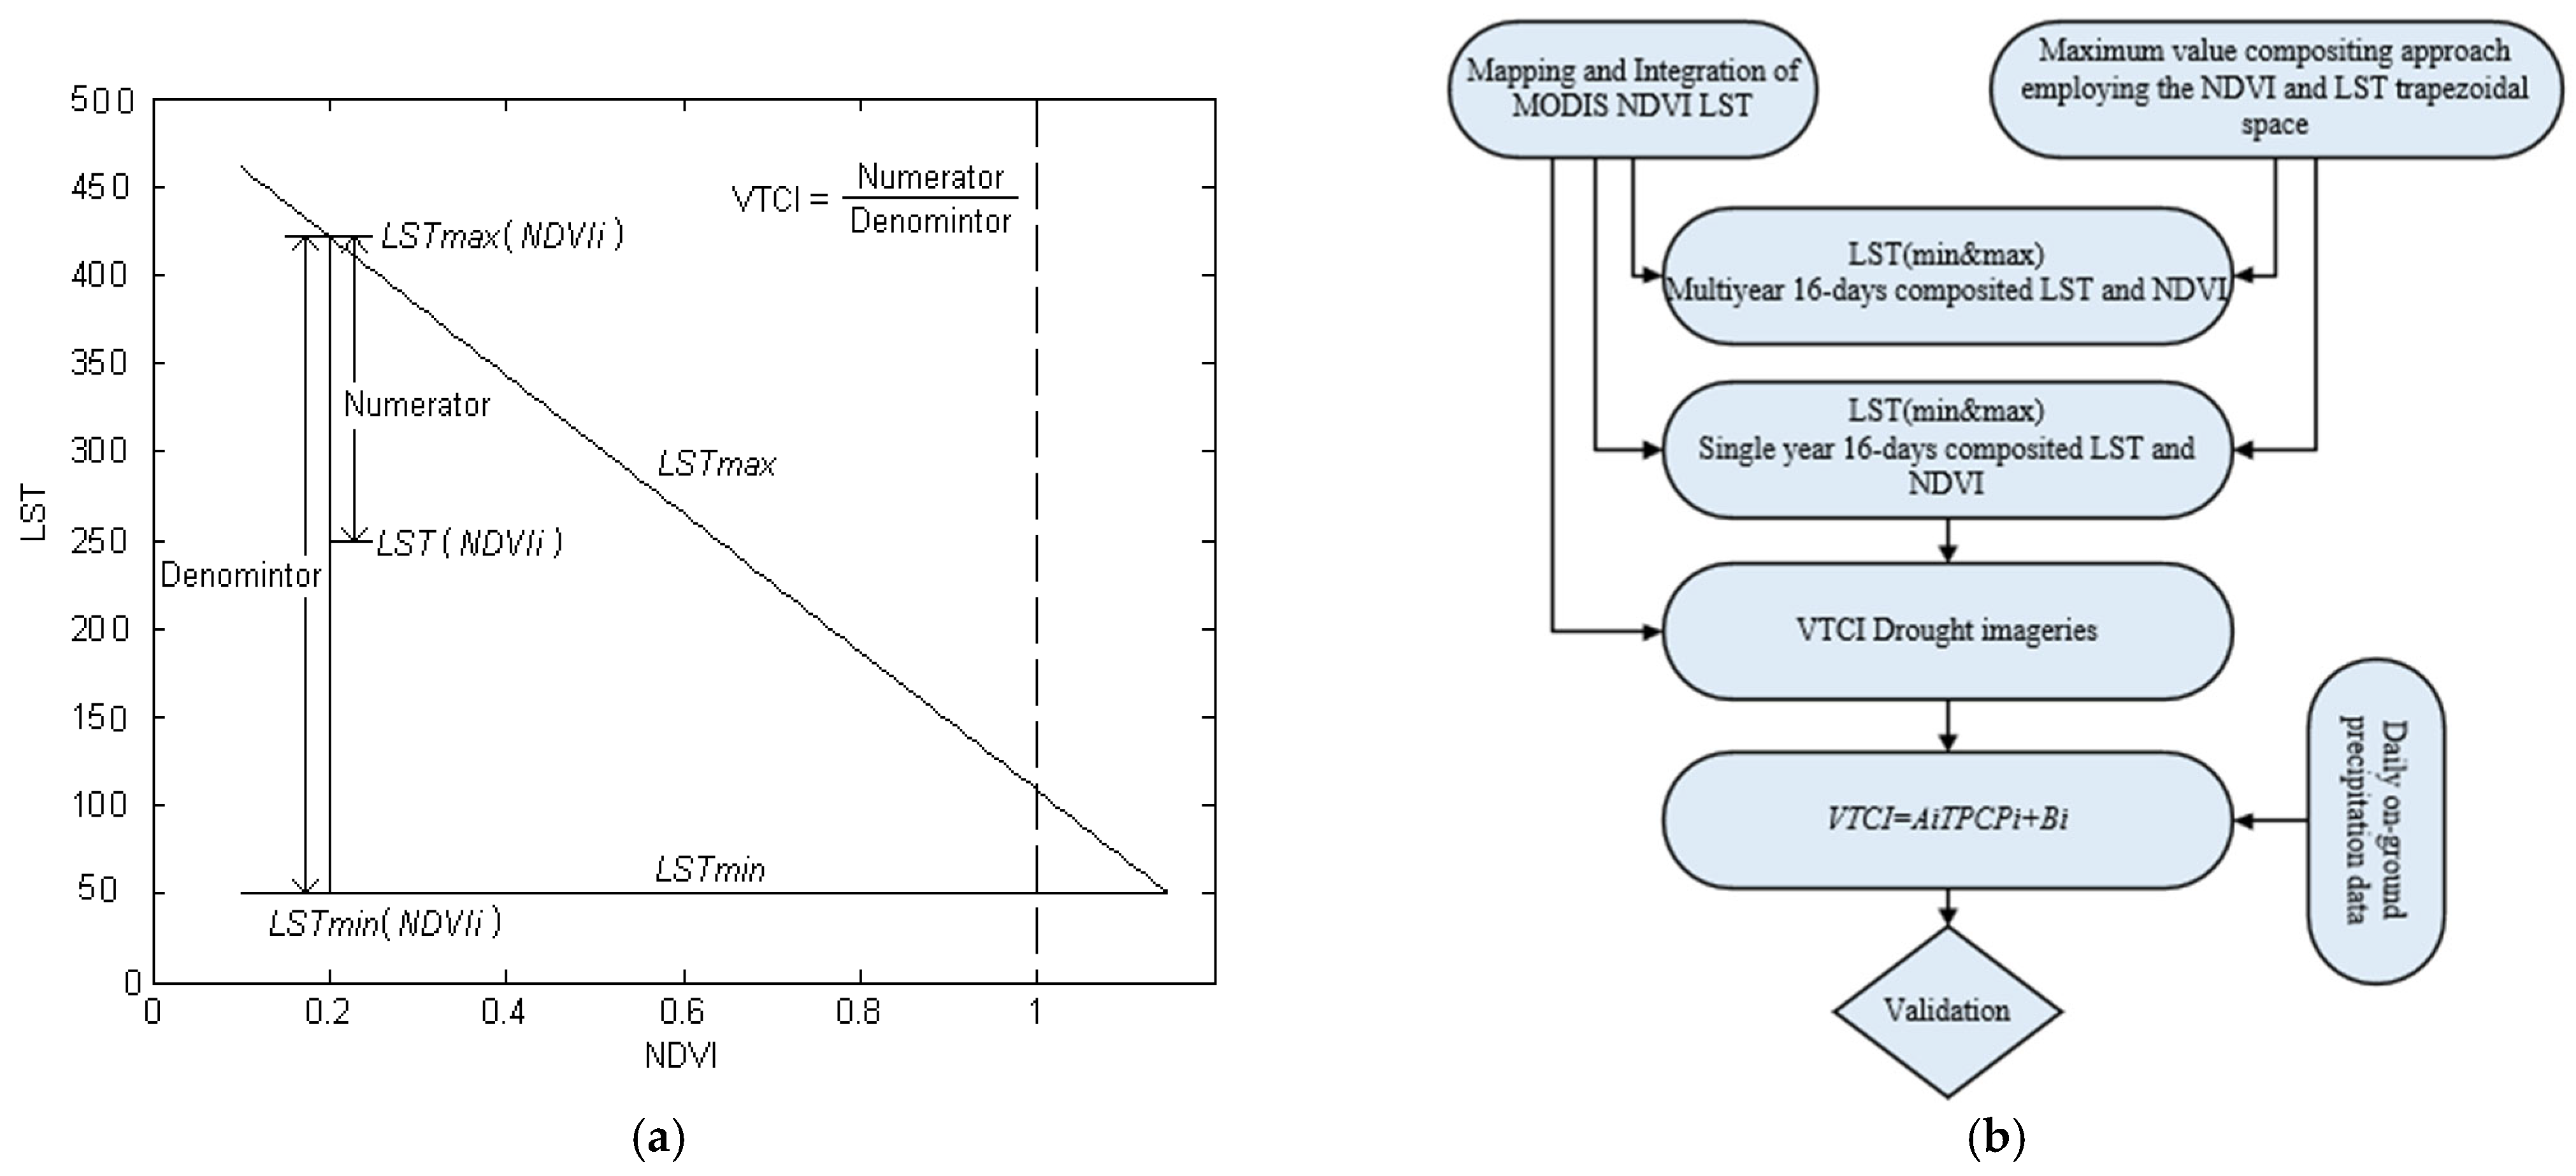
2.3. Methods
3. Results and Discussion
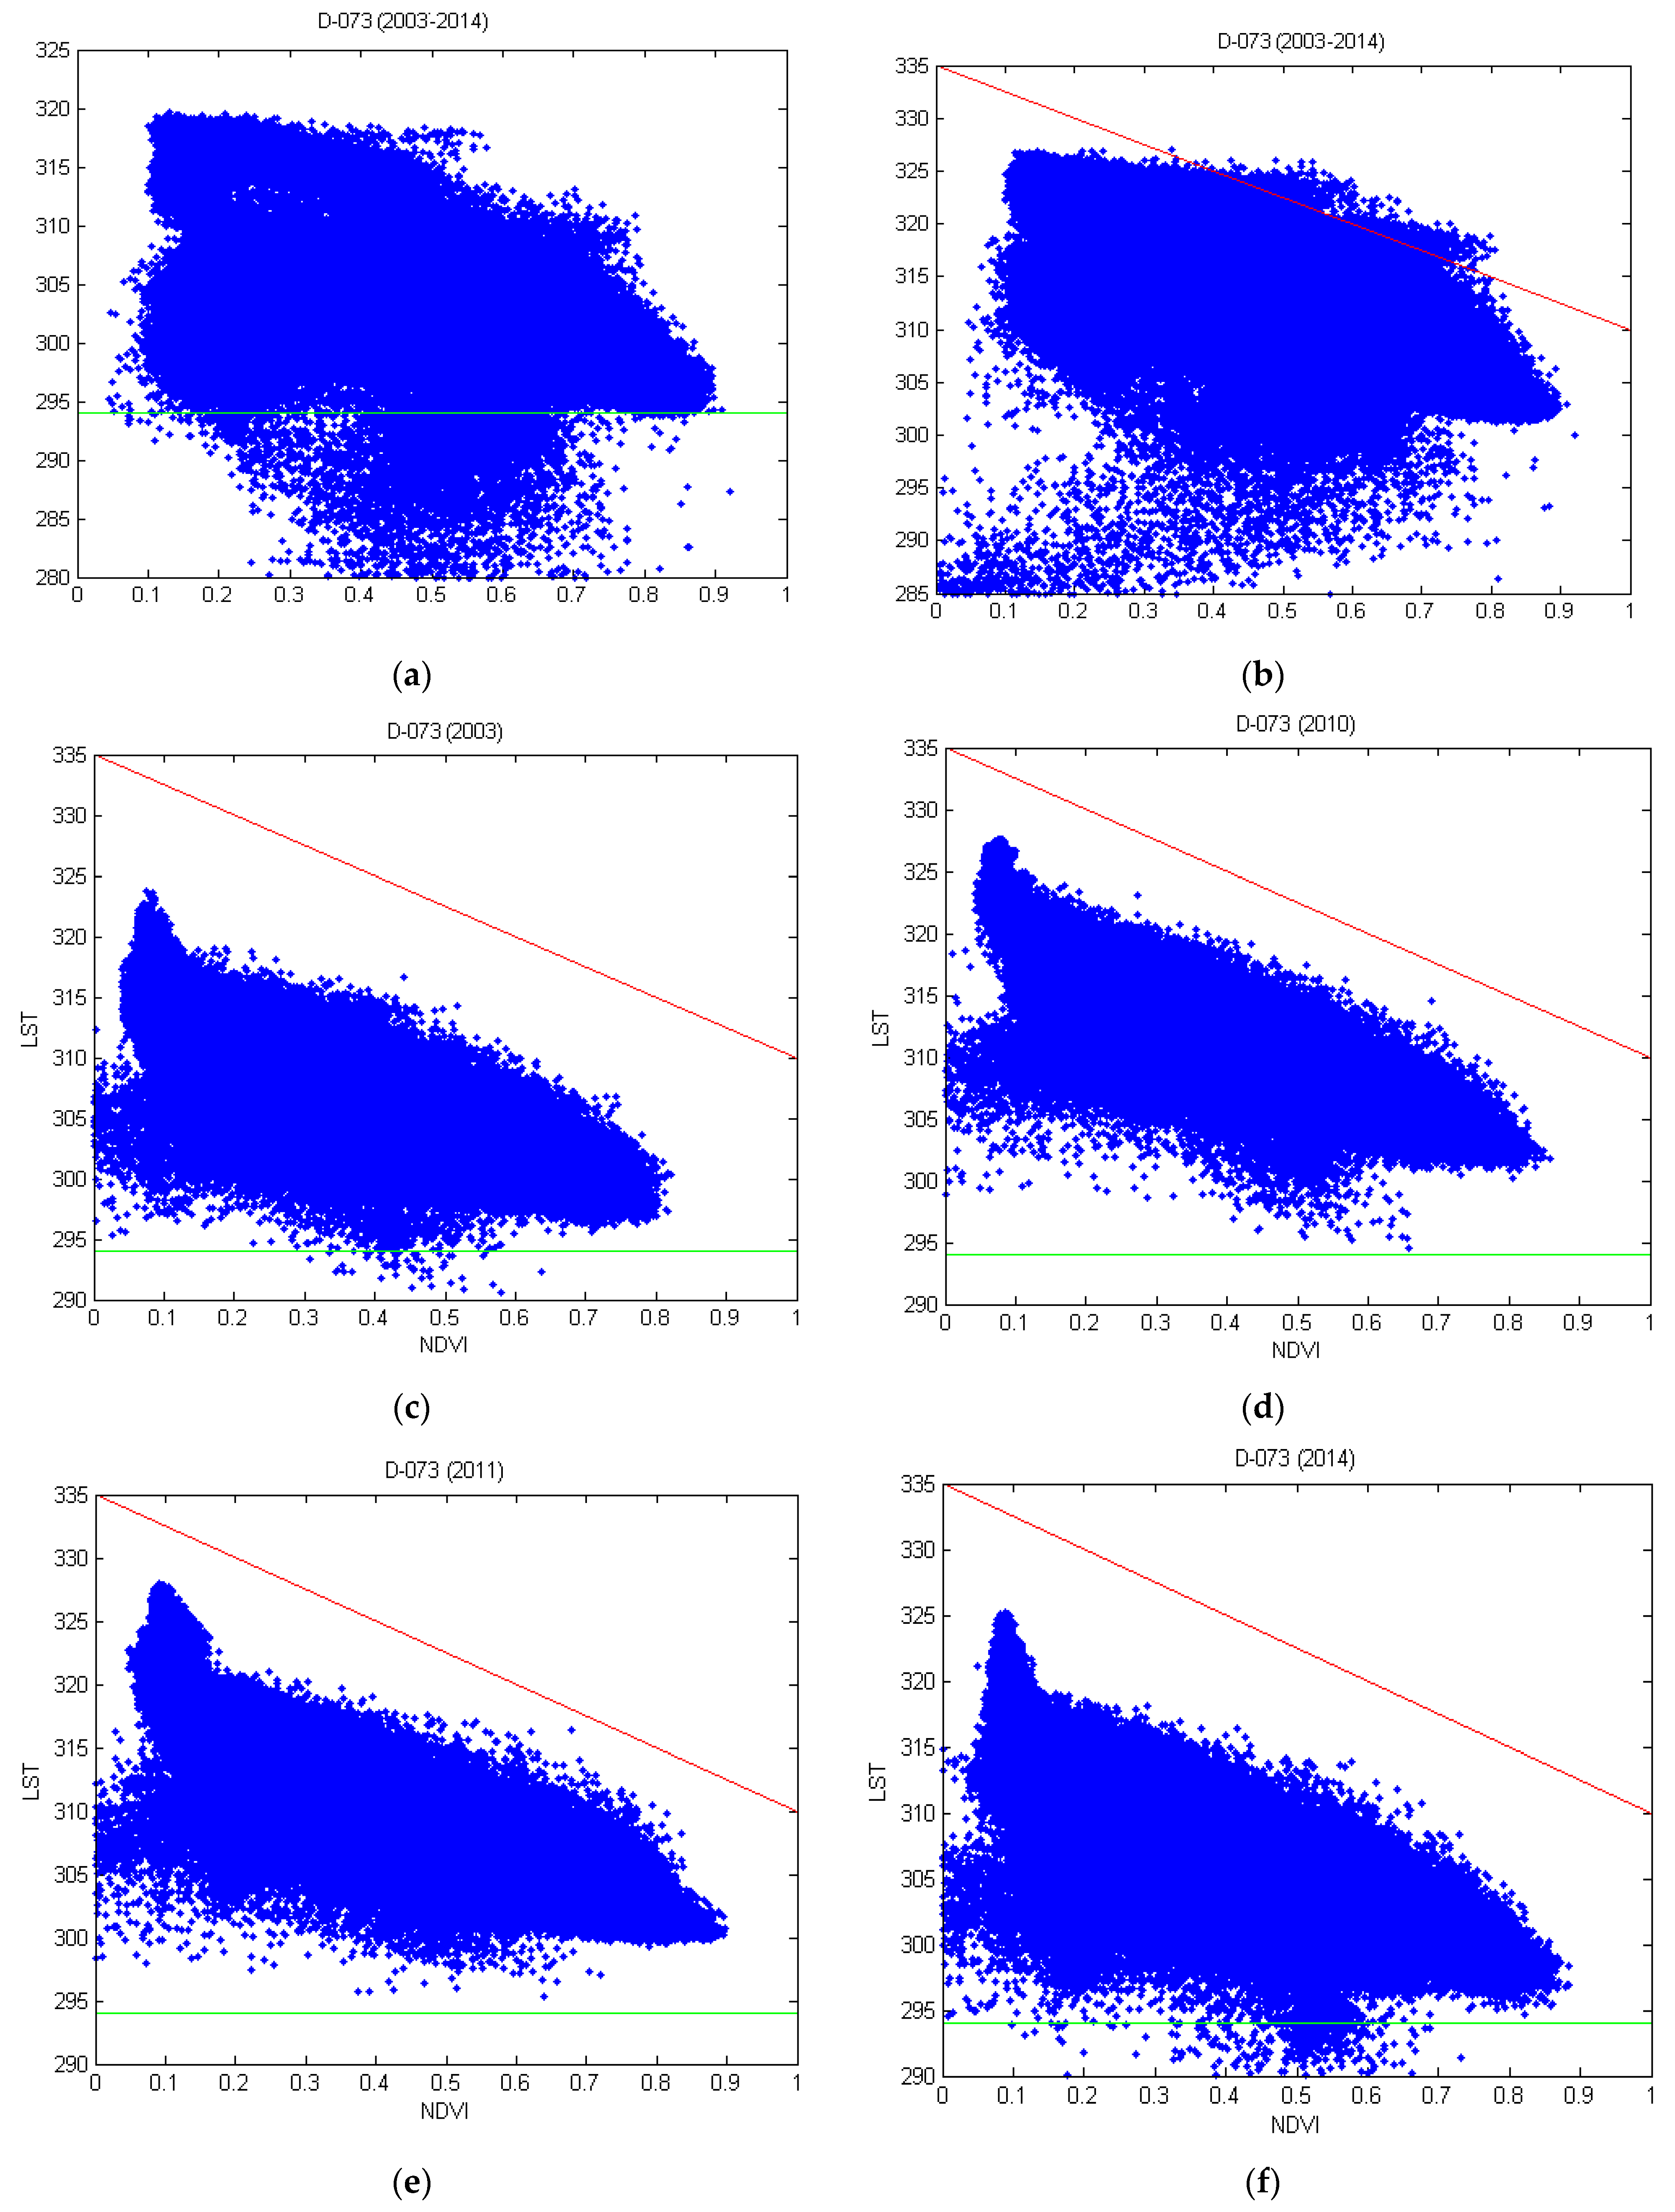
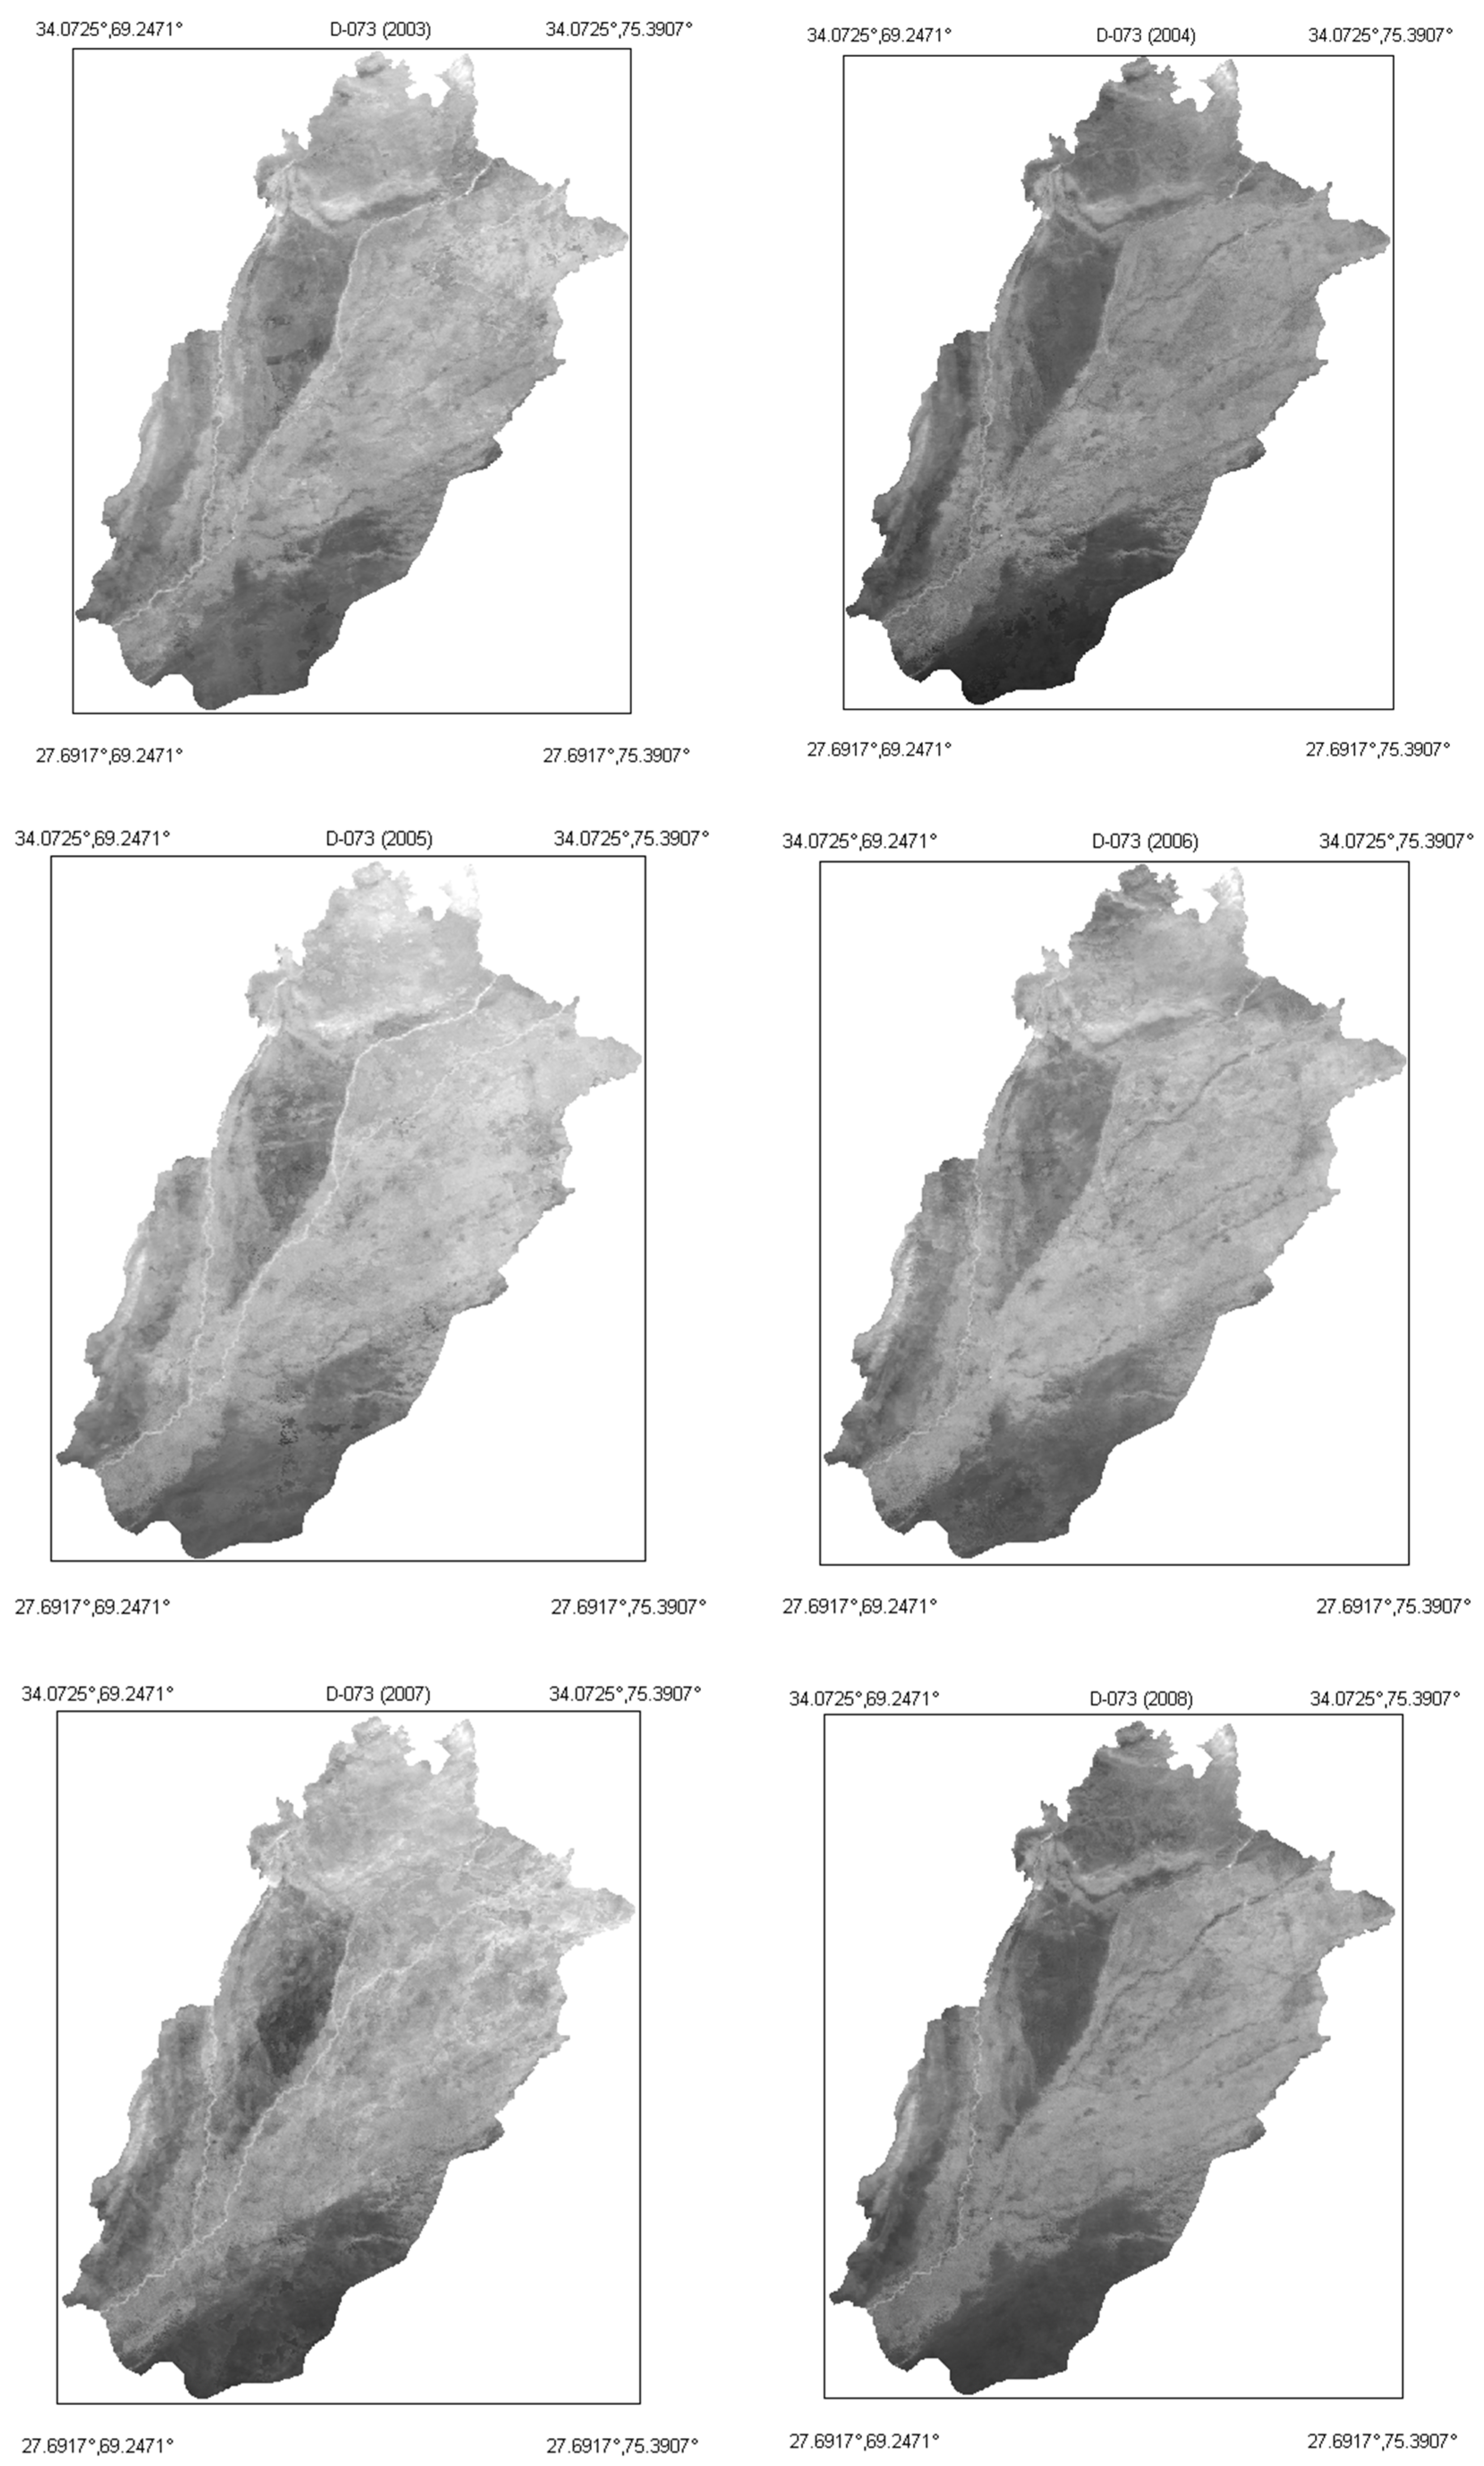
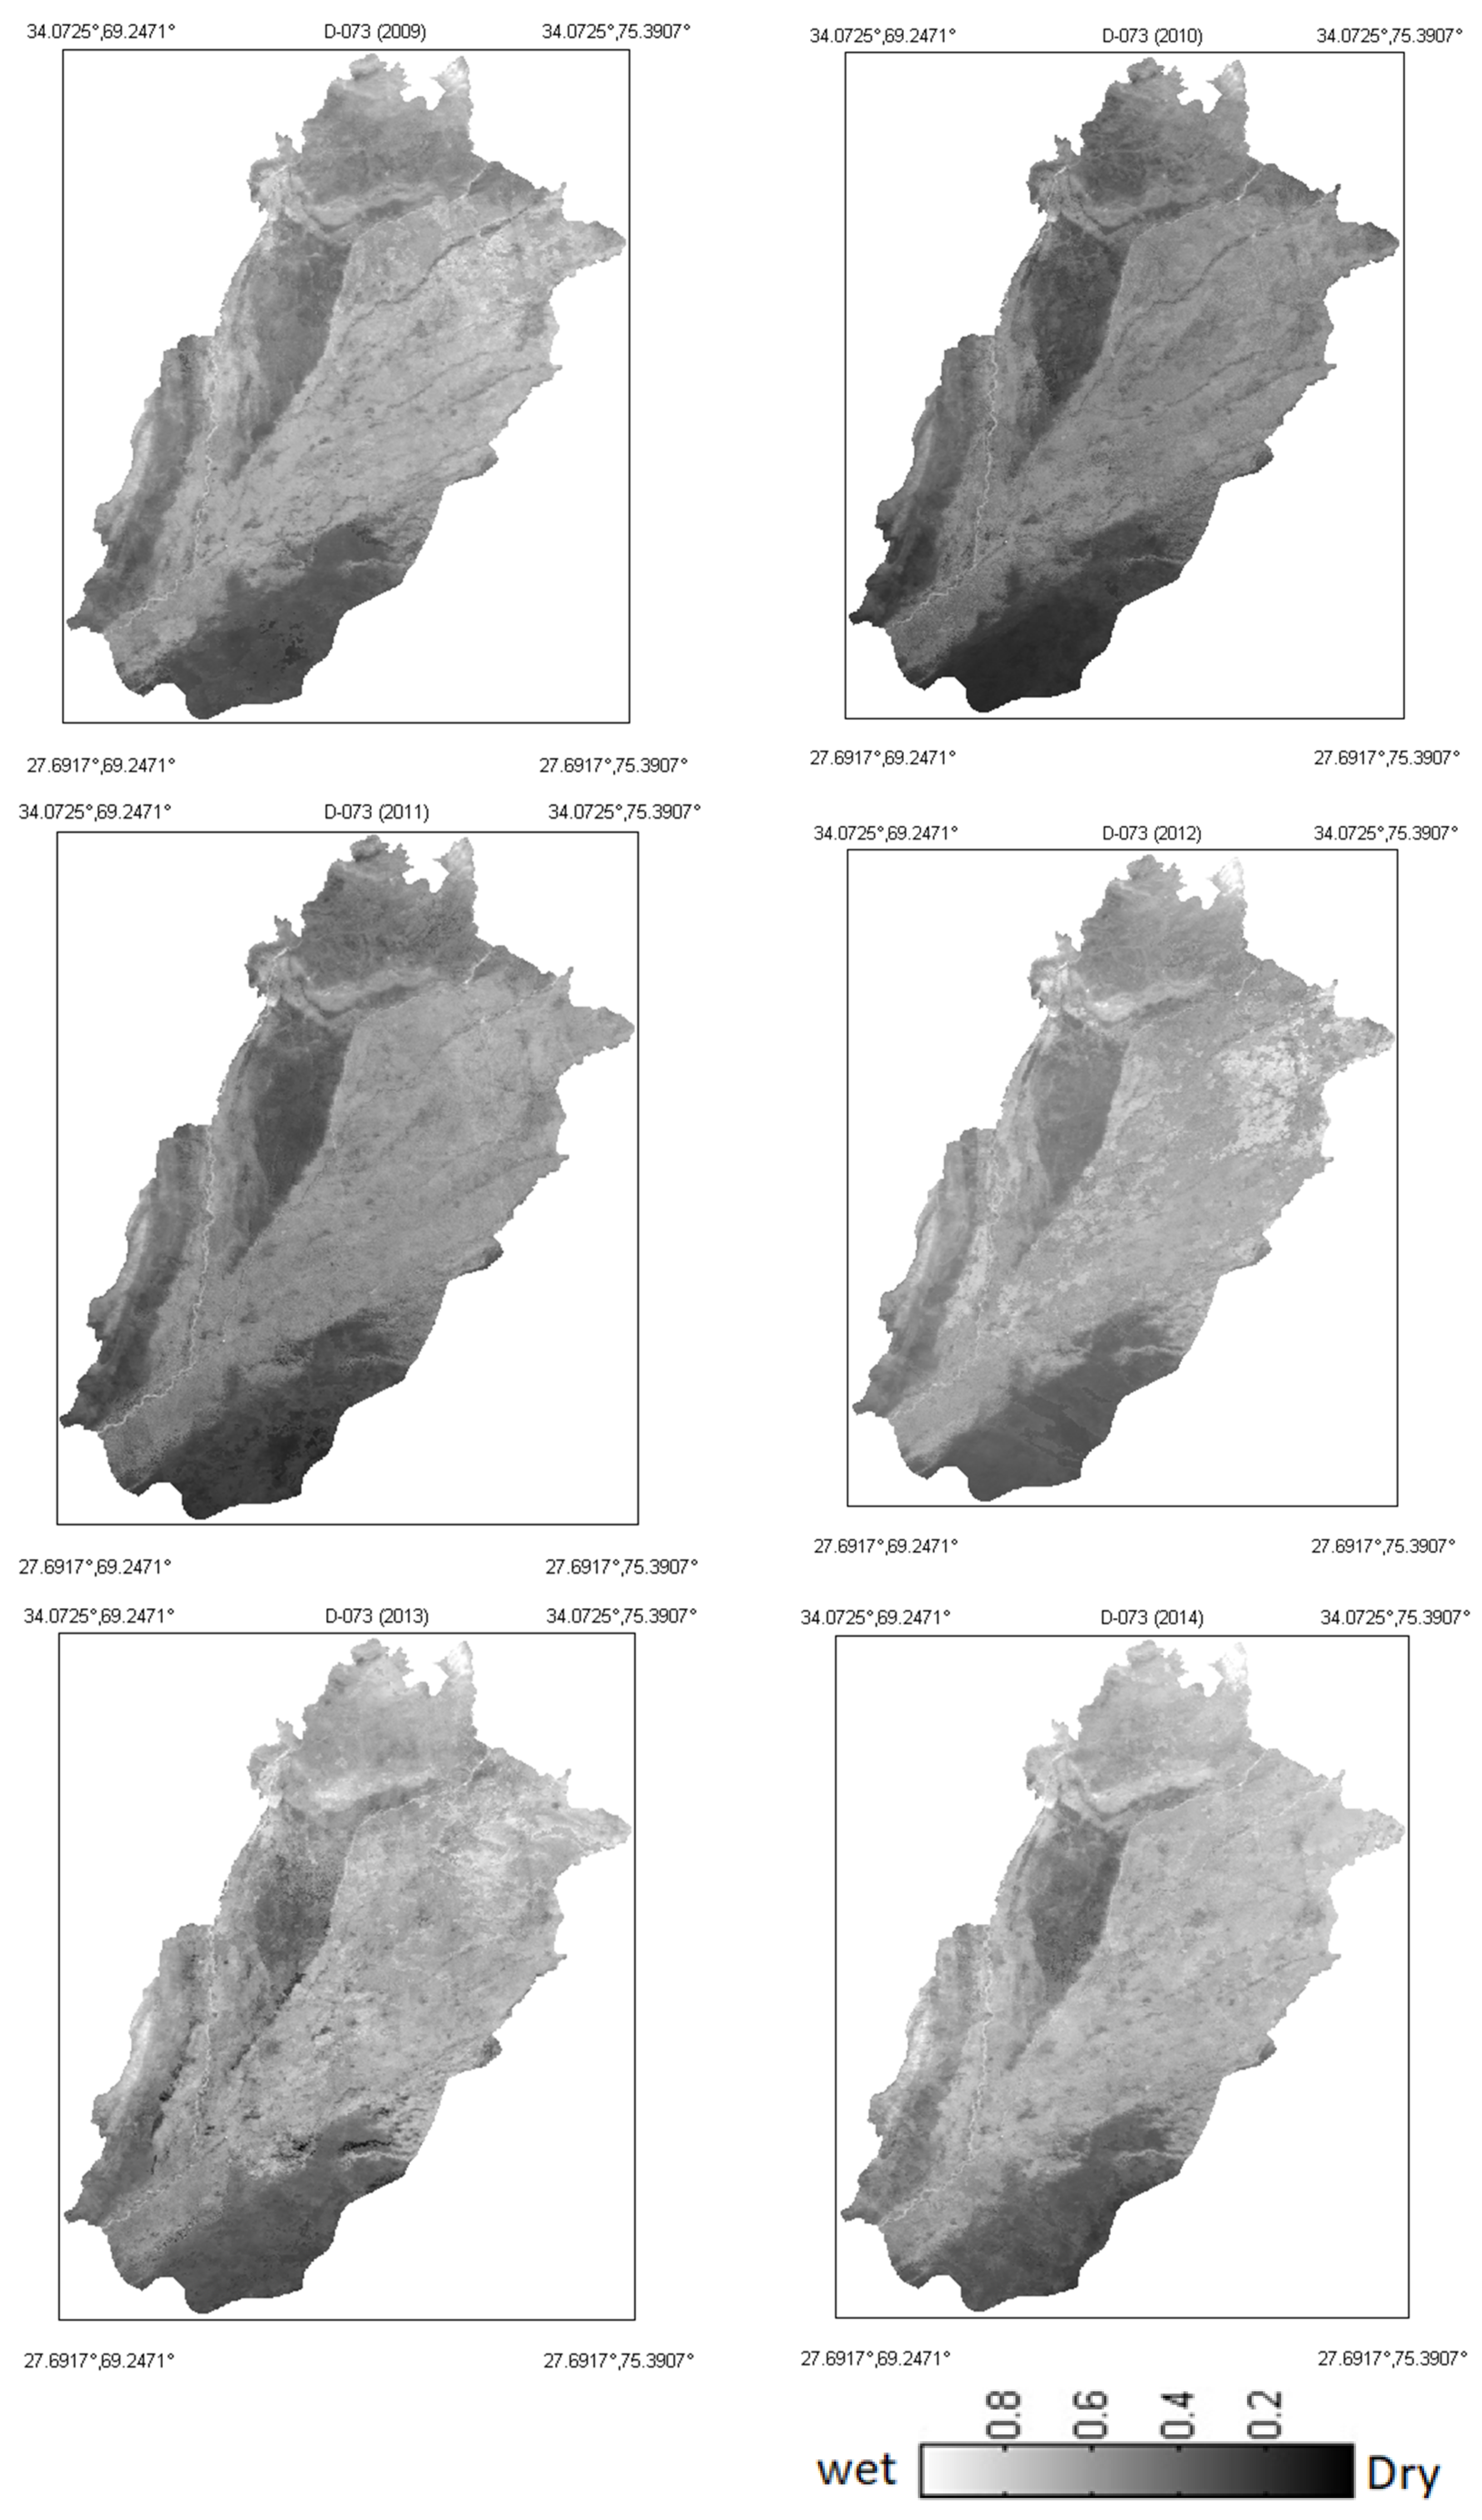
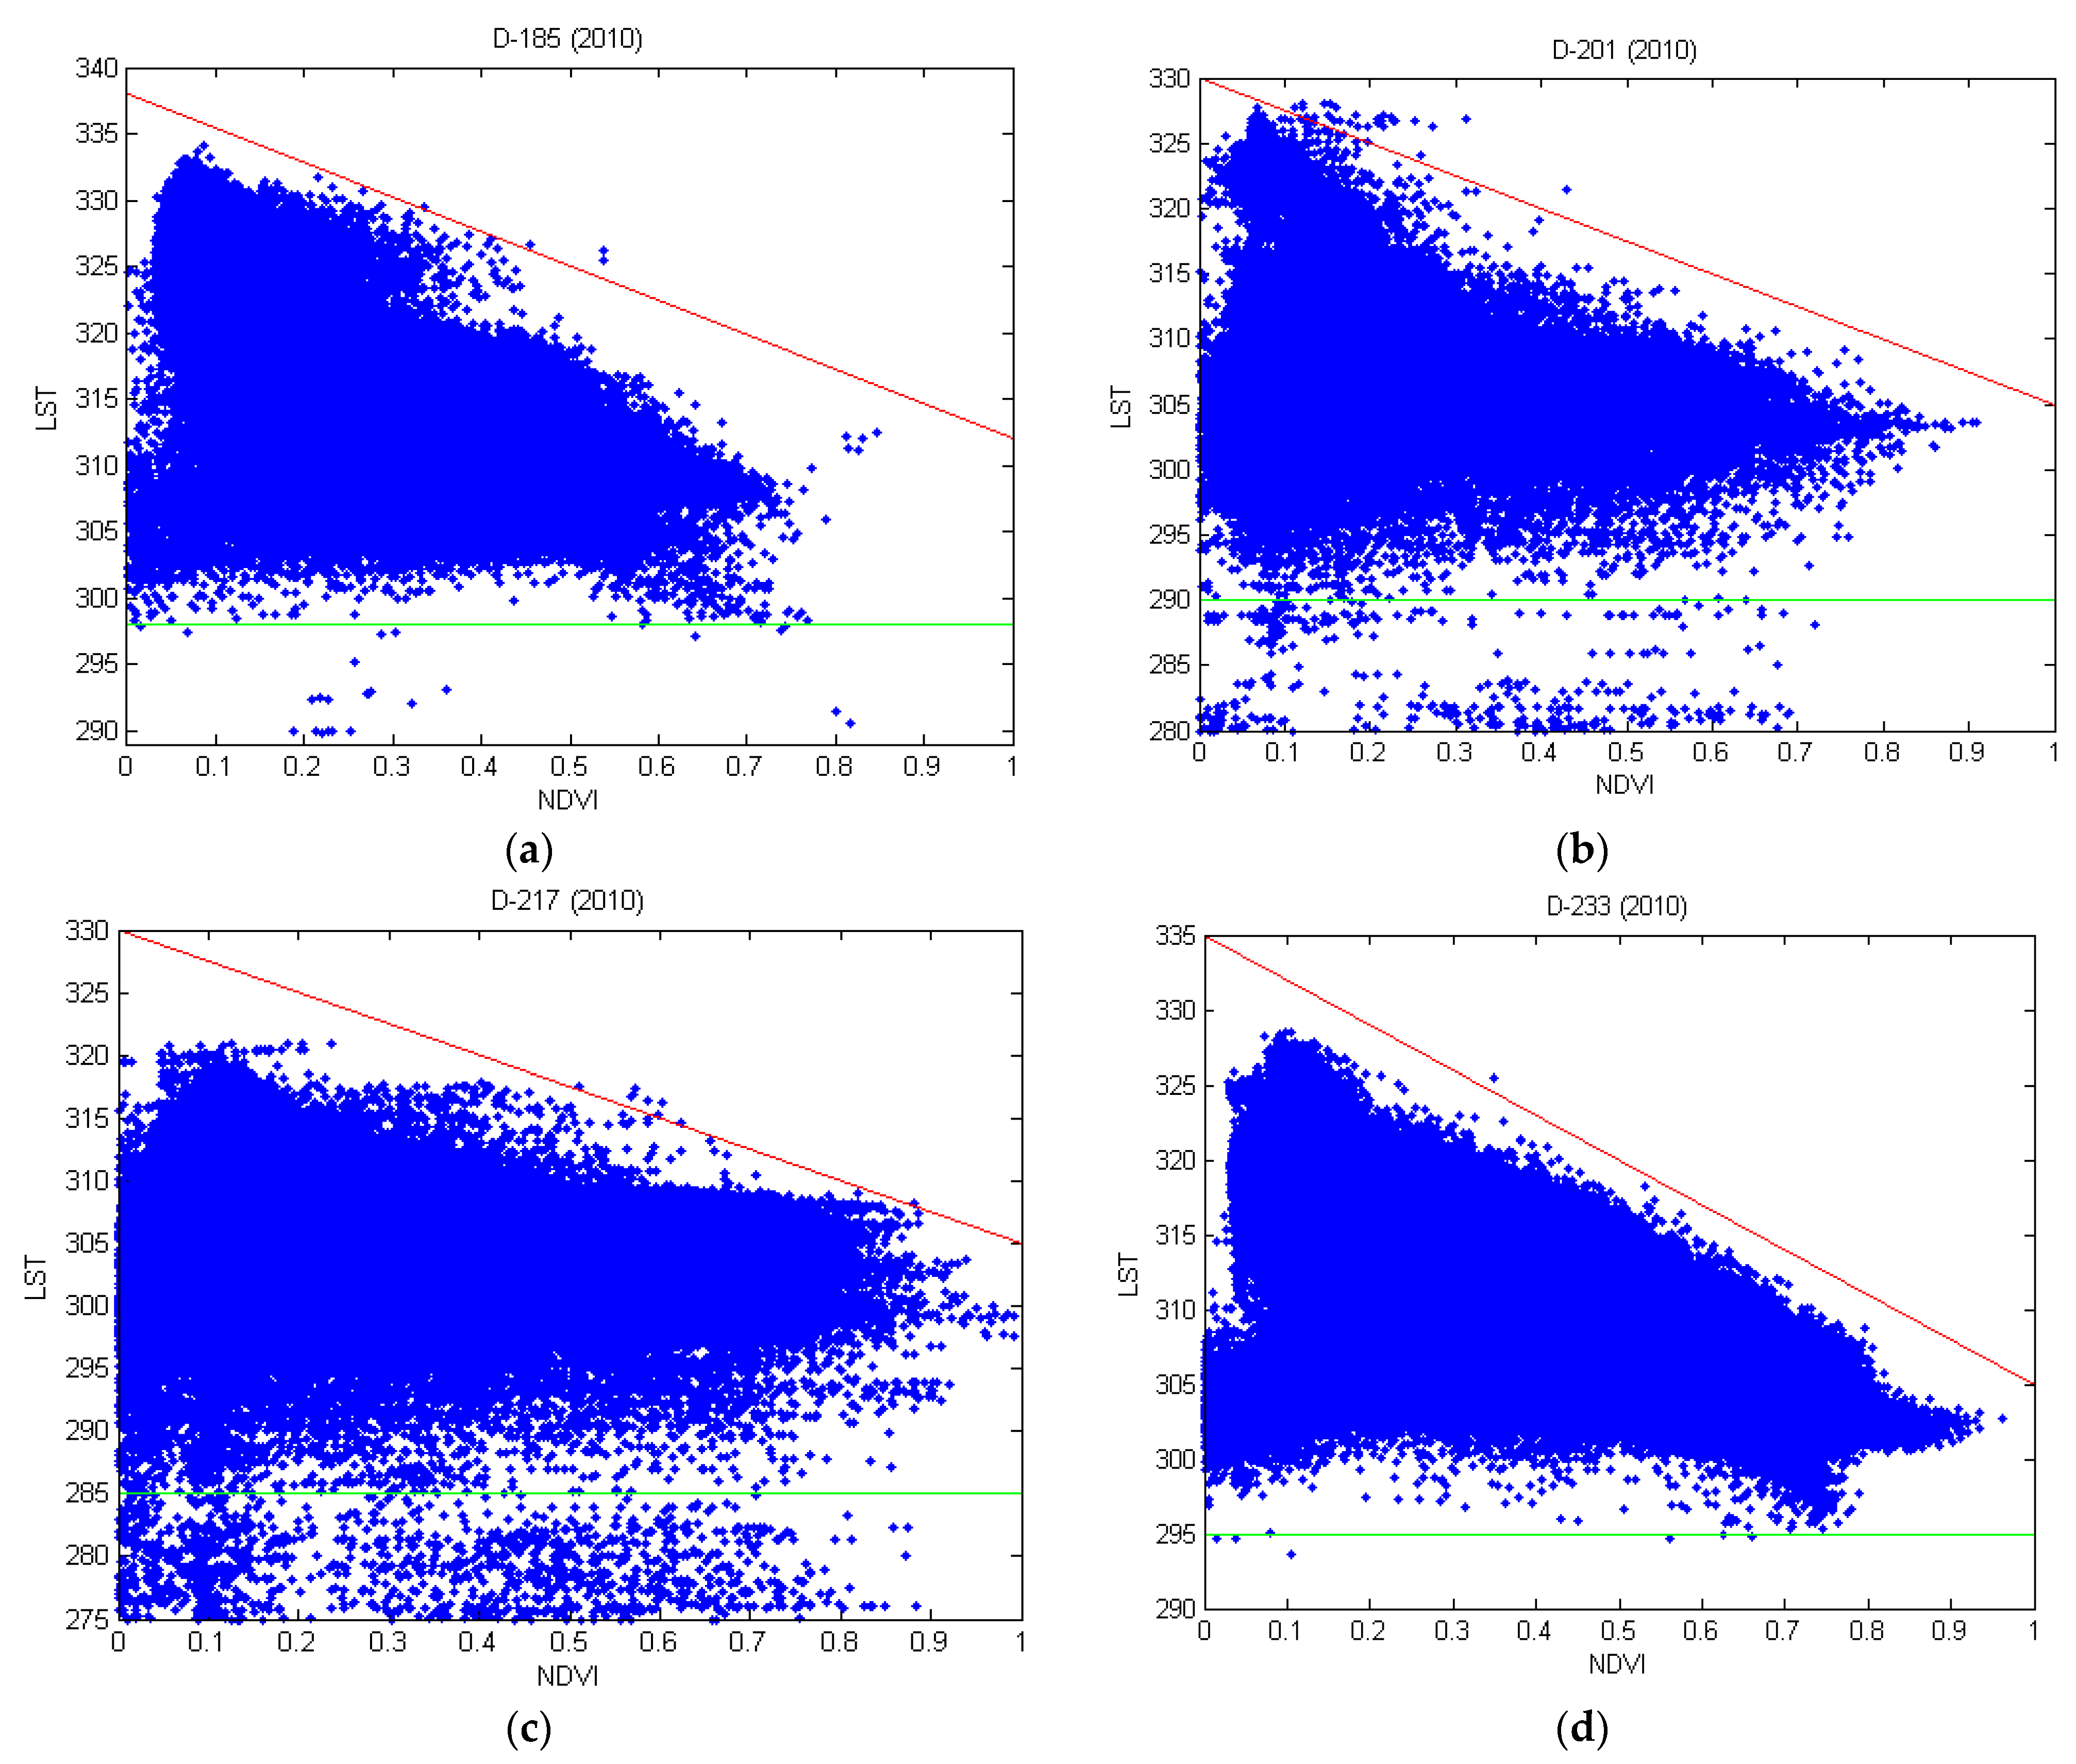
3.1. Determining Drought, ‘Warm and Cold Edges’ and Flood
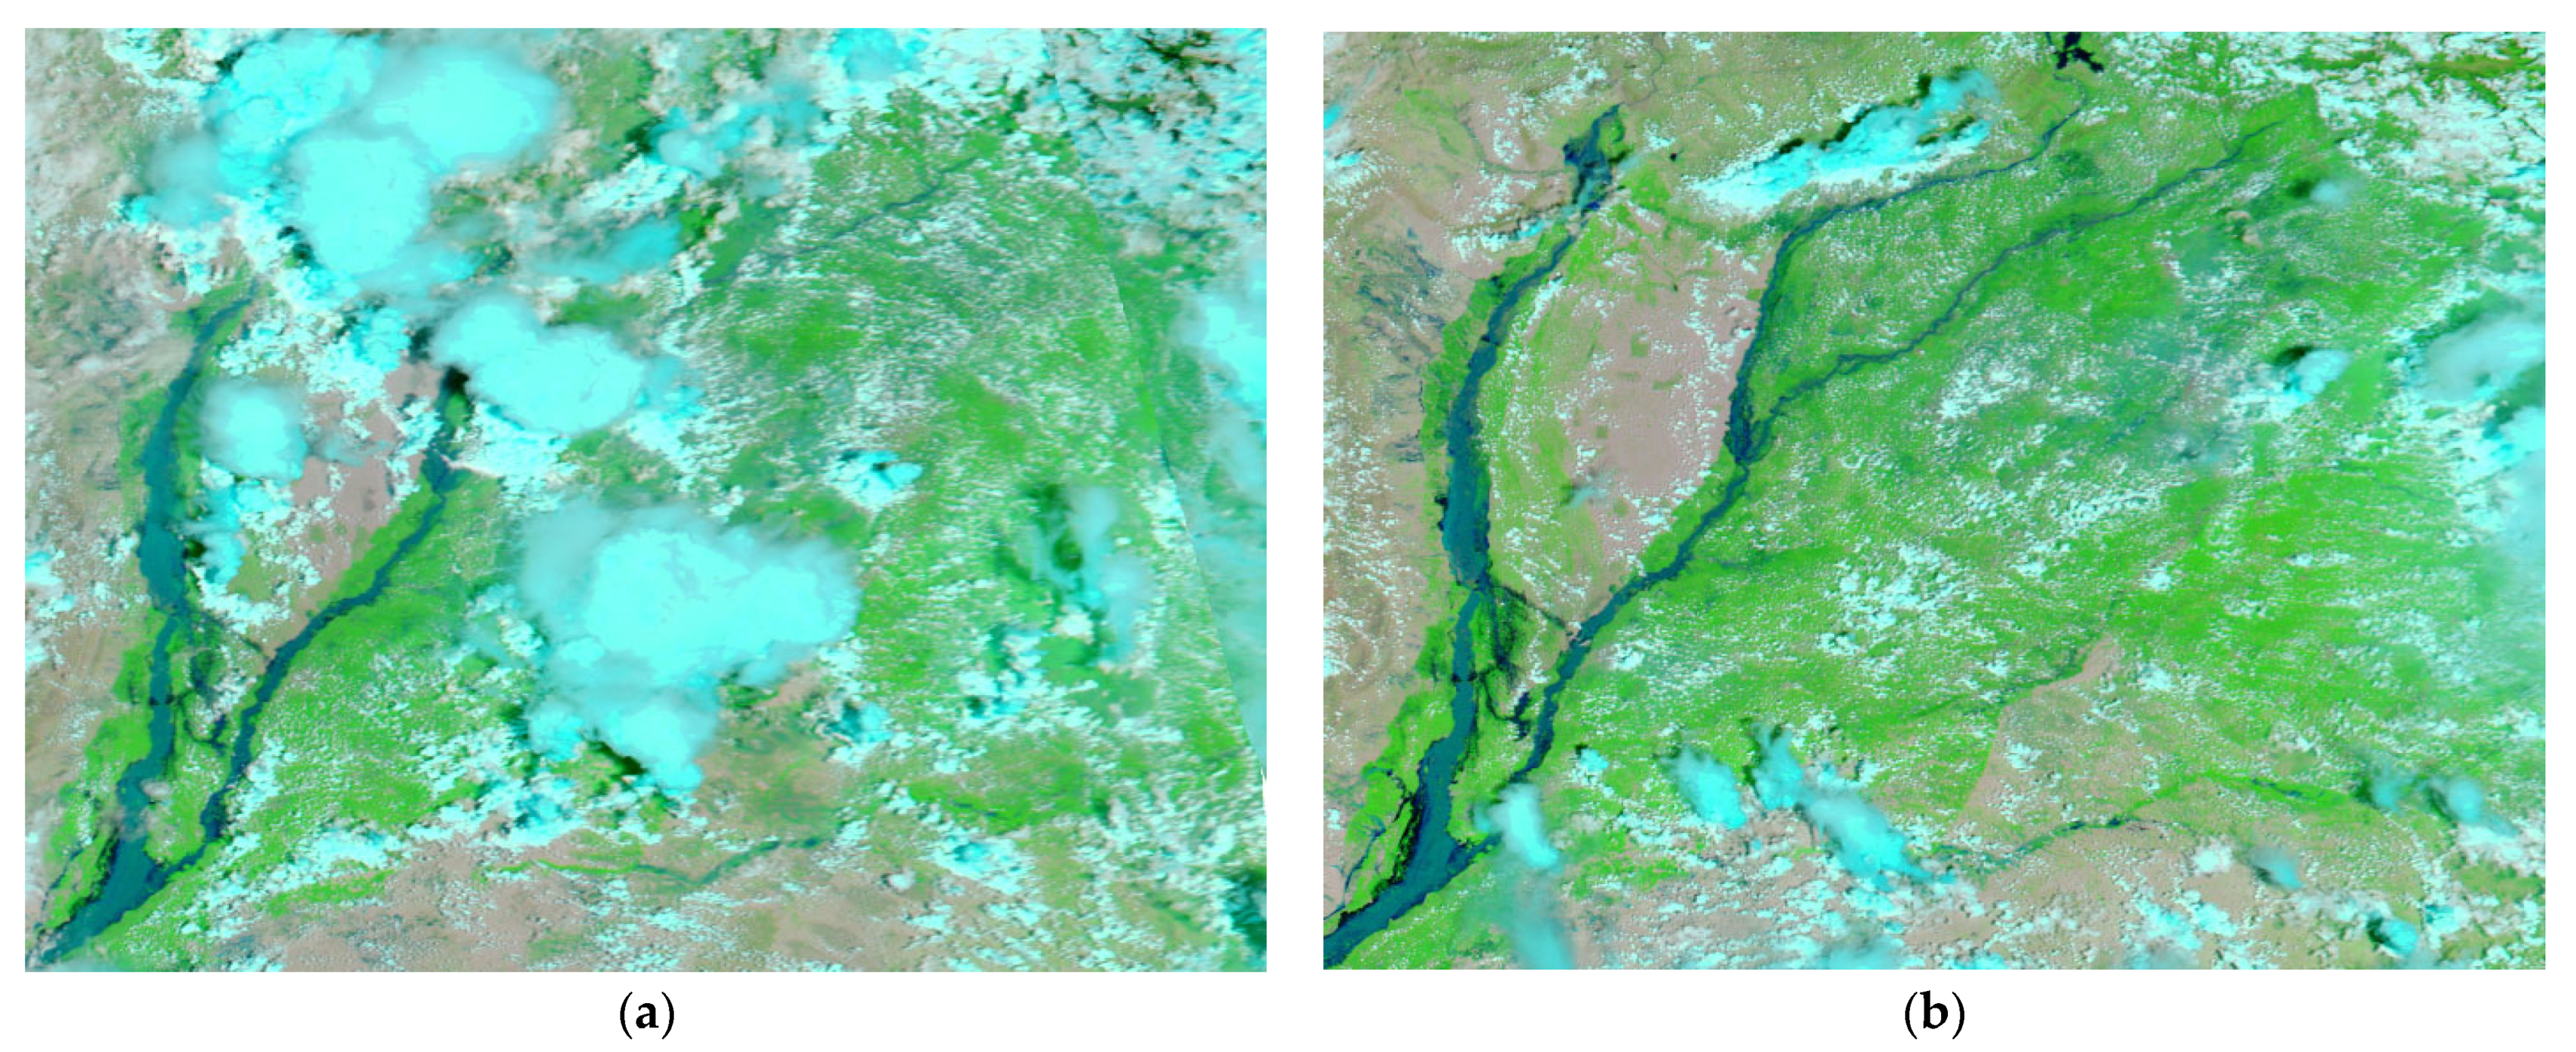
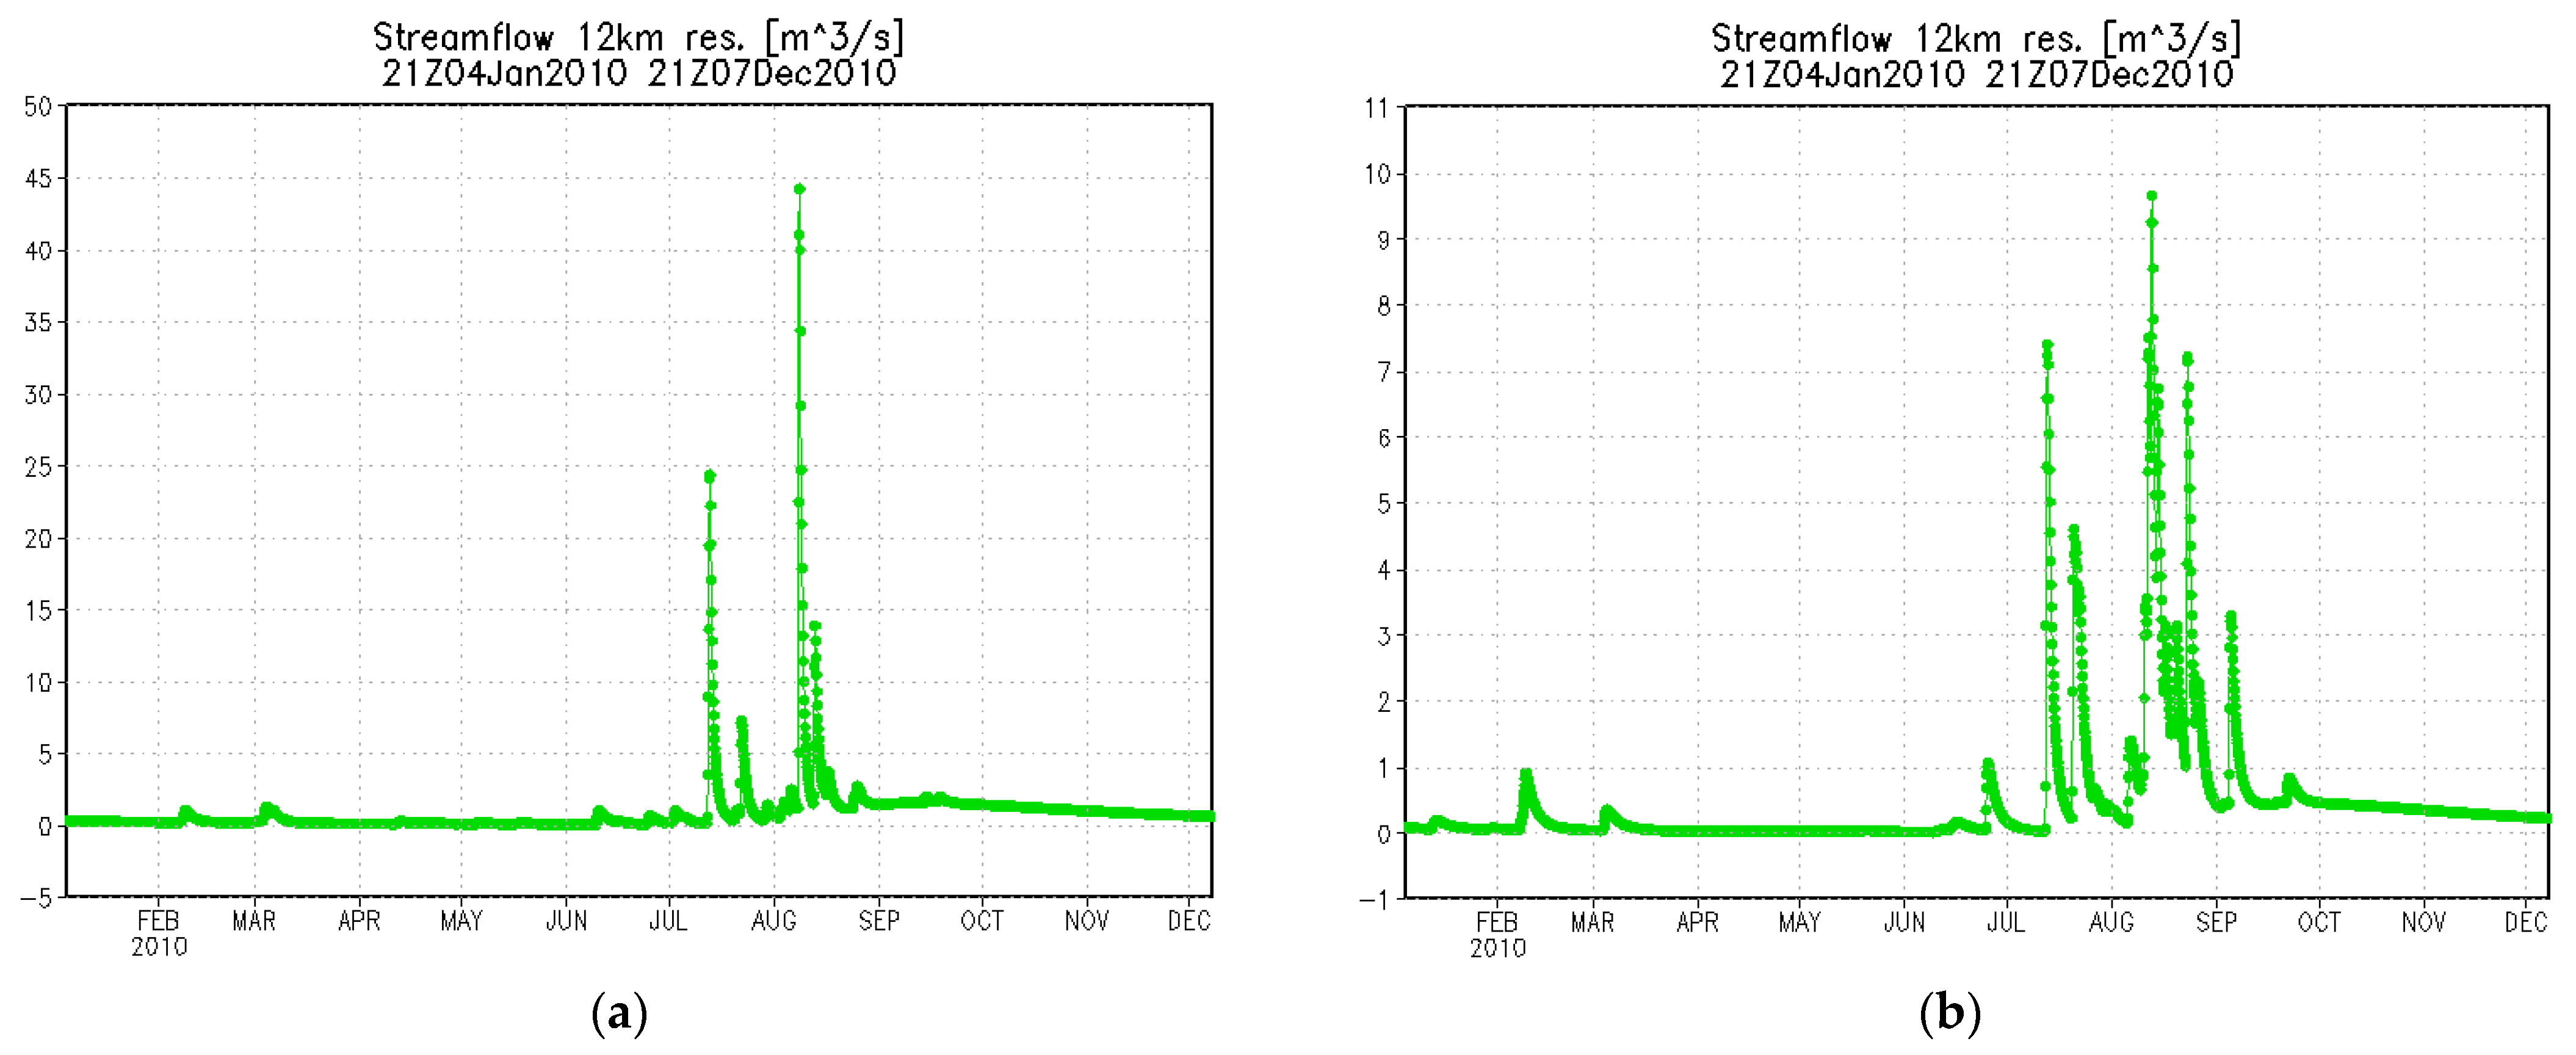
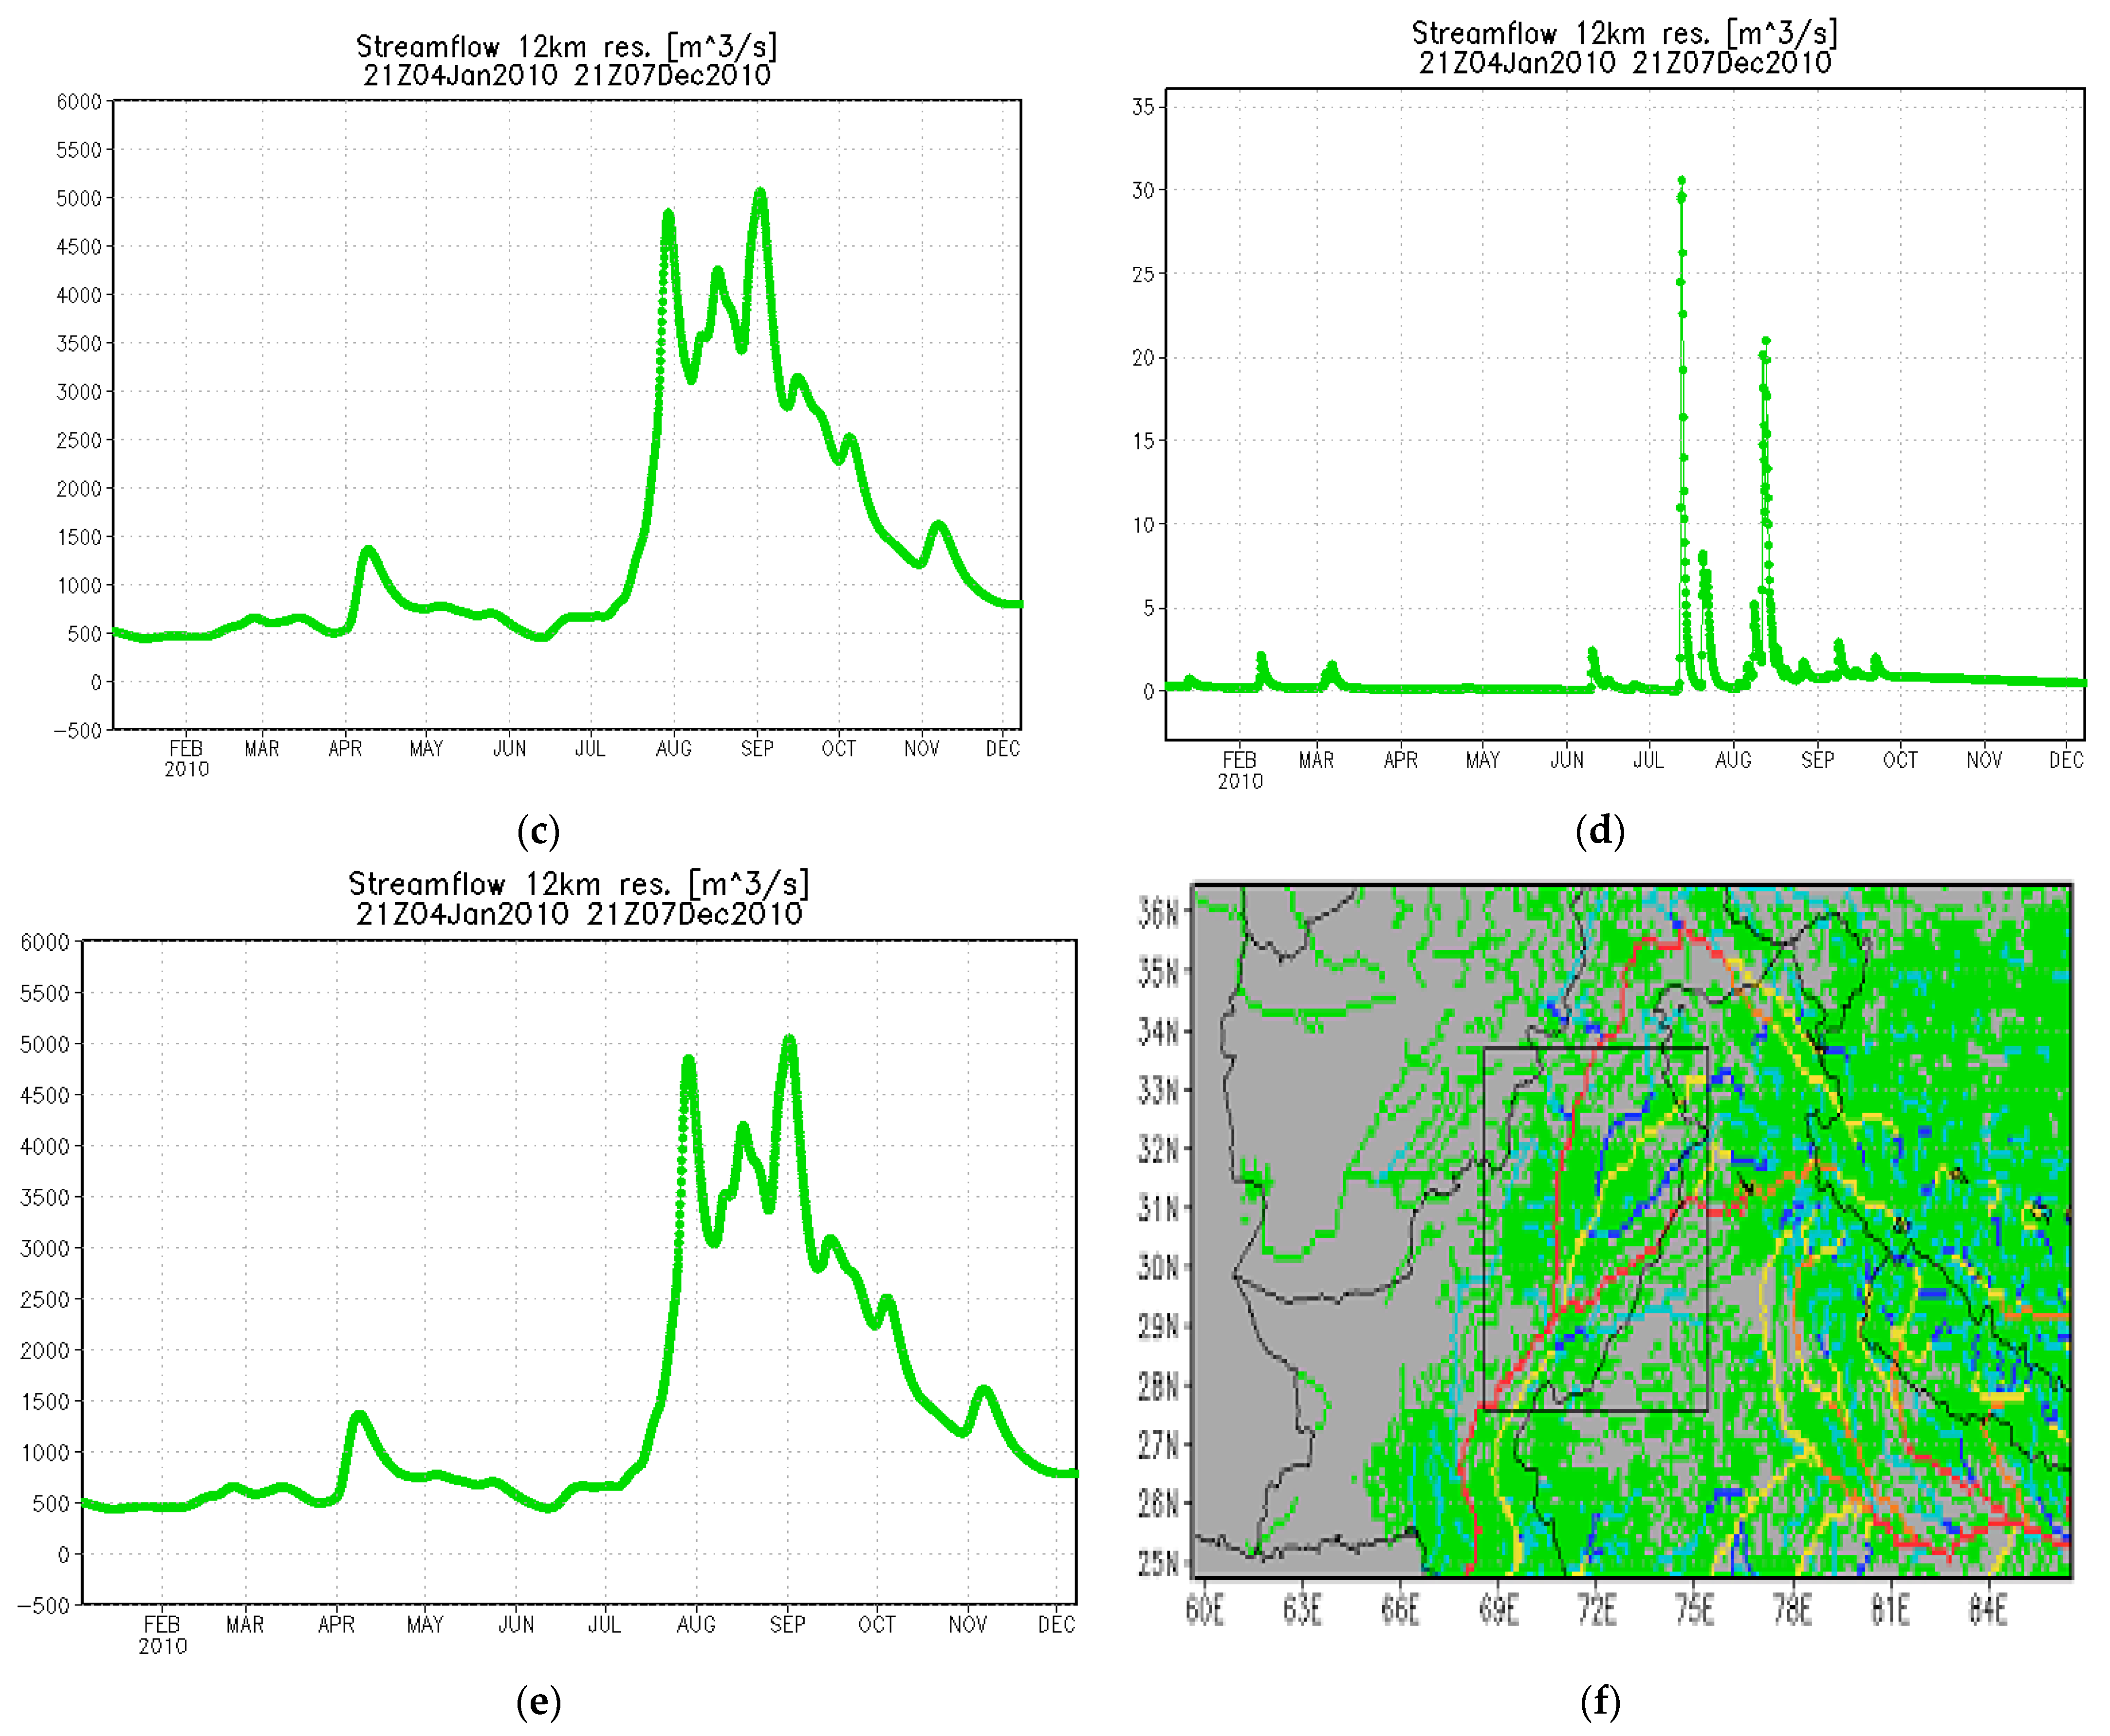
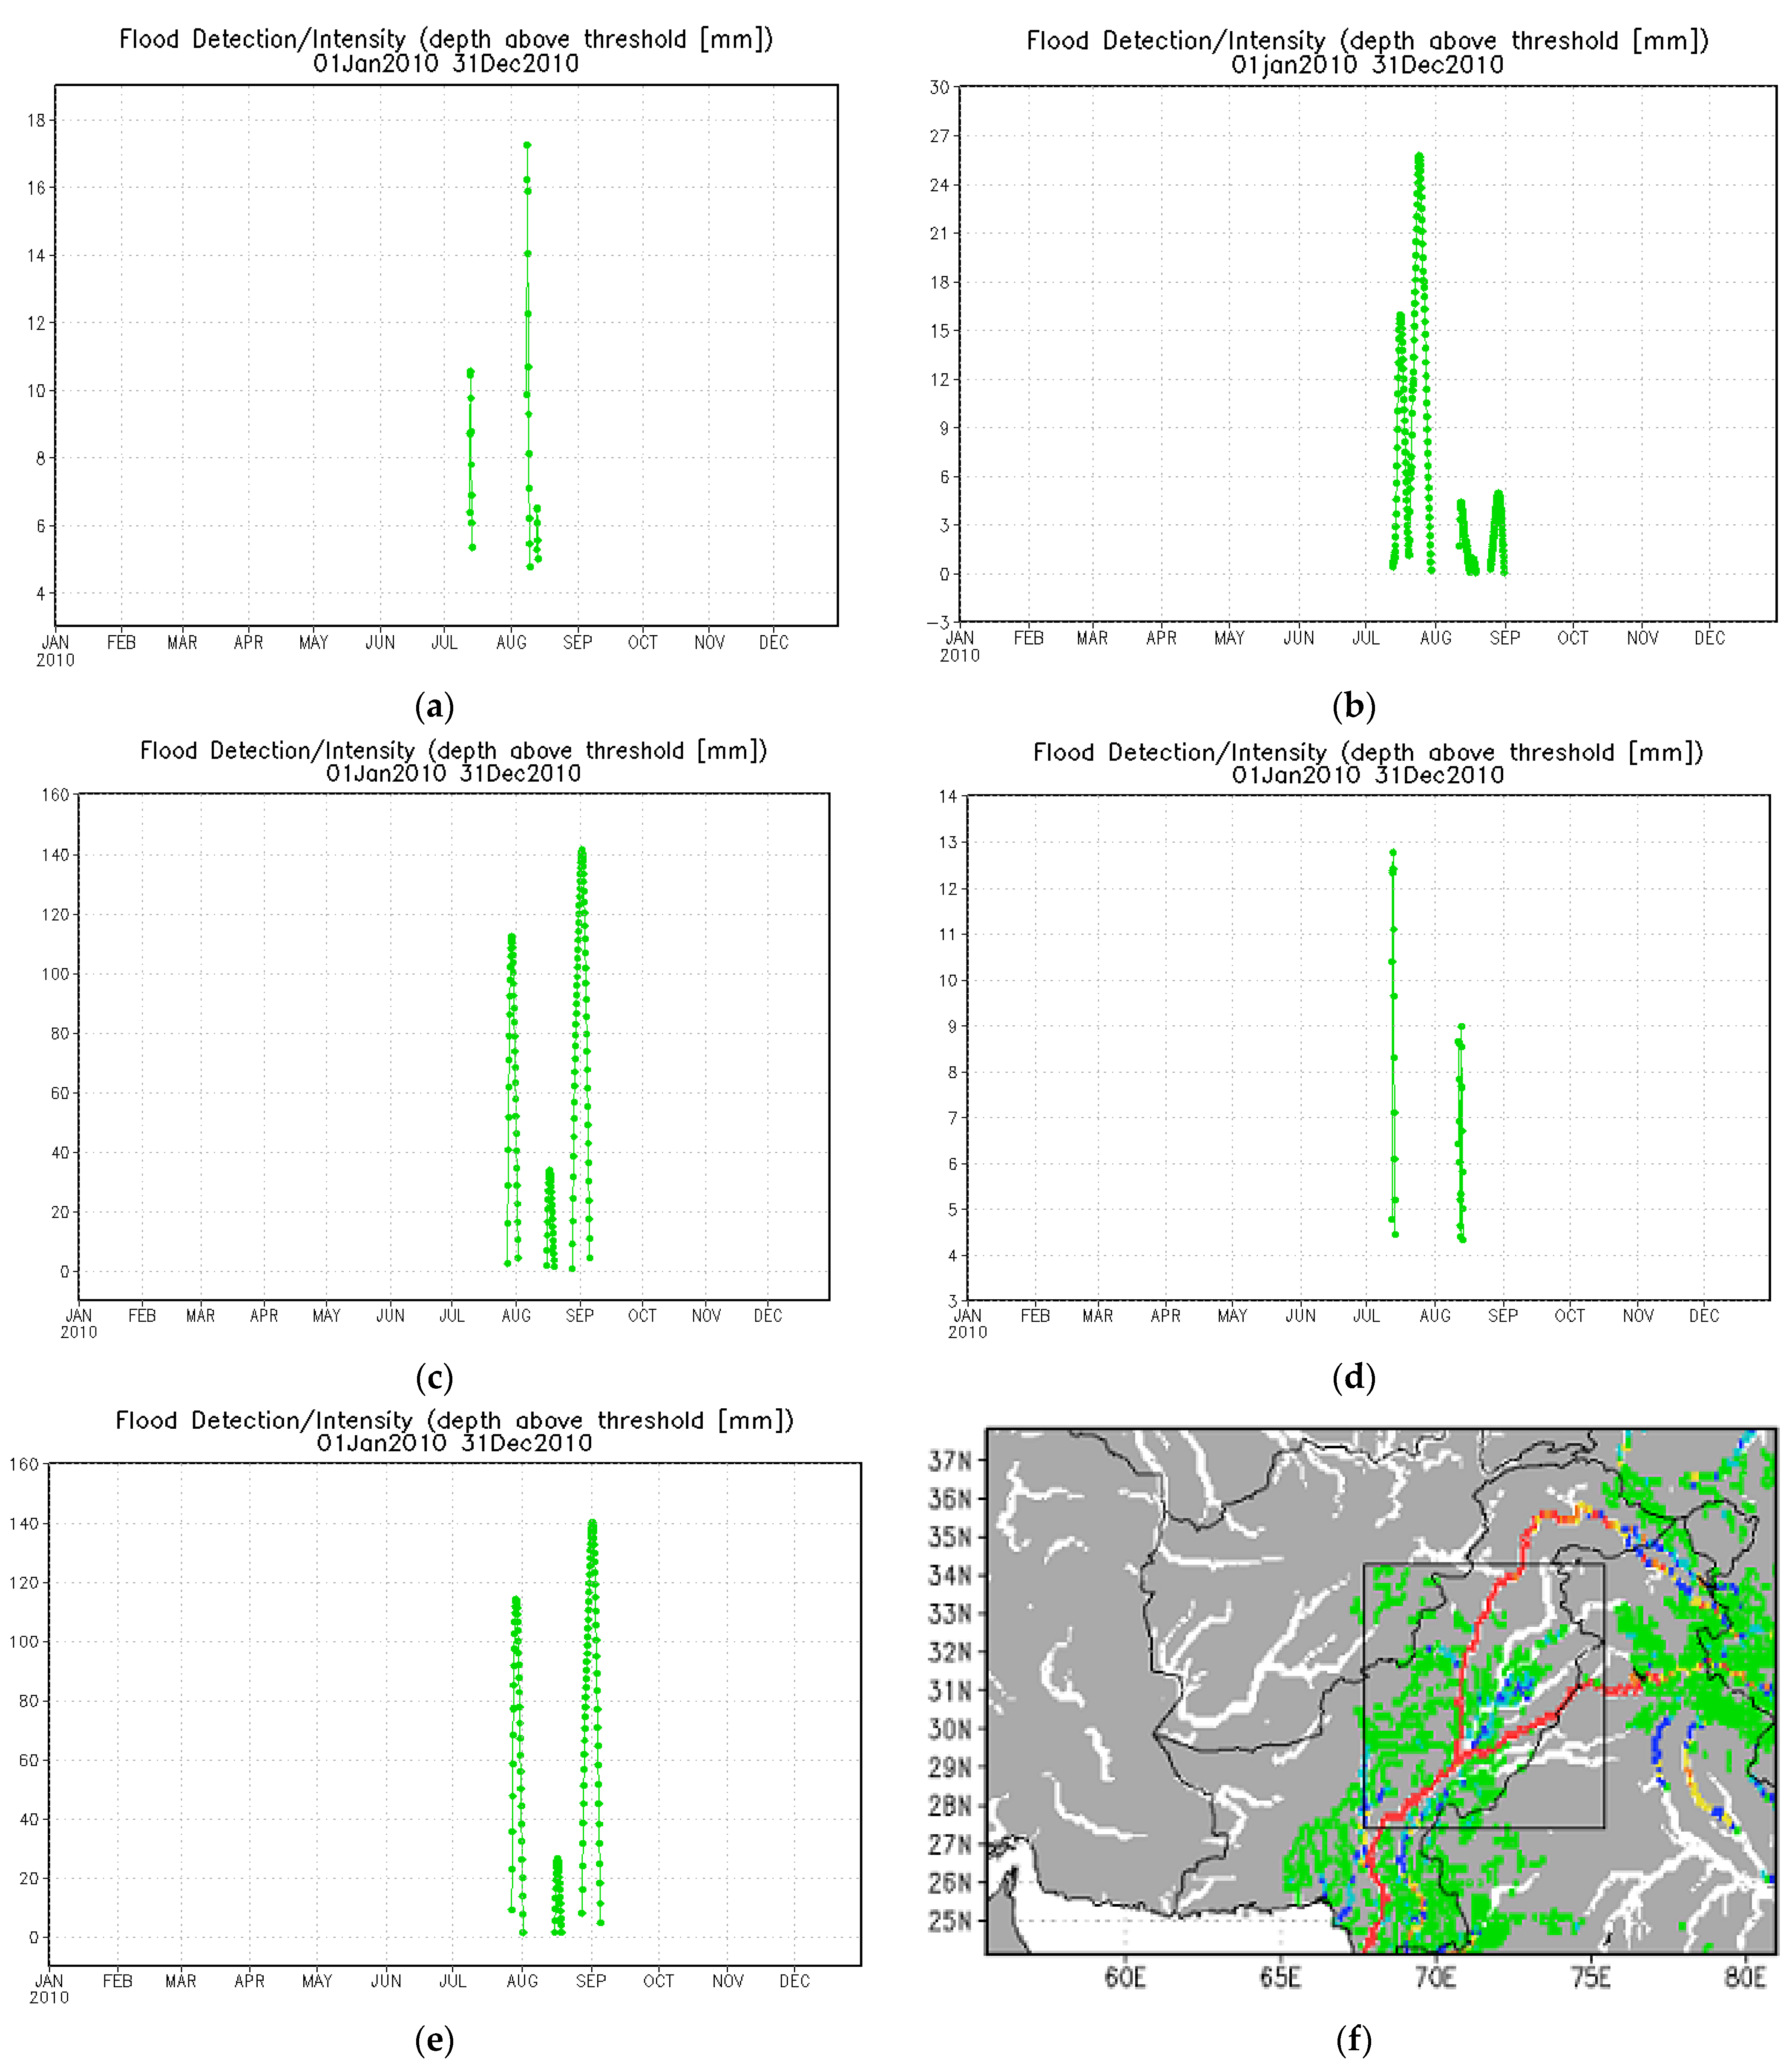
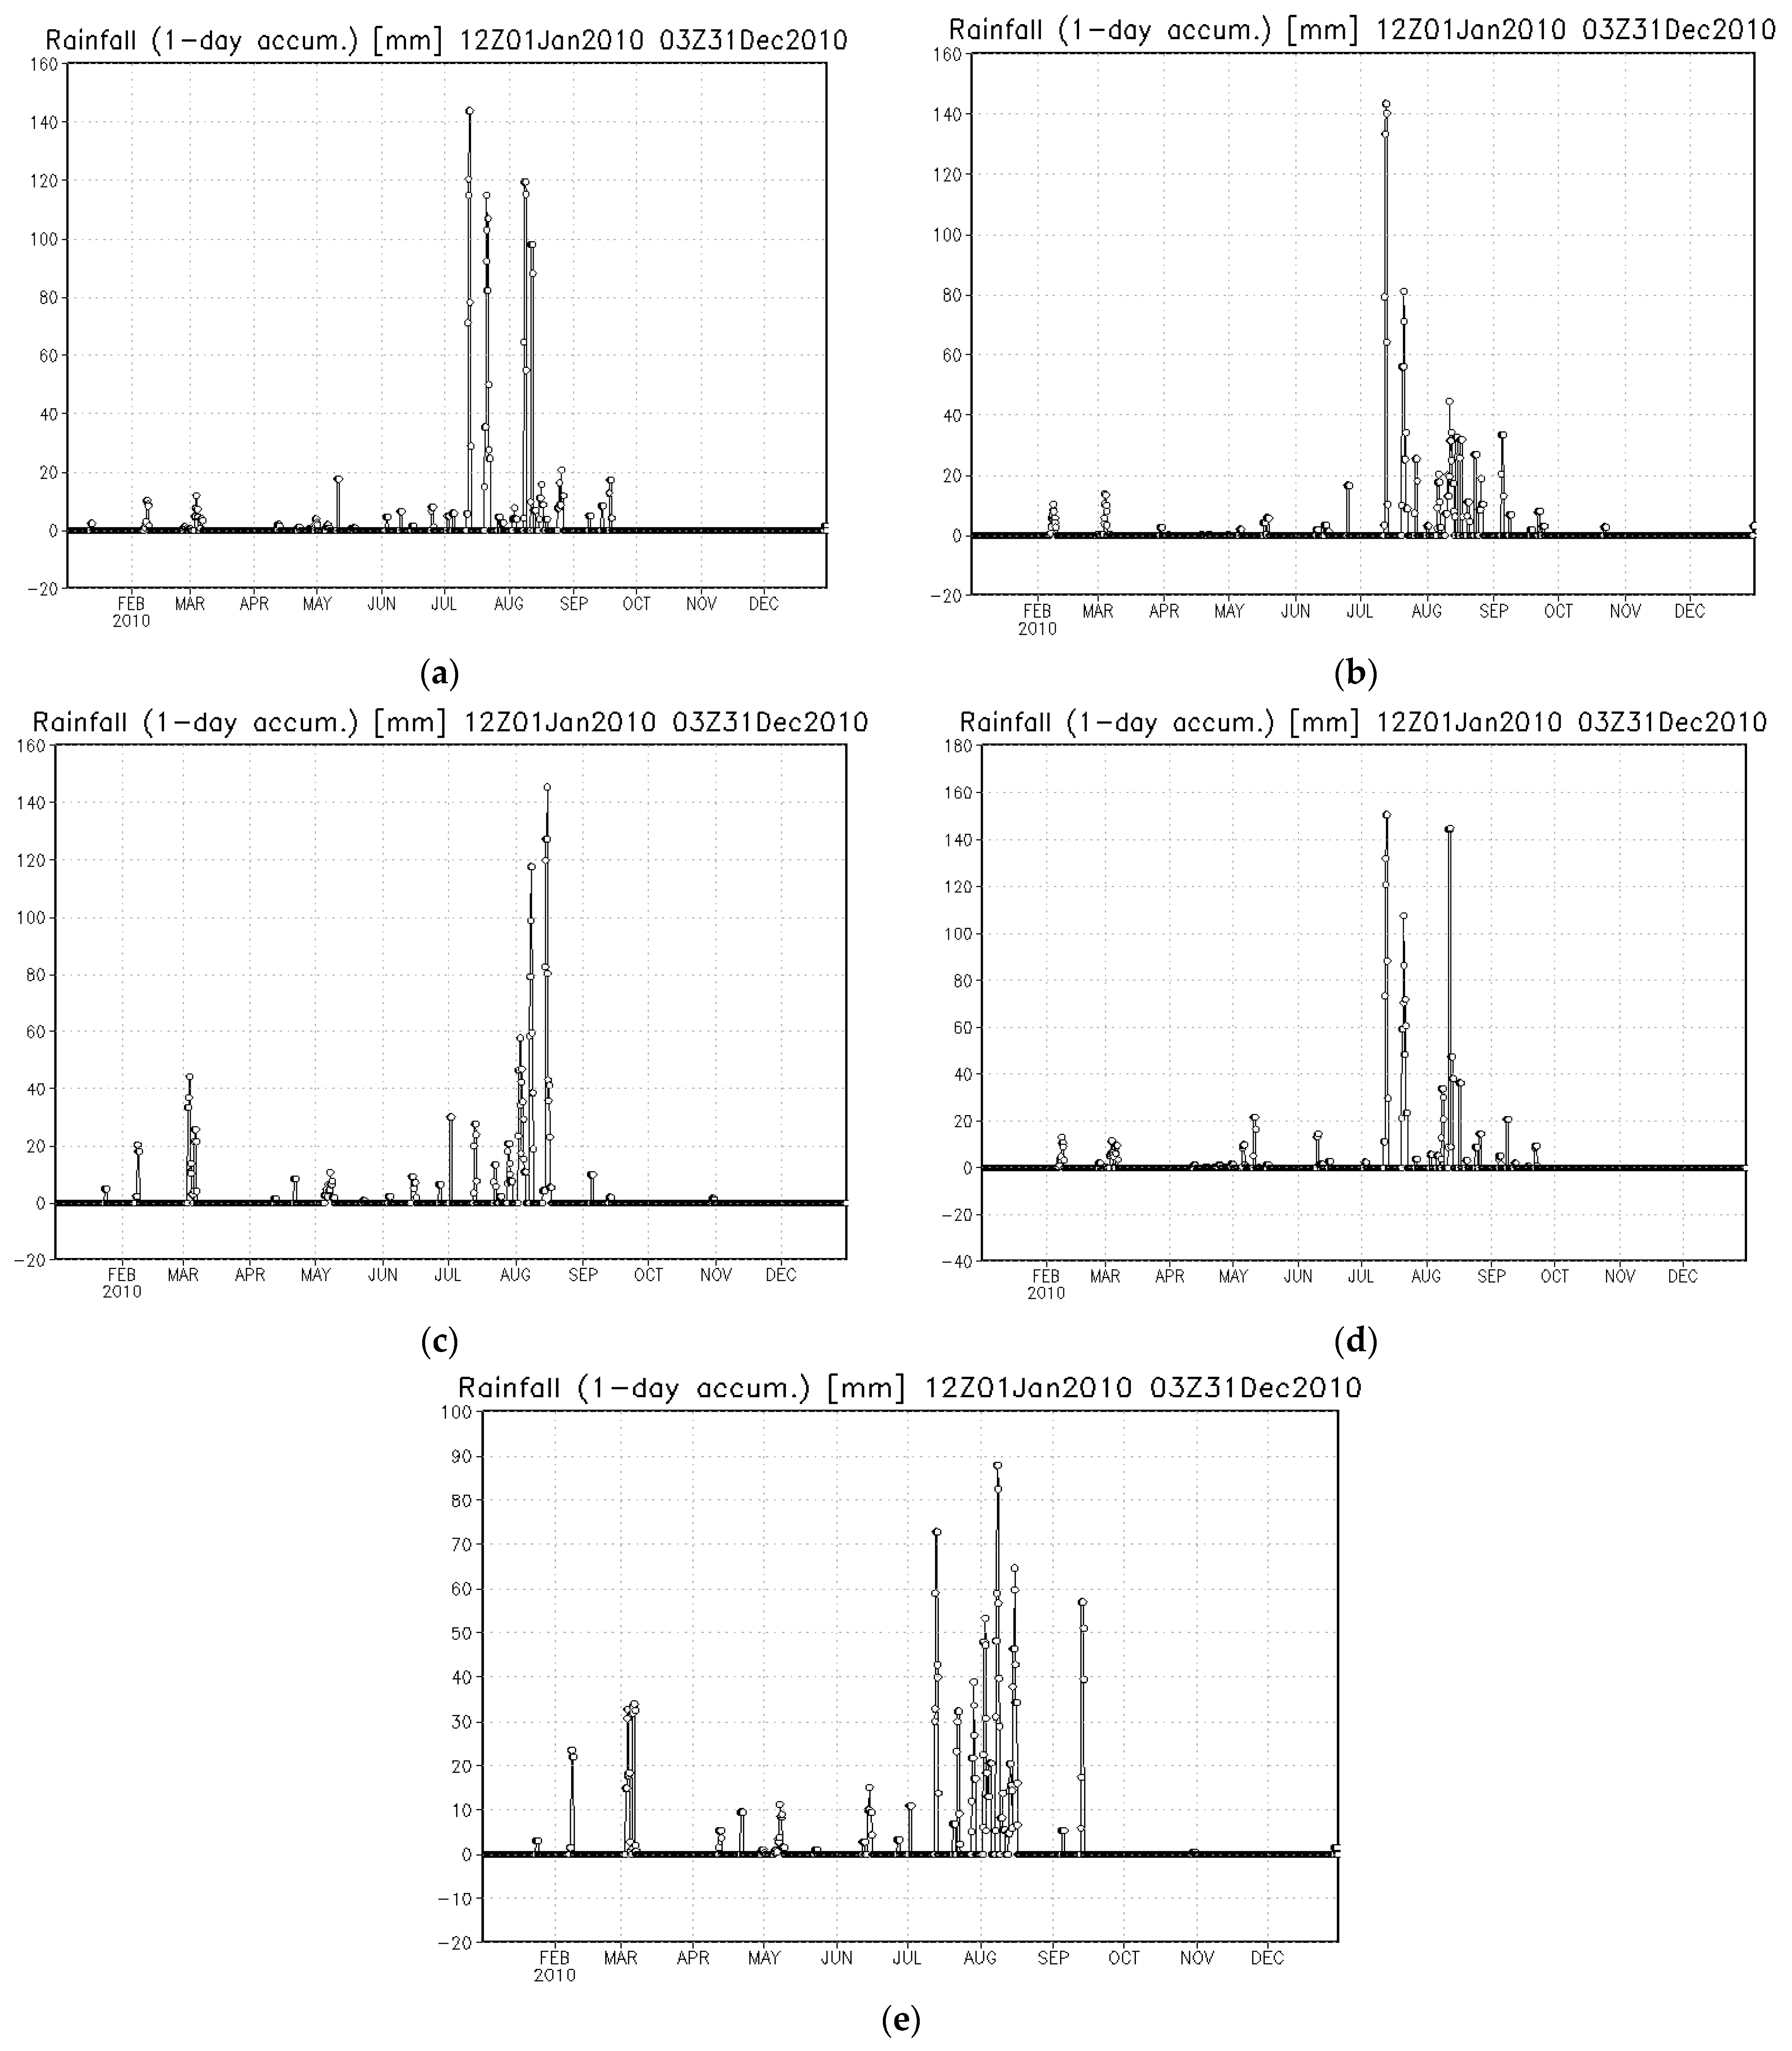
3.2. Determining the Flood Using the GFMS Model
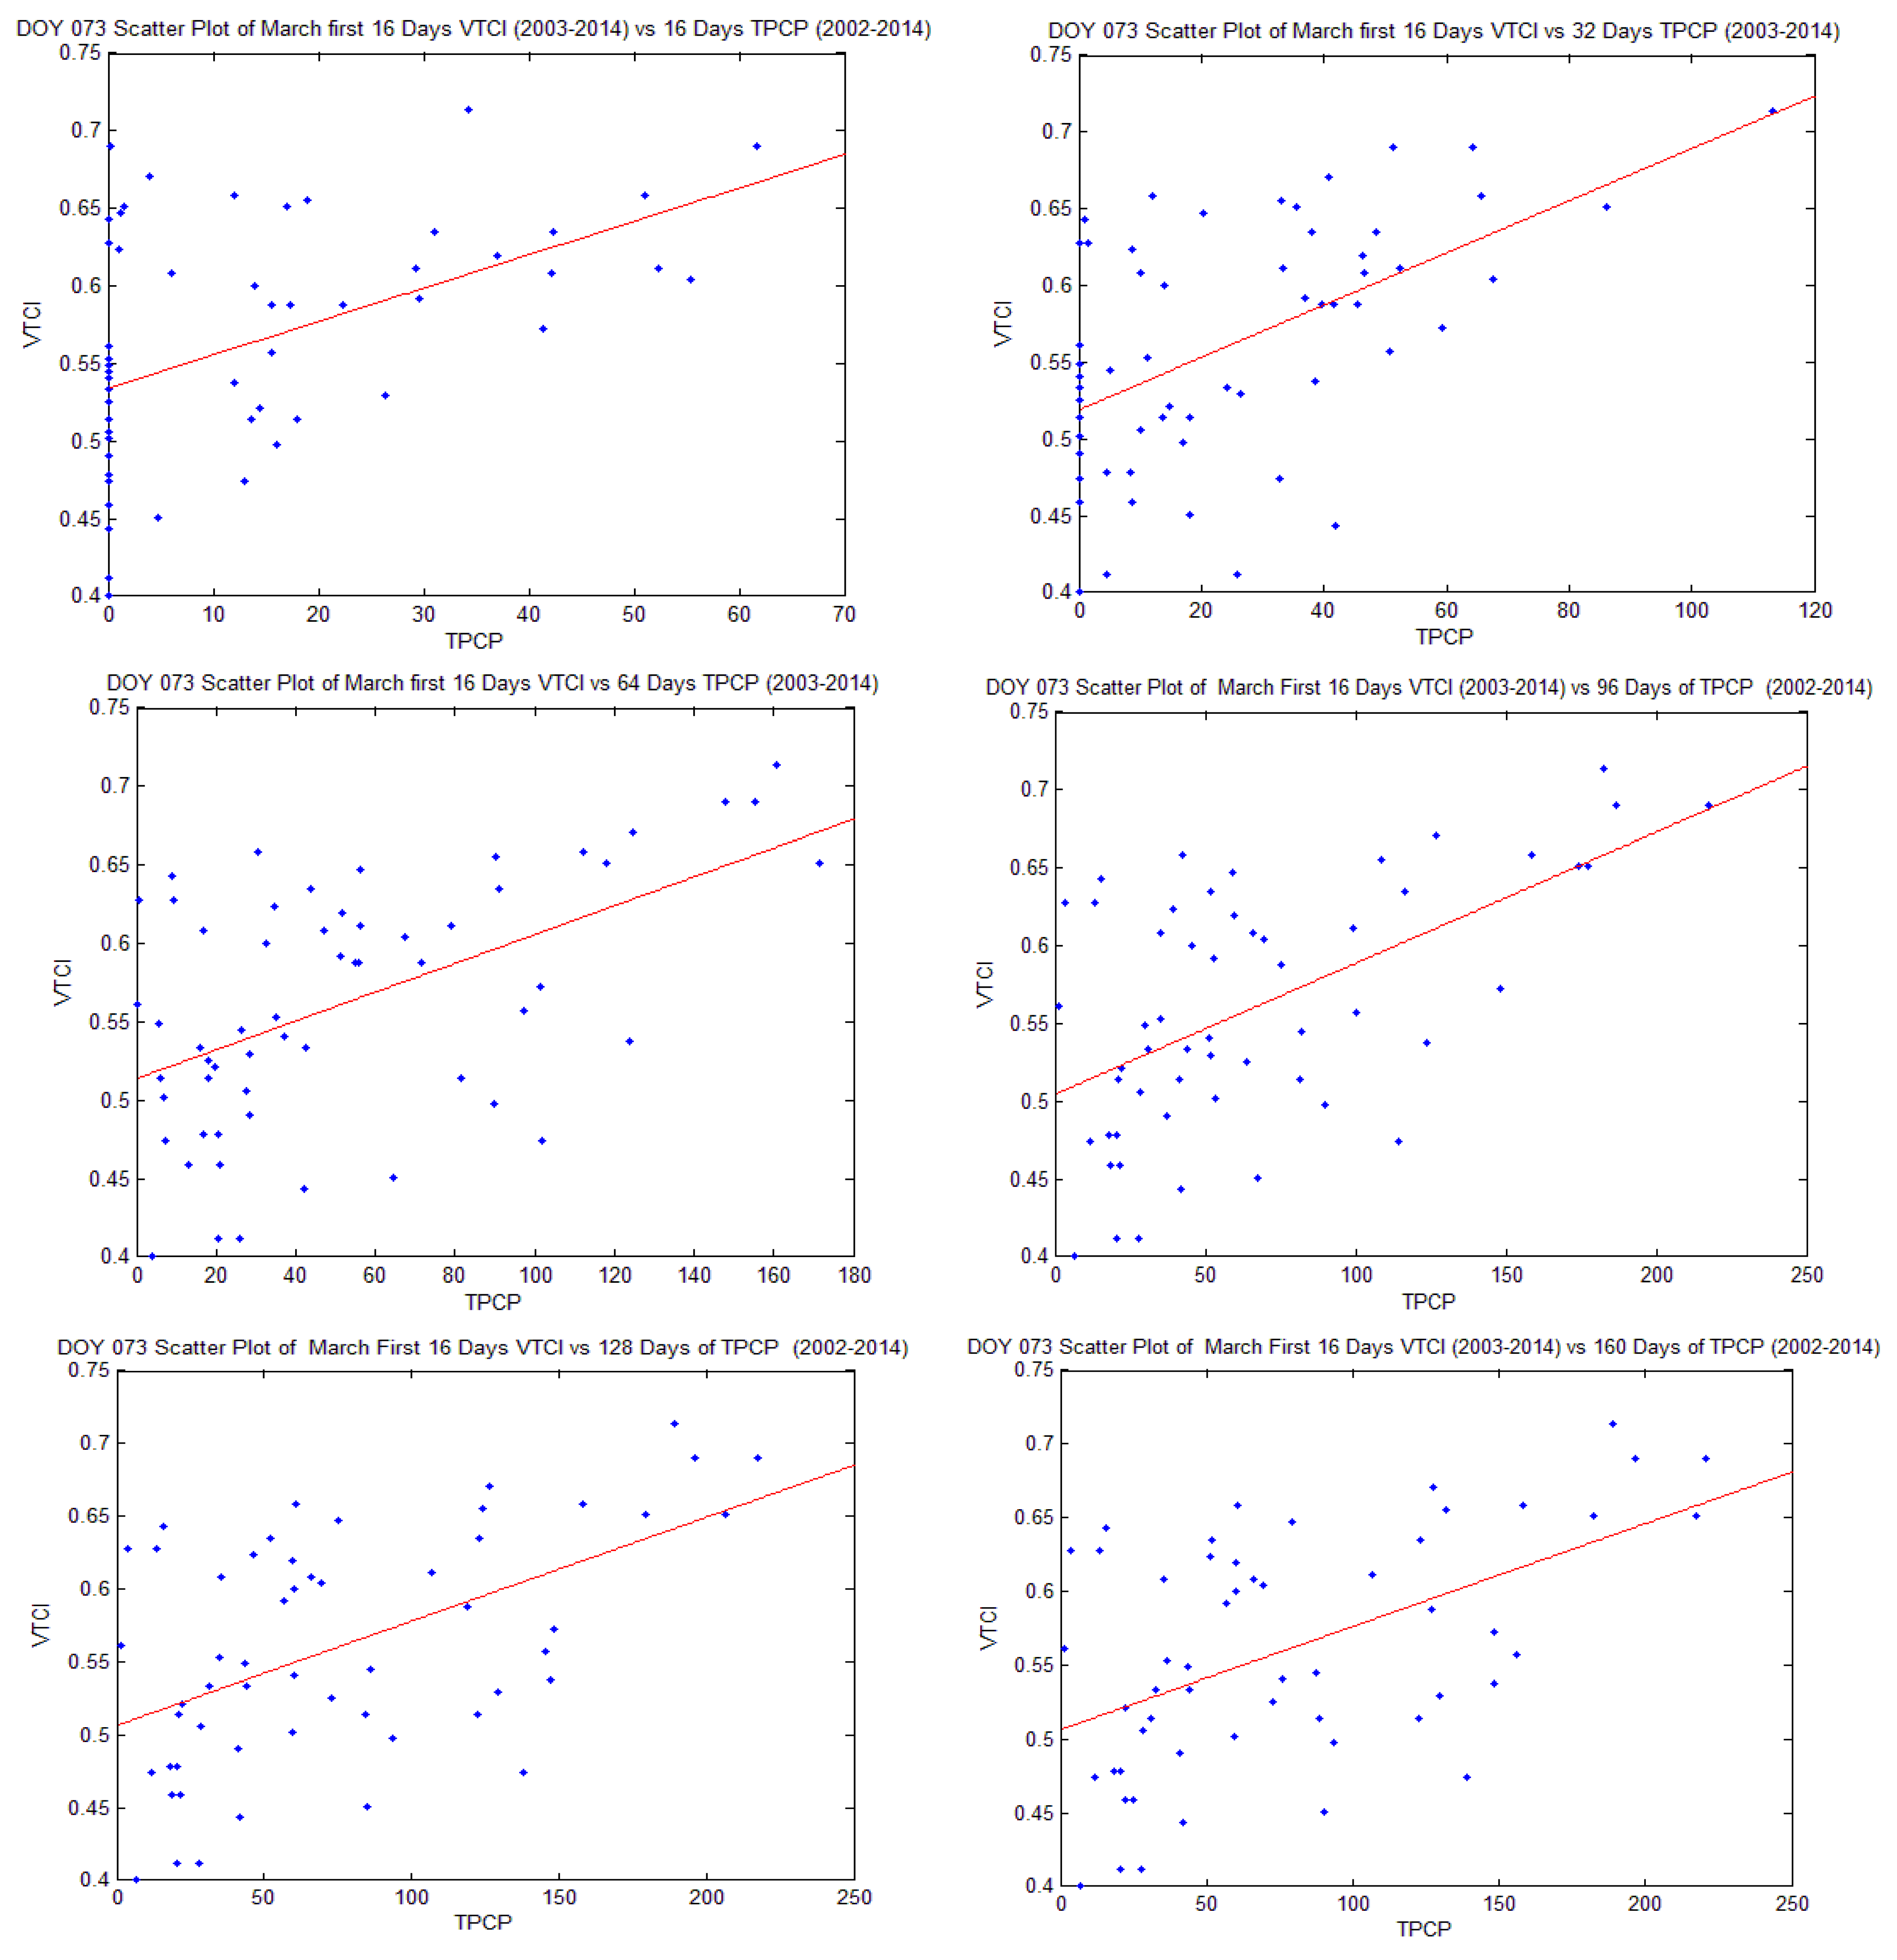
3.3. Validation of the Drought and Flood
4. Conclusions
Author Contributions
Funding
Data Availability Statement
Conflicts of Interest
References
- Wilhite, D.; Svoboda, M.; Hayes, M. Understanding the complex impacts of drought: A key to enhancing drought mitigation and preparedness. Water Resour. Manag. 2007, 21, 763–774. [Google Scholar] [CrossRef]
- Wu, J.; Chen, X.; Love, C.A.; Yao, H.; Chen, X.; AghaKouchak, A. Determination of water required to recover from hydrological drought: Perspective from drought propagation and non-standardized indices. J. Hydrol. 2020, 590, 125227. [Google Scholar] [CrossRef]
- Ullah, I.; Ma, X.; Yin, J.; Asfaw, T.G.; Azam, K.; Syed, S.; Liu, M.; Arshad, M.; Shahzaman, M. Evaluating the meteorological drought characteristics over Pakistan using in situ observations and reanalysis products. Int. J. Climatol. 2021, 41, 4437–4459. [Google Scholar] [CrossRef]
- Hina, S.; Saleem, F.; Arshad, A.; Hina, A.; Ullah, I. Droughts over Pakistan: Possible cycles, precursors and associated mechanisms. Geomat. Nat. Hazards Risk 2021, 12, 1638–1668. [Google Scholar] [CrossRef]
- Shahzaman, M.; Zhu, W.; Ullah, I.; Mustafa, F.; Bilal, M.; Ishfaq, S.; Nisar, S.; Arshad, M.; Iqbal, R.; Aslam, R.W. Comparison of multi-year reanalysis, models, and satellite remote sensing products for agricultural drought monitoring over South Asian countries. Remote Sens. 2021, 13, 3294. [Google Scholar] [CrossRef]
- Ullah, I.; Ma, X.; Yin, J.; Saleem, F.; Syed, S.; Omer, A.; Habtemicheal, B.A.; Liu, M.; Arshad, M. Observed changes in seasonal drought characteristics and their possible potential drivers over Pakistan. Int. J. Climatol. 2022, 42, 1576–1596. [Google Scholar] [CrossRef]
- Sein, Z.M.M.; Zhi, X.; Ullah, I.; Azam, K.; Ngoma, H.; Saleem, F.; Xing, Y.; Iyakaremye, V.; Syed, S.; Hina, S.; et al. Recent variability of sub-seasonal monsoon precipitation and its potential drivers in Myanmar using in-situ observation during 1981–2020. Int. J. Climatol. 2022, 42, 3341–3359. [Google Scholar] [CrossRef]
- Ahmad, B.; Kaleem, M.S.; Butt, M.J.; Dahri, Z.H. Hydrological modelling and flood hazard mapping of Nullah Lai. Proc. Pakistan Acad. Sci. 2010, 47, 215–226. [Google Scholar]
- Shahzaman, M.; Zhu, W.; Bilal, M.; Habtemicheal, B.; Mustafa, F.; Arshad, M.; Ullah, I.; Ishfaq, S.; Iqbal, R. Remote sensing indices for spatial monitoring of agricultural drought in South Asian countries. Remote Sens. 2021, 13, 2059. [Google Scholar] [CrossRef]
- Arshad, M.; Ma, X.; Yin, J.; Ullah, W.; Liu, M.; Ullah, I. Performance evaluation of ERA-5, JRA-55, MERRA-2, and CFS-2 reanalysis datasets, over diverse climate regions of Pakistan. Weather Clim. Extrem. 2021, 33, 100373. [Google Scholar] [CrossRef]
- Ullah, I.; Saleem, F.; Iyakaremye, V.; Yin, J.; Ma, X.; Syed, S.; Hina, S.; Asfaw, T.G.; Omer, A. Projected changes in socioeconomic exposure to heatwaves in South Asia under changing climate. Earth’s Future 2022, 10, e2021EF002240. [Google Scholar] [CrossRef]
- Uwimbabazi, J.; Jing, Y.; Iyakaremye, V.; Ullah, I.; Ayugi, B. Observed changes in meteorological drought events during 1981–2020 over Rwanda, East Africa. Sustainability 2022, 14, 1519. [Google Scholar] [CrossRef]
- Lu, K.; Arshad, M.; Ma, X.; Ullah, I.; Wang, J.; Shao, W. Evaluating observed and future spatiotemporal changes in precipitation and temperature across China based on CMIP6-GCMs. Int. J. Climatol. 2022, 42, 7703–7729. [Google Scholar] [CrossRef]
- Sajjad, M.M.; Wang, J.; Abbas, H.; Ullah, I.; Khan, R.; Ali, F. Impact of climate and land-use change on groundwater resources, study of Faisalabad District, Pakistan. Atmosphere 2022, 13, 1097. [Google Scholar] [CrossRef]
- Ahmad, Z.; Hafeez, M.; Ahmad, I. Hydrology of mountainous areas in the upper Indus Basin, Northern Pakistan with the perspective of climate change. Environ. Monit. Assess. 2012, 184, 5255–5274. [Google Scholar] [CrossRef] [PubMed]
- Hassan, M.; Du, P.; Mahmood, R.; Jia, S.; Iqbal, W. Streamflow response to projected climate changes in the Northwestern Upper Indus Basin based on regional climate model (RegCM4.3) simulation. J. Hydro-Environ. Res. 2019, 27, 32–49. [Google Scholar] [CrossRef]
- Ullah, I.; Ma, X.; Asfaw, T.G.; Yin, J.; Iyakaremye, V.; Saleem, F.; Xing, Y.; Azam, K.; Syed, S. Projected changes in increased drought risks over South Asia under a warmer climate. Earth’s Future 2022, 10, e2022EF002830. [Google Scholar] [CrossRef]
- Xing, Y.; Shao, D.; Liang, Q.; Chen, H.; Ma, X.; Ullah, I. Investigation of the drainage loss effects with a street view based drainage calculation method in hydrodynamic modelling of pluvial floods in urbanized area. J. Hydrol. 2022, 605, 127365. [Google Scholar] [CrossRef]
- Sein, Z.M.M.; Ullah, I.; Iyakaremye, V.; Azam, K.; Ma, X.; Syed, S.; Zhi, X. Observed spatiotemporal changes in air temperature, dew point temperature and relative humidity over Myanmar during 2001–2019. Meteorol. Atmos. Phys. 2022, 134, 7. [Google Scholar] [CrossRef]
- Ullah, I.; Ma, X.; Yin, J.; Omer, A.; Habtemicheal, B.A.; Saleem, F.; Iyakaremye, V.; Syed, S.; Arshad, M.; Liu, M. Spatiotemporal characteristics of meteorological drought variability and trends (1981–2020) over South Asia and the associated large-scale circulation patterns. Clim. Dyn. 2022. [Google Scholar] [CrossRef]
- Mie Sein, Z.M.; Ullah, I.; Saleem, F.; Zhi, X.; Syed, S.; Azam, K. Interdecadal variability in myanmar rainfall in the Monsoon Season (May–October) using eigen methods. Water 2021, 13, 729. [Google Scholar] [CrossRef]
- Ullah, I.; Ma, X.; Ren, G.; Yin, J.; Iyakaremye, V.; Syed, S.; Lu, K.; Xing, Y.; Singh, V.P. Recent changes in drought events over South Asia and their possible linkages with climatic and dynamic factors. Remote Sens. 2022, 14, 3219. [Google Scholar] [CrossRef]
- Aadhar, S.; Mishra, V. A substantial rise in the area and population affected by dryness in South Asia under 1.5 °C, 2.0 °C and 2.5 °C warmer worlds. Environ. Res. Lett. 2019, 14, 114021. [Google Scholar] [CrossRef]
- Zhou, J.; Jiang, T.; Wang, Y.; Su, B.; Tao, H.; Qin, J.; Zhai, J. Spatiotemporal variations of aridity index over the Belt and Road region under the 1.5 °C and 2.0 °C warming scenarios. J. Geogr. Sci. 2020, 30, 37–52. [Google Scholar] [CrossRef]
- Wu, J.; Yuan, X.; Yao, H.; Chen, X.; Wang, G. Reservoirs regulate the relationship between hydrological drought recovery water and drought characteristics. J. Hydrol. 2021, 603, 127127. [Google Scholar] [CrossRef]
- Ali, S.; Xu, Z.T.; Henchirli, M.; Wilson, K.; Zhang, J. Studying of drought phenomena and vegetation trends over South Asia from 1990 to 2015 by using AVHRR and NASA’s MERRA data. Environ. Sci. Pollut. Res. 2020, 27, 4756–4768. [Google Scholar] [CrossRef] [PubMed]
- Ullah, R.; Khan, J.; Ullah, I.; Khan, F.; Lee, Y. Assessing impacts of flood and drought over the Punjab Region of Pakistan using multi-satellite data products. Remote Sens. 2023, 15, 1484. [Google Scholar] [CrossRef]
- Palmer, W.C. Meteorological Drought; Pap. No. 45; US Department of Commerce, Weather Bureau: Washington, DC, USA, 1965; 58p. [Google Scholar]
- McKee, T.B.; Nolan, J.; Kleist, J. The relationship of drought frequency and duration to time scales. In Proceedings of the 8th Conference on Applied Climatology, Anaheim, CA, USA, 17–22 January 1993. [Google Scholar]
- Dai, A. Hydroclimatic trends during 1950–2018 over global land. Clim. Dyn. 2021, 56, 4027–4049. [Google Scholar] [CrossRef]
- Liu, M.; Ma, X.; Yin, Y.; Zhang, Z.; Yin, J.; Ullah, I.; Arshad, M. Non-stationary frequency analysis of extreme streamflow disturbance in a typical ecological function reserve of China under a changing climate. Ecohydrology 2021, 23, e2323. [Google Scholar] [CrossRef]
- Dai, A. Characteristics and trends in various forms of the Palmer Drought Severity Index during 1900-2008. J. Geophys. Res. Atmos. 2011, 116. [Google Scholar] [CrossRef]
- Dai, A. Increasing drought under global warming in observations and models. Nat. Clim. Chang. 2013, 3, 52–58. [Google Scholar] [CrossRef]
- Wu, J.; Chen, X.; Yao, H.; Gao, L.; Chen, Y.; Liu, M. Non-linear relationship of hydrological drought responding to meteorological drought and impact of a large reservoir. J. Hydrol. 2017, 551, 495–507. [Google Scholar] [CrossRef]
- Bowling, L.C.; Lettenmaier, D.P.; Nijssen, B.; Graham, L.P.; Clark, D.B.; El Maayar, M.; Essery, R.; Goers, S.; Gusev, Y.M.; Habets, F.; et al. Simulation of high-latitude hydrological processes in the Torne-Kalix basin: PILPS Phase 2(e) 1: Experiment description and summary intercomparisons. Glob. Planet. Chang. 2003, 38, 1–30. [Google Scholar] [CrossRef]
- Ferrant, S.; Bustillo, V.; Burel, E.; Salmon-Monviola, J.; Claverie, M.; Jarosz, N.; Yin, T.; Rivalland, V.; Dedieu, G.; Demarez, V.; et al. Extracting soil water holding capacity parameters of a distributed agro-hydrological model from high resolution optical satellite observations series. Remote Sens. 2016, 8, 154. [Google Scholar] [CrossRef]
- Tanaka, M.; Sugimura, T.; Tanaka, S.; Tamai, N. Flood–drought cycle of Tonle Sap and Mekong Delta area observed by DMSP-SSM/I. Int. J. Remote Sens. 2003, 24, 1487–1504. [Google Scholar] [CrossRef]
- Ali, M.; Ghaith, M.; Wagdy, A.; Helmi, A.M. Development of a new multivariate composite drought index for the Blue Nile River Basin. Water 2022, 14, 886. [Google Scholar] [CrossRef]
- Iyakaremye, V.; Zeng, G.; Yang, X.; Zhang, G.; Ullah, I.; Gahigi, A.; Vuguziga, F.; Asfaw, T.; Ayugi, B. Increased high-temperature extremes and associated population exposure in Africa by the mid-21st century. Sci. Total Environ. 2021, 790, 148162. [Google Scholar] [CrossRef]
- Iyakaremye, V.; Zeng, G.; Ullah, I.; Gahigi, A.; Mumo, R.; Ayugi, B. Recent observed changes in extreme high-temperature events and associated meteorological conditions over Africa. Int. J. Climatol. 2022, 42, 4522–4537. [Google Scholar] [CrossRef]
- Mie Sein, Z.; Ullah, I.; Syed, S.; Zhi, X.; Azam, K.; Rasool, G. Interannual variability of air temperature over Myanmar: The influence of ENSO and IOD. Climate 2021, 9, 35. [Google Scholar] [CrossRef]
- Han, Y.; Wang, Y.; Zhao, Y. Estimating soil moisture conditions of the greater Changbai Mountains by land surface temperature and NDVI. IEEE Trans. Geosci. Remote Sens. 2010, 48, 2509–2515. [Google Scholar] [CrossRef]
- Ahmed, K.; Shahid, S.; Wang, X.; Nawaz, N.; Khan, N. Spatiotemporal changes in aridity of Pakistan during 1901-2016. Hydrol. Earth Syst. Sci. 2019, 23, 3081–3096. [Google Scholar] [CrossRef]
- Arshad, M.; Ma, X.; Yin, J.; Ullah, W.; Ali, G.; Ullah, S.; Liu, M.; Shahzaman, M.; Ullah, I. Evaluation of GPM-IMERG and TRMM-3B42 precipitation products over Pakistan. Atmos. Res. 2021, 249, 105341. [Google Scholar] [CrossRef]
- Yuan, Y.F.; Zhai, P.M.; Li, J.; Chen, Y. Changes in classified precipitation in the urban, suburban, and mountain areas of Beijing. Adv. Clim. Chang. Res. 2017, 8, 279–285. [Google Scholar] [CrossRef]
- Harris, I.; Osborn, T.J.; Jones, P.; Lister, D. Version 4 of the CRU TS monthly high-resolution gridded multivariate climate dataset. Sci. Data 2020, 7, 109. [Google Scholar] [CrossRef]
- Wu, J.; Zhou, L.; Mo, X.; Zhou, H.; Zhang, J.; Jia, R. Drought monitoring and analysis in China based on the Integrated Surface Drought Index (ISDI). Int. J. Appl. Earth Obs. Geoinf. 2015, 41, 23–33. [Google Scholar] [CrossRef]
- Kulkarni, S.S.; Wardlow, B.D.; Bayissa, Y.A.; Tadesse, T.; Svoboda, M.D.; Gedam, S.S. Developing a remote sensing-based combined drought indicator approach for agricultural drought monitoring over Marathwada, India. Remote Sens. 2020, 12, 2091. [Google Scholar] [CrossRef]
- Tabassum, R.; Arsalan, M.H.; Khalid, A.; Ahmad, I.; Mirza, A.I.; Abad, S.B. Assessment of drought risk by using vegetation indices from remotely sensed data: A perspective from hot and arid district of Pakistan. Univ. Eng. Technol. Taxila. Tech. J. 2015, 20, 2–7. [Google Scholar]
- Prakash, S. Performance assessment of CHIRPS, MSWEP, SM2RAIN-CCI, and TMPA precipitation products across India. J. Hydrol. 2019, 571, 50–59. [Google Scholar] [CrossRef]
- Sadegh, M.; Ragno, E.; AghaKouchak, A. Multivariate Copula Analysis Toolbox (MvCAT): Describing dependence and underlying uncertainty using a Bayesian framework. Water Resour. Res. 2017, 53, 5166–5183. [Google Scholar] [CrossRef]
- Wan, Z.; Wang, P.; Li, X. Using MODIS land surface temperature and normalized difference vegetation index products for monitoring drought in the southern Great Plains, USA. Int. J. Remote Sens. 2004, 25, 61–72. [Google Scholar] [CrossRef]
- Sun, W.; Wang, P.-X.; Zhang, S.-Y.; Zhu, D.-H.; Liu, J.-M.; Chen, J.-H.; Yang, H.-S. Using the vegetation temperature condition index for time series drought occurrence monitoring in the Guanzhong Plain, PR China. Int. J. Remote Sens. 2008, 29, 5133–5144. [Google Scholar] [CrossRef]
- Tian, M.; Wang, P.; Khan, J. Drought forecasting with vegetation temperature condition index using ARIMA models in the Guanzhong Plain. Remote Sens. 2016, 8, 690. [Google Scholar] [CrossRef]
- Zeng, X.; Lu, E. Globally unified monsoon onset and retreat indexes. J. Clim. 2004, 17, 2241–2248. [Google Scholar] [CrossRef]
- Adnan, S.; Ullah, K.; Shouting, G. Investigations into precipitation and drought climatologies in south central Asia with special focus on Pakistan over the period 1951–2010. J. Clim. 2016, 29, 6019–6035. [Google Scholar] [CrossRef]
- Liang, M.; Yuan, X. Critical role of soil moisture memory in predicting the 2012 Central United States flash drought. Front. Earth Sci. 2021, 9, 615969. [Google Scholar] [CrossRef]
- Wu, J.; Chen, X.; Yu, Z.; Yao, H.; Li, W.; Zhang, D. Assessing the impact of human regulations on hydrological drought development and recovery based on a ‘simulated-observed’ comparison of the SWAT model. J. Hydrol. 2019, 577, 123990. [Google Scholar] [CrossRef]
- Wu, Z.; Huang, N.E.; Wallace, J.M.; Smoliak, B.V.; Chen, X. On the time-varying trend in global-mean surface temperature. Clim. Dyn. 2011, 37, 759. [Google Scholar] [CrossRef]
- Wu, J.; Chen, X. Spatiotemporal trends of dryness/wetness duration and severity: The respective contribution of precipitation and temperature. Atmos. Res. 2019, 216, 176–185. [Google Scholar] [CrossRef]


| Weather Stations | St. 1 | St. 2 | St. 3 | St. 4 | St. 5 | |
|---|---|---|---|---|---|---|
| VTCI D-041 | ||||||
| 2003 | 0.634858 | 0.632244 | 0.653159 | 0.682353 | 0.605664 | |
| 2004 | 0.509368 | 0.582135 | 0.603486 | 0.566449 | 0.561656 | |
| 2005 | 0.706754 | 0.727669 | 0.814815 | 0.739869 | 0.800871 | |
| 2006 | 0.660566 | 0.601743 | 0.71329 | 0.715033 | 0.709368 | |
| 2007 | 0.639651 | 0.691068 | 0.690196 | 0.663181 | 0.732462 | |
| 2008 | 0.550327 | 0.544227 | 0.637908 | 0.610022 | 0.594771 | |
| 2009 | 0.534205 | 0.622222 | 0.771678 | 0.647495 | 0.692375 | |
| 2010 | 0.442702 | 0.457952 | 0.586928 | 0.48976 | 0.577342 | |
| 2011 | 0.498039 | 0.535512 | 0.654902 | 0.566013 | 0.628322 | |
| 2012 | 0.616122 | 0.685839 | 0.70719 | 0.643137 | 0.699782 | |
| 2013 | 0.433115 | 0.646187 | 0.678867 | 0.620479 | 0.715468 | |
| 2014 | 0.5939 | 0.684532 | 0.71939 | 0.659695 | 0.730719 | |
| Weather Stations | St. 1 | St. 2 | St. 3 | St. 4 | St. 5 | |
|---|---|---|---|---|---|---|
| VTCI—Day of the Year 2010 | ||||||
| D-009 | 0.70719 | 0.706318 | 0.807407 | 0.742484 | 0.776906 | |
| D-025 | 0.555556 | 0.549455 | 0.710675 | 0.653595 | 0.64793 | |
| D-041 | 0.55512 | 0.583878 | 0.658388 | 0.601307 | 0.660566 | |
| D-057 | 0.610893 | 0.537691 | 0.657952 | 0.648366 | 0.681046 | |
| D-073 | 0.442702 | 0.457952 | 0.586928 | 0.48976 | 0.577342 | |
| D-089 | 0.468845 | 0.542919 | 0.579085 | 0.495861 | 0.607843 | |
| D-105 | 0.382135 | 0.417429 | 0.396514 | 0.3939 | 0.432244 | |
| D-121 | 0.356427 | 0.479739 | 0.435294 | 0.367756 | 0.447059 | |
| D-137 | 0.282789 | 0.382135 | 0.308497 | 0.318954 | 0.330719 | |
| D-153 | 1 | 0.454902 | 0.494553 | 1 | 0.526797 | |
| D-169 | 0.412636 | 0.400871 | 0.45098 | 0.481481 | 0.454466 | |
| D-185 | 0.866231 | 1 | 1 | 0.611329 | 1 | |
| D-201 | 1 | 1 | 1 | 1 | 1 | |
| D-217 | 1 | 0.816558 | 1 | 1 | 1 | |
| D-233 | 0.284967 | 0.53159 | 0.547277 | 0.301961 | 0.586492 | |
| D-249 | 0.447495 | 0.547712 | 0.63573 | 0.478867 | 0.634858 | |
| D-265 | 0.367756 | 0.405664 | 0.499346 | 0.395643 | 0.514597 | |
| D-281 | 0.437473 | 0.541612 | 0.556863 | 0.471024 | 0.555991 | |
| D-297 | 0.31329 | 0.500218 | 0.385185 | 0.349891 | 0.483224 | |
| D-313 | 0.324619 | 0.504575 | 0.44183 | 0.4122 | 0.48976 | |
| D-329 | 0.3939 | 0.57342 | 0.362963 | 0.413943 | 0.42658 | |
| D-345 | 0.40915 | 0.512418 | 0.436166 | 0.412636 | 0.499782 | |
| D-361 | 0.375163 | 0.557734 | 0.430065 | 0.375599 | 0.473638 | |
| TPCP Periods | D-016 | D-032 | D-064 | D-096 | D-128 | D-160 | D-192 | D-288 | D-384 | |
|---|---|---|---|---|---|---|---|---|---|---|
| VTCI DOY | ||||||||||
| D-009 | −0.2370 | −0.2370 | −0.2370 | 0.1902 | 0.7360 | 0.7494 | 0.9484 | 0.9426 | 0.9364 | |
| D-025 | 0.7707 | 0.6731 | 0.6731 | 0.7055 | 0.7160 | 0.3573 | 0.4164 | 0.5456 | 0.5881 | |
| D-041 | 0.5552 | 0.8509 | 0.8130 | 0.8130 | 0.7930 | 0.8174 | 0.8822 | 0.8706 | 0.8407 | |
| D-057 | 0.6663 | 0.6663 | 0.7374 | 0.73747 | 0.7292 | 0.7298 | 0.3822 | −0.2044 | −0.2223 | |
| D-073 | - | −0.6777 | −0.5691 | −0.6163 | −0.6163 | −0.6083 | −0.3467 | 0.9356 | 0.9562 | |
| D-089 | - | - | −0.5707 | −0.5058 | −0.5058 | −0.4871 | −0.3691 | 0.8096 | 0.8024 | |
| D-105 | 0.0579 | 0.0579 | −0.0395 | 0.0494 | 0.0759 | 0.0759 | 0.0544 | 0.2428 | 0.2017 | |
| D-121 | 0.6399 | 0.7453 | 0.74535 | −0.5590 | −0.3661 | −0.3661 | −0.3502 | 0.8882 | 0.9767 | |
| D-137 | −0.3942 | 0.6505 | 0.6618 | −0.2967 | −0.0898 | −0.0878 | −0.0878 | 0.9864 | 0.7055 | |
| D-153 | 0.4068 | 0.3925 | 0.5992 | 0.5992 | −0.1453 | 0.0662 | 0.0662 | 0.9440 | 0.5541 | |
| D-169 | −0.2972 | −0.3412 | −0.3553 | −0.2760 | 0.9380 | 0.8019 | 0.9748 | 0.6764 | −0.1636 | |
| D-185 | −0.2373 | −0.2278 | −0.2233 | −0.2667 | −0.2667 | −0.4596 | −0.4078 | −0.3914 | −0.2077 | |
| D-217 | −0.9365 | −0.5398 | −0.5350 | −0.5330 | −0.5498 | −0.5498 | −0.6216 | −0.6026 | −0.5628 | |
| D-233 | 0.8031 | 0.8321 | 0.9555 | 0.9554 | 0.9555 | 0.9577 | 0.9554 | 0.9544 | 0.9046 | |
| D-249 | 0.3012 | 0.2084 | 0.3447 | 0.4074 | 0.4109 | 0.4282 | 0.4282 | 0.4531 | 0.4791 | |
| D-265 | 0.1182 | 0.5447 | 0.8226 | 0.7347 | 0.7442 | 0.7444 | 0.7460 | 0.7490 | 0.7525 | |
| D-281 | 0.3447 | 0.7210 | 0.8607 | 0.9637 | 0.9723 | 0.9743 | 0.9770 | 0.9766 | 0.9741 | |
| D-297 | −0.4590 | −0.1984 | 0.6688 | 0.8888 | 0.8922 | 0.8973 | 0.8979 | 0.9000 | 0.8994 | |
| D-313 | - | −0.4774 | 0.7258 | 0.8912 | 0.8997 | 0.8910 | 0.8953 | 0.8921 | 0.8920 | |
| D-329 | - | - | 0.40815 | 0.54791 | 0.5629 | 0.7039 | 0.7076 | 0.7027 | 0.7024 | |
| D-345 | - | - | −0.2688 | 0.7983 | 0.9026 | 0.8481 | 0.8255 | 0.8347 | 0.8356 | |
| D-361 | 0.0569 | 0.0569 | 0.0569 | 0.0459 | 0.6350 | 0.8031 | 0.7483 | 0.7382 | 0.7346 | |
| TPCP Periods | D-016 | D-032 | D-064 | D-096 | D-128 | D-160 | D-192 | D-288 | D-384 | |
|---|---|---|---|---|---|---|---|---|---|---|
| VTCI DOY | ||||||||||
| D-009 | 0.0117 | 0.0620 | 0.46525 | 0.6291 | 0.1570 | 0.3222 | 0.2914 | −0.1466 | −0.0968 | |
| D-025 | −0.7999 | 0.1592 | 0.2052 | 0.3612 | −0.2640 | −0.5359 | −0.0127 | 0.2805 | −0.0384 | |
| D-041 | 0.3387 | 0.3280 | 0.2710 | −0.1018 | −0.3738 | −0.5472 | −0.4862 | −0.5438 | −0.5063 | |
| D-057 | −0.9345 | −0.89083 | −0.3413 | 0.05605 | −0.6093 | −0.5478 | 0.9779 | 0.7122 | 0.5646 | |
| D-073 | 0.6843 | 0.1965 | 0.2488 | 0.3273 | 0.3854 | 0.2760 | 0.2999 | 0.4173 | 0.3281 | |
| D-089 | −0.8006 | −0.7460 | −0.4035 | 0.0513 | 0.9161 | 0.9168 | −0.4185 | 0.7692 | 0.9036 | |
| D-105 | −0.1434 | −0.0264 | −0.0323 | −0.02383 | 0.1392 | 0.7174 | 0.71658 | 0.5677 | 0.4826 | |
| D-121 | −0.60425 | −0.5687 | 0.13461 | −0.0141 | 0.5868 | 0.0112 | 0.24572 | 0.3922 | 0.4467 | |
| D-137 | 0.17480 | 0.2468 | 0.30071 | 0.76973 | 0.5392 | −0.3438 | −0.5654 | −0.5222 | −0.4579 | |
| D-153 | −0.9582 | −0.8856 | −0.4946 | 0.29672 | −0.8336 | −0.5917 | −0.6087 | −0.5454 | −0.6070 | |
| D-169 | −0.1996 | −0.3497 | −0.4601 | −0.31107 | 0.8231 | 0.9686 | 0.6118 | 0.5814 | 0.5988 | |
Disclaimer/Publisher’s Note: The statements, opinions and data contained in all publications are solely those of the individual author(s) and contributor(s) and not of MDPI and/or the editor(s). MDPI and/or the editor(s) disclaim responsibility for any injury to people or property resulting from any ideas, methods, instructions or products referred to in the content. |
© 2023 by the authors. Licensee MDPI, Basel, Switzerland. This article is an open access article distributed under the terms and conditions of the Creative Commons Attribution (CC BY) license (https://creativecommons.org/licenses/by/4.0/).
Share and Cite
Ullah, R.; Khan, J.; Ullah, I.; Khan, F.; Lee, Y. Investigating Drought and Flood Evolution Based on Remote Sensing Data Products over the Punjab Region in Pakistan. Remote Sens. 2023, 15, 1680. https://doi.org/10.3390/rs15061680
Ullah R, Khan J, Ullah I, Khan F, Lee Y. Investigating Drought and Flood Evolution Based on Remote Sensing Data Products over the Punjab Region in Pakistan. Remote Sensing. 2023; 15(6):1680. https://doi.org/10.3390/rs15061680
Chicago/Turabian StyleUllah, Rahat, Jahangir Khan, Irfan Ullah, Faheem Khan, and Youngmoon Lee. 2023. "Investigating Drought and Flood Evolution Based on Remote Sensing Data Products over the Punjab Region in Pakistan" Remote Sensing 15, no. 6: 1680. https://doi.org/10.3390/rs15061680
APA StyleUllah, R., Khan, J., Ullah, I., Khan, F., & Lee, Y. (2023). Investigating Drought and Flood Evolution Based on Remote Sensing Data Products over the Punjab Region in Pakistan. Remote Sensing, 15(6), 1680. https://doi.org/10.3390/rs15061680