Article

Investigating the Influence of Water Vapor on Heavy Rainfall Events in the Southern Korean Peninsula

1
High Impact Weather Research Laboratory, Forecast Research Department, National Institute of Meteorological Sciences, Gangneung 25457, Republic of Korea
2
Research Center for Atmospheric Environment, Hankuk University of Foreign Studies, Yongin 17035, Republic of Korea
*
Author to whom correspondence should be addressed.
Remote Sens. 2023, 15(2), 340; https://doi.org/10.3390/rs15020340
Submission received: 22 November 2022 / Revised: 31 December 2022 / Accepted: 3 January 2023 / Published: 6 January 2023
(This article belongs to the Special Issue Remote Sensing of Precipitation Extremes)

Abstract

:
In this study, we examined the influence of water vapor on heavy rainfall events over the complex mountainous terrain of the southern Korean Peninsula using rawinsonde and global navigation satellite system (GNSS) datasets from a mobile observation vehicle (MOVE). Results demonstrated that the prevailing southeasterly winds enhanced precipitation on the leeward side of the mountainous region. The probability of severe rainfall increased in the highest precipitable water vapor (PWV) bin (>60 mm). A lead–lag analysis demonstrated that the atmosphere remained moist for 1 h before and after heavy rainfall. The temporal behavior of PWV retrieved from the MOVE-GNSS data demonstrated that during Changma (the summer monsoon) (Case 1), heavy rainfall events experience a steep decrease after a long increasing trend in PWV. However, the most intense rainfall events occurred after a rapid increase in PWV along with a strong southwesterly water vapor flow during convective instability (Case 2), and they had consistently higher moisture and greater instability than those in Case 1 over the entire period. The results of this study can provide some insights to improve the predictability of heavy rainfall in the southern Korean Peninsula.

1. Introduction

The southern Korean Peninsula is vulnerable to meteorological disasters because of its synoptic and complex geographical characteristics, with heavy rainfall episodes occurring frequently in summer [1]. Moreover, the local convergence and updraft caused by irregular topographic forcing significantly affect the location and intensity of precipitation reaching the ground [2]. Park et al. [3] suggested that the high wind speed of the low-level jet (LLJ) contributes to increased total precipitation close to Mountain Jiri, Korea. Lee and Ryu [4] emphasized the significance of the southwesterly water vapor flux that flows into the southern mountainous regions of the Korean Peninsula.
Many studies on heavy rainfall in the southern Korean Peninsula have been conducted using the numerical weather prediction model [1,5,6]. However, extremely few studies have examined the observational characteristics at the meteorological process level; furthermore, the accuracy of current numerical models and observations is limited when predicting atmospheric flow characteristics in complex mountainous regions. An accuracy threshold of 3 mm is required if precipitable water vapors (PWVs) are inputs to weather nowcasting, according to a document by World Meteorological Organization (WMO) [7]. Atmospheric water vapor is a very important element in severe weather and climate studies due to its status as not only a greenhouse gas but also an energy source that generates numerous extreme weather phenomena [8,9,10]. The amount of water vapor in the atmosphere is a key factor that can, along with other factors such as LLJ, determine the amount of heavy rainfall and influence the dynamical evolution of convective storms [11,12]. Increasing the availability of PWV data will ensure more accurate heavy rainfall forecasts, especially in higher-elevation arid climate zones where there are large distances between existing PWV measurement sites [13,14].
There are currently several methods for directly and indirectly measuring the total amount of water vapor in the atmosphere. The more traditional methods of PWV measurement include radiosondes [15,16], microwave radiometers [17,18] and sun photometers [19]. Kelsey et al. (2022) [20] recently utilized infrared thermometry to analyze the relationship between zenith sky temperature and PWV over Socorro, New Mexico, for a period of 2 years. Despite the high cost and the limitation of launch time, radiosonde remains the most widely used instrument to evaluate PWV data. As an alternative, to resolve some limitations (e.g., weather-sensitivity, poor temporal resolutions, etc.) of traditional instruments, GNSS has been widely used to retrieve PWV since Bevis first proposed GNSS meteorology in 1992 [21]. It can be used to investigate heavy rainfall due to its advantages of high precision, high temporal resolution and all-weather capacity [22]. Huang et al. (2021) [23] showed that variations of PWV retrieved from GNSS have a direct relationship with the in situ rainfall measurements, and that the PWV increases sharply before the arrival of heavy rainfall in Guilin, China. Li et al. (2022) [24] suggested that the anomaly-based percentile thresholds of predictors derived from GNSS-PWV can be effectively applied to the detection of heavy rainfall events in the Hong Kong region. Despite progress in many investigations using GNSS-PWV data worldwide, the number of permanent GNSS stations is still insufficient in areas with sparse observations, such as those with complex terrain. Therefore, a well-designed observational framework based on mobile platforms equipped with both a global navigation satellite system (GNSS) and rawinsonde sensors is necessary to capture these important factors in areas where there are few observations.
This study examines the characteristics of the local climate and the influence of water vapor on heavy rainfall events over the southern mountainous region of the Korean Peninsula, particularly at the meso timescale. The 2016 summer intensive observation period (IOP) ran from 23 June to 12 July 2016 in Geochang (GC), South Korea. During the IOP, the mobile observation vehicle (MOVE) datasets with high temporal resolution rawinsonde soundings and GNSS observations were used. We analyzed the low-level thermodynamic structure in terms of the relationship between water vapor (and/or wind) and orographic precipitation, and lag times. This study examines the general features of thermodynamic profiles originating from two different cases. Case 1 has localized heavy rainfall associated with Changma, or the summer monsoon, and Case 2 has convective instability.

2. Data and Methods

2.1. Study Area

GC-gun is a county in South Gyeongsang Province (Gyeongsangnam-do), South Korea, with an area of 804.14 km2. It is situated on the far west side of the province. The temperature of this county is higher than those of the surrounding mountainous areas because of the trapping of heat waves through the behavior of the local circulations in low-lying basin topography [25]. Its summers are generally humid and have the most precipitation in a year, which is primarily from the East Asian monsoon that occurs from June to September. July is the rainiest month. As per the 1991–2020 climate data of the Korea Meteorological Administration (KMA), the county experiences average precipitation and relative humidity of 286.2 mm and 79.7%, respectively (https://data.kma.go.kr/resources/normals/pdf_data/korea_pdf_0106_v2.pdf, accessed on 30 December 2022).
Figure 1 shows the locations of selected ground-based MOVE platforms, automatic weather system (AWS) sites and topographic features near the GC supersite. The GC supersite is surrounded by three major mountains, Jiri, Deokyu, and Gaya, which rise to >1000 m above the sea level.

2.2. Data

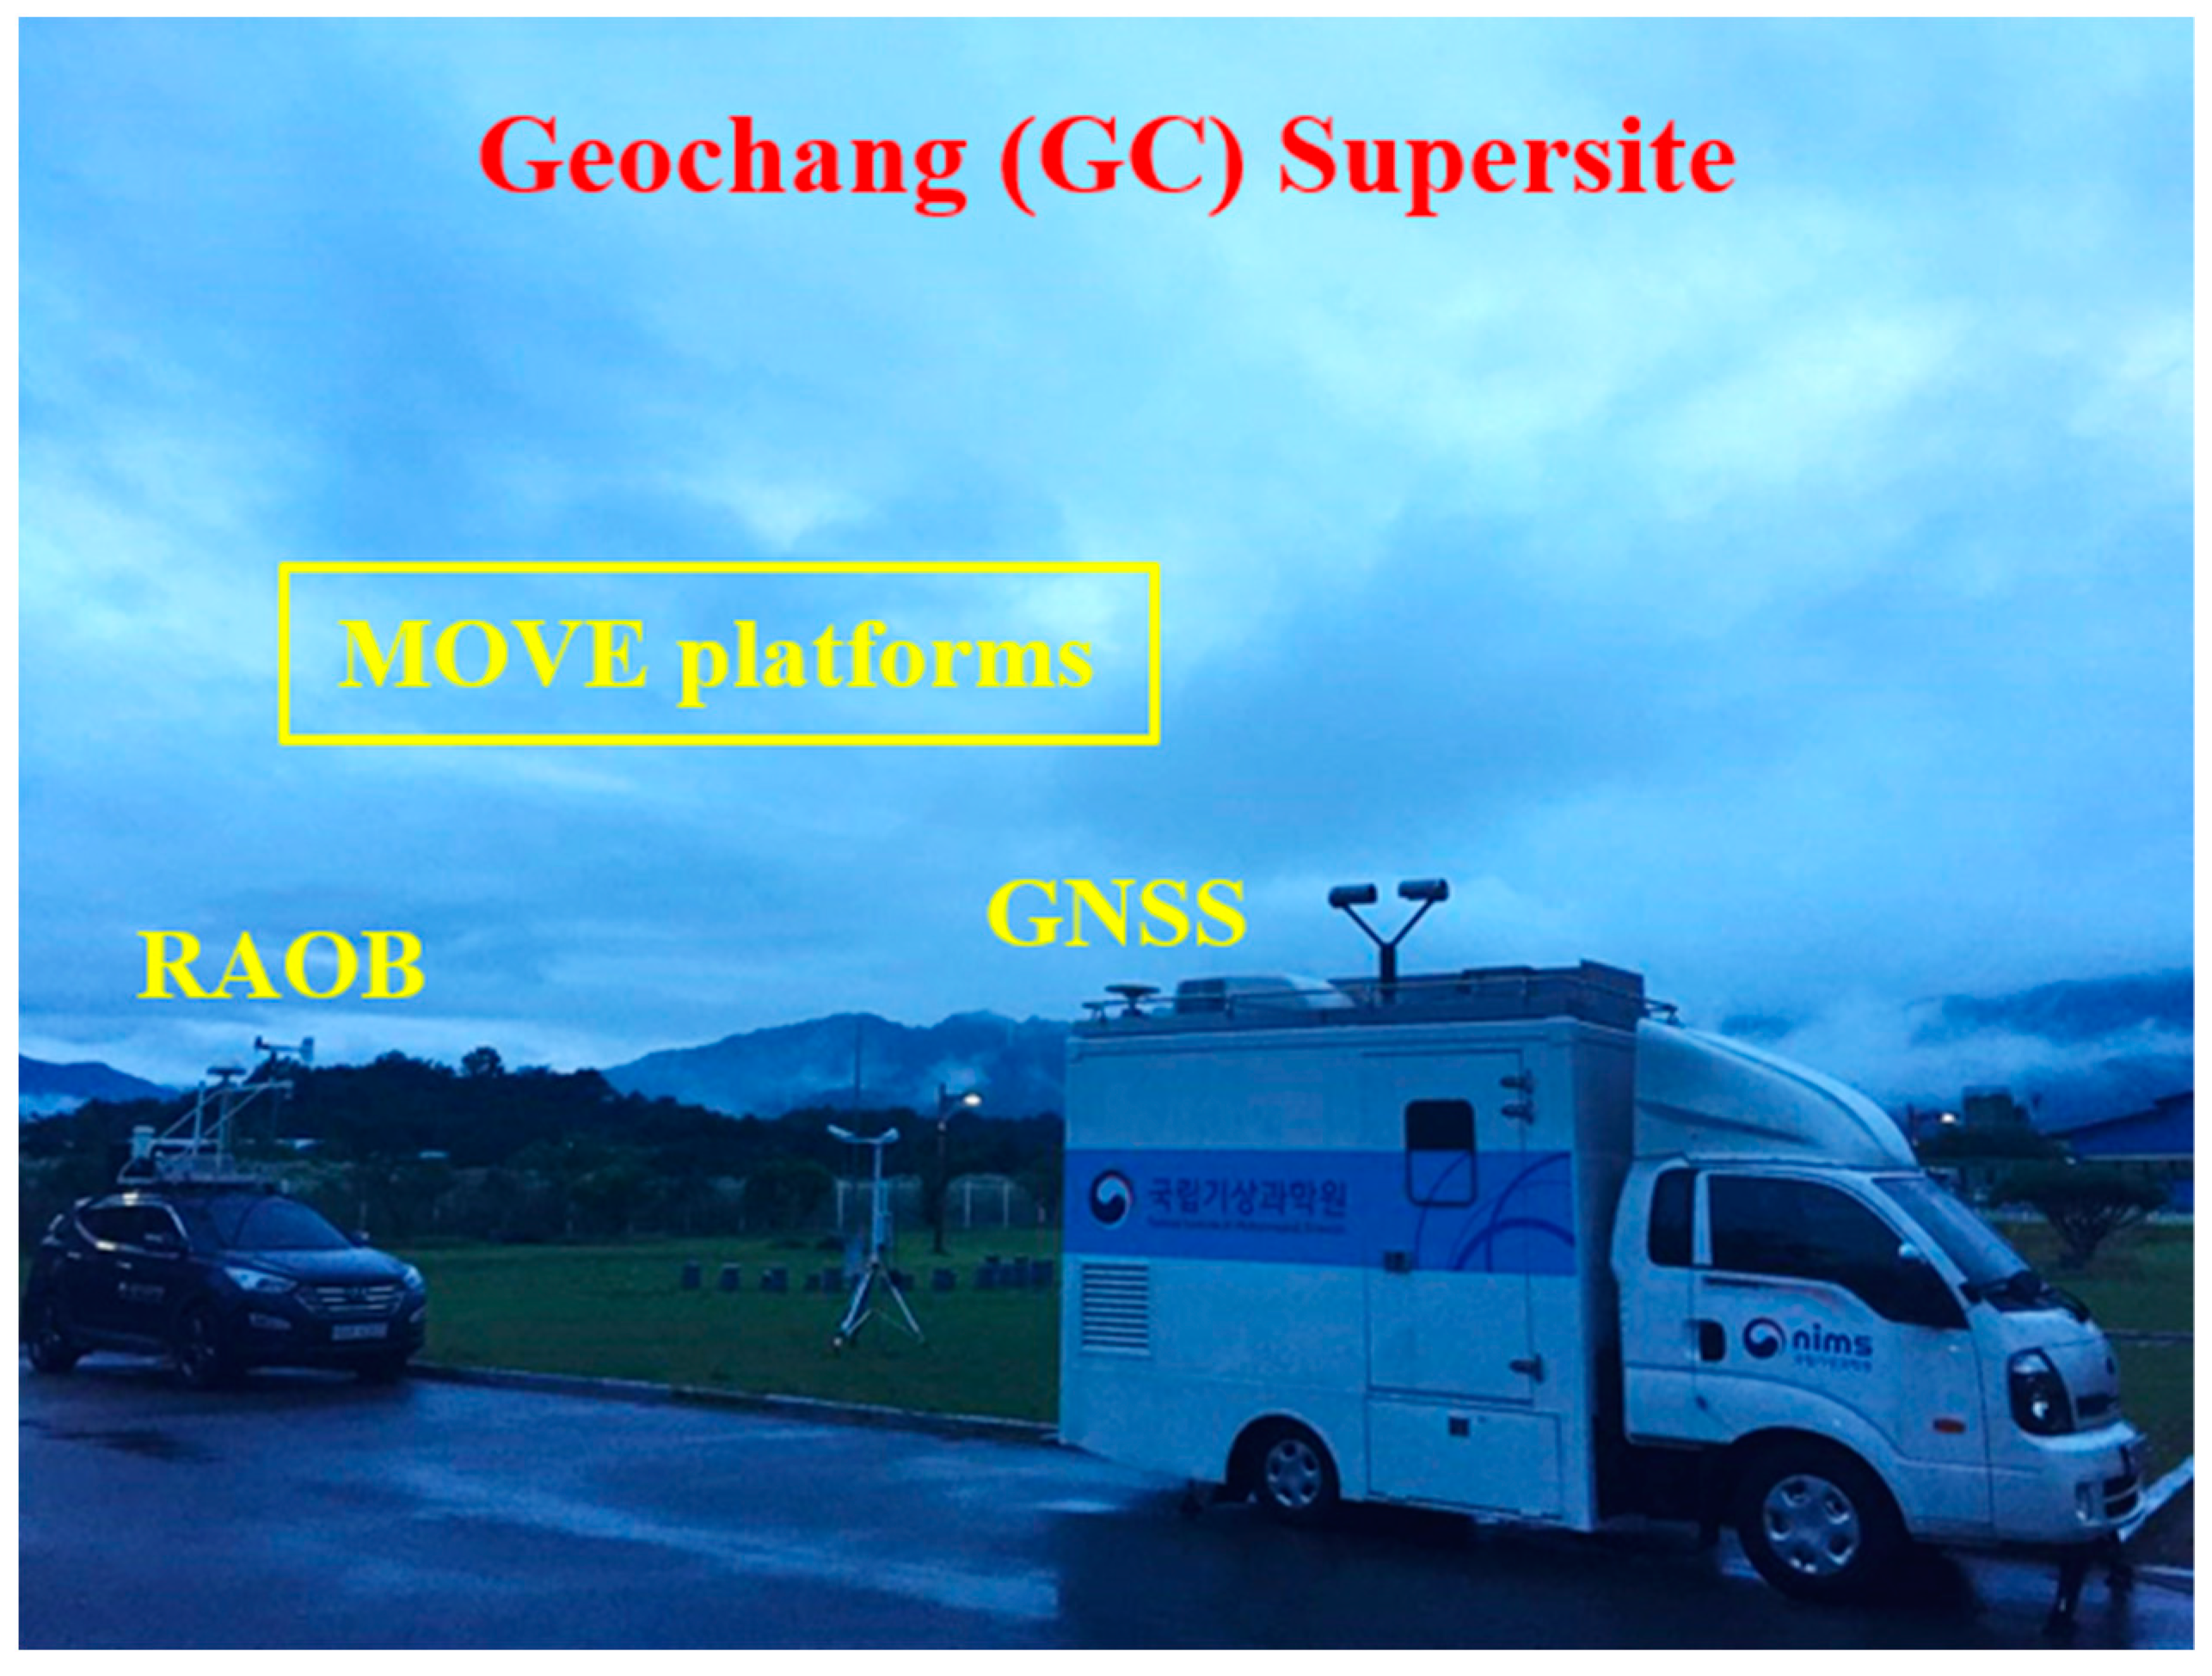
Figure 2 shows a representative image of the GC supersite, and the observational instruments and data used are summarized in Table 1. The MOVE datasets were generated using a GNSS (NetR9) from Trimble (Westminster, CO, USA) and a rawinsonde sounding system (DFM-09) from GRAW (Bayern, Germany).
To identify the environmental conditions, vertical temperature, humidity, and wind speed profiles were obtained every 6 h from the MOVE rawinsonde. The AWS surface site observations provided high temporal resolution (1 min intervals) climatological parameters, such as dominant wind speed and direction, in addition to precipitation. The GNSS data were post-processed using a high-precision Bernese 5.0 and a double-difference strategy to estimate the zenith total delay (ZTD) [9,26]. The minimum elevation cutoff angle for Bernese processing was set to 10° according to operational GNSS observation settings in the worldwide International GNSS Service (IGS) network. A mapping function that represents a correlation equation of delay in the zenith direction and delay in the slant direction, the Niell mapping function (NMF), was used [27]. The zenith hydrostatic delay (ZHD) model used in this study is that given by Saastamoinen (1972) [28], as shown in Equation (1), which uses automatic weather sensors and GNSS data observed by MOVE:
ZHD = ( 2.2779 ± 0.0024 ) P M 1 0.00266 cos 2   Φ M 0.00028   H M  
PWV = Z W D ρ R v ( k 2 + k 3 T m ) × 10 6
where P M and Φ M represent the surface pressure and latitude from the MOVE dataset, respectively. H M is the ellipsoidal height determined by adding the mean sea level to the orthometric height at the observing point [29]. The zenith wet delay (ZWD) was derived by subtracting the ZHD from the ZTD value [21]. We finally retrieved precipitable water vapor (PWV) using Equation (2). Here, ρ is the density of water, R v is the specific gas constant of the water vapor, and k 2 and k 3 are constants for the atmospheric refractivity index used by Davis et al. (1985) [30]. In the end, we used the surface temperature data from the MOVE for the mean temperature equation ( T m ) , which is suitable for the weather conditions of the Korean Peninsula as suggested by Ha et al. (2008) [31].
To identify evidence for the southwesterly advection of a 2D water vapor field, we used a PWV dataset with high 10 min intervals, which were retrieved by Korea Astronomy and Space Science Institute (KASI) from 24 ground GNSS stations across the study area. The analysis area and information on all GNSS stations are shown in Figure 1 and Table A1, respectively.

2.3. Methods

The 2016 summer IOP ran from 23 June to 12 July 2016. We selected the summer storms of two cases during the IOP—Case 1: Changma, and Case 2: convective instability—and used different initiation mechanisms to compare the structural evolution of moisture and temperature. We used a cross-correlation method with transition times to analyze the quantitative correlation between the PWV and rain intensity as Equation (3) [32]:
r x , y ( k ) = i [ ( x i m x ) ( y i + k m y ) ] S x S y
where r x , y ( k ) is simply the cross-correlation coefficient among all data pairs x i and y i + k that exist at separation or lag of k . That is, where x and y are PWV (fixed variable) and rain intensity (lagged variable), respectively, and S and m are the standard deviation and mean of each variable, respectively. This statistical method is useful for verifying the relationship between two or more datasets over a lag time. Moreover, specific humidity ( q ) and equivalent potential temperature ( θ e ) from the rawinsonde observations were calculated to compare the vertical thermodynamic structure [33]. We then analyzed the observed average vertical profiles of specific humidity and equivalent potential temperature at each altitude level. The rawinsonde data were used for rainfall lagging and leading by up to 12 h for the two different severe cases. The analysis periods are 1200–1800 UTC 23 June, 0000–0600 UTC 24 June, and 1200–1800 UTC 24 June for Case 1, and 1800 UTC 5 July–0000 UTC 6 July, 0600–1200 UTC 6 July and 1800 UTC 6 July–0000 UTC 7 July for Case 2.

3. Results

3.1. Data Validation

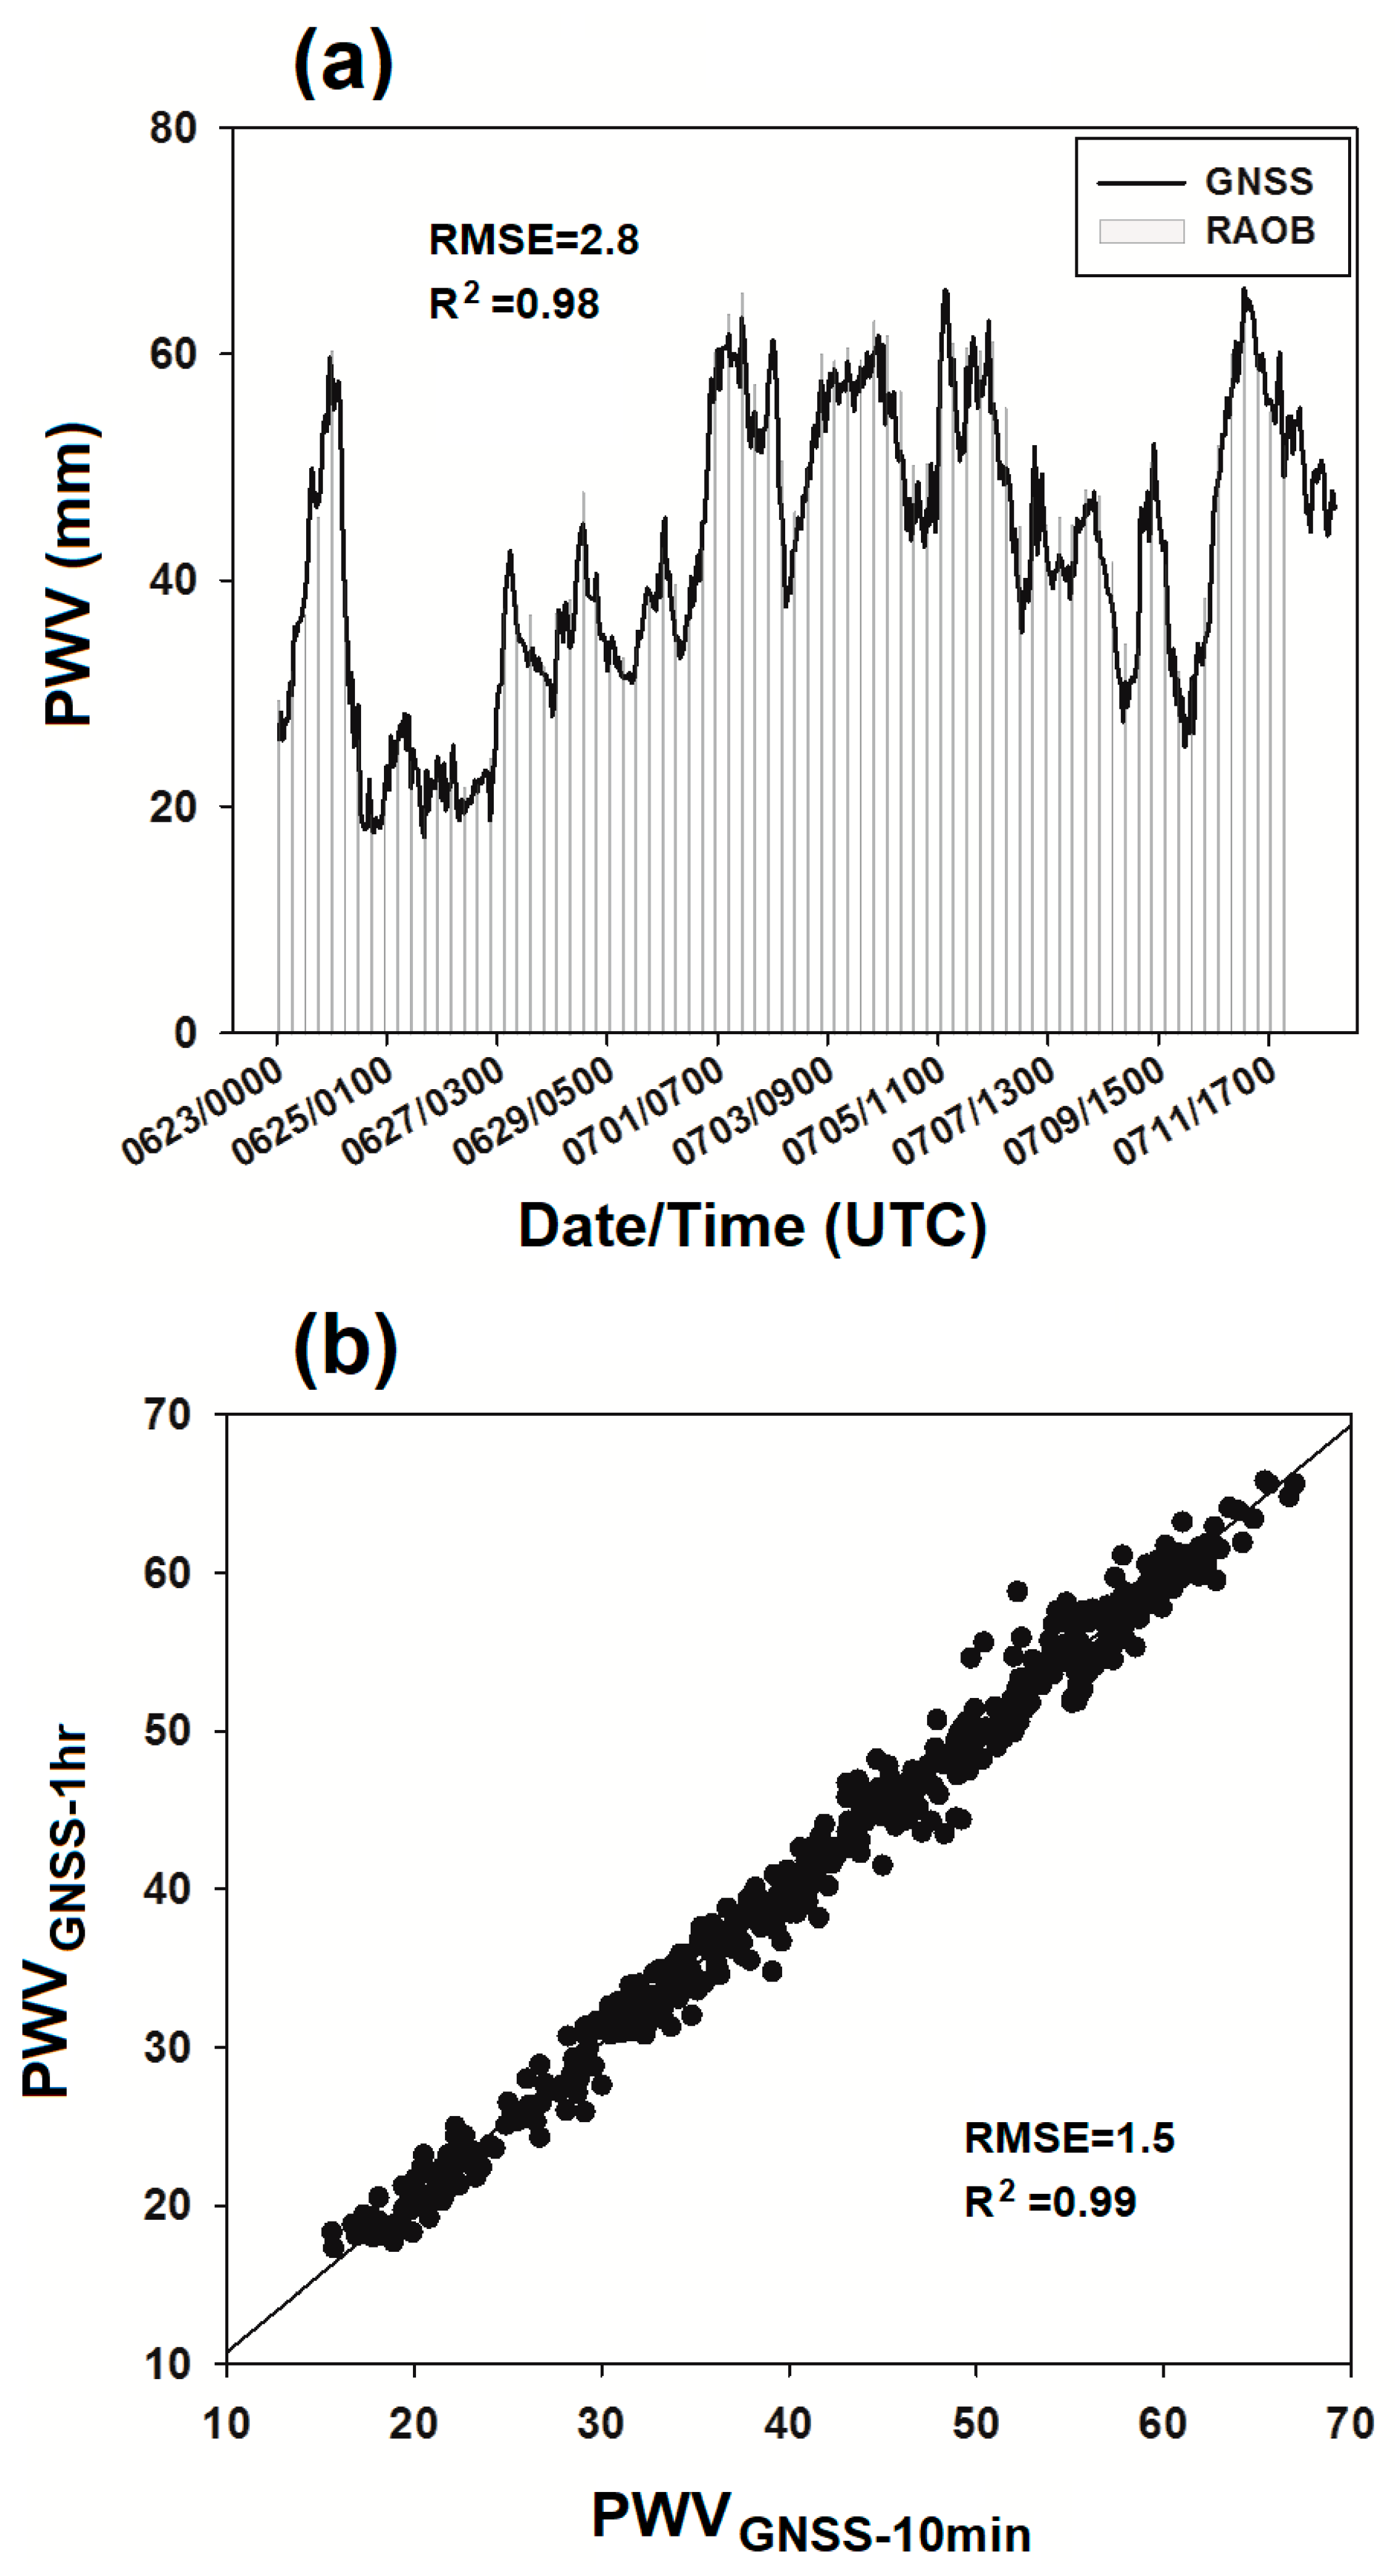
To determine the accuracy of the PWV retrieved from the MOVE-GNSS during the 2016 summer IOP, we compared the PWV values at the 1 h interval from the MOVE-GNSS with those at the 6 h interval obtained from the MOVE-rawinsonde observation (RAOB) system operated at the same site (Figure 2). Figure 3a shows the time series of PWVs obtained from GNSS (black solid line) and RAOB (vertical gray bar). During the analysis period, a consistency in peak time between both PWV products was noted in most cases. Compared with the RAOB-PWV trend, the time series of GNSS-PWV have comparatively similar trends and good agreement, with values of ranging from 17 mm to 66 mm (Figure 3a). These results are consistent with the statistical results of PWV retrievals. The root mean square error (RMSE), square of the correlation coefficient (R2) and the number of data pairs are 2.8 mm, 0.98 and 77, respectively (Table 2). Here, RMSE denotes the standard deviation of the residuals. Residuals are a measure of how far from the regression line the data points are. That is, they tell us how concentrated the data are around the line of best fit.
To increase the sampling number and representativeness of validation data, we used 10 min interval GNSS-PWV results obtained from optional Bernese processing settings. The performance of the GNSS-PWV retrievals with high temporal resolution was evaluated through long-term analysis (about 5 years) [34]. First, we compared RAOB-PWVs (6 h interval) with GNSS-PWVs at 10 min intervals (Table 2). Although the RMSE of 10 min interval GNSS-PWVs is slightly worse than that of 1 h interval GNSS-PWVs, having a difference of 0.6 mm, the accuracy of high-frequency (10-min) observation of moisture (PWV) from MOVE-GNSS is quite reliable under static conditions (R2 = 0.97 and slope = 1.00). A scatter plot between GNSS-PWVs with time intervals of 10 min and 1 h and the statistical results are shown in Figure 3b and Table 2, respectively. The linear relationship (slope = 0.98) and determination coefficient (R2 = 0.99) between the GNSS-PWV results at 10 min and 1 h intervals agree well with enough samples (number of samples = 480). The statistical measures of the regression line for the scatter plot show a p-value of 0.0001, indicating statistical significance at the 1% level. This demonstrated that the accuracy of the high temporal resolution GNSS-PWVs based on the MOVE platform was reliable. The high-frequency (10-min) dataset of PWV during the 2016 summer IOP was used to examine PWV-precipitation relationships and characterize the influence of water vapor on heavy rainfall events in the study area.

3.2. Wind Rose Analysis

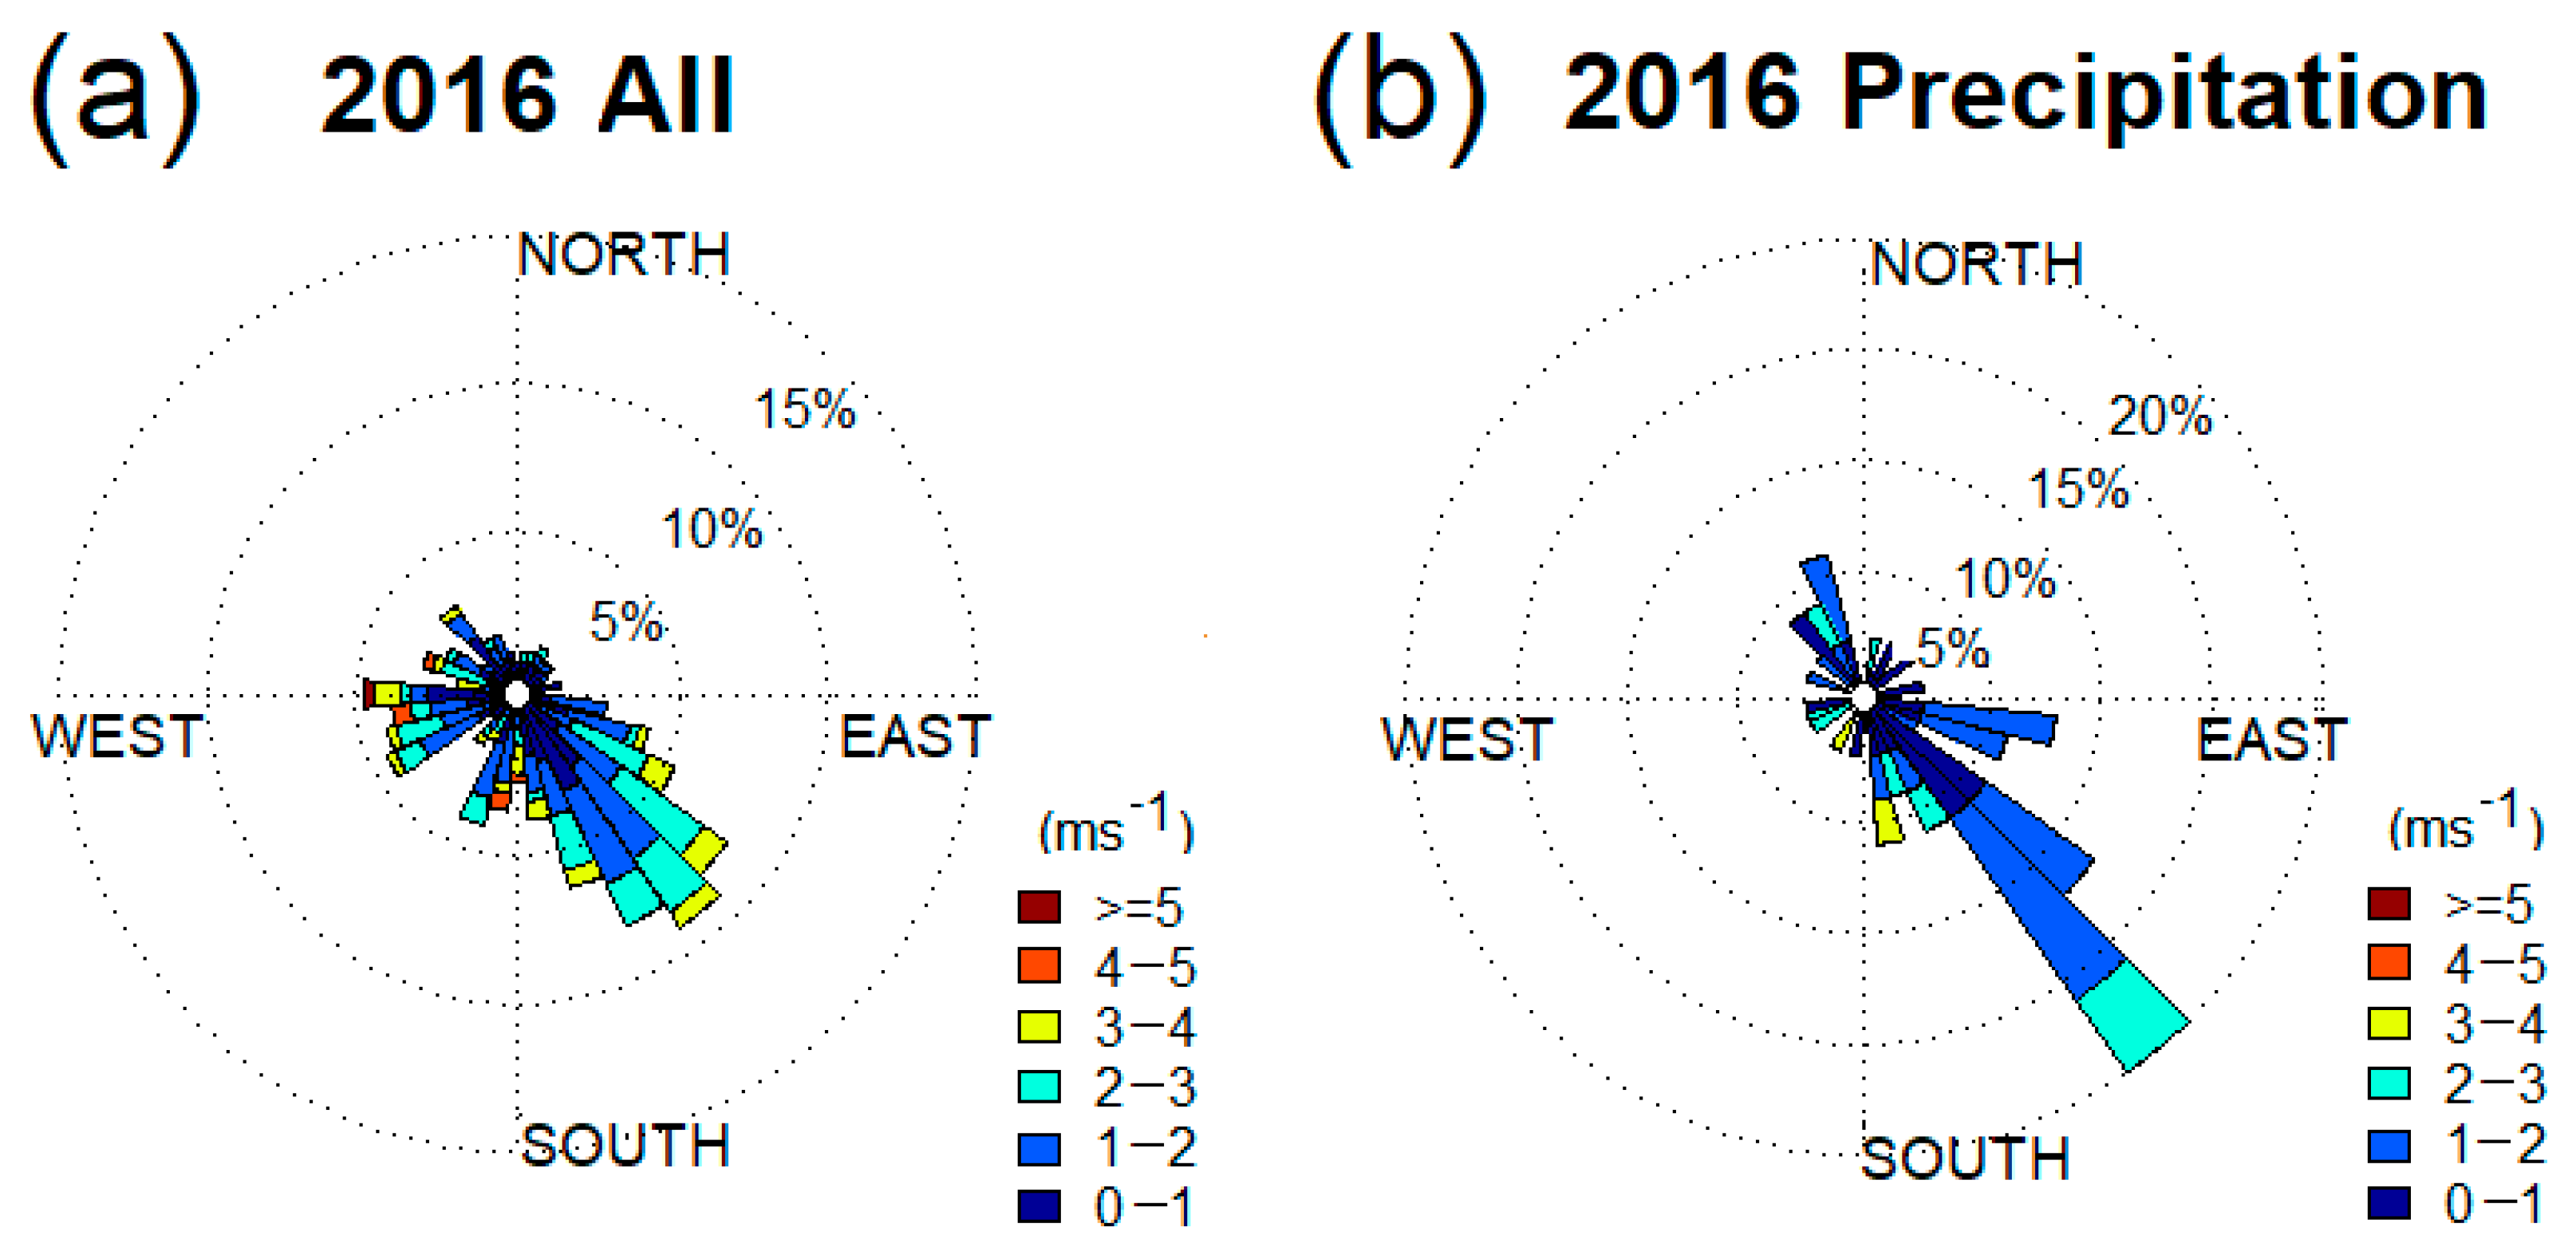
Characterizing the dominant flow of low-level upslope winds is an important step in examining the climatological parameters of orographic precipitation in mountainous regions. The prevailing wind directions and wind speeds for GC, a windward site, during the 2016 summer IOP is shown in Figure 4. Southeasterly winds predominated during the entire period (Figure 4a); this was attributed to the attenuation from the blocking effect of the southern mountains above 300 m altitude (sea level) (Figure 1). Interestingly, significant prevailing southeasterly winds were observed when we only analyzed data from the time when precipitation occurred (Figure 4b).
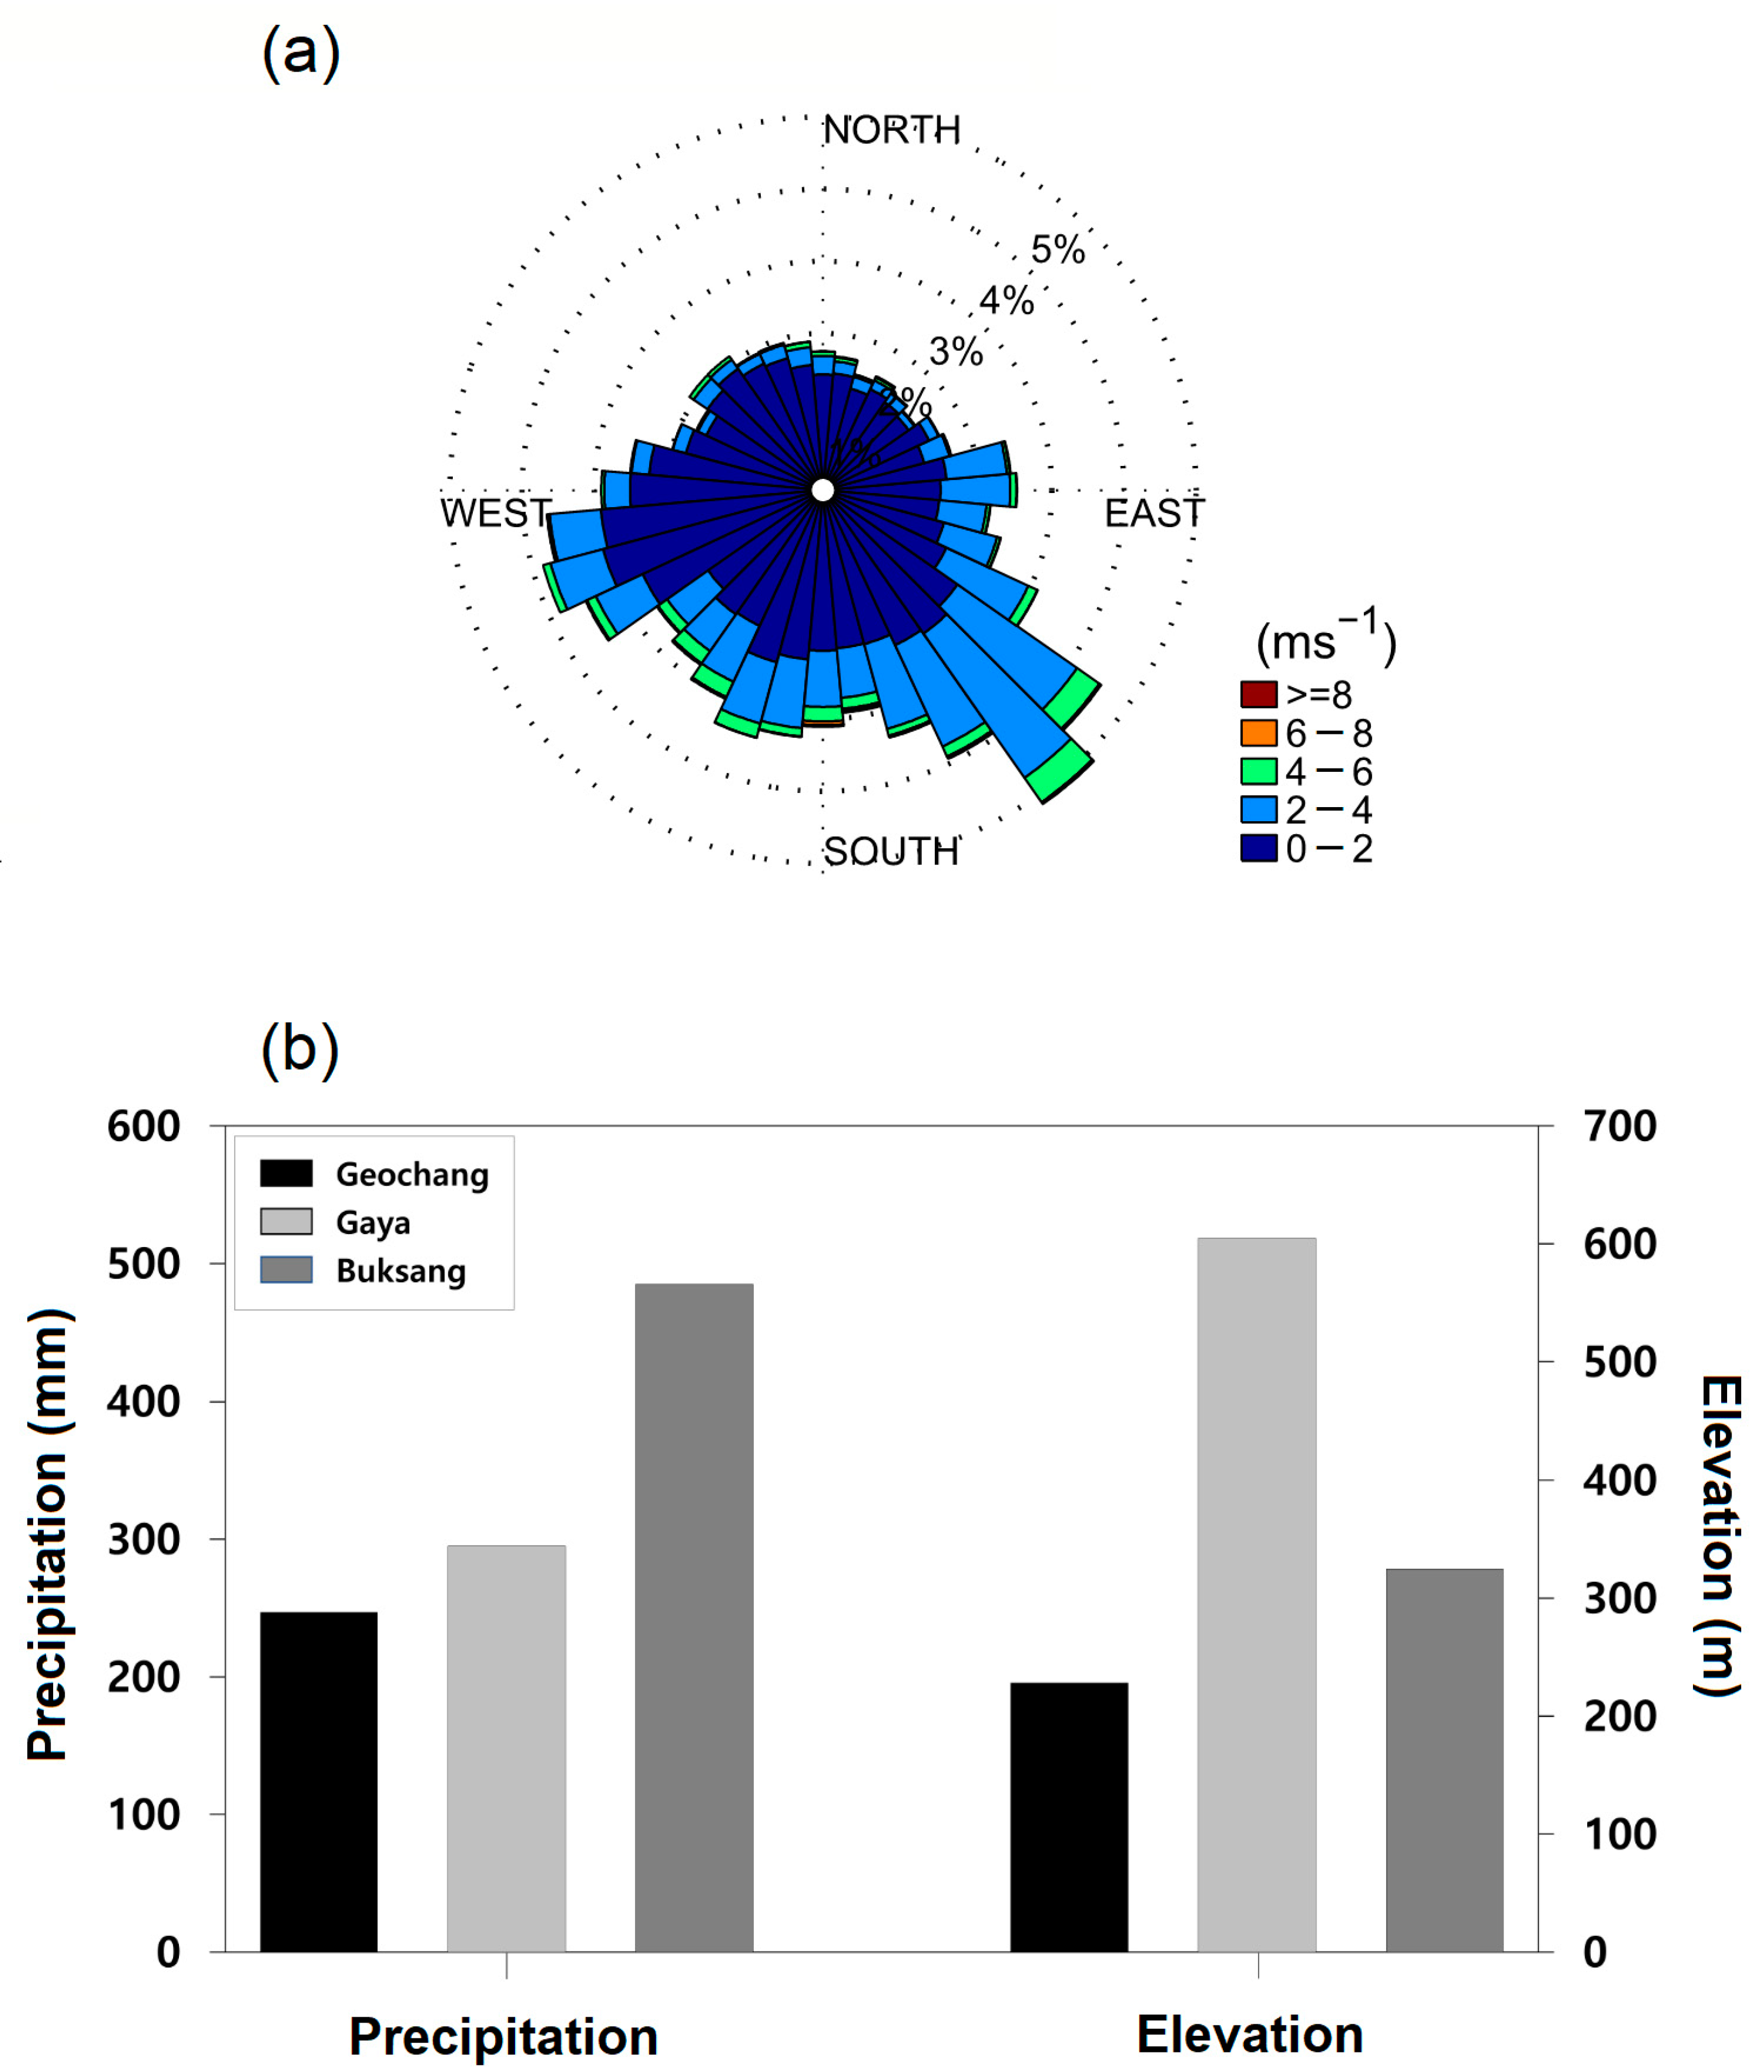
Figure 5a shows the long-term observational results of upslope flow at the windward site (GC supersite) using the past 10-year (2006–2015) summer (from June to August) dataset. The southerly wind flow (particularly in the southeast) was dominant from a long-term trend perspective, i.e., the characteristics of the prevailing wind during the 2016 summer agreed well with the results of a 10-year climatic wind rose analysis (Figure 4a and Figure 5a). The total precipitation at the Buksang (BS) and Gayasan (GA) sites during the 2016 summer IOP was 485 and 295 mm, respectively (Figure 5b). Although the altitude above sea level at the BS site (325 m) is ~50% that at the GA site (605 m), an increase in precipitation on the leeward site (i.e., BS, as marked in Figure 1) was evident, which could be associated with the prevailing winds on the windward site (i.e., GC) (Figure 4b and Figure 5b).

3.3. Relationship between GNSS-PWV and Precipitation

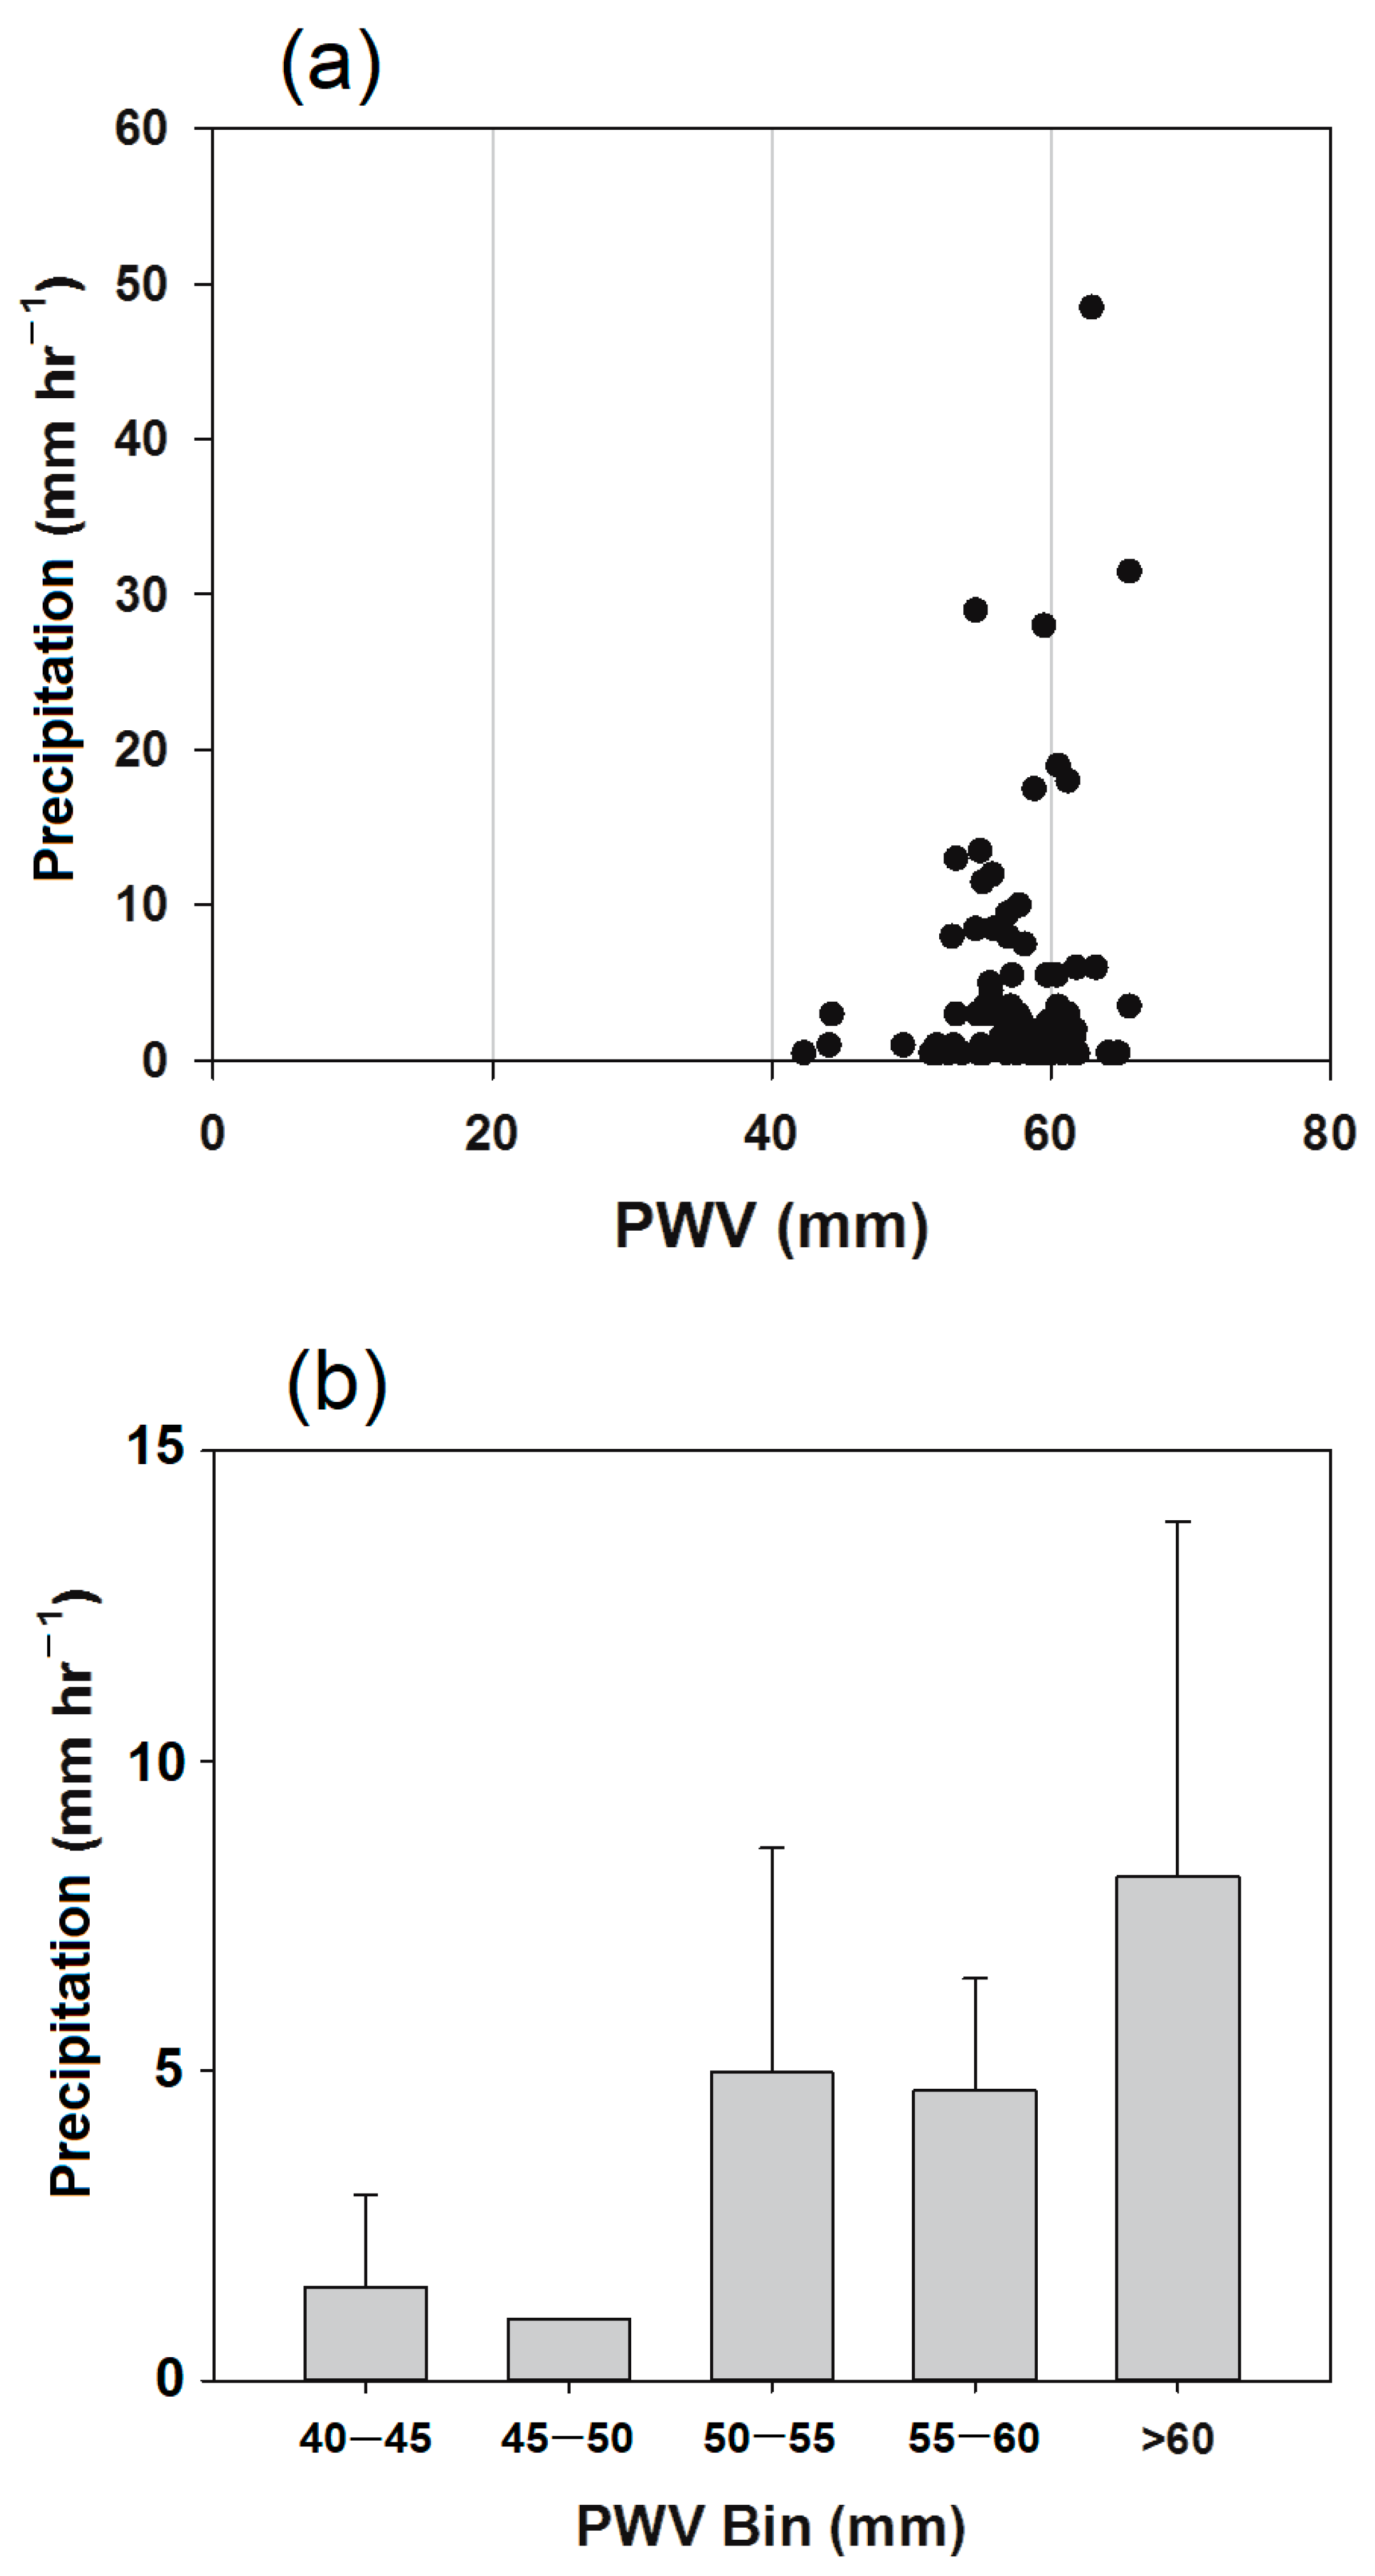
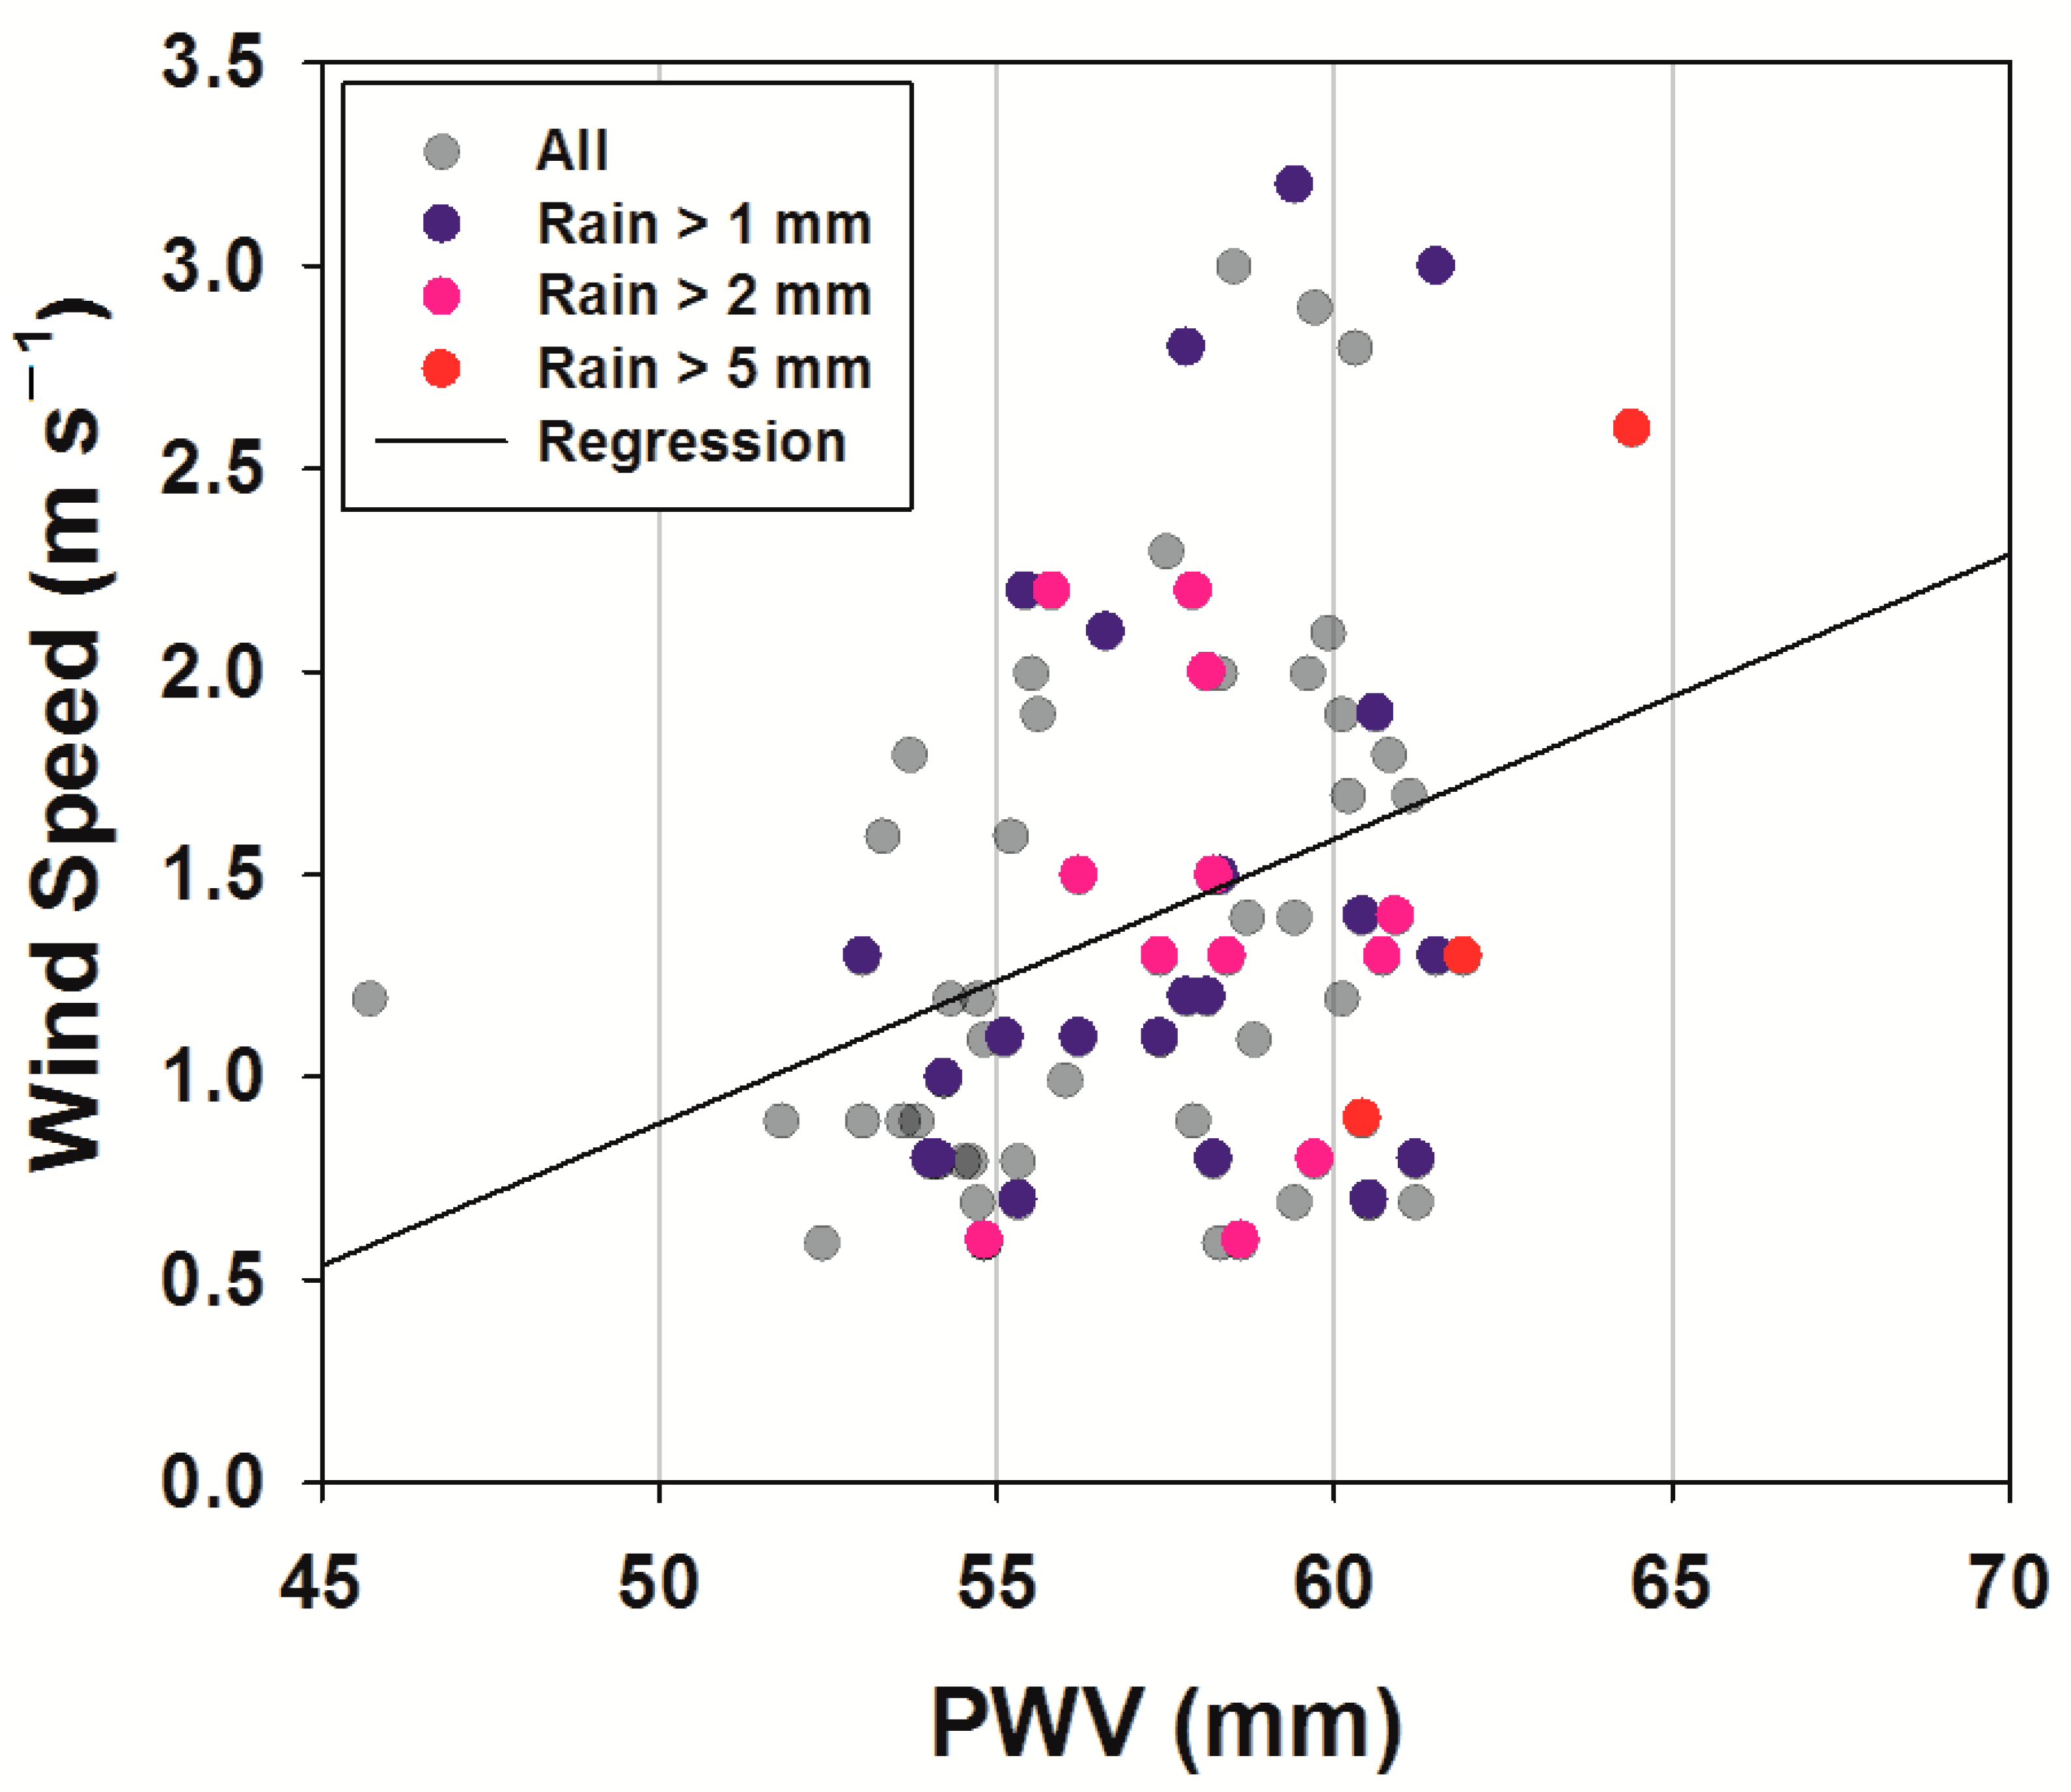
Figure 6a shows the 1 h averaged rain intensity at the BS site as a function of the GC supersite PWV values; the figure shows the transition point from no rain to rain as a function of PWV. Despite the limitation of rainfall duration hours during the 2016 summer IOP, a threshold value of ~40 mm was determined to identify the PWV condition that influenced the occurrence of rainfall. We conditionally averaged the 1 h rain intensities in the PWV values over five different bins to characterize the behavior of the PWV in the presence of summer heavy rainfall (Figure 6b). A sharp pickup in precipitation above a 50 mm PWV is shown in Figure 6b. This jump was considerable, as reported by the vertical whisker representing +2 standard errors. Despite a slight offset in the 55–60 PWV bin, the results demonstrated that high PWV on the windward site corresponded to high precipitation on the leeward site (BS). Furthermore, we propose the product of PWV and horizontal wind speed as the variable that accounts for the relationship between PWV and heavy rainfall to account for the effect of convergence (Figure 7). The observed relationship between wind speed and PWV, which is classified as per rain intensity, has a positive slope. However, there were only weak relationships between surface wind speed at the GC supersite and rain intensity at the BS site. The results demonstrate that the water vapor in the windward site (GC) depends more on the occurrence of heavy rainfall on the leeward site (BS) than on the surface wind speed. To provide statistical significance, we must examine long-term datasets for a sufficiently large range of wind speeds.

3.4. Vertical Profiles of Moisture and Wind Speed

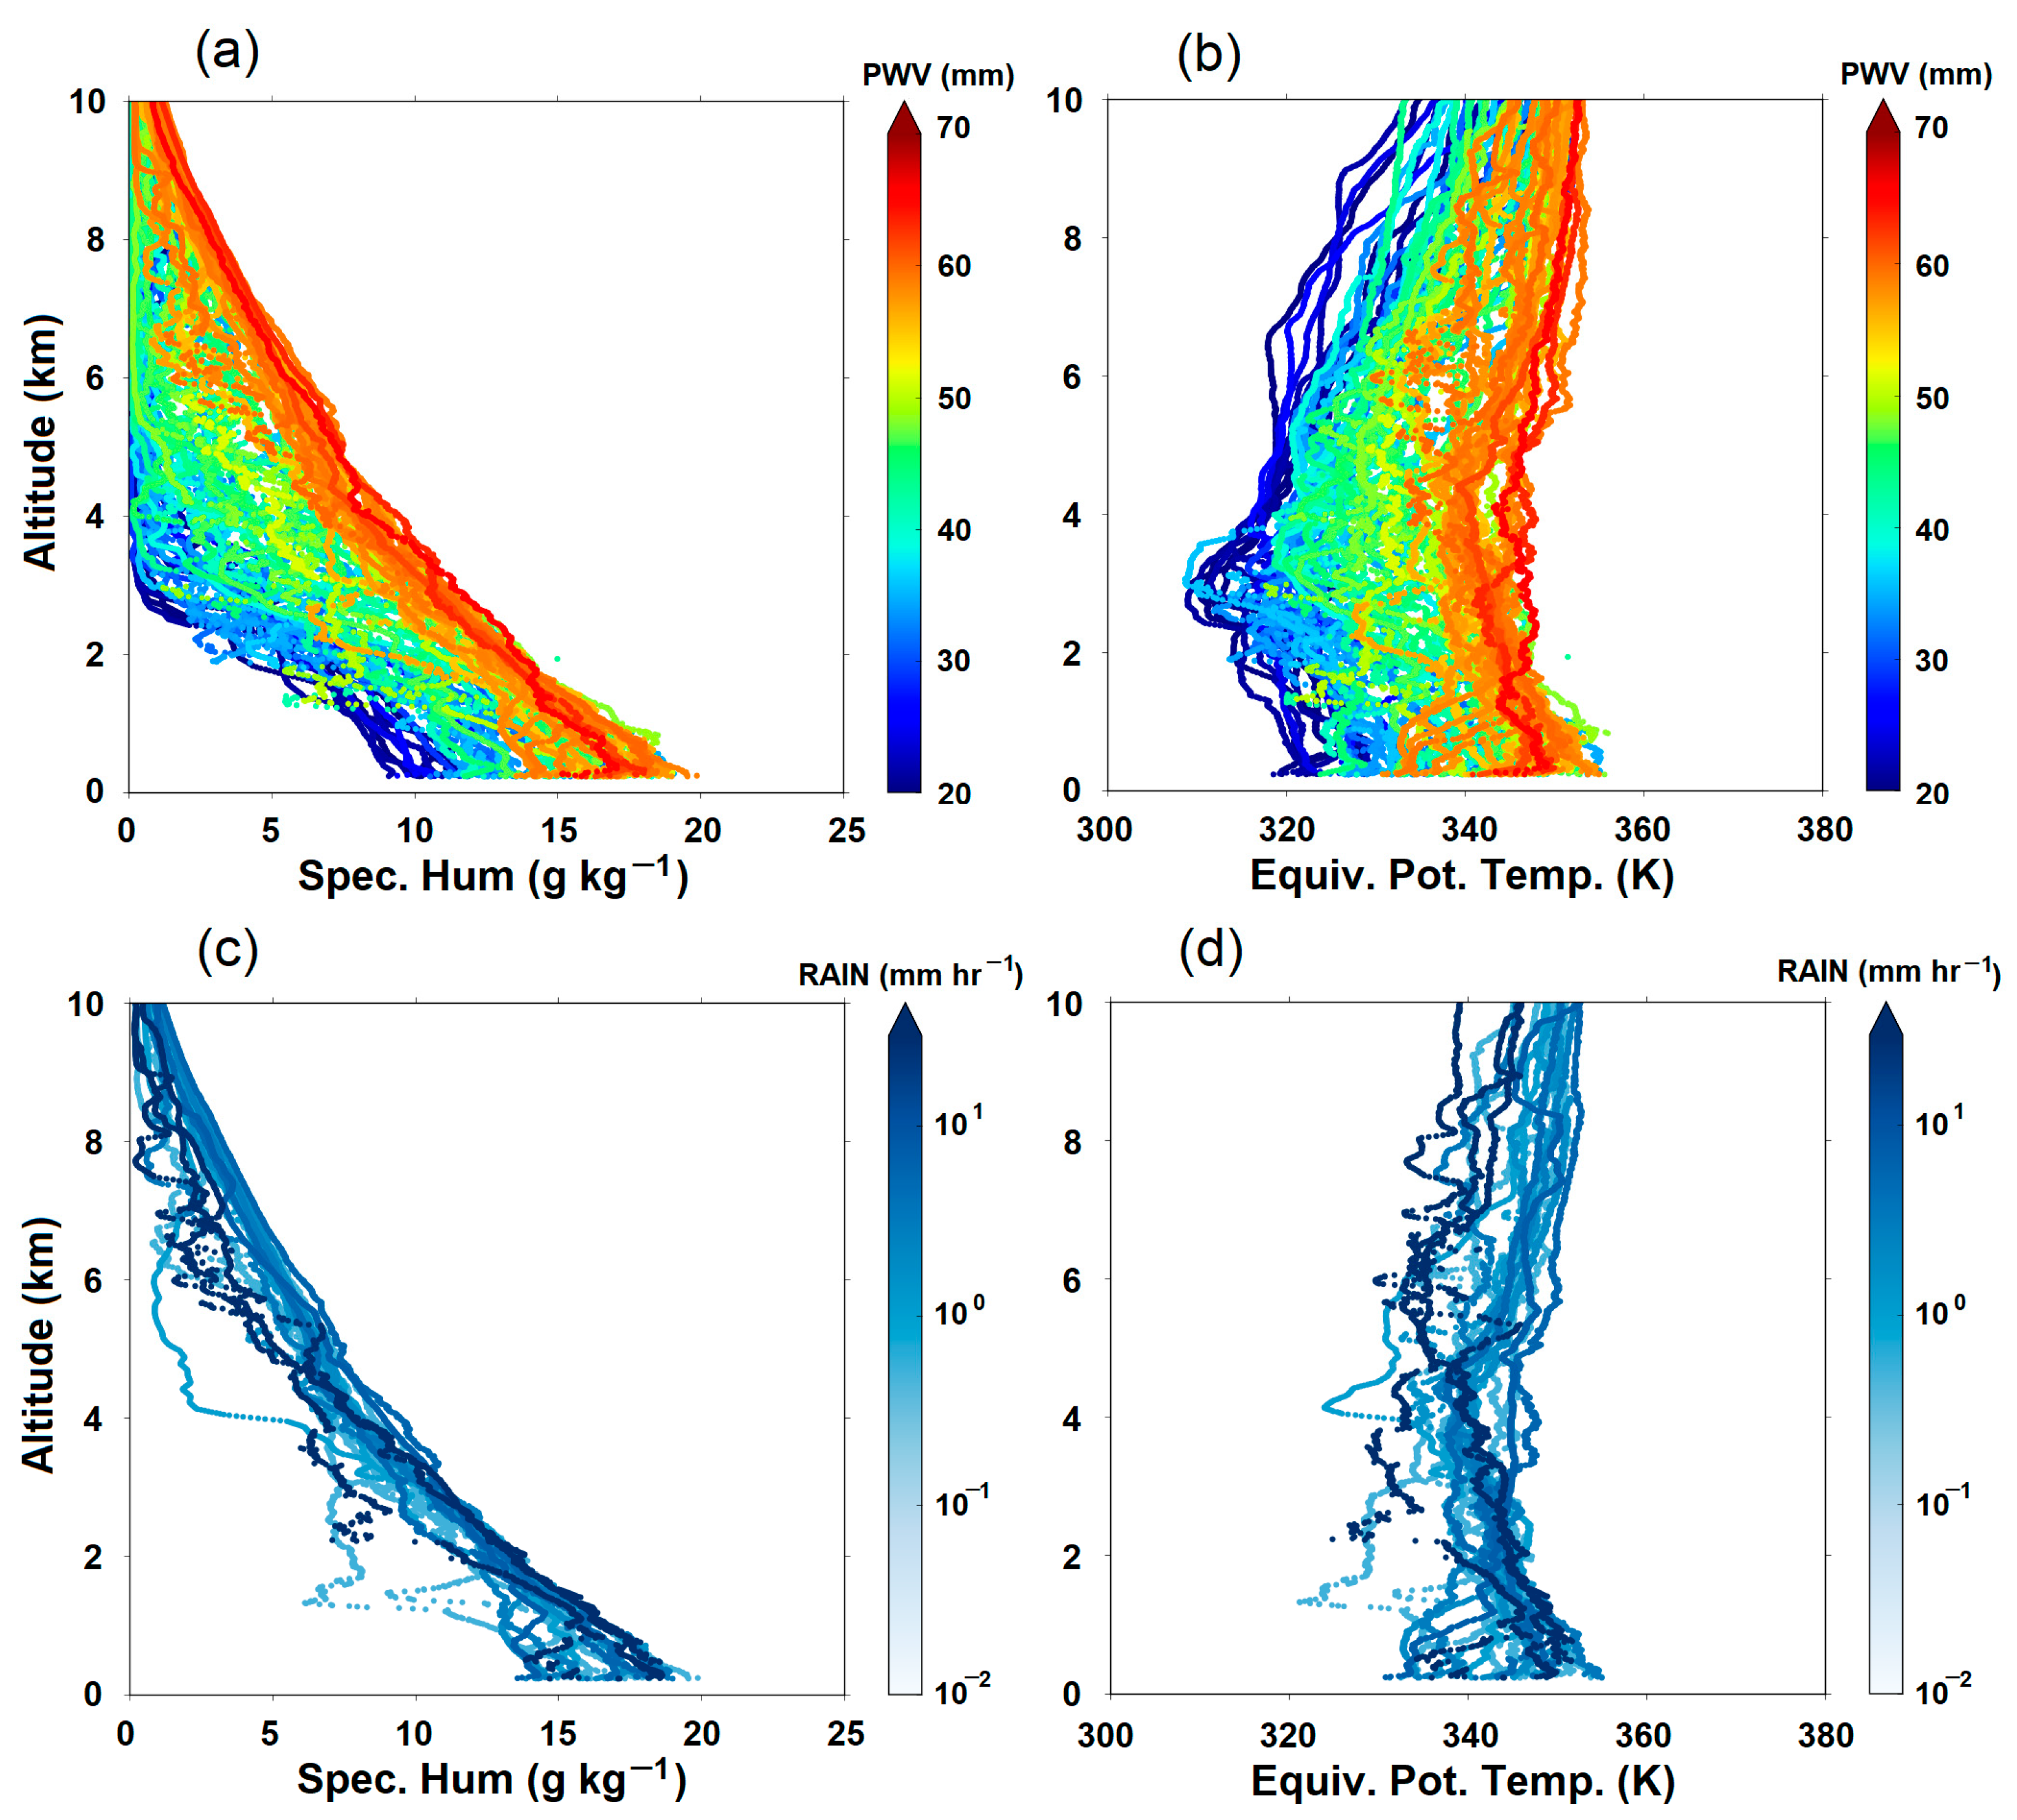
To understand the vertical structure of moisture variation and static stability associated with PWV and precipitation, we analyzed rawinsonde temperature and moisture data at 6 h intervals and precipitation gauge data at 1 min intervals for the 2016 summer IOP. A 1 h rain intensity at the BS site was computed for comparison with 77 rawinsonde soundings. The results of thermodynamic profiles conditioned on PWV and rain intensity in the linear and logarithmic scales are shown in Figure 8. First, the profiles of specific humidity conditioned on PWV (Figure 8a) demonstrated that it was primarily boundary layer moisture rather than upper tropospheric moisture that increased with increasing PWV. That is, ~70% of tropospheric water vapor is in the lowest 2 km above sea level, which is comparable to previous studies [35,36]. Inversion stability increased in the lowest PWV bin compared with the highest PWV bin (high instability) (Figure 8b), probably because of the absorption of dry air into the nonprecipitating cloud layer. The specific humidity and equivalent potential temperature profiles conditioned on rain intensity did not demonstrate the same behavior as the PWV. The sub-cloud layer moisture decreased in the highest precipitation bin; this could be attributed to precipitation-induced downdrafts forming cold pools of relatively denser air beneath warmer, lighter environmental air [37]. The cold pools moisten in shallow convection with low rain intensity, preserving the near-surface equivalent potential temperature; this condition shows downdraft origin air from within the boundary layer (Figure 8c,d) [38].
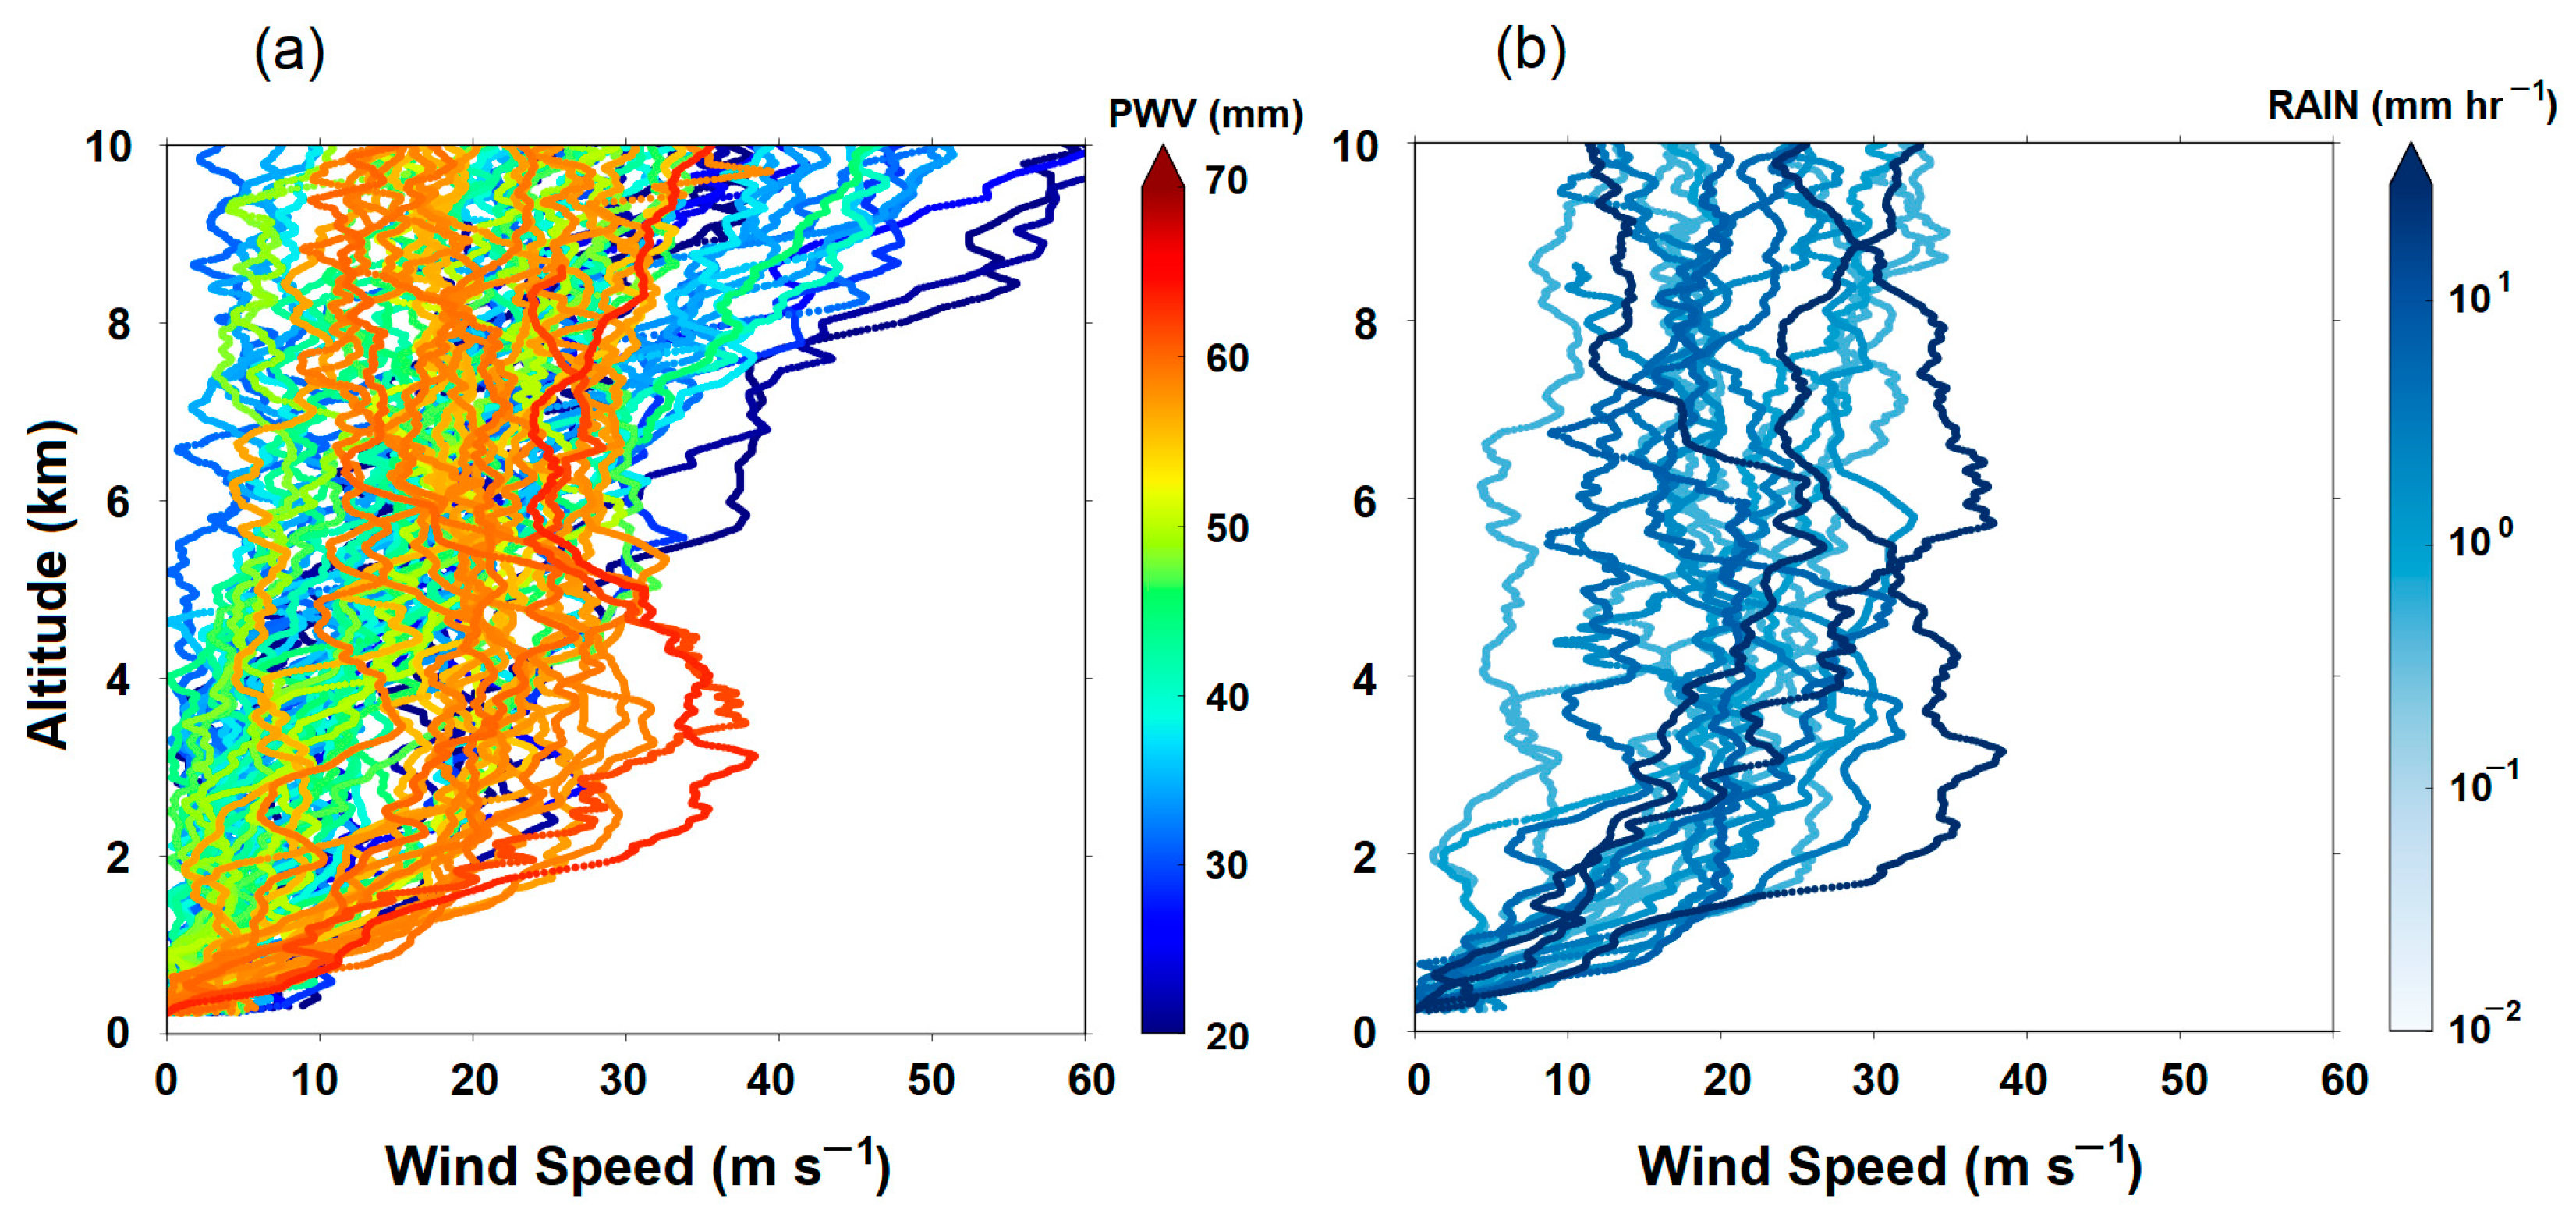
Furthermore, we used rawinsonde observations to examine the impact of lower-tropospheric flows and low-level moisture on rainfall behavior, because the surface measurements were unrepresentative of conditions aloft. A relationship between the vertical profiles of the wind speed and magnitude of the PWV in the upstream site (GC supersite) is shown in Figure 9a. Interestingly, the vertical structures of the horizontal wind speed indicate an LLJ with a maximum of ~40 m s−1, ~3–4 km where low-level moisture tends to be concentrated. Furthermore, we explored the horizontal wind speed profiles conditioned on rain intensity in the logarithmic scale (Figure 9b) to examine the features of upslope flow (particularly for the strong wind flow; LLJ) influencing heavy rainfall regimes in the downstream mountains (BS site). Therefore, the horizontal wind speed is ~40 m s−1 for the highest rain intensity bin at ~3 km altitude, and there is a large amount of variability among the bins at this level. When profiles are conditioned on rain intensity in the lowest bins, there is a considerably greater spread in horizontal wind speed. Note that the vertical variability of horizontal wind speed in the highest PWV bins shown in Figure 9a corresponds to large changes in upslope flows for all precipitation bins (Figure 9b). That is, the low-level upslope flow and low-level moisture observed above the windward site are important indicators of rain occurrence in the mountains [35]. However, the magnitude of upslope flows (and/or moistures) was not proportional to the rain intensities in downstream mountains (Figure 8c and Figure 9) because high PWV often precedes heavy rainfall, typically in the form of mesoscale convective clusters or larger-scale features [36].

3.5. Precipitation Cross-Correlation Analysis

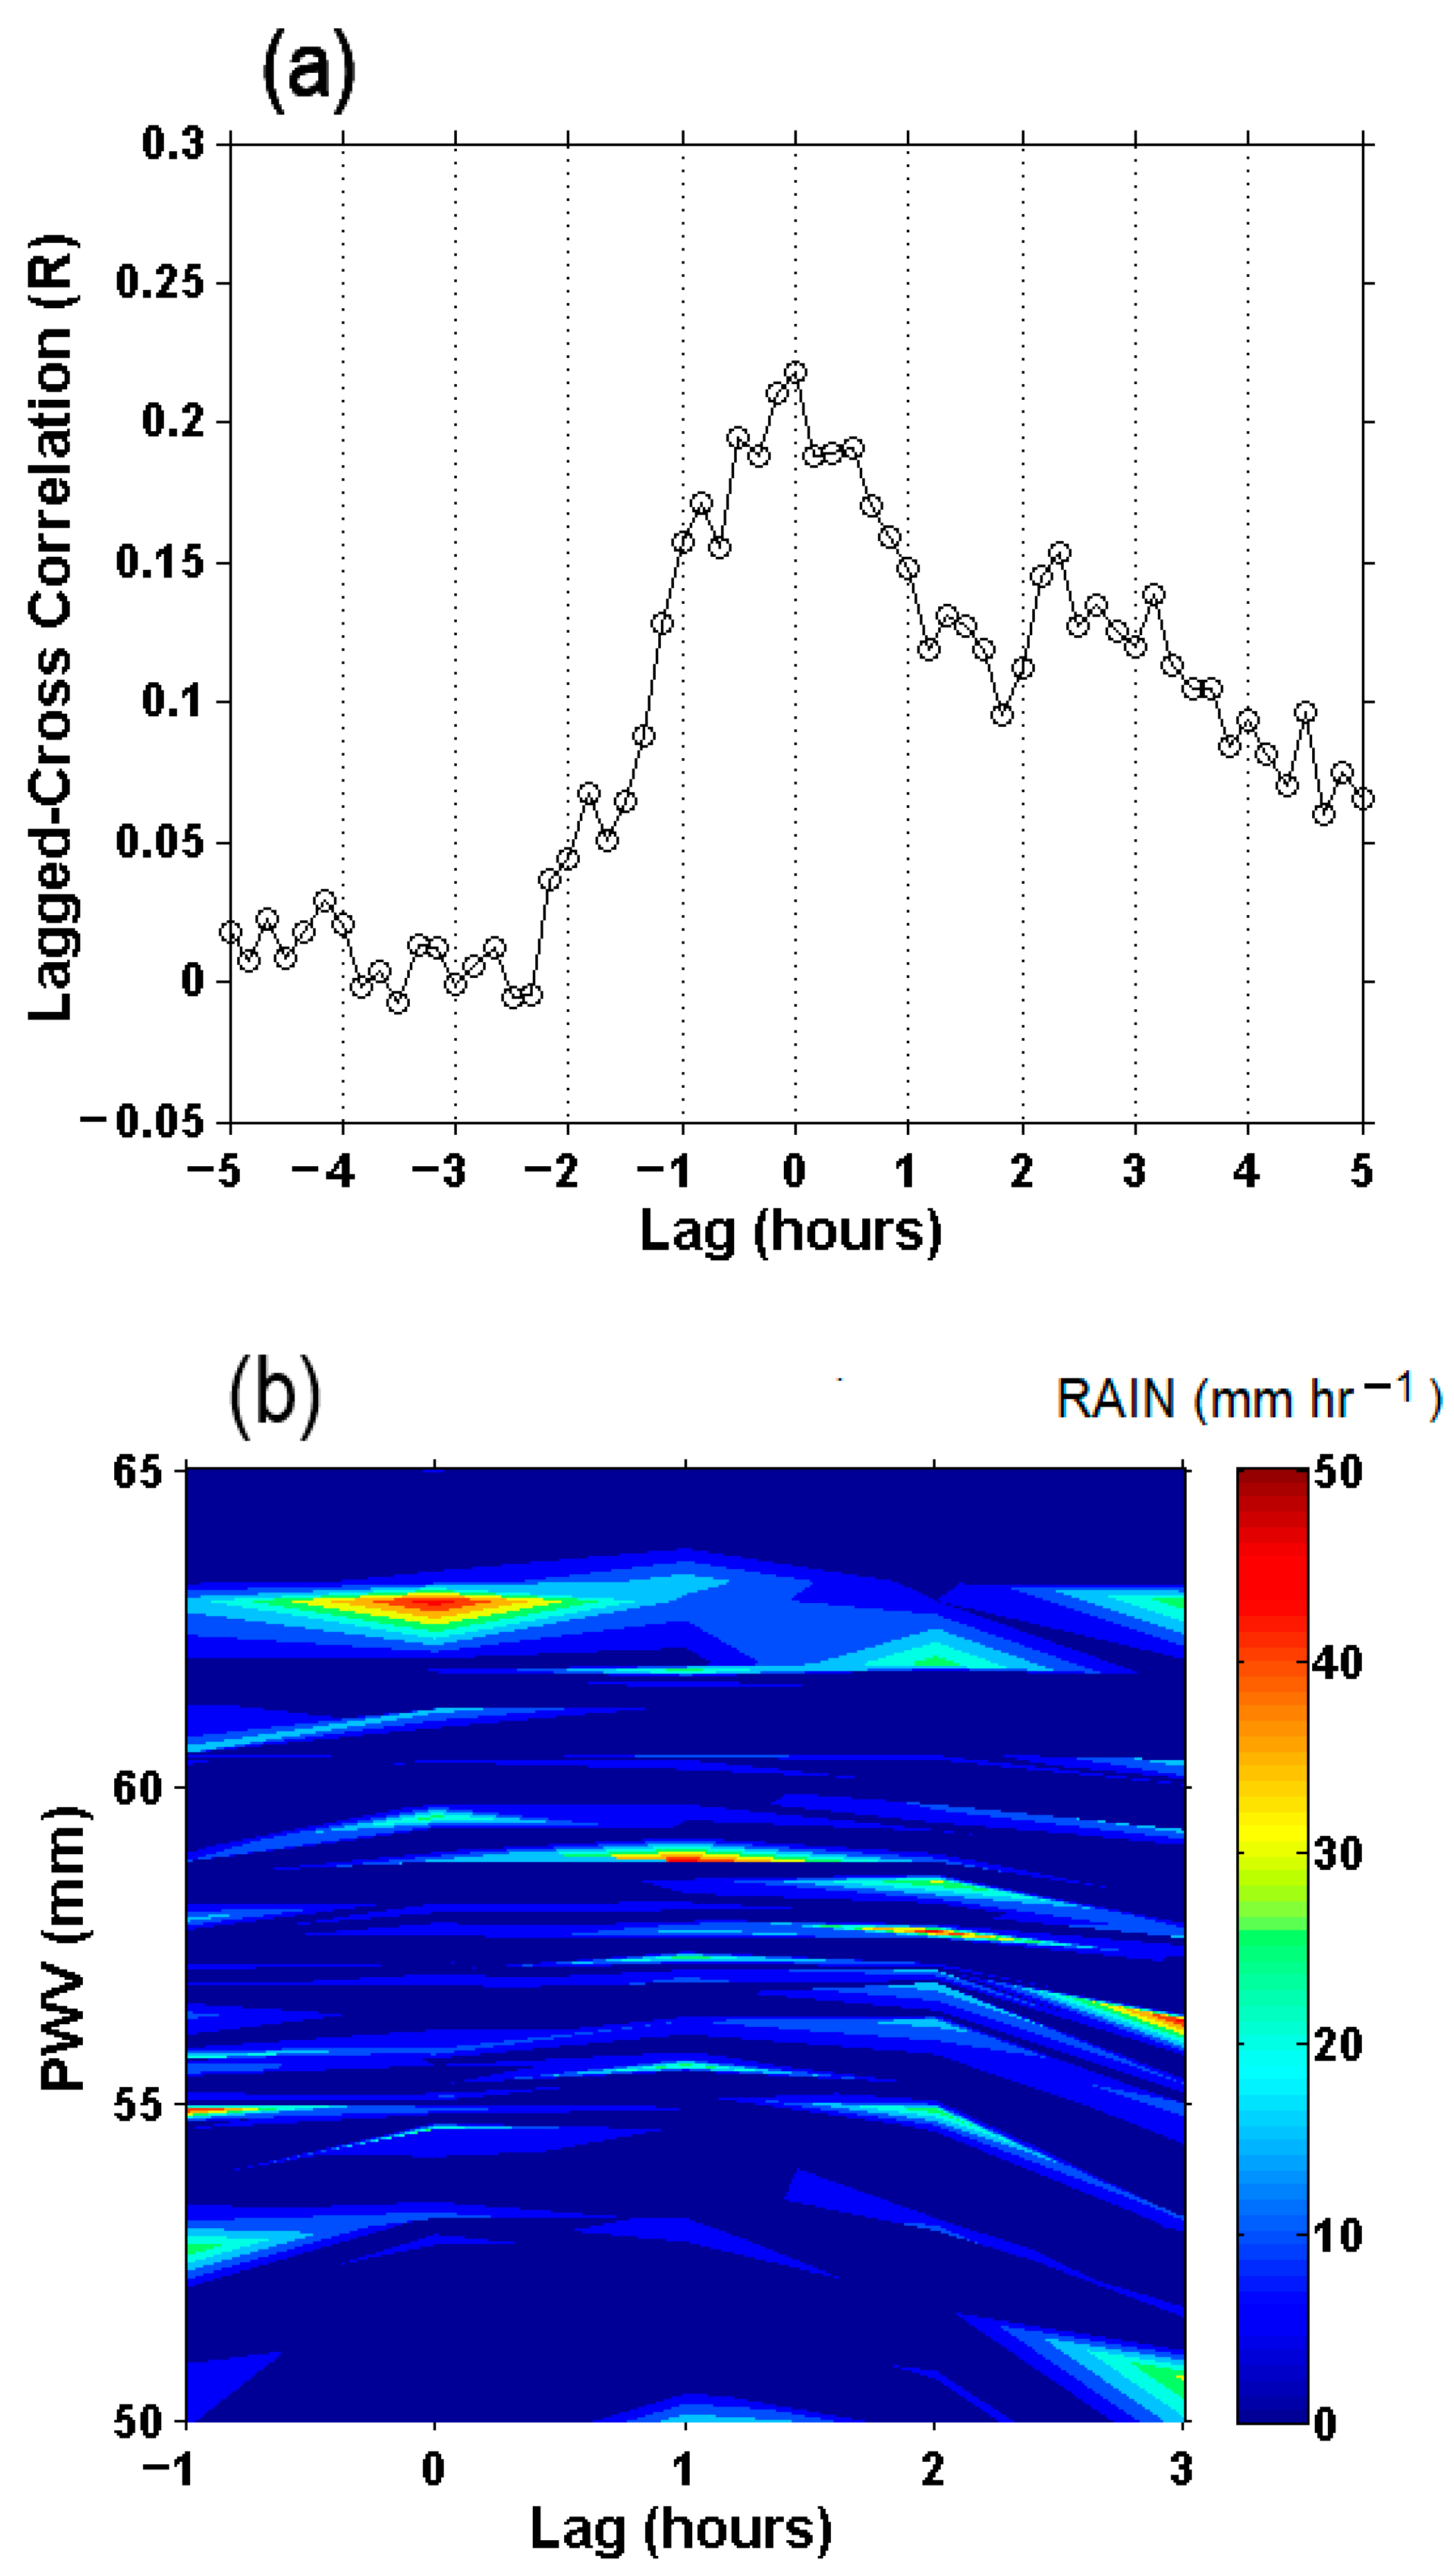
Many previous studies have reported positive feedback between PWV and deep convection [36,39,40]. Furthermore, a rapid increase in atmospheric water vapor is an important ingredient for multiple heavy rainfall events. Therefore, this section explores the correlation and lags between PWVs and rain intensities. As previously mentioned, a lead-lag analysis was performed using MOVE-GNSS and AWS site data throughout the analysis period to examine PWV–precipitation relationships (Figure 10a). These data are provided at a 10 min resolution, allowing us to explore the cross-correlation between PWV and precipitation at multiple lag times (from a few minutes to a few hours). The cross-correlation between the observed PWV and rain intensity sharply increased from approximately a −2 h lag to a brief peak with zero lag, before returning to near-ambient levels at ~4 h. This feature was interpreted because of an increase in the probability of precipitation events induced by an increase in PWV. An additional diagram was developed for visual clarity, to quantify lead-lag times associated with PWVs impacting heavy rainfall during the 2016 summer IOP. The rain intensity conditioned on gap-filled PWV at −1 h to 3 h lags is shown in Figure 10b. A fairly symmetric pattern, with a PWV of 63 mm and a rain intensity of ~50 mm h−1 in the ±1 lag time with increasing precipitation with PWV, was observed. The rain moistening the air around it and causing a reversed lag relationship explained the increase in precipitation intensity at the 1 h lag after the high PWV, with a PWV of 59 mm and a rain intensity of ~40 mm h−1. Although we focused on small-scale GNSS-PWV and precipitation gauge data, the relationship between PWV and precipitation can enable stochastic representations of the initiation of precipitation over a very short period.

4. Cases of Heavy Rainfall

4.1. Synoptic Characteristics

To examine the characteristics of synoptic flow in summer heavy rainfall, we selected two heavy rainfall cases that occurred on 23–24 June and 5–7 July, 2016; one has a summer monsoon (Changma) and the other has convective instability. The surface weather chart at 2100 UTC on 23 June 2016 is shown in Figure 11a. The synoptic chart for Case 1 shows low pressure over the Yellow Sea, with a quasi-stationary surface cyclone in the southern Korean Peninsula. This indicates that the quasi-stationary front moved eastward in connection with the low-pressure system that was passing via the study area. Furthermore, we examined another heavy rainfall event with different synoptic conditions. A North Pacific High extended to the southeastern coast of the Korean Peninsula on the surface weather chart at 0000 UTC on 6 July 2016, and a low-pressure was located over the East Sea to the west of Japan (Figure 11b). This synoptic pattern characteristic eventually results in the formation of a passage through which a large amount of warm water vapor can flow into the Korean Peninsula from the southwest along the edges of the North Pacific High. The spatial distribution of total accumulated precipitation from 0000 UTC 23 June to 2300 UTC 24 June is shown in Figure 11c. The observed precipitation was interpolated using a dataset of 638 rain gauges operated by the KMA. Note that >30 mm (maximum 87 mm; adjacent to GC supersite) of accumulated precipitation was recorded on the southern side of the Korean Peninsula, which is commonly attributed to the crossing of low pressure in the area (Figure 11a), thereby intensifying the accumulated rainfall amount. Furthermore, the spatial distribution of the total accumulated precipitation during the analysis period for Case 2 is shown in Figure 11b. While rainfall in the southern inland region of the Korean Peninsula exceeded 100 mm, a maximum center with total rainfall exceeding 280 mm (for 34 h) was located at the BS site in the study area. This indicates that in an unstable atmosphere, vertical air movements (such as in orographic lifting because of terrain effects) tend to increase, thus resulting in extensive vertical clouds and heavy rainfall, probably in association with the convective activity depicted by the convective available potential energy (CAPE; >2000 J kg−1) analysis (not shown).

4.2. Detailed Observational Structures

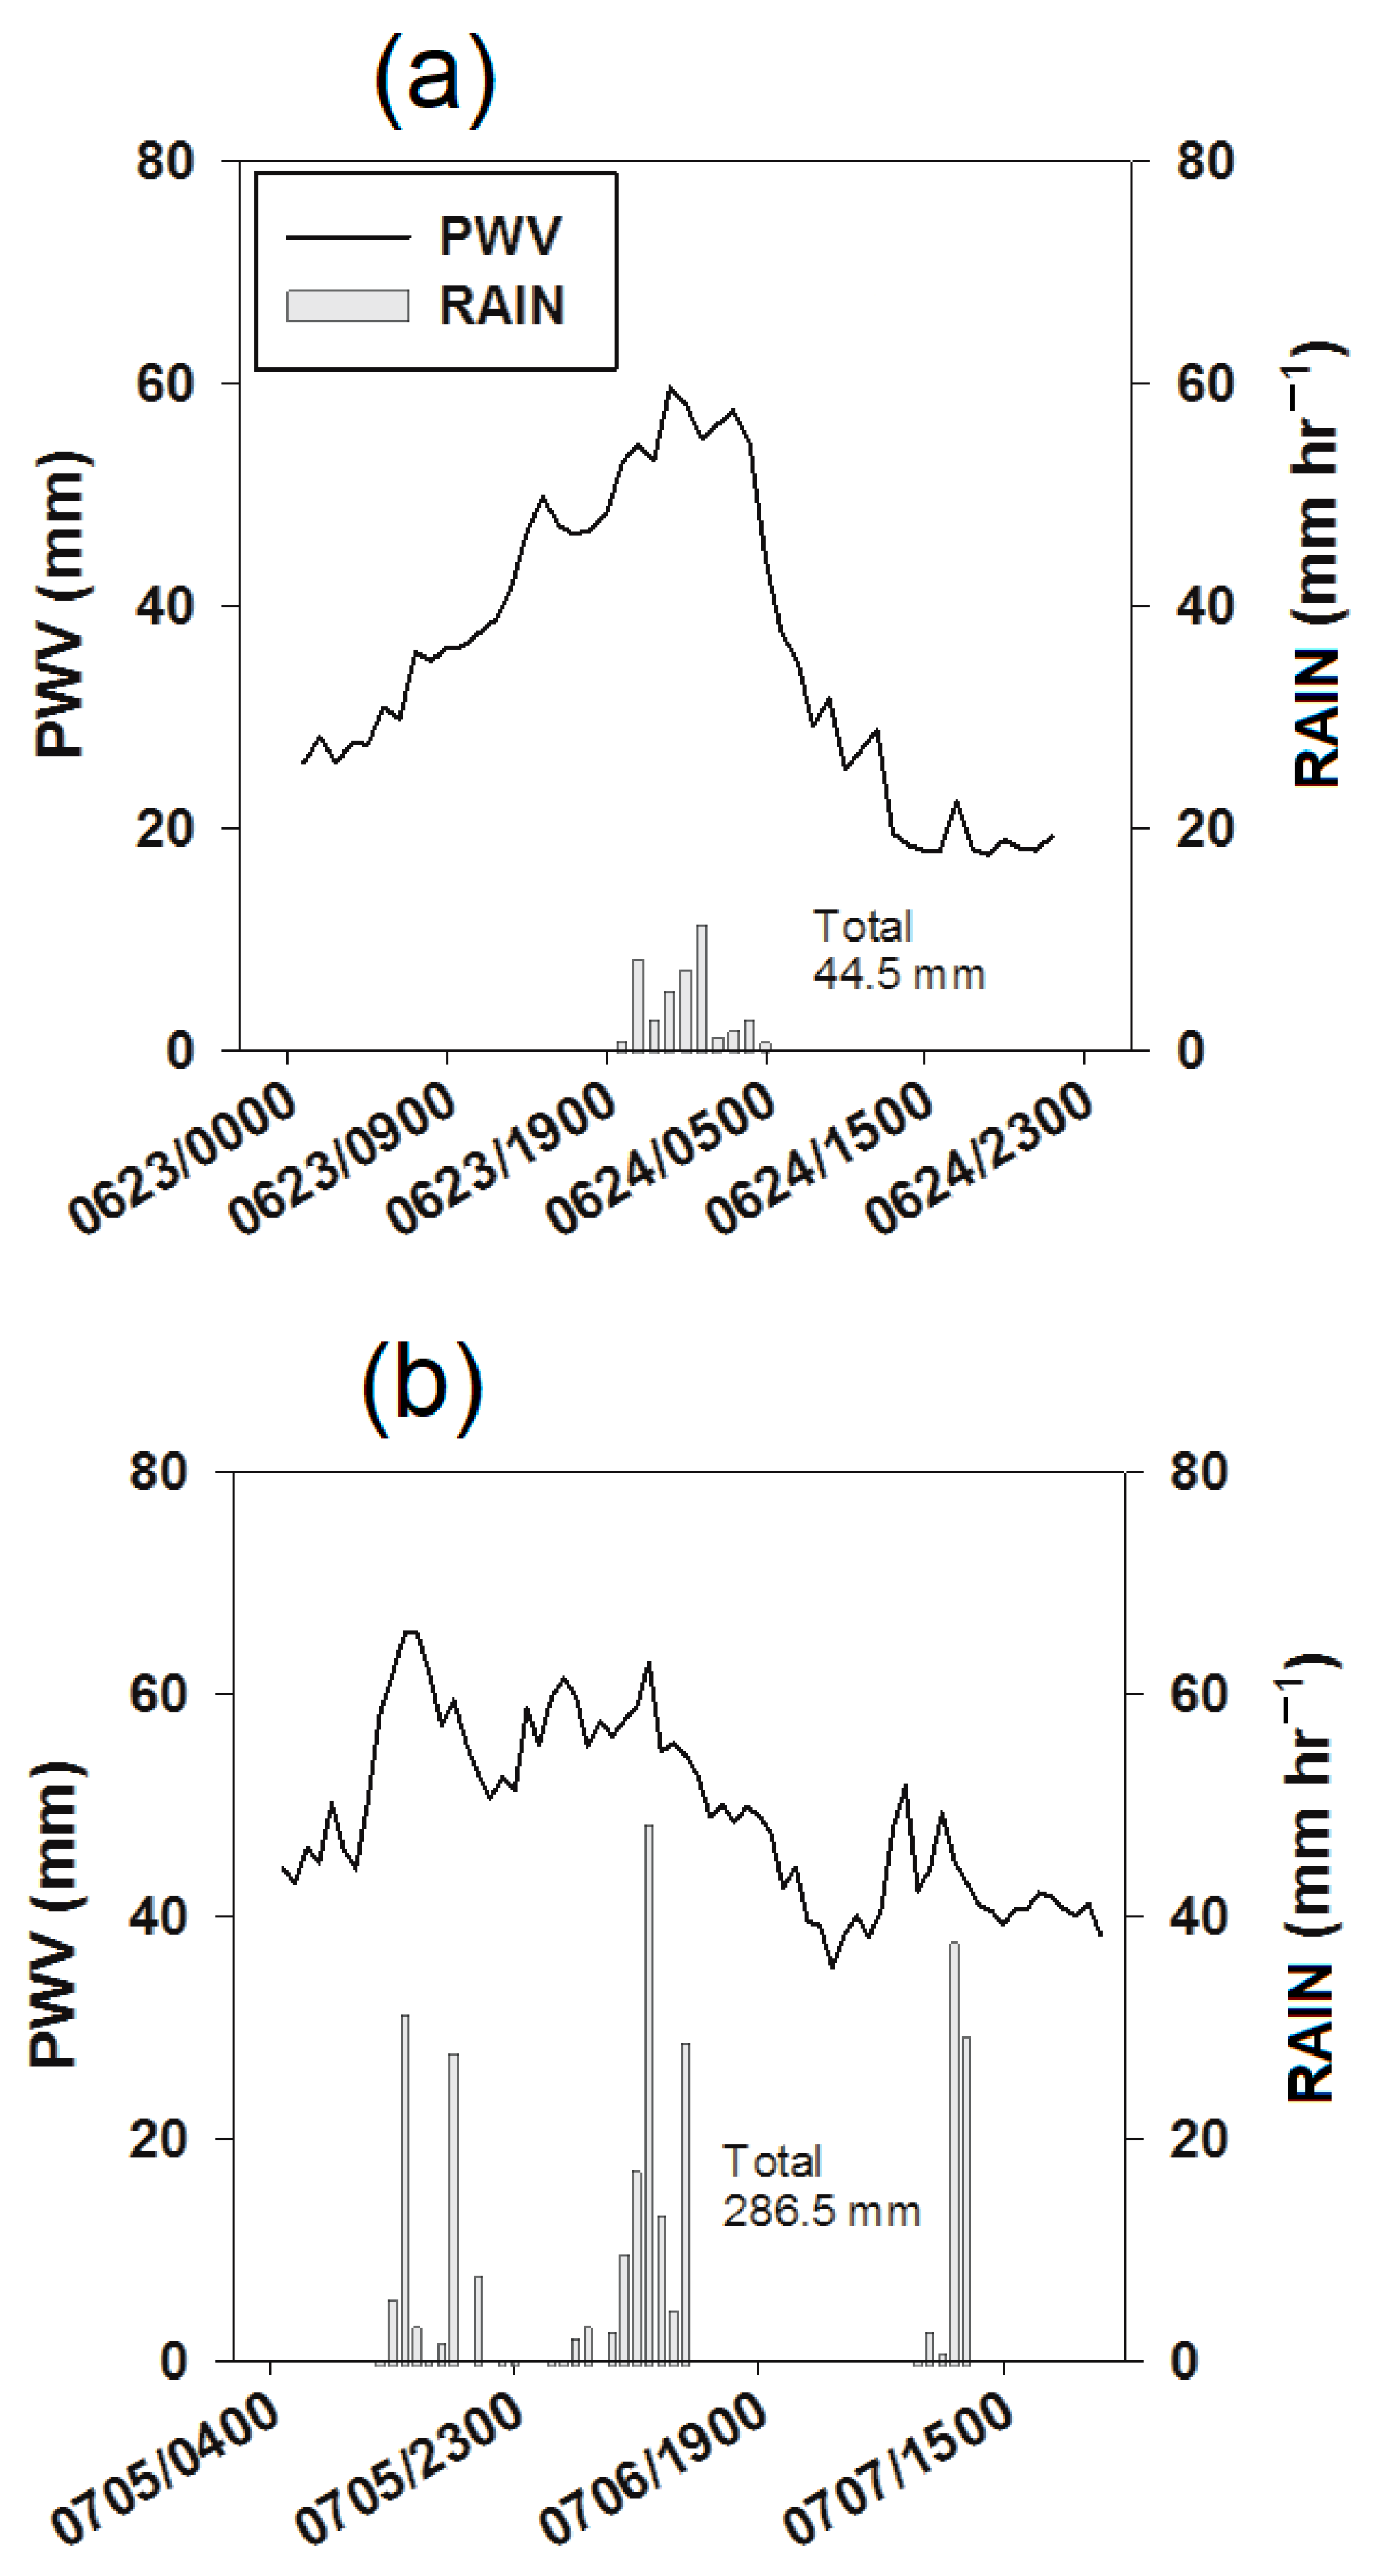
Furthermore, we compared the PWV–precipitation relationships between two different cases of localized heavy rainfall. Two distinct cases of relatively large surface rain intensity occurred from 0000 UTC 23 June to 2300 UTC 24 June (Case 1) and from 0400 UTC 5 July to 1400 UTC 7 July (Case 2), with total rainfall accumulations of 44.5 and 286.5 mm for Case 1 and Case 2, respectively. Figure 12a shows the time series of rain intensity and the PWV during Changma for Case 1, originating from a quasi-stationary surface cyclone at the leading edge of the maritime tropical air mass (Figure 11a). In this case, the relationship between the PWV and precipitation is extremely clear and simple. The maximum observed rain intensity (~20 mm h−1) occurred only after the largest PWV peak, with a maximum PWV of ~60 mm. Furthermore, Case 2, shown in Figure 12b, corresponds to a heavy shower produced by convection clouds observed in the study area between 5 and 7 July 2016 (cf. Figure 11b,d). This was associated with three PWV peaks, and the observed precipitation spikes ranged from 30 to 50 mm h−1. Four heavy rainfall events for both cases occurred after each build-up of PWV, and these initiated a sharp decrease in PWV during the following hours (Figure 12a,b). However, the build-up phase of the PWV in the Changma case (Case 1) took considerably longer than in the convective instability case (Case 2). The longer build-up phase of the PWV is possibly caused by smaller localized surface heating in Case 1 than in Case 2.
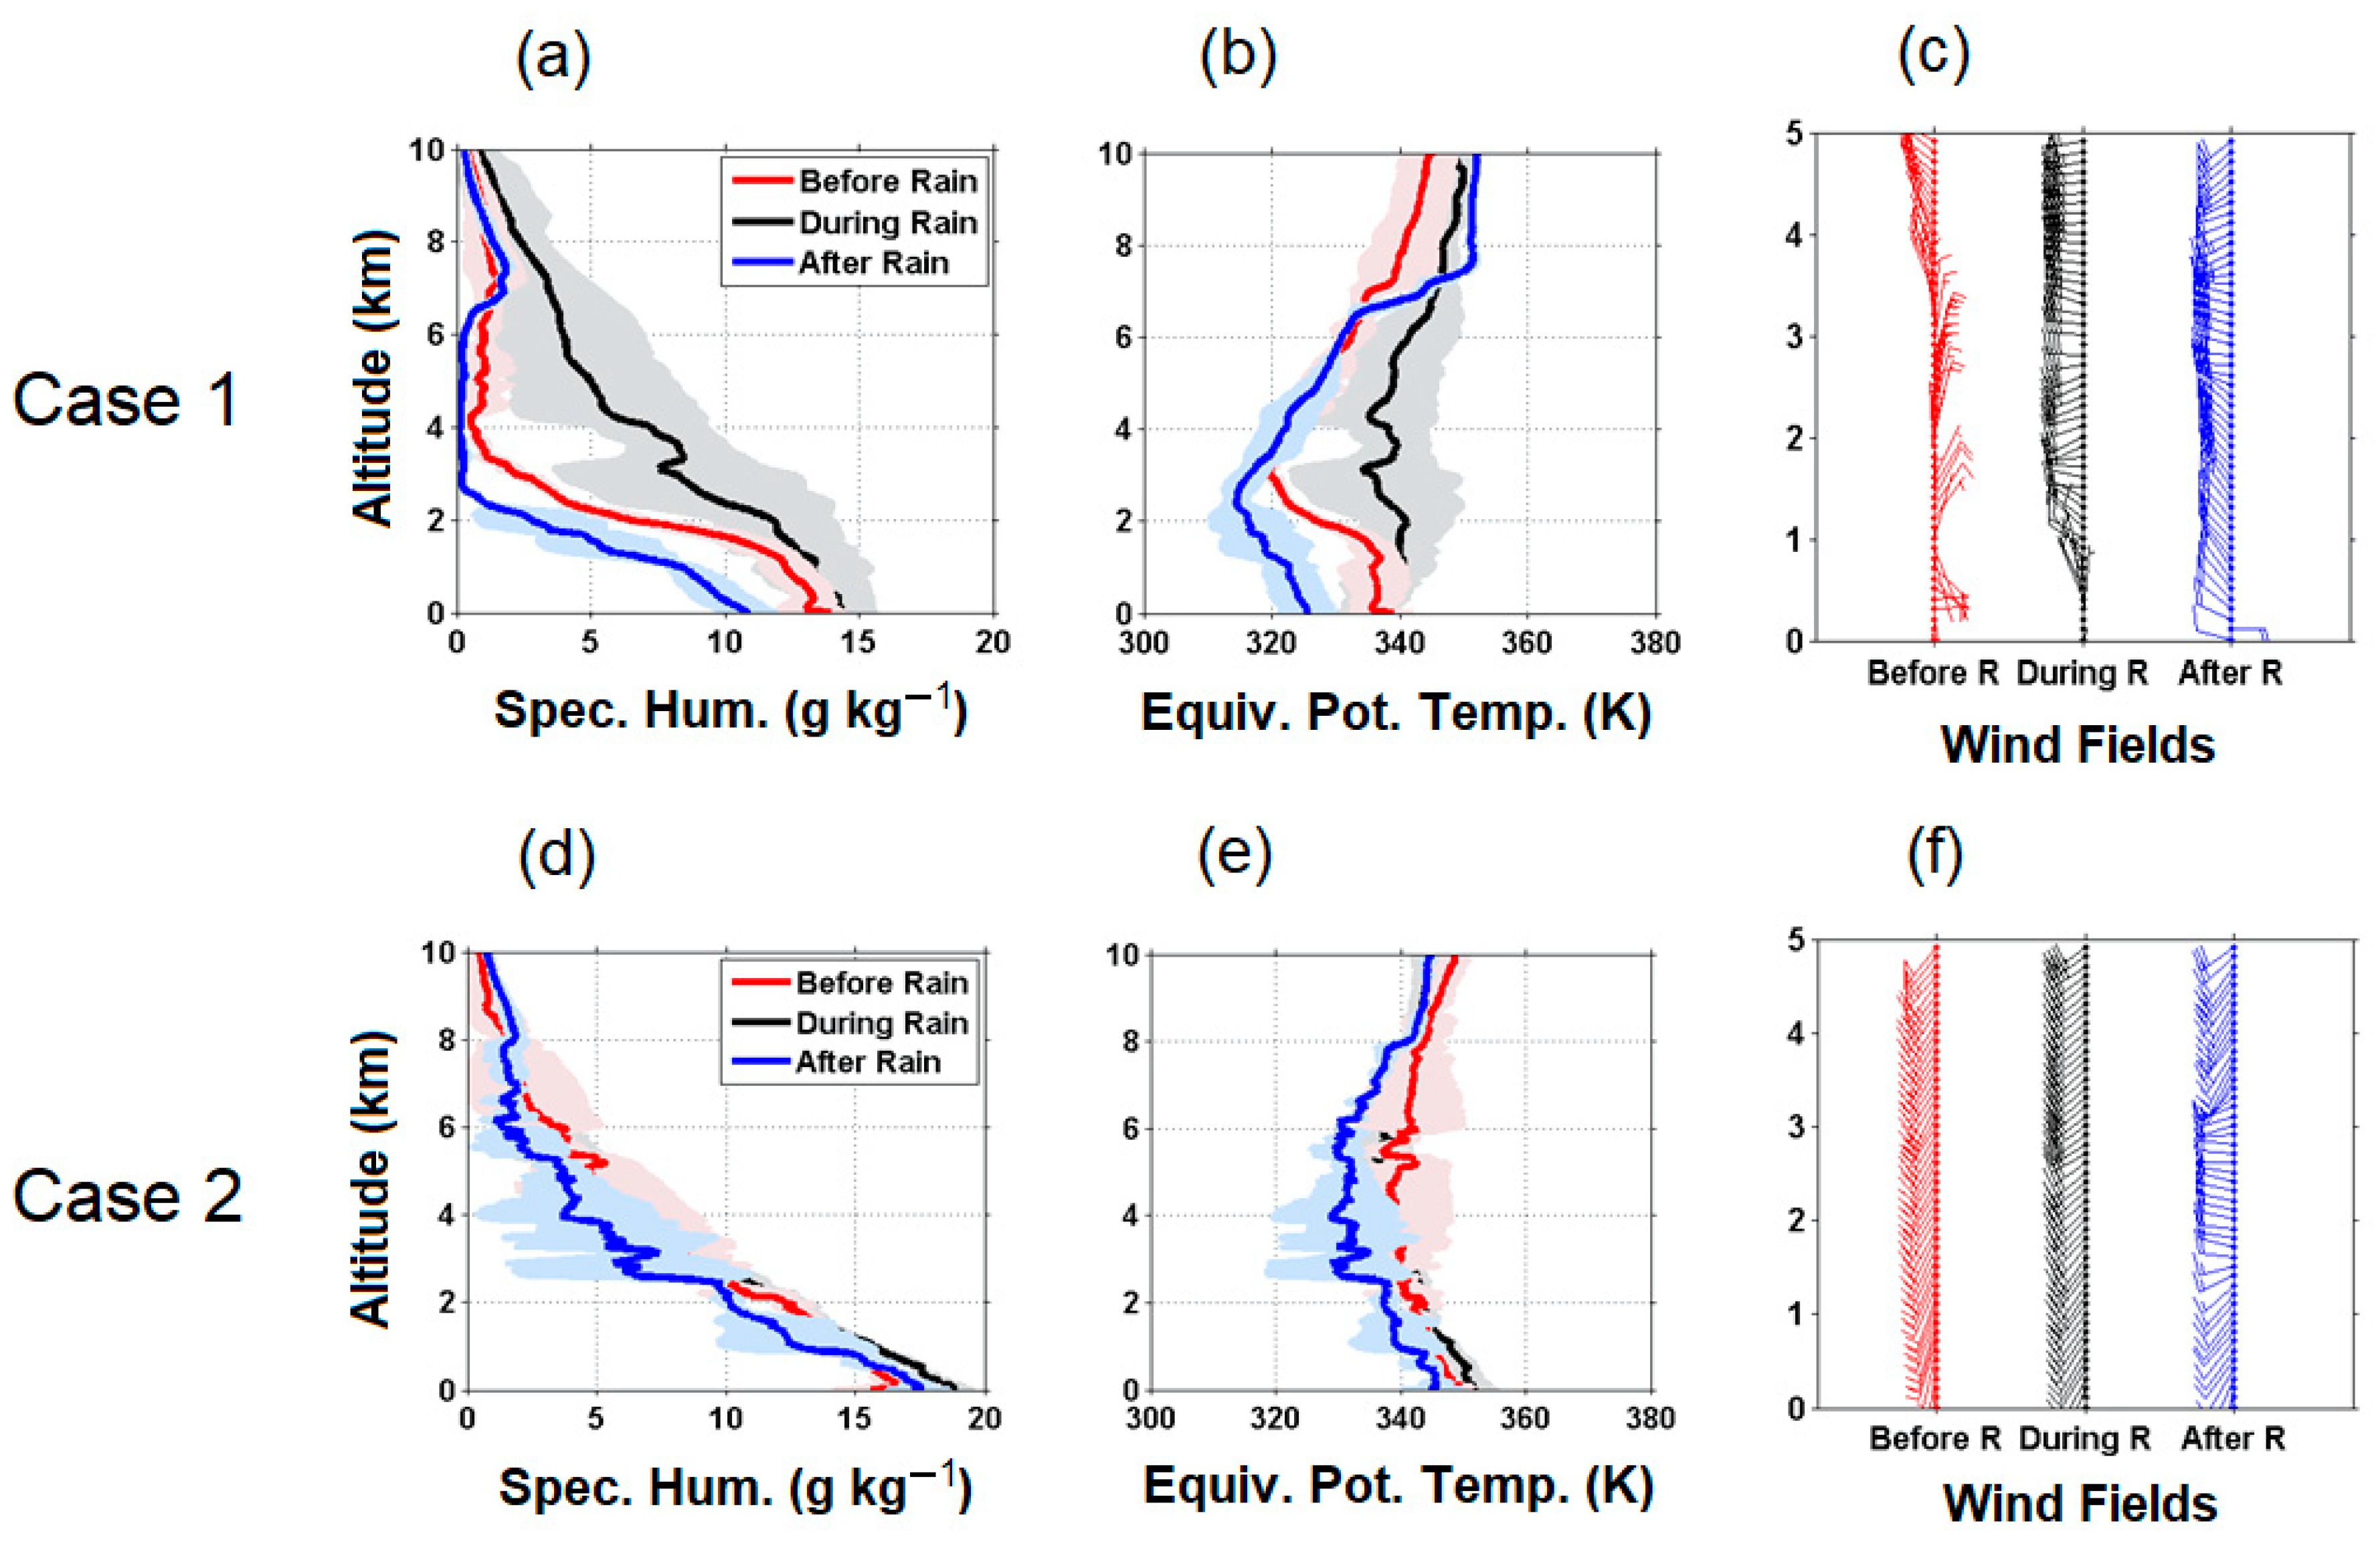
In this section, the rawinsonde data from the MOVE platforms at the GC supersite for both cases were used to compare the vertical structures of thermodynamic indices at the process level. The level-averaged vertical profiles for specific humidity and equivalent potential temperatures, and representative soundings of vertical wind fields for rainfall lagging and leading of the rawinsonde data by up to 12 h are shown in Figure 13. In Case 1, the profiles demonstrated that the specific humidity was highest during precipitation and considerably lower before and after precipitation, particularly over the altitude range of the tropospheric layer (4–7 km) (Figure 13a). Note that levels below 1.5 km were moister before and during rainfall than afterward; this could be attributable to a warm perturbation (warming and moistening) because of the advection of warm air (Figure 13b,c). There were no significant differences in the specific humidity between the periods in altitude average for Case 2; however, specific humidity was greater than Case 1 at the lower level (Figure 13d). The vertical characteristics of the equivalent potential temperatures shown in Figure 13b,e show additional contrasts between the cases. In Case 1, the surface cooling of ~10 K after rainfall was possibly attributed to the formation of a cold pool induced by diabatic cooling through the evaporation of raindrops [41]. Interestingly, the mean static stability at >2 km altitude was variable for all periods (in the order of after > before > during rainfall), whereas in Case 2, this was less variable with time and had generally higher convective instability close to the surface, compared with Case 1. Vertical wind barbs reported that the wind structures in Case 1 and Case 2 differed significantly (Figure 13c,f). Case 1 demonstrated the progression of a vertical wind structure connected with a quasi-stationary frontal passage (e.g., veering winds at low levels before rainfall), whereas Case 2 demonstrated a nearly homogeneous southwesterly wind from the surface to an altitude of 5 km.

4.3. PWV Plumes in the Ground GNSS Database

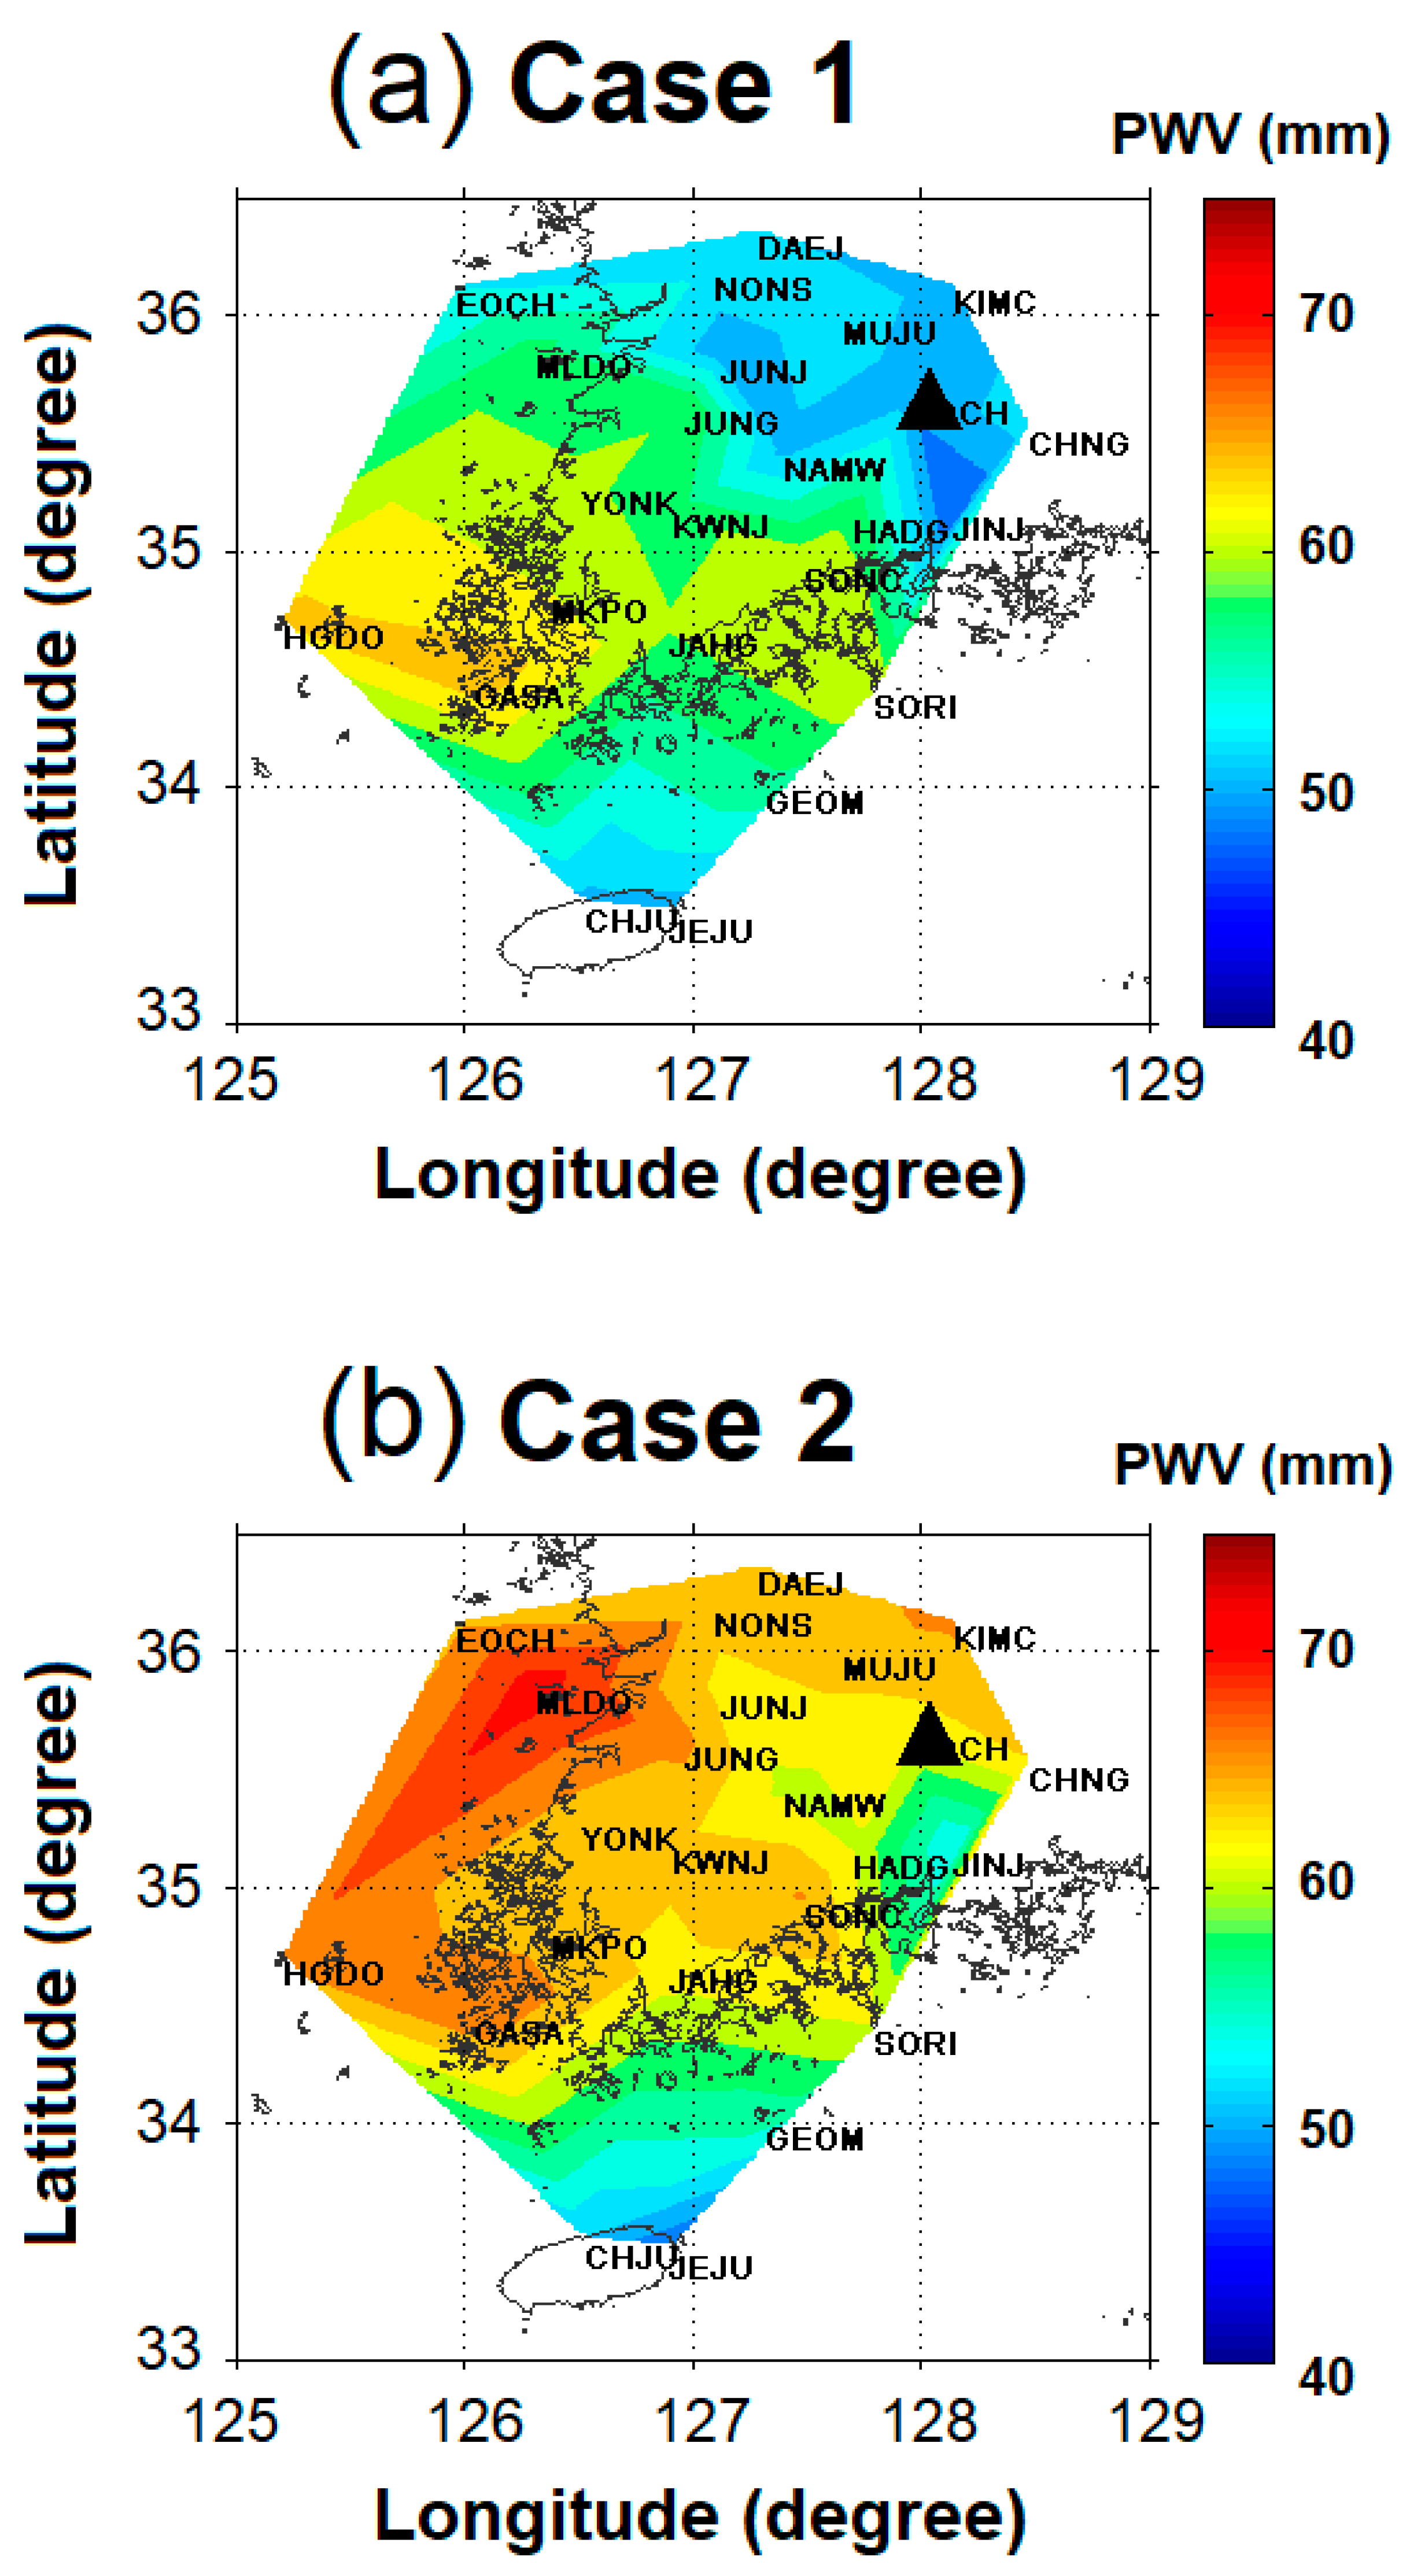
Finally, the PWV dataset for 24 ground GNSS stations supported by the KASI was used as a baseline for detecting landfalling water vapor plumes that extended to the southwestern coast of the Korean Peninsula. We created a composite image of the PWV during the Changma case (Case 1) based on the 24 ground GNSS stations distributed across the southern Korean Peninsula to examine the average behavior of PWV around a heavy rainfall event (Figure 14a). The spatial distribution of the PWV reported a horizontal gradient from the southwest to the northeast, representing the eastward movement of the water vapor during the time evolution. This water vapor plume lies within the quasi-stationary cyclones crossing the southern Korean Peninsula (Figure 11a). Because of the steep topography of certain GNSS sites (e.g., station MUJU, GOCH, and NAMW; see Table A1) in the study area, the Saastamoinen zenith hydrostatic delay model and the Vienna Mapping Function 1 (hydrostatic and wet) were used to represent realistic atmospheric conditions, such as pressure and water vapor content [28,42]. Despite the removal of the topography effect in GNSS processing, there was a significant northeastward movement of water vapor along the southwestern coast of Korea (Figure 14b) (for Case 2). Cross-barrier, southwesterly moving water vapor with a peak of >70 mm at the coast (station MLDO; see Figure 14b) formed narrow warm-sector corridors of strong water vapor transport associated with a continuous low-level southwesterly flow (Figure 13f), which eventually magnified the orographic rainfall over the mountain complex (Figure 11d).

5. Discussion

In this study, we examined the characteristics of the local climate and the influence of water vapor on heavy rainfall events in the southern Korean Peninsula during the 2016 summer intensive observation period (IOP; from 23 June to 12 July 2016) in Geochang (GC), South Korea. An intensive observation dataset of MOVE, with high temporal resolution rawinsonde soundings and GNSS observations, was used. We analyzed the low-level thermodynamic structure in terms of the relationship between water vapor and heavy rainfall. We divided study events into two heavy rainfall cases to compare the characteristics of representative summer heavy rainfall with different synoptic environments. Case 1 has localized heavy rainfall associated with the Changma (summer monsoon) and Case 2 has convective instability.
Results demonstrated that an increase in precipitation on the leeward side of the mountainous region coincided with the prevailing winds on the southeasterly flank of the windward site, indicating that examining prevailing surface winds in the windward region is critical for an improved understanding of their influence on orographic precipitation. Note that the vertical variability of the horizontal wind speed in the highest PWV bins corresponds to considerable changes in upslope flows for all precipitation bins, indicating that the LLJ along with strong low-level moisture of ~3–4 km is an important indicator of rain occurrence in the downstream mountains. A lead-lag analysis revealed that the atmosphere remained moist for 1 h on either side of heavy rainfall, with the probability of severe rainfall increasing in the highest PWV bin (>60 mm). PWV plumes are important in water vapor availability for precipitation processes along the edges of the North Pacific High (Figure 11a,b), and the proximity of the mountainous terrain of the southern Korean Peninsula to this water vapor source is ideal for two heavy rainfall cases. Furthermore, the LLJ, which forms in response to restoring thermal wind balance, favors a strong water vapor transport (Figure 9a), thus leading to precipitation enhancement when it transports water vapor toward a mountain range [43,44,45]. This study is unique in that it details low-level vertical kinematic structures to better understand their influence on the orographic precipitation associated with a small-scale basin surrounded by mountains.
Despite these results, this study has limitations insofar as it only focused on two heavy rainfall cases from one season (2016). Longer GNSS and precipitation datasets must be analyzed to understand the dependency of parameters, such as the best threshold and lead-lag times for the tendency of PWV, on heavy rainfall. Using GNSS-PWV data with more intensive (3 h interval) rawinsonde observations and/or other remote sensing measurements will surely improve this study. Furthermore, low-level three-dimensional kinematic and moisture structures are essential for improved understanding of their influence on heavy rainfall [8]. PWV and precipitation vary in complex environments such as mountainous areas. Thus, the integration of numerical prediction models, dual-polarization radars, polar-orbiting satellites and MOVE observations is necessary to improve the predictability of heavy rainfall impacting the southern Korean Peninsula [11,12,45]. In future, combined analysis using numerical modeling, radar observations, satellites (e.g., Special Sensor Microwave Imager: SSM/I, Geostationary Korea Multi-Purpose Satellite-2A: GK-2A, and others) and other upper-air observations (e.g., wind profiler and Doppler wind lidar) will be conducted. In addition, it is necessary to consider anomaly-based percentile thresholds of predictors (e.g., hourly increment, cumulative increment and rate of cumulative increment) derived from GNSS-PWV for obtaining better detection performance of heavy rainfall events, as addressed by Li et al. (2022) [22].

6. Conclusions

In this study, we focused on the meteorological characteristics at the process level of actual PWV and thermodynamic indices observed from the remote sensing of the MOVE platform in target areas during heavy rainfall cases. Our results on PWV-precipitation relationships show that the interactions of blocked and unblocked flow by the terrain in a given storm and lead-lag analysis should be considered. The MOVE platform observational evidence base demonstrated that strong low-level upslope flows accompanying the southwesterly movement of PWV plumes are an important factor in determining the distribution and intensity of precipitation in the mountainous area of the southern Korean Peninsula. Based on the results of this study, GNSS and rawinsonde datasets with high temporal resolution should be used to improve the predictability of heavy rainfall for end-users, and low-level moisture and upslope flow effects at the windward site should be optimized. These strategies should be primarily considered in complex mountainous areas where travelers are exposed to extreme flooding. Although this approach has certain limitations, the results could provide the basis for the regional characterization of conditions and impacts associated with atmospheric water vapors. This framework suggests the application of stochastic prediction of precipitation in hydrological models.

Author Contributions

Conceptualization, Y.-J.K.; methodology, Y.-J.K.; validation, Y.-J.K. and J.-B.J.; formal analysis, Y.-J.K.; investigation, Y.-J.K.; data curation, Y.-J.K.; writing—original draft preparation, Y.-J.K.; writing—review and editing, Y.-J.K. and J.-B.J.; supervision, B.L.; project administration, B.L. All authors have read and agreed to the published version of the manuscript.

Funding

This research was funded by the Korea Meteorological Administration Research and Development Program “Research and Development for KMA Weather, Climate, and Earth system Services—Developing Target Observations, Analysis and Application Technology for High Impact Weather” under Grant (KMA2018-00123).

Data Availability Statement

The data presented in this study are available on request from the corresponding author. The data are not publicly available due to privacy or ethical restrictions.

Acknowledgments

Thanks are extended to the Korea Astronomy and Space Science Institute for supporting PWV dataset for 24 ground GNSS stations in the southern Korean Peninsula.

Conflicts of Interest

The authors declare no conflict of interest.

Appendix A

Table A1. Information on ground global navigation satellite system (GNSS) stations used in this study.
StationsLatitude (°N)Longitude (°E)H 1 (m)Receiver/Antenna
KIMC36.137128.14294.652Trimble NetR9/TRM59800.00
GOCH35.668127.943217.203Trimble NetR9/TRM59800.00
CHNG35.533128.47861.753Leica GR50/LEIAR25.R4
MUJU36.003127.661230.189Leica GR50/LEIAR25.R4
DAEJ36.363127.291116.840Trimble NetR9/TRM59800.00
NONS36.186127.09950.684Trimble NetR5/TRM59800.00
EOCH36.125125.96888.945Trimble NetR9/ChokeRing
MLDO35.858126.31575.290Trimble NetR9/ChokeRing
JUNJ35.843127.13577.148Trimble NetR9/TRM59800.00
JINJ35.173128.050122.001Trimble NetR9/TRM59800.00
JUNG35.623126.974141.387Leica GR50/LEIAR25.R4
NAMW35.423127.396179.845Leica GR50/LEIAR25.R4
HADG35.162127.70976.592Trimble Alloy/TRM59800.00
KWNJ35.178126.91071.626Trimble NetR9/TRM59800.00
YONK35.279126.516100.002Leica GR50/LEIAR25.R4
MKPO34.817126.38164.380Trimble NetR9/TRM59800.00
JANG34.675126.900116.773Trimble NetR9/TRM59800.00
HGDO34.711125.204112.025Trimble NetR9/ChokeRing
GASA34.461126.04384.502Trimble NetR9/L1/L2
GEOM34.008127.32295.421Trimble NetR9/ChokeRing
SORI34.412127.801114.177Trimble NetR9/ChokeRing
CHJU33.514126.53050.337Trimble NetR9/TRM59800.00
JEJU33.468126.905430.203Trimble NetR9/TRM59800.00
SONC34.957127.48643.617Leica GR50/LEIAR25.R4
1 H indicates the ellipsoidal height at each station.

References

  1. Kim, D.-K.; Chun, H.-Y. A numerical study of the orographic effects associated with a heavy rainfall event. J. Korean Meteor. Soc. 2000, 36, 441–454, (In Korean with English abstract). [Google Scholar]
  2. Nickerson, E.C.; Richard, E.R.; Rosset, R.; Smith, D.R. The numerical simulation of clouds, rain, and airflow over the Vosges and Black Forest mountains: A meso-β model with parameterized microphysics. Mon. Wea. Rev. 1985, 114, 398–414. [Google Scholar] [CrossRef]
  3. Park, C.H.; Lee, H.W.; Jung, W.-S. The effects of low-level jet and topography on heavy rainfall near Mt. Jirisan. J. Korean Meteor. Soc. 2003, 39, 441–458, (In Korean with English abstract). [Google Scholar]
  4. Lee, S.-H.; Ryu, C.-S. Numerical studies on the relation between low-level jet and heavy rainfall. Proc. Spring Meet. Korean Earth Sci. Soc. 2004, 1, 118–120. (In Korean) [Google Scholar]
  5. Lee, J.-W.; Hong, S.-Y. A numerical simulation study of orographic effects for a heavy rainfall event over Korea using the WRF model. J. Korean Meteor. Soc. 2006, 16, 319–332, (In Korean with English abstract). [Google Scholar]
  6. Lee, D.-K.; Eom, D.-Y.; Kim, J.-W.; Lee, J.-B. High-resolution summer rainfall prediction in the JHWC real-time WRF system. Asia-Pacific J. Atmos. Sci. 2010, 46, 341–353. [Google Scholar] [CrossRef]
  7. De Hann, S. National/Regional Operational Procedures of GPS Water Vapour Networks and Agreed International Procedures; KNMI: De Bilt, The Netherlands, 2006. [Google Scholar]
  8. Jacob, D. The role of water vapour in the atmosphere. A short overview from a climate modeller’s point of view. Phys. Chem. Earth 2001, 26, 523–527. [Google Scholar] [CrossRef]
  9. Lee, S.-W.; Kouba, J.; Schutz, B.; Kim, D.-H.; Lee, Y.-J. Monitoring precipitable water vapor in real-time using global navigation satellite systems. J. Geodesy 2013, 87, 923–934. [Google Scholar] [CrossRef]
  10. Webb, S.R.; Penna, N.T.; Clarke, P.J.; Webster, S.; Martin, I.; Bennitt, G.V. Kinematic GNSS estimation of zenith wet delay over a range of altitudes. J. Atmos. Ocean. Technol. 2016, 33, 3–15. [Google Scholar] [CrossRef]
  11. Smith, B.L.; Yuter, S.E.; Neiman, P.J.; Kingsmill, D.E. Water vapor fluxes and orographic precipitation over northern California associated with a landfalling atmospheric river. Mon. Wea. Rev. 2010, 138, 74–100. [Google Scholar] [CrossRef]
  12. Valenzuela, R.A.; Kingsmill, D.E. Orographic precipitation forcing along the coast of northern California during a landfalling winter storm. Mon. Wea. Rev. 2015, 143, 3570–3590. [Google Scholar] [CrossRef]
  13. Maussion, F.; Scherer, D.; Mölg, T.; Collier, E.; Curio, J.; Finkelnburg, R. Precipitation Seasonality and variability over the Tibetan Plateau as resolved by the High Asia Reanalysis. J. Clim. 2014, 27, 1910–1927. [Google Scholar] [CrossRef] [Green Version]
  14. Chen, B.; Dai, W.; Liu, Z.; Wu, L.; Kuang, C.; Ao, M. Constructing a precipitable water vapor map from regional GNSS network observations without collocated meteorological data for weather forecasting. Atmos. Meas. Tech. 2018, 11, 5153–5166. [Google Scholar] [CrossRef] [Green Version]
  15. Guan, J.-P.; Yin, Y.-T.; Zhang, L.-F.; Wang, J.-N.; Zhang, M.-Y. Comparison analysis of total precipitable water of satellite-borne microwave radiometer retrievals and island radiosondes. Atmosphere 2019, 10, 390. [Google Scholar] [CrossRef]
  16. Zhao, Q.; Zhang, X.; Wu, K.; Liu, Y.; Li, Z.; Shi, Y. Comprehensive precipitable water vapor retrieval and application platform based on various water vapor detection technique. Remote Sens. 2022, 14, 2507. [Google Scholar] [CrossRef]
  17. Billault-Roux, A.-C.; Berne, A. Integrated water vapor and liquid water path retrieval using a single-channel radiometer. Atmos. Meas. Tech. 2021, 14, 2749–2769. [Google Scholar] [CrossRef]
  18. Walbröl, A.; Crewell, S.; Engelmann, R.; Orlandi, E.; Griesche, H.; Radenz, M.; Hofer, J.; Althausen, D.; Maturilli, M.; Ebell, K. Atmospheric temperature, water vapour and liquid water path from two microwave radiometers during MOSAiC. Sci. Data 2022, 9, 534. [Google Scholar] [CrossRef] [PubMed]
  19. Antuña-Marrero, J.C.; Román, R.; Cachorro, V.E.; Mateos, D.; Toledano, C.; Calle, A.; Antuña-Sánchez, J.C.; Vaquero-Martínez, J.; Antón, M.; de Frutos Baraja, Á.M. Integrated water vapor over the Arctic: Comparison between radiosondes and sun photometer observations. Atmos. Res. 2022, 270, 106059. [Google Scholar] [CrossRef]
  20. Kelsey, V.; Riley, S.; Minschwaner, K. Atmospheric precipitable water vapor and its correlation with clear-sky infrared temperature observations. Atmos. Meas. Tech. 2022, 15, 1563–1576. [Google Scholar] [CrossRef]
  21. Bevis, M.; Businger, S.; Herring, T.A.; Rocken, C.; Anthes, R.A.; Ware, R.H. GPS meteorology: Remote sensing of atmospheric water vapor using the global positioning system. J. Geophys. Res. Atmos. 1992, 97, 15787–15801. [Google Scholar] [CrossRef]
  22. Li, L.; Zhang, K.; Wu, S.; Li, H.; Wang, X.; Hu, A.; Li, W.; Fu, E.; Zhang, M.; Shen, Z. An improved method for rainfall forecast based on GNSS-PWV. Remote Sens. 2022, 14, 4280. [Google Scholar] [CrossRef]
  23. Huang, L.; Mo, Z.; Xie, S.; Liu, L.; Chen, J.; Kang, C.; Wang, S. Spatiotemporal characteristics of GNSS-derived precipitable water vapor during heavy rainfall events in Guilin, China. Satell. Navig. 2022, 2, 13. [Google Scholar] [CrossRef]
  24. Li, H.; Wang, X.; Choy, S.; Jiang, C.; Wu, S.; Zhang, J.; Qiu, C.; Zhou, K.; Li, L.; Fu, E.; et al. Detecting heavy rainfall using anomaly-based percentile thresholds of predictors derived from GNSS-PWV. Atmos. Res. 2022, 265, 105912. [Google Scholar] [CrossRef]
  25. Lee, S.-H.; Kim, H.-D. Effects of regional warming due to urbanization on daytime local circulations in a complex basin of the Daegu metropolitan area, Korea. J. Appl. Meteorol. Climatol. 2008, 47, 1427–1441. [Google Scholar] [CrossRef]
  26. Dach, R.; Hugentobler, U.; Fridez, P.; Meindl, M. Bernese GPS Software, version 5.0; Astronomical Institute, University of Bern: Bern, Switzerland, 2007. [Google Scholar]
  27. Niell, A.E. Global mapping functions for the atmosphere delay at radio wavelengths. J. Geophys. Res. 1996, 101, 3227–3246. [Google Scholar] [CrossRef]
  28. Saastamoinen, J. Atmospheric correction for the troposphere and stratosphere in radio ranging of satellites. In The Use of Artificial Satellites for Geodesy; Geophysical Monograph Series; Henriksen, S.W., Mancini, A., Chovitz, B.H., Eds.; American Geophysical Union: Washington, DC, USA, 1972; Volume 15, pp. 247–251. [Google Scholar]
  29. Groves, P.D. Principles of GNSS, inertial, and multi-sensor integrated navigation systems. Artech House 2007, 64, 161–277. [Google Scholar]
  30. Davis, J.L.; Herring, T.A.; Shapiro, I.I.; Gogers, A.E.E.; Elgered, G. Geodesy by radio interferometry: Effects of atmospheric modeling errors on estimates of baseline length. Radio Sci. 1985, 20, 1593–1607. [Google Scholar] [CrossRef]
  31. Ha, J.H.; Park, K.D.; Heo, B.H. Comparisons of a local mean temperature equation for GPS-based precipitable water vapor over the Korean Peninsula. J. Astron. Space Sci. 2008, 25, 425–434, (In Korean with English abstract). [Google Scholar] [CrossRef] [Green Version]
  32. Benesty, J.; Chen, J.; Huang, Y.; Cohen, I. Pearson Correlation Coefficient. In Noise Reduction in Speech Processing; Springer: Heidelberg, Germany, 2009; Volume 2. [Google Scholar]
  33. Bolton, D. The computation of equivalent potential temperature. Mon. Wea. Rev. 1980, 108, 1046–1053. [Google Scholar] [CrossRef]
  34. Park, H.-E.; Yoo, S.-M.; Yoon, H.S.; Chung, J.-K.; Cho, J. Performance analysis of mapping functions and mean temperature equations for GNSS precipitable water vapor in the Korean Peninsula. J. Position. Navig. Timing 2016, 5, 75–85. [Google Scholar] [CrossRef] [Green Version]
  35. Nickerson, E.C.; Richard, E.R.; Rosset, R.; Smith, D.R. The statistical relationship between upslope flow and rainfall in California’s coastal mountains: Observations during CALJET. Mon. Wea. Rev. 2002, 130, 1468–1492. [Google Scholar]
  36. Holloway, C.E.; Neelin, J.D. Moisture vertical structure, column water vapor, and tropical deep convection. J. Atmos. Sci. 2009, 66, 1665–1683. [Google Scholar] [CrossRef] [Green Version]
  37. Holloway, C.E.; Neelin, J.D. Temporal relations of column water vapor and tropical precipitation. J. Atmos. Sci. 2010, 67, 1091–1105. [Google Scholar] [CrossRef]
  38. Zuidema, P.; Torri, G.; Muller, C.; Chandra, A. A survey of precipitation-induced atmospheric cold pools over oceans and their interactions with the larger-scale environment. Surv. Geophys. 2017, 38, 1283–1305. [Google Scholar] [CrossRef] [Green Version]
  39. Tompkins, A.M. Organization of tropical convection in low vertical wind shears: The role of water vapor. J. Atmos. Sci. 2001, 58, 529–545. [Google Scholar] [CrossRef]
  40. Derbyshire, S.H.; Beau, I.; Bechtold, P.; Grandpeix, J.-Y.; Piriou, J.-M.; Redelsperger, J.-L.; Soares, P.M.M. Sensitivity of moist convection to environmental humidity. Quart. J. Roy. Meteor. Soc. 2004, 130, 3055–3079. [Google Scholar] [CrossRef]
  41. Jeong, J.-H.; Lee, D.-I.; Wang, C.-C. Impact of the cold pool on mesoscale convective system–Produced extreme rainfall over southeastern South Korea: 7 July 2009. Mon. Wea. Rev. 2016, 144, 3985–4006. [Google Scholar] [CrossRef]
  42. Boehm, J.; Werl, B.; Schuh, H. Troposphere mapping functions for GPS and very long baseline interferometry from European Centre for Medium-range Weather Forecasts operational analysis data. J. Geophys. Res. Solid Earth 2006, 111, 1–9. [Google Scholar] [CrossRef]
  43. White, A.B.; Neiman, P.J.; Ralph, R.M.; Kingsmill, D.E.; Persson, P.O.G. Coastal orographic rainfall processes observed by radar during the California LandFalling Jets Experiment. J. Hydrometeor. 2003, 4, 264–282. [Google Scholar] [CrossRef]
  44. Ralph, F.M.; Rotunno, R. Dropsonde observations in low-level jets over the northeastern Pacific Ocean from CALJET-1998 and PACJET-2001: Mean vertical profile and atmospheric river characteristics. Mon. Wea. Rev. 2005, 133, 889–910. [Google Scholar] [CrossRef]
  45. Neiman, P.J.; Ralph, F.M.; White, A.B.; Lundquist, J.D.; Dettinger, M.D. Meteorological characteristics and overland precipitation impacts of atmospheric rivers affecting the west coast of North America based on eight years of SSM/I satellite observations. J. Hydrometeor. 2008, 9, 22–47. [Google Scholar] [CrossRef]
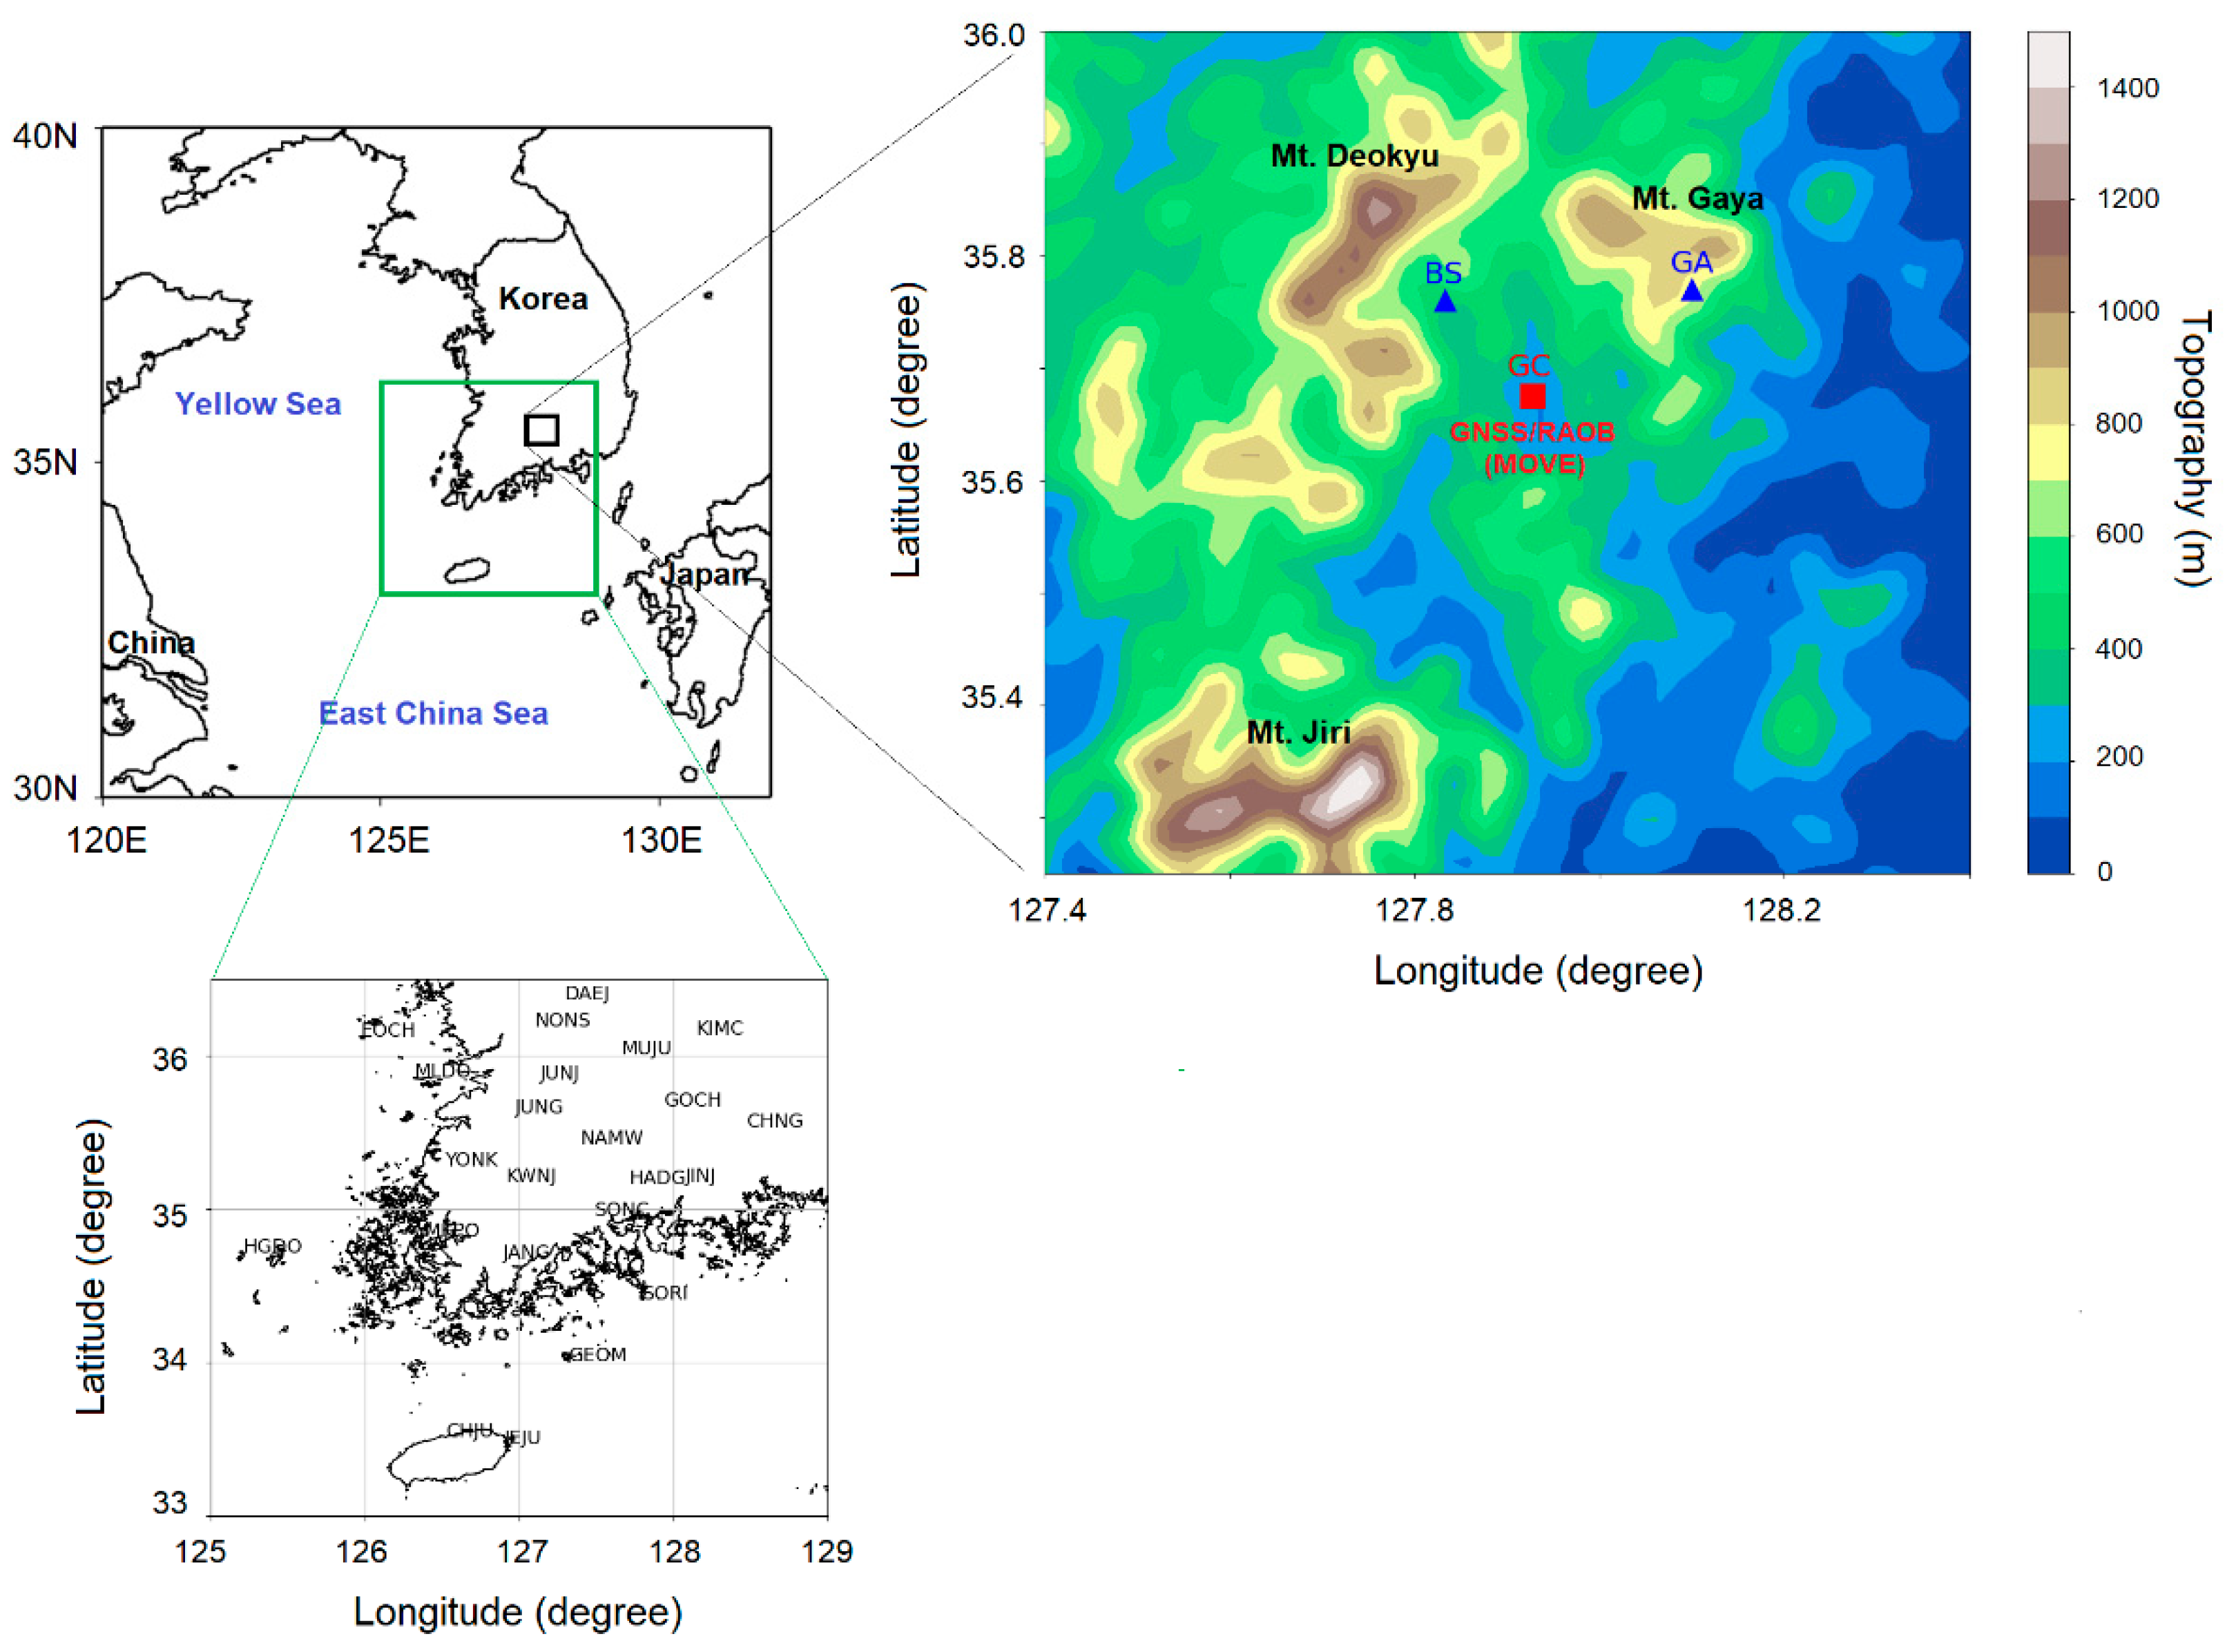
Figure 1. Map of the study area: Geochang (GC)-gun, South Gyeongsang Province. The right magnified map shows the topography of the study area, and the locations of the automatic weather system (AWS) sites: Geochang (GC) supersite, Buksang (BS), and Gayasan (GA). The green color box in the upper left map shows the analysis area (lower zoomed map) of a two-dimensional (2D) water vapor field.
Remotesensing 15 00340 g001
Figure 2. Representative image of the observational instruments of mobile observation vehicles (MOVEs) in the Geochang (GC) supersite. The RAOB and GNSS are the rawinsonde observation and global navigation satellite systems, respectively.
Remotesensing 15 00340 g002
Figure 3. (a) Time series of precipitable water vapors (PWVs) obtained from the global navigation satellite system (GNSS) and rawinsonde observation (RAOB), and (b) comparison between GNSS-PWVs over time intervals of 10 min and 1 h. The RMSEs shown as text in Figure 3 indicate root mean square error.
Remotesensing 15 00340 g003
Figure 4. The wind rose diagrams for the (a) whole and (b) precipitation periods from 0000 UTC 23 June to 0000 UTC 12 July 2016 (IOP) at the Geochang (GC) supersite.
Remotesensing 15 00340 g004
Figure 5. (a) The wind rose diagram using the past 10-year (2006—2015) summer (from June to August) dataset at the Geochang (GC) supersite, and (b) total precipitation (left y-axis; units: mm) and site elevation (right y-axis; units: m) of three automatic weather stations (AWSs) during the 2016 summer intensive observation period (IOP).
Remotesensing 15 00340 g005
Figure 6. (a) Scatter plot of the 1 h averaged rain intensity at the Buksang (BS) site versus precipitable water vapor (PWV) at the Geochang (GC) supersite, and (b) averaged rainfall according to each PWV bin. The vertical whiskers denote the +2 standard errors of the rainfall.
Remotesensing 15 00340 g006
Figure 7. Relationship of wind speed (units: m s−1) to precipitable water vapor (PWV; units: mm) with the stratification by rain intensity for the Geochang (GC) supersite. All data were extracted at 10 min intervals.
Remotesensing 15 00340 g007
Figure 8. Specific humidity (units: g kg−1) and equivalent potential temperature (K) profiles conditioned on (a,b) precipitable water vapor (PWV) (units: mm) and (c,d) rain intensity (units: mm h−1) in the linear and logarithmic scales, respectively. There were 77 soundings during the 2016 summer intensive observation period (IOP).
Remotesensing 15 00340 g008
Figure 9. As shown in Figure 8, except for the horizontal wind speed (units: m s−1) profiles conditioned on (a) precipitable water vapor (PWV) (units: mm) and (b) rain intensity (units: mm h−1) in the linear and logarithmic scales, respectively.
Remotesensing 15 00340 g009
Figure 10. (a) Lagged cross-correlation between precipitable water vapor (PWV) at the Geochang (GC) supersite and rain intensities at the Buksang (BS) site with a 10 min bin width, and (b) rain intensity (units: mm h–1) conditioned on gap-filled PWV at −1 h to 3 h lags during the entire analysis period.
Remotesensing 15 00340 g010
Figure 11. (a,b) Surface weather charts at (upper left) 2100 UTC 23 June and (upper right) 0000 UTC 6 July 2016, and (c,d) spatial distributions of total accumulated precipitation from (lower left) 0000 UTC 23 June to 2300 UTC 24 June and (lower right) 0400 UTC 5 July to 1400 UTC 7 July 2016. The black triangle in the lower maps stands for Geochang (GC) supersite.
Remotesensing 15 00340 g011
Figure 12. Time series of the precipitable water vapor (PWV) at the Geochang supersite and the rain intensity at the Buksang site for (a) Case 1 and (b) Case 2.
Remotesensing 15 00340 g012
Figure 13. Level-averaged vertical profiles of (a,d) specific humidity (units: g kg−1) and (b,e) equivalent potential temperature (units: K), and representative soundings of (c,f) vertical wind fields (wind barbs; units: m s−1) at the Geochang supersite (upper panels: Case 1 and lower panels: Case 2). The shaded envelopes represent the standard deviations; red, black, and blue represent before, during, and after rain, respectively (a,b,d,e). The analysis periods are 1200–1800 UTC 23 June, 0000–0600 UTC 24 June, and 1200–1800 UTC 24 June for Case 1 and 1800 UTC 5 July–0000 UTC 6 July, 0600–1200 UTC 6 July and 1800 UTC 6 July–0000 UTC 7 July for Case 2 (a,b,d,e). The representative times are 1200 UTC 23 June, 0000 UTC 24 June and 1200 UTC 24 June for Case 1 and 0000 UTC 6 July, 1200 UTC 6 July and 0000 UTC 7 July for Case 2 (c,f).
Remotesensing 15 00340 g013
Figure 14. Composite distributions of time-averaged PWV retrieved from the 24 global navigation satellite system (GNSS) ground stations during (a) Case 1 and (b) Case 2. The analysis periods are the same as those of the total accumulated precipitation in Figure 11c,d. The black triangle in the maps stands for Geochang (GC) supersite.
Remotesensing 15 00340 g014
Table 1. Overview of the observational instruments used.
Variables (Intervals)Instruments (Site)Manufacture (Model)
Vertical profile (6 h)Rawinsonde (GC; MOVE 1)GRAW, Germany (DFM-09)
Precipitable water vapor
(1 h, 10 min)
Global navigation
satellite system (GC; MOVE)
Trimble, US (NetR9)
Precipitation amounts
(1 min)
Weighting precipitation gauge (GC, BS, GA 2)Wellbian system,
South Korea (WPG-A1)
Wind speed and direction
(1 min)
Anemometer (GC)R. M. Young, US (05018)
1 MOVE denotes the mobile observation vehicle operated by the National Institute of Meteorological Sciences, Korea Meteorological Administration (KMA). 2 GC, BS, and GA indicate the Geochang supersite, Buksang, and Gayasan, respectively.
Table 2. Comparison of precipitable water vapor (PWV) retrievals.
GNSS1h vs. RAOB 1GNSS10min vs. RAOBGNSS10min vs. GNSS1h
Number of samples7777480
Slope 21.011.000.98
R20.980.970.99
RMSE 3 (mm)2.83.41.5
1 RAOB is rawinsonde observation. 2 Slope is interpreted as the change of y for a one unit in increase in x. 3 RMSE indicates root mean square error.
Disclaimer/Publisher’s Note: The statements, opinions and data contained in all publications are solely those of the individual author(s) and contributor(s) and not of MDPI and/or the editor(s). MDPI and/or the editor(s) disclaim responsibility for any injury to people or property resulting from any ideas, methods, instructions or products referred to in the content.