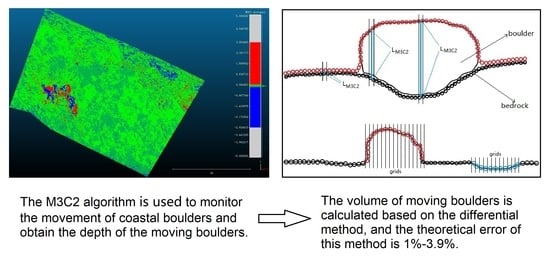
Monitoring of Coastal Boulder Movements by Storms and Calculating Volumetric Parameters Using the Volume Differential Method Based on Point Cloud Difference
Abstract
1. Introduction
2. Study Area
3. Materials and Methods
3.1. Materials and Equipment
3.2. Acquisition of UAS Imagery and GCP Data
3.3. Reconstruction of the Study Area Using Pix4DMapper
- For point cloud generation (dense reconstruction): The image scale in the point cloud densification was set to 1/2 and the multiscale was turned off to reduce noise. The point density was set to high, with each point requiring at least 2 matches, which can increase the detail and density of point cloud reconstruction.
- DSM and orthomosaicing: Triangulation was used instead of inverse distance weighting, as it can improve clarity for the edges of the boulders. Since the resolution setting is consistent with the GSD (2 cm), each boulder can be better identified.
3.4. Calculation of M3C2 Distance
- Importing the point cloud. Calculating the M3C2 distance requires two clouds, with one for reference and the other for comparison. In this project, the point cloud of the previous year was uniformly treated as the reference cloud; for example, the point cloud of 2017 was used as the reference cloud in the comparison between 2017 and 2018.
- Setting the core point. The distance distribution between two point clouds was calculated based on several cell areas, which are usually divided from the original point cloud. The centres of these cell areas are core points, which are usually the reference point cloud itself or a subsample set. Here, the point cloud of the middle year (2018) was taken in this project as the core point to calculate the M3C2 distances of 2017–2018 and 2018–2019, thus reducing the systematic error of the volume calculations.
- Defining normal vectors. Since the M3C2 algorithm calculates the distance between the reference cloud and the comparison cloud in terms of each core point, the normal vector of each core point is critical and defines the direction in which the distance from one cloud to another is calculated. Usually, a given value, , is required to confirm the normal direction of the core point. Then, the M3C2 algorithm is applied to create a sphere with the core point as the sphere centre and as the radius. The points contained within the sphere are fitted to a plane, and the normal vector of this plane is treated as the normal of this core point. However, any normal in a non-vertical direction was meaningless here (see Section 3.5 for an explanation), and the vertical direction was used directly.
- Calculating the distance between two clouds. After the core point (i) and the normal vector (N) were determined, another parameter was set for the M3C2 algorithm to make a circle with core point i as the centre and as the radius. Subsequently, a cylinder was created along the axis of the normal vector that passed through the core point i. The parts of the two point clouds located inside the cylinder were defined as the and point cloud subsets. All the points in and were projected onto the cylindrical axis, with core point i as the origin, thus determining their distance distributions. The mean of these two distributions defined the average cloud positions, and , along the normal direction, while the distance between the two point clouds () was defined by the distance between and . In addition, it was necessary to input the maximum length of the cylinder to speed up the calculation process. In the cases of no corresponding point cloud data within the set length of the cylinder in the comparison cloud, the distance was not calculated.
- Outputting M3C2 distance. The M3C2 distance value, as calculated based on each core point, was temporarily saved in a new point cloud composed of core points (the 2018 point cloud with RGB information removed herein). For the convenience of editing and reading, the results of this project were exported as a CSV file.
3.5. Calculation of the M3C2 Volume of Moving Boulders and Determination of the Length of the a-, b-, and c-Axes
- Identifying moving boulders. In the M3C2 results, areas where values were significantly above or below 0 indicated boulder movement, keeping in mind that the surrounding bedrock does not change. QGIS was used to visualize the M3C2 results, with two orthomosaics, corresponding to the year, combined to identify the moving boulders.
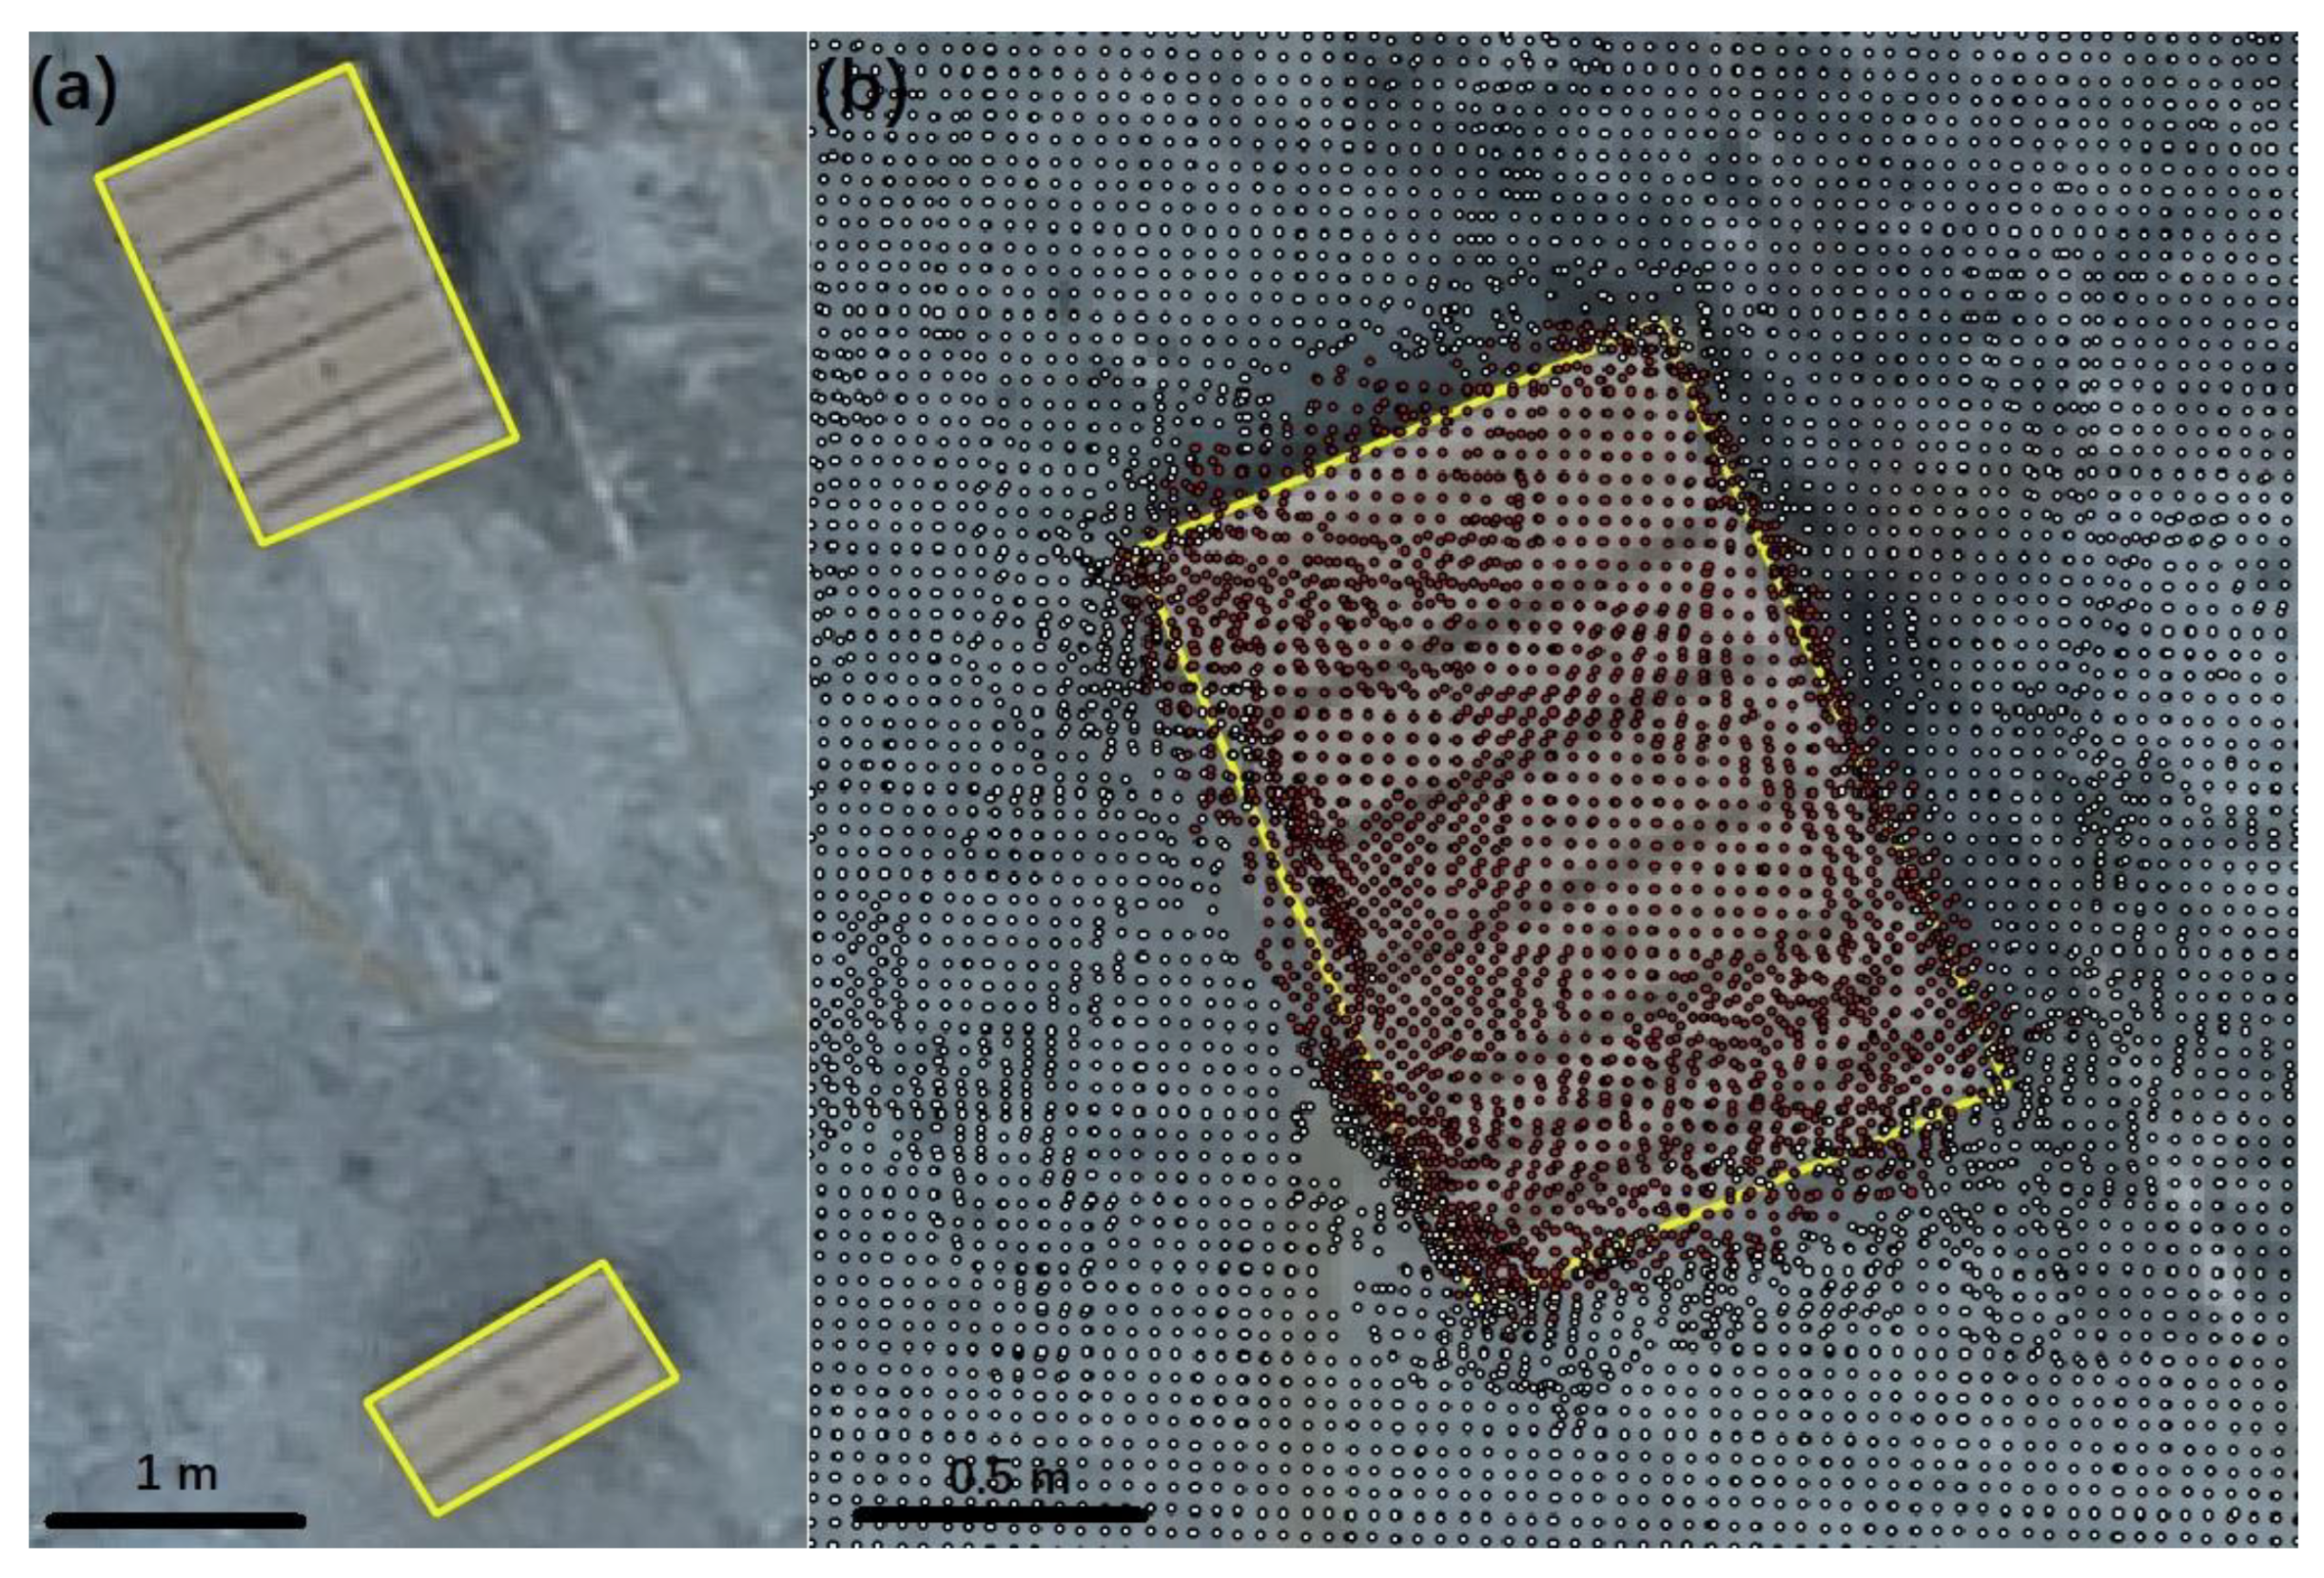
- Determining the edges of the boulder. Since accurate boulder edges are required for volume calculation, this study generated boulder edges manually to eliminate errors introduced by edge detection tools. The boulders whose volumes could not be calculated were excluded. Based on the visualization in step 1, the edges of the moving boulders were outlined using the orthomosaic of the study area and saved as a polygonal vector file.
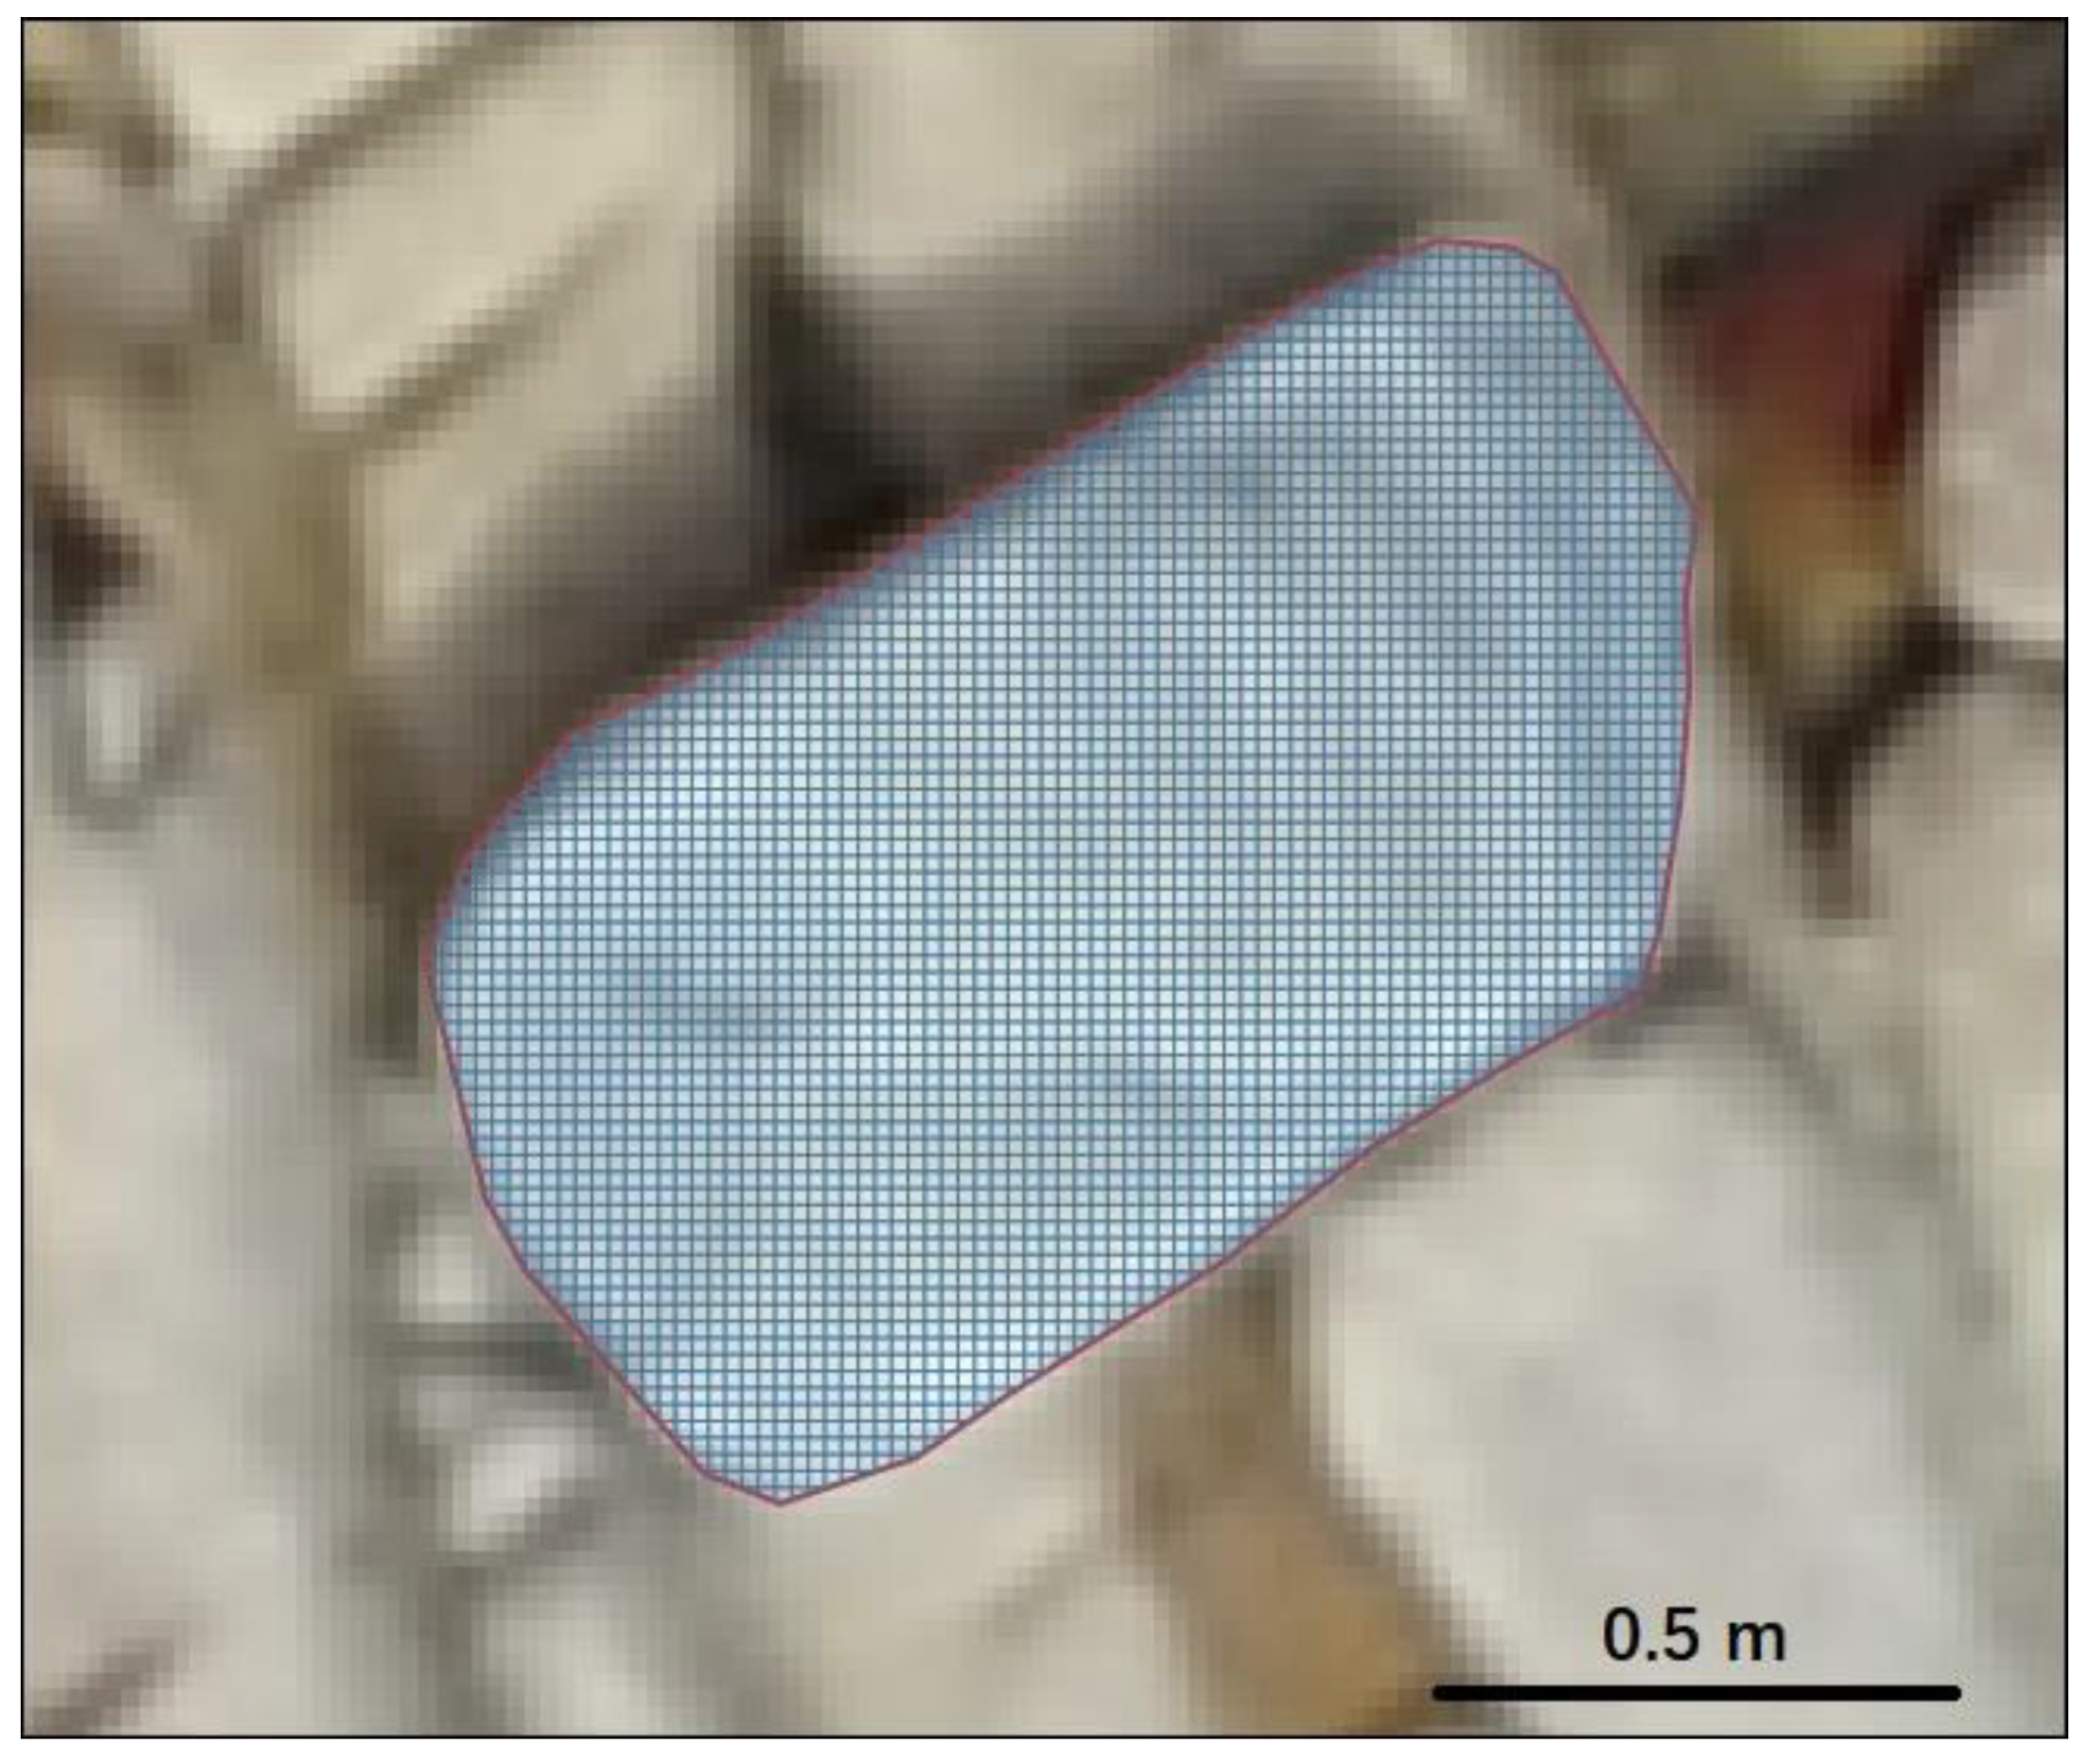
- Boulder outline gridding. This step was a process of differentials, using GIS tools to grid the boulder edges at set distances and calculate the area of each grid (which is the cross-section of the polygonal column, ). In this study, the grid was set to 2 cm, which was the GSD of the UAS surveys.
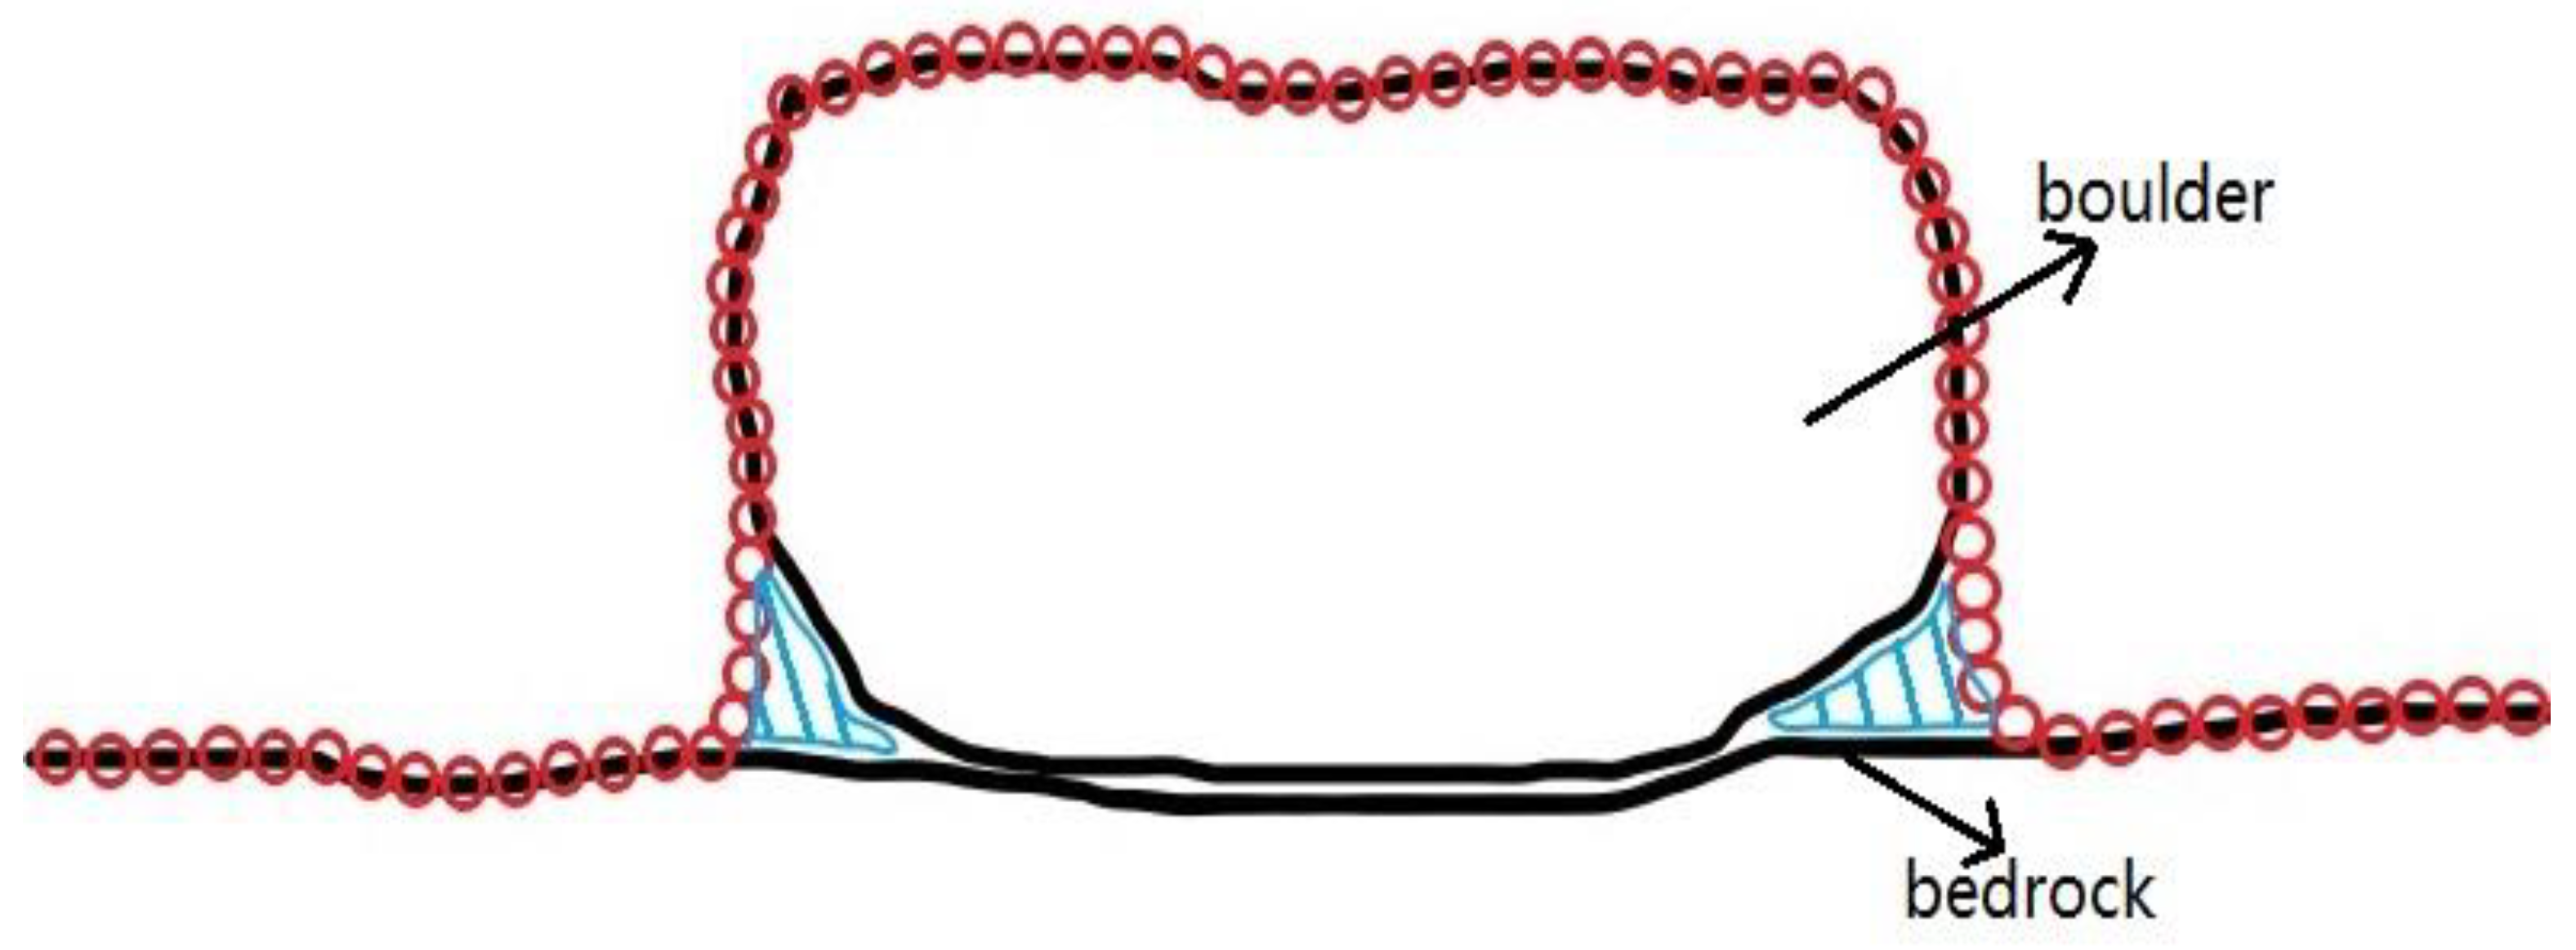
- Determining the height of the polygonal column. Since the two point clouds had been finely aligned before the M3C2 algorithm was operated, the unchanged areas in the study area tended to be zero in the M3C2 results. Therefore, when a single boulder was moving, the M3C2 value (absolute value) of each core point in the area where the boulder was located could represent the height of that boulder in the vicinity of the core point (Figure 4). In the grid generated in step 3, there may have been one or more core points (M3C2 values) in some grids. In this situation, the maximum value of M3C2 was taken as the height () of the polygonal column. In the case of no core point in the grid, the M3C2 value of the core point which was closest to the grid centre was treated as the height () of the polygonal column. The advantage of using M3C2 core points to find the depth of boulders is reflected here. If two point clouds are directly used to calculate the elevation difference, the closest points found in the two point clouds may not be at the same position, which does not represent the depth of the boulder at a specific position very well. It is worth noting that the Z values of these core points are meaningless, as the grids only select core points in the horizontal direction and read the M3C2 value. This explains why only the vertical normal is selected in the M3C2 algorithm, as only the vertical is meaningful.
- Calculating the boulder volume. The volume of each polygonal column was expressed as (Equation (1)), and the sum of the volumes of all polygonal columns represents the theoretical volume of the boulder. According to the principle of differentiation, the smaller the grid scale and the higher the density of the core point, the closer the calculated theoretical volume is to the real volume.
3.6. Accuracy Verification of M3C2 Volumes and Boulder Axis Lengths
4. Results
4.1. Results of Model Reconstruction
4.2. M3C2 Results
4.3. The Volume and Axial Lengths of the Boulder
4.4. Accuracy Verification Results
5. Discussion
5.1. Benefits of Differential Volume Calculation Based on M3C2 Distance
5.2. Analysis of the Error between the M3C2 Volume and Real Volume of the Boulders
5.3. The Relationship between Coastal Boulder Movement and Storm Intensity
6. Conclusions
Author Contributions
Funding
Data Availability Statement
Conflicts of Interest
References
- Li, J.; Xue, J.; Wang, W.; Zhang, J.; Xu, Y. Analysis and enlightenment of the overseas important typhoon disaster in 2013. Meteorol. Disaster Reduct. Res. 2014, 37, 50–54. [Google Scholar]
- Nagle-McNaughton, T.; Cox, R. Measuring Change Using Quantitative Differencing of Repeat Structure-From-Motion Photogrammetry: The Effect of Storms on Coastal Boulder Deposits. Remote Sens. 2020, 12, 42. [Google Scholar] [CrossRef]
- Sedrati, M.; Morales, J.A.; El M’rini, A.; Anthony, E.J.; Bulot, G.; Le Gall, R.; Tadibaght, A. Using UAV and Structure-From-Motion Photogrammetry for the Detection of Boulder Movement by Storms on a Rocky Shore Platform in Laghdira, Northwest Morocco. Remote Sens. 2022, 14, 4102. [Google Scholar] [CrossRef]
- Gienko, G.A.; Terry, J.P. Three-dimensional modeling of coastal boulders using multi-view image measurements. Earth Surf. Process. Landf. 2014, 39, 853–864. [Google Scholar] [CrossRef]
- Boesl, F.; Engel, M.; Eco, R.C.; Galang, J.B.; Gonzalo, L.A.; Llanes, F.; Quix, E.; Brückner, H. Digital mapping of coastal boulders—High-resolution data acquisition to infer past and recent transport dynamics. Sedimentology 2020, 67, 1393–1410. [Google Scholar] [CrossRef]
- Liu, Z.; Zhou, L.; Gao, S. Application of the terrestrial laser scanner to the coastal boulders on the southern coast of Hainan Island. Haiyang Xuebao 2019, 41, 127–141. [Google Scholar]
- Terry, J.P.; Dunne, K.; Jankaew, K. Prehistorical frequency of high-energy marine inundation events driven by typhoons in the Bay of Bangkok (Thailand), interpreted from coastal carbonate boulders. Earth Surf. Process. Landf. 2016, 41, 553–562. [Google Scholar] [CrossRef]
- Kennedy, A.B.; Mori, N.; Yasuda, T.; Shimozono, T.; Tomiczek, T.; Donahue, A.; Shimura, T.; Imai, Y. Extreme block and boulder transport along a cliffed coastline (Calicoan Island, Philippines) during Super Typhoon Haiyan. Mar. Geol. 2017, 383, 65–77. [Google Scholar] [CrossRef]
- Goto, K.; Okada, K.; Imamura, F. Characteristics and hydrodynamics of boulders transported by storm waves at Kudaka Island, Japan. Mar. Geol. 2009, 262, 14–24. [Google Scholar] [CrossRef]
- May, S.M.; Engel, M.; Brill, D.; Cuadra, C.; Lagmay, A.M.F.; Santiago, J.; Suarez, J.K.; Reyes, M.; Brückner, H. Block and boulder transport in eastern Samar (Philippines) during Supertyphoon Haiyan. Earth Surf. Dyn. 2015, 3, 543–558. [Google Scholar] [CrossRef]
- Erdmann, W.; Kelletat, D.; Scheffers, A. Boulder transport by storms—Extreme-waves in the coastal zone of the Irish west coast. Mar. Geol. 2018, 399, 1–13. [Google Scholar] [CrossRef]
- Terry, J.P.; Jankaew, K.; Dunne, K. Coastal vulnerability to typhoon inundation in the Bay of Bangkok, Thailand? Evidence from carbonate boulder deposits on Ko Larn Island. Estuar. Coast. Shelf Sci. 2015, 165, 261–269. [Google Scholar] [CrossRef]
- Frohlich, C.; Hornbach, M.J.; Taylor, F.W.; Shen, C.-C.; Moala, A.; Morton, A.E.; Kruger, J. Huge erratic boulders in Tonga deposited by a prehistoric tsunami. Geology 2009, 37, 131–134. [Google Scholar] [CrossRef]
- Terry, J.P.; Lau, A.Y.A.; Etienne, S. Outlook for Boulder Studies within Tropical Geomorphology and Coastal Hazard Research; Springer: Berlin/Heidelberg, Germany, 2013; pp. 97–102. [Google Scholar]
- Terry, J.P.; Lau, A.Y.A.; Etienne, S. Reef-Platform Coral Boulders; Springer: Berlin/Heidelberg, Germany, 2013; pp. 97–102. [Google Scholar]
- Morton, R.A.; Gelfenbaum, G.; Jaffe, B.E. Physical criteria for distinguishing sandy tsunami and storm deposits using modern examples. Sediment. Geol. 2007, 200, 184–207. [Google Scholar] [CrossRef]
- Hall, A.M.; Hansom, J.D.; Williams, D.M.; Jarvis, J. Distribution, geomorphology and lithofacies of cliff-top storm deposits: Examples from the high-energy coasts of Scotland and Ireland. Mar. Geol. 2006, 232, 131–155. [Google Scholar] [CrossRef]
- Spiske, M.; Böröcz, Z.; Bahlburg, H. The role of porosity in discriminating between tsunami and hurricane emplacement of boulders—A case study from the Lesser Antilles, southern Caribbean. Earth Planet. Sci. Lett. 2008, 268, 384–396. [Google Scholar] [CrossRef]
- Etienne, S.; Paris, R. Boulder accumulations related to storms on the south coast of the Reykjanes Peninsula (Iceland). Geomorphology 2010, 114, 55–70. [Google Scholar] [CrossRef]
- Nandasena, N.A.K.; Paris, R.; Tanaka, N. Reassessment of hydrodynamic equations: Minimum flow velocity to initiate boulder transport by high energy events (storms, tsunamis). Mar. Geol. 2011, 281, 70–84. [Google Scholar] [CrossRef]
- Lague, D.; Brodu, N.; Leroux, J. Accurate 3D comparison of complex topography with terrestrial laser scanner: Application to the Rangitikei canyon (N-Z). ISPRS J. Photogramm. Remote Sens. 2013, 82, 10–26. [Google Scholar] [CrossRef]
- James, M.R.; Robson, S.; Smith, M.W. 3-D uncertainty-based topographic change detection with structure-from-motion photogrammetry: Precision maps for ground control and directly georeferenced surveys. Earth Surf. Process. Landf. 2017, 42, 1769–1788. [Google Scholar] [CrossRef]
- Knight, J.; Burningham, H.; Barrett-Mold, C. The geomorphology and controls on development of a boulder-strewn rock platform, NW Ireland. J. Coast. Res. 2009, 56, 1646–1650. [Google Scholar]
- Knight, J.; Burningham, H. Boulder dynamics on an Atlantic-facing coastline, northwest Ireland. Mar. Geol. 2011, 283, 56–65. [Google Scholar] [CrossRef]
- Scheffers, A.; Kelletat, D.; Haslett, S.; Scheffers, S.; Browne, T. Coastal boulder deposits in Galway Bay and the Aran Islands, western Ireland. Z. Geomorphol. 2010, 54, 247–279. [Google Scholar] [CrossRef]
- Cox, R.; Jahn, K.L.; Watkins, O.G.; Cox, P. Extraordinary boulder transport by storm waves (west of Ireland, winter 2013–2014), and criteria for analysing coastal boulder deposits. Earth Sci. Rev. 2018, 177, 623–636. [Google Scholar] [CrossRef]
- Furukawa, Y.; Curless, B.; Seitz, S. Towards internet-scale multi-view stereo. In Proceedings of the 2010 IEEE Conference on Computer Vision and Pattern Recognition, San Francisco, CA, USA, 13–18 June 2010; pp. 1434–1441. [Google Scholar]
- Grenzdörffer, G.J.; Engel, A.; Teichert, B. The photogrammetric potential of low-cost UAVs in forestry and agriculture. Int. Arch. Photogramm. Remote Sens. Spat. Inf. Sci. 2008, 31, 1207–1214. [Google Scholar]
- Mosbrucker, A.; Major, J.; Spicer, K.; Pitlick, J. Camera system considerations for geomorphic applications of SfM photogrammetry. Earth Surf. Process. Landf. 2017, 42, 969–986. [Google Scholar] [CrossRef]
- Henry, J.; Malet, J.; Maquaire, O.; Grussenmeyer, P. The use of small-format and low-altitude aerial photos for the realization of high resolution DEMs in mountainous areas: Application to the Super-Sauze earthflow (Alpes-de-Haute-Provence, France). Earth Surf. Process. Landf. 2002, 27, 1339–1350. [Google Scholar] [CrossRef]
- Torres-Sánchez, J.; López-Granados, F.; Borra-Serrano, I.; Peña, J. Assessing UAV-collected image overlap influence on computation time and digital surface model accuracy in olive orchards. Precis. Agric. 2017, 19, 115–133. [Google Scholar] [CrossRef]
- Mesas-Carrascosa, F.; Notario García, M.; Meroño de Larriva, J.; García-Ferrer, A. An Analysis of the Influence of Flight Parameters in the Generation of Unmanned Aerial Vehicle (UAV) Orthomosaicks to Survey Archaeological Areas. Sensors 2016, 16, 1838. [Google Scholar] [CrossRef]
- Engel, M.; May, S.M. Bonaire’s boulder fields revisited: Evidence for Holocene tsunami impact on the Leeward Antilles. Quat. Sci. Rev. 2012, 54, 126–141. [Google Scholar] [CrossRef]
- Hoffmeister, D.; Ntageretzis, K.; Aasen, H.; Curdt, C.; Hadler, H.; Willershäuser, T.; Bareth, G.; Brückner, H.; Vött, A. 3D model-based estimations of volume and mass of high-energy dislocated boulders in coastal areas of Greece by terrestrial laser scanning. Z. Geomorphol. 2014, 58, 115–135. [Google Scholar] [CrossRef]
- Nott, J. Waves, coastal boulder deposits and the importance of the pre-transport setting. Earth Planet. Sci. Lett. 2003, 210, 269–276. [Google Scholar] [CrossRef]
- UK Storm Season 2017/18. Available online: https://www.metoffice.gov.uk/weather/warnings-and-advice/uk-storm-centre/uk-storm-season-2017-18 (accessed on 24 April 2019).
- UK Storm Season 2018/19. Available online: https://www.metoffice.gov.uk/weather/warnings-and-advice/uk-storm-centre/uk-storm-season-2018-19 (accessed on 17 August 2020).
- Irish Weather Buoy Network Observations. Available online: http://www.marine.ie/site-area/data-services/real-time-observations/irish-weather-buoy-network-observations (accessed on 21 December 2022).



| ID | 2017 | 2018 | 2019 | |||
|---|---|---|---|---|---|---|
| Vertical Error (m) | Horizontal Error (m) | Vertical Error (m) | Horizontal Error (m) | Vertical Error (m) | Horizontal Error (m) | |
| 19 | 0.004 | 0.026 | 0.010 | 0.026 | 0.002 | 0.015 |
| 46 | 0.039 | 0.034 | 0.006 | 0.021 | 0.010 | 0.048 |
| 52 | 0.361 | 0.061 | 0.111 | 0.077 | 0.325 | 0.038 |
| 64 | 0.193 | 0.041 | 0.286 | 0.061 | 0.209 | 0.083 |
| 73 | 0.009 | 0.045 | 0.041 | 0.068 | 0.023 | 0.051 |
| Years | Sequence | a-Axis (m) | b-Axis (m) | c-Axis (m) | |||
|---|---|---|---|---|---|---|---|
| 2017–2018 | 1 | 2.488 | 1.476 | 0.835 | 1.605 | 1.854 | −13.4% |
| 2 | 1.952 | 1.454 | 1.008 | 1.498 | 1.512 | −1.0% | |
| 3 | 1.314 | 1.178 | 0.885 | 0.717 | 0.935 | −23.3% | |
| 4 | 1.624 | 0.917 | 0.854 | 0.666 | 0.837 | −20.5% | |
| 5 | 1.839 | 1.245 | 0.609 | 0.730 | 0.685 | 6.7% | |
| 6 | 1.548 | 1.077 | 0.852 | 0.744 | 0.640 | 16.2% | |
| 7 | 1.670 | 0.925 | 0.560 | 0.453 | 0.594 | −23.8% | |
| 8 | 1.204 | 1.118 | 0.872 | 0.614 | 0.549 | 11.9% | |
| 9 | 1.598 | 0.830 | 0.713 | 0.495 | 0.498 | −0.4% | |
| 10 | 1.554 | 0.786 | 0.663 | 0.424 | 0.474 | −10.5% | |
| 11 | 1.405 | 0.814 | 0.776 | 0.465 | 0.471 | −1.3% | |
| 12 | 1.389 | 0.962 | 0.721 | 0.504 | 0.468 | 7.7% | |
| 13 | 1.348 | 1.013 | 0.483 | 0345 | 0.429 | −19.5% | |
| 14 | 1.644 | 1.207 | 0.476 | 0.495 | 0.427 | 16.0% | |
| 15 | 1.642 | 0.725 | 0.619 | 0.386 | 0.424 | −9.1% | |
| 16 | 1.191 | 0.852 | 0.758 | 0.403 | 0.418 | −3.7% | |
| 17 | 1.119 | 1.100 | 0.796 | 0.513 | 0.405 | 26.8% | |
| 18 | 1.151 | 0.827 | 0.637 | 0.318 | 0.404 | 21.4% | |
| 19 | 1.614 | 1.071 | 0.314 | 0.284 | 0.385 | 26.3% | |
| 20 | 1.559 | 1.094 | 0.365 | 0.326 | 0.378 | 13.9% | |
| 2018–2019 | 1 | 1.311 | 1.119 | 0.982 | 0.754 | 0.954 | 21.0% |
| 2 | 1.305 | 1.088 | 0.663 | 0.493 | 0.582 | 15.3% | |
| 3 | 1.269 | 0.844 | 0.858 | 0.481 | 0.409 | 17.6% | |
| 4 | 1.869 | 0.867 | 0.490 | 0.416 | 0.390 | 6.6% | |
| 5 | 1.410 | 0.849 | 0.624 | 0.391 | 0.363 | 7.7% | |
| 6 | 1.219 | 0.815 | 0.643 | 0.335 | 0.356 | −6.0% | |
| 7 | 1.316 | 0.892 | 0.561 | 0.345 | 0.340 | 1.5% | |
| 8 | 1.407 | 0.888 | 0.698 | 0.457 | 0.323 | 41.2% | |
| 9 | 1.281 | 0.548 | 0.665 | 0.244 | 0.309 | −21.0% | |
| 10 | 0.895 | 0.892 | 0.904 | 0.378 | 0.303 | 24.8% | |
| 11 | 1.349 | 0.850 | 0.570 | 0.342 | 0.292 | 17.2% | |
| 12 | 1.080 | 0.780 | 0.602 | 0.266 | 0.291 | −8.6% | |
| 13 | 1.286 | 0.773 | 0.441 | 0.230 | 0.286 | −19.7% | |
| 14 | 1.429 | 0.791 | 0.503 | 0.298 | 0.278 | 7.2% | |
| 15 | 1.060 | 0.744 | 0.565 | 0.233 | 0.255 | −8.4 | |
| 16 | 1.329 | 0.697 | 0.513 | 0.249 | 0.249 | 0.0% | |
| 17 | 0.958 | 0.850 | 0.590 | 0.252 | 0.248 | 1.4% | |
| 18 | 1.302 | 0.843 | 0.483 | 0.278 | 0.238 | 16.7% | |
| 19 | 0.972 | 0.679 | 0.552 | 0.191 | 0.226 | −15.7% | |
| 20 | 1.215 | 0.645 | 0.521 | 0.214 | 0.219 | −2.2% |
| ID | a-Axis | b-Axis | ||||
| Measured Value (m) | True Value (m) | Measured Value (m) | True Value (m) | |||
| 1 | 1.504 | 1.488 | 1.1% | 1.057 | 1.054 | 0.3% |
| 2 | 1.053 | 1.054 | −0.1% | 0.506 | 0.496 | 2.0% |
| 3 | 1.056 | 1.054 | 0.2% | 0.754 | 0.742 | 1.6% |
| ID | c-Axis | Volume | ||||
| Computed Value (m) | True Value (m) | Computed Value (m3) | True Value (m3) | |||
| 1 | 0.775 | 0.742 | 4.4% | 1.151 | 1.164 | −1.1% |
| 2 | 0.773 | 0.742 | 4.2% | 0.373 | 0.388 | −3.9% |
| 3 | 1.502 | 1.486 | 1.1% | 1.176 | 1.164 | 1.0% |
| Years | Name | Appearance Time | Maximum Wind Speed (mph) | Maximum Wave Height (m) |
|---|---|---|---|---|
| 2017–2018 | Ophelia | 16–20 October 2017 | 119 | 13.828 |
| Brian | 19–23 October 2017 | 85 | 15.938 | |
| Caroline | 6–11 December 2017 | 93 | 11.25 | |
| Dylan | 30 December 2017–3 January 2018 | 77 | 20.156 | |
| Eleanor | 2–5 January 2018 | 140 | 20.156 | |
| Fionn | 14–21 January 2018 | 147 | 20.625 | |
| David | 17–21 January 2018 | 126 | 20.625 | |
| Georgina | 23–27 January 2018 | 140 | 13.125 | |
| Emma | 26 February–7 March 2018 | 142 | No Data | |
| 2018–2019 | Hector | 13–17 June 2018 | 70 | 10.078 |
| Helene | 16–21 September 2018 | 78 | 9.375 | |
| Ali | 17–22 September 2018 | 102 | 9.375 | |
| Bronagh | 20–25 September 2018 | 96 | 8.438 | |
| Callum | 10–16 October 2018 | 76 | 12.188 | |
| Diana | 27–30 November 2018 | 110 | 15.703 | |
| Enk | 7–14 February 2019 | 86 | 10.547 | |
| Gareth | 11–14 March 2019 | 81 | 10.078 | |
| Hannah | 25–28 April 2019 | 82 | 10.078 |
Disclaimer/Publisher’s Note: The statements, opinions and data contained in all publications are solely those of the individual author(s) and contributor(s) and not of MDPI and/or the editor(s). MDPI and/or the editor(s) disclaim responsibility for any injury to people or property resulting from any ideas, methods, instructions or products referred to in the content. |
© 2023 by the authors. Licensee MDPI, Basel, Switzerland. This article is an open access article distributed under the terms and conditions of the Creative Commons Attribution (CC BY) license (https://creativecommons.org/licenses/by/4.0/).
Share and Cite
Yao, Y.; Burningham, H.; Knight, J.; Griffiths, D. Monitoring of Coastal Boulder Movements by Storms and Calculating Volumetric Parameters Using the Volume Differential Method Based on Point Cloud Difference. Remote Sens. 2023, 15, 1526. https://doi.org/10.3390/rs15061526
Yao Y, Burningham H, Knight J, Griffiths D. Monitoring of Coastal Boulder Movements by Storms and Calculating Volumetric Parameters Using the Volume Differential Method Based on Point Cloud Difference. Remote Sensing. 2023; 15(6):1526. https://doi.org/10.3390/rs15061526
Chicago/Turabian StyleYao, Yao, Helene Burningham, Jasper Knight, and David Griffiths. 2023. "Monitoring of Coastal Boulder Movements by Storms and Calculating Volumetric Parameters Using the Volume Differential Method Based on Point Cloud Difference" Remote Sensing 15, no. 6: 1526. https://doi.org/10.3390/rs15061526
APA StyleYao, Y., Burningham, H., Knight, J., & Griffiths, D. (2023). Monitoring of Coastal Boulder Movements by Storms and Calculating Volumetric Parameters Using the Volume Differential Method Based on Point Cloud Difference. Remote Sensing, 15(6), 1526. https://doi.org/10.3390/rs15061526


