Article

Urban Impervious Surface Extraction Based on Deep Convolutional Networks Using Intensity, Polarimetric Scattering and Interferometric Coherence Information from Sentinel-1 SAR Images

1
School of Remote Sensing and Information Engineering, Wuhan University, Wuhan 430079, China
2
School of Geophysics and Geomatics, China University of Geosciences, Wuhan 430074, China
3
State Key Laboratory of Information Engineering in Surveying, Mapping and Remote Sensing, Wuhan University, Wuhan 430079, China
4
Hubei Luojia Laboratory, Wuhan 430079, China
*
Author to whom correspondence should be addressed.
Remote Sens. 2023, 15(5), 1431; https://doi.org/10.3390/rs15051431
Submission received: 16 January 2023 / Revised: 22 February 2023 / Accepted: 1 March 2023 / Published: 3 March 2023

Abstract

:
Urban impervious surface area is a key indicator for measuring the degree of urban development and the quality of an urban ecological environment. However, optical satellites struggle to effectively play a monitoring role in the tropical and subtropical regions, where there are many clouds and rain all year round. As an active microwave sensor, synthetic aperture radar (SAR) has a long wavelength and can penetrate clouds and fog to varying degrees, making it very suitable for monitoring the impervious surface in such areas. With the development of SAR remote sensing technology, a more advanced and more complex SAR imaging model, namely, polarimetric SAR, has been developed, which can provide more scattering information of ground objects and is conducive to improving the extraction accuracy of impervious surface. However, the current research on impervious surface extraction using SAR data mainly focuses on the use of SAR image intensity or amplitude information, and rarely on the use of phase and polarization information. To bridge this gap, based on Sentinel-1 dual-polarized data, we selected UNet, HRNet, and Deeplabv3+ as impervious surface extraction models; and we input the intensity, coherence, and polarization features of SAR images into the respective impervious surface extraction models to discuss their specific performances in urban impervious surface extraction. The experimental results show that among the intensity, coherence, and polarization features, intensity is the most useful feature in the extraction of urban impervious surface based on SAR images. We also analyzed the limitations of extracting an urban impervious surface based on SAR images, and give a simple and effective solution. This study can provide an effective solution for the spatial-temporal seamless monitoring of an impervious surface in cloudy and rainy areas.

1. Introduction

In the past few decades, our planet has been impacted by the rapid urbanization wave, resulting in a large number of surfaces being covered by impervious surfaces (ISs) [1,2]. Impervious surface is mainly composed of artificial materials such as asphalt, cement, metal, and glass [3]. Permeable natural surfaces have been replaced by impervious surfaces, which has changed the material circulation process of the global ecosystem, leading to increased ecological risks and threatening human health. In consideration of human well-being, the United Nations officially launched the 2030 Agenda for Sustainable Development in 2016, putting forward 17 sustainable development goals and calling on the world to take joint action to eradicate poverty, protect the planet, and improve the lives and futures of all people [4]. Building inclusive, safe, resilient and sustainable cities and human settlements is one of the 17 sustainable development goals. Reasonable planning of urban layout is an important way to build the above-mentioned sustainable cities, and understanding the spatio-temporal distribution of urban impervious surfaces is the premise for reasonable planning of cities [5]. Therefore, it is of great significance to monitor urban impervious surfaces.
With the development of Earth observation technology, remote sensing technology plays an irreplaceable role in the extraction of urban impervious surfaces. For example, Misra et al. used Sentinel-2 as the data source and evaluated the performances of three different machine learning algorithms in the extraction of urban impervious surfaces to better understand the feature extraction method and the appropriate classifier for the classification of urban impervious areas [6]. Additionally, Huang et al. used more than three million Landsat images since 1972 to extract the world’s impervious surface from 1972 to 2019, with the miss rate, false alarm rate, and F-score of 5.16%, 0.82%, and 0.954, respectively [7]. In rapidly urbanized areas, it is very important to monitor the changes in impervious surface regularly. In order to realize high-frequency dynamic monitoring of impervious surface, Liu et al. proposed a method to dynamically capture continuous impervious surface using Landsat data of a spatial-temporal rule and dense time series. It had an overall accuracy of 85.5% [8]. However, the most rapidly urbanizing region in the world is located in Southeast Asia, which is a typical tropical or subtropical region with cloudy and rainy weather all year round [9]. According to data statistics, for the cloudy and rainy tropical and subtropical regions, the single-point effective date of optical remote sensing data is generally less than 40%, and the regional effective date is less than 20%, which makes it difficult for optical satellites to effectively monitor impervious surface. Synthetic aperture radar (SAR) detects the geometric and physical properties of ground objects by actively transmitting signals and then receiving electromagnetic signals reflected by ground objects. Due to its long wavelength, SAR is capable of all-day and all-weather Earth observation. Therefore, SAR is very suitable for monitoring the impervious surface in such areas. However, urban impervious surfaces include roads, squares, buildings, etc., with various spatial locations and different features on SAR images. Therefore, extracting urban impervious surfaces from SAR images is a challenging task.
Many scholars have conducted in-depth studies on the extraction of urban impervious surfaces using SAR images. For example, Guo et al. used a full-polarization SAR (PolSAR) RADARSAT-2 image as the data source, extracted polarization features through polarization decomposition, and used them as the input for C5.0 decision tree algorithm to extract the impervious surface of Beijing, China [10]. According to the characteristics of impervious surface on polarimetric SAR images, Zhang et al. proposed a new framework for impervious-surface classification based on H/A/Alpha decomposition theory [11]. Ban et al. constructed a robust urban-area extractor based on ENVISAT advanced synthetic aperture radar (ASAR) intensity data to extract global built-up areas [12]. By comparing different regions, Attarchi et al. verified the effectiveness of texture features of full PolSAR images based on a gray co-occurrence matrix in urban impervious surface extraction [13]. In addition, Jiang et al. used the coherence feature of SAR for land-cover classification and achieved considerable accuracy, which proved the potential of coherence information in land-cover classification [14]. Subsequently, Sica et al., used interferometric SAR of short time series Sentinel-1 images for land-cover classification, which again confirmed the feasibility of land-cover classification using SAR coherence features [15]. Although researchers have comprehensively analyzed the effectiveness of intensity, coherence, and polarization features of SAR images in the extraction of urban impervious surfaces, there are still three limitations in the following aspects: (1) Most of their studies only proved the effectiveness of a single feature of SAR images in the extraction of urban impervious surfaces but did not evaluate the differences between multiple features of SAR images and their integration effect. (2) The current studies on impervious surface extraction using SAR data mainly focus on the use of SAR image intensity or amplitude information, and rarely on the use of phase and polarization information. (3) It is difficult to fully mine the information contained in SAR images only by manually extracting a small number of shallow features. (4) Traditional machine learning methods struggle to obtain satisfactory extraction results.
Deep learning technology has strong feature-learning ability, which can mine useful information from massive data. Therefore, deep learning has been adopted by remote sensing scholars and has achieved satisfactory results. For example, Zhang et al. used full PolSAR and optical images as data sources, and used deep convolution networks based on small patches to extract urban impervious surfaces [16]. The extraction accuracy was significantly better than those of traditional machine learning algorithms, such as random forest (RF) and support vector machine (SVM). Wang et al. proposed an urban impervious surface extraction method based on modified deep belief network, which also achieved better accuracy than the traditional machine learning methods RF and SVM [17]. Wu et al. employed UNet as the backbone network and Gaofen-3 as the data source to extract the built-up areas in the whole of China, providing overall accuracy of 76.05% to 93.45% [18]. Hafner et al. proposed a semi-supervised model of domain adaptation based on Sentinel-1 and Sentinel-2 data to extract global urban regions [19]. Due to the limitation of impervious surface datasets, the research on impervious surface extraction based on deep learning is relatively scant. With free access to Sentinel-1 and other SAR data, more and more datasets will be released in the future, and then impervious surface extraction methods based on deep learning will be developed rapidly.
Although the above studies have proved that methods based on deep learning can obtain better accuracy than traditional methods, most of them focused on the intensity or amplitude information of SAR images, ignoring the rich and unique phase and scattering information related to ground objects contained in SAR images. Cities are highly heterogeneous scenes. The spatial distribution of an impervious surface is diversified, which makes its features on SAR images diversified. For example, tall buildings are highlighted on SAR images due to double-scattering effects, but for low and randomly distributed residential areas, their features on SAR images are not always highlighted due to volume scattering effects [20]. Other examples are wide airports and roads, which reflect radar waves in a specular way. The reflected waves received by the radar antenna are very weak, appearing dark colors in an SAR image, which are difficult to distinguish from bodies of water. Therefore, it is difficult to accurately extract urban impervious surfaces only by using the intensity or amplitude features of SAR images. In addition, under the deep learning framework, the independent effectiveness of different types of SAR image features in impervious surface extraction and the role of multi-feature integration have not been fully evaluated. To bridge this gap, based on Sentinel-1 dual-polarization data, we selected UNet, HRNet, and Deeplabv3+ deep learning models as impervious surface extraction models to deeply explore the specific roles of SAR image intensity, coherence, and polarization scattering features in the extraction of urban impervious surfaces. This study provides a new data scheme for the extraction of impervious surfaces in the tropical and subtropical areas with cloudy and rainy weather.
The rest of this study is organized as follows. Section 2 is the data description and preprocessing steps. Section 3 describes methods, experimental details, and evaluation metrics. In Section 4, the experimental results are presented quantitatively and qualitatively. Section 5 discusses the temporal and spatial transfer capability of the impervious surface extraction models and the limitations of the impervious surface extraction based on SAR images. Finally, the conclusions of this study are drawn in Section 6.

2. Dataset Description

Sentinel-1 satellite is an Earth observation satellite in the Copernicus Program (GMES) of the European Space Agency (ESA) and is a continuation of the earth observation missions of ERS-1/2 and ENVISAT ASAR. It is composed of two satellites equipped with a C-band SAR sensor and has four operation modes, namely, Stripmap (SM), Interferometric Wide (IW) Swath, Extra-Wide (EW) Swath, and Wave (WV) [21]. As an innovative SAR system, Sentinel-1 not only provides dual polarization capabilities, but also has an extremely short revisit time and fast product delivery. The revisit time of a single satellite is 12 days, whereas that of a dual satellite is as short as 6 days. The Sentinel-1 data can be freely downloaded from the ESA data distribution website (https://scihub.esa.int (accessed on 25 June 2019)). Therefore, Sentinel-1 can provide strong data support for global environmental monitoring. In this study, we took the main urban area of Wuhan (covering an area of about 3000 km 2 ) as the study area, and the Sentinel-1 single-look complex (SLC) images from 13 and 25 June 2019 as the data. Under the framework of deep learning, the roles of SAR image intensity, coherence, polarization features, and multi-feature integration in the extraction of urban impervious surface were studied. The detailed information of the data used is shown in Table 1.

2.1. Intensity

Since this study needed to use the coherence and polarization information of SAR images, the Sentinel-1 data product used in this study was SLC images, rather than directly using Sentinel-1 GRD data. In order to better maintain the information in SAR images, we only carried out necessary preprocessing steps. From SLC to intensity data, a series of preprocessing steps, such as orbit correction, thermal noise removal, radiometric calibration, S-1 TOPS deburst, multi-looking, and terrain correction, are required. All preprocessing steps in this study were carried out in the software SNAP. Due to the mechanism of coherent imaging, SAR images are seriously affected by speckle, which makes it difficult to interpret and extract information from SAR images. Therefore, this study uses refined Lee filter with a window size of 7 × 7 px for despeckling.

2.2. Interferometric Coherence

Interferometric SAR (InSAR) technology refers to acquiring two SAR SLC images repeatedly in the same area and then processing them coherently. This technology has been widely used in the monitoring of surface deformation and the acquisition of digital elevation model data [22,23]. The coherence coefficient is an important index to evaluate the quality of the interference fringe pattern. The larger the coherence coefficient is, the better the quality of the interference fringe pattern. In addition, the coherence coefficient can also be used to estimate the phase stability of targets in two SAR images. The value of the coherence is related to the platform parameters and the scatterers of the ground objects. In practical applications, the coherence map can be calculated from two SLC images after registration according to the following formula:
γ = E V 1 V 2 * E V 1 2 E V 2 2
where γ is the coherence coefficient. E is a mathematical expectation, and V 1 and V 2 represent the registered SLC images. The symbol * indicates conjugate multiplication. The value of γ ranges from 0 to 1. If γ = 0 , it means that the two SAR images are completely uncorrelated. If γ = 1 , it means that the two SAR images are completely correlated; that is, during the radar imaging process, all parameters and ground objects have not changed. These are two extreme cases.
To reduce the influence of noise and assume that the scatterer is ergodic, the calculation of the coherence coefficient can replace the overall mean value with the local mean value within a window of a certain size. The specific calculation formula is as follows:
γ = n = 1 N m = 1 M V 1 ( n , m ) V 2 * ( n , m ) n = 1 N m = 1 M V 1 ( n , m ) 2 n = 1 N m = 1 M V 2 ( n , m ) 2
where N and M represent the size of the sliding window. Generally, they are equal. Studies have shown that the window size of 5 × 5 px is suitable for the calculation of the coherence coefficient in urban areas [24].
SAR SLC image pairs use the above formula to calculate the coherence value in a window with the current pixel as the center and N × M as the size, and get the final coherence image through sliding over the window pixel by pixel. The value of each pixel on the coherence image represents the coherence value of this pair of SLC images at that pixel. Decoherence of different ground objects is the basis of remote sensing image classification using interferometric coherence [14,25]. Since the speckle in the coherence image will affect the accuracy of urban impervious surface extraction, this study used the mean filter to process the coherence image, and the size of the filtering window was 3 × 3 px.

2.3. Polarimetric Information

2.3.1. Polarimetric Covariance Matrix

In polarimetric SAR images, each pixel contains the amplitude and phase information of ground objects, which can be represented by the backscattering matrix S [26]:
S = S H H S H V S V H S V V
where S H V represents the scattering polarization information vertically transmitted and horizontally received by the radar antenna, which is related to the reflectivity of ground objects. Other elements in the the backscattering matrix S are defined similarly. In the case of monostatic radar, according to the reciprocity theorem, the backscattering matrix S becomes a symmetric matrix—that is, S H V = S V H .
For Setinel-1 dual-polarization data, the backscattering matrix S is:
S = 0 0 S V H S V V
Then, the eigenvector K can be obtained by vectorizing the scattering matrix:
K = S V H S V V T
where T represents conjugate transpose.
From the eigenvector K, the polarization covariance matrix C of Sentinel-1 image can be obtained as follows:
C = K K * T = 2 S V H 2 2 S V H S V V * 2 S V V S V H * S V V 2
where S V H = S V H e j ϕ V H , S V H and ϕ V H represent SAR amplitude and phase information, respectively; * represents conjugate multiplication; and represents statistical mean.

2.3.2. H/A/Alpha Dual Polarization Decomposition

Polarization decomposition is the most commonly used interpretation method in polarimetric SAR, which decomposes the polarization measurement data into multiple basic components to reveal the physical mechanisms of different scatterers [27]. Common decomposition methods based on the polarization covariance matrix include Cloude decomposition [28], Touzi decomposition [29], and H/A/Alpha decomposition [30]. To explore the roles of polarization features in the extraction of urban impervious surface, we used the H/A/Alpha decomposition method to extract polarization features, including polarimetric entropy (H), mean scattering angle (Alpha), and polarimetric anisotropy (A).
H/A/Alpha decomposition was initially proposed for full PolSAR data, and then extended to dual PolSAR data [31]. By eigenvalue decomposition of the covariance matrix, H/A/Alpha components can be obtained. The specific calculation formula is as follows:
H = i = 1 2 p i log 2 p i , H [ 0 , 1 ]
A l p h a = i = 1 2 p i α i , A l p h a [ 0 , 90 ]
A = ( λ 1 λ 2 ) ( λ 1 + λ 2 ) , A [ 0 , 1 ]
with
p i = λ i i = 1 2 λ i
where λ i and α i are the eigenvalues of the covariance matrix and their corresponding eigenvectors, respectively, and p i is the probability of the relative contribution of the eigenvalue λ i to the total backscatter power.
Polarimetric entropy H is used to describe the proportions of different scattering mechanisms in the total scattering process. It is a measure of the randomness of scatterers, and its values range from 0 to 1. The closer H is to 1, the higher the randomness of ground object scattering is, and vice versa. Low polarimetric entropy H indicates that the pixel is dominated by a single scattering type, and high polarimetric entropy H involves multiple scattering processes. The scattering angle alpha is an important factor to identify the main scattering mechanism of ground objects. The range of A l p h a is [ 0 , 90 ] , which describes the change in scattering mechanism from odd scattering ( 0 ) to volume scattering ( 45 ) to even scattering ( 90 ). The polarimetric anisotropy A is mainly used to describe the scattering anisotropy of scattering randomness, reflecting the influences of two smaller scattering mechanisms on the results, which is a supplement to H, and its value range is [0, 1]. When H is large, the scattering of ground objects involves multiple scattering processes. At this time, the scattering mechanism with the maximum scattering power cannot be considered only, and the data need to be further analyzed through polarimetric anisotropy A. When A is large, it indicates that there are two scattering mechanisms that are dominant. When A is large and H is low, only one scattering mechanism is dominant. When A is large and H is high, it means that the three scattering mechanisms are similar and the scattering is almost random.

2.4. Dataset Form

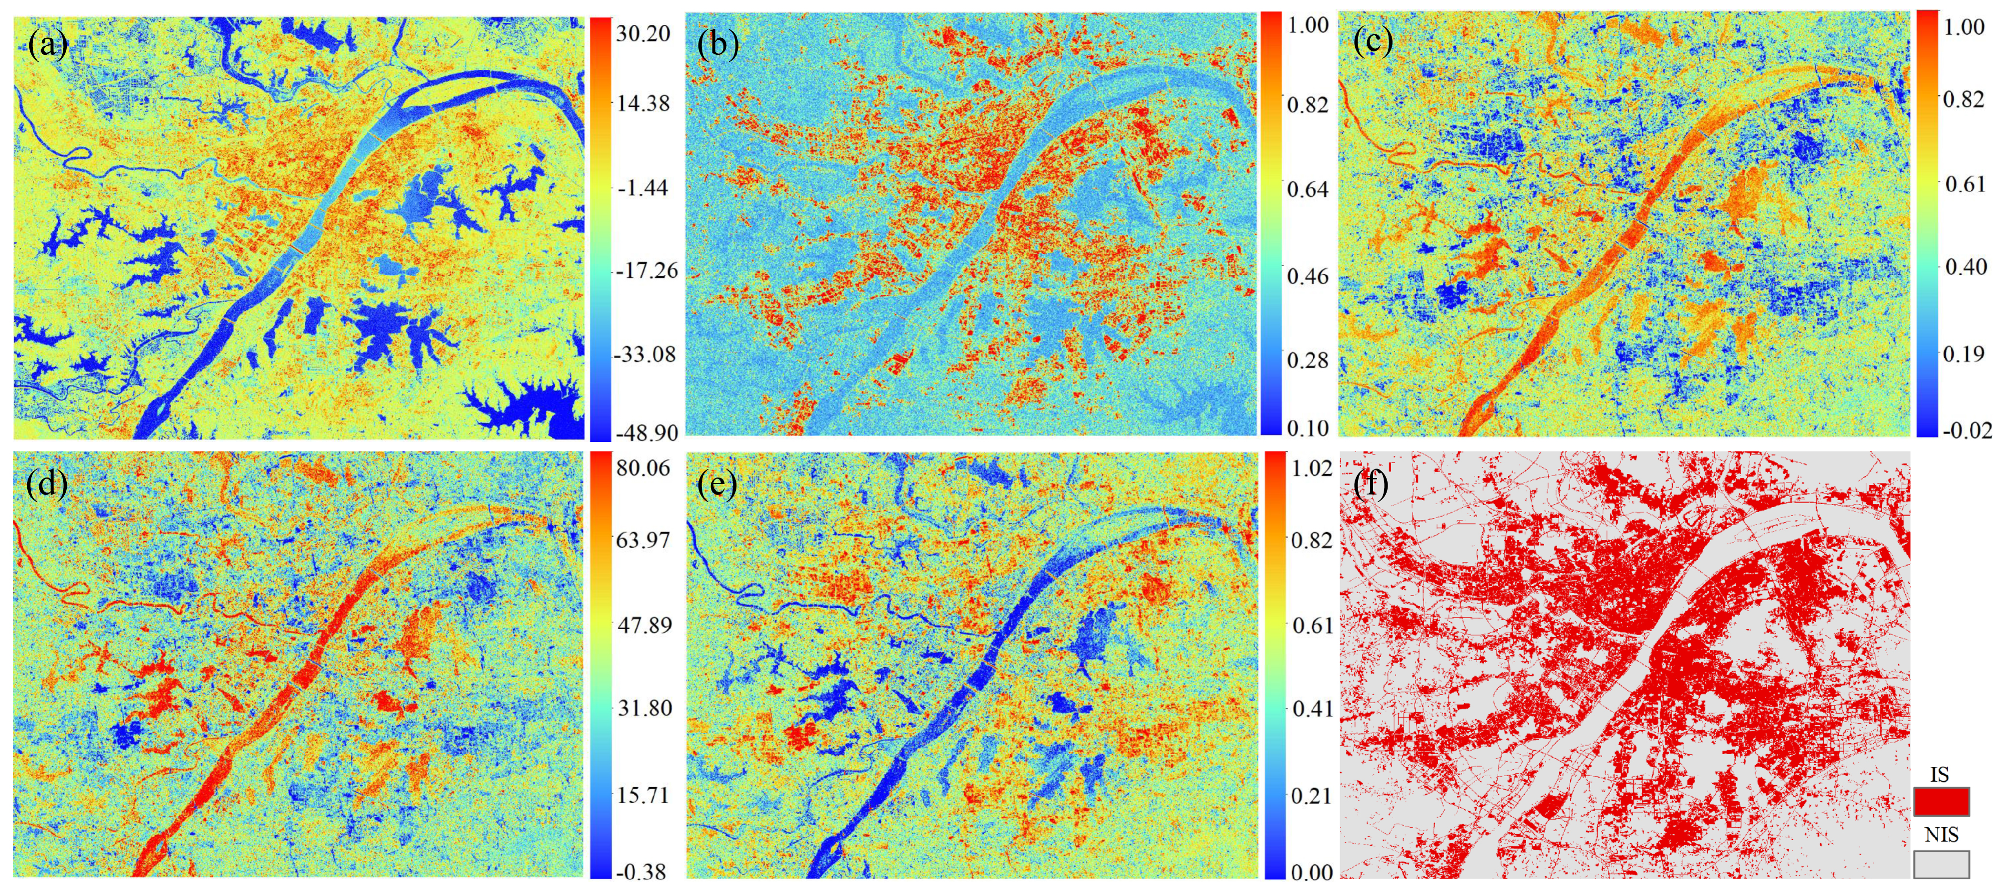
Figure 1 shows the visualization results of the intensity, coherence, and polarization features of ground objects. It can be seen that the intensity and coherence of a impervious surface are significantly higher than those of a pervious surface. To better understand the scattering mechanism of ground objects, the H, A, and Alpha can be split according to the split criteria shown in Table 2 to form an H-Alpha plane, which consists of nine zones. According to the H and Alpha values, the impervious surface is generally located in zones 2, 4, 5, 7, and 8 of the H-Alpha plane. In this study, we aimed to fully explore the roles of intensity, coherence, and polarization features of SAR images in the extraction of urban impervious surfaces. To this end, we constructed seven types of datasets, as shown in Table 3. Among them, dataset D1 contains only the intensity information; dataset D2 contains only the coherence information; dataset D3 contains the polarization scattering information; dataset D4 contains the intensity and coherence information; dataset D5 contains the intensity and polarization scattering information; dataset D6 contains the coherence and polarization information, and dataset D7 contains the intensity, coherence, and polarization scattering information. The dataset used in this study was annotated pixel-by-pixel. Due to the difficulty of SAR image interpretation, in the annotating process, the high-resolution optical image was first registered with the SAR image, and then the SAR image was annotated by visual interpretation with the assistance of the optical image. An impervious surface was labeled as 1, and a pervious surface was labeled as 0. The annotation tool used was Adobe Photoshop software 5.0. After annotation, the whole image was cut into a number of 128 × 128 image patches to finally obtain 5603 patches. The above patches were randomly divided into training and validation sets according to the ratio of 8:2 and input into models.

3. Methodology

This section first introduces the overall framework of this study, then outlines the used impervious surface extraction models, and finally, describes the specific experimental settings and evaluation indicators of impervious surface extraction accuracy.

3.1. The Overall Framework of This Study

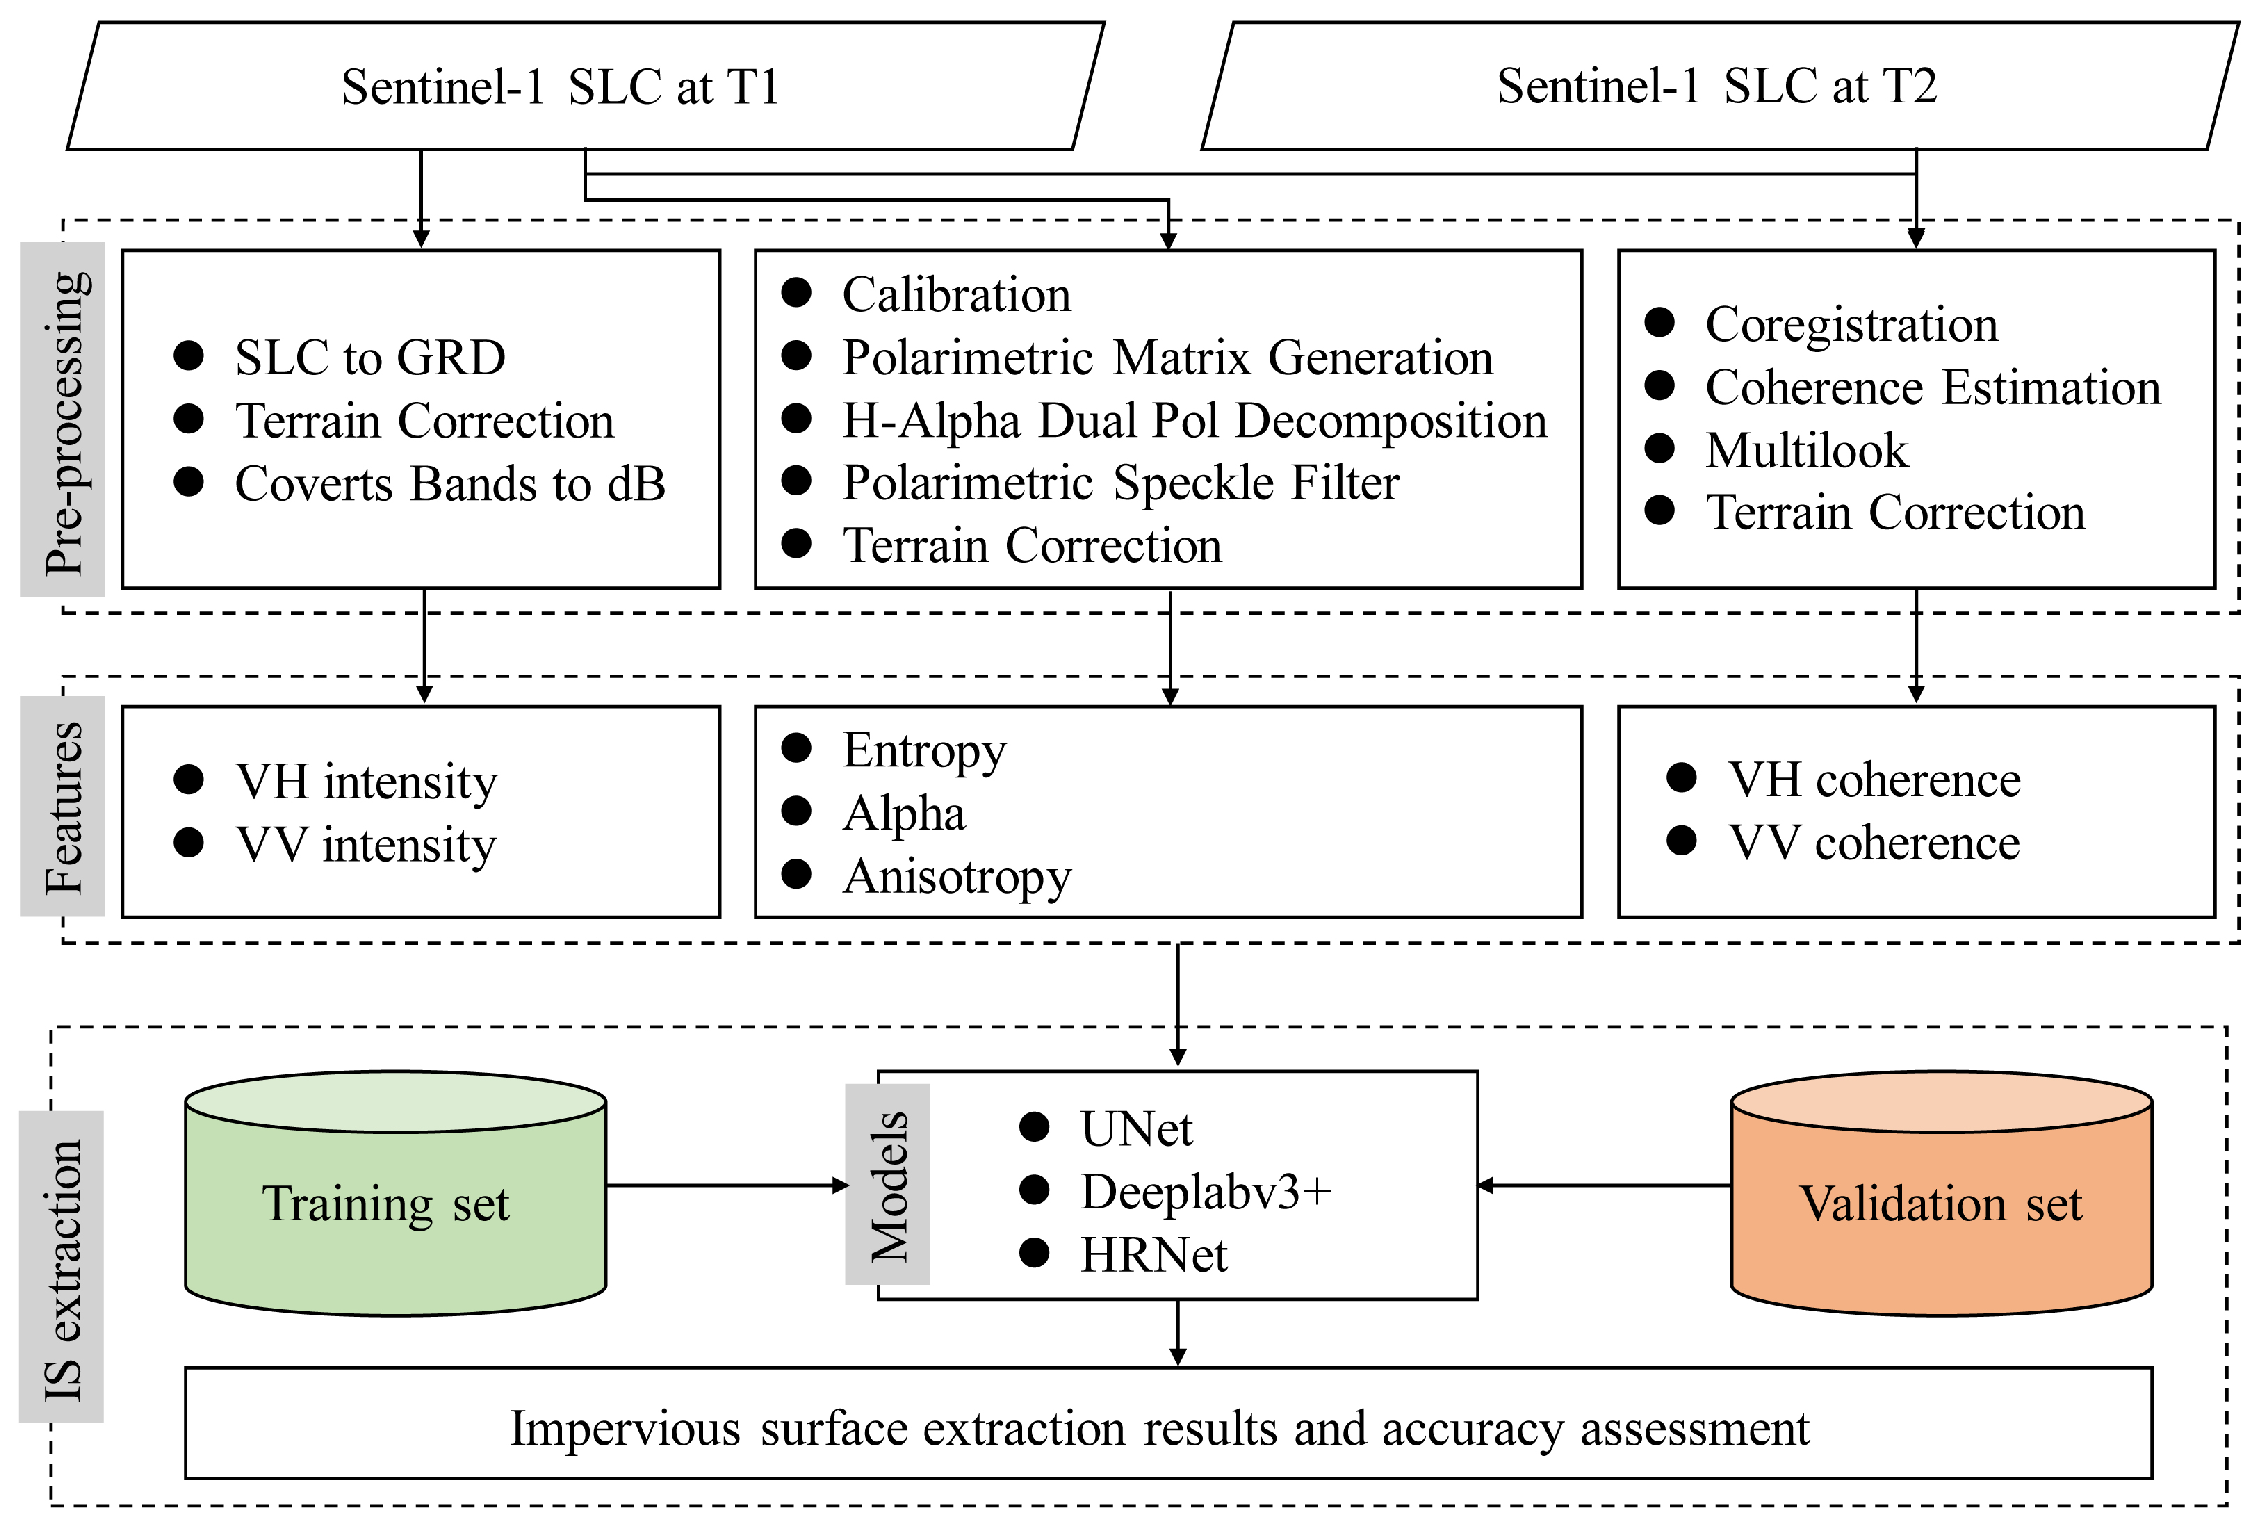
Figure 2 shows the overall framework of this study, which was mainly composed of SAR image preprocessing, feature extraction, and impervious surface extraction. In this study, the Sentinel-1 SLC image was used as the original data source to extract intensity, coherence, and polarization features. The extraction of different features requires different preprocessing steps. For coherence feature extraction, two SLC images covering the same scene at different times are required, and the final coherence features are obtained through preprocessing steps such as coregistration, coherence estimation, multi-look, and terrain correction. The polarization features used in this study includde polarimetric entropy H, mean scattering angle Alpha, and polarimetric anisotropy A. From SLC images to polarization features extraction, the preprocessing steps such as radiometric calibration, polarization matrix generation, H-Alpha dual polarimetric decomposition, polarimetric speckle filter, and terrain correction are needed. To obtain intensity features from SLC images, SLC to GRD (ground range detected), thermal noise removal, radiometric calibration, multi-look, filtering, and terrain correction are required. All preprocessing steps in this study were performed using software SNAP. In SNAP software, a convenient tool for processing SLC to intensity features is provided. In view of the good segmentation performance of UNet [32], Deepalabv3+ [33], and HRNet [34], we selected these three models to extract an impervious surface, and took the above extracted intensity, coherence, and polarization features as the input of models to explore the performance sof intensity, coherence, and polarization features of SAR image in urban impervious surface extraction. The principles and structures of these three models will be described later.

3.2. UNet for Urban Impervious Surface Extraction

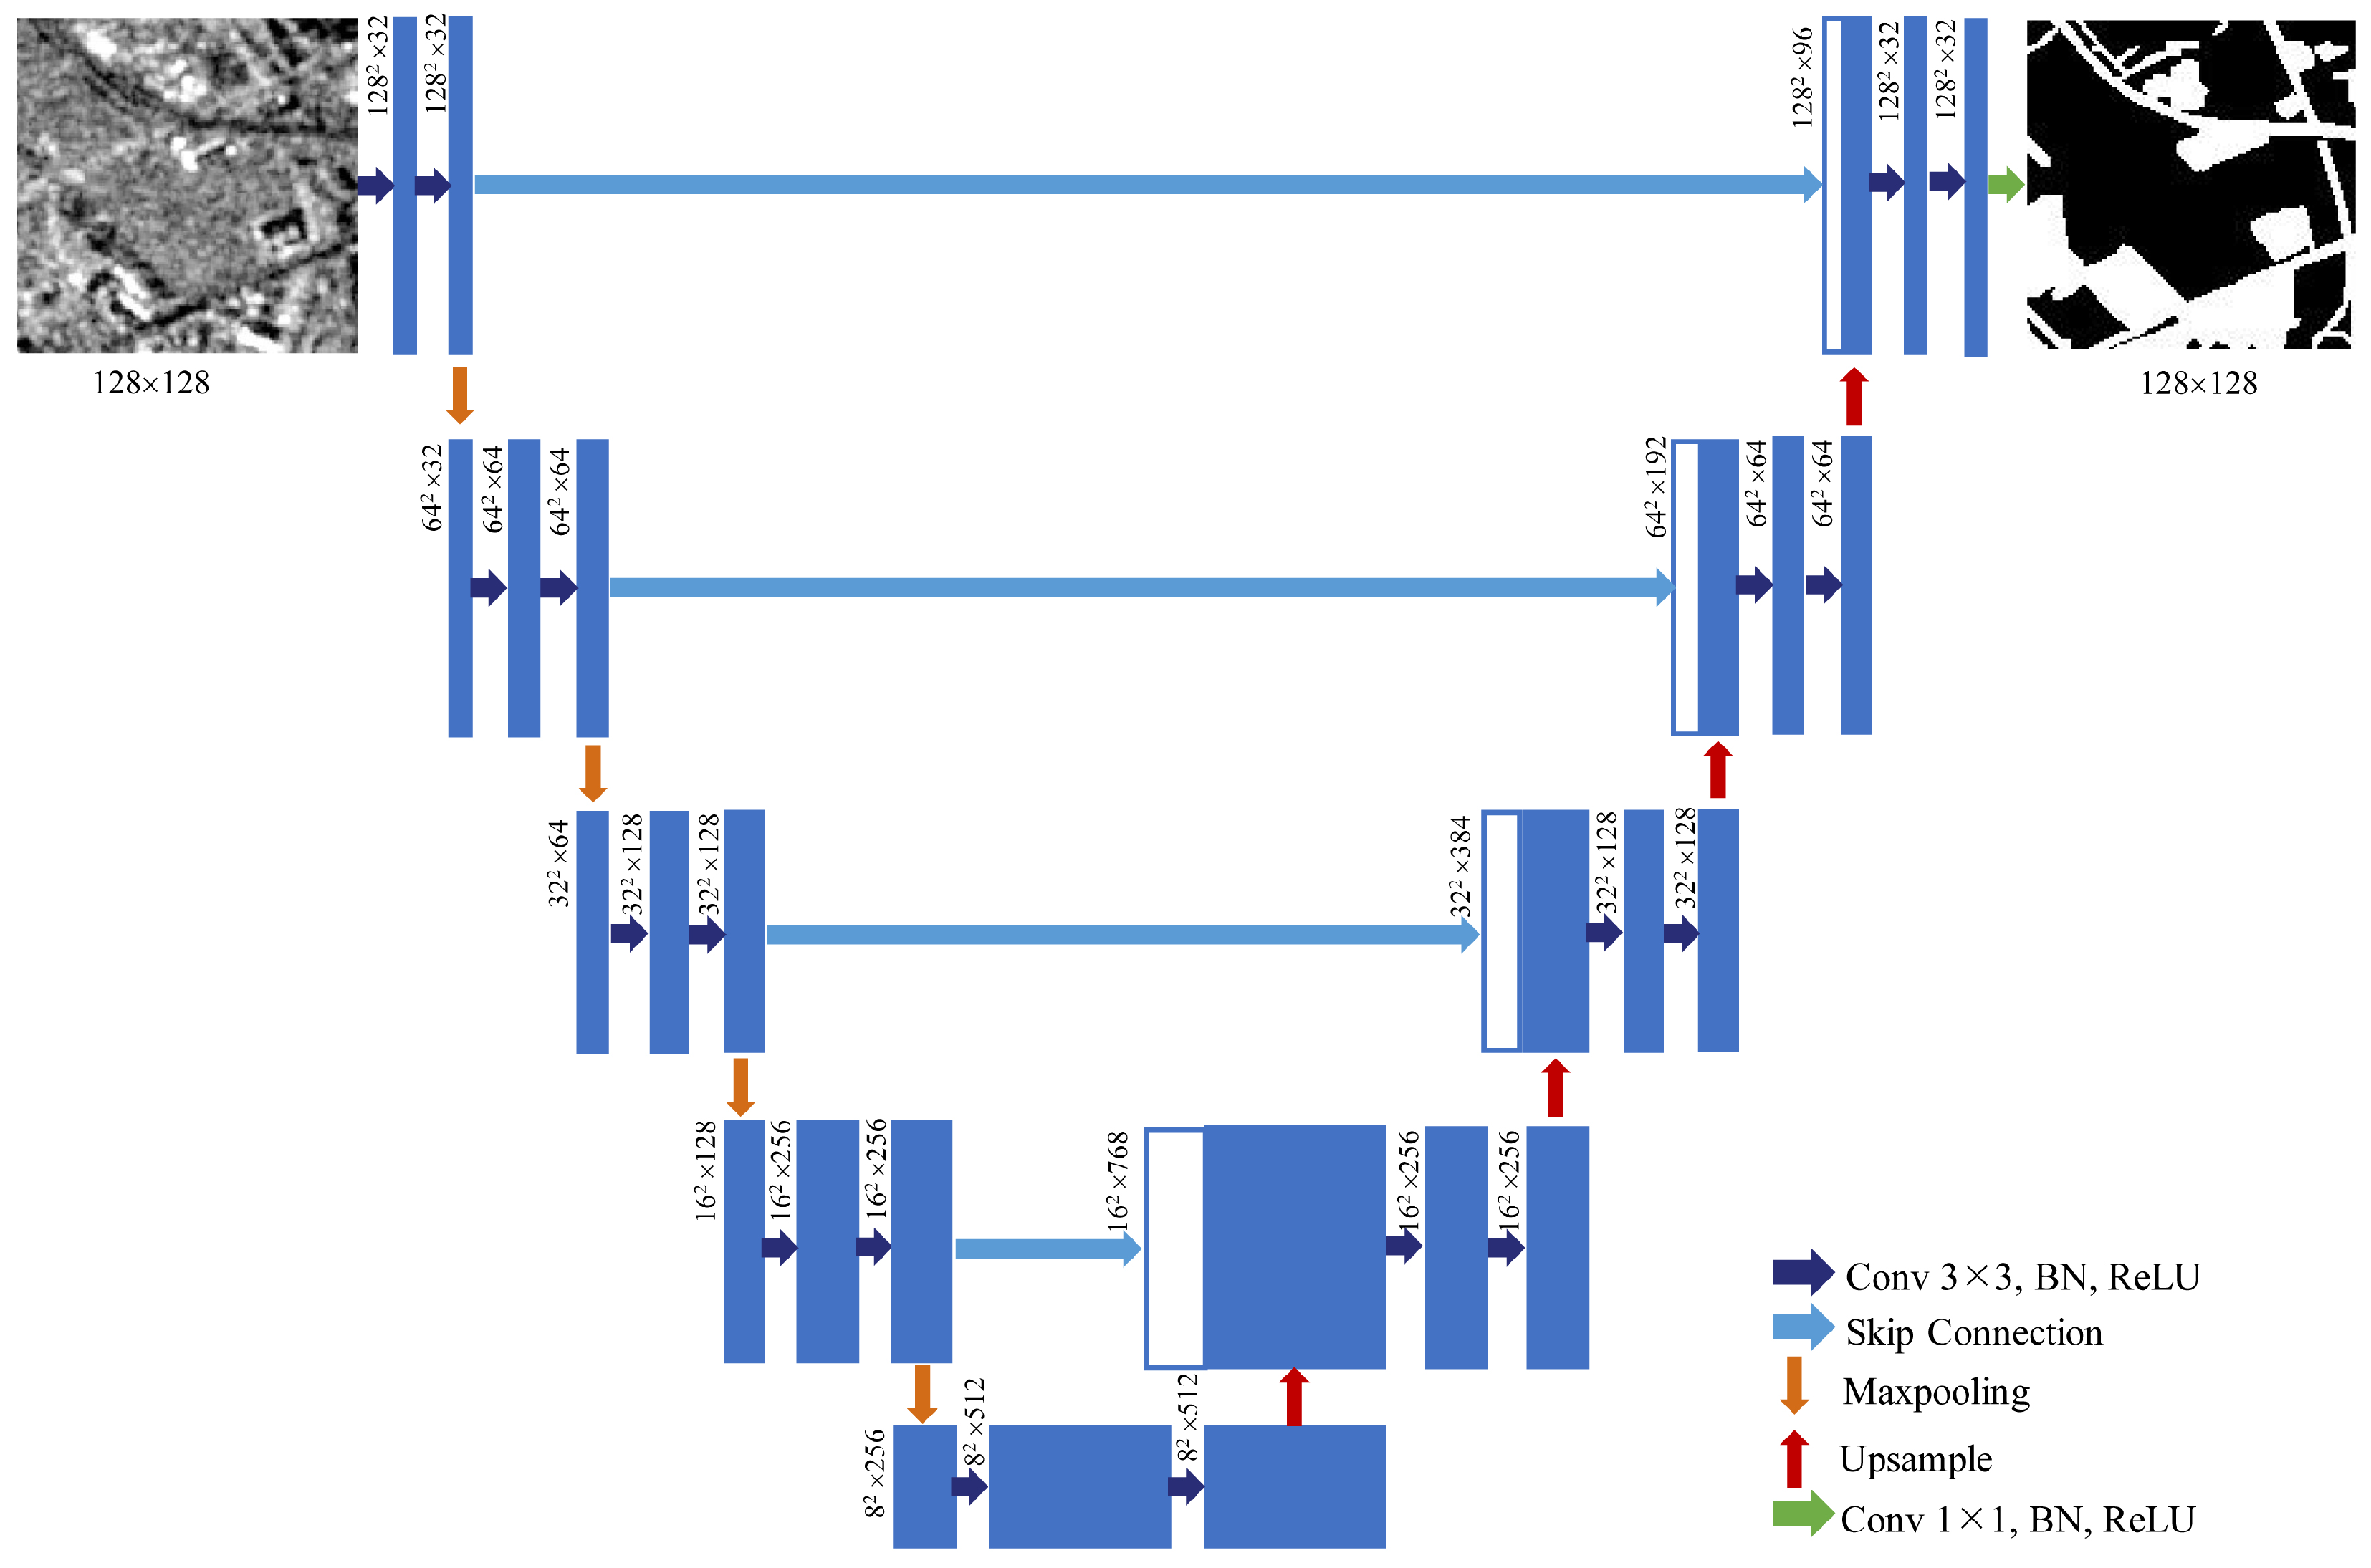
UNet is a variant of FCN which was proposed in 2015 to solve medical image segmentation [32]. Its basic structural framework is shown in Figure 3. UNet is a “U” shaped network structure composed of an encoder and a decoder. The left half of the network is the encoder, which is used to extract multi-scale features of the image, and the right half is the decoder, which mainly restores the resolution of the feature map to the original size through up sampling and convolution operations. The encoder consists of a series of convolution and max-pooling operations. The convolution operation is performed by 3 × 3 convolution, batch normalization (BN), and ReLU. After two convolution operations, a 2 × 2 max-pooling operation follows. After the last convolution operation of the encoder, the 2 × 2 max-pooling operation is replaced by a 2 × 2 deconvolution operation, and the result is input into the decoder of UNet. The decoder consists of multiple groups of 2 × 2 deconvolution, concatenation, and convolution operations to gradually restore the resolution of the feature maps to the size of the input image to achieve image reconstruction. The final image segmentation result is obtained by 1 × 1 convolution. For image segmentation tasks, low-level location information is very important. To this end, UNet integrates low-level location information and high-level semantic information through skip connections, which is one of the important innovations of UNet. In this study, the input SAR image was 128 × 128, and the encoder of UNet performed 5 convolution operations and 4 max-pooling operations. The size of the feature maps was reduced from 128 × 128 to 8 × 8, and the channels of feature maps were increased from the channels of the input SAR image to 512. Accordingly, the decoder of UNet performs 4 convolution and 4 deconvolution operations. The deconvolution operation gradually restores the size of feature maps from 8 × 8 to 128 × 128 and reduces the number of channels from 512 to the corresponding number of segmentation categories. This study focuses on impervious surfaces and pervious surfaces (NIS), so the number of categories divided in this study was to.

3.3. Deeplabv3+ for Urban Impervious Surface Extraction

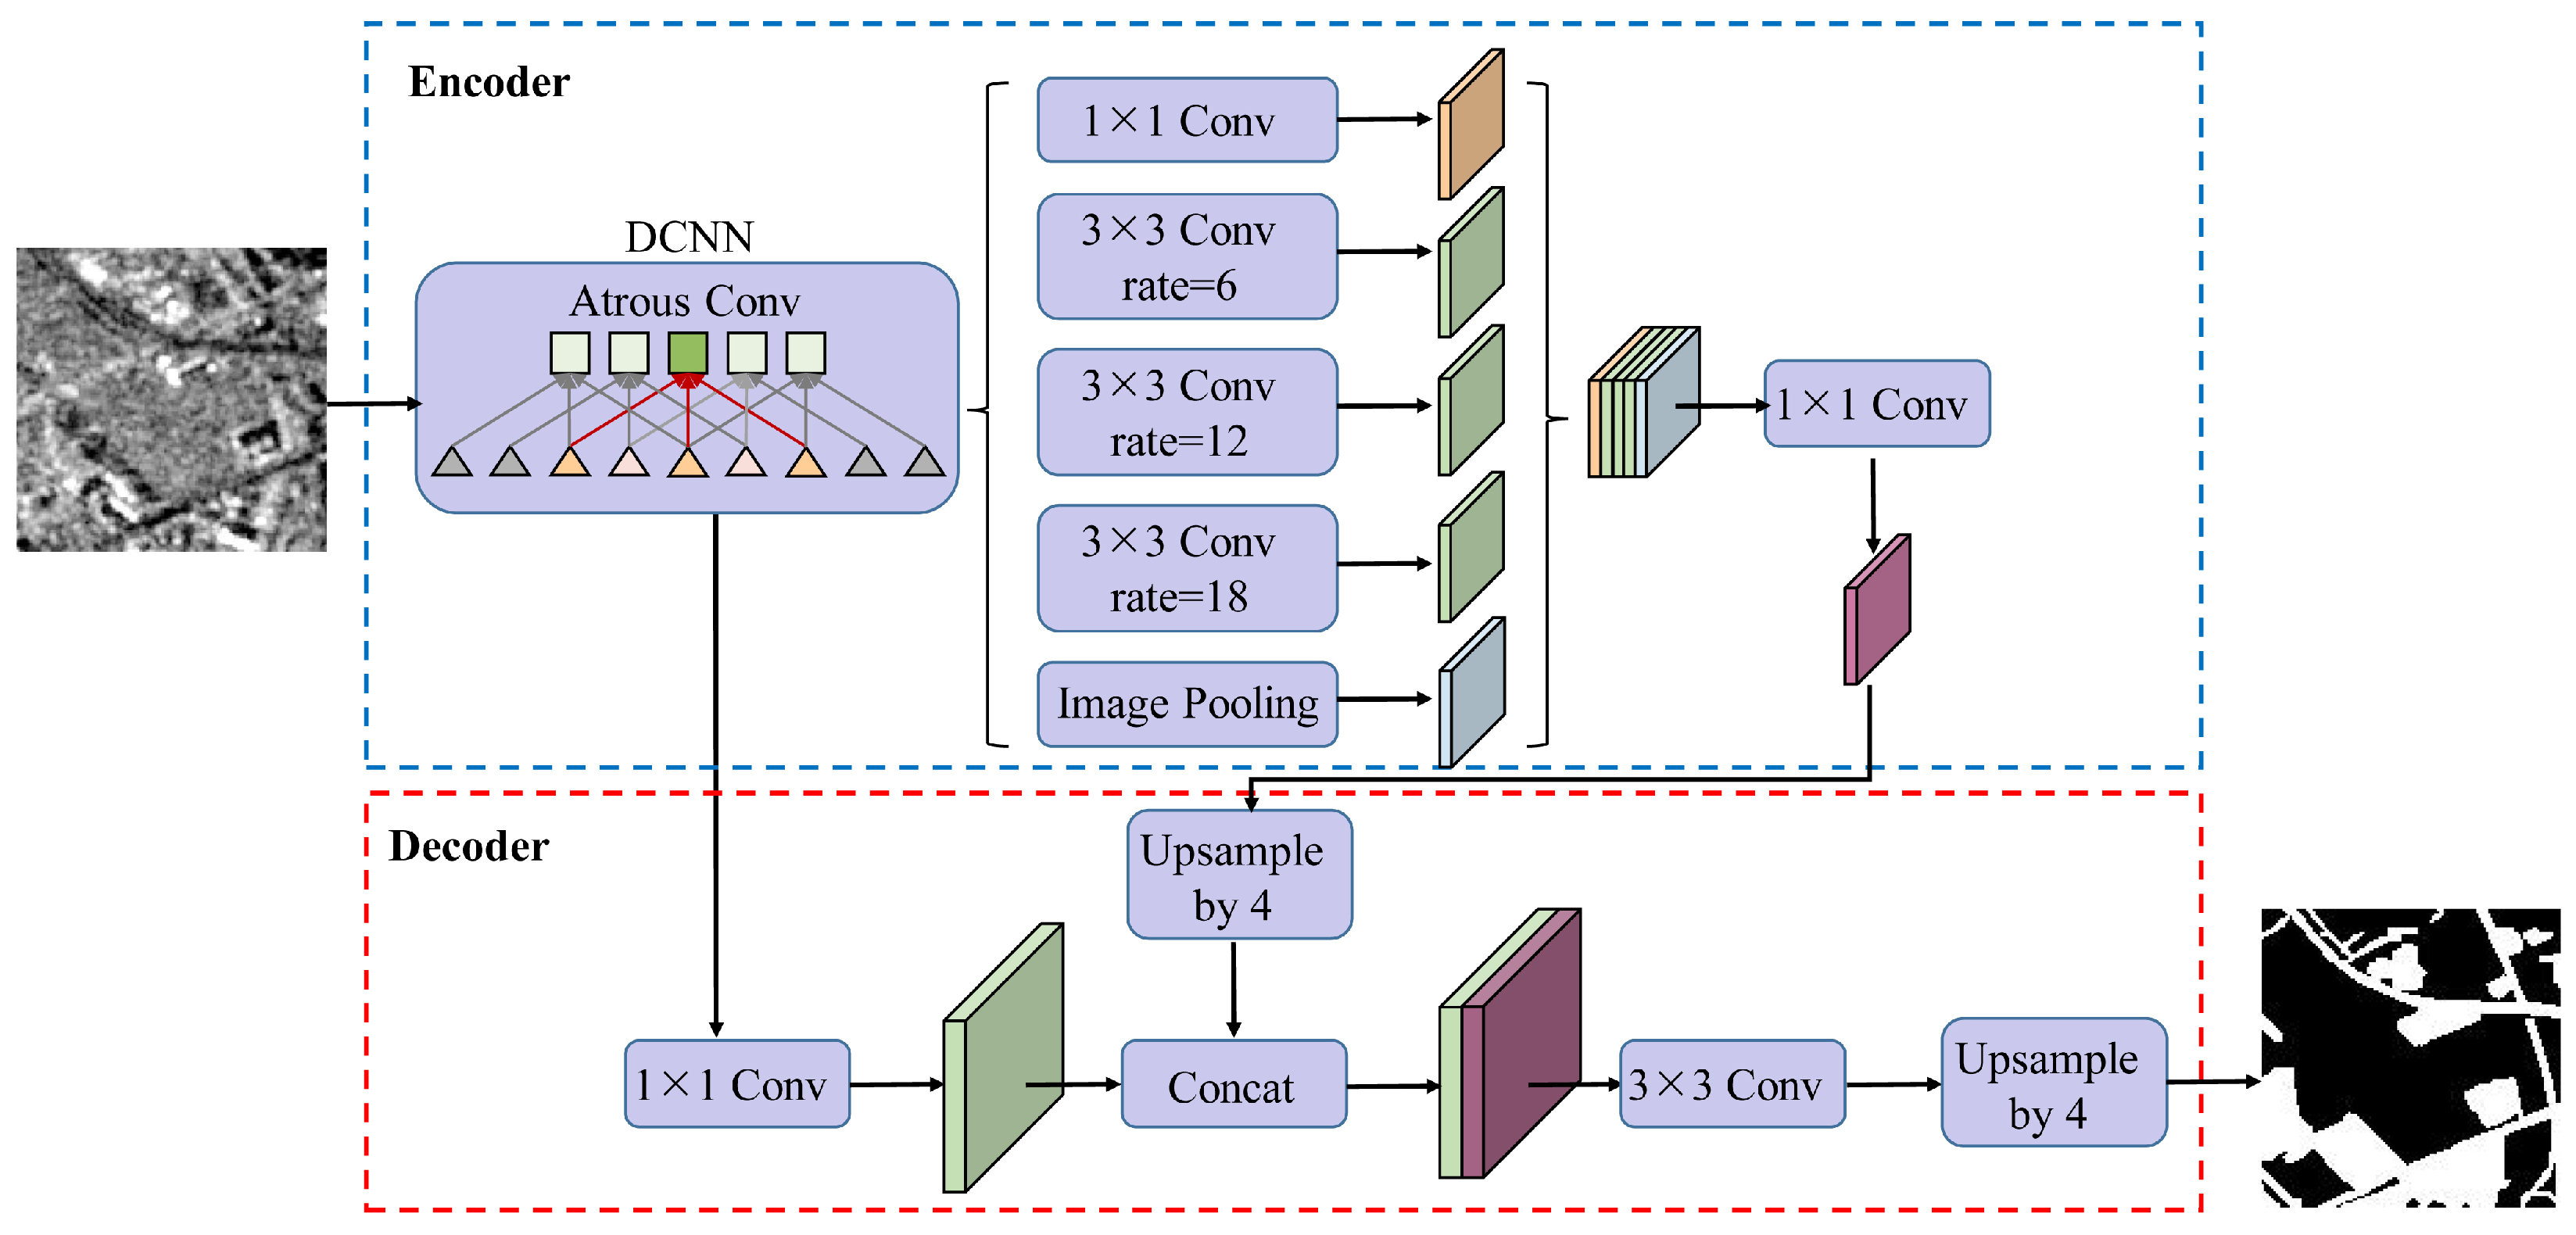
Deeplab series segmentation networks are another peak work in the field of image segmentation, and have achieved satisfactory segmentation results on several public datasets. The network structure is shown in Figure 4. Deeplabv3+ was developed on the basis of Deeplabv3, and it is also an encoder–decoder network [33]. In Deeplabv3+, Deeplabv3 is used as the encoder, and a simple but effective decoder is designed to refine the results of image segmentation. In the encoder, the input image is first input into a deep convolution neural network to extract features, and then the atrous spatial pyramid pooling (ASPP) is used to further extract features from the output of the deep convolution neural network. The ASPP can obtain multi-scale features through different dilation rates without reducing spatial resolution. Then, the multi-scale features extracted by ASPP are concatenated, and the number of channels is reduced through a 1 × 1 convolution operation, and finally, high-level features containing semantic information are obtained. Therefore, the output of the encoder contains 256 channels with rich semantic information. It is worth noting that ASPP can extract features from the arbitrary resolution output of the deep convolution neural network according to the computing power. The output stride is used to represent the ratio of spatial resolution between the input and output of the model. For classification tasks, the spatial resolution of the output is usually 1/32 of the model input image; that is, the output stride is 32. For semantic segmentation tasks, in order to extract more intensive features, the output stride is usually 8 or 16. Therefore, in the Deeplabv3+ model, the output stride with Deeplabv3 as the encoder is 16. In Deeplabv3, the feature maps are up sampled 16 times by bilinear interpolation to restore the size of the output feature maps to the size of the model input, so it can be seen as a simple decoder module. However, this simple decoder module can not restore the details of the segmented object well. To this end, Deeplabv3+ has proposed a simple but effective decoder module. In this decoder, the output features of the encoder are first up sampled by four times through bilinear interpolation and then concatenated in the channel dimension with low-level features of the same size in the deep convolution neural network in the encoder. However, before concatenation, low-level features require 1 × 1 convolution to reduce the number of channels. As the low-level features usually contain a large number of channels, this will make the low-level features more important than the output high-level features of the encoder and make training more difficult. After concatenating the high-level and low-level features, Deeplabv3+ performs 3 × 3 convolution operation on the concatenated features to obtain the segmentation result and then uses bilinear interpolation to conduct 4 round of up sampling on the segmentation result to recover to the size of the input image to obtain the final segmentation result. The experiment proves that when the output stride of encoder is 16, the best balance between speed and accuracy can be achieved. When the output stride of encoder is 8, although the model segmentation effect can be slightly improved, the calculation amount increases accordingly. In Deepalabv3+, ResNet and Xception can be selected as the backbone of the deep convolution neural network.

3.4. HRNet for Urban Impervious Surface Extraction

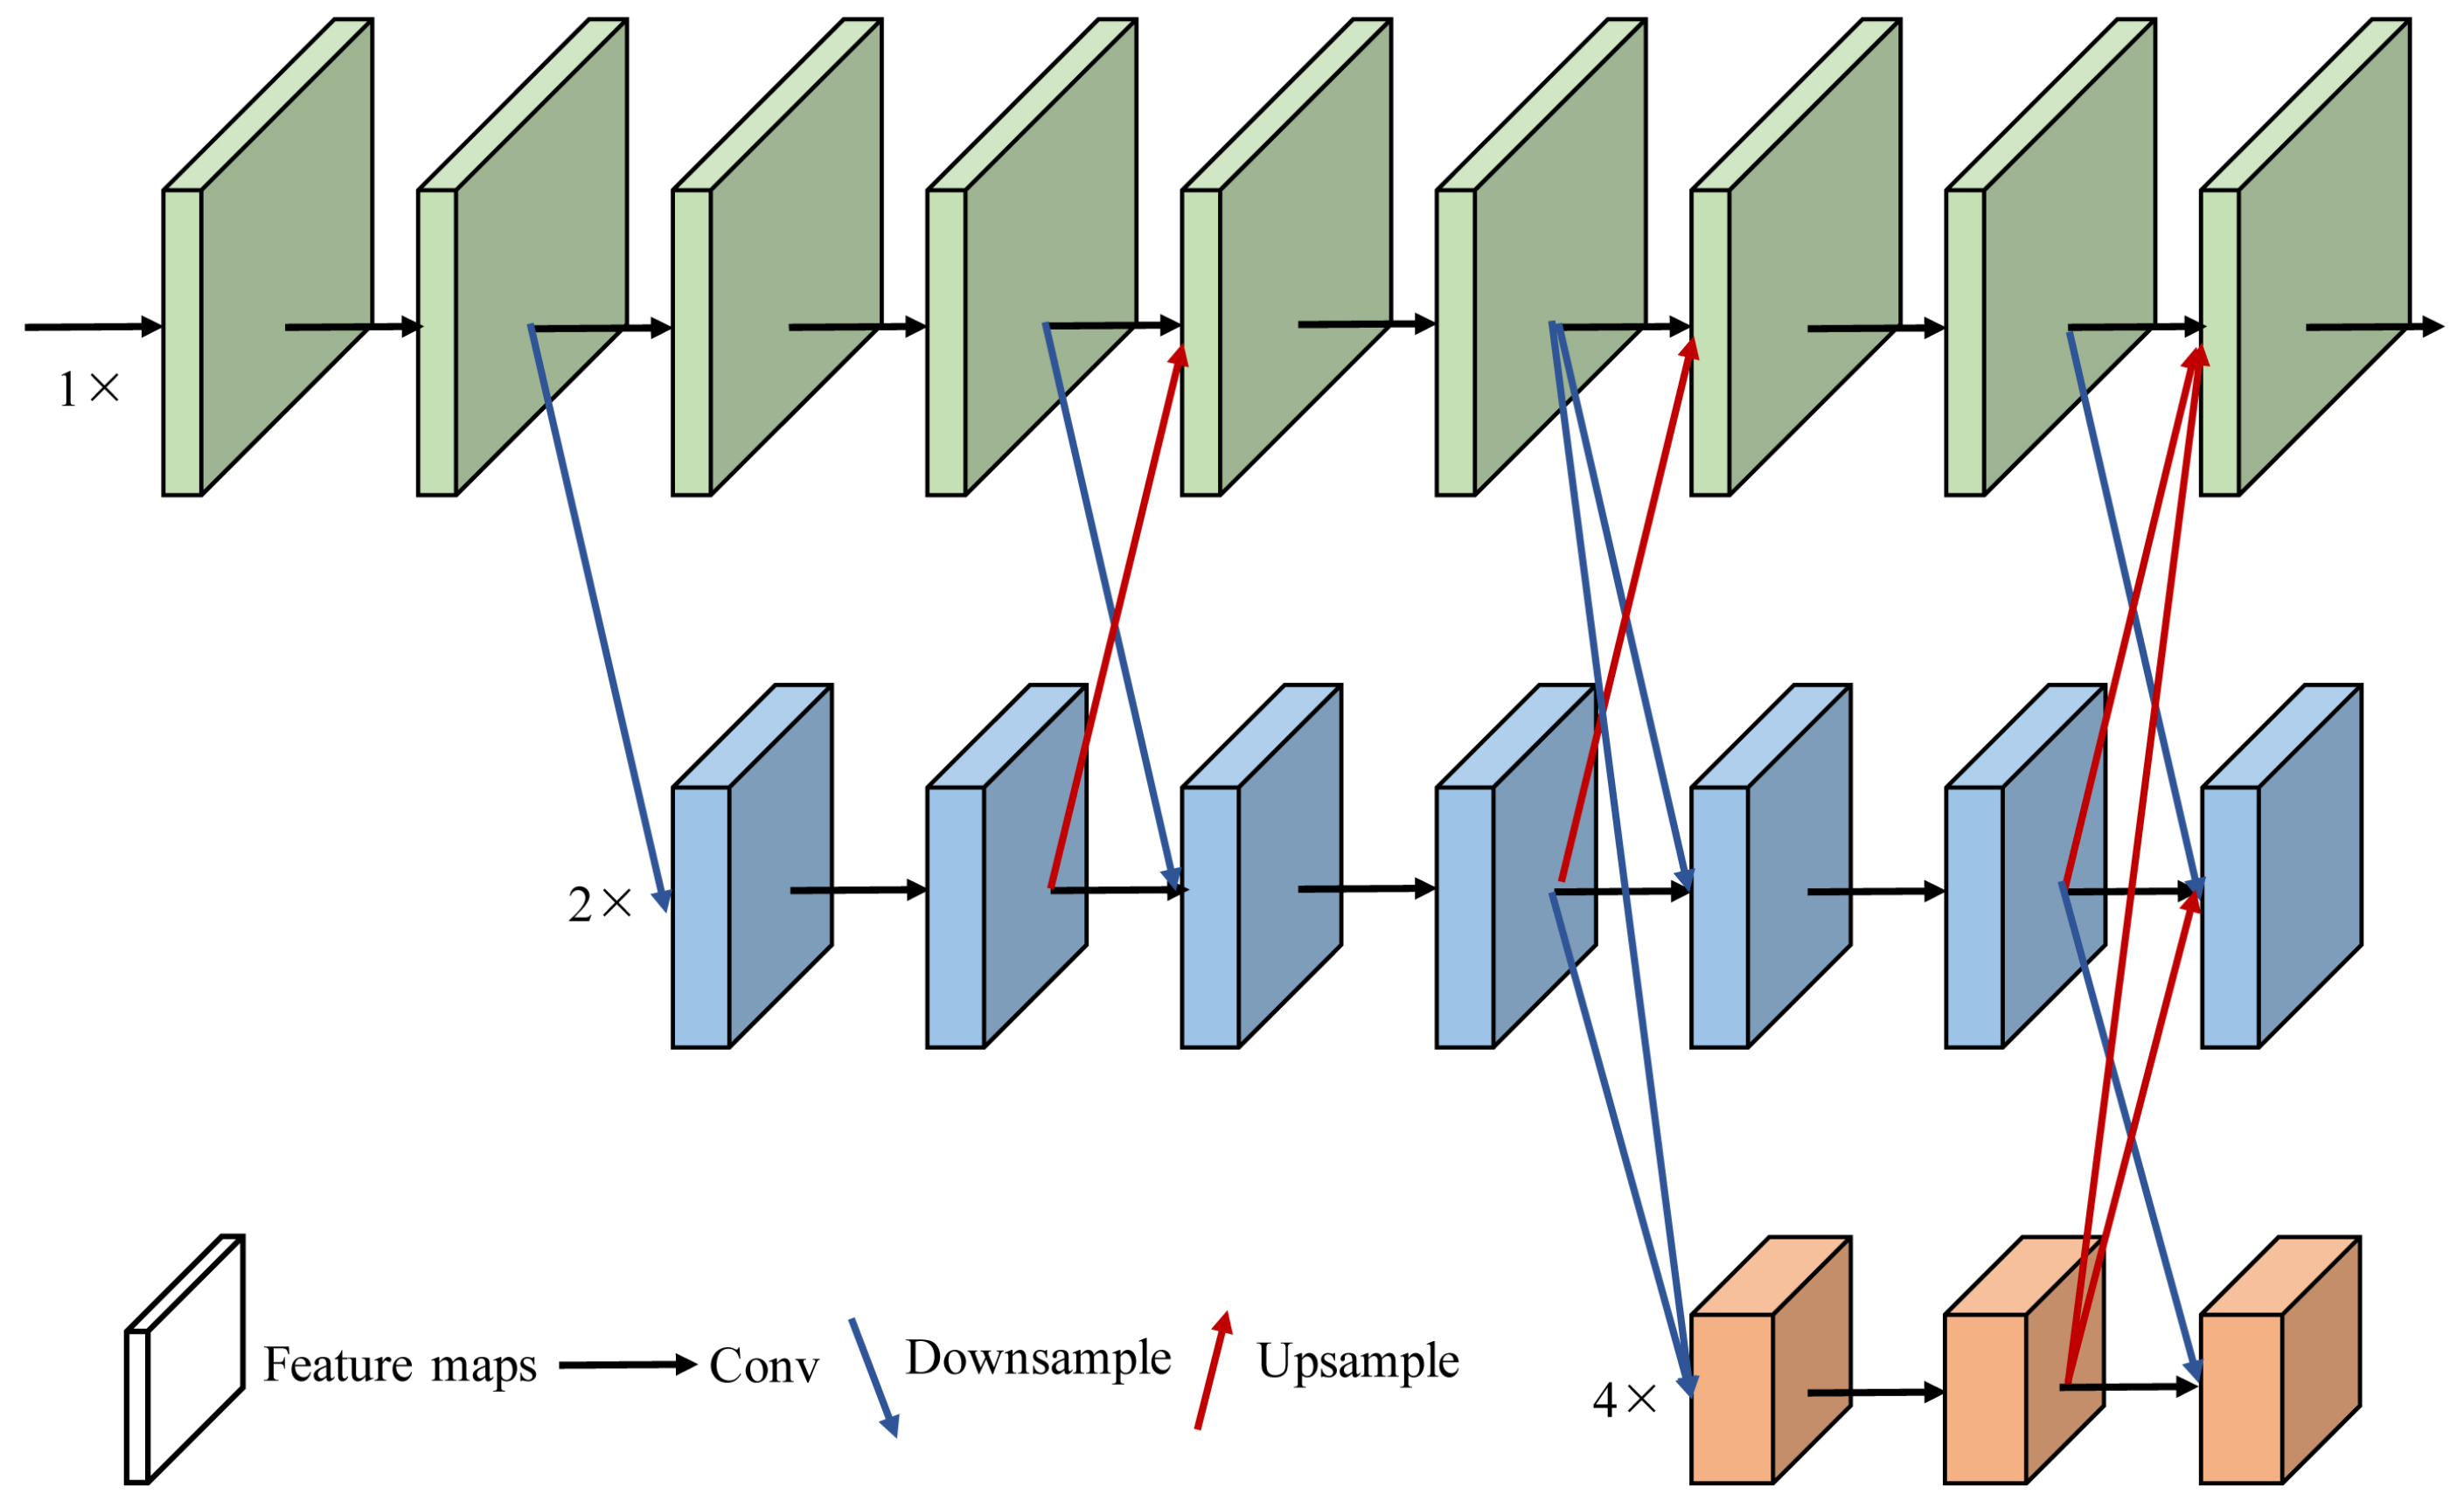
For an image semantic segmentation task, the general method is to use a convolutional neural network to continuously perform down sampling and convolution operations to extract features at different levels, and then recover to the original resolution by up sampling. However, continuous down sampling will lose the spatial details in the image, and it is difficult to effectively recover the lost spatial details through an up sampling operation. For tasks sensitive to image location information such as image semantic segmentation, it requires high-resolution representation. To solve this problem, Sun et al. designed a new network architecture, namely, the high resolution network (HRNet), which can maintain a high-resolution representation throughout the feature extraction process [34]. Its structure is shown in Figure 5. HRNet is characterized by changing the connections of high-resolution and low-resolution features from the commonly used serial structure to the parallel structure, and constantly exchanging information between low-resolution and high-resolution features, rather than recovering feature maps from low resolution to high resolution through the up sampling operation. The existence of high-resolution features makes it more accurate in space, and the existence of low-resolution features makes it more sufficient in semantics. The network takes the high-resolution subnet as the first stage, then gradually increases the high-resolution subnet to the low-resolution subnet to form more stages, and connects the multi-resolution subnet in parallel. At the same time, in the whole process, the model conducts multi-scale information fusion by repeatedly exchanging information on parallel multi-resolution subnetworks, so that each high-resolution or low-resolution representation receives information from other parallel representations repeatedly, thereby obtaining rich high-resolution representations. This fusion scheme is different from most commonly used fusion schemes that aggregate low-level and high-level features. To exchange information between high and low-resolution features, high-resolution features need to first use one or several consecutive 3 × 3 convolutions with a stride size of 2 to reduce the resolution to that of the low-resolution features, and then use element summation to fuse features with different resolutions. For low resolution features, HRNet first uses the nearest neighbor interpolation to conduct 2-fold or 4-fold up sampling, increases the resolution of the low-resolution features to be the same as that of the high-resolution features, then uses 1 × 1 convolution to make the number of channels consistent with the number of high-resolution features, and then performs the summation operation to achieve features fusion. Finally, the outputs of streams with different resolutions are concatenated and then input into softmax and conduct four-fold up sampling to obtain segmentation results with the same size as the original image.

3.5. Experimental Details

The purpose of this study was to explore the impacts of intensity, coherence, and polarization features of SAR images on the extraction of impervious surface under the framework of deep learning. Therefore, according to different feature combinations, seven groups of experiments were designed in this study, as shown in Table 4. The deep learning models used in this study were all trained with the same parameters to ensure the fairness of comparison. In this study, all models were trained for 400 epochs, and the batch size was set to 32. Additionally, the Adam optimizer was selected to optimize the objective loss function, and the model’s parameters were solved through back propagation. The initial learning rate of all models was set to 0.0001, and the polynomial learning rate strategy was used to update the learning rate. For each iteration, the learning rate was adjusted by multiplying the initial learning rate by ( 1 i t e r max _ i t e r ) 0.9 , where i t e r represents the current number of iterations, and max _ i t e r represents the maximum number of iterations. In addition, in order to prevent the model from overfitting, we used the early stop strategy in the training process. When the accuracy of the model in the validation set did not improve for 50 consecutive epochs, the training was stopped in advance. At the same time, during training, we also augmented the training set by vertical flipping, random rotation, and adding random Gaussian noise. The training, testing, and prediction of all models were executed under the Pytorch framework and configured on a workstation with 11 GB of RAM and NVIDIA GeForce RTX 2080. In order to alleviate the problem of unbalanced positive and negative samples, we used the joint loss of binary cross-entropy loss and Dice-distance loss as the loss function. The specific expression is as follows:
L T o t a l = L B C E + L D i c e
where L T o t a l , L B C E , and L D i c e represent the joint loss, binary cross-entropy loss, and Dice-distance loss, respectively.
The binary cross-entropy loss is the most commonly used loss function for pixel-level loss in image semantic segmentation tasks, and its expression is as follows:
L B C E = 1 N y i log p i + ( 1 y i ) log 1 p i
where N is the number of samples and y i is the label of the i t h sample. The p i indicates the probability that the i t h sample is predicted to be positive. In this study, the positive class is impervious surfaces and is marked as 1, and the negative class is pervious surfaces and marked as 0.
Dice-distance loss is a function to measure the similarity of two contour regions, specifically defined as:
L D i c e = 1 2 i = 1 N y i y ¯ i i = 1 N ( y i 2 + y ¯ i 2 )
where y i represents the probability that the pixel i is predicted to be an impervious surface, and y ¯ i is the ground truth.

3.6. Evaluation Metrics

In this study, four evaluation indicators for the extraction accuracy of impervious surface were selected, namely, overall accuracy (OA), kappa coefficient, mean intersection over Union (MIoU) and F1-score. OA is defined as the proportion of the number of correctly classified samples to the number of all samples. The kappa coefficient is an indicator to measure whether the predicted results of the model are consistent with the actual classification results, which can alleviate the problem of large OA deviation caused by sample imbalance. Kappa can be calculated through the confusion matrix, and its value ranges from −1 to 1. It is usually greater than 0. MIoU is the intersection of the true value set and the predictive value set, and it was also the evaluation indicator used in this study for training early stop. F1-score can consider both precision and recall, which is a balanced reflection of accuracy. The specific calculation formulas for OA, kappa, MIoU and F1-score are as follows:
O A = T P + T N T P + F N + F P + T N
K a p p a = p 0 ( T P + T N ) p e p 0 2 p e p 0 = T P + F P + F N + T N p e = ( T P + F N ) ( T P + F P ) + ( F P + T N ) ( F N + T N )
F 1 s c o r e = 2 P A U A P A + U A U A = T P T P + F P P A = T P T P + F N
M I o U = 1 k + 1 i = 0 k T P T P + F P + T N
where T P indicates that the model correctly predicts the positive category. F P indicates that the model incorrectly predicted the positive category. F N indicates that the model incorrectly predicted the negative category. T N indicates that the model incorrectly predicted a negative category. Additionally, k presents the number of categories.

4. Experimental Results

In this section, the backscattering characteristics of impervious surface and other ground objects are compared and analyzed to verify the feasibility of impervious surface extraction based on SAR images. Then, the roles of SAR images with different polarization modes and features in impervious surface extraction are discussed, and the performances of different models are compared.

4.1. The Differences of Polarization Characteristics between Impervious Surfaces and Other Ground Objects

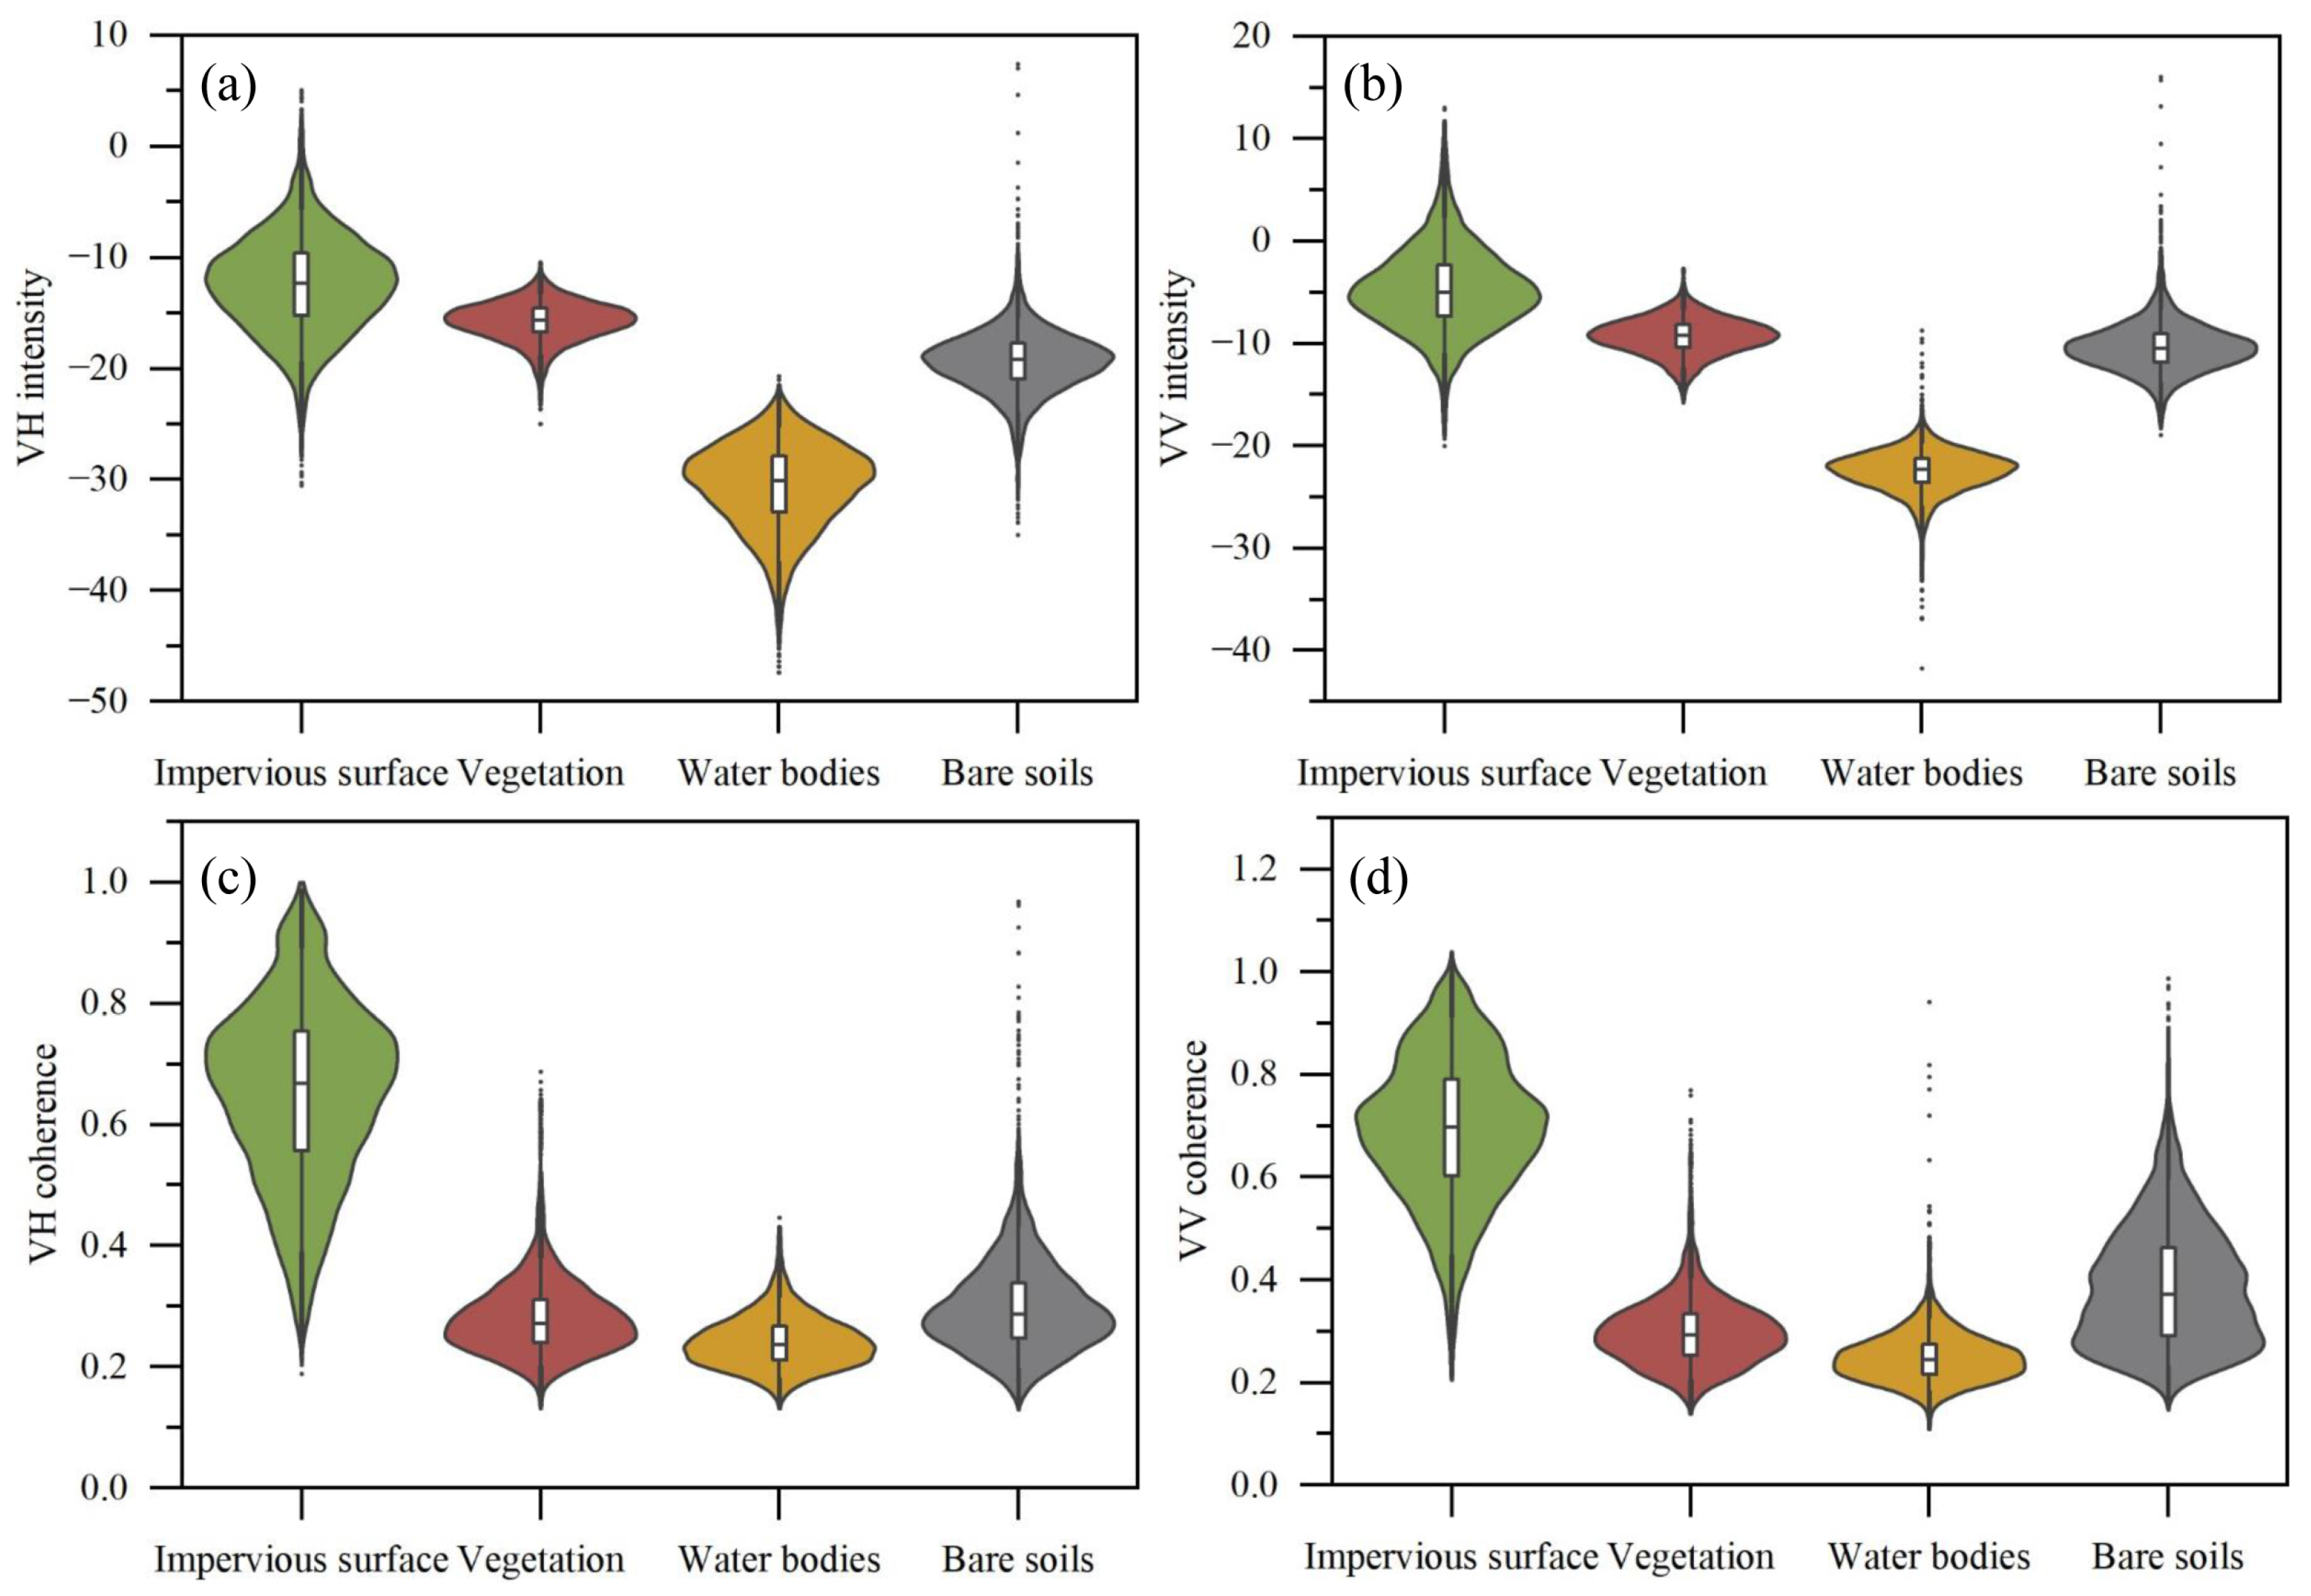
In this experiment, in order to verify the differences in intensity and coherence characteristics of SAR images in identifying impermeable surfaces and other ground objects under different polarization modes, 10,000 sample points were randomly selected from four typical ground objects, namely, impervious surfaces, vegetation (VG), water bodies (WBs) and bare soils (BSs). A violin chart is used to show the distributions of the intensity and coherence characteristics of these four types of ground objects, as shown in Figure 6.
In Figure 6, violins of different colors represent the distributions of backscattering intensity and coherence for different ground objects, and the black line in the middle represents the quartile range. The white rectangle in the middle reflects 50% of values. The bottom and top represent the first quartile and the third quartile, respectively. The horizontal line in the middle of the rectangle represents the median. It can be seen in Figure 6 that the intensity and coherence characteristics of impervious surface are significantly higher than those of the other three types of ground objects, regardless of VH or VV polarization, which can be well distinguished from other ground objects. Taking VH polarization as an example, the backscattering intensit of impervious surfaces is concentrated between −15 and −10 dB, which is the highest among the four kinds of ground objects. The backscattering intensity of vegetation is mainly distributed between −20 and −15 dB, which overlaps with that of impervious surfaces. The backscattering intensity of water bodies is the lowest, and its intensity values are basically below −25 dB. The backscattering intensity of bare soils is between that of water bodies and that of vegetation, and fluctuates around −20 dB. Compared with the backscattering intensity, the differences in the coherence between impervious surfaces and other ground objects are more obvious. The impervious surfaces had strong coherence. Their coherence values are mainly between 0.55 and 0.75, which are much higher than those of other ground objects. The coherence of the other three kinds of ground objects is very low. Their coherence values are basically below 0.3. The main reason for the poor coherence of the three kinds of ground objects is that they are easily affected by environmental factors such as wind and rainfall, which leads to their incoherence. According to Figure 6, the polarization mode has little effect on the relative difference between impervious surface and other ground objects, so we will not repeat the description of the difference in backscattering intensity and coherence between different ground objects under VV polarization. Regarding the distinguishability of impervious surfaces and vegetation and water bodies, VV polarization is slightly better than VH polarization, but for the distinguishability of impervious surface and bare soil, VH polarization is better than VV polarization.
The above only qualitatively shows the differentiability between impervious surfaces and other ground objects. Therefore, we also used Jeffries–-Matusita (JM) distance to quantitatively analyze the differentiability between impervious surfaces and other ground objects based on the characteristics of different polarization modes. The JM distance measures the average distance between two classes density functions, taking into account the distance and the distribution of the mean values of classes, which has been proved to be the most suitable indicator for characterizing the differentiability of classes. The calculation formula is as follows:
J = 2 1 e B
B = 1 8 m 1 m 2 2 2 δ 1 2 + δ 2 2 + 1 2 I n δ 1 2 + δ 2 2 2 δ 1 δ 2
where B represents Bhattacharyya distance, δ i 2 represents the variance in class i, i = 1 , 2 , and m i represents the mean value of class i. The range of JM distance value is from 0 to 2. When J M = 2 , it means that the two classes can be completely separable. When J M = 0 , it means that the two classes are completely confused.
According to the above formula, the JM distances between impervious surfaces and vegetation, water bodies, and bare soils under SAR image features of different polarization modes were calculated in this study, and the calculation results are shown in Table 5. In Table 5, VH includes the intensity and coherence of VH polarization. VV and VH + VV have the same meaning as VH. It can be seen in Table 5 that no matter whether we use VH or VV polarization, the JM distances between impervious surfaces and vegetation, water bodies, and bare soils are large, especially for vegetation and water bodies. The JM distance between impervious surfaces and water bodies is more than 1.9 for these data, indicating that impervious surfaces and water bodies can be completely separated. The differentiability between impervious surfaces and vegetation is also good, and their JM distance is more than 1.6. The differentiability between impervious surfaces and bare soils is relatively poor, and the maximum JM distance is 1.58, indicating that there is some confusion between impervious surfaces and bare soils. For vegetation and water bodies, their differentiability from impervious surfaces under VV polarization is stronger than that under VH polarization. Bare soils work oppositely. In addition, the combination of VV and VH polarization can significantly increase the differentiability between impervious surfaces and other ground objects. The above quantitative and qualitative analysis results show that it is feasible to use the backscattering intensity and coherence features of SAR images to extract impervious surfaces, and the differences between different polarization modes are not obvious, but the combination of VH and VV polarization can improve the differentiability to some extent.

4.2. Impervious Surface Extraction Results of Different Polarization Channels

In the previous section, we qualitatively and quantitatively analyzed the differentiability between impervious surfaces and vegetation, water bodies, and bare soils from the SAR image’s features’ distributions and JM distances. In this section, we discuss the influences of SAR image features under different polarization modes on the extraction of impervious surfaces to determine the best input for the model.
The multi-channel SAR image composed of intensity and coherence features of different polarization modes was used as the input of the model. Table 6 shows the extraction accuracy for impervious surfaces of UNet, Deeplabv3+, and HRNet models with different polarization channels as input. In Table 6, we can observe some interesting findings: Firstly, for the extraction of impervious surfaces, there was no significant difference in the extraction accuracy between VV and VH polarization; secondly, compared with single polarization as input, the extraction accuracy for impervious surfaces with dual polarization as input was significantly improved. The OA, kappa, MIoU, and F1-score of impervious surface extraction results of UNet with a dual-polarization channel as input were 1.05%, 0.0236, 0.0202, and 0.0118 higher than those of extraction results with a single polarization channel as input. For Deeplabv3+, the OA, kappa, MIoU, and F1-score of impervious surface extraction results with a dual-polarization channel as input were 1.21, 0.0282, 0.0233, and 0.0141% higher than those with a single polarization channel as input, respectively. The OA, kappa, MIoU, and F1-score of impervious surface extraction results of HRNet with a dual polarization-channel as input were 0.46, 0.011, 0.0085, and 0.0054% higher than those of extraction results with single polarization channel as input. Thirdly, the extraction accuracies of impervious surface of different models are also significantly different. Among the three models, the extraction accuracy of UNet was the best, and its OA, kappa, MIoU, and F1-score were 4%, 0.10, 0.0789, and 0.048 higher than the lowest values of the other two models, respectively.
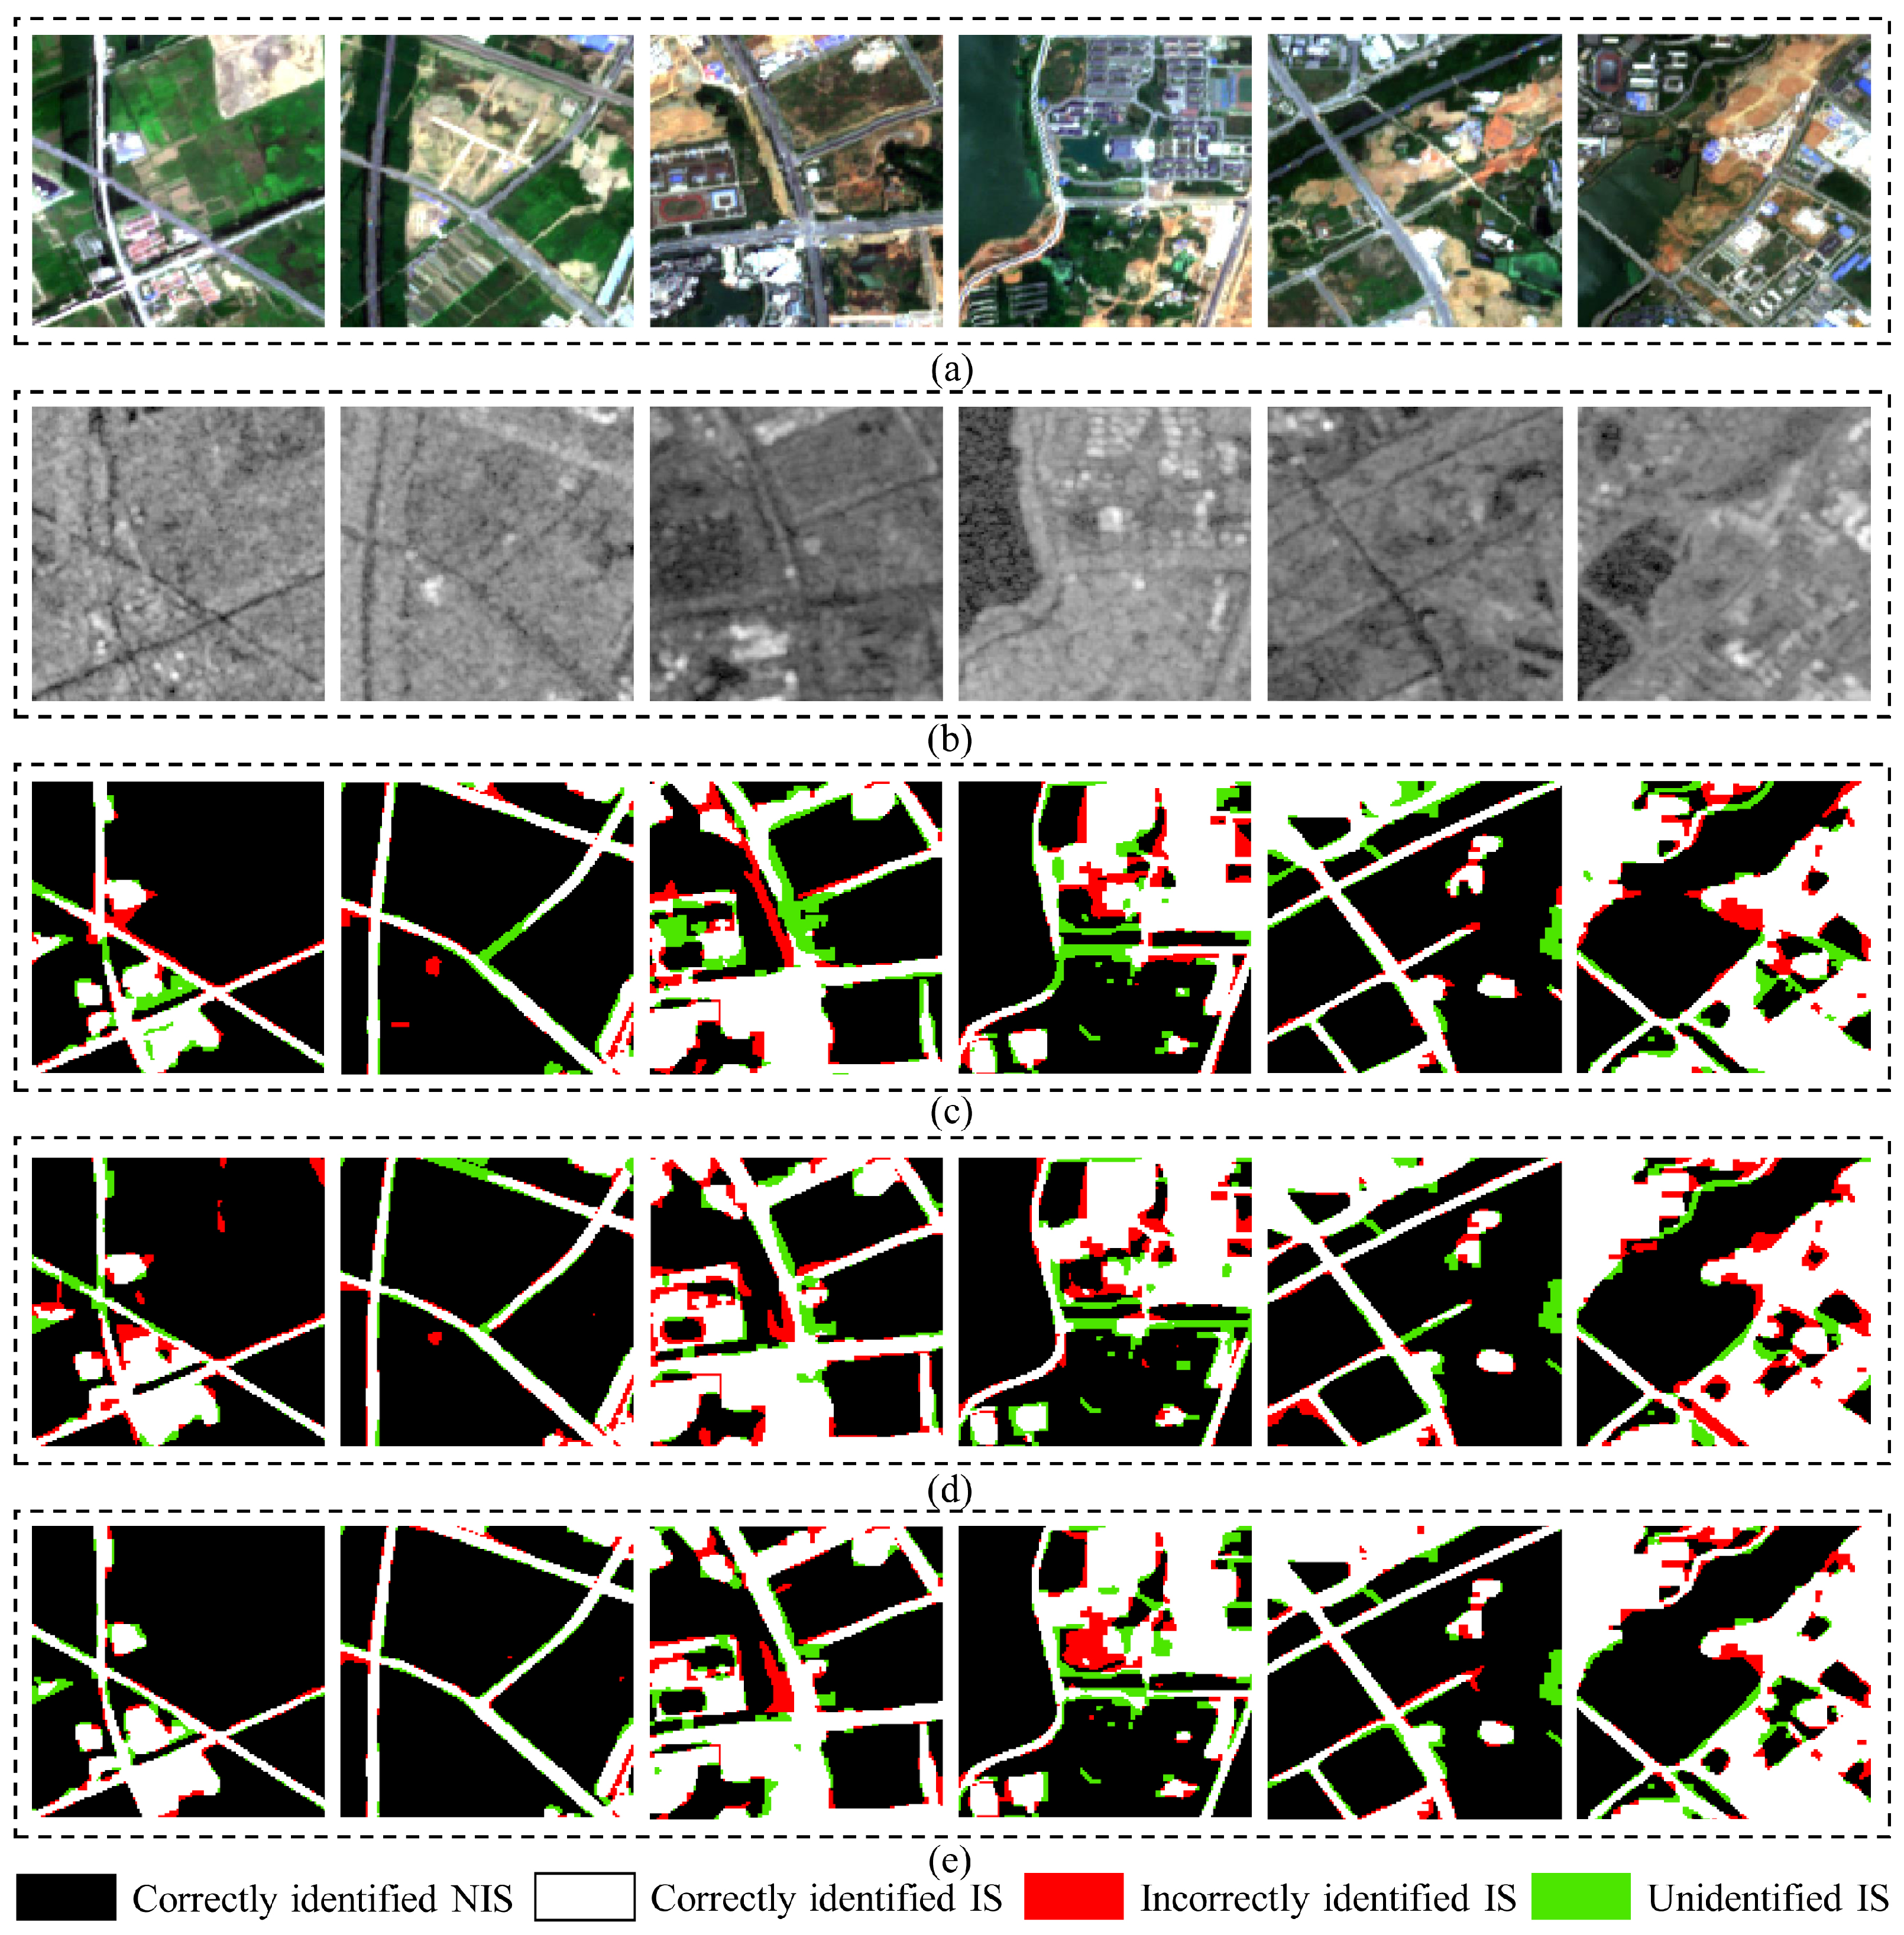
Figure 7 shows the extraction results of impervious surfaces based on different polarization channels, with UNet as an example. The black area in this figure represents the correctly extracted pervious surface, the white area represents the correctly extracted impervious surface, the red area represents the incorrectly extracted impervious surface, and the green area represents the omitted extracted impervious surface. It can be seen in this figure that with the dual polarization channels as the input for the model, the impervious surface extracted incorrectly and omitted is significantly smaller than that based on VV or VH polarization. In the extraction results of impervious surface based on VV and VH polarization, although the positions of the areas of impervious surface that are incorrectly and missed are different, their areas are basically the same, and it is difficult to distinguish the differences between the effects of the two polarization modes.
According to the SAR intensity and coherence analysis in Section 4.1 and the impervious surface extraction results in this section, the dual polarization channels are the optimal input for models. For the extraction of impervious surfaces based on dual-polarization Sentinel-1 data, it is recommended to use dual-polarization data as the input for the model. In the later experiments, the dual-polarization data were used as input to obtain better results in impervious surface extraction.

4.3. Analysis of Impervious Surface Extraction Results Using Intensity, Coherence, and Polarization Features

This section mainly quantitatively evaluates the application potential of the intensity, coherence, and polarization features of dual-polarized SAR images in the extraction of impervious surfaces. In Section 4.1, we used the violin figure and JM distances to analyze the differences in intensity and coherence features between impervious surfaces and other ground objects. Similarly, in this section, we first use the violin figure to show the distributions of polarization features of impervious surfaces and other ground objects, as shown in Figure 8. It can be seen in Figure 8 that the distribution of the polarization features (H, A, and Alpha) of impervious surfaces overlaps with those of vegetation, water bodies, and bare soils to a certain extent, which is in contrast to the intensity and coherence features of impervious surfaces and vegetation, water bodies, and bare soils. This would make it difficult to effectively separate impervious surfaces from other ground objects using only polarization features. According to Equations (18) and (19), we also calculated the JM distances between impervious surfaces and vegetation, water bodies, and bare soils based on polarization features, which were 1.3527, 1.3232, and 1.1399, respectively. The JM distance value was relatively low, indicating that there was some confusion between impervious surfaces and vegetation, water bodies, and bare soils.
Next, according to the experiment set in Section 3, we combined the intensity, coherence, and polarization features of SAR images and input them into urban impervious surface extraction models to explore their specific roles in the impervious surface extraction. Table 7 shows the impervious surface extraction accuracies of UNet with different feature inputs. It can be seen that the extraction accuracy for impervious surfaces based on intensity features was the highest, followed by the results for coherence and polarization features. Compared with a single feature, a multi-feature combination can improve the extraction accuracy to a certain extent, but the degree of improvement differs. For example, the extraction accuracy based on the combination of intensity and coherence features was obviously better than that based on the combination of intensity and polarization features or the combination of coherence and polarization features. Additionally, the extraction accuracy based on the combination of coherence and polarization features was even lower than that based on intensity features alone. Although the extraction accuracy of combining intensity, coherence, and polarization features was the highest, it was only slightly higher than the combination of intensity and coherence features.
Table 8 shows the impervious surface extraction accuracies of Deeplabv3+ with different feature inputs. Similarly to the situation reflected in Table 7, among the three features of intensity, coherence, and polarization, the extraction accuracy based on intensity features was the highest, followed by coherence and polarization features. Additionally, the extraction accuracy based on multi-feature combinations was better than that based on single feature. Differently from the results of UNet, the impervious surface extraction results based on the combination of intensity and coherence features had the highest accuracy and were superior to the combination of intensity, coherence, and polarization features. Table 9 shows the impervious surface extraction accuracies of HRNet with different feature inputs. It can be seen that when a single feature was used as the input of the model, the extraction accuracy for impervious surfaces based on intensity feature was still the highest, followed by coherence and polarization features, which is consistent with the results of UNet and Deeplabv3+. However, what is inconsistent with these two models is that after combining multiple features, the extraction accuracy of the model was not significantly improved, which was only higher than that based on intensity and coherence features alone, but lower than that based on the intensity feature.
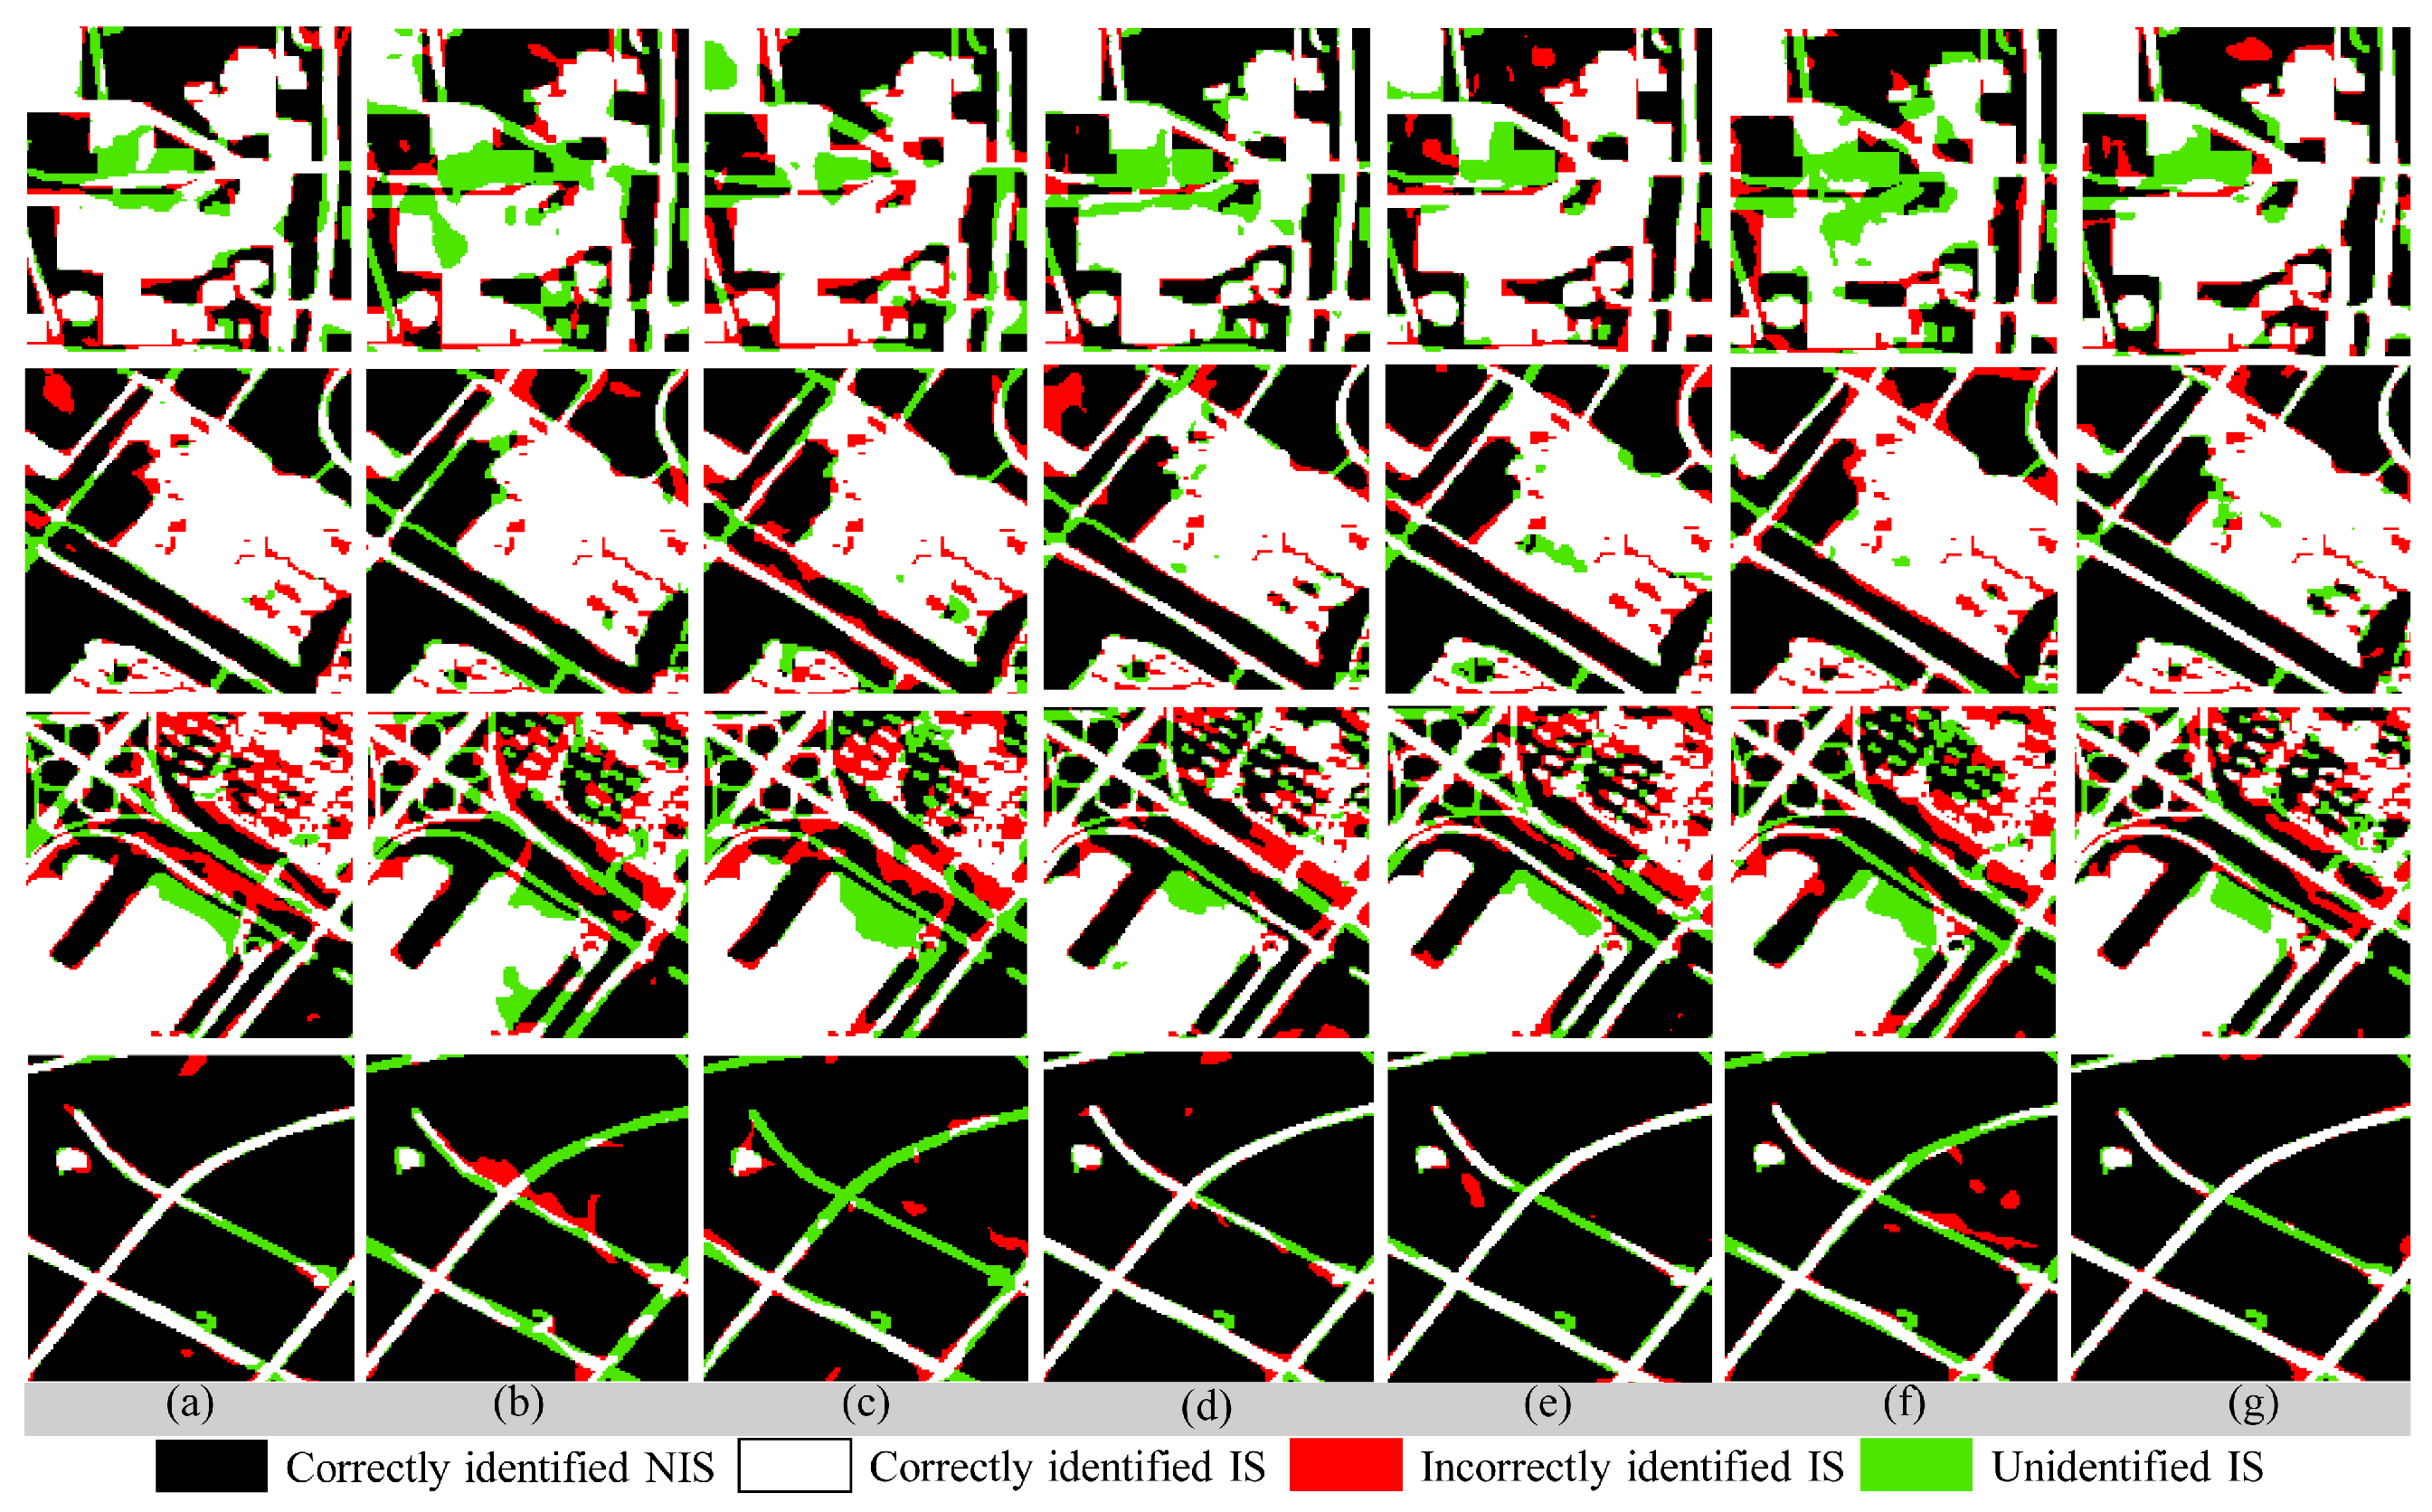
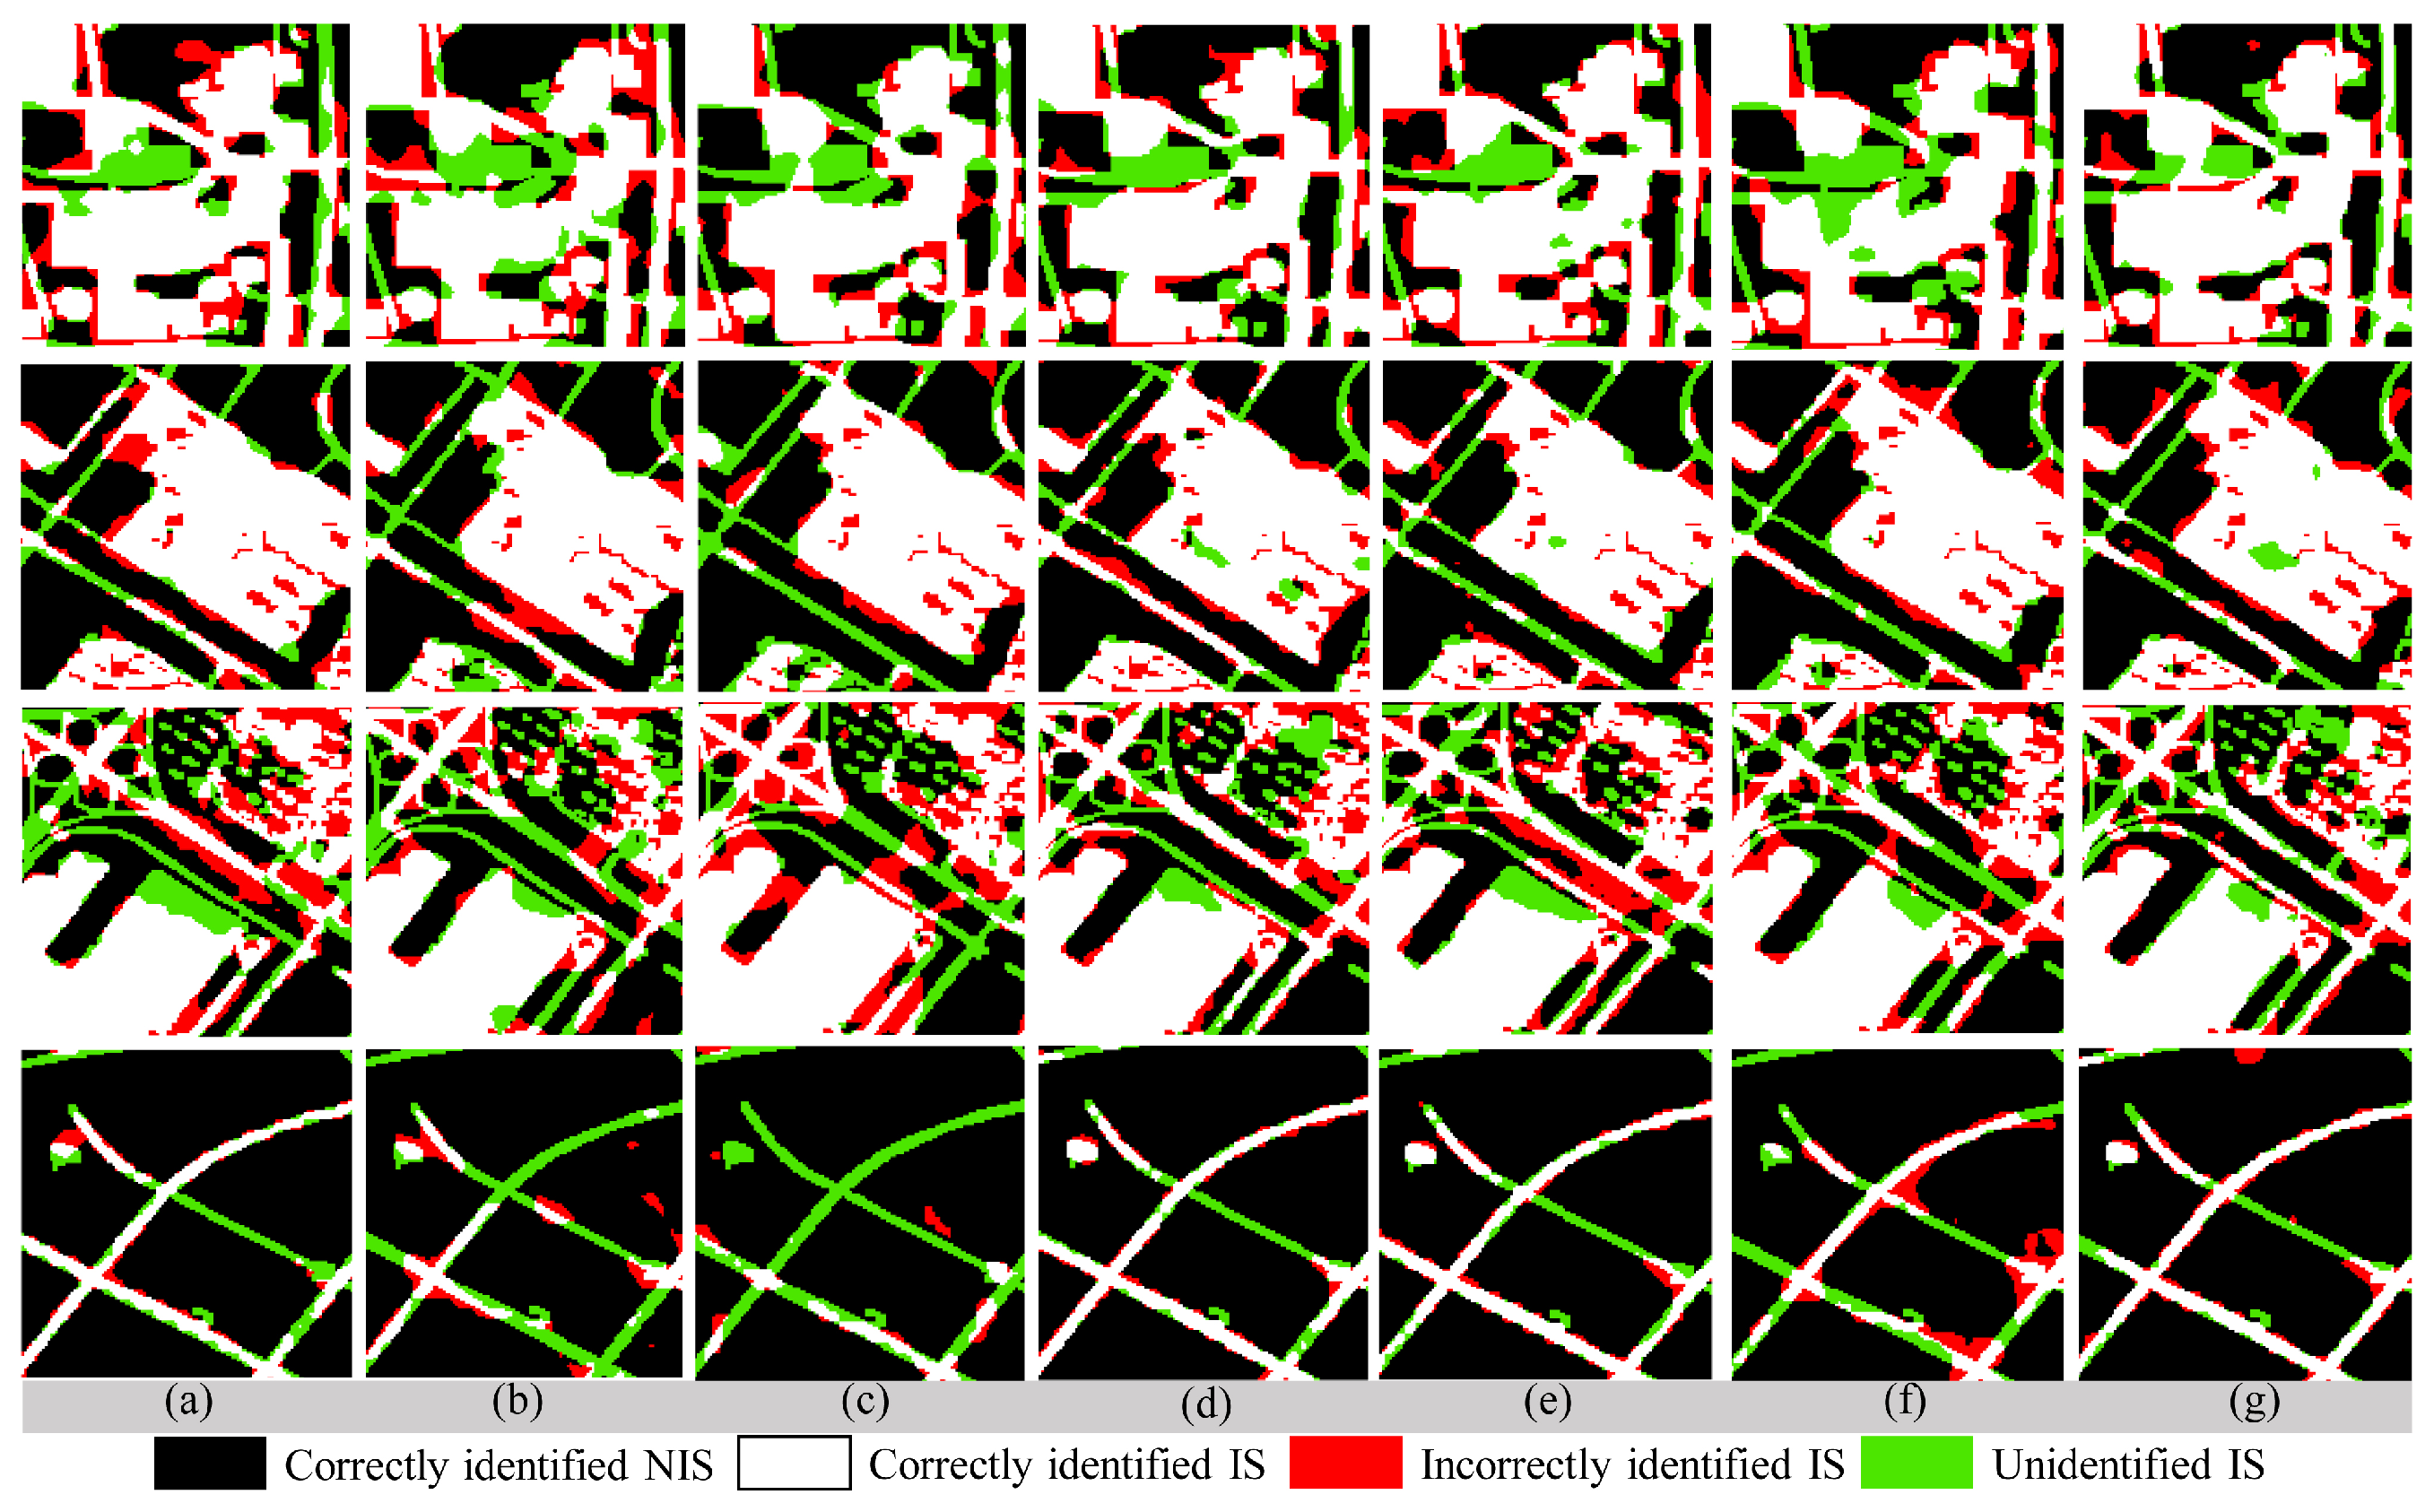
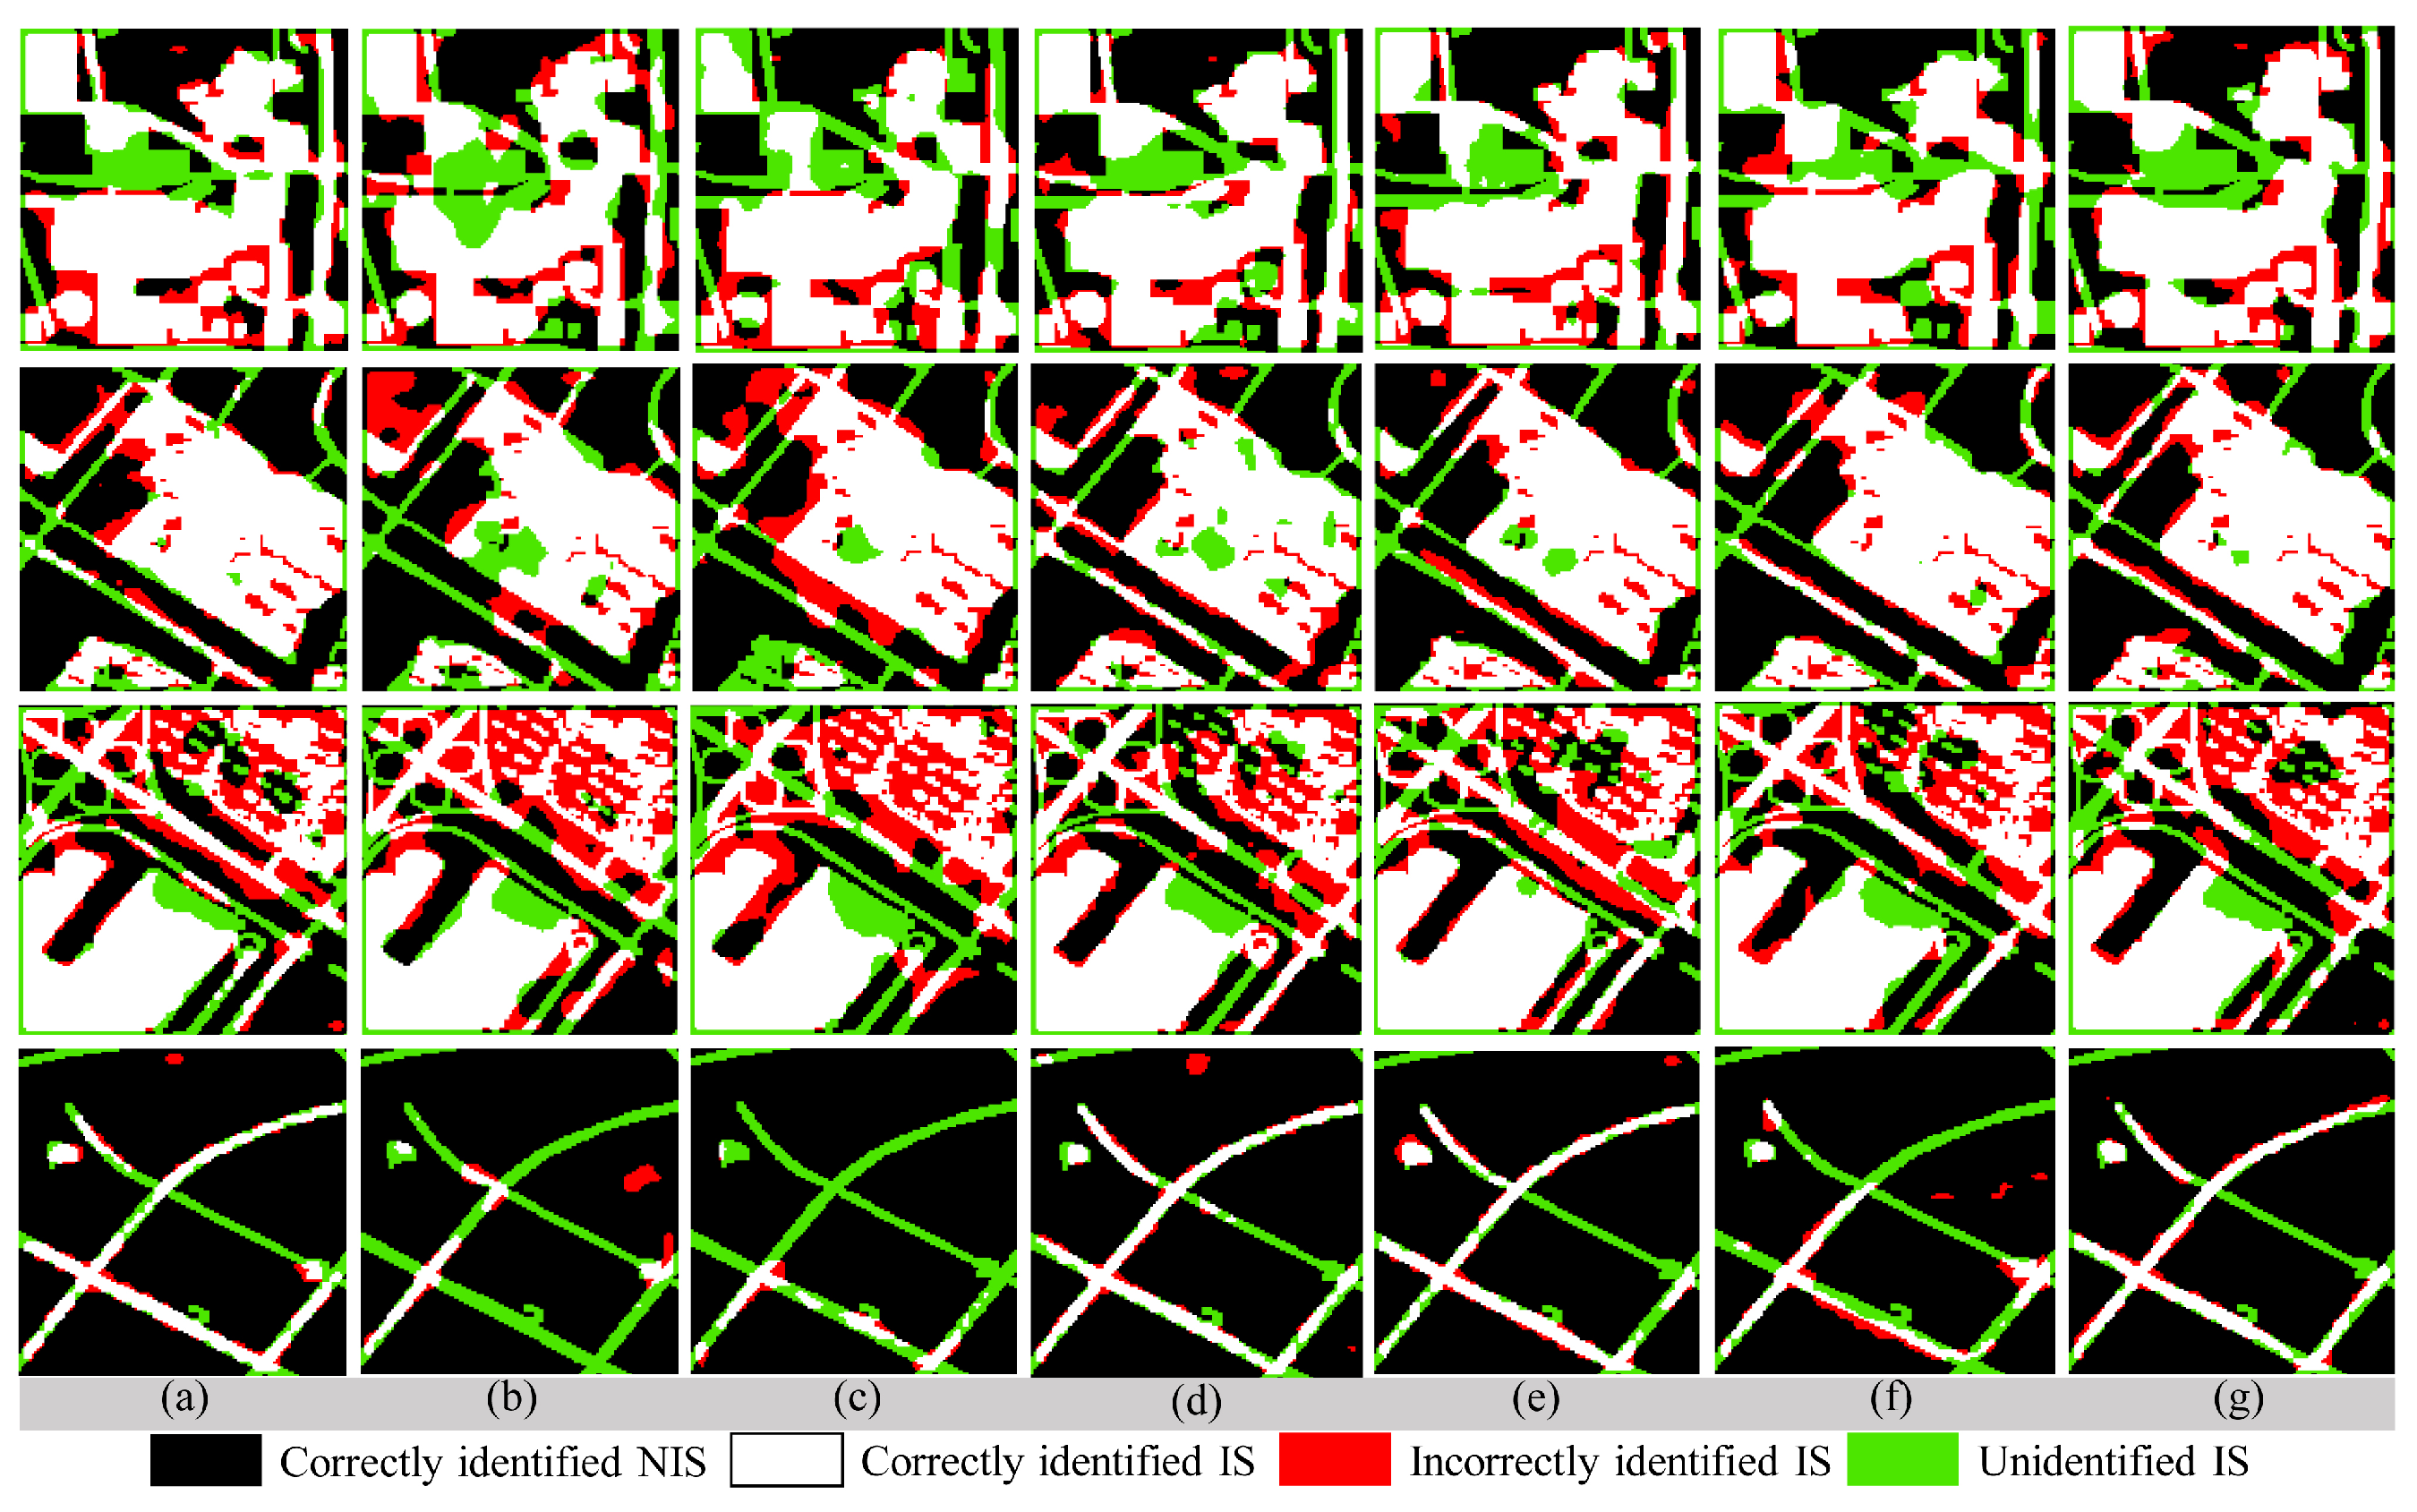
Figure 9 shows the extraction results for impervious surfaces of UNet with different features as inputs in four different scenarios. Visually, the results of Figure 9a,d,e,g are good, but the results of Figure 9b,c,f are poor, and their phenomena of the incorrect extraction (red area) and missed extraction (green areas) are obvious. Compared with using a single feature, the incorrect and missed areas were significantly reduced after adding features, and the areas caught by the additional features were mainly located at the edges of ground objects and the road area. Through careful comparison, it was found that the result of Figure 9g is the best, and some small roads and edges of ground objects were correctly extracted, as shown in the viaduct in the third row of Figure 9. Figure 10 shows the extraction results of impervious surfaces of Deeplabv3+ based on various features in four different scenarios. Similarly, the extraction results in Figure 10a,d,e,g are better than those in Figure 10b,c,f. However, it is difficult to judge the differences in the extraction results in Figure 10a,d,e,g only through visual interpretation. Additionally, Figure 11 shows the impervious surface extraction results of HRNet based on different features in four different scenarios. As shown in Figure 9 and Figure 10, the results of impervious surface extraction in Figure 11a,d,e,g are similar and better than those in Figure 11b,c,f. The qualitative results of impervious surface extraction shown in Figure 9, Figure 10 and Figure 11 are consistent with the quantitative results shown in Table 7, Table 8 and Table 9.
Through the above quantitative and qualitative analysis of the impervious surface extraction results of different models, we can draw the following conclusions: Firstly, for the impervious surface extraction, compared with the coherence and polarization features, the intensity is the most useful feature in SAR images, and the role of polarization features is limited. Secondly, compared with single feature, multi-feature integration can improve the extraction accuracy for impervious surfaces to some extent in most cases, but it is unstable, depending on the urban impervious surface extraction model used. Thirdly, through the combination of multiple features, the extraction accuracy based on the combination of intensity and coherence features is usually high and stable.

4.4. Comparison of Impervious Surface Results Extracted from Different Models

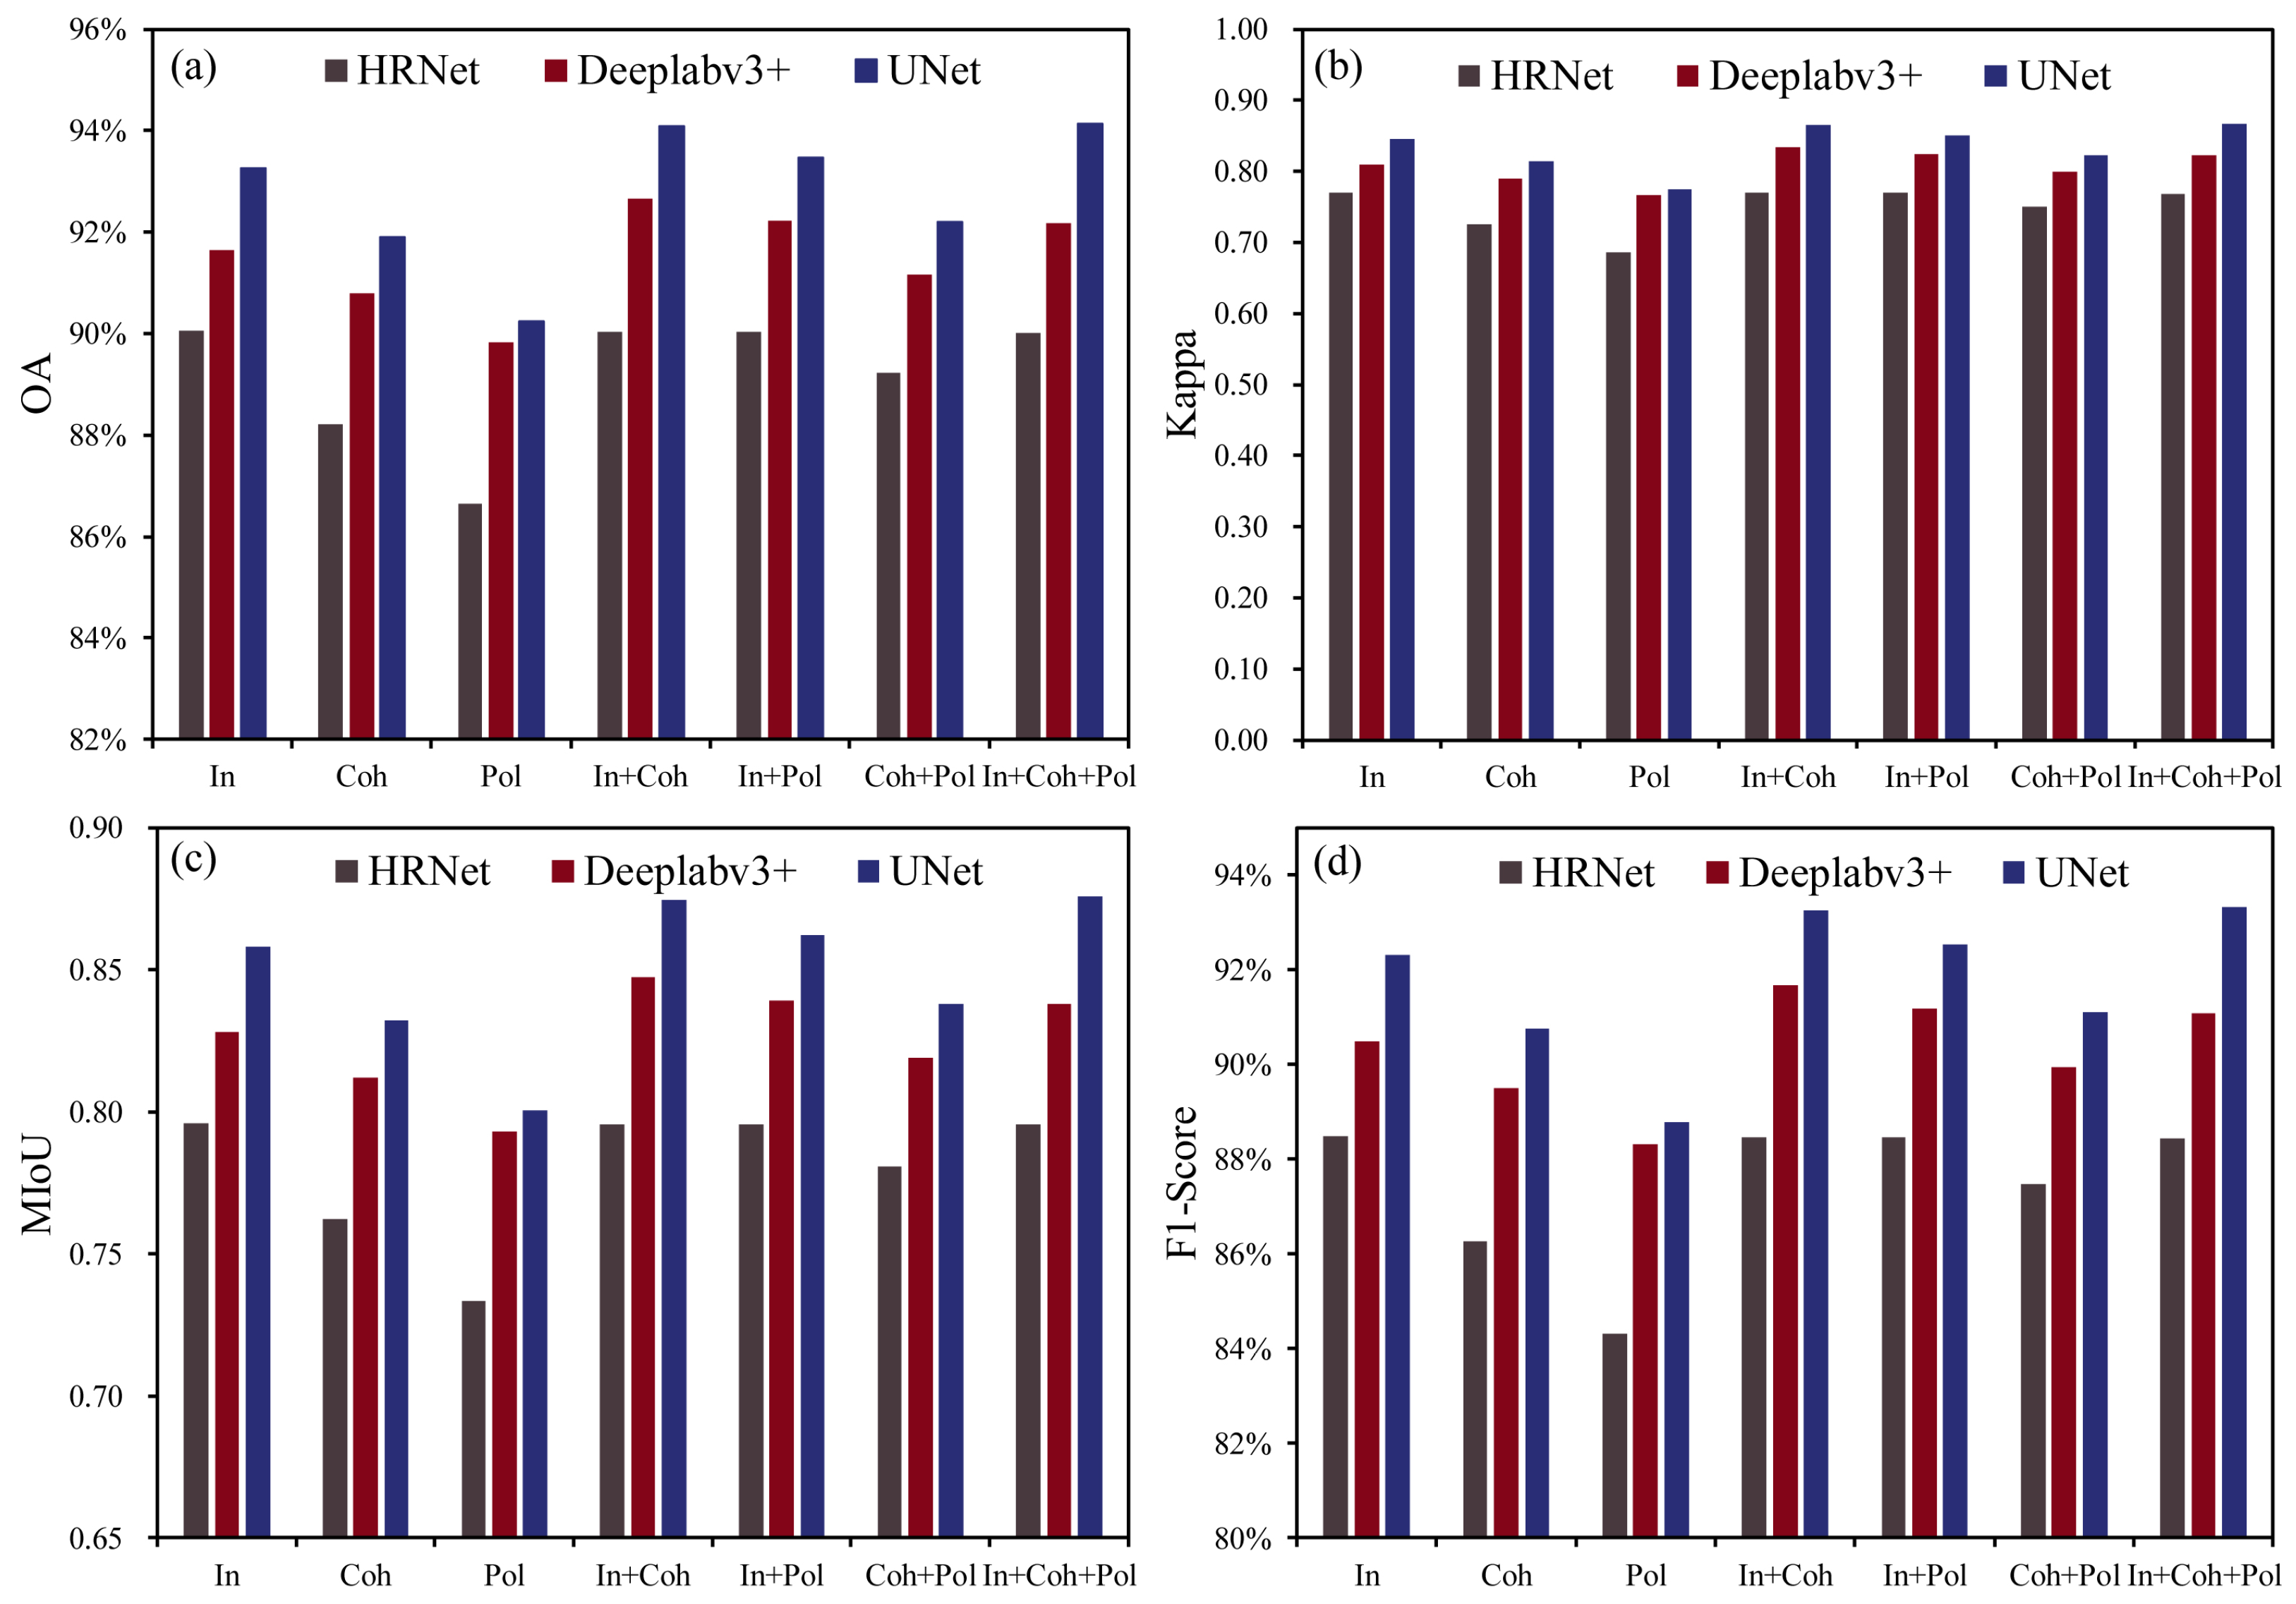
The model is also a key factor affecting the accuracy for impervious surface extraction. For this reason, this section compares the impervious surface extraction accuracies of UNet, Deeplabv3+, and HRNet based on different features. Figure 12 shows the comparison of the OA, kappa, MIoU, and F1-score of UNet, Deeplabv3+, and HRNet models. It can be seen that among the three models, the extraction accuracy of UNet is the highest, followed by Deeplabv3+ and HRNet. However, when the polarization features are taken as the input of the model, the extraction accuracy of Deeplabv3+ is similar to that of UNet. The maximum differences in the OAs, kappa coefficients, MIoUs, and F1-scores of UNet, Deeplabv3+, and HRNet reached 3.17%, 0.0975, 0.0596, and 0.0323, respectively. The structures of UNet, Deepalabv3+, and HRNet are the main reason for this difference. UNet extracts multi-scale features from low level to high level through continuous down sampling in the encoder, and then restores the resolution of feature maps to the same as the original image through up sampling in the decoder. The encoder and decoder are connected by skip connection. This structure enables UNet to fully learn features of different scales and integrates the low-level location information with the high-level semantic information, which is very beneficial to the semantic segmentation task. Although Deeplabv3+ also has an encoder–decoder structure, it only performs multi-scale features extraction on the high-level features output by the deep convolution neural network, and there is only one connection between the encoder and decoder, which makes the fusion between low-level and high-level features insufficient. Therefore, its semantic segmentation result is worse than that of UNet. Although HRNet can maintain high-resolution output through parallelism, its low-resolution branches are not deep enough, which limits the semantic capabilities of the network. Due to the significant increase in computing costs, it is not advisable to adopt a deeper network in the last two stages of HRNet. Therefore, combining the most advantageous features of SAR images and developing more advanced models are important ways to improve the accuracy for impervious surface extraction.

5. Discussion

This section first discusses the models’ transfer capabilities for SAR images in two dimensions, time and space, and then analyzes the limitations of impervious surface extraction based on SAR images and gives a reference solution.

5.1. The Spatial and Temporal Transfer Capabilities of the Models

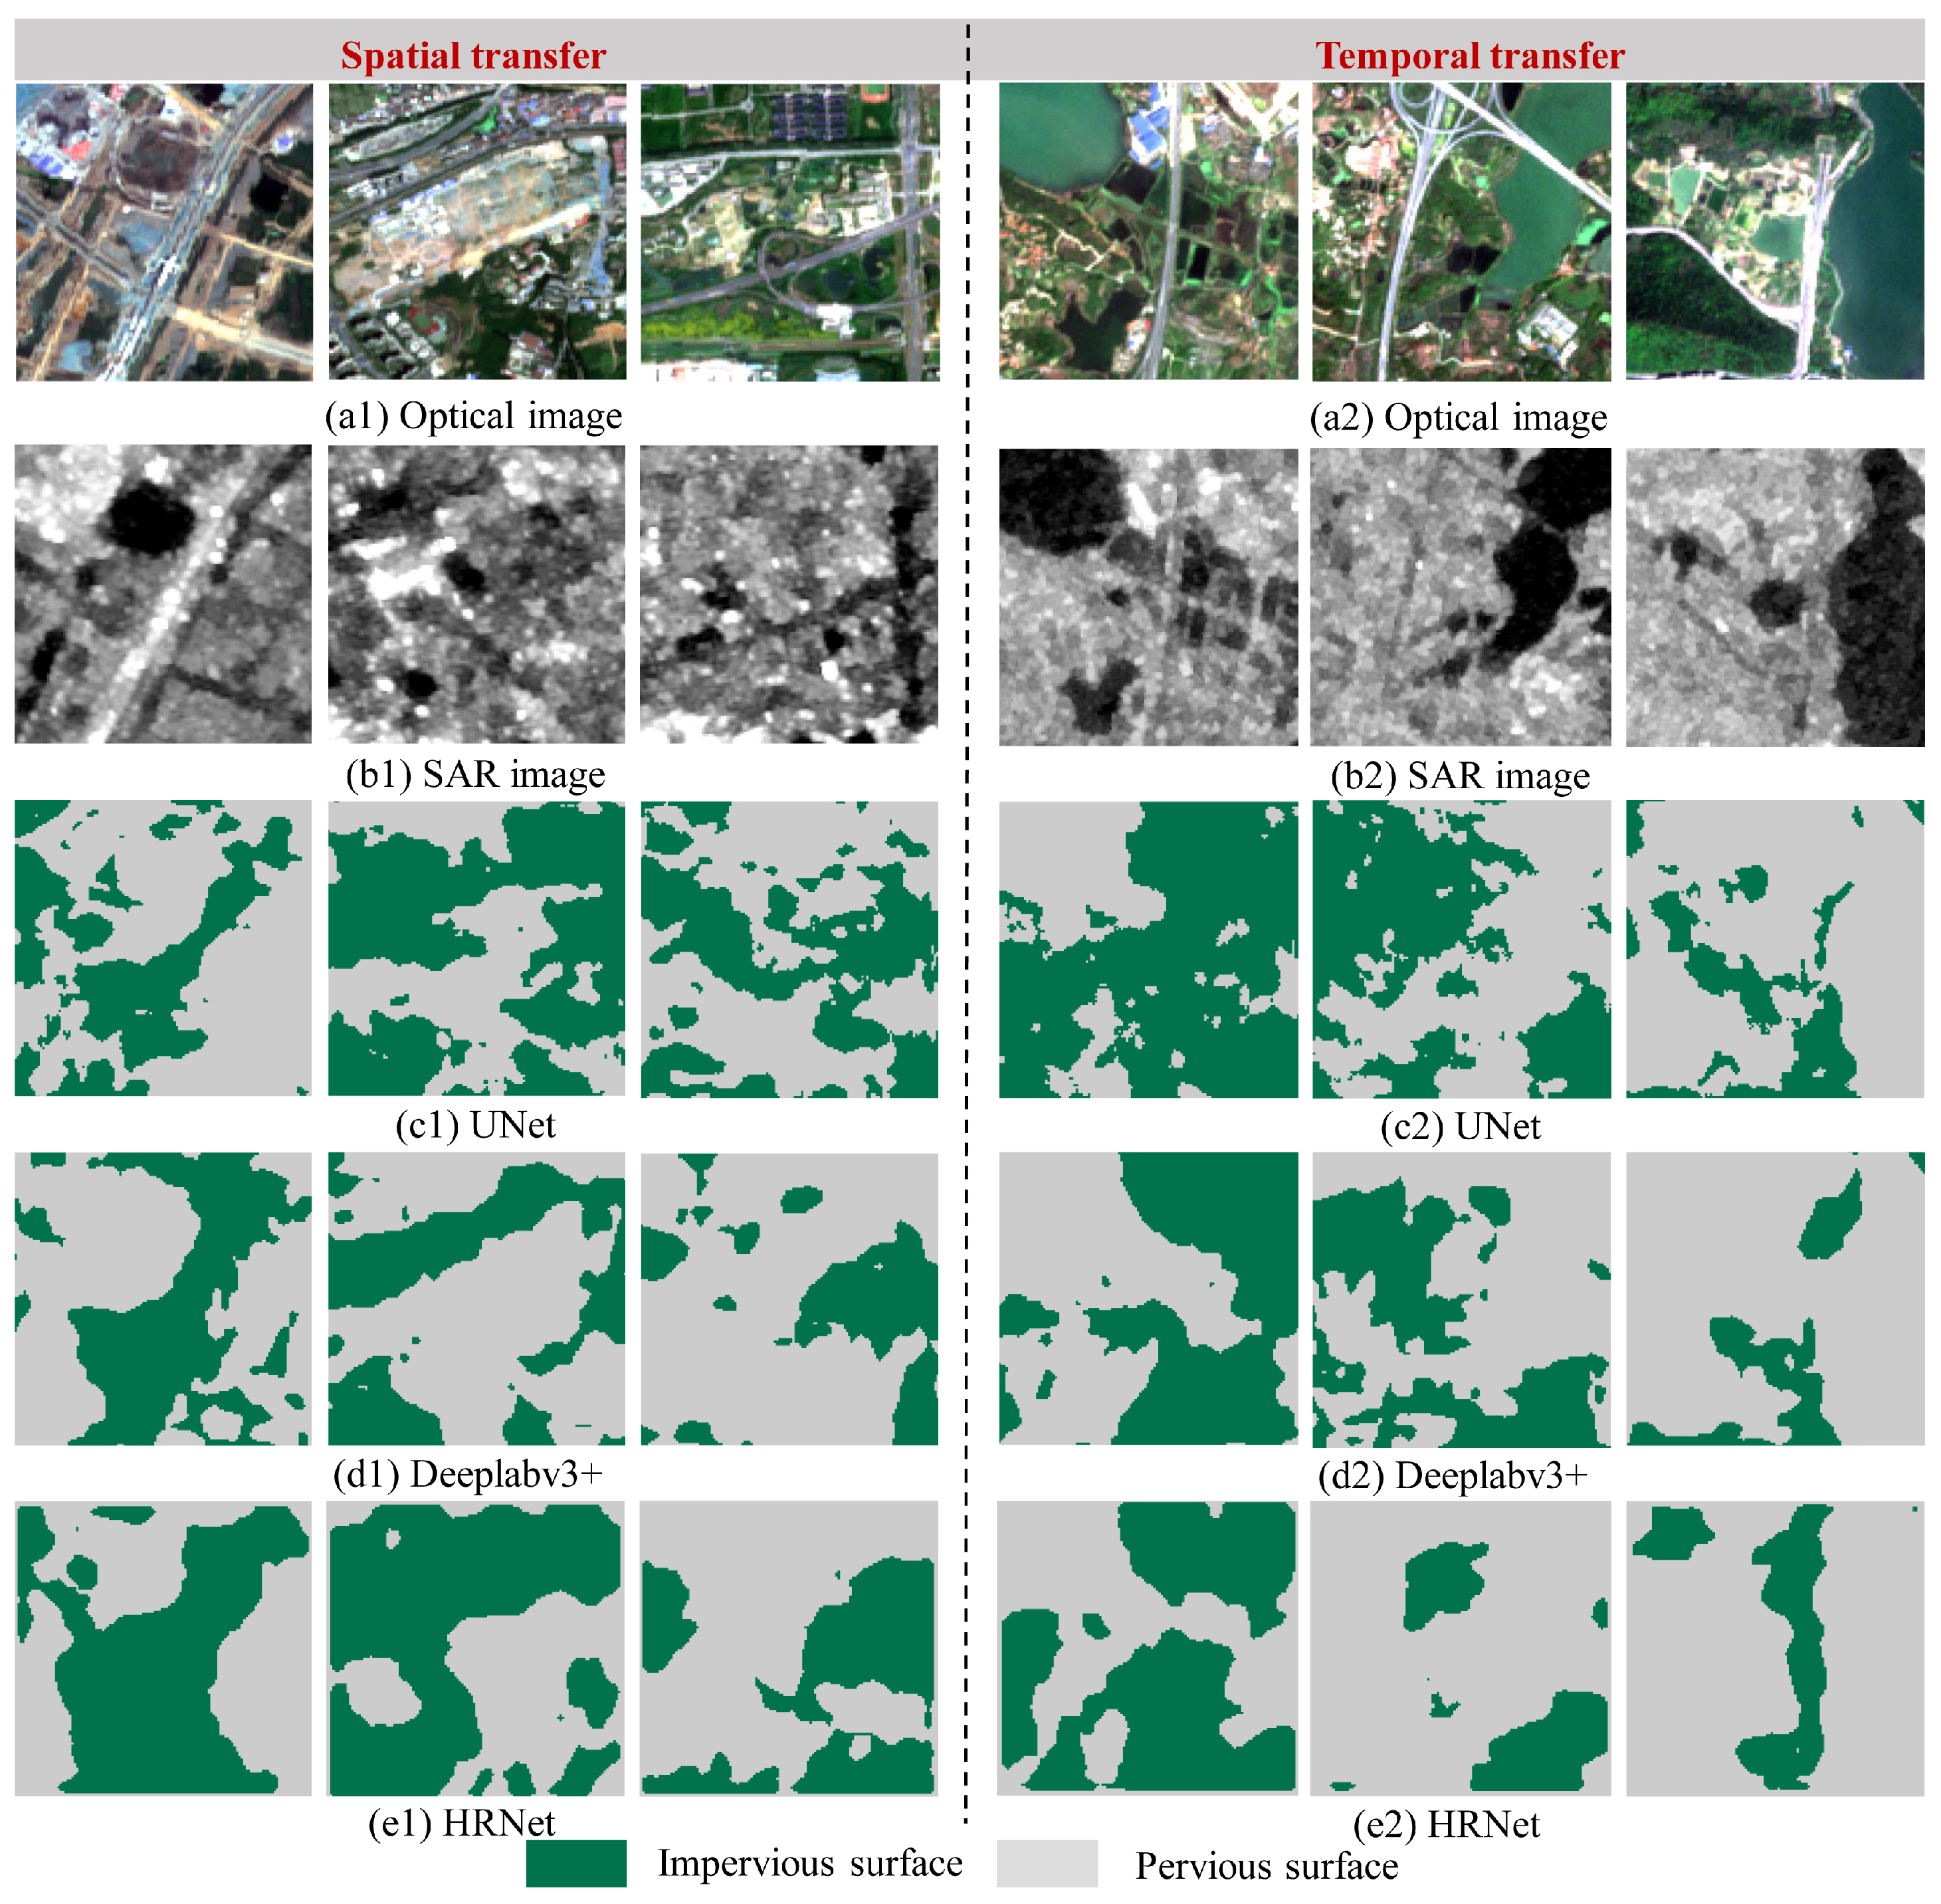
The generalization abilities of deep learning models have been concerns and puzzles for academia and industry. Therefore, this section discusses the transfer capabilities of UNet, Deeplabv3+, and HRNet for the time and space dimensions when SAR images are used as model inputs. In the model temporal transfer experiment, the Sentinel-1 dual-polarization SLC images obtained on 3 March 2020 and 15 March 2020 covering the Wuhan area were used as the data source. In the model spatial transfer experiment, the Sentinel-1 dual-polarization SLC images obtained on 10 June 2019 and 22 June 2019 covering the Nanjing area were used as the data source. The data preprocessing was conducted according to Section 3.1 of this study. In the temporal and spatial transfer experiments of the model, the combination of intensity, coherence, and polarization features was used as the input for the model to extract impervious surfaces. Due to the lack of corresponding ground truth for impervious surfaces, we qualitatively evaluated the spatial and temporal transfer capabilities of the models by visual comparison with the optical images. Figure 13 shows the partial impervious surface results of Wuhan in 2020 and Nanjing in 2019 extracted from the three models. It can be seen that the impervious surface results extracted from the three models are relatively rough, and there are obvious phenomena of incorrect and missing extractions of impervious surfaces. Among the three models, the spatial and temporal transfer capacity of UNet is the best, followed by Deeplabv3+ and HRNet. The experimental results show that the spatial and temporal transfer capabilities of the models cannot meet the application requirements.
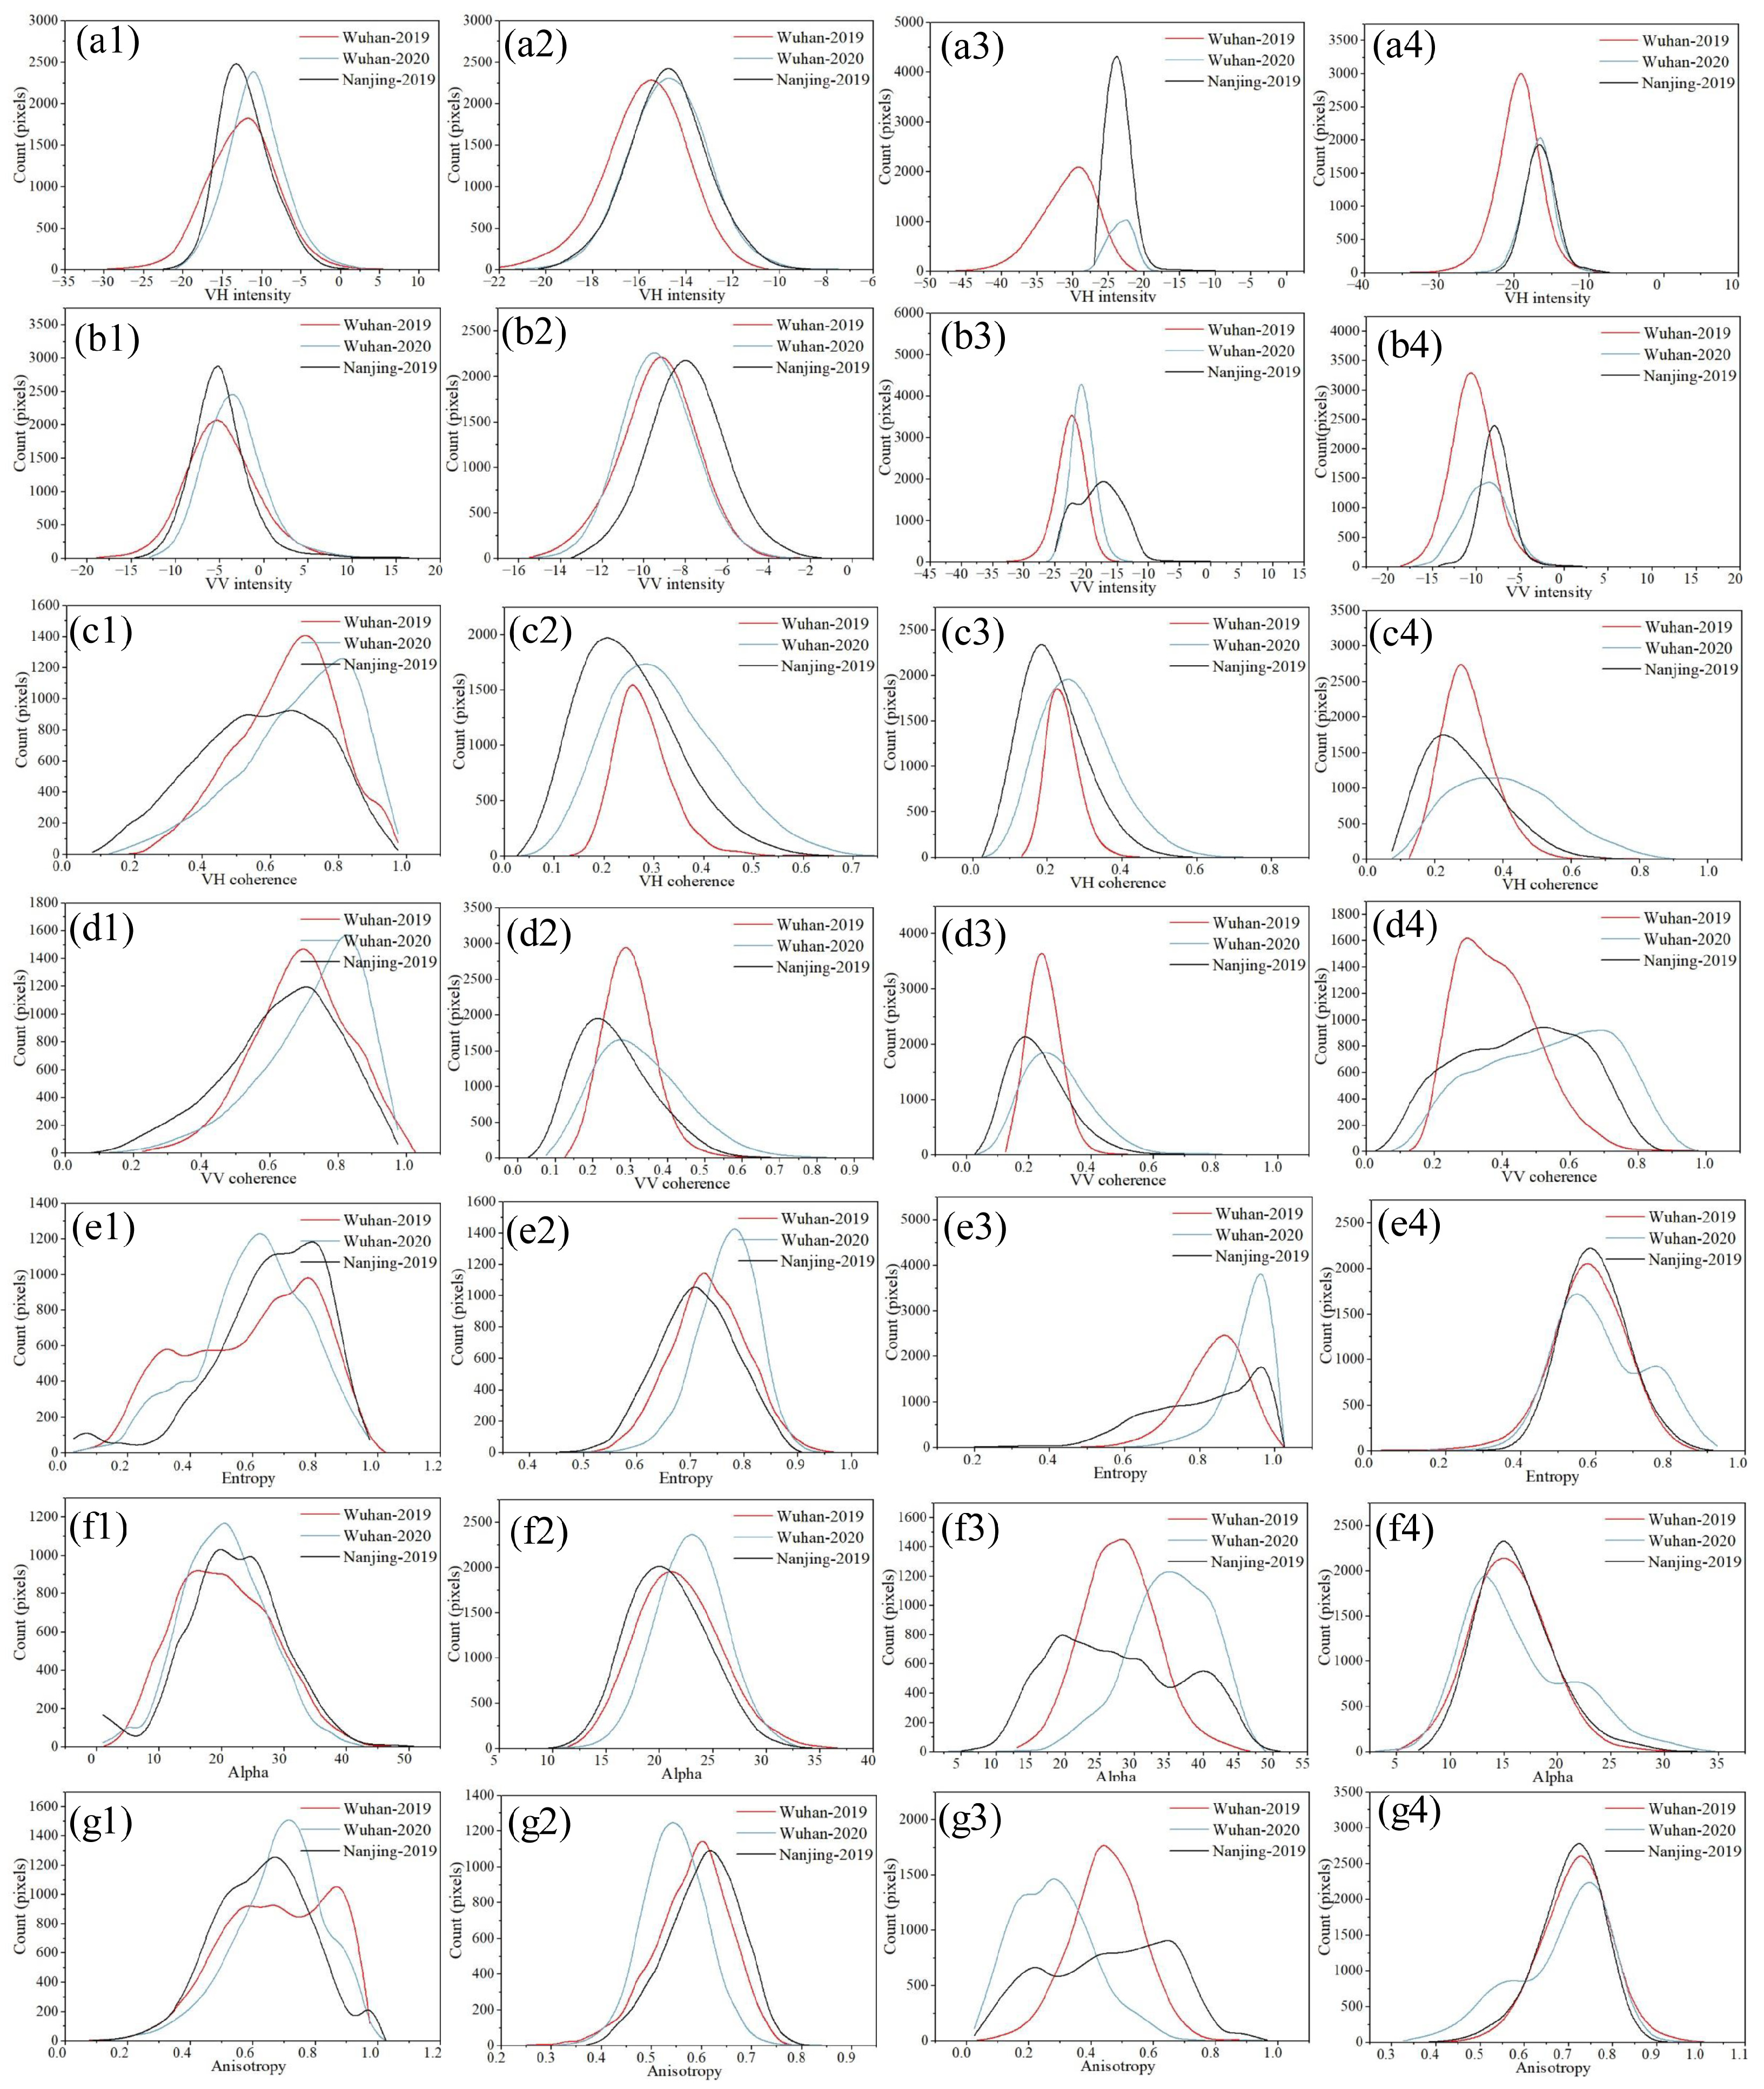
In order to try to explain the reason for the poor spatial and temporal transfer ability of UNet, Deeplabv3+, and HRNet in this study, we selected 10,000 sample points from the SAR images covering Wuhan in 2019, Wuhan in 2020, and Nanjing in 2019 to analyze the distribution differences in SAR features among impervious surfaces, vegetation, water bodies, and bare soils. The results are shown in Figure 14. It can be seen that the distributions of intensity, coherence, and polarization features for the same kind of ground object in different dimensions of time and space are obviously different. Therefore, if SAR data that are different in time and space are directly input into the trained model to extract impervious surfaces, the accuracy will inevitably be poor and cannot meet the application requirements. In order to enable the model to have a better transfer capability and obtain satisfactory impervious surface extraction results, it is necessary to conduct some processing on the data of target domain and source domain to reduce the differences between them.

5.2. Limitations of Extracting Impervious Surfaces Based on SAR Images

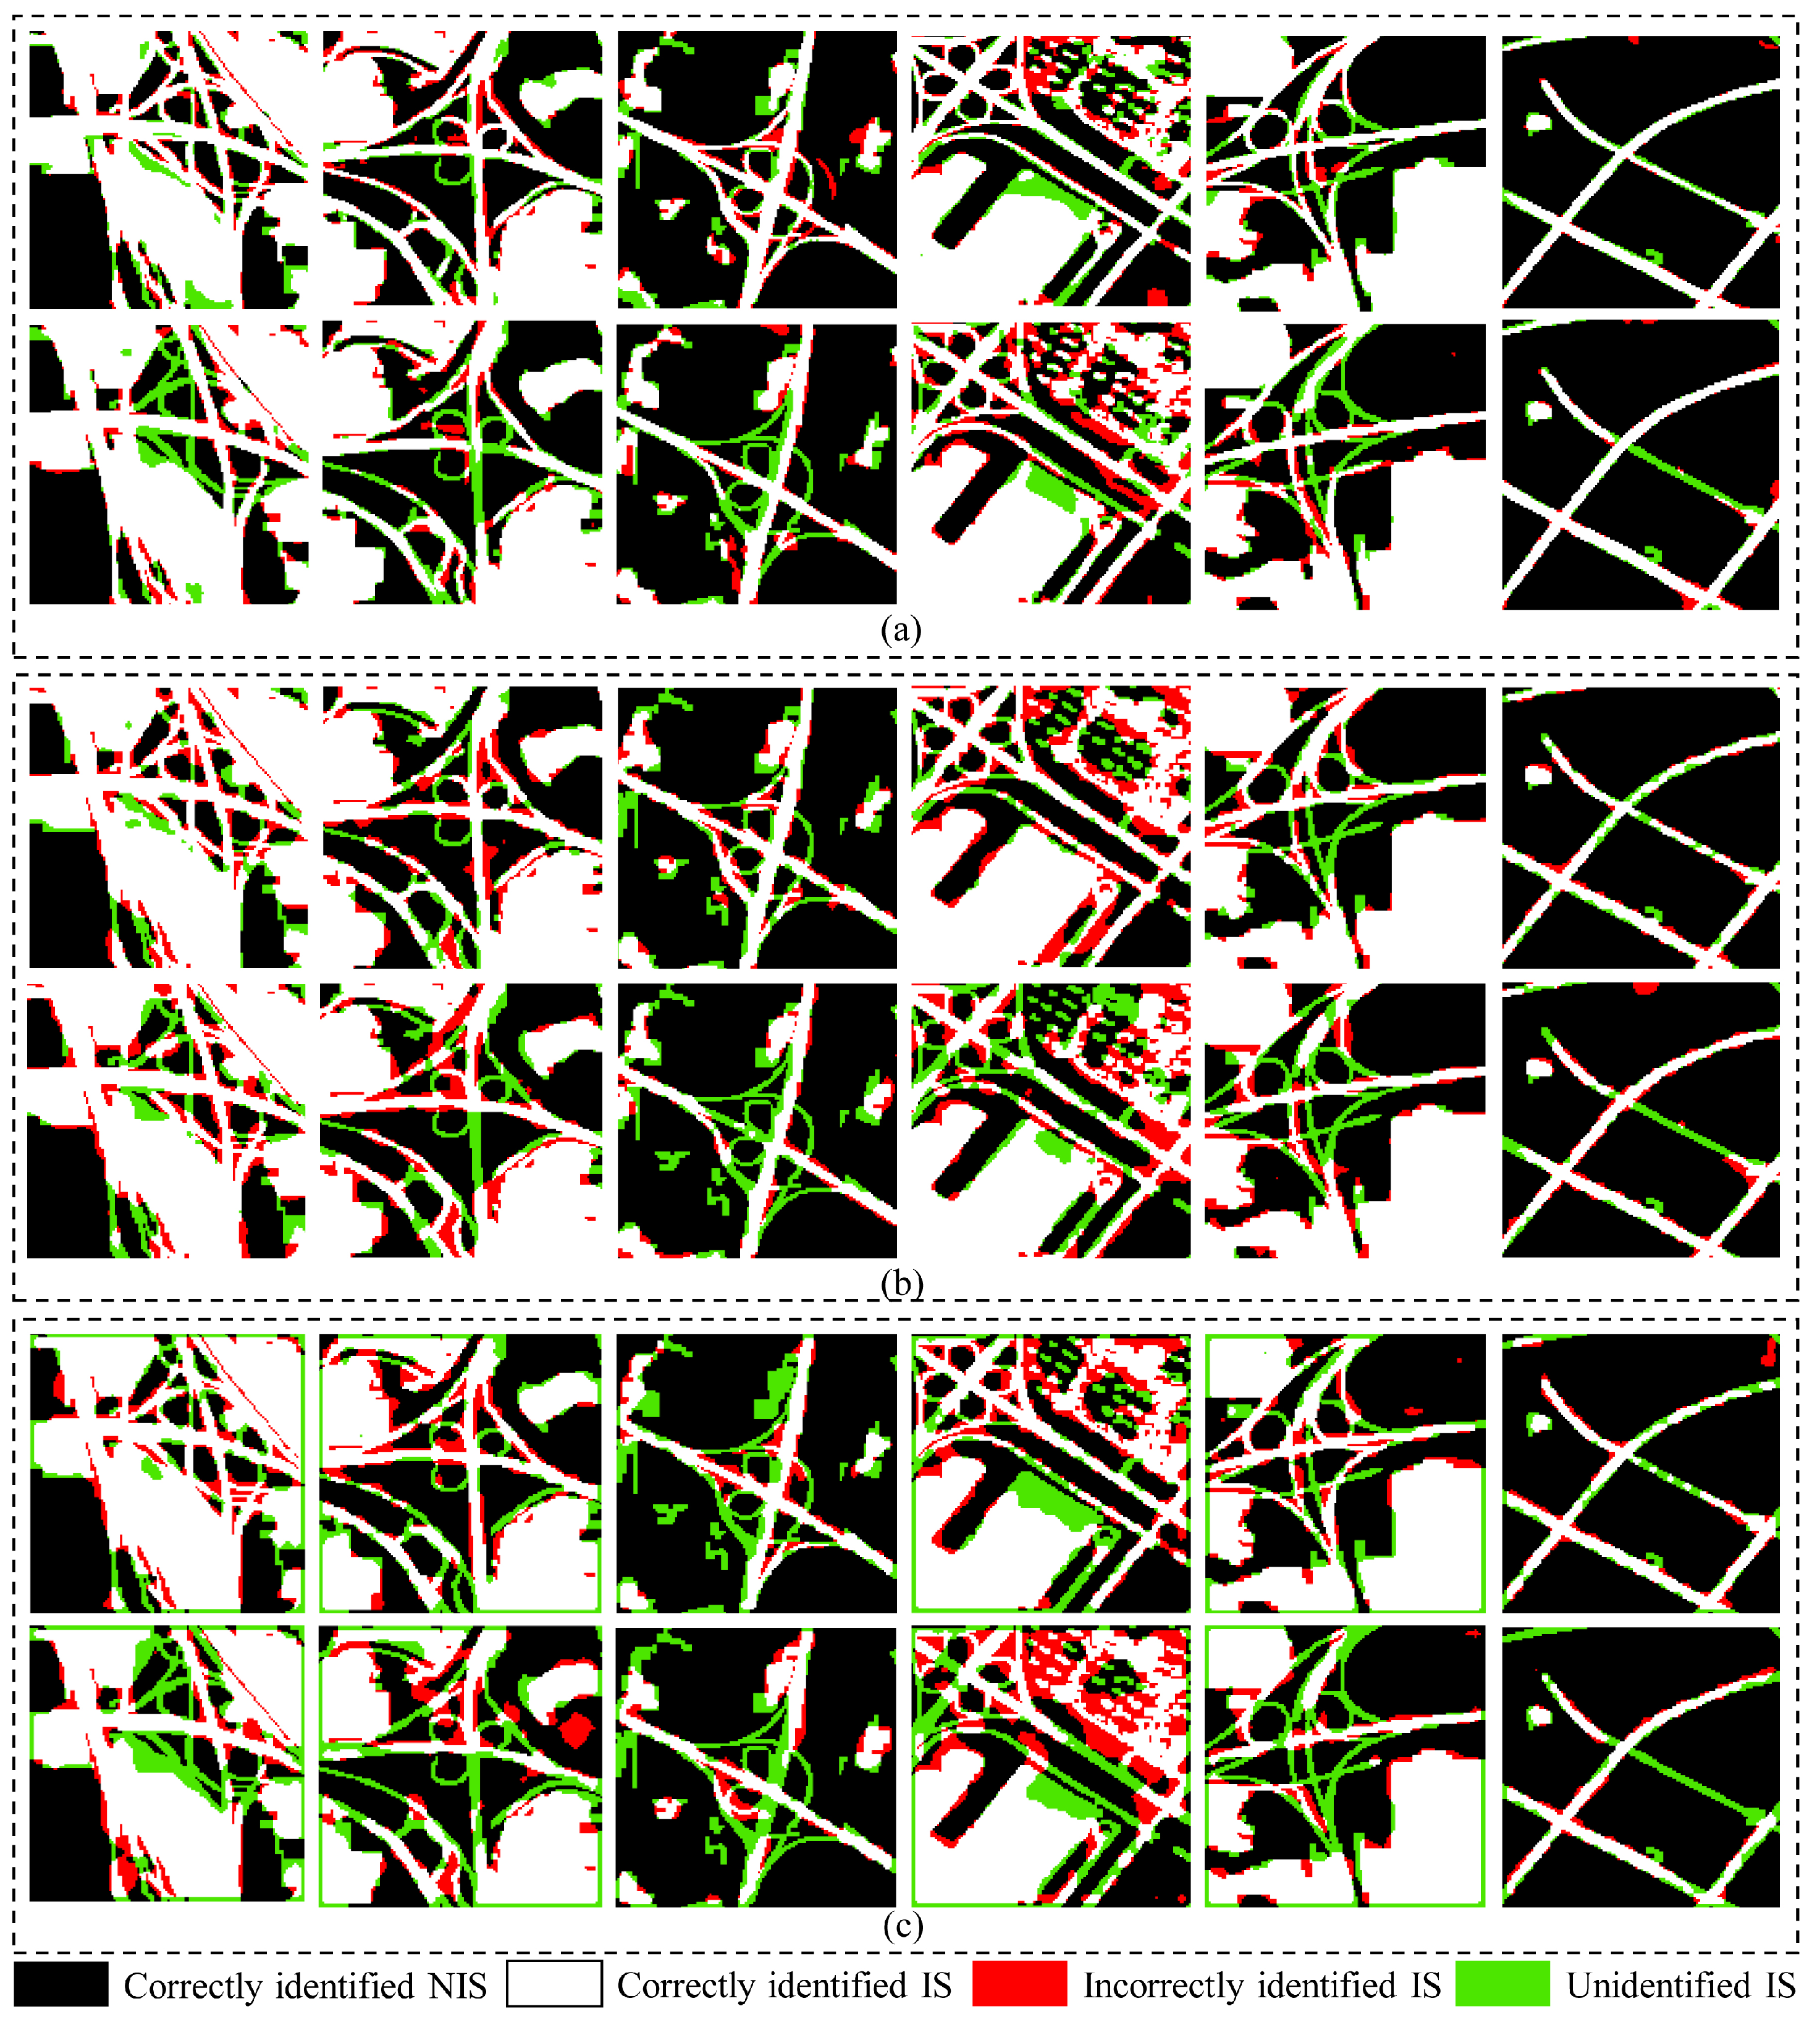
According to the impervious surface results of UNet, Deeplabv3+, and HRNet shown in Figure 9, Figure 10 and Figure 11, a considerable portion of the incorrect and missed impervious surface extraction areas are located at the edges of ground objects and roads. The main reason is that, limited by the imaging mechanism and spatial resolution, the inherent speckle noise in SAR images makes the edges of ground objects blurred, making some edges and roads not well detected. The low extraction accuracy for impervious surfaces is caused by the quality of data sources. Therefore, it is challenging to improve the extraction accuracy by improving the model. Relatively speaking, it may be more concise and effective to improve the extraction accuracy for impervious surfaces by adding appropriate auxiliary data for specific problems. To this end, this section proves the effectiveness of this method through the addition of free OpenStreetMap (OSM) road network data on the basis of SAR data. Since the OSM road network data are vector data, we first converted them into raster data with the same spatial resolution as the SAR image, and then input them with the SAR image (including intensity, coherence, and polarization features) into UNet, Deeplabv3+, and HRNet models to extract impervious surfaces. Figure 15 shows the extraction results of impervious surfaces of the three models before and after adding the OSM road network data. It can be seen that after adding the OSM road network data, each model significantly improved the extraction accuracy for impervious surfaces, and the misclassification and omission in edge areas of ground objects were also significantly reduced. In order to quantitatively show the improvement in the impervious surface extraction of models after adding OSM road network data, Table 10 shows the extraction accuracy for impervious surfaces of each model after adding the OSM road network data. By comparing Table 10 with Table 7, Table 8 and Table 9, one can see that after using the OSM road network data, the OA, kappa, MIoU, and F1-score of UNet were increased by 0.16%, 0.0034, 0.0029, and 0.0017, respectively. The OA, kappa, MIoU, and F1-score of Deeplabv3+ were increased by 0.86%, 0.0198, 0.0165, and 0.0099, respectively. Additionally, the OA, kappa, MIoU, and F1-score of HRNet were increased by 0.7%, 0.0164, 0.0129, and 0.0082, respectively. Based on the above qualitative and quantitative results, the addition of OSM road network data can improve the accuracy for impervious surface extraction of the model, which shows that adding auxiliary data is a simple and effective way to improve the accuracy for impervious surface extraction.

6. Conclusions

Urban impervious surface area has become an important indicator for measuring the quality of an urban ecological environment. Due to the limitations of climatic conditions, it is very difficult to use optical remote sensing images alone to achieve seamless, impervious spatio-temporal surface monitoring in large regions, especially in the cloudy and rainy subtropical regions. Synthetic aperture radar (SAR) is an active sensor which is very suitable for monitoring the impervious surfaces in such areas. As a more advanced and complex SAR imaging mode, polarimetric SAR contains more scattering information of ground objects. However, the modern studies on impervious surface extraction using SAR data mainly focused on the use of SAR image intensity or amplitude information, and rarely on the use of phase and polarization information. Additionally, regarding deep learning, there has been little research on the performances of SAR image intensity, coherence, and polarization features and their integration in impervious surface extraction. Therefore, we used Sentinel-1 dual-polarization data as the data source to extract the intensity, coherence, and polarization features, and input them into UNet, Deeplabv3+, and HRNet to discuss the performance of each feature in the extraction of impervious surfaces. The experimental results show that among intensity, coherence, and polarization, intensity is the most useful feature for the extraction of impervious surfaces based on SAR images. Additionally, in most cases, the extraction accuracy for impervious surfaces when using multi-feature integration is improved compared with that based on a single feature, and the extraction accuracy for impervious surfaces based on the combination of intensity and coherence is significantly improved and more stable. In addition, we also analyzed the limitations of extracting urban impervious surface based on SAR images, and gave a simple and effective solution. The relevant findings of this study have certain reference significance for the seamless spatio-temporal monitoring of impervious surfaces in large-scale areas, especially in cloudy and rainy areas.
Author Contributions

Data curation, W.W. and S.G.; funding acquisition, Z.S.; methodology, W.W. and Z.S.; supervision, Z.S. and D.L.; validation, W.W.; writing—original draft, W.W.; and writing—review and editing, Z.S. and S.G. All authors have read and agreed to the published version of the manuscript.

Funding

This work was supported in part by the National Natural Science Foundation of China under grant 42090012, the Special Fund of Hubei Luojia Laboratory (220100009), 03 Special Research and 5G Project of Jiangxi Province in China (20212ABC03A09), the Zhuhai Industry University Research Cooperation Project of China (ZH22017001210098PWC), a Key R&D project of the Sichuan ScieNce and Technology Plan (2022YFN0031), and the Zhizhuo Research Fund on Spatial–Temporal Artificial Intelligence (Grant No. ZZJJ202202).

Data Availability Statement

Not applicable.

Acknowledgments

We thank the editor and anonymous reviewers for their constructive comments and suggestions that improved the manuscript.

Conflicts of Interest

The authors declare no conflict of interest.

References

  1. Gong, P.; Li, X.; Wang, J.; Bai, Y.; Chen, B.; Hu, T.; Liu, X.; Xu, B.; Yang, J.; Zhang, W.; et al. Annual maps of global artificial impervious area (GAIA) between 1985 and 2018. Remote Sens. Environ. 2020, 236, 111510. [Google Scholar] [CrossRef]
  2. Lu, D.; Li, G.; Kuang, W.; Moran, E. Methods to extract impervious surface areas from satellite images. Int. J. Digit. Earth 2014, 7, 20. [Google Scholar] [CrossRef]
  3. Weng, Q. Remote sensing of impervious surfaces in the urban areas: Requirements, methods, and trends. Remote Sens. Environ. 2012, 117, 34–49. [Google Scholar] [CrossRef]
  4. Colglazier, W. Sustainable development agenda: 2030. Science 2015, 349, 1048–1050. [Google Scholar] [CrossRef]
  5. Sun, Z.; Du, W.; Jiang, H.; Weng, Q.; Guo, H.; Han, Y.; Xing, Q.; Ma, Y. Global 10-m impervious surface area mapping: A big earth data based extraction and updating approach. Int. J. Appl. Earth Obs. Geoinf. 2022, 109, 102800. [Google Scholar] [CrossRef]
  6. Kumar, D.; Misra, M.; Shekhar, S. Assessing Machine Learning Based Supervised Classifiers For Built-Up Impervious Surface Area Extraction From Sentinel-2 Images. Urban For. Urban Green. 2020, 53, 126714. [Google Scholar]
  7. Huang, X.; Jiayi, L.I.; Yang, J.; Zhang, Z.; Dongrui, L.I.; Liu, X. 30m global impervious surface area dynamics and urban expansion pattern observed by Landsat satellites: From 1972 to 2019. Sci. China Earth Sci. 2021, 64, 12. [Google Scholar] [CrossRef]
  8. Chong, L.; Qi, Z.C.; Hui, L.D.; Sqa, B.; Ste, F.; Hx, G.; Yuan, Y.H. An efficient approach to capture continuous impervious surface dynamics using spatial-temporal rules and dense Landsat time series stacks. Remote Sens. Environ. 2019, 229, 114–132. [Google Scholar]
  9. Liu, X.; Huang, Y.; Xu, X.; Li, X.; Li, X.; Ciais, P.; Lin, P.; Gong, K.; Ziegler, A.D.; Chen, A.; et al. High-spatiotemporal-resolution mapping of global urban change from 1985 to 2015. Nat. Sustain. 2020, 3, 564–570. [Google Scholar] [CrossRef]
  10. Guo, H.; Yang, H.; Sun, Z.; Li, X.; Wang, C. Synergistic use of optical and PolSAR imagery for urban impervious surface estimation. Photogramm. Eng. Remote Sens. 2014, 80, 91–102. [Google Scholar] [CrossRef]
  11. Zhang, H.; Lin, H.; Wang, Y. A new scheme for urban impervious surface classification from SAR images. ISPRS J. Photogramm. Remote Sens. 2018, 139, 103–118. [Google Scholar] [CrossRef]
  12. Ban, Y.; Jacob, A.; Gamba, P. Spaceborne SAR data for global urban mapping at 30 m resolution using a robust urban extractor. ISPRS J. Photogramm. Remote Sens. 2015, 103, 28–37. [Google Scholar] [CrossRef]
  13. Attarchi, S. Extracting impervious surfaces from full polarimetric SAR images in different urban areas. Int. J. Remote Sens. 2020, 41, 4644–4663. [Google Scholar] [CrossRef]
  14. Jiang, M.; Yong, B.; Tian, X.; Malhotra, R.; Hu, R.; Li, Z.; Yu, Z.; Zhang, X. The potential of more accurate InSAR covariance matrix estimation for land cover mapping. ISPRS J. Photogramm. Remote Sens. 2017, 126, 120–128. [Google Scholar] [CrossRef]
  15. Sica, F.; Pulella, A.; Nannini, M.; Pinheiro, M.; Rizzoli, P. Repeat-pass SAR interferometry for land cover classification: A methodology using Sentinel-1 Short-Time-Series. Remote Sens. Environ. 2019, 232, 111277. [Google Scholar] [CrossRef]
  16. Zhang, H.; Wan, L.; Wang, T.; Lin, Y.; Lin, H.; Zheng, Z. Impervious surface estimation from optical and polarimetric SAR data using small-patched deep convolutional networks: A comparative study. IEEE J. Sel. Top. Appl. Earth Obs. Remote Sens. 2019, 12, 2374–2387. [Google Scholar] [CrossRef]
  17. Wang, Y.; Li, M. Urban impervious surface detection from remote sensing images: A review of the methods and challenges. IEEE Geosci. Remote Sens. Mag. 2019, 7, 64–93. [Google Scholar] [CrossRef]
  18. Wu, F.; Wang, C.; Zhang, H.; Li, J.; Li, L.; Chen, W.; Zhang, B. Built-up area mapping in China from GF-3 SAR imagery based on the framework of deep learning. Remote Sens. Environ. 2021, 262, 112515. [Google Scholar] [CrossRef]
  19. Hafner, S.; Ban, Y.; Nascetti, A. Unsupervised domain adaptation for global urban extraction using Sentinel-1 SAR and Sentinel-2 MSI data. Remote Sens. Environ. 2022, 280, 113192. [Google Scholar] [CrossRef]
  20. Xiang, D.; Tang, T.; Ban, Y.; Su, Y.; Kuang, G. Unsupervised polarimetric SAR urban area classification based on model-based decomposition with cross scattering. ISPRS J. Photogramm. Remote Sens. 2016, 116, 86–100. [Google Scholar] [CrossRef]
  21. Torres, R.; Snoeij, P.; Geudtner, D.; Bibby, D.; Davidson, M.; Attema, E.; Potin, P.; Rommen, B.; Floury, N.; Brown, M.; et al. GMES Sentinel-1 mission. Remote Sens. Environ. 2012, 120, 9–24. [Google Scholar] [CrossRef]
  22. Ferretti, A.; Prati, C.; Rocca, F. Multibaseline InSAR DEM reconstruction: The wavelet approach. IEEE Trans. Geosci. Remote Sens. 1999, 37, 705–715. [Google Scholar] [CrossRef]
  23. Wright, T.J.; Parsons, B.E.; Lu, Z. Toward mapping surface deformation in three dimensions using InSAR. Geophys. Res. Lett. 2004, 31. [Google Scholar] [CrossRef] [Green Version]
  24. Schneider, R.Z.; Papathanassiou, K.P.; Hajnsek, I.; Moreira, A. Polarimetric and Interferometric Characterization of Coherent Scatterers in Urban Areas. IEEE Trans. Geosci. Remote Sens. 2006, 44, 971–984. [Google Scholar] [CrossRef]
  25. Mohammadimanesh, F.; Salehi, B.; Mahdianpari, M.; Brisco, B.; Motagh, M. Multi-temporal, multi-frequency, and multi-polarization coherence and SAR backscatter analysis of wetlands. ISPRS J. Photogramm. Remote Sens. 2018, 142, 78–93. [Google Scholar] [CrossRef]
  26. Paquay, M.; Iriarte, J.C.; Ederra, I.; Gonzalo, R.; de Maagt, P. Thin AMC structure for radar cross-section reduction. IEEE Trans. Antennas Propag. 2007, 55, 3630–3638. [Google Scholar] [CrossRef]
  27. Lee, J.S.; Pottier, E. Polarimetric Radar Imaging: From Basics to Applications.; CRC Press: Boca Raton, FL, USA, 2009. [Google Scholar]
  28. Cloude, S.R. Target decomposition theorems in radar scattering. Electron. Lett. 1985, 21, 22–24. [Google Scholar] [CrossRef]
  29. Touzi, R. Target Scattering Decomposition in Terms of Roll-Invariant Target Parameters. IEEE Trans. Geosci. Remote Sens. 2006, 45, 73–84. [Google Scholar] [CrossRef]
  30. Cloude, S.R.; Pottier, E. An entropy based classification scheme for land applications of polarimetric SAR. IEEE Trans. Geosci. Remote Sens. 1997, 35, 68–78. [Google Scholar] [CrossRef]
  31. Singha, S.; Johansson, A.M.; Doulgeris, A.P. Robustness of SAR sea ice type classification across incidence angles and seasons at L-band. IEEE Trans. Geosci. Remote Sens. 2020, 59, 9941–9952. [Google Scholar] [CrossRef]
  32. Ronneberger, O.; Fischer, P.; Brox, T. U-net: Convolutional networks for biomedical image segmentation. In Proceedings of the International Conference on Medical Image Computing and Computer-Assisted Intervention, Munich, Germany, 5–9 October 2015; Springer: Berlin/Heidelberg, Germany, 2015; pp. 234–241. [Google Scholar]
  33. Chen, L.C.; Zhu, Y.; Papandreou, G.; Schroff, F.; Adam, H. Encoder-decoder with atrous separable convolution for semantic image segmentation. In Proceedings of the European Conference on Computer Vision (ECCV), Munich, Germany, 8–14 September 2018; pp. 801–818. [Google Scholar]
  34. Sun, K.; Xiao, B.; Liu, D.; Wang, J. Deep high-resolution representation learning for human pose estimation. In Proceedings of the IEEE/CVF Conference on Computer Vision and Pattern Recognition, Long Beach, CA, USA, 15–20 June 2019; pp. 5693–5703. [Google Scholar]
Figure 1. Visualization results of intensity, coherence, and polarization features of ground objects. (a) VH intensity, (b) VH coherence, (c) polarimetric entropy H, (d) mean scattering angle Alpha, (e) polarimetric anisotropy A, and (f) the ground truth of impervious surfaces.
Remotesensing 15 01431 g001
Figure 2. The overall framework of this study.
Remotesensing 15 01431 g002
Figure 3. The basic structure of UNet [32].
Remotesensing 15 01431 g003
Figure 4. The basic structure of Deeplabv3+ [33].
Remotesensing 15 01431 g004
Figure 5. The basic architecture of HRNet [34].
Remotesensing 15 01431 g005
Figure 6. Differences of the intensity and coherence characteristics between impervious surfaces and other ground objects. (ad) Differences between impervious surfaces and other ground objects based on VH intensity, VV intensity, VH coherence, and VV coherence.
Remotesensing 15 01431 g006
Figure 7. Qualitative impervious surface extraction results of different polarization channels. (a) Sentinel-2 image. (b) VH intensity image of Sentinel-1. (ce) Impervious surface extraction results of VH polarization, VV polarization, and VH and VV polarization, respectively.
Remotesensing 15 01431 g007
Figure 8. Differences in polarization features between impervious surfaces and other ground objects. (ac) Differences between impervious surfaces and other ground objects based on H, Alpha, and A.
Remotesensing 15 01431 g008
Figure 9. Impervious surface extraction results based on UNet with various features. (ag) Test1–Test7.
Remotesensing 15 01431 g009
Figure 10. Impervious surface extraction results based on Deeplabv3+ with various features. (ag) Test1–Test7.
Remotesensing 15 01431 g010
Figure 11. Impervious surface extraction results based on HRNet with various features. (ag) Test1–Test7.
Remotesensing 15 01431 g011
Figure 12. Comparison of impervious surface extraction accuracies of UNet, Deeplabv3+, and HRNet. (a) OA; (b) Kappa; (c) MIoU; (d) F1-score.
Remotesensing 15 01431 g012
Figure 13. Spatial and temporal transfer results of UNet, Deeplabv3+, and HRNet. (a1e1) Impervious surface extraction results of models spatial transfer. (a2e2) Impervious surface extraction results of models temporal transfer.
Remotesensing 15 01431 g013
Figure 14. Spatial and temporal distribution differences in SAR features of impervious surfaces, vegetation, water bodies, and bare soils. (a1g1) Impervious surfaces, (a2g2) vegetation, (a3g3) water bodies, and (a4g4) bare soils, respectively.
Remotesensing 15 01431 g014
Figure 15. Comparison of impervious surface extraction results of models before and after adding road network data. (ac) The extraction results of impervious surfaces detected by UNet, Deeplabv3+, and HRNet before (the second row) and after (the first row) adding the OSM road network data.
Remotesensing 15 01431 g015
Table 1. Detailed information of the data used in this study.
AttributesSentinel-1
PolarimetricVH, VV
Product typeSLC
Product levelL1
BandC
Acquistion date13 and 25 June 2019
Spatial resolution10 m
Table 2. Split criteria of the H-Alpha plane.
Alpha
H[0, 40] ( 40 , 55 ] ( 55 , 90 ] [0, 40] ( 40 , 50 ] ( 50 , 90 ] [0, 42.5] ( 42.5 , 47.5 ] ( 47.5 , 90 ]
[ 0 , 0.5 ] Z7Z8Z9
[ 0.5 , 0.9 ] Z4Z5Z6
[ 0.9 , 1.0 ] Z1Z2Z3
Table 3. The seven datasets constructed in this study.
DatasetFeatures
D1Intensity
D2Coherence
D3Polarization
D4Intensity + Coherence
D5Intensity + Polarization
D6Coherence + Polarization
D7Intensity + Coherence + Polarization
Table 4. Seven groups of experiments designed in this study.
TestIntensityCoherencePolarizationModel
Test1
Test2
Test3 UNet
Test4 Deeplabv3+
Test5 HRNet
Test6
Test7
Table 5. JM distances between impervious surfaces and other ground objects under different polarization modes.
Polarization ModesVGWBBS
VH1.64941.94461.4927
VV1.72241.98381.2069
VH + VV1.84021.99351.5844
Table 6. Extraction accuracy for impervious surfaces with different polarization channels.
ModelPolarization ModesOA (%)KappaMIoUF1-Score
UNetVH93.230.84540.85770.9227
VV93.040.84140.85430.9207
VH + VV94.090.8650.87450.9325
Deeplabv3+VH91.450.80510.82420.9026
VV91.750.8120.82980.906
VH + VV92.660.83330.84750.9167
HRNetVH89.570.75820.78710.8791
VV89.970.76810.79470.884
VH + VV90.030.76920.79560.8845
Table 7. Impervious surface extraction accuracies of UNet with different feature inputs.
TestOA (%)KappaMIoUF1-Score
Test193.250.84590.85810.923
Test291.90.8150.83230.9075
Test390.240.77550.80050.8877
Test494.090.8650.87450.9325
Test593.470.85070.86220.9254
Test692.210.82170.83790.9109
Test794.140.86640.87570.9332
Table 8. Impervious surface extraction accuracies of Deeplabv3+ with different feature inputs.
TestOA (%)KappaMIoUF1-Score
Test191.640.80970.82790.9049
Test290.80.78970.81180.8949
Test389.820.76620.79320.8831
Test492.660.83330.84750.9167
Test592.230.82330.83910.9117
Test691.170.79880.8190.8994
Test792.170.82170.83780.9108
Table 9. Impervious surface extraction accuracies of HRNet with different feature inputs.
TestOA (%)KappaMIoUF1-Score
Test190.060.76980.79610.8849
Test288.220.72540.76210.8626
Test386.650.68670.73360.8431
Test490.030.76920.79560.8845
Test590.040.76920.79560.8845
Test689.230.74980.78060.8748
Test790.020.76890.79540.8844
Table 10. Extraction accuracies for impervious surfaces after adding the OSM road network data.
ModelOA (%)KappaMIoUF1-Score
UNet94.30.86980.87860.9349
Deeplabv3+93.030.84150.85430.9207
HRNet90.720.78530.80830.8926
Disclaimer/Publisher’s Note: The statements, opinions and data contained in all publications are solely those of the individual author(s) and contributor(s) and not of MDPI and/or the editor(s). MDPI and/or the editor(s) disclaim responsibility for any injury to people or property resulting from any ideas, methods, instructions or products referred to in the content.