Article

Construction and Analysis of Ecological Security Patterns in the Southern Anhui Region of China from a Circuit Theory Perspective

1
College of Management and Economics, Tianjin University, Tianjin 300072, China
2
School of Landscape Architecture, Nanjing Forestry University, Nanjing 210042, China
3
Key Laboratory of Poyang Lake Wetland and Watershed Research, School of Geography and Environment, Jiangxi Normal University, Nanchang 330022, China
4
Faculty of Geographical Science, Beijing Normal University, Beijing 100875, China
5
Faculty of Geo-Information Science and Earth Observation (ITC), University of Twente, 7514 AE Enschede, The Netherlands
6
School of Environment, Tsinghua University, Beijing 100084, China
7
Chinese Research Academy of Environmental Sciences, Beijing 100012, China
8
Hydrology Bureau of Xinjiang Uygur Autonomous Region, Urumqi 830099, China
9
Haikou Marine Geological Survey Center, China Geological Survey, Haikou 571127, China
10
State Key Laboratory of Hydraulic Engineering Simulation and Safety, School of Civil Engineering, Tianjin University, Tianjin 300072, China
11
State Key Laboratory of Simulation and Regulation of Water Cycle in River Basin, China Institute of Water Resources and Hydropower Research, Beijing 100044, China
*
Author to whom correspondence should be addressed.
These authors contributed equally to this work.
Remote Sens. 2023, 15(5), 1385; https://doi.org/10.3390/rs15051385
Submission received: 23 December 2022 / Revised: 20 February 2023 / Accepted: 23 February 2023 / Published: 28 February 2023

Abstract

:
Located in an important biodiversity conservation area in the Yangtze River Delta, the habitats of many species have been severely eroded because of human activities such as tourism development. There is no relevant species conservation plan in place in the region, and scientific guidance on ecosystem change and corridor construction is urgently needed. In this study, we first assess ecosystem service functions based on the InVEST model; then, we assess ecological sensitivity and identify landscape resistance surfaces by constructing ecosystem sensitivity indicators; finally, we construct ecological security patterns by combining landscape resistance surfaces and circuit theory identification. The main results are as follows: (1) The high value area of ecosystem services is located in the southwest, while the northeast part of the study area has lower ecosystem services, and there is a trade-off between the ecosystem services in the study area. (2) There are 38 ecological sources in southern Anhui, with a total area of more than 5742.79 km2, that are the basic guarantees of ecological security, mainly located in the northeast of the study area, and woodland and grassland are the most important components, accounting for 18.4% of the total study area. (3) The ecological security pattern in the study area consists of 63 ecological sources, 37 important corridors, and 26 potential corridors, of which there are 28 pinch point areas and 6 barrier point patches in the study area, mainly located within Huangshan City and Xuancheng City. We recommend that when implementing restoration and rehabilitation measures in the future, policy makers should give priority to pinch points and barrier areas.

Graphical Abstract

1. Introduction

With the rapid expansion of human activities, the ecological environment [1,2] is gradually being fragmented and destroyed. On the one hand, habitat fragmentation has led to biodiversity reduction. On the other hand, the conflict between economic development and environmental protection is intensifying, leading to new demands on ecosystem services [3,4,5]. The ecological security pattern mainly refers to a potential spatial pattern composed of key points, lines, parts (planes), or spatial combinations that plays a crucial role in maintaining and controlling ecological processes and is also the basic guarantee for realising ecological security [6,7]. As a bridge between ecosystem services and social development, the design of ecological safety patterns has become an important tool for governments at all levels to ensure sustainable regional economic development and to coordinate the relationship between ecosystems and economy and society [8,9].
The structure [10,11,12,13], function [14,15], construction [16], and assessment [17,18] of ecological corridors are currently being discussed by scholars in different fields in several countries. In addition, scholars have carried out extensive work on biodiversity conservation [19,20,21], nature reserve design [22], and ecosystem restoration strategies [23,24,25,26]. The mainstream paradigm of “ecological source land–resistance surface–ecological corridor” has been developed in China [27,28], and there is a consensus that scientific identification of source land and resistance surface is an important basis for building ecological security patterns. In recent years circuit theory has become a popular corridor design theory both nationally and internationally [27,29]. The theory links random wander theory, circuit theory, and movement ecology to generalise a complex landscape into a conductive surface: target species in the landscape are compared to random wanderers, and land-use types that favour the movement process of wanderers are assigned lower resistance values (and, conversely, higher resistance values). At present, the domestic application scale for circuit theory is mainly focused on the municipal and county level [30,31,32,33,34]. Zhang and Wang et al. conducted an empirical study using circuit theory in a highly urbanised area to demonstrate the feasibility of circuit theory to model species migration corridors based on species behavioural traits [35,36]. Yu et al. used circuit theory combined with multi-quasi-measurement decision making to develop a model for constructing ecological security patterns under different ecosystem service protection scenarios in Anhui Province, which was used to provide decision support for policy makers. In general, circuit theory is an excellent method for addressing regional environmental protection and strategy development. The study areas are mostly rapidly urbanising areas with poor ecological backgrounds, which is still a blind spot for the study of regions that originally had better ecological conditions (all external factors that affect the survival and development of organisms) [37] and rapid economic development. Similarly, the selection of indicators and study areas for the construction of ecological source sites (habitats of extant species and meta points for dispersal and maintenance) [38] and landscape resistance needs to be deepened.
The mountain areas in southern Anhui are rich in biodiversity. The more than 100 biodiversity distribution centres in the world determined by the World Conservation Union (IUCN) include the Huangshan area, which is also one of the priority areas for biodiversity conservation in China. Influenced by the special geographical environment and topography, southern Anhui has more than 300 species of national first and second class protected animals, such as the clouded leopard, Chinese hyena, black muntjac, leopard cat, etc. Many human activities (such as tourism development) have seriously disturbed the habitat of its internal species, and the species have been transferred to deep mountains to resist this interference. Therefore, environmental protection is necessary and urgent in Anhui Province. This paper addresses this contradiction by optimising the strength of its internal species linkages, repairing the barrier areas, and constructing a scientific pathway to guarantee ecological security within the study area. We investigate three aspects: (1) Spatial principal component analysis was used to generate objective weights for a spatially superimposed evaluation of ecosystem service functions and ecological sensitivity, using the home range of black muntjac and leopard cat as the source area scale extraction criteria to screen ecological source areas for target species. (2) The resistance factor was modified based on the reciprocal of habitat quality and night light index and terrain position index, and the minimum cost path, pinch point (the places where organisms must pass during migration) [7], and obstacle point are calculated in the corridor design model Linkage Mapper based on circuit theory. (3) We assessed the impact of resistance thresholds on ecological corridor identification and ecological safety patterns in potential anthropogenic disturbance areas with a view to providing decision support for land-use development and ecosystem management in the study area.

2. Materials

2.1. Study Area

The study area (Figure 1) is located in the southern part of Anhui Province, China (29°31’–31°00′N and 116°31′–119°45′E). It is bounded to the north by the plains along the Yangtze River, to the southeast by Jiangsu and Zhejiang, and to the southwest by Jiangxi. There are a total of 30 districts and counties as well as 2 county-level cities in southern Anhui, with a total area of about 31,200 km2. It has three major water systems: the Yangtze River, the Poyang Lake system, and the Xin’an River. At the same time, South Anhui is rich in forest resources and soil types, with 20,500 km2 of forestland in the region; 45.7% of the forestland in Anhui Province is in South Anhui. There are 5 national nature reserves and 15 provincial nature reserves within the southern Anhui region.
As of the end of 2019, the resident population in southern Anhui was 8.89 million. Against the backdrop of the pressure of multi-population survival and long-term land development, the natural ecological processes in southern Anhui have been severely affected by the economic growth. This is manifested in the destruction of species habitats, loss of biodiversity, forest degradation, soil retention, and other ecological problems (the destruction of ecosystems due to the disruption of ecological balance, leading to serious disorders in the structure and function of ecosystems, thus threatening the survival and development of human beings) [39] in southern Anhui.

2.2. Data Sources and Pre-Processing

The land-use data and Normalized Difference Vegetation Index (NDVI) data for the study area were obtained from the Resource and Environment Science Data Center of the Chinese Academy of Sciences (https://www.resdc.cn/, 23 April 2022); Digital Elevation Model (DEM) data were obtained from the Geospatial Data Cloud website (http://srtm.csi.cgiar.org/srtmdata/, 23 April 2022); meteorological data for the study area were obtained from the Monthly Value Dataset of Anhui Surface Climate Information provided by the China Meteorological Data Network (http://data.cma.cn/, 23 April 2022); actual evapotranspiration data for the study area were obtained from Worldclim (https://www.worldclim.org/, 23 April 2022) and then interpolated to 30 m precision data using the ArcGIS kriging method; soil data from the China Soil Dataset (1:1 million) were provided by the China National Earth System Science Data Center (http://soil.geodata.cn/, 23 April 2022); NPP-Viirs night time light data were obtained from the National Oceanic and Atmospheric Administration (https://www.noaa.gov/, 23 April 2022); the National Terrestrial Ecosystem Classification was taken from the China Terrestrial Ecosystem Database (https://www.ecosystem.csdb.cn/ecosys/, 23 April 2022); and data such as planning texts related to the study area were from relevant government departments. All remote sensing satellite data were atmospherically and radiometrically corrected and clipped and mosaicked according to the study area.
Finally, based on the ArcGIS platform, all spatial data were standardised to the Albers Conic Equal Area projection and resampled to a 30 m × 30 m raster cell size for subsequent calculations. The study data are described in Table 1.

3. Research Methodology

3.1. Research Framework

The essence of building an ecological security pattern is to develop a network model that contains ecological sources, ecological corridors, and ecological nodes (three categories of ecologically weak points, pinch points, and barrier points were included) [7]. By identifying and protecting key source sites, regional ecosystem services are guaranteed to proceed properly. First, ecological source sites were the source points for species dispersal and location, and they included three main characteristics: they provided key ecological services, they had the continuity and integrity of the landscape pattern, and they prevented various ecological security problems caused by ecosystem degradation. A single ecological source site was unlikely to maintain the overall ecological security of the region.
Combining relevant studies [28,30,31,34,40] and the actual situation of the southern Anhui region, ecological source sites important to the ecological security pattern of the southern Anhui region were comprehensively identified from two aspects: the importance of ecosystem services and the sensitivity of the ecological environment. Ecosystem services mainly included the supply, regulating, and cultural functions of ecosystems. Since the evaluation of large-scale ecosystem services mostly focused on regulating services, the main regulating services in the study area (carbon fixation, water production, soil conservation, habitat quality) were selected as indicators for measuring ecosystem services in the study area; China has a rich ecological diversity and highly complex ecosystems, and the factors affecting ecological sensitivity vary from region to region. The selection of ecological sensitivity factors should be based on the intrinsic mechanism of ecological problems, combined with the environmental conditions of the study area, and selected to reflect the main environmental characteristics of the study area. In this paper, ecological sensitivity indicators (land use, normalised vegetation index (NDVI), DEM, SLOPE, soil erosion) were selected with reference to the existing literature on similar geographical environments in the study area. The second step was to construct a resistance surface, extracting corridors and key pinch points and obstacle points according to circuit theory and identifying important ecological source sites. The specific framework is shown in Figure 2.

3.2. Ecosystem Services

Ecosystem services are needed to meet the basic needs of people for a stable natural living environment. Based on the main ecosystem services that the study area can provide in the actual ecological environment, four types of ecosystems—habitat quality, soil retention, water retention, and carbon fixation—were selected as the screening indicators for this study’s ecological reserve. According to relevant research results in the study area, in order to avoid artificial subjective empowerment, spatial principal component analysis (SPCA) was used to calculate the weight of the four types of ecosystem services in the study area) [28,41,42]. Spatial principal component analysis (SPCA) combines the principles of statistics and GIS to assign each spatial variable to a matrix and assign the degree of influence of the relevant spatial variables on the dependent variable to the corresponding principal component factors, and it can clearly implement the results of principal component factor analysis to each image of the space, so that the original principal component analysis results are intuitively extended to two-dimensional space. The principle is derived from PCA, so SPCA can calculate the objective weights of each indicator, avoiding the artificial assignment of values, which affects the scientific nature of the evaluation results. The specific software platform for this method was ArcGIS 10.6.
In this study, habitat quality was defined as the diversity of species in the study area and the ability of ecosystems to provide living conditions for individuals, populations, and communities. Soil retention was defined as the ability of ecosystems to prevent soil loss, regulate erosion, and maintain sediment storage. Water retention was defined as the amount of surface water produced in a given area, reflecting the ability of ecosystems to maintain water. Carbon fixation was defined as the ability of an ecosystem to regulate climate and improve regional air quality. The four types of ecosystems mentioned above were calculated as shown below.

3.2.1. Habitat Quality

Habitat quality reflects the quality of the ecosystem and the state of the ecological environment in the area, and it is an important evaluation factor in assessing the ecological environment. The principle is to combine the sensitivity of the study area to landscape types and the intensity of external threats to obtain the distribution of habitat quality and thus the biodiversity status of the study area. Habitat quality is generally calculated using the habitat quality module of the InVEST model, and the quality of the habitat is used to reflect the level of biodiversity, with the default being that areas with better habitat quality have higher biodiversity and vice versa. This method refers to relevant studies [32,33,34,43] to set the relevant parameters. The specific equation is as follows:
Q x j = H j [ 1 ( D x j z D x j z + k z ) ]
where Q x j represents the habitat quality index of raster x in landscape type j in the study area; H j has a value range of [0, 1], representing the habitat suitability score of landscape type j ; k is the half-saturation constant, set according to the accuracy of the data in the study area, which was 50 in this paper; z is the scale constant, generally taken as 2.5. This study was based on the InVEST model manual and related studies, setting the habitat quality module based on the InVEST model manual and related studies.

3.2.2. Soil Retention

Soil retention is a widespread phenomenon in the natural environment, but excessive soil retention can cause a range of production and livelihood problems that affect people’s lives. Ecosystems reduce soil retention because of water erosion through their structure and processes, and this is one of their key regulating services. The seamless grid estimation method based on the USLE/RUSLE model is currently the main method of regional soil retention investigation in regional soil retention studies [43,44]. In recent years, Liu et al. continued their in-depth research on soil survey techniques at large scales in Sichuan, Qinghai, and southwest China, as well as in China and “One Belt, One Road” [45,46,47,48], and proposed several ULSE model parameterisation methods for soil retention assessment at large scales. The basic form of the improved USLE is
A = R · K · L · S · C · P · M
P A = R · K · L · S · M  
C A = P A A  
where A is the soil retention modulus ( t · km 2 · a 1 ), P A is the potential soil retention modulus ( t · km 2 · a 1 ), C A is the soil retention modulus ( t · km 2 · a 1 ). R is the rainfall erosivity factor ( MJ · mm · hm 2 · h 1 · a 1 ), K is the soil erodibility factor ( t · hm 2 · h · hm 2 · MJ 1 · mm 1 ), L is the slope length factor (dimensionless, 0~1), S is the slope gradient factor (dimensionless, 0~1), C is the ground cover and management factor (dimensionless, 0~1), P is the soil and water conservation measures factor (dimensionless, 0~1), and M is the correction factor (dimensionless).

3.2.3. Water Yield

Water yield is the process by which ecosystems (e.g., forests, grasslands) interact with water through their unique structure to retain, infiltrate, and store precipitation and regulate the water cycle through evapotranspiration. The role of water retention is mainly in moderating surface runoff to replenish groundwater, slowing down seasonal fluctuations in river flow, delaying flooding and replenishing dryness, and ensuring water quality. In this paper, the water yield was used as an indicator to assess the water yield of an ecosystem, and the water balance equation was used to calculate the water yield [49]. The calculation method is
T Q = i = 1 j ( P i R i E T i ) × A i × 10 3
where T Q is the total water yield (m3), P i is rainfall (mm), R i is surface runoff (mm), E T i is evapotranspiration (mm), A i is the area of ecosystem type i (km2), i is ecosystem type i in the study area, and j is the number of ecosystem types in the study area.

3.2.4. Carbon Fixation

Carbon fixation is the process by which organisms convert inorganic carbon into organic compounds through photosynthesis. The capacity for carbon fixation and oxygen release is a direct manifestation of the functional service capacity of green ecosystems. The NPP dataset based on MODIS data was chosen to characterise the capacity for carbon fixation and oxygen release after processing.

3.3. Ecological Sensitivity Assessment

Ecological sensitivity refers to the degree to which an ecosystem reflects the disturbance of human activities and changes in the natural environment, indicating the ease and likelihood of regional ecological problems occurring. The level of sensitivity reflects the probability of experiencing ecological problems when disturbed by unreasonable activities [26]. For example, the larger the NDVI value is, the greater the possibility that it will decline after being affected by human activities. Here, scholars generally define it as highly sensitive. The evaluation of ecological sensitivity is determined by both natural factors and human activities and is complex and comprehensive, so the multi-factor composite index evaluation method is generally used.
S = k = 1 n W K × C K
Here, k is the evaluation factor number; n is the total number of evaluation factors; S is the combined value of the evaluation; W K is the weight of the k th evaluation factor; C K is the k th evaluation factor sensitivity evaluation index annotation index. The evaluation factors for this study are referred to Table 1.
The southern part of Anhui Province is located in a mountainous and hilly area. Based on relevant studies [26,48,49] and the actual study area, five types of indicators—vegetation cover, elevation, slope, land-use type, and soil retention intensity—were selected as evaluation factors. Because of spatial heterogeneity, different regions have different degrees of importance for the same evaluation factor. Therefore, we used spatial principal component analysis to remove invalid information and retain the evaluation factors that affected spatial differences, achieved the best synthesis and simplification of high-dimensional variables, and objectively determined the weight of each index. The results were weighted using GIS to assign sensitivity values to the above five categories of factors. The results were classified into five classes: not sensitive, mildly sensitive, moderately sensitive, highly sensitive and extremely sensitive, using the natural breakpoint method. The final spatial distribution of ecological sensitivity evaluation was obtained. The specific values and weights are shown in Table 2.

3.4. Landscape Resistance Surfaces

The difficulty of species movement between habitat patches in this paper was characterised by the setting of resistance surfaces. The resistance value of the resistance surface depended on the distance between ecological source sites, the type of land use, and human activity. Human activities can impede the circulation of materials and energy exchange between different landscape patches. Traditional resistance surfaces only consider the ecological resistance of patch land using simulations, ignoring the possibility that different material and energy flows exist for the same type of site and resulting in a less accurate distribution of simulated resistance surfaces. Generally speaking, the higher the quality of habitats in a region, the more complex the biodiversity and the more unobstructed the species in that region. Peng, Zhang et al. assigned land-use/cover values according to different land types and then used other factors to correct. Habitat quality was assigned to land use based on its output. The assigned parameters were set according to the InVEST manual and previous research papers in the study area. On this basis, the model considered the linear or nonlinear “edge effects” imposed on habitat groups by human activities such as construction land and roads and obtained the final assessment results of habitat quality in the study area. The research proved that the habitat quality can indicate the level of regional biodiversity and the impact of human activities to a certain extent. Compared with direct land-use assignment, it can better represent the different land uses of the same land type. In this paper, based on relevant studies and the actual situation of the study area [50,51], the inverse of the habitat quality was introduced to construct the resistance surface, and the resistance surface was corrected based on night time lighting data and topographic position index.

3.5. Regional Ecological Safety Pattern

An ecological corridor is a narrow strip of land within a landscape patch, which is distinctly different from the ecological source areas on either side and is often created to improve ecological connectivity between ecological patches. There are a number of key points in the corridor, such as pinch points and barrier points (an area that prevents movement or communication between organisms) [7]. Pinch points are key ecological source sites for high flows of ecological processes and are priority areas for protection, because of their irreplaceable role in landscape connectivity. Barriers can impede the movement of species through ecological corridors. Restoring barrier sites can maximise landscape connectivity.
In this study, properties of current theory were used to identify pinch points and barrier points in heterogeneous landscapes that affected ecological corridor connectivity. In the circuit theory model, the landscape is represented as a conductive surface, with low resistance being assigned to landscape patches that best facilitate species movement and high resistance being assigned to landscape patches that impede species movement. In physics, Ohm’s law suggests that the current through a conductor between two points is proportional to the voltage between the two points. Based on the electrical analogy, the effective resistance, current, and voltage of a landscape patch are related to ecological processes such as particle movement and gene flow by calculating them. The calculations are as follows:
I = V R
where I is the current through the conductor (resistance surface), which in this study was analogous to the strength of the ecological flow; V is the voltage measured through the conductor (resistance surface), which in this study was analogous to the driving force of the ecological flow (e.g., species reproduction behaviour); and R is the effective resistance of the conductor, which in this study were the different resistance values of the resistance surface.
In addition, the effective resistance R is related to the way in which the circuit is constructed. In a parallel circuit with multiple branches, each branch has a constant resistance. As the number of branches increases, the resistance R decreases. In an ecological sense, the resistance R is considered an indicator of the spatial isolation of the nodes. Again, the I of a branch circuit is reflected as ecological flow and can be used to predict the probability size of gene flow or species movement. Therefore, areas with high current values can be identified as key components of ecological corridors.
This study used the Linkage Mapper tool plugin based on the ArcGIS platform for network construction and corridor identification of the extracted ecological source patches and resistance surfaces. Important ecological corridors represented the lowest resistance paths between ecological source patches, while potential ecological corridors represented possible linkage paths between source patches. Barrier points in the corridors were identified using the Barrier Mapper tool and used to extract restoration strategies to improve corridor connectivity in the future; the Pinchpoint Mapper tool was used to identify pinch points in the ecological corridors.

4. Results

4.1. Spatial Patterns of Ecosystem Services

Based on the above ecosystem service evaluation methods, the spatial patterns of the four types of ecosystem services were obtained after normalisation (Figure 3). The results indicated that the average habitat quality in southern Anhui was 0.67, with areas of high habitat quality located mainly within Huangshan City and partly in Jingde County and Ningguo City under Xuancheng City. Huangshan City is a mountainous location with a short spring and autumn, long summer and winter, and abundant heat. The city is home to more than 200 species of all types of birds of prey, such as the golden monkey and the great spirit cat. It is an important ecosystem service-providing area in Anhui Province. The northeast part of southern Anhui is located in a plain area, with less woodland and grassland in the territory and an overall lower quality of habitat. The high value area of soil retention function in southwest Anhui is in the southwest, mostly in the Huangshan City area, with a small part in Jingxian County, and the gap between the soil retention function in the northeast and Huangshan City is larger. The southeast region has a stronger capacity for carbon and oxygen fixation and release, the northeast region is weaker, and the other parts have a small difference in carbon and oxygen fixation and release capacity. The best water retention capacity is located in Huangshan District, Huaning County, and Qimen County of Huangshan City.
The 20,000 attribute points in the study area were randomly selected. Normalised values for the four ecosystem services were extracted into attribute tables using ArcGIS tools. Finally, Pearson correlation analysis was used to explore the synergistic and trade-off effects of ecosystem services in the study area. The results (Figure 4) indicated that there was a trade-off between habitat quality (HQ) and water yield (WY) in southern Anhui, with a correlation coefficient of −0.266, while the other ecosystem services were all synergistic. It is worth noting that the synergy between habitat quality (HQ) and carbon fixation (CF) was high at 0.497, which was related to the presence of large areas of woodland in the mountainous areas of southern Anhui. The large area of woodland has a strong role in regulating climate while constituting ecological land for species to inhabit.

4.2. Spatial Pattern Analysis of Eco-Environmental Sensitivity

Based on the above ecological sensitivity evaluation method, the spatial pattern of various ecological sensitivity factors and the evaluation level were obtained (Figure 5). Low-sensitivity land uses such as construction land in the study area were mainly located in the northeast part of the study area, which is the second largest city in Anhui, Wuhu. The lower the elevation and the lower the slope the more frequent the human activity. The main land use in the low elevation and low slope areas of the study area was construction land. The spatial distribution of NDVI greater than 0.75 in the study area was mainly distributed in a point pattern in Xuancheng and Huangshan City. The spatial distribution of soil retention in the study area was relatively uniform, and there was basically no soil retention. The areas of lower ecological sensitivity in southern Anhui were in the adjacent areas of Wuhu City and Xuancheng City, around the Yangtze River, where the topography is relatively flat, the woodland and grassland cover are low, and the ecological environment is vulnerable to human activities because of the large population. The areas within Huangshan City and Xuancheng City with lower elevations are vulnerable to human activities because of their higher vegetation cover.

4.3. Ecological Source Site Construction

Through the above landscape resistance surface construction method, the final landscape resistance surface of the study area was obtained (Figure 6). Overall, the study area had greater overall resistance values in the northeast than in the southwest.
Considering that ecological source sites need a certain area to support the survival of species, smaller ecological source sites can hardly support the encroachment of the surrounding unfavourable environment, and this increases the management difficulty. We defined 1 to 5 as extreme, slightly poor, medium, good, and excellent, respectively.
The evaluation results with importance levels 4 and 5 were selected as the ecological sites in the study area. In this paper, we considered the home area of black muntjac and leopard cat as the minimum screening area of the ecological source of the study area and determined that their home area was usually greater than 2.5 km2. Through the ArcGIS aggregation and deletion tool, ecological sources smaller than 2.5 km2 were deleted, and finally, the ecological source points of the study were obtained as shown in Figure 7. There were 38 ecological sources in southern Anhui, with a total area of over 5742.79 km2. These were the basic guarantees of ecological security, mainly located in the northeast of the study area, with woodland and grassland being the most important components, accounting for 18.4% of the total study area.

4.4. Analysis of Circuit Theory Results

The ecological network model of “ecological source–resistance surface–ecological corridor” was constructed using the linkage mapping tool, and the ecological corridor of South Anhui was obtained (Figure 8a). The ecological corridors in the study area were mainly located in the Huangshan District and Yixian County of Huangshan City. A small number of ecological corridors were located in the vicinity of Guangde County, Langxi County, and Xuanzhou District in Xuancheng City. There were 63 ecological corridors connecting the 38 ecological source areas, including 37 important corridors and 26 potential corridors. Some of the important corridors and potential corridors overlapped in places, probably because of the low resistance of the landscape patches in the region. The longest important corridor was 77.04 km, with 78 corridors over 10 km in length, accounting for 44.8% of the total number of important corridors. The 26 potential corridors had an average length of 16.9 km. The longest potential corridor was between the Guangde City ecological source area and the Xuancheng District and Ningguo City ecological source areas. If the ecology of the area is improved and connectivity between ecological sources is restored, this will have a strong enhancing effect on species transfer and ecological recovery.
The simulated species migration corridors varied in width across the study area (Figure 8b). The narrower the corridor, the fewer options there were for organisms to pass through it. The narrowest corridors were located around cities, where the land-use type was mainly construction land with high ecological resistance. Ecological corridors were mostly located along rivers and highways, flanked by protective forests, where the risk of ecological degradation was high because of the strong disturbance of human construction activities around the corridor. In addition, the high density of human activities near urban built-up areas led to highly dispersed ecological sources and high ecological resistance in the area. Therefore, the ecological corridor was characterised as long and narrow. The shorter and thicker corridors indicated the lower possibility of species being disturbed by human activities during migration.
Based on the Barrier Mapper module in the Linkage Mapper, after repeated validation and according to the actual needs of the study area, the search path step size was set to 300 and the maximum search distance was 1500 to obtain the barrier circles, which indicated that improvement scores were expanded to fill the entire search window (Figure 8c). The study demonstrated that the areas with high cumulative current response values were mainly located in the northeast of the study area, where human activity was frequent, with a large proportion of built-up land and arable land, and where the quality of the ecological environment was relatively low.
The classification of simulation results for ecological source site centrality was conducted using the natural breakpoint method (Figure 8d). It was found that the ecological source sites with high centrality in southern Anhui were mainly located around Nanling, Jixi, and Huangshan, and their centrality scores exceeded 269.01. The ecological source sites around Wuhu were less centrally located, and their centrality scores were mostly in the range of 37.00–169.00.

4.5. Ecological Safety Pattern Construction

Based on the above spatial distribution of cumulative current values and cumulative improvement current values in southern Anhui, the natural breakpoint grading method was used to divide them into three levels, and the highest level cumulative current values and cumulative improvement current values were extracted as pinch points and obstacle points in the study area, respectively. Therefore, ecological weaknesses were extracted from the intersections of ecological corridors in the study area. The ecological safety pattern of southern Anhui was constructed by superimposing the pinch points and obstacle points on the ecological sources and corridors in the study area (Figure 9).
The results indicated that the ecological safety pattern in the study area consisted of 63 ecological source sites, 37 important corridors, and 26 potential corridors. There were 28 pinch point areas and 6 barrier points. The total area of pinch points in the study area was 889.81 km2. The overlay of land-use data and remote sensing images showed that the current land types in the ecological pinch points were mainly forestland, cropland, grassland, and water area, accounting for 60.36%, 16.14%, 9.44% and 7.88%, respectively, and the identified ecological pinch points reflected a single landscape type with a relatively complete structure. Eight ecological barrier points based on the ecological safety pattern, i.e., areas with high cumulative current recovery values, were identified in total, with a total area of 344.79 km2. The largest barrier point had an area of 138.01 km2 and the smallest barrier point had an area of 25.83 km2. Most ecological obstacle points were located at the junction of ecological sources and ecological corridors and the intersection and overlap of multiple corridors, and from the overlay of land-use data and remote sensing images, it can be seen that the current land types of ecological obstacle points were mainly arable land, construction land, and other land, interspersed with a little forestland, grassland, and water, accounting for 51.26%, 39.35%, 8.19%, 0.67%, 0.18% and 0.04%, respectively. The identified ecological barrier landscape differed from the ecological pinch point landscape type in that it was dominated by many landscapes disturbed by human activities, and the landscape showed obvious fragmentation.

5. Discussion

5.1. Ecological Restoration Strategies for Key Areas

Both pinch points and barrier points occur in ecological corridors, and the destruction of pinch points may create barriers to species transfer in the region and affect the construction of ecological security patterns. Pinch points are high flow nodes and important conservation areas in species transfer, ecosystem conservation, and ecosystem movement [7,29]. According to circuit theory, the higher the current density, the greater the likelihood that the area will be selected by species as a migration corridor, and the higher its importance in the ecological corridor. The protection of pinch points will help to support the smooth construction of ecological corridors and maintain a stable ecological environment in the future. Fewer pinch points occurred in Jixi County in the study area, and their connectivity was poor. There were more pinch points in Huangshan City, which is the core area of ecotourism in southern Anhui and has a relatively good ecological protection system. The junction of four counties or districts, Xuanzhou District, Guangde County, Ningguo City, and Langxi County, had many small ecological source sites that function as footsteps distributed in the region, and a large area of pinch points appeared. Part of this is related to the better ecological environment of the scenic areas within the district, and on the other hand this may be related to the implementation of ecological fallowing by the government and the rapid development of local agriculture [38,52,53].
Barrier points are areas that impede the movement of species from ecological source sites to other source sites and may be natural barriers, such as overly wide rivers, cliffs, etc., or the result of the construction of new areas, the establishment of industrial parks, the assumption of large airports, etc. The Barrier Mapper tool identified 6 barrier point patches occurring in southern Anhui, distributed in densely built-up areas such as the urban areas of Xuancheng City and Huangshan City. One of the largest barrier spots appeared in the middle of Xuanzhou District, Xuancheng City. The actual survey found that the central part of Xuanzhou District was an urban area, mostly used for construction. It was surrounded by ecological sources with a good ecological environment such as Jingting Mountain National Forest Park, China Crocodile Lake, and Hua Tuo Ling [38,54]. The barrier points around Huangshan City, on the other hand, appeared to be blocked by the construction of industrial parks and high-tech zones. The government can take measures to address this situation, such as setting up strip green areas in the district to form a green ecological network, which can restore the connectivity of several ecological source areas in the district and improve the ecological stability of the region [34,55].

5.2. Threshold for Broadband of Species Migration Corridors

Ecological corridor identification plays an important role in maintaining ecological processes. The ecological function of a corridor is closely related to its spatial extent, such as the edge effect of a corridor [7,56]. The range of ecological corridor widths based on circuit theory was determined based on cumulative resistance and specific thresholds. As the cumulative resistance threshold increased from 1000 to 6000 to determine the extent of the ecological corridor, the corresponding proportion of the ecological safety pattern areas accounted for 7.55%, 10.68%, 13.35%, 15.37%, 19.65%, and 23.31% of the total area of the southern Anhui region, respectively (Figure A1 in Appendix A). We found that as the threshold value increased, the area of ecological corridors increased accordingly, and the chance of regional ecological flow gradually rose, showing stochastic diversion. However, the spatial distribution of ecological corridors only changed slightly and remained almost constant. In addition, the maximum cumulative current value at the pinch point gradually decreased as the threshold increased; this was because the wider corridor effectively increased the circuit connection path, resulting in a current split. However, despite the decrease in the cumulative current value of the pinch points, the location of the pinch points did not change significantly, indicating that the protection of natural ecosystems at key locations in the landscape was effective in ensuring regional ecological safety. In this study, considering the urgent need for economic development in the southern Anhui region, there was limited financial investment in ecological conservation and related studies for ecological corridor exploration [57]. It was assumed that ecological conservation investment could only support the management of the entire study area; therefore, a threshold value of 5000 was used to determine the spatial extent of ecological corridors.

5.3. Research Gaps and Outlook

This paper coupled the importance of ecosystem services and ecological sensitivity to identify regional ecological source sites and construct a regional ecological security pattern based on circuit theory, which is to a certain extent a reference for the future construction of ecological security in southern Anhui. However, in the current study, the selection of ecological source areas in the paper was mainly based on expert experience, and the ratio of the ecological source areas to the total study area must be explored in depth. Regarding the trade-offs and synergies between ecosystem services, this study selected only the key ecosystem services in the study area and omitted ecosystem services such as food production, nitrogen fixation, and pollination. In considering the different degrees of ecosystem service trade-offs between different regions and scales, this paper may not be comprehensive enough to evaluate the indicators of ecological source sites. In the future, a more reasonable method for selecting ecological source sites will be constructed according to the characteristics of the study area. Meanwhile, the width of ecological corridors has always been a hot topic and focus of research. The present study only simulated the spatial movement range of species migration with the help of circuit theory, and further research is needed for more detailed corridor width methods [6,34].

6. Conclusions

(1)
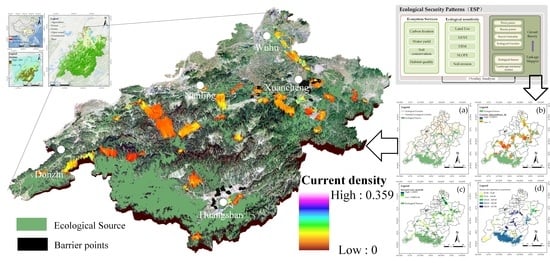
The high value areas for the four types of ecosystem services in southern Anhui were mainly concentrated in Huangshan City, and there were trade-offs between the four types of ecosystem services. The areas with high ecological sensitivity in the study area were mainly dotted in the territory of Huangshan City, while the ecological sensitivity in Wuhu and Xuancheng was low.
(2)
The ecological safety pattern of the southern Anhui region consisted of an ecological source dominated by woodlands and radiating ecological corridors distributed along the mountains and forests. The main ecological source sites and corridors were located in the southwestern part of the study area.
(3)
The ecological safety pattern in the study area consisted of 63 ecological sources, 37 important corridors, and 26 potential corridors, of which there were 28 pinch point areas and 6 barrier point patches in the study area.

Author Contributions

Conceptualisation: X.G.; methodology: H.Y. and X.G.; software: X.G. and G.L.; validation: X.L., H.Y. and X.G.; formal analysis: H.Y.; investigation: X.G.; resources: X.Z.; data curation: H.Y. and J.J.; writing—original draft preparation: X.G. and H.Y.; visualisation: Q.Z., Y.F. and Y.J.; supervision: X.L.; project administration: X.L.; funding acquisition: X.L. All authors have read and agreed to the published version of the manuscript.

Funding

This research was supported by the National Natural Science Foundation of China (Grant Number: 42071286) and the Third Xinjiang Scientific Expedition Program (Grant Number: 2021XJKK0406).

Data Availability Statement

Data is contained within the article.

Conflicts of Interest

We declare no conflict of interest.

Appendix A

Figure A1. Ecological corridors in southern Anhui at different current thresholds (NOTE: Figure A1:(a)–(f) represents the spatial distribution of corridors in the study area under different parameter (1000, 2000, 3000, 4000, 5000, 6000) settings).
Remotesensing 15 01385 g0a1
Figure A2. Spatial distribution of the average climate elements in southern Anhui; (a) Average annual rainfall in southern Anhui. (b) Average temperature in southern Anhui.
Remotesensing 15 01385 g0a2
Figure A3. Spatial distribution of hydrological conditions and protected areas in southern Anhui; (a) Nature reserve locations in southern Anhui. (b) Hydrological conditions in southern Anhui.
Remotesensing 15 01385 g0a3

References

  1. Cai, J.; Li, X.; Liu, L.; Chen, Y.; Wang, X.; Lu, S. Coupling and coordinated development of new urbanization and agro-ecological environment in China. Sci. Total Environ. 2021, 776, 145837. [Google Scholar] [CrossRef]
  2. Shi, T.; Yang, S.; Zhang, W.; Zhou, Q. Coupling coordination degree measurement and spatiotemporal heterogeneity between economic development and ecological environment—Empirical evidence from tropical and subtropical regions of China. J. Clean. Prod. 2020, 244, 118739. [Google Scholar] [CrossRef]
  3. Dai, X.; Wang, L.; Yang, L.; Wang, S.; Li, Y.; Wang, L. Predicting the supply-demand of ecosystem services in the Yangtze River Middle Reaches Urban Agglomeration. Prog. Phys. Geogr. Earth Environ. 2022, 46, 530–546. [Google Scholar] [CrossRef]
  4. Fang, L.; Wang, L.; Chen, W.; Sun, J.; Cao, Q.; Wang, S.; Wang, L. Identifying the impacts of natural and human factors on ecosystem service in the Yangtze and Yellow River Basins. J. Clean. Prod. 2021, 314, 127995. [Google Scholar] [CrossRef]
  5. Dai, X.; Wang, L.; Tao, M.; Huang, C.; Sun, J.; Wang, S. Assessing the ecological balance between supply and demand of blue-green infrastructure. J. Environ. Manag. 2021, 288, 112454. [Google Scholar] [CrossRef] [PubMed]
  6. Peng, J.; Pan, Y.; Liu, Y.; Zhao, H.; Wang, Y. Linking ecological degradation risk to identify ecological security patterns in a rapidly urbanizing landscape. Habitat Int. 2018, 71, 110–124. [Google Scholar] [CrossRef]
  7. Peng, J.; Yang, Y.; Liu, Y.; Hu, Y.n.; Du, Y.; Meersmans, J.; Qiu, S. Linking ecosystem services and circuit theory to identify ecological security patterns. Sci. Total Environ. 2018, 644, 781–790. [Google Scholar] [CrossRef] [Green Version]
  8. Nathwani, J.; Lu, X.; Wu, C.; Fu, G.; Qin, X. Quantifying security and resilience of Chinese coastal urban ecosystems. Sci. Total Environ. 2019, 672, 51–60. [Google Scholar] [CrossRef]
  9. Huang, J.; Hu, Y.; Zheng, F. Research on recognition and protection of ecological security patterns based on circuit theory: A case study of Jinan City. Environ. Sci. Pollut. Res. 2020, 27, 12414–12427. [Google Scholar] [CrossRef]
  10. He, J.; Pan, Y.; Liu, D. Analysis of the wetland ecological pattern in Wuhan City from the perspective of ecological network. Acta Ecol. Sin. 2020, 40, 3590–3601. [Google Scholar]
  11. Wang, G.; Yu, Q.; Yang, D.; Zhang, Q.; Yue, D.; Liu, J. Hierarchical Ecological Network Structure Based on Complex Network Analysis. Trans. Chin. Soc. Agric. Mach. 2019, 50, 258–266,312. [Google Scholar]
  12. Zheng, Q.; Zeng, J.; Luo, J.; Cui, J.; Sun, X. Spatial Structure and Space Governance of Ecological Network in Wuhan City. Econ. Geogr. 2018, 38, 191–199. [Google Scholar]
  13. Baguette, M.; Blanchet, S.; Legrand, D.; Stevens, V.M.; Turlure, C. Individual dispersal, landscape connectivity and ecological networks. Biol. Rev. 2013, 88, 310–326. [Google Scholar] [CrossRef] [PubMed]
  14. Song, T.; Li, D.; Zhang, L.; Wang, G.; Gao, Y.; Yang, C.; Feng, C.; Ma, H. Importance Evaluation of Ecosystem Services and Construction of Ecological Security Pattern in Qinba Mountain Area. Strateg. Study CAE 2020, 22, 64–72. [Google Scholar] [CrossRef]
  15. Cong, Z.; Sun, Y.; Xie, G.; Peng, Q. Study on the evolution of ecological network in Haikou coastal zone. Acta Ecol. Sin. 2020, 40, 1044–1054. [Google Scholar]
  16. Chi, Y.; Xie, Z.; Wang, J. Establishing archipelagic landscape ecological network with full connectivity at dual spatial scales. Ecol. Model. 2019, 399, 54–65. [Google Scholar] [CrossRef]
  17. Zhuge, H.; Lin, D.; Li, X. Identification of ecological corridors for Tibetan antelope and assessment of their human disturbances in the alpine desert of Qinghai-Tibet Plateau. Chin. J. Appl. Ecol. 2015, 26, 2504–2510. [Google Scholar]
  18. Zeller, K.A.; McGarigal, K.; Whiteley, A.R. Estimating landscape resistance to movement: A review. Landsc. Ecol. 2012, 27, 777–797. [Google Scholar] [CrossRef]
  19. Streicher, J.W.; Loader, S.P.; Varela-Jaramillo, A.; Montoya, P.; de Sa, R.O. Analysis of ultraconserved elements supports African origins of narrow-mouthed frogs. Mol. Phylogenetics Evol. 2020, 146, 106771. [Google Scholar] [CrossRef]
  20. Schroeter, M.; Kraemer, R.; Remme, R.P.; van Oudenhoven, A.P.E. Distant regions underpin interregional flows of cultural ecosystem services provided by birds and mammals. Ambio 2020, 49, 1100–1113. [Google Scholar] [CrossRef]
  21. Mirasole, A.; Signa, G.; Gianguzza, P.; Bonaviri, C.; Mazzola, A.; Vizzini, S. Fish assemblages cope with ocean acidification in a shallow volcanic CO2 vent benefiting from an adjacent recovery area. Mar. Environ. Res. 2020, 157, 104851. [Google Scholar] [CrossRef]
  22. Chen, Q.; Li, M.; Wang, X.; Faisal, M.Q.; Wang, P.; Yang, J.; Wang, M.; Yang, W. Identification of potential ecological corridors for Marco Polo sheep in Taxkorgan Wildlife Nature Reserve, Xinjiang, China. Biodivers. Sci. 2019, 27, 186–199. [Google Scholar]
  23. Gu, X.; Long, A.; Liu, G.; Yu, J.; Wang, H.; Yang, Y.; Zhang, P. Changes in Ecosystem Service Value in the 1 km Lakeshore Zone of Poyang Lake from 1980 to 2020. Land 2021, 10, 951. [Google Scholar] [CrossRef]
  24. Wang, Y.Y.; Shen, C.Z.; Jin, X.B.; Bao, G.Y.; Liu, J.; Zhou, Y.K. Developing and optimizing ecological networks based on MSPA and MCR model. Ecol. Sci. 2019, 38, 138–145. [Google Scholar]
  25. Huang, M.Y.; Yue, W.Z.; Feng, S.R.; Cai, J. Analysis of spatial heterogeneity of ecological security based on MCR model and ecological pattern optimization in the Yuexi county of the Dabie Mountain Area. J. Nat. Resour. 2019, 34, 771–784. [Google Scholar] [CrossRef]
  26. Dequan, C.; Zeying, L.; Weiqi, L. Construction of Land Ecological Security in Guangdong Province From the Perspective of Ecological Demand. J. Ecol. Rural Environ. 2019, 35, 826–835. [Google Scholar]
  27. Shan, N.; Zhou, K.X.; Pan, Y.; Tang, F. Research advances in design methods of biodiversity conservation corridors. Acta Ecol. Sin. 2019, 39, 411–420. [Google Scholar]
  28. Sun, F.; Zhang, J.H.; Wang, P.J.; Wei, G.; Chu, G.; Cao, Y. Construction and evaluation of urban ecological security pattern: A case study of Suzhou city. Geogr. Res. 2021, 40, 2476–2493. [Google Scholar]
  29. Dickson, B.G.; Albano, C.M.; Anantharaman, R.; Beier, P.; Fargione, J.; Graves, T.A.; Gray, M.E.; Hall, K.R.; Lawler, J.J.; Leonard, P.B.; et al. Circuit-theory applications to connectivity science and conservation. Conserv. Biol. 2019, 33, 239–249. [Google Scholar] [CrossRef]
  30. Chen, N.; Qin, F.; Zhai, Y.; Cao, H.; Zhang, R.; Cao, F. Evaluation of coordinated development of forestry management efficiency and forest ecological security: A spatiotemporal empirical study based on China’s provinces. J. Clean. Prod. 2020, 260, 121042. [Google Scholar] [CrossRef]
  31. Guo, X.; Zhang, X.; Du, S.; Li, C.; Siu, Y.L.; Rong, Y.; Yang, H. The impact of onshore wind power projects on ecological corridors and landscape connectivity in Shanxi, China. J. Clean. Prod. 2020, 254, 120075. [Google Scholar] [CrossRef]
  32. Wang, Y.Y.; Jin, X.B.; Shen, C.Z.; Bao, G.Y.; Liu, J.; Zhou, Y.K. Establishment of an ecological security pattern in the eastern developed regions: A case study of the Sunan District. Acta Ecol. Sin. 2019, 39, 2298–2310. [Google Scholar]
  33. Qiu, S.; Wang, Y.; Wang, P.; Lin, C. Construction of urban ecological security pattern and construction land development based on MCR Model. Trans. Chin. Soc. Agric. Eng. 2018, 34, 257–265. [Google Scholar]
  34. Huang, M.Y.; Yue, W.Z.; Feng, S.R.; Zhang, J.H. Spatial-temporal evolution of habitat quality and analysis of landscape patterns in Dabie Mountain area of west Anhui province based on InVEST model. Acta Ecol. Sin. 2020, 40, 2895–2906. [Google Scholar]
  35. Zhang, R.; Zhang, L.; Zhong, Q.; Zhang, Q.; Ji, Y.; Song, P.; Wang, Q. An optimized evaluation method of an urban ecological network: The case of the Minhang District of Shanghai. Urban For. Urban Green. 2021, 62, 127158. [Google Scholar] [CrossRef]
  36. Wang, Y.; Qu, Z.; Zhong, Q.; Zhang, Q.; Zhang, L.; Zhang, R.; Yi, Y.; Zhang, G.; Li, X.; Liu, J. Delimitation of ecological corridors in a highly urbanizing region based on circuit theory and MSPA. Ecol. Indic. 2022, 142, 109258. [Google Scholar] [CrossRef]
  37. Hudson, A.R.; Peters, D.P.C.; Blair, J.M.; Childers, D.L.; Doran, P.T.; Geil, K.; Gooseff, M.; Gross, K.L.; Haddad, N.M.; Pastore, M.A.; et al. Cross-Site Comparisons of Dryland Ecosystem Response to Climate Change in the US Long-Term Ecological Research Network. Bioscience 2022, 72, 889–907. [Google Scholar] [CrossRef] [PubMed]
  38. Wang, Q.; Fu, M.; Wei, L.; Han, Y.; Shi, N.; Li, J.; Quan, Z. Urban ecological security pattern based on source-sink landscape theory and MCR model: A case study of Ningguo City, Anhui Province. Acta Sci. Circumstantiae 2016, 36, 4546–4554. [Google Scholar]
  39. Li, S.; Xiao, W.; Zhao, Y.; Lv, X. Incorporating ecological risk index in the multi-process MCRE model to optimize the ecological security pattern in a semi-arid area with intensive coal mining: A case study in northern China. J. Clean. Prod. 2020, 247, 119143. [Google Scholar] [CrossRef]
  40. Li, Z.-T.; Li, M.; Xia, B.-C. Spatio-temporal dynamics of ecological security pattern of the Pearl River Delta urban agglomeration based on LUCC simulation. Ecol. Indic. 2020, 114, 106319. [Google Scholar] [CrossRef]
  41. Ni, Q.L.; Hou, H.P.; Ding, Z.Y.; Li, Y.B.; Li, J.R. Ecological remediation zoning of territory based on the ecological security pattern recognition: Taking Jiawang district of Xuzhou city as an example. J. Nat. Resour. 2020, 35, 204–216. [Google Scholar]
  42. Wang, H.; Li, H.; Xie, M.; Xu, M.; Li, S.; Bai, Z. Construction of ecological security pattern for systematic restoration of industrial and mining land in resource-based cities. J. Nat. Resour. 2020, 35, 162–173. [Google Scholar]
  43. Ren, H.; Zhang, J.J.; Zhu, W.B.; Wang, L.; Zhang, L.; Zhu, L. Impact of land use change on habitat in the Qihe River Basin of Taihang Mountains. Prog. Geogr. 2018, 37, 1693–1704. [Google Scholar]
  44. Jiang, Y.; Gao, J.; Yang, L.; Wu, S.; Dai, E. The interactive effects of elevation, precipitation and lithology on karst rainfall and runoff erosivity. Catena 2021, 207, 105588. [Google Scholar] [CrossRef]
  45. Zhu, M.; Yang, Q.; Wang, C.; Zhang, X.; Liu, B.; Wei, X.; Pang, G.; Li, Y.; Tu, X. Sampling Survey Method of Regional Soil Erosion Based on Remote Sensing Images. J. Soil Water Conserv. 2019, 33, 64–71. [Google Scholar]
  46. Liu, B.T.; Tao, H.P.; Shi, Z.; Song, C.F.; Guo, B. Spatial Distribution Characteristics of Soil Erodibility K Value in Qinghai-Tibet Plateau. Bull. Soil Water Conserv. 2014, 34, 13–16. [Google Scholar]
  47. Liu, B.; Tao, H.; Song, C.; Guo, B.; Shi, Z. Study on annual variation of rainfall erosivity in southwest China using gravity center model. Trans. Chin. Soc. Agric. Eng. 2012, 28, 113–120. [Google Scholar]
  48. Song, C.F.; Tao, H.P.; Liu, B.T.; Shi, Z.; Guo, B.; Hua, J. Spatial Distribution Characteristics of Soil Erodibility K Value in the Upper Yangtze River. Resour. Environ. Yangtze Basin 2012, 21, 1123–1130. [Google Scholar]
  49. Zhang, D.; Qu, L.P.; Zhang, J.H. Ecological security pattern construction method based on the perspective of ecological supply and demand: A case study of Yangtze River Delta. Acta Ecol. Sin. 2019, 39, 7525–7537. [Google Scholar]
  50. Jia, K.; Zhang, C.; Yang, Y.; You, Z. Delimitation of Urban Growth Boundary Based on the Coordination of Ecology and Residential Activity Spaces: A Case Study of Jinan, China. J. Resour. Ecol. 2019, 10, 518–524. [Google Scholar]
  51. Wang, Y.; Zhou, C. Landscape Ecological Security Pattern in Central Guizhou Urban Agglomeration. J. Ecol. Rural Environ. 2019, 35, 1111–1117. [Google Scholar]
  52. Dai, X.; Li, Z.; Lin, S.; Xu, W. Assessment and zoning of eco-environmental sensitivity for a typical developing province in China. Stoch. Environ. Res. Risk Assess. 2012, 26, 1095–1107. [Google Scholar] [CrossRef]
  53. Liu, H.; Chen, J.; Zhang, L.; Sun, K.; Cao, W. Simulation effects of clean water corridor technology on the control of non-point source pollution in the Paihe River basin, Chaohu lake. Environ. Sci. Pollut. Res. 2021, 28, 23534–23546. [Google Scholar] [CrossRef] [PubMed]
  54. Yao, X.J.; Hu, Y.; Li, J.L.; Jiang, D. Construction of ecological security pattern based on Pressure-state-response model in Linquan county of Anhui Province. J. Anhui Agric. Univ. 2020, 47, 538–546. [Google Scholar]
  55. Yu, H.; Gu, X.; Liu, G.; Fan, X.; Zhao, Q.; Zhang, Q. Construction of Regional Ecological Security Patterns Based on Multi-Criteria Decision Making and Circuit Theory. Remote Sens. 2022, 14, 527. [Google Scholar] [CrossRef]
  56. Li, J.; Xu, J.; Chu, J. The Construction of a Regional Ecological Security Pattern Based on Circuit Theory. Sustainability 2019, 11, 6343. [Google Scholar] [CrossRef] [Green Version]
  57. Zhu, Q.; Yu, K.J.; Li, D.H. The width of ecological corridor in landscape planning. Acta Ecol. Sin. 2005, 25, 2406–2412. [Google Scholar]
Figure 1. Topography of the southern Anhui region.
Remotesensing 15 01385 g001
Figure 2. Framework for constructing the ecological security pattern in southern Anhui.
Remotesensing 15 01385 g002
Figure 3. Spatial pattern of four types of ecosystem services in southern Anhui; (a) HQ: Habitat Quality; (b) WY: Water Yield; (c) CF: Carbon Fixation; (d) SR: Soil Retention.
Remotesensing 15 01385 g003
Figure 4. Trade-off and synergy analysis of ecosystem services in southern Anhui.
Remotesensing 15 01385 g004
Figure 5. Spatial distribution pattern of ecological sensitivity factors in the study area; (a) shows land use; (b) shows the elevation; (c) shows the slope; (d) shows NDVI; (e) shows the degree of soil erosion; (f) shows the soil type.
Remotesensing 15 01385 g005
Figure 6. Ecological resistance surface in southern Anhui; (a) is the reciprocal of habitat quality; (b) is the night light index after standardization; (c) is the night light index after standardization; (d) is the landscape resistance surface.
Remotesensing 15 01385 g006
Figure 7. Construction of ecological source sites in southern Anhui; (a) is the importance of ecosystem services; (b) is the ecological sensitivity; (c) is the spatial distribution of comprehensive evaluation results; (d) is the ecological source. (Note: 1 to 5 as extreme, slightly poor, medium, good, and excellent, respectively).
Remotesensing 15 01385 g007
Figure 8. Distribution of ecological corridors in southern Anhui; (a) shows the spatial distribution of ecological sources and corridors; (b) is the current value of the pinch point; (c) is the current value of the obstacle point; (d) is the centrality score of the ecological source.
Remotesensing 15 01385 g008
Figure 9. Construction of the ecological security pattern in southern Anhui.
Remotesensing 15 01385 g009
Table 1. Data sources and descriptions.
DataSourceSpatial ResolutionData Use
DEMGeospatial Data Cloud30 mLS factors, ecological sensitivity calculations
Anhui Provincial Statistical Yearbook, Nature Reserve LocationAnhui Provincial Department of Statistics-Regional profile
China 1:1 million soil database DataCentre for Resource and Environmental Sciences, Chinese Academy of Sciences1000 mSoil retention calculation
30 m resolution land use data of southern Anhui Province DataCenter for Resource and Environmental Sciences, Chinese Academy of Sciences30 mCalculation of habitat quality, ecological sensitivity
Evapotranspiration dataWorldclim1 kmWater conservation calculations
Annual NDVI dataCenter for Resource and Environmental Sciences, Chinese Academy of Sciences30 mEcological sensitivity calculations
MODIS_NPP datasetInternational Science Service Platform250 mCalculation of carbon sequestration and oxygen release
Climate dataChina Meteorological Network-Soil retention calculation
Table 2. Grading and weighting of ecological sensitivity evaluation factors.
Evaluation FactorsSensitivity ValuesWeights
97531
NDVI>0.75(0.65, 0.75](0.50, 0.65](0.35, 0.50]≤0.350.20
Elevation (m)≤500(500, 1000](1000, 1500](1500, 2000]>20000.15
Slope (°)≤5(5, 10](10, 15](15, 25]>250.15
Land useForestland, watersGrasslandCroplandBare landConstructions0.20
Soil erosion (t/ha)extremely sensitivehighly sensitivemoderately sensitivemildly sensitivenot sensitive0.30
Disclaimer/Publisher’s Note: The statements, opinions and data contained in all publications are solely those of the individual author(s) and contributor(s) and not of MDPI and/or the editor(s). MDPI and/or the editor(s) disclaim responsibility for any injury to people or property resulting from any ideas, methods, instructions or products referred to in the content.

