Abstract
In the general framework of the atmosphere, the in-depth study of extreme events of complex nature such as tropical cyclones remains an open problem. Nowadays, there are different useful studies aiming to enlarge the current knowledge of these events. Under this perspective, the search for mechanisms and geographical areas of formation and dynamics of tropical cyclones at different latitudes needs better constraints on their preliminary results. This work focuses on a diagnostic analysis of a tropical cyclone, with the aim of identifying key points that characterize its evolution, from a dynamic and observational point of view. The study is applied to Hurricane Faraji, the most powerful tropical cyclone of the 2021 Indian Ocean season, classified as fifth-category on the Saffir–Simpson intensity scale. The study develops in three main sections, all related to each other. The starting point is a large set of satellite products from both polar and geostationary platforms. From the data acquired by the polar instruments, an accurate study of the evolution of the hurricane is carried out, focused on the extraction of physical information related to the system (temperature and altitude of the associated cloudy system, temperature gradient, pressure in the different regions) at moderate resolutions. From the data acquired by the geostationary instruments, it is possible to obtain very high temporal resolution pictures of the temperature field of the cyclone, from which a study of the turbulent dynamics is carried out. In particular, to investigate the maximum energy content in the different regions of the cyclone, the Proper Orthogonal Decomposition (POD) technique is used to extract the associated spectra of both the spatial and temporal components, studied separately on three different ranges of scales.
1. Introduction
The characterization and fine description of a tropical cyclone are extensively studied in the general context of atmospheric physics. Since the 1970s–80s, various methods have been proposed to investigate the characteristics of this type of extreme events, mainly concerning their formation and evolution. There are currently several satellite remote sensing techniques used for the data acquisition and analysis, aimed at providing increasingly in-depth diagnostics and accurate forecasts [1,2]. Considering their impacts on infrastructures, transports, society and everyday life in general, remote sensing has become pivotal in detecting, characterizing, tracing and forecasting such extreme events [3,4]. The categorization of a tropical cyclone in the Saffir–Simpson scale depends on physical parameters, such as vertical wind shear, short-time maximum sustained wind and pressure minima [5,6,7], that can be dealt with by satellite remote sensing. This work concerns the diagnostic study of the physical evolution of Faraji, the first tropical cyclone of the 2021 season that reached category 5 on the Saffir–Simpson scale, using a large satellite database, and the use of some remote sensing techniques is the main focus. The first part of the work is centered on data collected during the rapid intensification phase of the Indian-Ocean hurricane Faraji, by the Spinning Enhanced Visible Infra-Red Imager (SEVIRI) radiometer, orbiting onboard the geostationary satellite Meteosat Second Generation 8 Indian Ocean Data Collection (MSG-8 IODC) [8]. With this specific database, an in-depth study of the spatiotemporal dynamics of Faraji using the proper orthogonal decomposition (POD) technique was carried out [9,10,11,12,13]. This technique allows to extract a set of empirical basis functions from a generic ensemble of snapshots (typically representing the time evolution) of a field, that can therefore be written as a linear superposition of orthogonal eigenfunctions, the so-called POD modes. Such eigenfunctions have the remarkable property of capturing the most energetic content (on average) of the field itself, thus their spectrum is “optimal”, in the sense that it retains the majority of the energetic content of the signal in the lowest number of modes. This is carried out by using the different realizations of the field to construct an autocorrelation matrix, then solving an eigenvalue problem (Fredholm problem of the first type ) [14,15,16,17] which allows to extract the empirical basis that, on average, maximizes the “projection” of the field on each of its members. Thus, the spatial and temporal components of the dynamics, described by the extracted eigenfunctions and coefficients, respectively, are factorized and while the eigenfunctions keep into account the spatial distribution of the energy of the field, the coefficients account for its temporal dynamics. In [9], we carried out this analysis to extract the POD eigenfunctions and coefficients from a collection of satellite products related to the brightness temperature of the Faraji cyclone. From this extraction, the energy content is studied by separating the two components and building up energy spectra, in which it is possible to visualize how the hurricane evolves into three different characteristic ranges of scales. On the different ranges of scales, we study the turbulent motions of the cyclones, characterized by the presence of “coherent structures”, namely energy-containing, velocity field structures that persist in the flow for several nonlinear turnover times. In the first part of the present work, we perform a similar analysis on the same dataset, by using this time the effective temperature, instead of the brightness temperature. The reason for doing so is that the effective temperature is more physically meaningful with respect to the brightness temperature and, moreover, it also gives information on other interesting physical quantities, such as the altitude (top of the cloud system) of the cyclone. The analysis, as seen below, confirms the results obtained in the previous investigation, by again showing a clear separation of the turbulent effective temperature field in three regions of scales, both spatial and temporal, thus allowing to separately follow the turbulent evolution of the field independently in the various range of scales. Nevertheless, as in the previous study, the mechanisms distinguishing the formation of inertial and dissipative turbulence scales are not investigated.
In the second part of the work, the specifications of the polar and quasi-polar satellites are best exploited, considering a radiometric instrumentation capable of providing 1–2 satellite images per day at higher spatial resolution than the ones allowed by SEVIRI. Three radiometers were chosen for the acquisition of data and images, they are: MODIS (Moderate-Resolution Imaging Spectroradiometer from Earth Observation System (EOS)-Terra/Aqua) satellites, SLSTR (Sea and Land Surface Temperature Radiometer) from Sentinel-3 platform and VIIRS (Visible/Infrared Imager Radiometer Suite) from Suomi NPP (Suomi National Polar-orbiting Partnership) satellite [18,19,20,21], whose characteristics allow to extract from the same event some physical quantities that can characterize Faraji’s evolution throughout its lifetime. In this case we acquire 32 products, having the spatial and temporal characteristics strictly dependent on the specifications of the satellite instrument, in order to describe the evolution of the event. The extraction of the physical parameters of interest for the cyclone is carried out by exploiting the brightness temperature data in the pixel of the matrix-image representative of the event at a given time. From them, it is possible to derive the values of effective temperature, associated-cloud altitude, temperature gradient and atmospheric pressure, in the observed structure of Faraji.
Considering the recorded values of air temperature at 2 m above sea level (a.s.l.) from the GLOBO—Southern Hemisphere forecasting model [22], knowing the scale height, the value of the pressure in the eye of the cyclone is evaluated for each of the products. In this way, a detailed temporal trend of these values is obtained from the different used radiometers, and this allows to verify the hurricane intensity variations at the considered sensing times. The diagnostic of the event from an observational point of view is supported by an evaluation of the temporal evolution of the minimum pressure calculated in the eye of the cyclone, based on the results obtained by different radiometers. The overall results are compared to the eye-pressure values obtained from NASA’s Storms Map in the Zoom Earth database [23].
For this work, we chose to investigate the evolution of the Faraji cyclone to confirm the high efficiency of meteorological earth observation exploited through the quality of the acquired data describing its behavior. Faraji represents one of the most recent events of this kind and its 12-day lifecycle started on 5 February close to the Chagos Archipelago as a Moderate Tropical Storm; it became a Tropical Cyclone moving eastward on 7 February, before reaching its maximum intensity in oceanic waters two days later. Peaking as Very Intense Tropical Cyclone between 8–9 February, its outermost zone generated important rainfalls near La Réunion island. Its central impact area did not move significantly later on, during its weakening phase. Turning back to Tropical Depression, Faraji virtually ended on 15 February 2021 [24,25].
2. Methods
Generally, satellite applications and missions can span different domains depending on the type and characteristics of the used platforms. In this work, we chose to exploit some characteristics of two types of satellites in order to highlight their capabilities from remote sensing techniques, by combining two different analyses. With the choice of different databases used, we want to bring out a comprehensive methodology for investigating Faraji cyclone, emphasizing data processing procedures to study its diagnostics from different perspectives.
More precisely, it is possible to exploit the important peculiarities of geostationary platforms to follow the evolution of the structure of the event at short time intervals in order to construct an analysis of the energy content distributed on different scales. On the other hand, an observational analysis of the event is best exploited by taking into account the capabilities of polar platform sensors. From the data obtained from these latter, we develop a processing procedure from which we empirically extract important information on the physical quantities about the description of the cyclone in the observed scenes.
2.1. Geostationary Instrument Analysis
Orbiting about 36,000 km above the Earth’s surface, SEVIRI onboard the geostationary MSG-8 IODC provides near real-time images of weather processes over the Indian Ocean [8]. It has low spatial resolutions (pixel dimension of 3 km at nadir) but very high revisiting temporal cycles (5–60 min).
To cover the entire structure of Faraji during its maximum intensity phase [24,25], we acquired N = 93 SEVIRI products, spaced by 15 min, in a 23-h total window across 8–9 February 2021.
The geographical area of action of the cyclone is visible in Figure 1 for one of the chosen sensing time in total temporal window, from a raw image acquired from the SEVIRI sensor, constituting the initial database. From this, the 93 chosen SEVIRI products are resized, thus we extract an area of for each snapshot, with pixels and pixels. For each pixel, we convert Digital Number data DNs to radiance , using the linear relationship:
with DN transformed by the calibration parameters g (gain) and b (offset). Then, the value of the brightness temperature is obtained by inverting Planck’s law [26,27]:
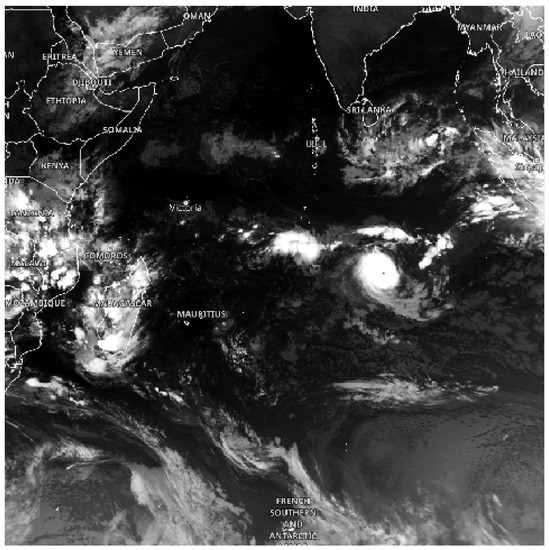
Figure 1.
SEVIRI raw image of 8 February 2021, 18.00 UTC, showing the geographical impact area of the Faraji cyclone during its phase of maximum intensification.
Brightness temperature value is not considered as a real physical quantity, but it is formally related with the radiation quantity hitting the satellite sensor at the moment of the acquisition. These temperature data in the pixels are extracted considering the thermal infrared (TIR) spectral channel, whose central wavelength is m, and the value of emissivity set as one in order to neglect reflected radiance in the line of sight between the radiometer and the object.
The first method used to post-process remote sensed data is an empirical method that allows to derive the physical quantities of altitude and temperature associated with the Faraji cloud system. The calculation procedure is described by the following system of linear equations, in which altitude H (the top of the cloud system) and temperature are coupled:
In these equations, the value of the temperature is obtained in order to identify the physical representation of the real temperature of the different layers of Faraji cloud system, also considering the relationship with the top height of the clouds. According to the information from the clouds structure of the cyclone, we define this quantity as effective temperature. In addition, the two constant parameters correspond to the conditions for which the air temperature drops 9.84 C per 1000 m of altitude, and the dew point drops 1.82 C per 1000 m of altitude, respectively [28]; is considered as a known parameter, associated with the average daily value of air temperature at 2 m above sea level, determined from GLOBO—Southern Hemisphere forecasting model. The most significant assumption here is that the satellite-recorded brightness temperature coincides with the dew point ().
This equivalence is based on the assumption of the conditions of instability that lead to the formation of clouds on the first layers of the atmosphere. In general, clouds form when the condensation begins, so the air cools to the dew point and the relative humidity rises a little over 100%. The altitude where clouds form is called the condensation level and, in our case, we consider the value of the dew point, at which the clouds are formed because of the instability, as the value of brightness temperature associated with the pixels that represent the cloud system at different altitudes.
Using this information, it is possible to solve the system of Equation (3), which becomes:
From the scalar field thus obtained, we start to study the turbulent and non-linear dynamics of the Faraji hurricane. For cases of non-homogeneous and anisotropic fluids, as the examined event can be considered, many studies of the turbulent evolution of the structures that characterize the system have been carried out. In particular, the technique chosen in this work for this type of analysis is the Proper Orthogonal Decomposition [9,10,11,12,13] method. This technique allows to obtain an optimal decomposition of a scalar or vector field defined on a space-time domain.
The Proper Orthogonal Decomposition is a technique initially formulated as a tool to study the development and evolution of turbulence in a statistically stationary dataset, namely an ensemble of data in which there are no large-scale transient states. It is well known that in such conditions the turbulent dynamics of a flow develops through the continuous birth and destruction of energetic structures, the so-called “coherent structures”, which tend to appear where the local gradients of the velocity field are stronger. Since the dynamics of such energetic structures is believed to strongly influence the characteristics and development of the turbulence, a technique that is able to capture and follow such coherent structures is a key tool to understand the bulk of the evolution of turbulent motions.
In its more general form the analysis starts from a set of temporal realizations of a nonhomogeneous, square integrable vector field (), defined on a finite domain D. The idea is to find the most similar function to the elements of the set on average, that is to determine the highest correlated structure (in a mean-square sense) with all the elements of the set of realizations, or the function which maximizes on average its projection on each member of the dataset. This corresponds to determine a vector function such that:
where is the average over the realizations (generally a time average) and the symbol represents a scalar product. It can be shown that a denumerable set of such solutions exists and they can be written as the solutions of a Fredholm integral equation of the first kind:
where the suffixes represent the vector components and is the two-point correlation tensor.
This is basically an eigenvalue problem and it is possible to show that the eigenfunctions are orthonormal and the corresponding eigenvalues are always real and positive. Therefore, every member of the original dataset can be reconstructed by means of a modal decomposition using the eigenfunctions as:
Such a decomposition has some quite interesting mathematical properties, which can also be used to check the correct evaluation of the eigenfunctions and of the coefficients. For instance, the coefficients of the expansion have to be uncorrelated: , and the sum of all the eigenvalues must be equal to the total turbulent kinetic energy of the flow:
E being the total turbulent kinetic energy averaged in time. The latter can be easily computed starting from the original dataset, and then the formula can be used to check the correctness in the calculation of the eigenvalues . Even more important is the fact that this formula states that the eigenvalues (which must be positively defined, as specified above) represent actually the average of the energy contained in the n-th POD mode. Moreover, since the diagonal part of the correlation tensor is twice the kinetic energy in each point of the domain, each eigenfunction maximizes the residual energy of the flow, that is it represents the most energetic structures of the original dataset, hence the coherent structures of the turbulent flow.
Finally, another straightforward test is to reconstruct the original dataset starting from the computed eigenfunctions and coefficients. The code that realizes the decomposition has been extensively tested using the properties mentioned above and it gives good results up to the machine precision. Therefore, we can be confident about the fact that the decomposition is correctly calculated.
It is worth noting that in what we said until now the dataset to analyze was supposed to be a three-dimensional vector field, but an analogous development can be written also for a scalar field in a spatial domain with a different number of dimensions. For our case, the effective temperature scalar field of the Faraji system is considered, depending on space and time coordinates, as . Our aim is to look for a decomposition of this field. The POD gives us the representation of the field in the form:
where are time-dependent modal coefficients and are basis functions which depend on space variables only. In this way, the spatial and time dependences are factorized and the evolution of the two can be separately evaluated.
Again, the basis functions are obtained as the solutions of a Fredholm integral equation [14,15,16,17], in the form of an eigenvalue problem of second kind, from which we obtain an infinite number of real and positive eigenvalues and the same infinite number of real eigenfunctions . These are mutually orthogonal in space, therefore they allow us to reconstruct the temperature field with partial sums at different ranges of scales. Since this work is based on the study of a typical mesoscale event in the unified classification proposed by Orlanski for atmospheric motions [29], we have chosen to subdivide the scale ranges by also referring to the characteristic scales of turbulence [30], thus taking into account our own subclassification that aims to better describe Faraji’s dynamical behavior, both in terms of atmospheric visualization and energy content distribution in the modes extracted from the decomposition technique.
We find the eigenfunctions , the eigenvalues , representing the time-average of the energy contained in the j-th POD mode, sorted in descending order, and the coefficients of the POD development, respectively, with . We adopt a generally accepted criterion to select the most meaningful eigenfunctions, which consists in considering the most energetic modes whose sum reachs at least the of the average energy [15,16,17]. This selection is associated with the first most energetic eigenvalues. Figure 2 shows the cumulative energy of these modes (red line), which converges to the selected threshold corresponding to the of the energy (blue line) at about . As the effective temperature is a positive-definite quantity, we subtracted from each snapshot the time average of the field , in order to do the analysis on the temperature fluctuations only. We did this because we are interested in capturing the spatial and temporal evolution of the turbulent structures. By retaining the average of the temperature, the first POD mode would have been coincident with this average and would have captured the bulk of the energy of the flow. However, this large-scale structure is not directly related to the turbulent fluctuations at small scales whose study we are interested in, therefore we excluded it a priori from the computation and limited our attention to the evolution of the turbulent motions.
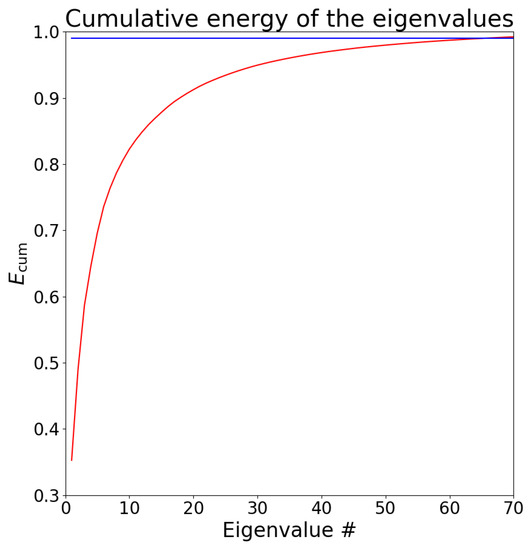
Figure 2.
Cumulative energy of the eigenvalues, attaining the threshold of the of the average energy of the field.
Thanks to the orthogonality of POD eigenfunctions, we finally apply the reconstruction of values inside the cyclone at different spatial scales, using the partial sums in the same analytical form of the field:
2.2. Polar Instrument Data Analysis
The starting point of the polar-satellite-based evaluation of the lifetime action of the Faraji hurricane depends on the revisit characteristics of the three Low Earth Orbit (LEO) satellite missions selected for this study (Table 1).

Table 1.
Sensors and platforms exploited in this paper. All instruments have a global spatial coverage [31]. The numbers in brackets in the fourth column, indicate the band numbers that correspond to that spatial resolution value.
A priori, the use of these instruments is connected to their characteristics (see Table 1), for which it is possible to acquire specific types of images, aimed at describing the observed phenomenon in detail. Three radiometers are onboard quasi-polar orbiting platforms. Generally, these allow an acquisition with moderate spatial resolution, which is very high if compared to the spatial extent of the well-defined structure of the cyclone.
From the characteristics of the instruments reported in Table 1, the evolution in the different lifedays of Faraji has been studied comparing data and images contained in the database reported in Table 2. All images are analyzed in the spectral bands of thermal infrared (TIR), in order to study the moments of formation and intensification through the fluctuations of the physical quantities of interest. It is worth noting that images acquired in daylight sensing times (7 from MODIS and 4 from SLSTR) are affected by reflected radiance, which, although negligible in the TIR range, may contribute to a slight overestimate of the temperatures. The values of central wavelengths of selected TIR bands slightly vary according to the considered sensor: the band 32 of MODIS contains a central wavelength m; the M16 band of VIIRS has a central wavelength of m; the S9 band of SLSTR has a central wavelength of m [18,19,21].

Table 2.
Spaceborne imagery acquired from the LEO satellites for this study. The hours marked with an asterisk indicate nighttime satellite images.
2.2.1. MODIS Data Processing
We acquired 15 images from the MODIS sensors onboard the EOS platforms Terra and Aqua. The Terra’s orbit has descending equator crossing in daylight hours (10:30 UTC), while the orbit of Aqua is ascending early in the afternoon (13:30 UTC) [18]. Data are expressed in emissive radiance at-satellite L, measured in W m sr m and integrated for each pixel on the entire wavelength channel interval.
Before data computation, all images undergo georeferencing [32] and resizing to coregistered pixel windows. In order to obtain the brightness temperature field, we apply Equation (2), considering the central wavelength value of MODIS TIR band 32. In the Temperature Map, the range of values is divided into 13 subranges of average width = 3.7 K, associated with a specific color-scale.
This allows highlighting the temperature field changes, in time and space, during the hurricane evolution. As thermal variations are associated with the different layers composing the cloud system of Faraji, the next step is to calculate the value of altitude H and effective temperature , using Equation (4), again considering as the average daily value of air temperature at 2 m a.s.l. and assuming .
With and H data, we can carry out a semi-qualitative evaluation of the temperature gradient associated with each cloud layer, using the daily mean value of sea surface temperature recorded and acquired by GLOBO—Southern Hemisphere forecasting model.
We use Equation (7), to estimate locally the temperature variation for changing altitude, as a first form of evaluation of the thermal exchanges that take place within the cloudy system. The final result highlights the presence of atmospheric instability conditions within the system, generally expressed by the conditions [5,6,7]:
- K/m (absolute atmospheric instability), in which the numerical value is the dry adiabatic vertical gradient in stability conditions of the standard atmosphere
- K/m K/m (conditionally atmospheric instability), in which the vertical temperature gradient is between the numerical values of moist adiabatic vertical gradient and dry adiabatic vertical gradient
By correlating the data obtained in the images it is possible to observe how instability evolves with the daily evolution of the hurricane.
Based on altitude and effective temperature data, the atmospheric pressure field in the system is extracted from the image database. The first step for this calculation is to derive, from the field of effective temperature, the value of the scale height .
In Equation (8), J Kg K is the specific gas constant of dry air and m s is the gravitational acceleration. We observe that T, which corresponds to the value of , is strictly dependent on the value of H, as defined in Equation (4), implying the direct proportionality of these two quantities with .
From H and , we extract the atmospheric pressure values for each cloud layer:
H values and the sea level pressure in standard conditions, equal to hPa, allow estimating pressure value with exponential law [5,6], in Equation (9).
This provides an evaluation of pressure levels in the different layers of the hurricane, and highlights the strong correlation of pressure with temperature and altitude layers.
2.2.2. SLSTR Data Processing
Onboard Sentinel-3A/3B, put in sunsynchronous orbit with descending equator crossing time at 10:00 UTC, SLSTR builds on the background of radiometers ATSR-2, onboard ERS-2 satellite, and AATSR, onboard ENVISAT satellite [21]. Its pixel writing is based on oblique conical scanning with a large cross-nadir swath of 1400 km and aft-viewing swath of 740 km, allowing for a revisit interval of the order of 0.9 days. Considering all products in the same size, the exploited database consists of 8 images in the TIR S9 band, of the size of pixel and with pixel size of 1 km, as described in Table 2. The SLSTR database is acquired from the Copernicus Open Access Hub, from which we obtain the images with pixels containing the data in brightness temperature. Here, the scope is to improve consistency of the Faraji dynamics analysis by comparison with the results obtained from MODIS. Image processing and physical quantities extraction techniques are same as for MODIS, in a sequence of temperature maps creation (temperature subranges of average width K), computation of , H using Equation (4) and the temperature gradient Equation (7), also considering the cut-off value of atmospheric instability conditions. After comparison with MODIS borne results, the scale height (Equation (8)), and the atmospheric pressure field (Equation (9)) are calculated again.
2.2.3. VIIRS Data Processing
Further analysis of data from polar platforms was carried out on the set of images acquired by the VIIRS sensor onboard Suomi NPP satellite [19,20], having is sunsynchronous orbit with ascending equator crossing time at 13:25 UTC. In this study we exploited the TIR M16 band of 9 VIIRS images (Table 2), with pixel size of 750 m. The images are expressed as matrices of pixel. The processing sequence was the same as that of SLSTR, with which VIIRS shares the central wavelength of the TIR band considered.
Taking into account the slightly improved TIR spatial resolution of VIIRS with respect to MODIS and SLSTR (750 m vs. 1000 m), we focus on the space-time changes of the Faraji structure highlighted by the full LEO database. In order to confirm the Faraji diagnostic evolution, we use the remote-sensed results to build up a time series map of the pressure in the eye of the cyclone, comparing our values with the recorded mean sea level pressure (MSLP) data of the storms map of the NASA’s Zoom Earth database, available from cyclones best track archives, mainly exploiting aircrafts data reconstructions [23]. Following the impact area of Faraji, we consider the layers below the satellite-obtained altitude value m, fixing scale height value m for all the scenes. The variability of values below the altitude limit allows us to calculate a range of pressure values, according to the exponential law, that characterize the eye area in all sensing times and for all three sensors.
3. Results
3.1. Geostationary Data Analysis
The sequence in Figure 3, showing the temporal evolution of Faraji, is a subset of the total database acquired by the SEVIRI sensor onboard MSG-8 IODC. This image series is taken as the representation of a part of the raw images in the total database. In these we show the result of the resizing of the observed scene, which centers the Faraji’s structure in the geographical area at the different sensing times, from which we start to extract the effective temperature field. We applied the POD to the set of 93 images, corresponding to one single day of the lifetime of Faraji, during its maximum intensity phase. We did not consider the whole cyclone’s lifetime since the POD analysis applies better to data with no transient states.
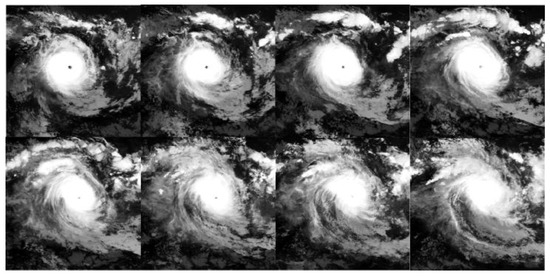
Figure 3.
TIR band (m central wavelength), gray-scale imagery of Faraji cyclone, as observed by the SEVIRI radiometer, between 12.00 UTC of 8 February 2021 and 09.00 UTC of 9 February 2021, in 3-h steps.
In Figure 4, the shaded images of the field of Faraji are shown, using the same temporal sequence of Figure 3. Their time averages allow identifying the central structure of the Faraji system, as shown in comparison with the field (Figure 5). In this comparison, it is visible that slight small scale differences highlight the dependence of the values on 2-m a.s.l. air temperature and altitude quantities.
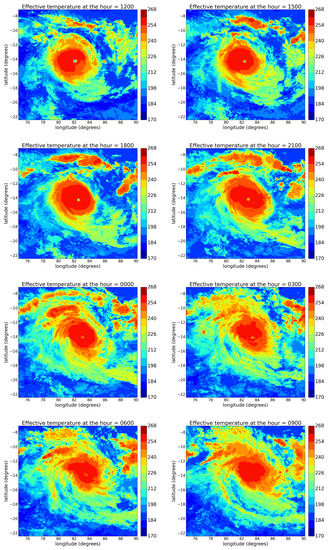
Figure 4.
Shaded images of effective temperature evolution in time of Faraji cyclone, from 12.00 UTC (8 February 2021) to 09.00 UTC (9 February 2021), in 3-h steps, as in Figure 11.
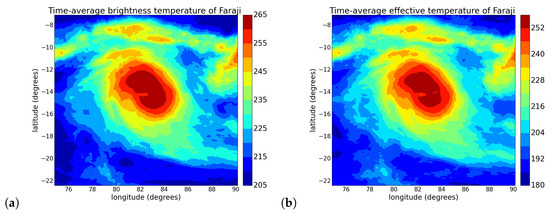
Figure 5.
Comparison between the brightness temperature (a) and the effective temperature (b) of the Faraji cyclone.
In paper [9], by analyzing the brightness temperature, we found there was a strict correspondence between the modes of the POD spectrum and the corresponding Fourier modes computed through an ordinary two-dimensional Fast Fourier Transform and by averaging in time the shell-integrated spectra of each single snapshot of the brightness temperature, it was possible to clearly distinguish in the resulting spectrum three different zones. We interpreted the presence of these two breakpoints in the spectrum of the temperature as due to a change, at given scales, in the dynamics of turbulent motions. Therefore, we classified the three zones of the spectrum as belonging to three different ranges of scales: large scales, intermediate scales and small scales, the different spectral slopes indicating likely different mechanisms generating the turbulent fluctuations.
To check whether this phenomenology is recovered also in the analysis of the effective temperature, we calculate the Fourier spectrum of integrated over the space of wave vectors for each snapshot, dividing this plane into 2D concentric circular regions, called shells. For each shell the energy contributions are calculated by adding up the energies of all Fourier modes having a wavevector falling inside the given shell, with . After that, this shell-integrated spectrum is averaged over all the different sensing times, in order to evaluate the spatial mode energy content of the Faraji dynamics, as plotted in Figure 6.
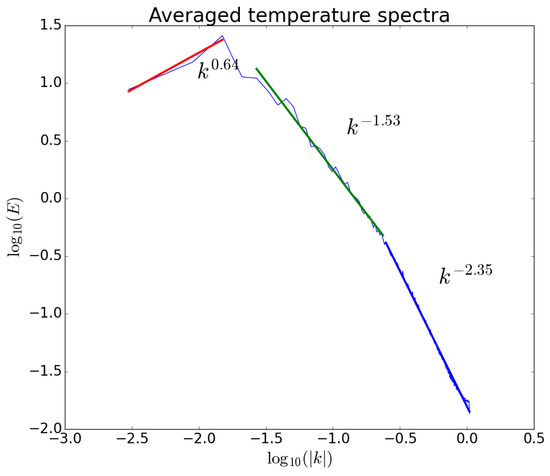
Figure 6.
Integrated spectrum of the spatial component of the dynamics of Faraji, averaged over all instants acquisition times, starting from the Fourier spectrum of field.
The trend of the energy is obtained in a double logarithmic scale from the field as a function of the wave vector. The spectrum shows, also in this case, the fitting power law that gives the spectral indices separately for the three-scales classification previously discussed. If we consider a direct comparison with the spectrum obtained from the brightness temperature field, we can immediately see that the two are identical, and the slope assessment is given according to the same empirical criterion [9]. Moreover, we start from the assumption that in the three zones of the spectrum, that we call Z1, Z2 and Z3, the energy as a function of the modulus of the wavevector obeys to a power law with spectral index . Therefore, as a function of has a linear behavior of the kind: , where we call y and x the logarithms of the two quantities E and K. Then, when there is the breakpoint in the spectrum, for instance between Z1 and Z2, we assume to have the same kind of relation, but with different parameters:
where is the value of k at the boundary of the two zones (for instance Z1 and Z2) where the change in slope between the two power laws takes place. The two straight lines have to assume the same value for : . Since we do not know the value of , we can nonetheless define one of the parameters, for instance as a function of and therefore the function with which we compute the best fit in the two zones Z1 and Z2 becomes:
From this best fit operation we work out the values of the parameters, in particular the spectral slopes and , as well as the breakpoint in the spectrum. By applying the same procedure to the zones Z2 and Z3 we obtain the best fit of the new parameters.
The separation in three different ranges of scales is confirmed by looking at the shell-integrated spectra of eigenfunctions extracted from the POD. We show in the left panel of Figure 7, the plots of three eigenfunctions, corresponding to , , , associated respectively with large, intermediate and small scales, as a function of latitude and longitude; in the right panel, we show the shell-integrated spectra associated with the same eigenfunctions. It is worth noting that the characteristic value of the peak, corresponding to the maximum value of energy, changes as a function of K. In particular, the trend corresponding to the peak of the spectra continuously shifts towards larger wavevectors (smaller scales) as the order of the eigenfunction j increases.
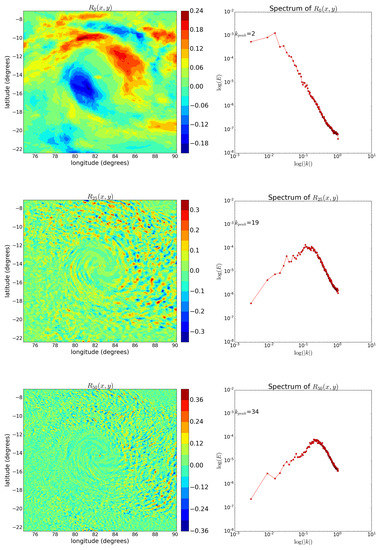
Figure 7.
Left panels: contour plots, as a function of longitude and latitude for the eigenfunctions order (), () and () (corresponding to large, intermediate and small scales) for the Faraji cyclone. Right panels: shell-integrated Fourier spectra in double logarithmic scales for the eigenfunctions order (), () and ().
Concerning the POD temporal coefficients, we analyze the trends of the extracted , and coefficients and their associated Fourier spectra. As for the spatial component, it is clearly visible from the plots in the left panels of Figure 8 that the number of oscillations in time increases for increasing values of j. The right panels show that the frequency corresponding to the maxima, the characteristic , increases with higher values of j.
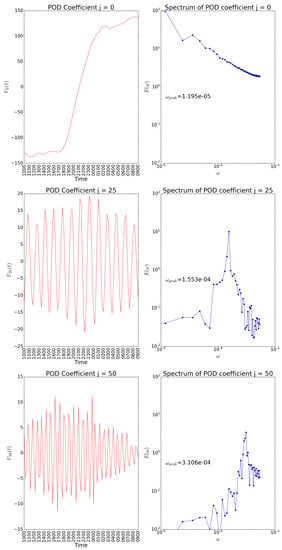
Figure 8.
Left, from top to bottom: plot of the temporal evolution of the POD coefficients , and , extracted from the effective temperature field of the Faraji cyclone. Right, from top to bottom: Fourier spectra of the same coefficients.
The correspondence between Fourier modes and POD eigenfunctions and coefficients resulting from Figure 7 and Figure 8 is a consequence of several effects. The first is the fact that we removed the average part of the field, thus outlining the contribution of turbulent motions to the effective temperature field. The second is the fact that in the inertial range, the turbulent fields are always characterized by a distribution of energy which is decreasing for increasing wavevectors or frequencies. Since the POD modes are ordered in decreasing order of the eigenvalues, which in turn represent the average energies of the modes, it is natural to find that increasing indexes of POD eigenfunctions correspond to increasing Fourier modes both in space and time, as in Figure 7 and Figure 8.
What it is more striking, as already observed in [9], is the fact that the Fourier spectra, shown on the right panels of Figure 7 and Figure 8 are so peaked around a quite narrow range of Fourier modes, as the single POD eigenfunction and coefficient would correspond truly to single Fourier modes. For periodic and statistically homogeneous fields, the POD corresponds to a Fourier analysis, in the sense that the empirical eigenfunctions and coefficients coincide with those that would be obtained through the Fourier analysis, although a cyclone is neither a periodic nor statistically homogeneous phenomenon.
The energy distribution among the POD modes is then analyzed as a function of the characteristic frequency, building the average energy spectrum in the POD modes, which is shown in Figure 9. The energy is taken from the eigenvalues , and shows minor distinction in the three different zones mentioned above: as for the brightness temperature field, the slopes suggest that the energy content decays as for all the three scales.
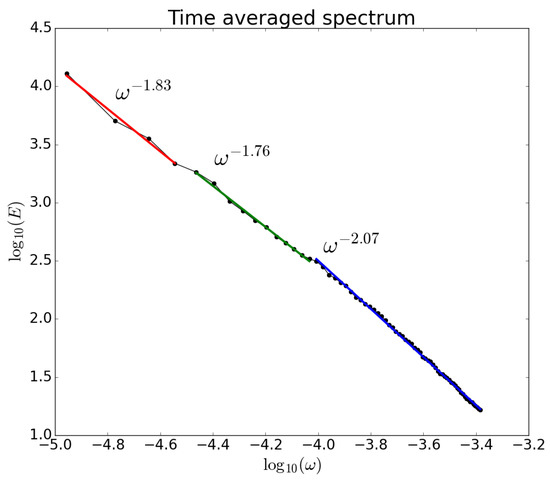
Figure 9.
Energy spectrum of the temporal component of the Faraji effective temperature field. The exponents correspond to the spectral indices of the three different zones, highlighted by the scale separation.
As a final step, we compute the reconstructions for the partial sums of the j-th POD modes for each time instant. We use Equation (6) to extrapolate from the orthogonality of the eigenfunctions the evolution of the effective temperature field in the three distinct scale ranges. Again, the evolution of the cyclone is divided into three different representations, all interrelated. At large scales (Figure 10, panel ), we can identify the cyclone central structure (eye), slightly different but consistent with that of the brightness temperature field (Figure 10, panel ). At intermediate scales (Figure 10, panel ) some filamented structures, related to the central one, remain, all rotating around the eye and with a tendency to expand towards the upper-right part of the cyclone. Some traces of those filamented structures persist also at smaller scales (Figure 10, panel ), although here the most evident phenomenon is the presence of small-scale spots. These trends confirm the not substantial difference in the reconstructions of the brightness temperature field (Figure 10, panel –).
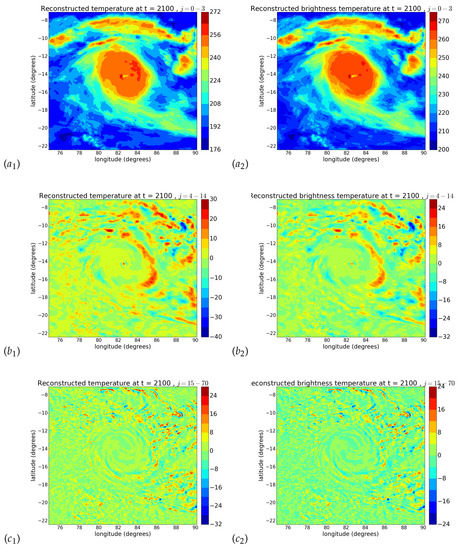
Figure 10.
Comparison between effective temperature field reconstructions (suffix 1) and brightness temperature ones (suffix 2), at 21.00 UTC on 8 February 2021 for Faraji hurricane. We show large scales in (a), intermediate scales in (b) and small scales in (c).
Summarizing, we repeated for the effective temperature, the same POD analysis we had performed in [9] for the brightness temperature at the same observation times, that is physically more meaningful. The obtained results practically confirmed the analysis we made in the previous work.
3.2. LEO Data Analysis
In Figure 11 we propose the example of a post-processing image, representing the results that can be obtained by following all the steps above mentioned, relating to the analysis procedure of the data obtained from the different LEO satellites. Firstly we show two temperature maps. When compared, these show the values obtained directly from the satellite data for the brightness temperature (a) and those for the effective temperature field (b), calculated using Equation (4). From the values themselves, it is possible to observe and distinguish the difference between the information dependent on the data recorded at the time of acquisition and the extracted one from the calculation procedure and the given empirical conditions, which are more physically meaningful for the Faraji behavior. Thereafter we show the subfigures identifying the evaluation of the vertical temperature gradient (c) and the values obtained for the pressure field (d) over the entire scene observed at that sensing time.
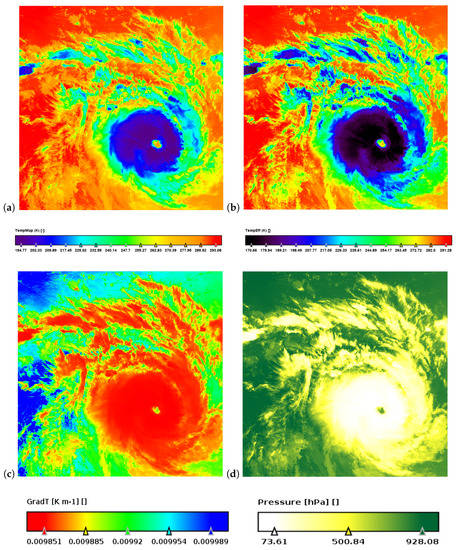
Figure 11.
Example of postprocessing applied to data of all the three sensors, showing the MODIS—Terra image of 8 February 2021, 05.20 UTC. Scene coordinates: from left to right on the top (74.16E, 7.20S)–(84.38E, 7.13S), on the bottom (74.15E, 16.3S)–(84.56E, 15.37S). (a), (b), (c) and pressure field (d).
MODIS data are the only ones pre-processed (Figure 12). In this phase, the aim is to remove bow-tie effects in boundary pixels, UTM WGS-84 reprojected and resized with focus on the cyclone cloud system. When the pre-processing phase is completed, the emissive radiance at-satellite data of TIR band 32 are converted to brightness temperature , in order to build up the temperature map.
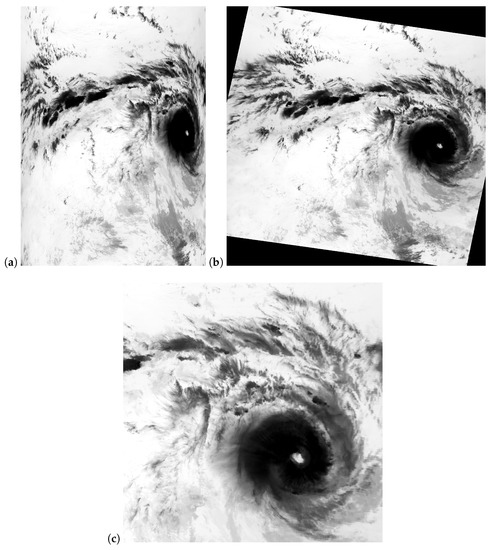
Figure 12.
Sequence of pre-processing steps of the MODIS-Terra image of 05.20 UTC on 8 February 2021: the raw MODIS image is first displayed (a), before the georeference processing (b), and after it is resized and centered on cyclonic system (c). Scene coordinates: from left to right on the top (74.16E, 7.20S)–(84.38E, 7.13S), on the bottom (74.15E, 16.3S)–(84.56E, 15.37S).
The same procedure was applied to process datasets acquired from all the sensors: six images from MODIS—Aqua, nine images from MODIS—Terra, eight images from SLSTR and nine images from VIIRS. In all cases we exploited the TIR spectral bands. For SLSTR and VIIRS the central wavelengths of TIR bands S9 and M16, respectively, are the closest to the MODIS one. M16 has a pixel size of 750 m, unlike the SLSTR and MODIS, whose resampled pixel size is 1000 m.
Starting from temperature maps, the calculation of altitude H and effective temperature is carried out using Equation (3), as previously carried out with the SEVIRI images, and under the assumption that brightness temperatures coincide with the dew point ones ().
In order to perform a better investigation of the temperature changes with changing altitude in the various cloud layers, the calculation of temperature gradient is carried out using Equation (7).
Finally, from and H values, we extract the atmospheric pressure field according to the exponential law in Equation (9).
Initially, we choose to show in Figure 13 a representation of the results obtained by LEO satellites. The figure shows only the four VIIRS images of the sensing times between 7 February and 11 February, with the results for vertical temperature gradient (a) and atmospheric pressure (b). These values are extracted without applying the resizing phase to the raw images of the VIIRS database, in order to show the evolution of the two quantities over time while keeping the same geographical area shown in the scene. In this way, the variations of Faraji in the structure can be observed both in its shape and in its spatial displacement of the area it occupies during the selected lifedays.
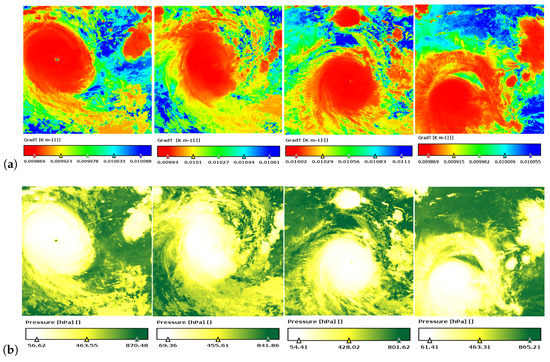
Figure 13.
Temporally ordered sequence of VIIRS not-resized images, from 7 February 00.00 UTC to 11 February 00.00 UTC. Each image represents (a) and P (b) values, extracted in the same geographical area of . Scene coordinates: from left to right on the top (80.00E, 10.00S)–(90.00E, 10.00S), on the bottom (80.00E, 20.00S)–(90.00E, 20.00S).
Furthermore, in order to show the physical quantities evolution in the Faraji structure, from all LEO sensors, in Figure 14 we report all the images resized into 2D representations of pixel, displayed as a sequence of the temporal evolution, in the lifedays from 7 February to 10 February, of the temperature gradient (a) and the pressure field (b) for the cyclone. The main purpose is to highlight, using 20 of the 32 available images from MODIS, SLSTR and VIIRS, the Faraji transformation at different sensing times, and how this is displayed by the three different radiometers. We selected those scenes among the others because at those times the cyclone has a more well-defined central structure and its evolution in the days of greater intensification is better visible in its cloud system.
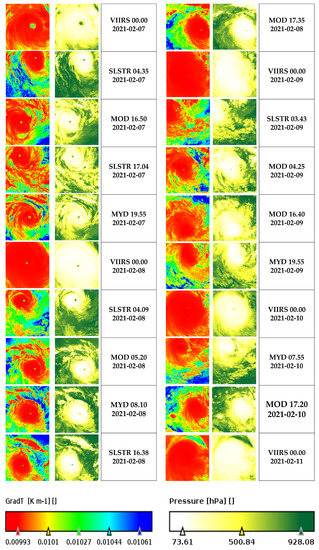
Figure 14.
Temporally ordered sequences of the Faraji’s evolution of (first and fourth columns, from top to bottom) and P (second and fifth columns, from top to bottom) are shown, with the images between 00.00 UTC of 7 February 2021 and 00.00 UTC of 11 February 2021. Color bars identify the range scales of and P, with values averaged over all sensing times.
From a purely observational point of view, the images highlight a clear difference in the scenes acquired by VIIRS (from top to bottom, nos. 1, 6 in the first two columns and nos. 12, 17, 20 in the second two columns), which have, from the resizing application, a more accurate view of the cyclone structure, due to the 750 m pixel size. Taking this into account, mainly from temperature gradient representations, a detailed view where the third dimension appears to be non-flattened is provided.
The coordinates never center on the same geographical area, because of the different visualization of the scene. The study approach is based on how Faraji’s structure changes shape on these different lifedays, where the orbiting platforms perform their respective scene scans. Both from the temperature gradient and the pressure field, whose values in the color bars are represented by applying an average on all the sensing times it is immediately noticed that, already on the earlier hours of 7 February, the cyclone has a well-defined structure of its cloud system (the first two images from top in the first two columns), with the eye becoming more pronounced while the over-ocean drift and a first rapid intensification had occurred. The cyclone entered effectively in the fourth category of the Saffir–Simpson some hours later in the same day (images 3–5), and maintained its structure until the first hours of the next day (images 6 and 7). From images 8–14, it is visible that Faraji just evolves in a very intense tropical cyclone (fifth category), a very well-defined eye and the typical characteristics of an annular tropical cyclone. However, Faraji began to weaken as it turned south due to limited outflow, with the eye collapsing completely by the next day (last 6 images).
In addition, from the images it is possible to distinguish low values of atmospheric instability in higher clouds and central regions (red color), as well as the higher gradient values are visible in the outermost regions (blue color). This is shown by the first 12 images of the sequence, where we can notice that less dense clouds are subject to strong rotational dynamics, while the effect of thermal changes with the altitude of the surrounding clouds is more significant closest to the eye of the cyclone.
Further comparisons provided important results in the evaluation of the temporal trend of the pressure in the eye of the cyclone. For this analysis we consider the 168 h of evolution of Faraji, between 00.00 UTC of 6 February and 00.00 UTC of 13 February. In Figure 15 the pressure values calculated for the different sensing times is shown. Curves identify the evolution trends of these values, and it is immediately noticed that products obtained for MODIS and SLSTR display different behaviors, whereas a slight consistent trend is observed for VIIRS. In fact, the latter fits better than MODIS and SLSTR the eye pressure data recorded in the storms map of NASA Zoom Earth database (yellow line), within the limits of the uncertainty ranges.
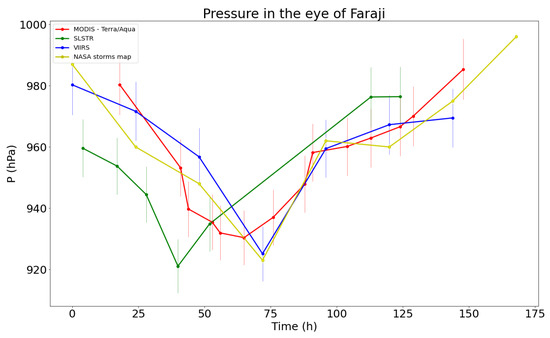
Figure 15.
Temporal comparison between the pressure in the eye of the Faraji cyclone derived from the polar-satellite remote sensing techniques and the same values obtained from NASA storms map of Zoom Earth database. Vertical thin lines in each point value represents the uncertainty ranges of the errors.
In accordance with the theory, the pressure values are higher in the sensing times corresponding to the moments of formation and weakening of the cyclone, with absolute minima associated with the days of maximum intensity, where the eye of the cyclone is well defined within its central structure. The maximum value in each eye-pressure range is the corresponding value of the pressure in the eye of the cyclone at that specific sensing time. Each point value of the pressure is associated with an error bar, evaluated using the relative error formula, including the uncertainty ranges of altitude, scale height and effective temperature.
4. Conclusions
We exploited geostationary and LEO satellite data to perform a detailed characterization of the tropical cyclone Faraji, developed in the Central Indian Ocean early in February 2021. Proper Orthogonal Decomposition of the data of SEVIRI onboard geostationary MSG-8 IODC allowed characterizing at very-high time resolution the spatial-temporal components of turbulent structures in the temperature field, through the separation in three different scale ranges for both components. With respect to previous analysis [9], here we use data extrapolated from the brightness temperature to obtain directly, as the latter is more physically meaningful than . The main difference is found in the reconstructions of the effective temperature fields obtained through the partial sums of the POD decomposition.
The temporal dynamics of the Faraji’s cloud system (temperature gradient and the atmospheric pressure field P) was focused on moderate-to-high resolution by exploiting the multispectral data of radiometers MODIS, SLSTR and VIIRS, onboard LEO satellites EOS—Terra/Aqua, Copernicus Sentinel-3A/3B and NASA Suomi NPP respectively. Although the temperature gradient may bring little physical information, it helped in visualizing the cyclone cloud system from a non-flattening point of view, while giving a graphical idea to explain the instability of the atmosphere in the surrounding regions of its central structure. With reference to the definitions of the atmospheric instability degree, it is possible to confirm that for Faraji, from the calculated values processed using the chosen LEO databases, a conditional instability, very close to the vertical thermal gradient cut-off that identifies the absolute one, is obtained in all sensing times.
Comparison between the pressure data close to the eye of the cyclone obtained from the LEO sensors with those recorded by NASA Zoom Earth shows that they are in good agreement in the limits of uncertainty ranges. For LEO data analysis, the best results are obtained from the values obtained by VIIRS data, due to their smaller pixel size and daily nighttime acquisition at 00:00 UTC, which minimizes influence of reflected radiance on at-satellite radiance.
Future extensions of this work are twofold. On the one hand, the same kind of study should be repeated on cyclones of different categories in the Saffir–Simpson scale, to see whether the three scale separation from the POD can satisfactorily apply also in those cases. On the other hand, we want to explore high-quality data from new satellite platforms—both geostationary and polar—in order to extend the analysis to quantifying other physical quantities relevant to the characterization of these extreme events, as relative humidity and wind speeds within the cyclone system [33,34].
Author Contributions
Conceptualization, V.C. and F.F.; methodology, G.C. and L.P.; software, G.C. and L.P.; validation, V.C., F.F. and F.L.; formal analysis, G.C. and L.P.; investigation, G.C.; resources, G.C. and F.F.; data curation, G.C. and F.F.; writing—original draft preparation, G.C. and L.P.; writing—review and editing, F.L.; visualization, G.C.; supervision, L.P. and F.L.; project administration, F.F. and V.C. All authors have read and agreed to the published version of the manuscript.
Funding
G.C. is supported by the Italian “Ministero dell’Università e della Ricerca” (MUR) under the program PON “Ricerca e Innovazione” 2014–2020, Azione IV.5—“Dottorati su tematiche green” tematica “Cambiamento climatico e accelerazione di eventi estremi nel bacino del Mediterraneo”. V.C. and F.L. acknowledge support from Italian MIUR–PRIN grant 2017APKP7T “Circumterrestrial Environment: Impact of Sun–Earth Interaction”.
Institutional Review Board Statement
Not applicable.
Informed Consent Statement
Not applicable.
Data Availability Statement
Data elaborated in the present article were downloaded from the following site (accessed on April 2021): https://view.eumetsat.int/productviewer?v=default, by selecting “Meteosat-8 41.5 E” for “satellite”, “High Rate SEVIRI IR10.8—MSG—Indian Ocean” for “Channels”; https://ladsweb.modaps.eosdis.nasa.gov, by selecting “MODIS Terra, Aqua”—“VIIRS Suomi NP”—“SLSTR ESA Copernicus Sentinel-3A”—“SLSTR ESA Copernicus Sentinel-3” for “Sensors”, “MOD021KM”—“MYD021KM”—“VNP41A1”—“S3ASL1RBT”—“S3BSL1RBT” for “Products”.
Conflicts of Interest
The authors declare no conflict of interest.
Abbreviations
The following abbreviations are used in this manuscript:
| LEO | Low Earth Orbit |
| EOS | Earth Observation System |
| MODIS | Moderate-Resolution Imaging Spectroradiometer |
| MSG | Meteosat Second Generation |
| MSG—8 IODC | Meteosat Second Generation 8 Indian Ocean Data Collection |
| POD | Proper Orthogonal Decomposition |
| SEVIRI | Spinning Enhanced Visible Infra-Red Imager |
| SLSTR | Sea and Land Surface Temperature Radiometer |
| Suomi NPP | Suomi National Polar-orbiting Partnership |
| VIIRS | Visible/Infrared Imager Radiometer Suite |
References
- Dvorak, V.F. Tropical cyclone intensity analysis and forecasting from satellite imagery. Mon. Weather Rev. 1975, 103, 420–430. [Google Scholar] [CrossRef]
- Dvorak, V.F. Tropical Cyclone Intensity Analysis Using Satellite Data; National Oceanic and Atmospheric Administration: Washington, DC, USA, 1984; pp. 46–47. [Google Scholar]
- Piñeros, M.F.; Ritchie, E.A.; Tyo, J.S. Objective measures of tropical cyclone structure and intensity change from remotely sensed infrared image data. IEEE Trans. Geosci. Remote Sens. 2008, 46, 3574–3580. [Google Scholar] [CrossRef]
- Knaff, J.A.; Brown, D.P.; Courtney, J.; Gallina, G.M.; Beven, J.L., II. An Evaluation of Dvorak Technique–Based Tropical Cyclone Intensity Estimates. Weather. Forecast. 2010, 25, 1362–1379. [Google Scholar] [CrossRef]
- Salby, M.L. Fundamental of Atmospheric Physics; Academic Press: London, UK, 1996. [Google Scholar]
- Ahrens, C.D. Meteorology Today: An Introduction to Weather, Climate, and the Environment, 9th ed.; Brooks/Cole, CengageLearning: Boston, MA, USA, 2009. [Google Scholar]
- Andrews, D.G. An Introduction to Atmospheric Physics, 2nd ed.; Cambridge University Press: Cambridge, UK, 2010. [Google Scholar]
- Aminou, D.M.A.; Jacquet, B.; Pasternak, F. Characteristics of the Meteosat Second Generation (MSG) Radiometer/Imager: SEVIRI. In Proceedings of the SPIE 3221, Sensors, Systems, and Next-Generation Satellites, Edinburgh, UK, 26–28 September 2016. [Google Scholar]
- Ciardullo, G.; Primavera, L.; Ferrucci, F.; Carbone, V.; Lepreti, F. Study of Turbulence Associated with the Faraji Cyclone. Climate 2022, 10, 21. [Google Scholar] [CrossRef]
- Vecchio, A.; Carbone, V.; Lepreti, F.; Primavera, L.; Sorriso-Valvo, L.; Straus, T.; Veltri, P. Spatio-Temporal Analysis of Photospheric Turbulent Velocity Fields Using the Proper Orthogonal Decomposition. Sol. Phys. 2008, 251, 163–178. [Google Scholar] [CrossRef]
- Siegel, S.G.; Cohen, K.; Seidel, J.; McLaughlin, T. Proper Orthogonal Decomposition Snapshot Selection for State Estimation of Feedback Controlled Flows. In Proceedings of the 44th AIAA Aerospace Sciences Meeting and Exhibit, Reno, NV, USA, 9–12 January 2006; pp. 1–11. [Google Scholar]
- Vecchio, A.; Carbone, V.; Lepreti, F.; Primavera, L.; Sorriso-Valvo, L.; Veltri, P.; Straus, T.; Alfonsi, G. Proper Orthogonal Decomposition of Solar Photospheric Motions. Phys. Rev. Lett. 2005, 95, 1–4. [Google Scholar] [CrossRef] [PubMed]
- Veltri, P.; Vecchio, A.; Carbone, V. Proper orthogonal decomposition analysis of spatio-temporal behavior of renal scintigraphies. Phys. Med. 2009, 26, 57–70. [Google Scholar] [CrossRef] [PubMed]
- Lumley, J.L. Coherent Structures in Turbulence. Transition and Turbulence; Academic Press: New York, NY, USA, 1981. [Google Scholar]
- Alfonsi, G.; Restano, C.; Primavera, L. Coherent structures of the flow around a surface-mounted cubic obstacle in turbulent channel flow. J. Wind Eng. Ind. Aerodyn. 2003, 91, 495–511. [Google Scholar] [CrossRef]
- Alfonsi, G.; Primavera, L.; Felisari, R. On the behavior of POD modes of the flow past a perforated plate. J. Flow Vis. Image Process. 2003, 10, 105–117. [Google Scholar] [CrossRef]
- Alfonsi, G.; Primavera, L. The structure of turbulent boundary layersin the wall region of plane channel flow. Proc. R. Soc. A 2007, 463, 593–612. [Google Scholar] [CrossRef]
- MODIS Characterization Support Team (MCST). MODIS 1 km Calibrated Radiances Product. NASA MODIS Adaptive Processing System; Goddard Space Flight Center: Greenbelt, MD, USA, 2017. [Google Scholar]
- Román, M.O.; Wang, Z.; Sun, Q.; Kalb, V.; Miller, S.D.; Molthan, A.; Schultz, L.; Bell, J.; Stokes, E.C.; Pandey, B.; et al. NASA’s Black Marble nighttime lights product suite. Remote Sens. Environ. 2018, 210, 113–143. [Google Scholar] [CrossRef]
- Cao, C.; Xiong, X.; Wolfe, R.; DeLuccia, F.; Liu, Q.; Blonski, S.; Lin, G.; Nishihama, M.; Pogorzala, D.; Oudrari, H.; et al. Visible iNfrared Imaging Radiometer Suite (VIIRS) Sensor Data Record (SDR) User’s Guide; Version 1.2; National Oceanic and Atmospheric Administration: Washington, DC, USA, 2013. [Google Scholar]
- Donlon, C.; Berruti, B.; Buongiorno, A.; Ferreira, M.-H.; Féménias, P.; Frerick, J.; Goryl, P.; Klein, U.; Laur, H.; Mavrocordatos, C.; et al. The Global Monitoring for Environment and Security (GMES) Sentinel-3 mission. Remote Sens. Environ. 2012, 120, 37–57. [Google Scholar] [CrossRef]
- Malguzzi, P.; Buzzi, A.; Drofa, O. The meteorological global model GLOBO at the ISAC-CNR of Italy: Assessment of 1.5 years of experimental use for medium range weather forecast. Weather. Forecast. 2011, 26, 1045–1055. [Google Scholar] [CrossRef]
- Knapp, K.R.; Kruk, M.C.; Levinson, D.H.; Diamond, H.J.; Neumann, C.J. The International Best Track Archive for Climate Stewardship (IBTrACS) Unifying Tropical Cyclone Data. Bull. Am. Meteorol. Soc. 2010, 91, 363–376. [Google Scholar] [CrossRef]
- Hoarau, P. Category 4, 19S(FARAJI) Annular-like Cyclone Has Probably Peaked, Invest 92P on the Map, 08/09utc Utpdates; Joint Typhoon Warning Center: Pearl Harbor, HI, USA, 2021. [Google Scholar]
- Météo France La Réunion, Very Intense Tropical Cyclone 10 (Faraji); Meteo France: Paris, France, 2021.
- Pili, P. Calibration of SEVIRI. In Proceedings of the 2000 EUMETSAT Meteorological Satellite Data Users Conference, EUMETSAT EUM, Bologna, Italy, 29 May–2 June 2000; Volume 29, pp. 33–39. [Google Scholar]
- Schmetz, J.; Pili, P.; Tjemkes, S.; Just, D.; Kerkmann, J.; Rota, S.; Ratier, A. SEVIRI Calibration. Bull. Am. Meteorol. Soc. 2002, 83, 977–992. [Google Scholar] [CrossRef]
- Bradbury, T. Meteorology and Flight, 3rd ed.; A and C Black: London, UK, 2000. [Google Scholar]
- Orlanski, I. A rational subdivision of scales for atmospheric processes. Bull. Am. Meteorol. Soc. 1975, 56, 527–530. [Google Scholar]
- Kolmogorov, A.N. The Local Structure of Turbulence in Incompressible Viscous Fluid for Very Large Reynolds Numbers. Dokl. Ak. Nauk SSSR 1941, 30, 301–304. [Google Scholar]
- Observing Systems Capability Analysis and Review Tool. Available online: https://space.oscar.wmo.int/ (accessed on 7 February 2023).
- Van Ha, P.; Thanh, N.T.N.; Hung, B.Q.; Klein, P.; Jourdan, A.; Laffly, D. Assessment of georeferencing methods on MODIS Terra/Aqua and VIIRS NPP satellite images in Vietnam. Presented at the 10th International Conference on Knowledge and Systems Engineering (KSE), Ho Chi Minh City, Vietnam, 1–3 November 2018; pp. 282–287. [Google Scholar]
- Quartly, G.D.; Guymer, T.H. Realizing Envisat’s potential for rain cloud studies. Geophys. Res. Lett. 2007, 34. [Google Scholar] [CrossRef]
- Scharroo, R.; Smith, W.F.H.; Lillibridge, J.L. Satellite altimetry and the intensification of Hurricane Katrina. EOS 2005, 86, 365–370. [Google Scholar] [CrossRef]
Disclaimer/Publisher’s Note: The statements, opinions and data contained in all publications are solely those of the individual author(s) and contributor(s) and not of MDPI and/or the editor(s). MDPI and/or the editor(s) disclaim responsibility for any injury to people or property resulting from any ideas, methods, instructions or products referred to in the content. |
© 2023 by the authors. Licensee MDPI, Basel, Switzerland. This article is an open access article distributed under the terms and conditions of the Creative Commons Attribution (CC BY) license (https://creativecommons.org/licenses/by/4.0/).