
The Arctic Amplification and Its Impact: A Synthesis through Satellite Observations

 , ,
, ,  , , and
Abstract
1. Introduction
2. Definition, Literature, Data, and Methods
3. The Synthesis
4. A Broader Impact of the Amplification
5. Conclusions and Perspectives
Author Contributions
Funding
Data Availability Statement
Conflicts of Interest
References
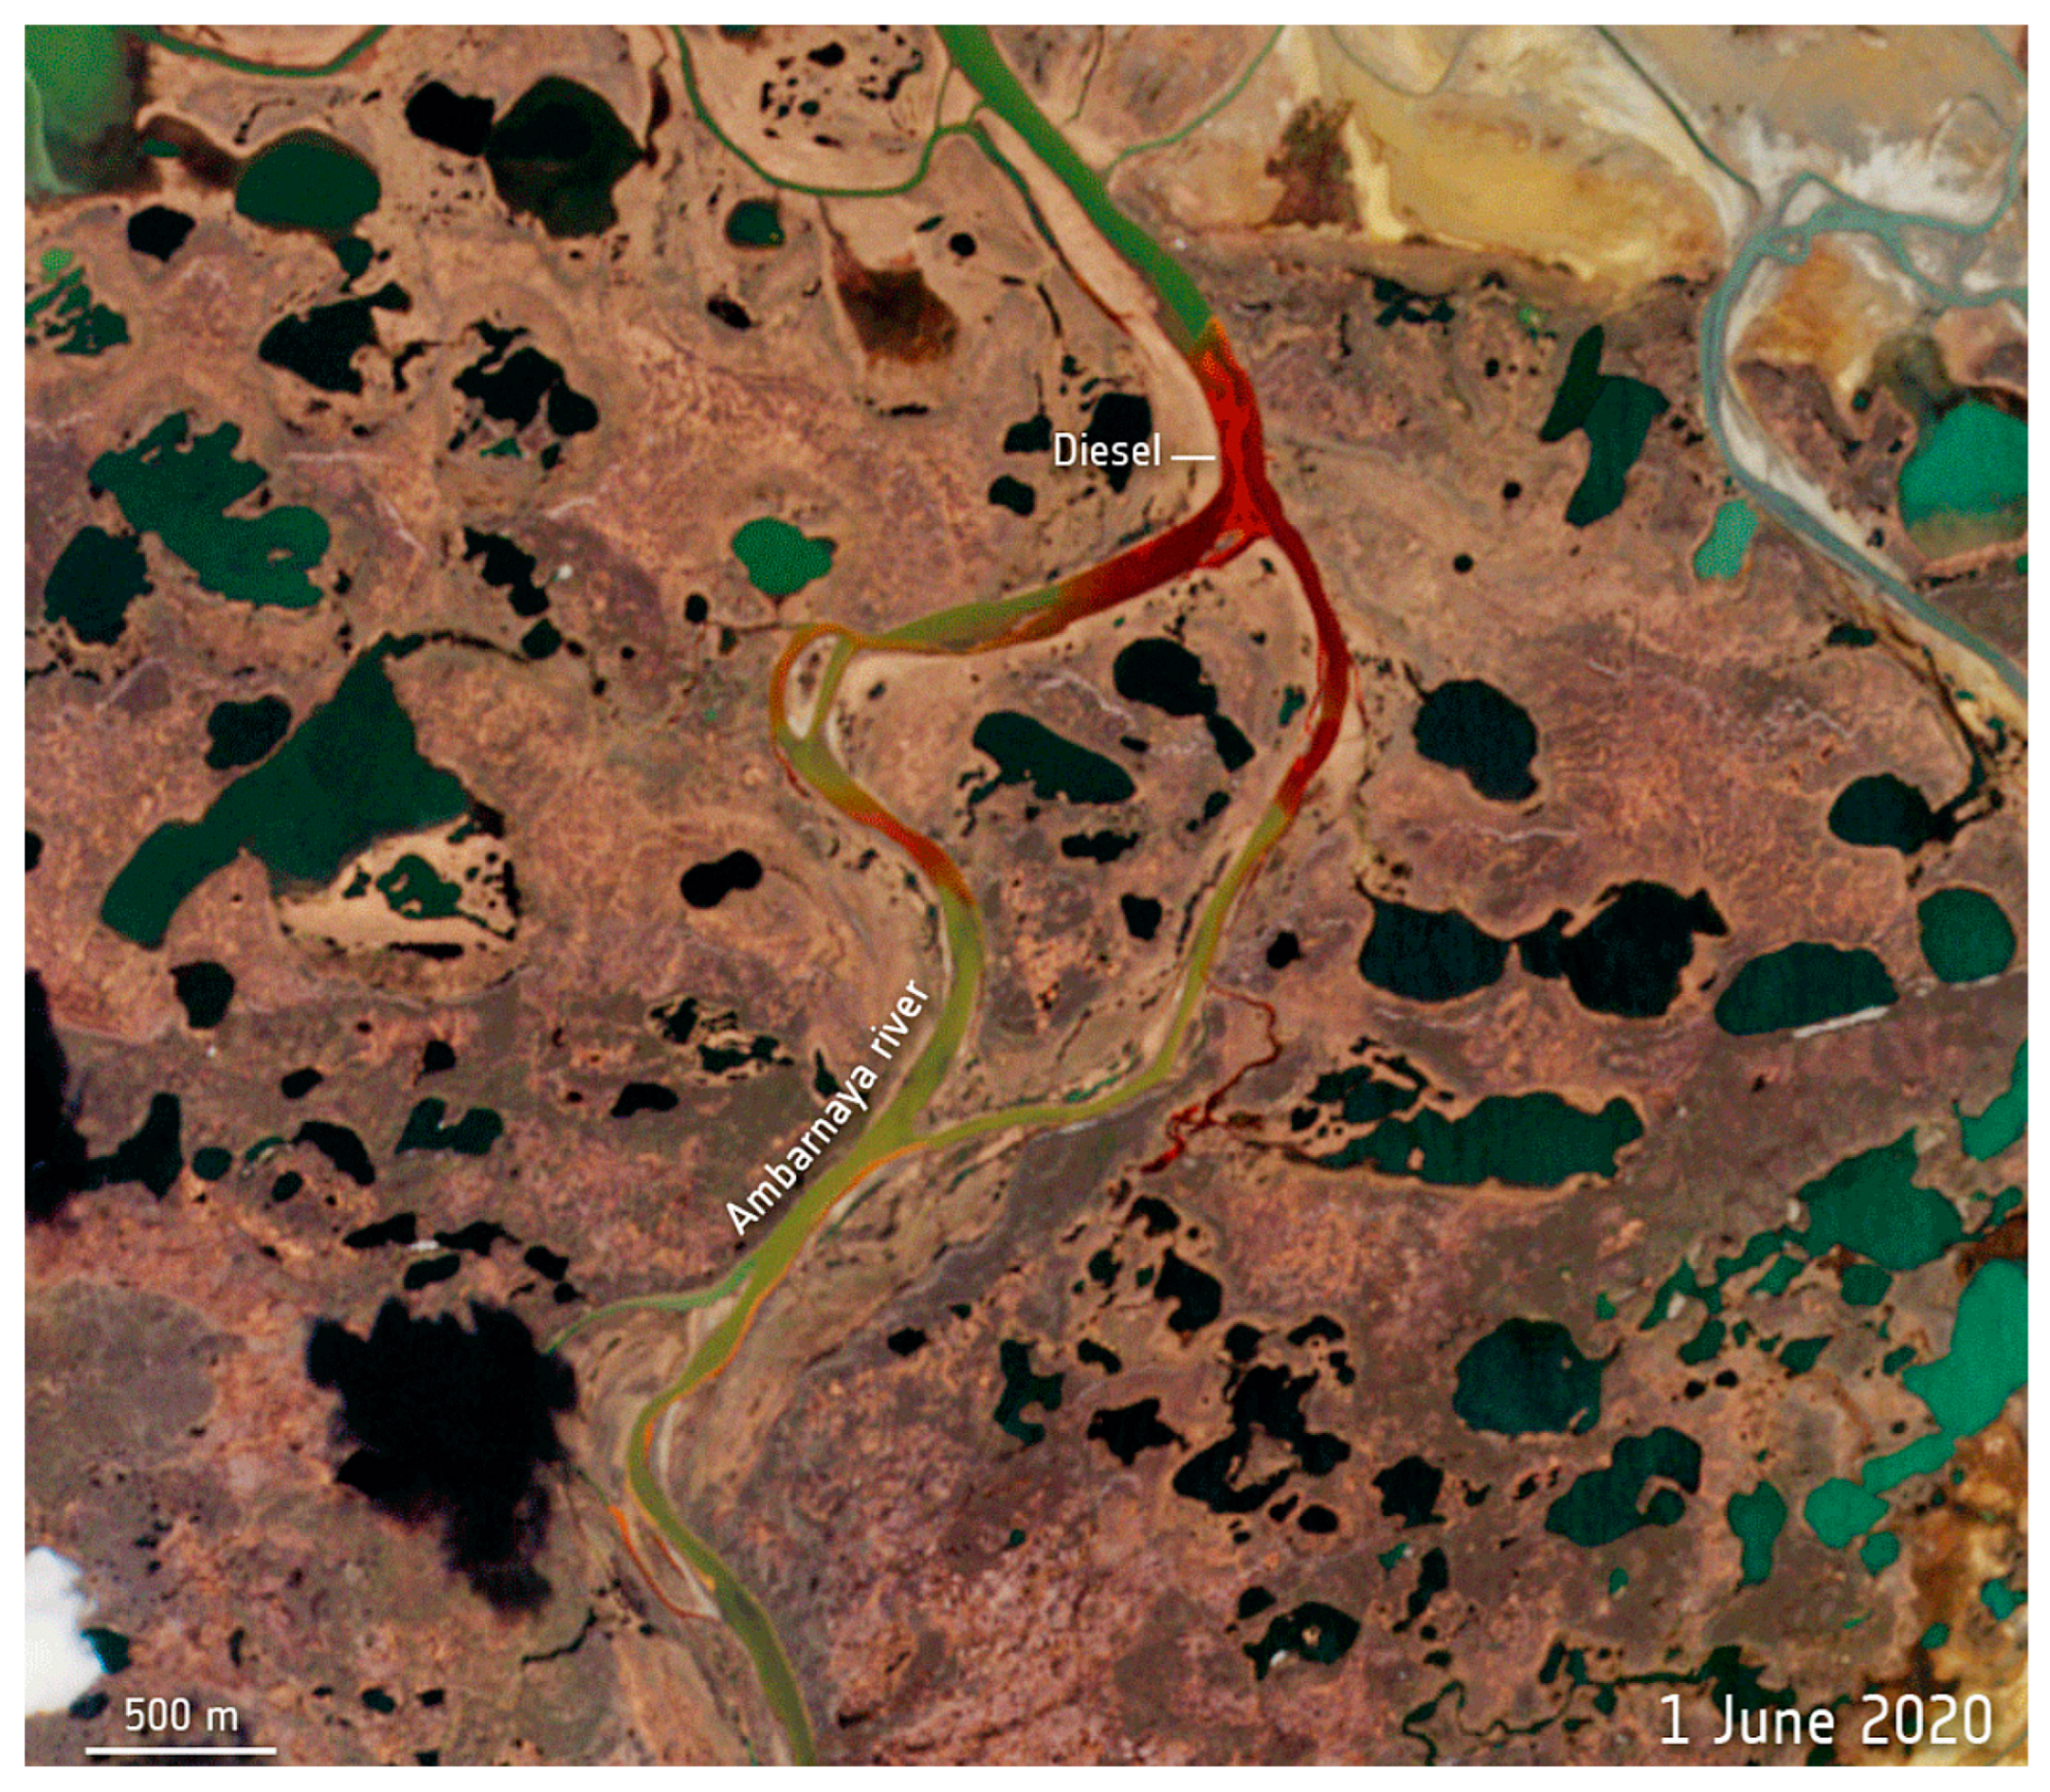
- Rajendran, S.; Sadooni, F.N.; Al-Kuwari, H.A.S.; Oleg, A.; Govil, H.; Nasir, S.; Vethamony, P. Monitoring Oil Spill in Norilsk, Russia Using Satellite Data. Sci. Rep. 2021, 11, 3817. [Google Scholar] [CrossRef]
- Hjort, J.; Karjalainen, O.; Aalto, J.; Westermann, S.; Romanovsky, V.E.; Nelson, F.E.; Etzelmüller, B.; Luoto, M. Degrading Permafrost Puts Arctic Infrastructure at Risk by Mid-Century. Nat. Commun. 2018, 9, 5147. [Google Scholar] [CrossRef]
- Hegglin, M.I.; Hollmann, R.; Ardhuin, F.; Bartsch, A.; Bastos, A.; Bennett, V.; Boutin, J.; Brockmann, C.; Buchwitz, M.; Chuvieco, E.; et al. Consistency of Satellite Climate Data Records for Earth System Monitoring. Bull. Am. Meteorol. Soc. 2020, 101, E1948–E1971. [Google Scholar] [CrossRef]
- Yang, J.; Gong, P.; Fu, R.; Zhang, M.; Chen, J.; Liang, S.; Xu, B.; Shi, J.; Dickinson, R. The Role of Satellite Remote Sensing in Climate Change Studies. Nat. Clim. Chang. 2013, 3, 875–883. [Google Scholar] [CrossRef]
- Duncan, B.N.; Ott, L.E.; Abshire, J.B.; Brucker, L.; Carroll, M.L.; Carton, J.; Comiso, J.C.; Dinnat, E.P.; Forbes, B.C.; Gonsamo, A.; et al. Space-Based Observations for Understanding Changes in the Arctic-Boreal Zone. Rev. Geophys. 2020, 58, e2019RG000652. [Google Scholar] [CrossRef]
- Jia, C.; Minnett, P.J. High Latitude Sea Surface Temperatures Derived from MODIS Infrared Measurements. Remote Sens. Environ. 2020, 251, 112094. [Google Scholar] [CrossRef]
- Myers-smith, I.H.; Kerby, J.T.; Phoenix, G.K.; Bjerke, J.W.; Epstein, H.E.; Assmann, J.J.; John, C.; Andreu-hayles, L.; Angers-blondin, S.; Beck, P.S.A.; et al. Complexity Revealed in the Greening of the Arctic. Nat. Clim. Chang. 2020, 10, 106–117. [Google Scholar] [CrossRef]
- Landrum, L.; Holland, M.M. Extremes Become Routine in an Emerging New Arctic. Nat. Clim. Chang. 2020, 10, 1108–1115. [Google Scholar] [CrossRef]
- Taylor, P.C.; Boeke, R.C.; Boisvert, L.N.; Feldl, N.; Henry, M.; Huang, Y.; Langen, P.L.; Liu, W.; Pithan, F.; Sejas, S.A.; et al. Process Drivers, Inter-Model Spread, and the Path Forward: A Review of Amplified Arctic Warming. Front. Earth Sci. 2022, 9, 1391. [Google Scholar] [CrossRef]
- Robinson, D.A.; Dewey, K.F.; Heim, R.R. Global Snow Cover Monitoring: An Update. Bull. Am. Meteorol. Soc. 1993, 74, 1689–1696. [Google Scholar] [CrossRef]
- Bojinski, S.; Verstraete, M.; Peterson, T.C.; Richter, C.; Simmons, A.; Zemp, M. The Concept of Essential Climate Variables in Support of Climate Research, Applications, and Policy. Bull. Am. Meteorol. Soc. 2014, 95, 1431–1443. [Google Scholar] [CrossRef]
- Starkweather, S.; Shapiro, H.; Vakhutinsky, S.; Druckenmiller, M. 15-Year Retrospective Analysis on AON the Observational Foundation of the Arctic Report Card—A 15-Year Retrospective Analysis on the Arctic Observing Network (AON) and Insights for the Future System; NOAA Arctic: Washington, DC, USA, 2020. [Google Scholar] [CrossRef]
- Comiso, J.C.; Hall, D.K. Climate Trends in the Arctic as Observed from Space. WIREs Clim. Chang. 2014, 5, 389–409. [Google Scholar] [CrossRef]
- Previdi, M.; Smith, K.L.; Polvani, L.M. Arctic Amplification of Climate Change: A Review of Underlying Mechanisms. Environ. Res. Lett. 2021, 16, 093003. [Google Scholar] [CrossRef]
- Semenov, V.A. Modern Arctic Climate Research: Progress, Change of Concepts, and Urgent Problems. Izv. Atmos. Ocean. Phys. 2021, 57, 18–28. [Google Scholar] [CrossRef]
- Wendisch, M.; Brückner, M.; Crewell, S.; Ehrlich, A.; Notholt, J.; Lüpkes, C.; Macke, A.; Burrows, J.P.; Rinke, A.; Quaas, J.; et al. Atmospheric and Surface Processes, and Feedback Mechanisms Determining Arctic Amplification: A Review of First Results and Prospects of the (AC)3 Project. Bull. Am. Meteorol. Soc. 2022, 104, E208–E242. [Google Scholar] [CrossRef]
- Wang, Y.; Bi, H.; Huang, H.; Liu, Y.; Liu, Y.; Liang, X.; Fu, M.; Zhang, Z. Satellite-Observed Trends in the Arctic Sea Ice Concentration for the Period 1979–2016. J. Oceanol. Limnol. 2019, 37, 18–37. [Google Scholar] [CrossRef]
- England, M.R.; Eisenman, I.; Lutsko, N.J.; Wagner, T.J.W. The Recent Emergence of Arctic Amplification. Geophys. Res. Lett. 2021, 48, e2021GL094086. [Google Scholar] [CrossRef]
- Isaksen, K.; Nordli, Ø.; Ivanov, B.; Køltzow, M.A.Ø.; Aaboe, S.; Gjelten, H.M.; Mezghani, A.; Eastwood, S.; Førland, E.; Benestad, R.E.; et al. Exceptional Warming over the Barents Area. Sci. Rep. 2022, 12, 9371. [Google Scholar] [CrossRef]
- Francis, J.A.; Vavrus, S.J. Evidence Linking Arctic Amplification to Extreme Weather in Mid-Latitude. Geophys. Res. Lett. 2012, 39, L06801. [Google Scholar] [CrossRef]
- Johannessen, O.M.; Kuzmina, S.I.; Bobylev, L.P.; Miles, M.W. Surface Air Temperature Variability and Trends in the Arctic: New Amplification Assessment and Regionalisation. Tellus Ser. A Dyn. Meteorol. Oceanogr. 2016, 68, 28234. [Google Scholar] [CrossRef]
- Davy, R.; Chen, L.; Hanna, E. Arctic Amplification Metrics. Int. J. Climatol. 2018, 38, 4384–4394. [Google Scholar] [CrossRef]
- Bekryaev, R.V.; Polyakov, I.V.; Alexeev, V.A. Role of Polar Amplification in Long-Term Surface Air Temperature Variations and Modern Arctic Warming. J. Clim. 2010, 23, 3888–3906. [Google Scholar] [CrossRef]
- Nielsen-Englyst, P.; Høyer, J.L.; Kolbe, W.M.; Dybkjær, G.; Lavergne, T.; Tonboe, R.T.; Skarpalezos, S.; Karagali, I. A Combined Sea and Sea-Ice Surface Temperature Climate Dataset of the Arctic, 1982–2021. Remote Sens. Environ. 2023, 284, 113331. [Google Scholar] [CrossRef]
- Bormann, K.J.; Brown, R.D.; Derksen, C.; Painter, T.H. Estimating Snow-Cover Trends from Space. Nat. Clim. Chang. 2018, 8, 924–928. [Google Scholar] [CrossRef]
- Ardyna, M.; Arrigo, K.R. Phytoplankton Dynamics in a Changing Arctic Ocean. Nat. Clim. Chang. 2020, 10, 892–903. [Google Scholar] [CrossRef]
- Nitze, I.; Grosse, G.; Jones, B.M.; Romanovsky, V.E.; Boike, J. Remote Sensing Quantifies Widespread Abundance of Permafrost Region Disturbances across the Arctic and Subarctic. Nat. Commun. 2018, 9, 5423. [Google Scholar] [CrossRef] [PubMed]
- Beamish, A.; Raynolds, M.K.; Epstein, H.; Frost, G.V.; Macander, M.J.; Bergstedt, H.; Bartsch, A.; Kruse, S.; Miles, V.; Tanis, C.M.; et al. Recent Trends and Remaining Challenges for Optical Remote Sensing of Arctic Tundra Vegetation: A Review and Outlook. Remote Sens. Environ. 2020, 246, 111872. [Google Scholar] [CrossRef]
- Trofaier, A.M.; Westermann, S.; Bartsch, A. Progress in Space-Borne Studies of Permafrost for Climate Science: Towards a Multi-ECV Approach. Remote Sens. Environ. 2017, 203, 55–70. [Google Scholar] [CrossRef]
- Jenkins, L.K.; Barry, T.; Bosse, K.R.; Currie, W.S.; Christensen, T.; Longan, S.; Shuchman, R.A.; Tanzer, D.; Taylor, J.J. Satellite-Based Decadal Change Assessments of Pan-Arctic Environments. Ambio 2020, 49, 820–832. [Google Scholar] [CrossRef]
- Liang, S.; Wang, D.; He, T.; Yu, Y. Remote Sensing of Earth’s Energy Budget: Synthesis and Review. Int. J. Digit. Earth 2019, 12, 737–780. [Google Scholar] [CrossRef]
- Riihelä, A.; Key, J.R.; Meirink, J.F.; Kuipers Munneke, P.; Palo, T.; Karlsson, K.-G. An Intercomparison and Validation of Satellite-Based Surface Radiative Energy Flux Estimates over the Arctic. J. Geophys. Res. Atmos. 2017, 122, 4829–4848. [Google Scholar] [CrossRef]
- Wang, X.; Key, J.; Liu, Y.; Fowler, C.; Maslanik, J.; Tschudi, M. Arctic Climate Variability and Trends from Satellite Observations. Adv. Meteorol. 2012, 2012, 505613. [Google Scholar] [CrossRef]
- Rantanen, M.; Karpechko, A.Y.; Lipponen, A.; Nordling, K.; Hyvärinen, O.; Ruosteenoja, K.; Vihma, T.; Laaksonen, A. The Arctic Has Warmed Nearly Four Times Faster than the Globe since 1979. Commun. Earth Environ. 2022, 3, 168. [Google Scholar] [CrossRef]
- Lind, S.; Ingvaldsen, R.B.; Furevik, T. Arctic warming hotspot in the northern Barents Sea linked to declining sea-ice import. Nat. Clim. Chang. 2018, 8, 634–639. [Google Scholar] [CrossRef]
- Ricker, R.; Kauker, F.; Schweiger, A.; Hendricks, S.; Zhang, J.; Paul, S. Evidence for an Increasing Role of Ocean Heat in Arctic Winter Sea Ice Growth. J. Clim. 2021, 34, 5215–5227. [Google Scholar] [CrossRef]
- Yang, X.-Y.; Fyfe, J.C.; Flato, G.M. The Role of Poleward Energy Transport in Arctic Temperature Evolution. Geophys. Res. Lett. 2010, 37. [Google Scholar] [CrossRef]
- Liu, Y.; Key, J.R.; Schweiger, A.; Francis, J. Characteristics of Satellite-Derived Clear-Sky Atmospheric Temperature Inversion Strength in the Arctic, 1980–1996. J. Clim. 2006, 19, 4902–4913. [Google Scholar] [CrossRef]
- Sobrino, J.A.; Julien, Y.; García-Monteiro, S. Surface Temperature of the Planet Earth from Satellite Data. Remote Sens. 2020, 12, 218. [Google Scholar] [CrossRef]
- Wang, Y.; Hessen, D.O.; Samset, B.H.; Stordal, F. Evaluating Global and Regional Land Warming Trends in the Past Decades with Both MODIS and ERA5-Land Land Surface Temperature Data. Remote Sens. Environ. 2022, 280, 113181. [Google Scholar] [CrossRef]
- Li, M.; Ke, C.Q.; Shen, X.; Cheng, B.; Li, H. Investigation of the Arctic Sea Ice Volume from 2002 to 2018 Using Multi-Source Data. Int. J. Climatol. 2021, 41, 2509–2527. [Google Scholar] [CrossRef]
- Bi, H.; Liang, Y.; Wang, Y.; Liang, X.; Zhang, Z.; Du, T.; Yu, Q.; Huang, J.; Kong, M.; Huang, H. Arctic Multiyear Sea Ice Variability Observed from Satellites: A Review. J. Oceanol. Limnol. 2020, 38, 962–984. [Google Scholar] [CrossRef]
- Liu, Y.; Key, J.R.; Wang, X.; Tschudi, M. Multidecadal Arctic Sea Ice Thickness and Volume Derived from Ice Age. Cryosph. 2020, 14, 1325–1345. [Google Scholar] [CrossRef]
- Kwok, R. Arctic Sea Ice Thickness, Volume, and Multiyear Ice Coverage: Losses and Coupled Variability (1958-2018). Environ. Res. Lett. 2018, 13, 105005. [Google Scholar] [CrossRef]
- Feng, J.; Zhang, Y.; Cheng, Q.; Tsou, J.Y. Pan-Arctic Melt Pond Fraction Trend, Variability, and Contribution to Sea Ice Changes. Glob. Planet. Chang. 2022, 217, 103932. [Google Scholar] [CrossRef]
- Pulliainen, J.; Luojus, K.; Derksen, C.; Mudryk, L.; Lemmetyinen, J.; Salminen, M.; Ikonen, J.; Takala, M.; Cohen, J.; Smolander, T.; et al. Patterns and Trends of Northern Hemisphere Snow Mass from 1980 to 2018. Nature 2020, 581, 294–298. [Google Scholar] [CrossRef]
- Devasthale, A.; Sedlar, J.; Tjernström, M.; Kokhanovsky, A. A Climatological Overview of Arctic Clouds. In Physics and Chemistry of the Arctic Atmosphere; Springer: Cham, Switzerland, 2020; pp. 331–360. [Google Scholar]
- Hwang, J.; Choi, Y.; Su, H.; Jiang, J.H. Invariability of Arctic Top-of-Atmosphere Radiative Response to Surface Temperature Changes. Earth Space Sci. 2020, 7, e2020EA001316. [Google Scholar] [CrossRef]
- Riihelä, A.; Manninen, T.; Laine, V. Observed Changes in the Albedo of the Arctic Sea-Ice Zone for the Period 1982–2009. Nat. Clim. Chang. 2013, 3, 895–898. [Google Scholar] [CrossRef]
- Pistone, K.; Eisenman, I.; Ramanathan, V. Observational Determination of Albedo Decrease Caused by Vanishing Arctic Sea Ice. Proc. Natl. Acad. Sci. USA 2014, 111, 3322–3326. [Google Scholar] [CrossRef]
- Marcianesi, F.; Aulicino, G.; Wadhams, P. Arctic Sea Ice and Snow Cover Albedo Variability and Trends during the Last Three Decades. Polar Sci. 2021, 28, 100617. [Google Scholar] [CrossRef]
- Seong, N.; Kim, H.-C.; Choi, S.; Jin, D.; Jung, D.; Sim, S.; Woo, J.; Kim, N.; Seo, M.; Lee, K.; et al. Evaluation of Sea Ice Radiative Forcing According to Surface Albedo and Skin Temperature over the Arctic from 1982–2015. Remote Sens. 2022, 14, 2512. [Google Scholar] [CrossRef]
- Cao, Y.; Liang, S.; Chen, X.; He, T. Assessment of Sea Ice Albedo Radiative Forcing and Feedback over the Northern Hemisphere from 1982 to 2009 Using Satellite and Reanalysis Data. J. Clim. 2015, 28, 1248–1259. [Google Scholar] [CrossRef]
- Park, H.; Kim, Y.; Kimball, J.S. Widespread Permafrost Vulnerability and Soil Active Layer Increases over the High Northern Latitudes Inferred from Satellite Remote Sensing and Process Model Assessments. Remote Sens. Environ. 2016, 175, 349–358. [Google Scholar] [CrossRef]
- Philipp, M.; Dietz, A.; Buchelt, S.; Kuenzer, C. Trends in Satellite Earth Observation for Permafrost Related Analyses-a Review. Remote Sens. 2021, 13, 1217. [Google Scholar] [CrossRef]
- Obu, J.; Westermann, S.; Bartsch, A.; Berdnikov, N.; Christiansen, H.H.; Dashtseren, A.; Delaloye, R.; Elberling, B.; Etzelmüller, B.; Kholodov, A.; et al. Northern Hemisphere Permafrost Map Based on TTOP Modelling for 2000–2016 at 1 Km2 Scale. Earth-Sci. Rev. 2019, 193, 299–316. [Google Scholar] [CrossRef]
- Park, T.; Ganguly, S.; Tømmervik, H.; Euskirchen, E.S.; Høgda, K.-A.; Karlsen, S.R.; Brovkin, V.; Nemani, R.R.; Myneni, R.B. Changes in Growing Season Duration and Productivity of Northern Vegetation Inferred from Long-Term Remote Sensing Data. Environ. Res. Lett. 2016, 11, 084001. [Google Scholar] [CrossRef]
- The IMBIE team Mass Balance of the Greenland Ice Sheet from 1992 to 2018. Nature 2020, 579, 233–239. [CrossRef]
- Mottram, R.; Simonsen, S.B.; Høyer Svendsen, S.; Barletta, V.R.; Sandberg Sørensen, L.; Nagler, T.; Wuite, J.; Groh, A.; Horwath, M.; Rosier, J.; et al. An Integrated View of Greenland Ice Sheet Mass Changes Based on Models and Satellite Observations. Remote Sens. 2019, 11, 1407. [Google Scholar] [CrossRef]
- Cooper, M.; Smith, L. Satellite Remote Sensing of the Greenland Ice Sheet Ablation Zone: A Review. Remote Sens. 2019, 11, 2405. [Google Scholar] [CrossRef]
- Bartsch, A.; Pointner, G.; Nitze, I.; Efimova, A.; Jakober, D.; Ley, S.; Högström, E.; Grosse, G.; Schweitzer, P. Expanding Infrastructure and Growing Anthropogenic Impacts along Arctic Coasts. Environ. Res. Lett. 2021, 16, 115013. [Google Scholar] [CrossRef]
- Bartsch, A.; Pointner, G.; Ingeman-Nielsen, T.; Lu, W. Towards Circumpolar Mapping of Arctic Settlements and Infrastructure Based on Sentinel-1 and Sentinel-2. Remote Sens. 2020, 12, 2368. [Google Scholar] [CrossRef]
- Sasgen, I.; Wouters, B.; Gardner, A.S.; King, M.D.; Tedesco, M.; Landerer, F.W.; Dahle, C.; Save, H.; Fettweis, X. Return to Rapid Ice Loss in Greenland and Record Loss in 2019 Detected by the GRACE-FO Satellites. Commun. Earth Environ. 2020, 1, 8. [Google Scholar] [CrossRef]
- Spencer, R.W.; Christy, J.R.; Braswell, W.D. UAH Version 6 Global Satellite Temperature Products: Methodology and Results. Asia-Pac. J. Atmos. Sci. 2017, 53, 121–130. [Google Scholar] [CrossRef]
- Christy, J.R.; Spencer, R.W.; Braswell, W.D.; Doty, K.G. NOAA CDR Program. NOAA Climate Data Record (CDR) of MSU and AMSU-A Mean Layer Temperatures, UAH Version 6.0, NOAA National Centers for Environmental Information: Washington, DC, USA, 2017. [Google Scholar] [CrossRef]
- Guay, K.C.; Beck, P.S.A.; Berner, L.T.; Goetz, S.J.; Baccini, A.; Buermann, W. Vegetation Productivity Patterns at High Northern Latitudes: A Multi-Sensor Satellite Data Assessment. Glob. Chang. Biol. 2014, 20, 3147–3158. [Google Scholar] [CrossRef]
- Lancheros, E.; Camps, A.; Park, H.; Sicard, P.; Mangin, A.; Matevosyan, H.; Lluch, I. Gaps Analysis and Requirements Specification for the Evolution of Copernicus System for Polar Regions Monitoring: Addressing the Challenges in the Horizon 2020–2030. Remote Sens. 2018, 10, 1098. [Google Scholar] [CrossRef]
- Hollmann, R.; Merchant, C.J.; Saunders, R.; Downy, C.; Buchwitz, M.; Cazenave, A.; Chuvieco, E.; Defourny, P.; de Leeuw, G.; Forsberg, R.; et al. The ESA Climate Change Initiative: Satellite Data Records for Essential Climate Variables. Bull. Am. Meteorol. Soc. 2013, 94, 1541–1552. [Google Scholar] [CrossRef]
- Nightingale, J.; Boersma, K.; Muller, J.-P.; Compernolle, S.; Lambert, J.-C.; Blessing, S.; Giering, R.; Gobron, N.; De Smedt, I.; Coheur, P.; et al. Quality Assurance Framework Development Based on Six New ECV Data Products to Enhance User Confidence for Climate Applications. Remote Sens. 2018, 10, 1254. [Google Scholar] [CrossRef]
- Kharbouche, S.; Muller, J.-P. Sea Ice Albedo from MISR and MODIS: Production, Validation, and Trend Analysis. Remote Sens. 2018, 11, 9. [Google Scholar] [CrossRef]
- Bentamy, A.; Piollé, J.F.; Grouazel, A.; Danielson, R.; Gulev, S.; Paul, F.; Azelmat, H.; Mathieu, P.P.; von Schuckmann, K.; Sathyendranath, S.; et al. Review and Assessment of Latent and Sensible Heat Flux Accuracy over the Global Oceans. Remote Sens. Environ. 2017, 201, 196–218. [Google Scholar] [CrossRef]
- Smedsrud, L.H.; Esau, I.; Ingvaldsen, R.B.; Eldevik, T.; Haugan, P.M.; Li, C.; Lien, V.S.; Olsen, A.; Omar, A.M.; Otterå, O.H.; et al. The role of the barents sea in the arctic climate system. Rev. Geophys. 2013, 51, 415–449. [Google Scholar] [CrossRef]
- Santer, B.D.; Solomon, S.; Pallotta, G.; Mears, C.; Po-Chedley, S.; Fu, Q.; Wentz, F.; Zou, C.Z.; Painter, J.; Cvijanovic, I.; et al. Comparing Tropospheric Warming in Climate Models and Satellite Data. J. Clim. 2017, 30, 373–392. [Google Scholar] [CrossRef]
- Karlsson, K.-G.; Anttila, K.; Trentmann, J.; Stengel, M.; Fokke Meirink, J.; Devasthale, A.; Hanschmann, T.; Kothe, S.; Jääskeläinen, E.; Sedlar, J.; et al. CLARA-A2: The Second Edition of the CM SAF Cloud and Radiation Data Record from 34 Years of Global AVHRR Data. Atmos. Chem. Phys. 2017, 17, 5809–5828. [Google Scholar] [CrossRef]
- Loeb, N.G.; Doelling, D.R.; Wang, H.; Su, W.; Nguyen, C.; Corbett, J.G.; Liang, L.; Mitrescu, C.; Rose, F.G.; Kato, S. Clouds and the Earth’s Radiant Energy System (CERES) Energy Balanced and Filled (EBAF) Top-of-Atmosphere (TOA) Edition-4.0 Data Product. J. Clim. 2018, 31, 895–918. [Google Scholar] [CrossRef]
- Heidinger, A.K.; Foster, M.J.; Walther, A.; Zhao, X. (Tom) The Pathfinder Atmospheres–Extended AVHRR Climate Dataset. Bull. Am. Meteorol. Soc. 2014, 95, 909–922. [Google Scholar] [CrossRef]
- Wang, X.; Key, J.R. Arctic Surface, Cloud, and Radiation Properties Based on the AVHRR Polar Pathfinder Dataset. Part II: Recent Trends. J. Clim. 2005, 18, 2575–2593. [Google Scholar] [CrossRef]
- Wang, X.; Liu, J.; Yang, B.; Bao, Y.; Petropoulos, G.P.; Liu, H.; Hu, B. Seasonal Trends in Clouds and Radiation over the Arctic Seas from Satellite Observations during 1982 to 2019. Remote Sens. 2021, 13, 3201. [Google Scholar] [CrossRef]
- Estilow, T.W.; Young, A.H.; Robinson, D.A. A Long-Term Northern Hemisphere Snow Cover Extent Data Record for Climate Studies and Monitoring. Earth Syst. Sci. Data 2015, 7, 137–142. [Google Scholar] [CrossRef]
- Lavergne, T.; Macdonald Sørensen, A.; Kern, S.; Tonboe, R.; Notz, D.; Aaboe, S.; Bell, L.; Dybkjær, G.; Eastwood, S.; Gabarro, C.; et al. Version 2 of the EUMETSAT OSI SAF and ESA CCI Sea-Ice Concentration Climate Data Records. Cryosphere 2019, 13, 49–78. [Google Scholar] [CrossRef]
- Comiso, J.C.; Meier, W.N.; Gersten, R. Variability and Trends in the Arctic Sea Ice Cover: Results from Different Techniques. J. Geophys. Res. Ocean. 2017, 122, 6883–6900. [Google Scholar] [CrossRef]
- Schweiger, A.J.; Wood, K.R.; Zhang, J. Arctic Sea Ice Volume Variability over 1901–2010: A Model-Based Reconstruction. J. Clim. 2019, 32, 4731–4752. [Google Scholar] [CrossRef]
- Piao, S.; Wang, X.; Park, T.; Chen, C.; Lian, X.; He, Y.; Bjerke, J.W.; Chen, A.; Ciais, P.; Tømmervik, H.; et al. Characteristics, Drivers and Feedbacks of Global Greening. Nat. Rev. Earth Environ. 2020, 1, 14–27. [Google Scholar] [CrossRef]
- Pinzon, J.; Tucker, C. A Non-Stationary 1981–2012 AVHRR NDVI3g Time Series. Remote Sens. 2014, 6, 6929–6960. [Google Scholar] [CrossRef]
- Kim, Y.; Kimball, J.S.; Glassy, J.; Du, J. An Extended Global Earth System Data Record on Daily Landscape Freeze–Thaw Status Determined from Satellite Passive Microwave Remote Sensing. Earth Syst. Sci. Data 2017, 9, 133–147. [Google Scholar] [CrossRef]
- Holland, M.M.; Bitz, C.M. Polar Amplification of Climate Change in Coupled Models. Clim. Dyn. 2003, 21, 221–232. [Google Scholar] [CrossRef]
- Serreze, M.C.; Barry, R.G. Processes and Impacts of Arctic Amplification: A Research Synthesis. Glob. Planet. Chang. 2011, 77, 85–96. [Google Scholar] [CrossRef]
- Comiso, J.C. Warming Trends in the Arctic from Clear Sky Satellite Observations. J. Clim. 2003, 16, 3498–3510. [Google Scholar] [CrossRef]
- Serreze, M.C.; Francis, J.A. The Arctic Amplification Debate. Clim. Chang. 2006, 76, 241–264. [Google Scholar] [CrossRef]
- Box, J.E.; Colgan, W.T.; Christensen, T.R.; Schmidt, N.M.; Lund, M.; Parmentier, F.J.W.; Brown, R.; Bhatt, U.S.; Euskirchen, E.S.; Romanovsky, V.E.; et al. Key Indicators of Arctic Climate Change: 1971-2017. Environ. Res. Lett. 2019, 14, 45010. [Google Scholar] [CrossRef]
- Screen, J.A.; Deser, C.; Simmonds, I. Local and Remote Controls on Observed Arctic Warming. Geophys. Res. Lett. 2012, 39. [Google Scholar] [CrossRef]
- Babar, B.; Graversen, R.; Boström, T. Evaluating CM-SAF Solar Radiation CLARA-A1 and CLARA-A2 Datasets in Scandinavia. Sol. Energy 2018, 170, 76–85. [Google Scholar] [CrossRef]
- Lohmann, G. Temperatures from Energy Balance Models: The Effective Heat Capacity Matters. Earth Syst. Dyn. 2020, 11, 1195–1208. [Google Scholar] [CrossRef]
- Mayer, M.; Tietsche, S.; Haimberger, L.; Tsubouchi, T.; Mayer, J.; Zuo, H. An Improved Estimate of the Coupled Arctic Energy Budget. J. Clim. 2019, 32, 7915–7934. [Google Scholar] [CrossRef]
- Jeevanjee, N.; Held, I.; Ramaswamy, V. Manabe’s Radiative–Convective Equilibrium. Bull. Am. Meteorol. Soc. 2022, 103, E2559–E2569. [Google Scholar] [CrossRef]
- Thackeray, C.W.; Hall, A. An Emergent Constraint on Future Arctic Sea-Ice Albedo Feedback. Nat. Clim. Chang. 2019, 9, 972–978. [Google Scholar] [CrossRef]
- Olonscheck, D.; Mauritsen, T.; Notz, D. Arctic Sea-Ice Variability Is Primarily Driven by Atmospheric Temperature Fluctuations. Nat. Geosci. 2019, 12, 430–434. [Google Scholar] [CrossRef]
- Bliss, A.C.; Anderson, M.R. Arctic Sea Ice Melt Onset Timing From Passive Microwave-Based and Surface Air Temperature-Based Methods. J. Geophys. Res. Atmos. 2018, 123, 9063–9080. [Google Scholar] [CrossRef]
- Bitz, C.M.; Roe, G.H. A Mechanism for the High Rate of Sea Ice Thinning in the Arctic Ocean. J. Clim. 2004, 17, 3623–3632. [Google Scholar] [CrossRef]
- Brennan, M.K.; Hakim, G.J.; Blanchard-Wrigglesworth, E. Arctic Sea-Ice Variability During the Instrumental Era. Geophys. Res. Lett. 2020, 47, e2019GL086843. [Google Scholar] [CrossRef]
- Serreze, M.C.; Barrett, A.P.; Stroeve, J.C.; Kindig, D.N.; Holland, M.M. The Emergence of Surface-Based Arctic Amplification. Cryosphere 2009, 3, 11–19. [Google Scholar] [CrossRef]
- Johannessen, O.M.; Bobylev, L.P.; Shalina, E.V.; Sandven, S. (Eds.) Sea Ice in the Arctic; Springer Polar Sciences; Springer International Publishing: Cham, Switzerland, 2020; ISBN 978-3-030-21300-8. [Google Scholar]
- Ivanova, N.; Pedersen, L.T.; Tonboe, R.T.; Kern, S.; Heygster, G.; Lavergne, T.; Sørensen, A.; Saldo, R.; Dybkjær, G.; Brucker, L.; et al. Inter-Comparison and Evaluation of Sea Ice Algorithms: Towards Further Identification of Challenges and Optimal Approach Using Passive Microwave Observations. Cryosphere 2015, 9, 1797–1817. [Google Scholar] [CrossRef]
- Ólason, E.; Rampal, P.; Dansereau, V. On the Statistical Properties of Sea-Ice Lead Fraction and Heat Fluxes in the Arctic. Cryosphere 2021, 15, 1053–1064. [Google Scholar] [CrossRef]
- Zhang, Y.; Cheng, X.; Liu, J.; Hui, F. The Potential of Sea Ice Leads as a Predictor for Summer Arctic Sea Ice Extent. Cryosphere 2018, 12, 3747–3757. [Google Scholar] [CrossRef]
- Wagner, P.M.; Hughes, N.; Bourbonnais, P.; Stroeve, J.; Rabenstein, L.; Bhatt, U.; Little, J.; Wiggins, H.; Fleming, A. Sea-Ice Information and Forecast Needs for Industry Maritime Stakeholders. Polar Geogr. 2020, 43, 160–187. [Google Scholar] [CrossRef]
- Marquardt Collow, A.B.; Cullather, R.I.; Bosilovich, M.G. Recent Arctic Ocean Surface Air Temperatures in Atmospheric Reanalyses and Numerical Simulations. J. Clim. 2020, 33, 4347–4367. [Google Scholar] [CrossRef]
- Minnett, P.J.; Alvera-Azcárate, A.; Chin, T.M.; Corlett, G.K.; Gentemann, C.L.; Karagali, I.; Li, X.; Marsouin, A.; Marullo, S.; Maturi, E.; et al. Half a Century of Satellite Remote Sensing of Sea-Surface Temperature. Remote Sens. Environ. 2019, 233, 111366. [Google Scholar] [CrossRef]
- Kumar, A.; Yadav, J.; Mohan, R. Spatio-Temporal Change and Variability of Barents-Kara Sea Ice, in the Arctic: Ocean and Atmospheric Implications. Sci. Total Environ. 2021, 753, 142046. [Google Scholar] [CrossRef]
- Lang, A.; Yang, S.; Kaas, E. Sea Ice Thickness and Recent Arctic Warming. Geophys. Res. Lett. 2017, 44, 409–418. [Google Scholar] [CrossRef]
- Chemke, R.; Polvani, L.M.; Kay, J.E.; Orbe, C. Quantifying the Role of Ocean Coupling in Arctic Amplification and Sea-Ice Loss over the 21st Century. NPJ Clim. Atmos. Sci. 2021, 4, 46. [Google Scholar] [CrossRef]
- Tschudi, M.; Meier, W.N.; Stewart, J.S.; Fowler, C.; Maslanik, J. EASE-Grid Sea Ice Age, Version 4 [Data Set]; NASA National Snow and Ice Data Center Distributed Active Archive Center: Boulder, CO, USA, 2019. [Google Scholar]
- Matveeva, T.A.; Semenov, V.A. Regional Features of the Arctic Sea Ice Area Changes in 2000–2019 versus 1979–1999 Periods. Atmosphere 2022, 13, 1434. [Google Scholar] [CrossRef]
- Philipp, D.; Stengel, M.; Ahrens, B. Analyzing the Arctic Feedback Mechanism between Sea Ice and Low-Level Clouds Using 34 Years of Satellite Observations. J. Clim. 2020, 33, 7479–7501. [Google Scholar] [CrossRef]
- Luo, T.; Yuan, R.; Wang, Z. Lidar-Based Remote Sensing of Atmospheric Boundary Layer Height over Land and Ocean. Atmos. Meas. Tech. 2014, 7, 173–182. [Google Scholar] [CrossRef]
- Dang, R.; Yang, Y.; Hu, X.M.; Wang, Z.; Zhang, S. A Review of Techniques for Diagnosing the Atmospheric Boundary Layer Height (ABLH) Using Aerosol Lidar Data. Remote Sens. 2019, 11, 1590. [Google Scholar] [CrossRef]
- McGrath-Spangler, E.L.; Denning, A.S. Global Seasonal Variations of Midday Planetary Boundary Layer Depth from CALIPSO Space-Borne LIDAR. J. Geophys. Res. Atmos. 2013, 118, 1226–1233. [Google Scholar] [CrossRef]
- Kim, M.-H.; Yeo, H.; Park, S.; Park, D.-H.; Omar, A.; Nishizawa, T.; Shimizu, A.; Kim, S.-W. Assessing CALIOP-Derived Planetary Boundary Layer Height Using Ground-Based Lidar. Remote Sens. 2021, 13, 1496. [Google Scholar] [CrossRef]
- Von Engeln, A.; Teixeira, J. A Planetary Boundary Layer Height Climatology Derived from ECMWF Reanalysis Data. J. Clim. 2013, 26, 6575–6590. [Google Scholar] [CrossRef]
- Ao, C.O.; Waliser, D.E.; Chan, S.K.; Li, J.L.; Tian, B.; Xie, F.; Mannucci, A.J. Planetary Boundary Layer Heights from GPS Radio Occultation Refractivity and Humidity Profiles. J. Geophys. Res. Atmos. 2012, 117, 1–18. [Google Scholar] [CrossRef]
- Ganeshan, M.; Wu, D.L. An Investigation of the Arctic Inversion Using COSMIC RO Observations. J. Geophys. Res. Atmos. 2015, 120, 9338–9351. [Google Scholar] [CrossRef]
- Ding, F.; Iredell, L.; Theobald, M.; Wei, J.; Meyer, D. PBL Height From AIRS, GPS RO, and MERRA-2 Products in NASA GES DISC and Their 10-Year Seasonal Mean Intercomparison. Earth Space Sci. 2021, 8, e2021EA001859. [Google Scholar] [CrossRef]
- Esau, I.N. Amplification of Turbulent Exchange over Wide Arctic Leads: Large-Eddy Simulation Study. J. Geophys. Res. Atmos. 2007, 112, D08109. [Google Scholar] [CrossRef]
- Qu, M.; Pang, X.; Zhao, X.; Zhang, J.; Ji, Q.; Fan, P. Estimation of Turbulent Heat Flux over Leads Using Satellite Thermal Images. Cryosph. 2019, 13, 1565–1582. [Google Scholar] [CrossRef]
- Chernokulsky, A.; Esau, I. Cloud Cover and Cloud Types in the Eurasian Arctic in 1936–2012. Int. J. Climatol. 2019, 39, 5771–5790. [Google Scholar] [CrossRef]
- Lenaerts, J.T.M.; Van Tricht, K.; Lhermitte, S.; L’Ecuyer, T.S. Polar Clouds and Radiation in Satellite Observations, Reanalyses, and Climate Models. Geophys. Res. Lett. 2017, 44, 3355–3364. [Google Scholar] [CrossRef]
- Karlsson, K.-G.; Devasthale, A. Inter-Comparison and Evaluation of the Four Longest Satellite-Derived Cloud Climate Data Records: CLARA-A2, ESA Cloud CCI V3, ISCCP-HGM, and PATMOS-X. Remote Sens. 2018, 10, 1567. [Google Scholar] [CrossRef]
- Stengel, M.; Stapelberg, S.; Sus, O.; Schlundt, C.; Poulsen, C.; Thomas, G.; Christensen, M.; Carbajal Henken, C.; Preusker, R.; Fischer, J.; et al. Cloud Property Datasets Retrieved from AVHRR, MODIS, AATSR and MERIS in the Framework of the Cloud_cci Project. Earth Syst. Sci. Data 2017, 9, 881–904. [Google Scholar] [CrossRef]
- Stengel, M.; Stapelberg, S.; Sus, O.; Finkensieper, S.; Würzler, B.; Philipp, D.; Hollmann, R.; Poulsen, C.; Christensen, M.; McGarragh, G. Cloud_cci Advanced Very High Resolution Radiometer Post Meridiem (AVHRR-PM) Dataset Version 3: 35-Year Climatology of Global Cloud and Radiation Properties. Earth Syst. Sci. Data 2020, 12, 41–60. [Google Scholar] [CrossRef]
- Chernokulsky, A.; Mokhov, I.I. Climatology of Total Cloudiness in the Arctic: An Intercomparison of Observations and Reanalyses. Adv. Meteorol. 2012, 2012, 542093. [Google Scholar] [CrossRef]
- Chan, M.A.; Comiso, J.C. Arctic Cloud Characteristics as Derived from MODIS, CALIPSO, and CloudSat. J. Clim. 2013, 26, 3285–3306. [Google Scholar] [CrossRef]
- Liu, Y.; Ackerman, S.A.; Maddux, B.C.; Key, J.R.; Frey, R.A. Errors in Cloud Detection over the Arctic Using a Satellite Imager and Implications for Observing Feedback Mechanisms. J. Clim. 2010, 23, 1894–1907. [Google Scholar] [CrossRef]
- Boccolari, M.; Parmiggiani, F. Trends and Variability of Cloud Fraction Cover in the Arctic, 1982–2009. Theor. Appl. Climatol. 2018, 132, 739–749. [Google Scholar] [CrossRef]
- Hwang, J.; Choi, Y.S.; Kim, W.M.; Su, H.; Jiang, J.H. Observational Estimation of Radiative Feedback to Surface Air Temperature over Northern High Latitudes. Clim. Dyn. 2018, 50, 615–628. [Google Scholar] [CrossRef]
- Zhang, R.; Wang, H.; Fu, Q.; Pendergrass, A.G.; Wang, M.; Yang, Y.; Ma, P.; Rasch, P.J. Local Radiative Feedbacks Over the Arctic Based on Observed Short-Term Climate Variations. Geophys. Res. Lett. 2018, 45, 5761–5770. [Google Scholar] [CrossRef]
- Kay, J.E.; L’Ecuyer, T. Observational Constraints on Arctic Ocean Clouds and Radiative Fluxes during the Early 21st Century. J. Geophys. Res. Atmos. 2013, 118, 7219–7236. [Google Scholar] [CrossRef]
- Kay, J.E.; L’Ecuyer, T.; Chepfer, H.; Loeb, N.; Morrison, A.; Cesana, G. Recent Advances in Arctic Cloud and Climate Research. Curr. Clim. Chang. Rep. 2016, 2, 159–169. [Google Scholar] [CrossRef]
- Pithan, F.; Mauritsen, T. Arctic Amplification Dominated by Temperature Feedbacks in Contemporary Climate Models. Nat. Geosci. 2014, 7, 181–184. [Google Scholar] [CrossRef]
- Palm, S.P.; Strey, S.T.; Spinhirne, J.; Markus, T. Influence of Arctic Sea Ice Extent on Polar Cloud Fraction and Vertical Structure and Implications for Regional Climate. J. Geophys. Res. 2010, 115, D21209. [Google Scholar] [CrossRef]
- Goosse, H.; Kay, J.E.; Armour, K.C.; Bodas-Salcedo, A.; Chepfer, H.; Docquier, D.; Jonko, A.; Kushner, P.J.; Lecomte, O.; Massonnet, F.; et al. Quantifying Climate Feedbacks in Polar Regions. Nat. Commun. 2018, 9, 1919. [Google Scholar] [CrossRef] [PubMed]
- Terai, C.R.; Klein, S.A.; Zelinka, M.D. Constraining the Low-Cloud Optical Depth Feedback at Middle and High Latitudes Using Satellite Observations. J. Geophys. Res. Atmos. 2016, 121, 9696–9716. [Google Scholar] [CrossRef]
- Sledd, A.; L’Ecuyer, T. How Much Do Clouds Mask the Impacts of Arctic Sea Ice and Snow Cover Variations? Different Perspectives from Observations and Reanalyses. Atmosphere 2019, 10, 12. [Google Scholar] [CrossRef]
- Zhang, R.; Wang, H.; Fu, Q.; Rasch, P.J.; Wang, X. Unraveling Driving Forces Explaining Significant Reduction in Satellite-Inferred Arctic Surface Albedo since the 1980s. Proc. Natl. Acad. Sci. USA 2019, 116, 23947–23953. [Google Scholar] [CrossRef]
- Walsh, J.E.; Ballinger, T.J.; Euskirchen, E.S.; Hanna, E.; Mård, J.; Overland, J.E.; Tangen, H.; Vihma, T. Extreme Weather and Climate Events in Northern Areas: A Review. Earth-Sci. Rev. 2020, 209, 103324. [Google Scholar] [CrossRef]
- Dobricic, S.; Russo, S.; Pozzoli, L.; Wilson, J.; Vignati, E. Increasing Occurrence of Heat Waves in the Terrestrial Arctic. Environ. Res. Lett. 2020, 15, 024022. [Google Scholar] [CrossRef]
- Vincent, W.F. Arctic Climate Change: Local Impacts, Global Consequences, and Policy Implications. In The Palgrave Handbook of Arctic Policy and Politics; Springer International Publishing: Cham, Switzerland, 2020; pp. 507–526. [Google Scholar]
- Smith, D.M.; Eade, R.; Andrews, M.B.; Ayres, H.; Clark, A.; Chripko, S.; Deser, C.; Dunstone, N.J.; García-Serrano, J.; Gastineau, G.; et al. Robust but Weak Winter Atmospheric Circulation Response to Future Arctic Sea Ice Loss. Nat. Commun. 2022, 13, 727. [Google Scholar] [CrossRef]
- Cohen, J.; Zhang, X.; Francis, J.; Jung, T.; Kwok, R.; Overland, J.; Ballinger, T.J.; Bhatt, U.S.; Chen, H.W.; Coumou, D.; et al. Divergent Consensuses on Arctic Amplification Influence on Midlatitude Severe Winter Weather. Nat. Clim. Chang. 2020, 10, 20–29. [Google Scholar] [CrossRef]
- Alkama, R.; Koffi, E.N.; Vavrus, S.J.; Diehl, T.; Francis, J.A.; Stroeve, J.; Forzieri, G.; Vihma, T.; Cescatti, A. Wind Amplifies the Polar Sea Ice Retreat. Environ. Res. Lett. 2020, 15, 124022. [Google Scholar] [CrossRef]
- Blackport, R.; Screen, J.A. Insignificant Effect of Arctic Amplification on the Amplitude of Midlatitude Atmospheric Waves. Sci. Adv. 2020, 6, eaay2880. [Google Scholar] [CrossRef] [PubMed]
- Tian, F.; Fensholt, R.; Verbesselt, J.; Grogan, K.; Horion, S.; Wang, Y. Evaluating Temporal Consistency of Long-Term Global NDVI Datasets for Trend Analysis. Remote Sens. Environ. 2015, 163, 326–340. [Google Scholar] [CrossRef]
- Metcalfe, D.B.; Hermans, T.D.G.; Ahlstrand, J.; Becker, M.; Berggren, M.; Björk, R.G.; Björkman, M.P.; Blok, D.; Chaudhary, N.; Chisholm, C.; et al. Patchy Field Sampling Biases Understanding of Climate Change Impacts across the Arctic. Nat. Ecol. Evol. 2018, 2, 1443–1448. [Google Scholar] [CrossRef]
- Forkel, M.; Carvalhais, N.; Verbesselt, J.; Mahecha, M.; Neigh, C.; Reichstein, M. Trend Change Detection in NDVI Time Series: Effects of Inter-Annual Variability and Methodology. Remote Sens. 2013, 5, 2113–2144. [Google Scholar] [CrossRef]
- Dash, J.; Ogutu, B.O. Recent Advances in Space-Borne Optical Remote Sensing Systems for Monitoring Global Terrestrial Ecosystems. Prog. Phys. Geogr. Earth Environ. 2016, 40, 322–351. [Google Scholar] [CrossRef]
- Bartsch, A.; Widhalm, B.; Leibman, M.; Ermokhina, K.; Kumpula, T.; Skarin, A.; Wilcox, E.J.; Jones, B.M.; Frost, G.V.; Höfler, A.; et al. Feasibility of Tundra Vegetation Height Retrieval from Sentinel-1 and Sentinel-2 Data. Remote Sens. Environ. 2020, 237, 111515. [Google Scholar] [CrossRef]
- Post, E.; Forchhammer, M.C.; Bret-Harte, M.S.; Callaghan, T.V.; Christensen, T.R.; Elberling, B.; Fox, A.D.; Gilg, O.; Hik, D.S.; Hoye, T.T.; et al. Ecological Dynamics Across the Arctic Associated with Recent Climate Change. Science 2009, 325, 1355–1358. [Google Scholar] [CrossRef]
- Frey, K.E.; Comiso, J.C.; Cooper, L.W.; Grebmeier, J.M.; Stock, L.V. Arctic Ocean Primary Productivity: The Response of Marine Algae to Climate Warming and Sea Ice Decline. Arct. Rep. Card 2020. [Google Scholar] [CrossRef]
- Bohlmann, U.M.; Koller, V.F. ESA and the Arctic—The European Space Agency’s Contributions to a Sustainable Arctic. Acta Astronaut. 2020, 176, 33–39. [Google Scholar] [CrossRef]
- Biskaborn, B.K.; Smith, S.L.; Noetzli, J.; Matthes, H.; Vieira, G.; Streletskiy, D.A.; Schoeneich, P.; Romanovsky, V.E.; Lewkowicz, A.G.; Abramov, A.; et al. Permafrost Is Warming at a Global Scale. Nat. Commun. 2019, 10, 264. [Google Scholar] [CrossRef]
- Jorgenson, M.T.; Grosse, G. Remote Sensing of Landscape Change in Permafrost Regions. Permafr. Periglac. Process. 2016, 27, 324–338. [Google Scholar] [CrossRef]
- Stow, D.A.; Hope, A.; McGuire, D.; Verbyla, D.; Gamon, J.; Huemmrich, F.; Houston, S.; Racine, C.; Sturm, M.; Tape, K.; et al. Remote Sensing of Vegetation and Land-Cover Change in Arctic Tundra Ecosystems. Remote Sens. Environ. 2004, 89, 281–308. [Google Scholar] [CrossRef]
- Smith, L.C.; Sheng, Y.; MacDonald, G.M.; Hinzman, L.D. Disappearing Arctic Lakes. Science 2005, 308, 1429. [Google Scholar] [CrossRef] [PubMed]
- Riseborough, D.; Shiklomanov, N.; Etzelmuller, B.; Gruber, S.; Marchenko, S. Recent Advances in Permafrost Modelling. Permafr. Periglac. Process. 2008, 19, 137–156. [Google Scholar] [CrossRef]
- Marchand, N.; Royer, A.; Krinner, G.; Roy, A.; Langlois, A.; Vargel, C. Snow-Covered Soil Temperature Retrieval in Canadian Arctic Permafrost Areas, Using a Land Surface Scheme Informed with Satellite Remote Sensing Data. Remote Sens. 2018, 10, 1703. [Google Scholar] [CrossRef]
- Du, J.; Watts, J.D.; Jiang, L.; Lu, H.; Cheng, X.; Duguay, C.; Farina, M.; Qiu, Y.; Kim, Y.; Kimball, J.S.; et al. Remote Sensing of Environmental Changes in Cold Regions: Methods, Achievements and Challenges. Remote Sens. 2019, 11, 1952. [Google Scholar] [CrossRef]
- Kumpula, T.; Pajunen, A.; Kaarlejärvi, E.; Forbes, B.C.; Stammler, F. Land Use and Land Cover Change in Arctic Russia: Ecological and Social Implications of Industrial Development. Glob. Environ. Chang. 2011, 21, 550–562. [Google Scholar] [CrossRef]
- Sizov, O.S.; Tsymbarovich, P.R.; Ezhova, E.V.; Soromotin, A.V.; Prikhodko, N.V. Assessment of the Post-Pyrogenic Dynamics of Tundra Vegetation in the Northern Part of Western Siberia over the Past 50 Years (1968–2018) Based on Detailed and High Resolution Remote Sensing Data. Sovrem. Probl. Distantsionnogo Zo. Zemli Kosmosa 2020, 17, 137–153. [Google Scholar] [CrossRef]
- Esau, I.; Miles, V.V.; Davy, R.; Miles, M.W.; Kurchatova, A. Trends in Normalized Difference Vegetation Index (NDVI) Associated with Urban Development in Northern West Siberia. Atmos. Chem. Phys. 2016, 16, 9563–9577. [Google Scholar] [CrossRef]
- Vaguet, Y.; Ourng, C.; Moriconi-Ebrard, F. Is the Arctic Really a Frontier? Settlement Dynamics within Various Arctic Limits Based on the Arcticapolis Geohistorical Database. Espac. Popul. Sociétés 2021, 1. [Google Scholar] [CrossRef]
- Yu, Q.; Epstein, H.E.; Engstrom, R.; Shiklomanov, N.; Strelestskiy, D. Land Cover and Land Use Changes in the Oil and Gas Regions of Northwestern Siberia under Changing Climatic Conditions. Environ. Res. Lett. 2015, 10, 124020. [Google Scholar] [CrossRef]
- Melnikov, V.P.; Osipov, V.I.; Brouchkov, A.V.; Falaleeva, A.A.; Badina, S.V.; Zheleznyak, M.N.; Sadurtdinov, M.R.; Ostrakov, N.A.; Drozdov, D.S.; Osokin, A.B.; et al. Climate Warming and Permafrost Thaw in the Russian Arctic: Potential Economic Impacts on Public Infrastructure by 2050. Nat. Hazards 2022, 112, 231–251. [Google Scholar] [CrossRef]
- Ramage, J.; Jungsberg, L.; Wang, S.; Westermann, S.; Lantuit, H.; Heleniak, T. Population Living on Permafrost in the Arctic. Popul. Environ. 2021, 43, 22–38. [Google Scholar] [CrossRef]
- Nyland, K.E.; Gunn, G.E.; Shiklomanov, N.I.; Engstrom, R.N.; Streletskiy, D.A. Land Cover Change in the Lower Yenisei River Using Dense Stacking of Landsat Imagery in Google Earth Engine. Remote Sens. 2018, 10, 1226. [Google Scholar] [CrossRef]
- Miller, G.H.; Alley, R.B.; Brigham-Grette, J.; Fitzpatrick, J.J.; Polyak, L.; Serreze, M.C.; White, J.W.C. Arctic Amplification: Can the Past Constrain the Future? Quat. Sci. Rev. 2010, 29, 1779–1790. [Google Scholar] [CrossRef]
- Andrews, T.; Gregory, J.M.; Webb, M.J. The Dependence of Radiative Forcing and Feedback on Evolving Patterns of Surface Temperature Change in Climate Models. J. Clim. 2015, 28, 1630–1648. [Google Scholar] [CrossRef]
- Alexeev, V.A.; Langen, P.L.; Bates, J.R. Polar Amplification of Surface Warming on an Aquaplanet in “Ghost Forcing” Experiments without Sea Ice Feedbacks. Clim. Dyn. 2005, 24, 655–666. [Google Scholar] [CrossRef]
- Haine, T.W.N.; Martin, T. The Arctic-Subarctic Sea Ice System Is Entering a Seasonal Regime: Implications for Future Arctic Amplification. Sci. Rep. 2017, 7, 4618. [Google Scholar] [CrossRef] [PubMed]
- Graff, L.S.; Iversen, T.; Bethke, I.; Debernard, J.B.; Seland, Ø.; Bentsen, M.; Kirkevåg, A.; Li, C.; Olivié, D.J.L. Arctic Amplification under Global Warming of 1.5 and 2 °C in NorESM1-Happi. Earth Syst. Dyn. 2019, 10, 569–598. [Google Scholar] [CrossRef]
- Virapongse, A.; Pearlman, F.; Pearlman, J.; Murambadoro, M.D.; Kuwayama, Y.; Glasscoe, M.T. Ten Rules to Increase the Societal Value of Earth Observations. Earth Sci. Inform. 2020, 13, 233–247. [Google Scholar] [CrossRef]
- Plummer, S.; Lecomte, P.; Doherty, M. The ESA Climate Change Initiative (CCI): A European Contribution to the Generation of the Global Climate Observing System. Remote Sens. Environ. 2017, 203, 2–8. [Google Scholar] [CrossRef]


| Reference | Key Notes and Brief Conclusions |
|---|---|
| General reviews | |
| [4] | Satellite observations are indispensable for climate monitoring. |
| [5] | Satellites plays a vital role in Arctic climate change assessment. |
| [31] | Satellites reveal climate change footprints in the Arctic energy budget. |
| [32] | Satellites reveal changes in the radiation balance. |
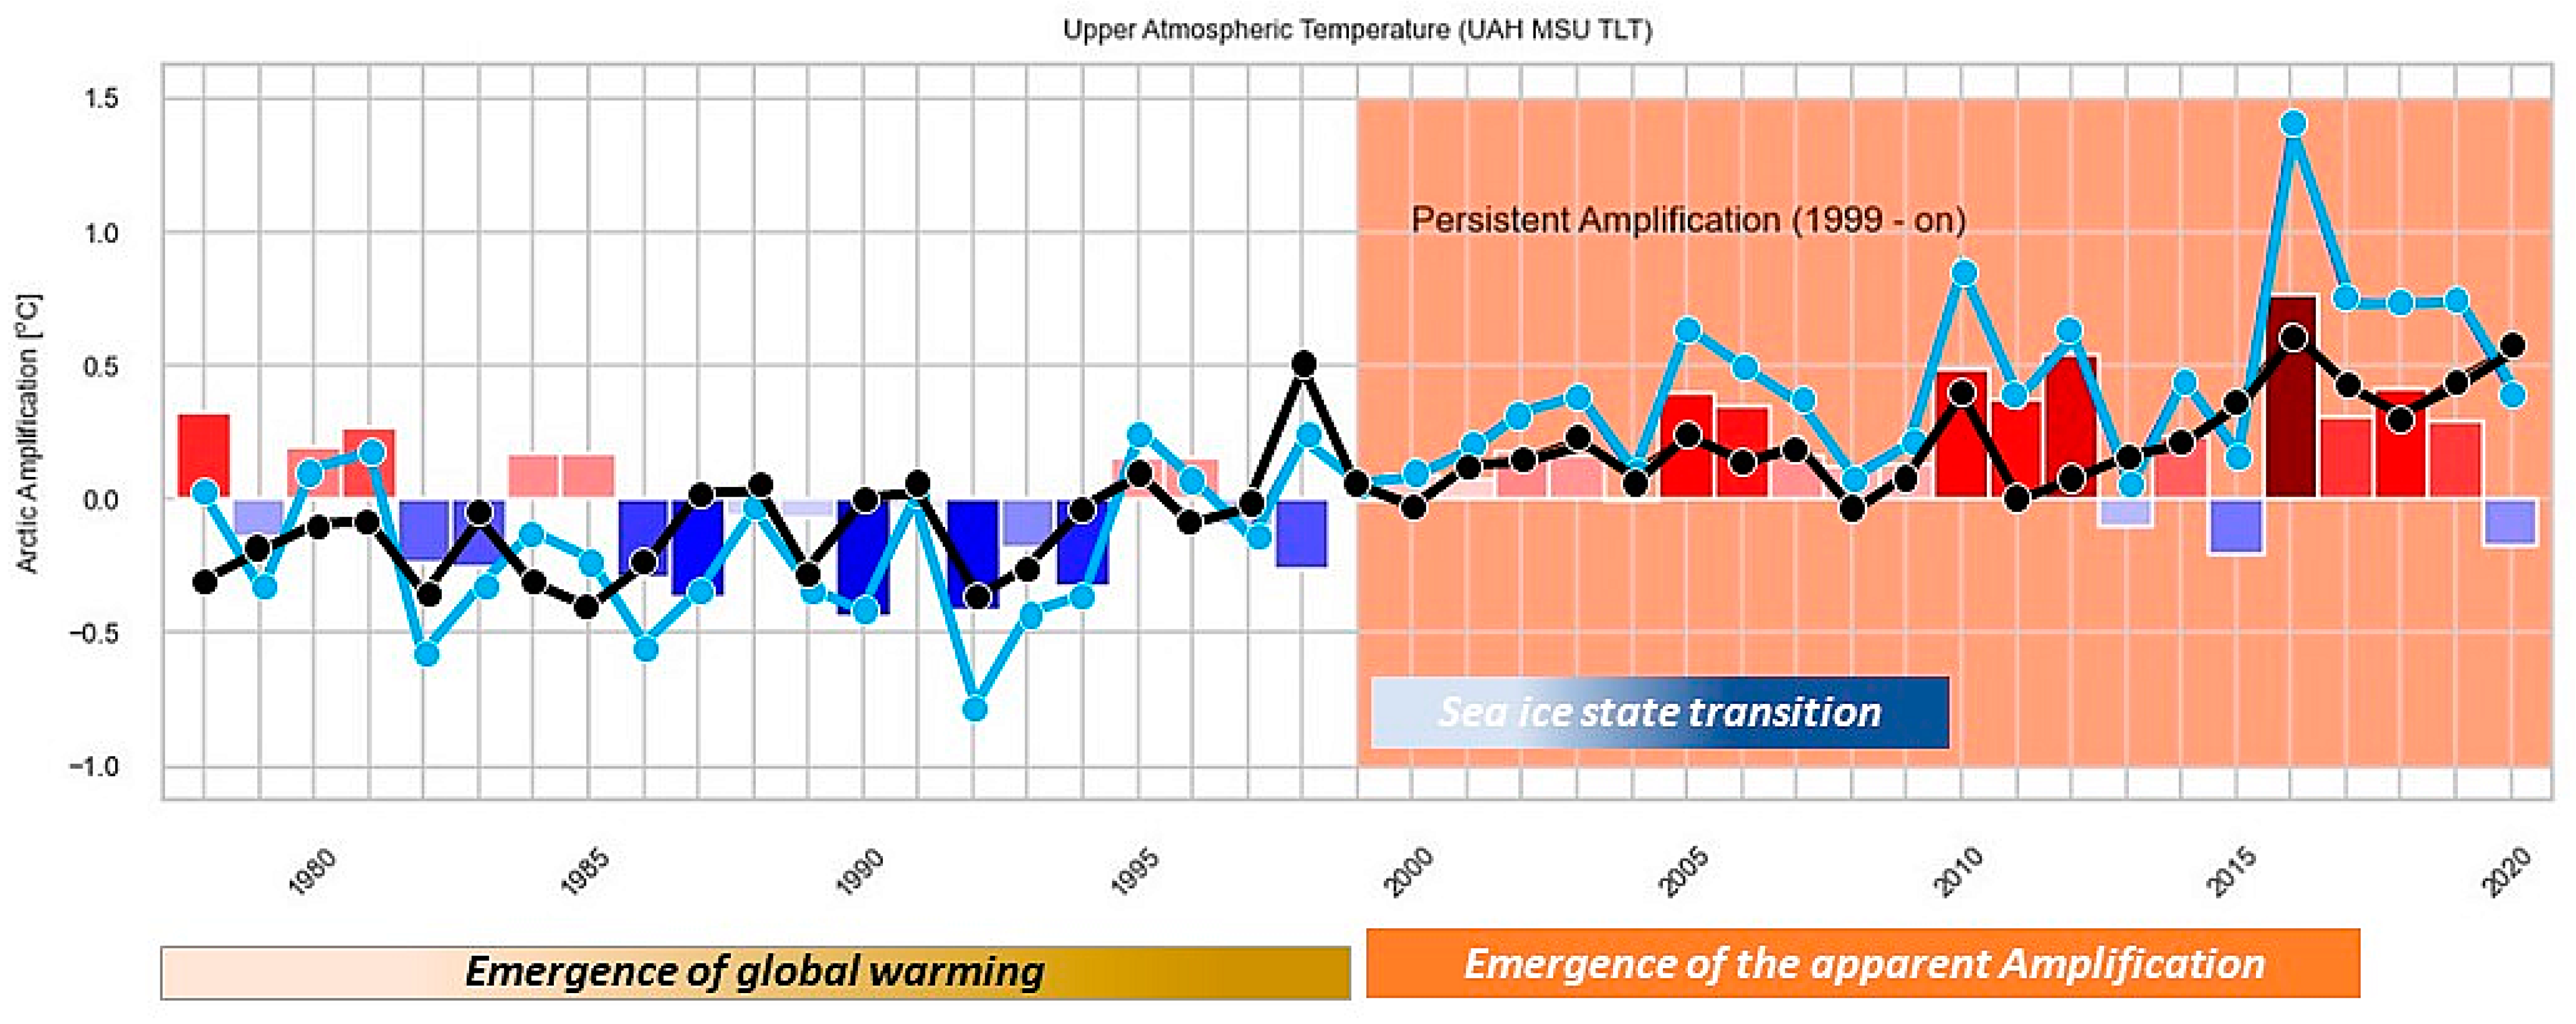
| [13,33] | Satellites disclose the amplified Arctic warming. |
| [9] | Satellites reveal interconnections in the amplification drivers, feedback, and geographical patterns. |
| [19,34,35] | Exceptional warming over Barents Sea is related to sea ice retreat and declining sea ice import. |
| Specific reviews | |
| Dynamical factors of the amplification | |
| [36] | Increase in ocean warm water inflow |
| [37] | Decrease in meridional heat transport since 2000 |
| [38] | Decrease in middle atmosphere temperature inversion strength |
| Local factors and feedback of the amplification | |
| [39,40] | Increase in land surface temperatures with minimum trends in summer and maximum trends in autumn; atmospheric temperature inversions correlated with sea ice anomalies |
| [6,24] | Rise in Arctic sea surface temperatures |
| [19,41] | Surface air and sea surface temperatures correlated with sea ice cover |
| [17,42,43,44] | Satellites show disappearance of multiyear ice and reduction in ice thickness and volume |
| [45] | Increase in area of melting ponds on ice |
| [25,46] | General decrease in extent of snow cover and water equivalent, but geographical variations are significant |
| [47] | Arctic cloud cover undergoes multidirectional changes |
| [48] | Regional changes in TOA radiation fluxes are insignificant—implies weak atmosphere–surface coupling |
| [49,50,51] | Decrease in Arctic ice surface albedo |
| [52] | Increase in sea ice radiative forcing |
| [53] | Increase in cloud radiative forcing |
| Environmental changes | |
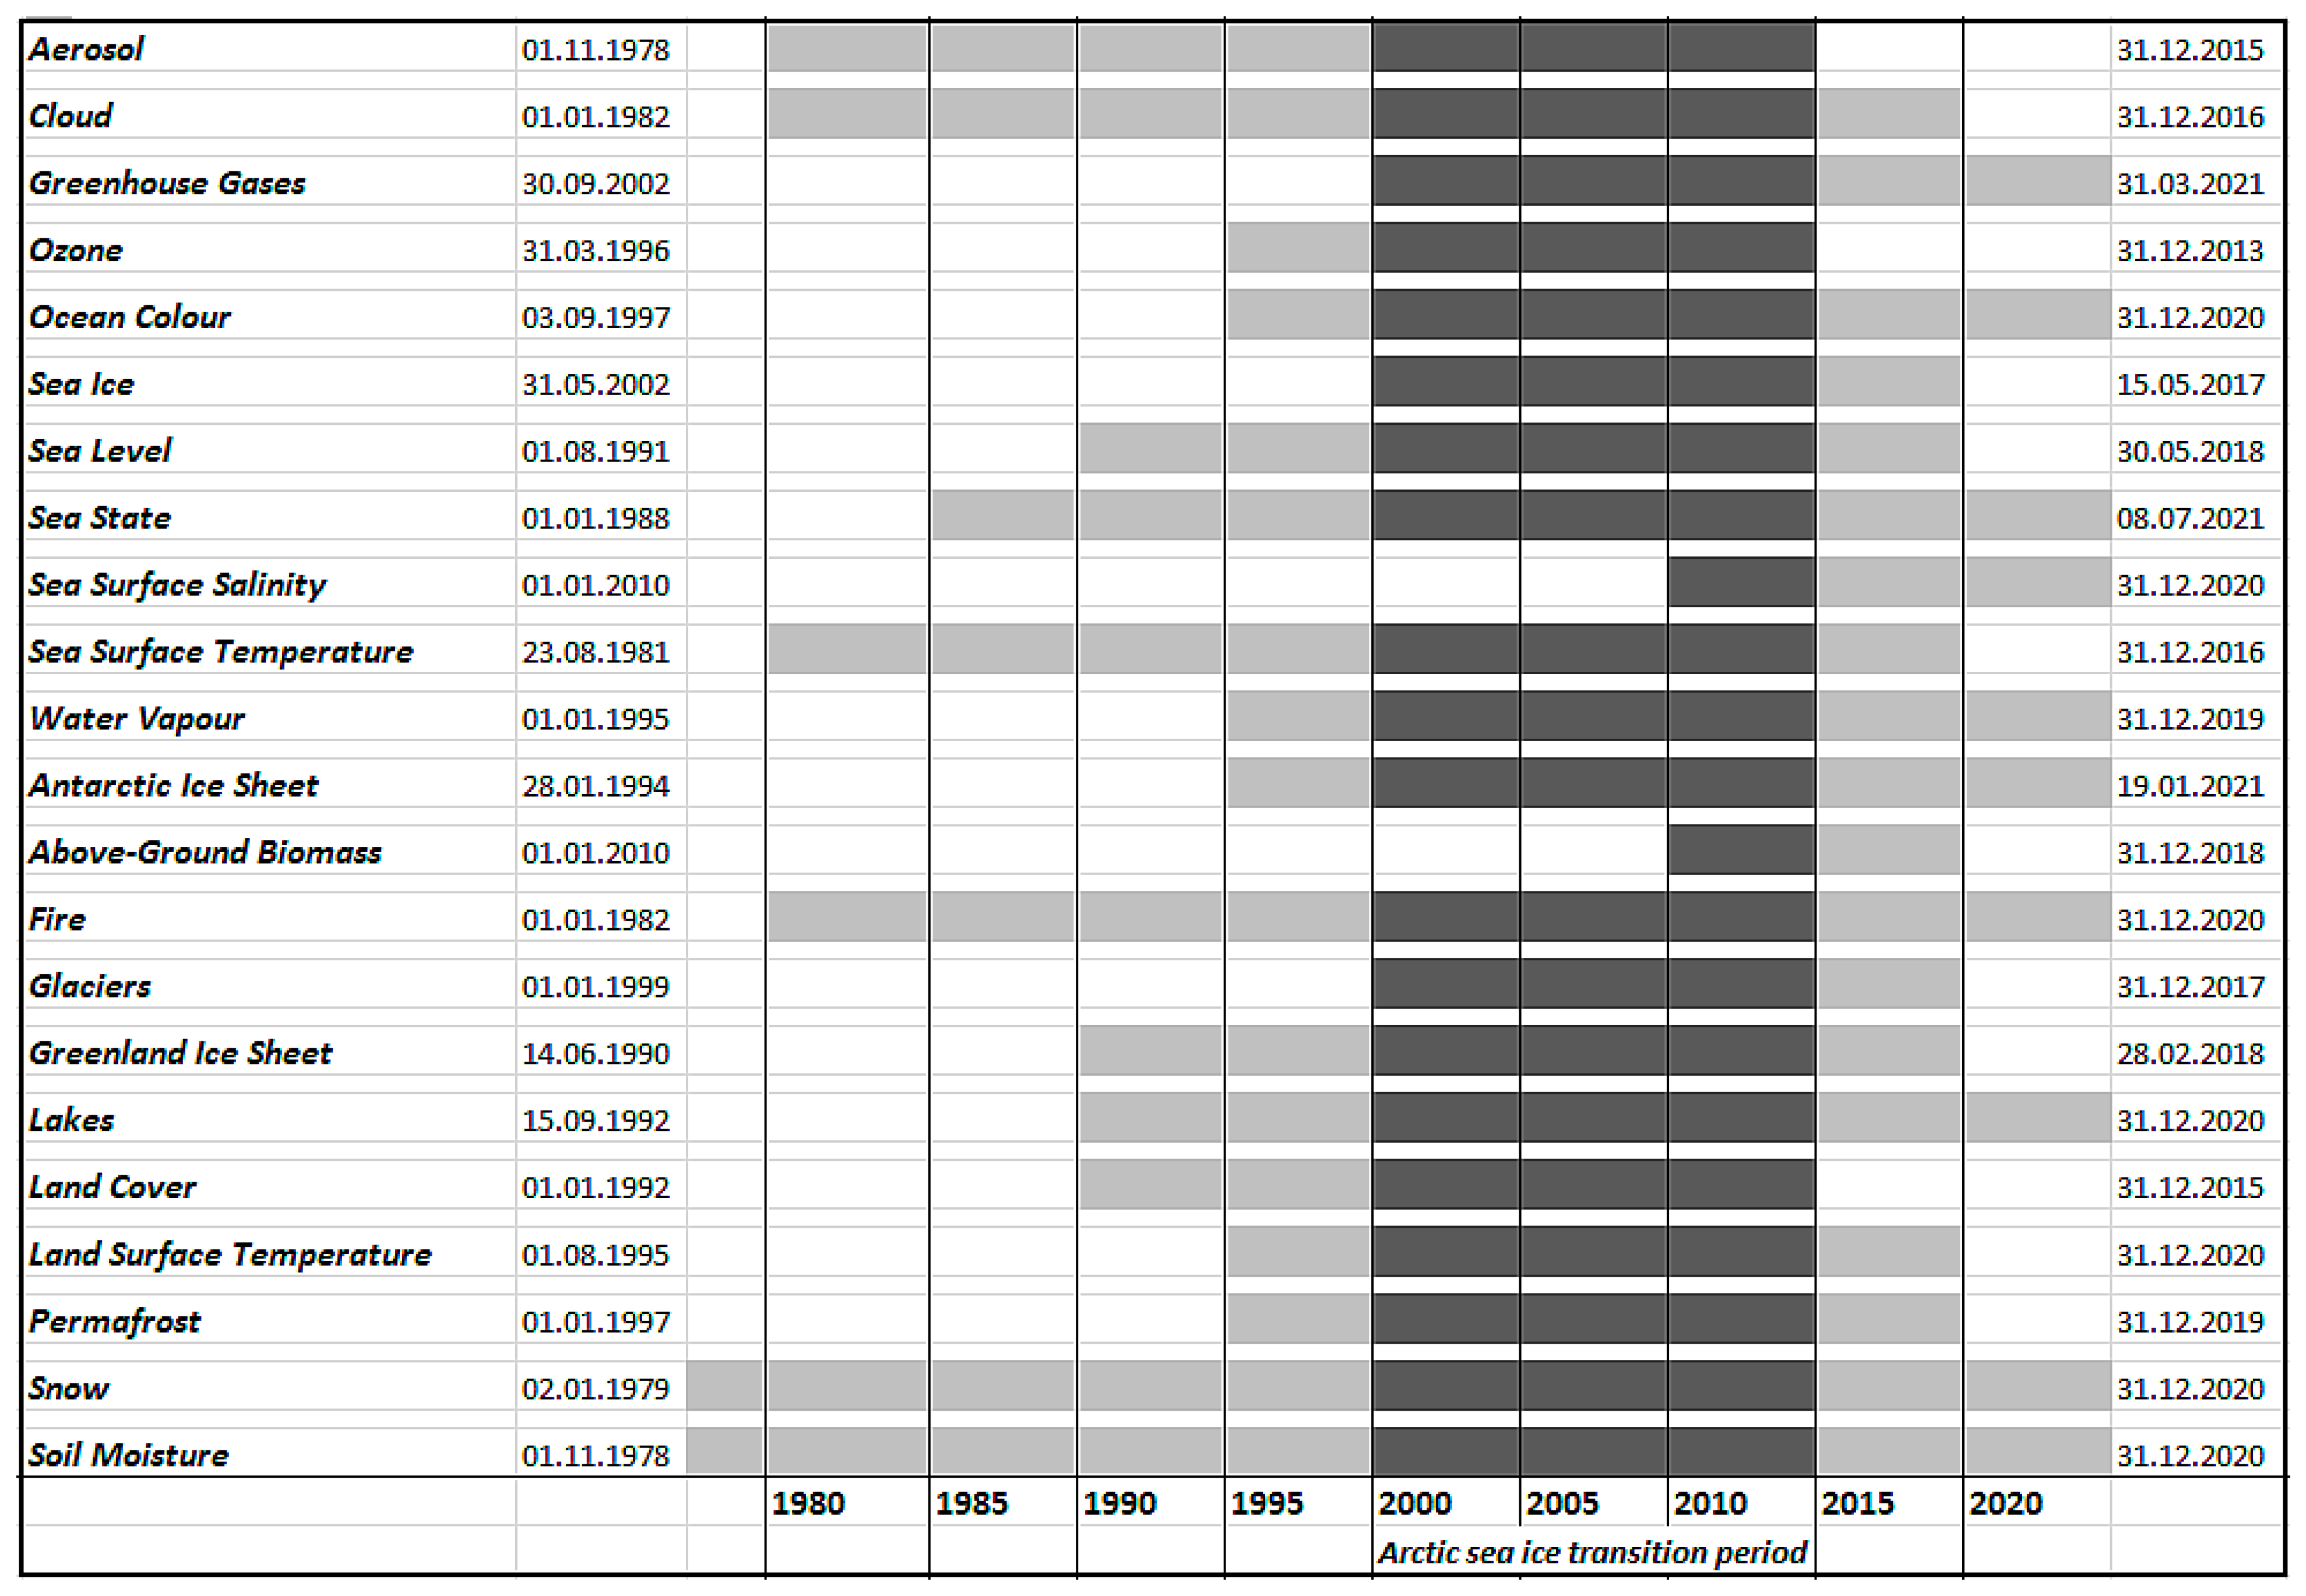
| [30] | Satellite observations reveal rapid changes in the Arctic environment; list of relevant satellite data sets provided |
| [7,28] | Satellite observations reveal complex changes in the Arctic environment |
| [27,29,54,55,56] | Satellite observations could be used to monitor permafrost thaw; permafrost becoming unstable in different regions |
| [57] | Growing season duration and increase in productivity of vegetation |
| [26] | Satellites reveal increasing marine biological production in the Arctic |
| [58,59,60] | Loss in Greenland ice sheet mass and height |
| Impact on humans | |
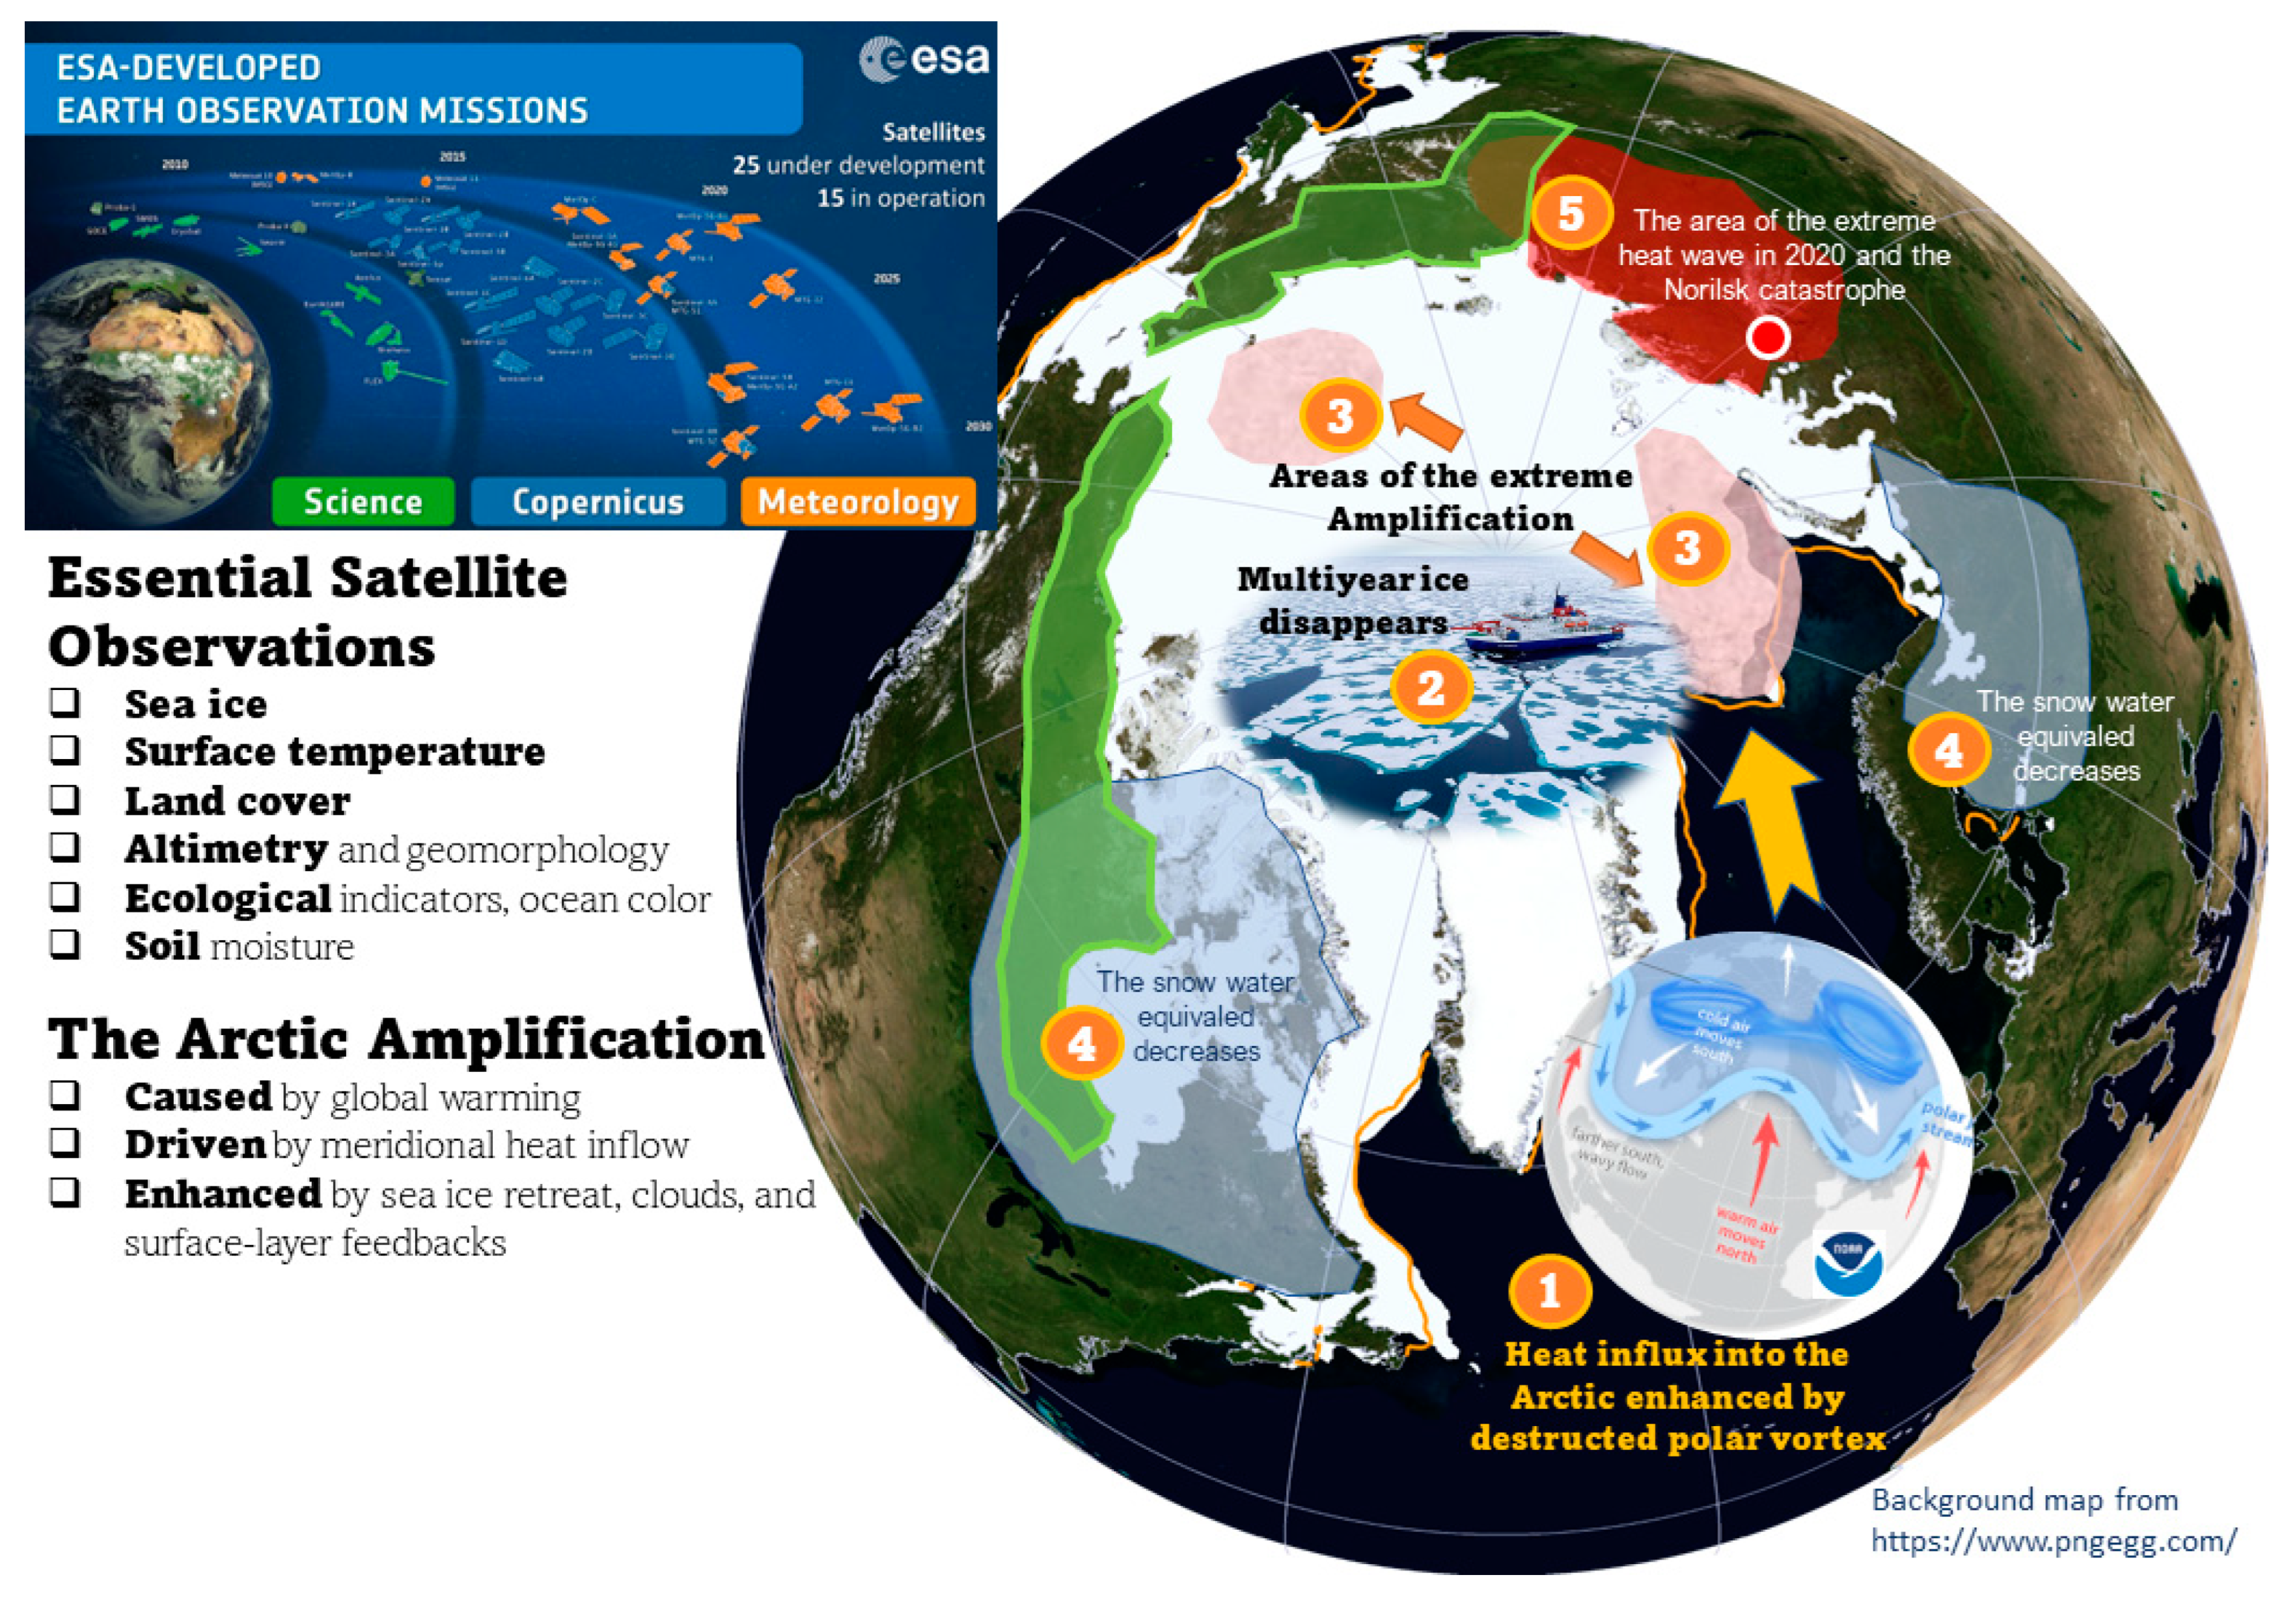
| [61,62] | Satellites reveal expanding human infrastructure and growing impact in the Arctic |
| Product Name (Abbreviation) | Accessibility | Reference |
|---|---|---|
| Multiple variable products | ||
| MODIS data products | Moderate Resolution Imaging spectroradiometer https://modis.gsfc.nasa.gov/data/dataprod/ (accessed on 8 January 2023) | [30] |
| Temperature | ||
| UAH MSU/AMSU | University of Alabama-Huntsville (UAH) MSU/AMSU Mean Layer Atmospheric Temperatures, version 6 https://data.globalchange.gov/dataset/university-alabama-huntsville-uah-msu-amsu-mean-layer-atmospheric-temperatures-version-6 (accessed on 8 January 2023) | [65,73] |
| SST | Arctic Ocean—Sea and Ice Surface Temperature REPROCESSED https://data.marine.copernicus.eu/product/SEAICE_ARC_PHY_CLIMATE_L4_MY_011_016/description (accessed on 8 January 2023) | [24] |
| Cloud and radiation budget characteristics | ||
| CLARA-A2 | Cloud, Albedo, and Surface Radiation data set from AVHRR data, second edition https://wui.cmsaf.eu/safira/action/viewDoiDetails?acronym=CLARA_AVHRR_V002 (accessed on 8 January 2023) | [74] |
| CERES EBAF | Clouds and the Earth’s Radiant Energy System (CERES) Energy Balanced and Filled (EBAF) Top-of-Atmosphere (TOA) edition-4.1 data product https://asdc.larc.nasa.gov/project/CERES/CERES_EBAF-TOA_Edition4.1 (accessed on 8 January 2023) | [75] |
| PATMOS-x | NOAA’s Pathfinder Atmospheres, Extended program (PATMOS-x), v6.0 https://doi.org/10.7289/V5X9287S (accessed on 8 January 2023) | [76] |
| APP-x | Extended Advanced Very High-Resolution Radiometer (AVHRR) Polar Pathfinder (APP-x) https://www.ncei.noaa.gov/data/avhrr-polar-pathfinder-extended/access/ (accessed on 8 January 2023) | [77,78] |
| Sea ice and snow cover characteristics | ||
| NOAA CDR – Rutgers | NOAA Snow Cover Extent Climate Data Record (CDR) Rutgers University Global Snow data set https://climate.rutgers.edu/snowcover/ (accessed on 8 January 2023) | [79] |
| EUMETSAT OSI SAF v2.0 | https://osi-saf.eumetsat.int/about/access-data | [80] |
| Goddard Bootstrap (SB2) and NASA Team (NT1) data sets | National Snow and Ice Data Center (NSIDC): the NASA Team (http://nsidc.org/data/nsidc-0051 (accessed on 8 January 2023)) and Bootstrap SB2 (http://nsidc.org/data/nsidc-0079 (accessed on 8 January 2023)) | [81] |
| PIOMAS | Polar Science Center sea ice data http://psc.apl.uw.edu/research/projects/arctic-sea-ice-volume-anomaly/data/ (accessed on 8 January 2023) | [82] |
| Land cover and vegetation productivity | ||
| GIMMS3g | Global Inventory Modeling and Mapping Studies https://climatedataguide.ucar.edu/climate-data/ndvi-normalized-difference-vegetation-index-3rd-generation-nasagfsc-gimms (accessed on 8 January 2023) | [66,83,84] |
| MEaSUREs | MEaSUREs Global Record of Daily Landscape Freeze/Thaw Status, version 3 (NSIDC-0477) https://nsidc.org/data/nsidc-0477/versions/3 (accessed on 8 January 2023) | [85] |
Disclaimer/Publisher’s Note: The statements, opinions and data contained in all publications are solely those of the individual author(s) and contributor(s) and not of MDPI and/or the editor(s). MDPI and/or the editor(s) disclaim responsibility for any injury to people or property resulting from any ideas, methods, instructions or products referred to in the content. |
© 2023 by the authors. Licensee MDPI, Basel, Switzerland. This article is an open access article distributed under the terms and conditions of the Creative Commons Attribution (CC BY) license (https://creativecommons.org/licenses/by/4.0/).
Share and Cite
Esau, I.; Pettersson, L.H.; Cancet, M.; Chapron, B.; Chernokulsky, A.; Donlon, C.; Sizov, O.; Soromotin, A.; Johannesen, J.A. The Arctic Amplification and Its Impact: A Synthesis through Satellite Observations. Remote Sens. 2023, 15, 1354. https://doi.org/10.3390/rs15051354
Esau I, Pettersson LH, Cancet M, Chapron B, Chernokulsky A, Donlon C, Sizov O, Soromotin A, Johannesen JA. The Arctic Amplification and Its Impact: A Synthesis through Satellite Observations. Remote Sensing. 2023; 15(5):1354. https://doi.org/10.3390/rs15051354
Chicago/Turabian StyleEsau, Igor, Lasse H. Pettersson, Mathilde Cancet, Bertrand Chapron, Alexander Chernokulsky, Craig Donlon, Oleg Sizov, Andrei Soromotin, and Johnny A. Johannesen. 2023. "The Arctic Amplification and Its Impact: A Synthesis through Satellite Observations" Remote Sensing 15, no. 5: 1354. https://doi.org/10.3390/rs15051354
APA StyleEsau, I., Pettersson, L. H., Cancet, M., Chapron, B., Chernokulsky, A., Donlon, C., Sizov, O., Soromotin, A., & Johannesen, J. A. (2023). The Arctic Amplification and Its Impact: A Synthesis through Satellite Observations. Remote Sensing, 15(5), 1354. https://doi.org/10.3390/rs15051354