Article

Sampling Survey Method of Wheat Ear Number Based on UAV Images and Density Map Regression Algorithm

1
Key Laboratory of Agricultural Blockchain Application, Ministry of Agriculture and Rural Affairs, Agricultural Information Institute, Chinese Academy of Agricultural Sciences, Beijing 100081, China
2
Jiangsu Key Laboratory of Crop Genetics and Physiology, Jiangsu Key Laboratory of Crop Cultivation and Physiology, Agricultural College of Yangzhou University, Yangzhou 225009, China
3
Jiangsu Co-Innovation Center for Modern Production Technology of Grain Crops, Yangzhou University, Yangzhou 225009, China
*
Author to whom correspondence should be addressed.
These authors contributed equally to this work.
Remote Sens. 2023, 15(5), 1280; https://doi.org/10.3390/rs15051280
Submission received: 17 November 2022 / Revised: 16 February 2023 / Accepted: 22 February 2023 / Published: 25 February 2023

Abstract

:
The number of wheat ears is one of the most important factors in wheat yield composition. Rapid and accurate assessment of wheat ear number is of great importance for predicting grain yield and food security-related early warning signal generation. The current wheat ear counting methods rely on manual surveys, which are time-consuming, laborious, inefficient and inaccurate. Existing non-destructive wheat ear detection techniques are mostly applied to near-ground images and are difficult to apply to large-scale monitoring. In this study, we proposed a sampling survey method based on the unmanned aerial vehicle (UAV). Firstly, a small number of UAV images were acquired based on the five-point sampling mode. Secondly, an adaptive Gaussian kernel size was used to generate the ground truth density map. Thirdly, a density map regression network (DM-Net) was constructed and optimized. Finally, we designed an overlapping area of sub-images to solve the repeated counting caused by image segmentation. The MAE and MSE of the proposed model were 9.01 and 11.85, respectively. We compared the sampling survey method based on UAV images in this paper with the manual survey method. The results showed that the RMSE and MAPE of NM13 were 18.95 × 10⁴/hm2 and 3.37%, respectively, and for YFM4, 13.65 × 10⁴/hm2 and 2.94%, respectively. This study enables the investigation of the number of wheat ears in a large area, which can provide favorable support for wheat yield estimation.

Graphical Abstract

1. Introduction

Wheat is an adaptable and globally distributed food crop that is a staple food for about one-third of the global population, which is also the most important food for trade and international aid [1,2]. Therefore, wheat yield estimation methods have received extensive research attention. The number of wheat ears, grains per spike, and grain weight are the most important yield components of wheat. Several studies have shown that there is a dynamic compensation mechanism among yield components, with sharp fluctuations in the differences between other factors and yield correlations, but the correlation between ear number and yield always remains stable at the strongest level [3,4,5,6]. Thereby, the number of wheat ears has become an important indicator for studying wheat yield, and an accurate estimation of the number of wheat ears is crucial for growers to predict wheat harvest and growth trends [7,8,9]. Traditional survey of wheat ear number relies on manual work, which is not only tedious and laborious, with limited sampling area, but also error-prone and time-consuming, thus severely limiting the accuracy of yield prediction and causing excessive estimation errors. Therefore, the development of an efficient and automated survey method of wheat ear number is of great significance for wheat yield prediction. In addition, it can provide a theoretical basis and technical support for early warning signals related to food security.
Wheat ear counting is a crucial computer vision task. In the last decade, many researchers have invested substantial effort in it due to its great potential for applications (e.g., yield measurement and phenotypic analysis). There are three non-destructive methods for wheat ear counting. One is the traditional image processing algorithms, which aim to achieve wheat ear counting by manually screening feature parameters (color features and texture features) [10,11,12]. This method is fast and low-cost. However, it requires manual screening of features. If these features do not have adaptive thresholds, the accuracy will be unstable in complex environments. The second method is object detection or semantic segmentation based on deep learning algorithms, which aim to use convolutional neural networks to fit region proposals or segment ears for counting [13,14,15,16,17,18,19,20]. This method can generate features adaptively, which is less affected by complex environments and can locate the position of wheat ears. However, it is not suitable for very small scale and scenes that are too dense. The third method is density map regression based on deep learning algorithms, which aim to use convolutional neural networks to generate high-quality density maps to estimate wheat ear number [21,22]. The progress of this method compared with the previous one is that it uses the location information of wheat ears to exchange, which is well adapted to small and dense scenes.
Unmanned aerial vehicles (UAVs) are one of the main ways to obtain remote sensing data at present. Compared with satellite remote sensing platforms, UAV remote sensing has the advantages of simple operation, mobility and flexibility, rapid response, and low cost. They have been used increasingly in agriculture in recent years, including crop yield assessment, crop height monitoring, weed mapping, and biomass monitoring [23,24,25,26]. Wheat ear images acquired using UAVs are usually characterized by the diversity of resolution, inconsistent lighting, and high density, which make crop counting extremely difficult. As mentioned earlier, the deep learning algorithm can overcome this problem. However, there are many kinds of deep learning algorithms. It is worth considering selecting an appropriate method to match UAV images to achieve an efficient survey of wheat ear numbers.
Crowd counting research provides a solution to the method selection for this study because its scene is very similar to the wheat ear counting scene of UAV images [27]. Its density map regression algorithm mainly focuses on small-scale and dense crowd scenes and is maturely developed [28,29,30,31]. This algorithm transforms (e.g., geometric adaptive Gaussian kernel) the labeled target information into a probability density map (ground truth), then uses end-to-end training to generate a high-quality density map (predicted value), and finally determines the quantity by integration. In addition, the location information of each wheat ear will not be taken into account during the survey, so the weakness of this algorithm can be ignored.
Although we have preliminarily determined the method is suitable for wheat ear counting on UAV images, in the actual survey process, there are problems in the UAV image acquisition and algorithm matching. Therefore, we designed a UAV image sample collection method and selected several density map algorithms to optimize it to adapt to UAV images. This research will improve the efficiency of the field survey of wheat ear numbers, and is of great significance for wheat yield estimation by UAVs.

2. Materials and Methods
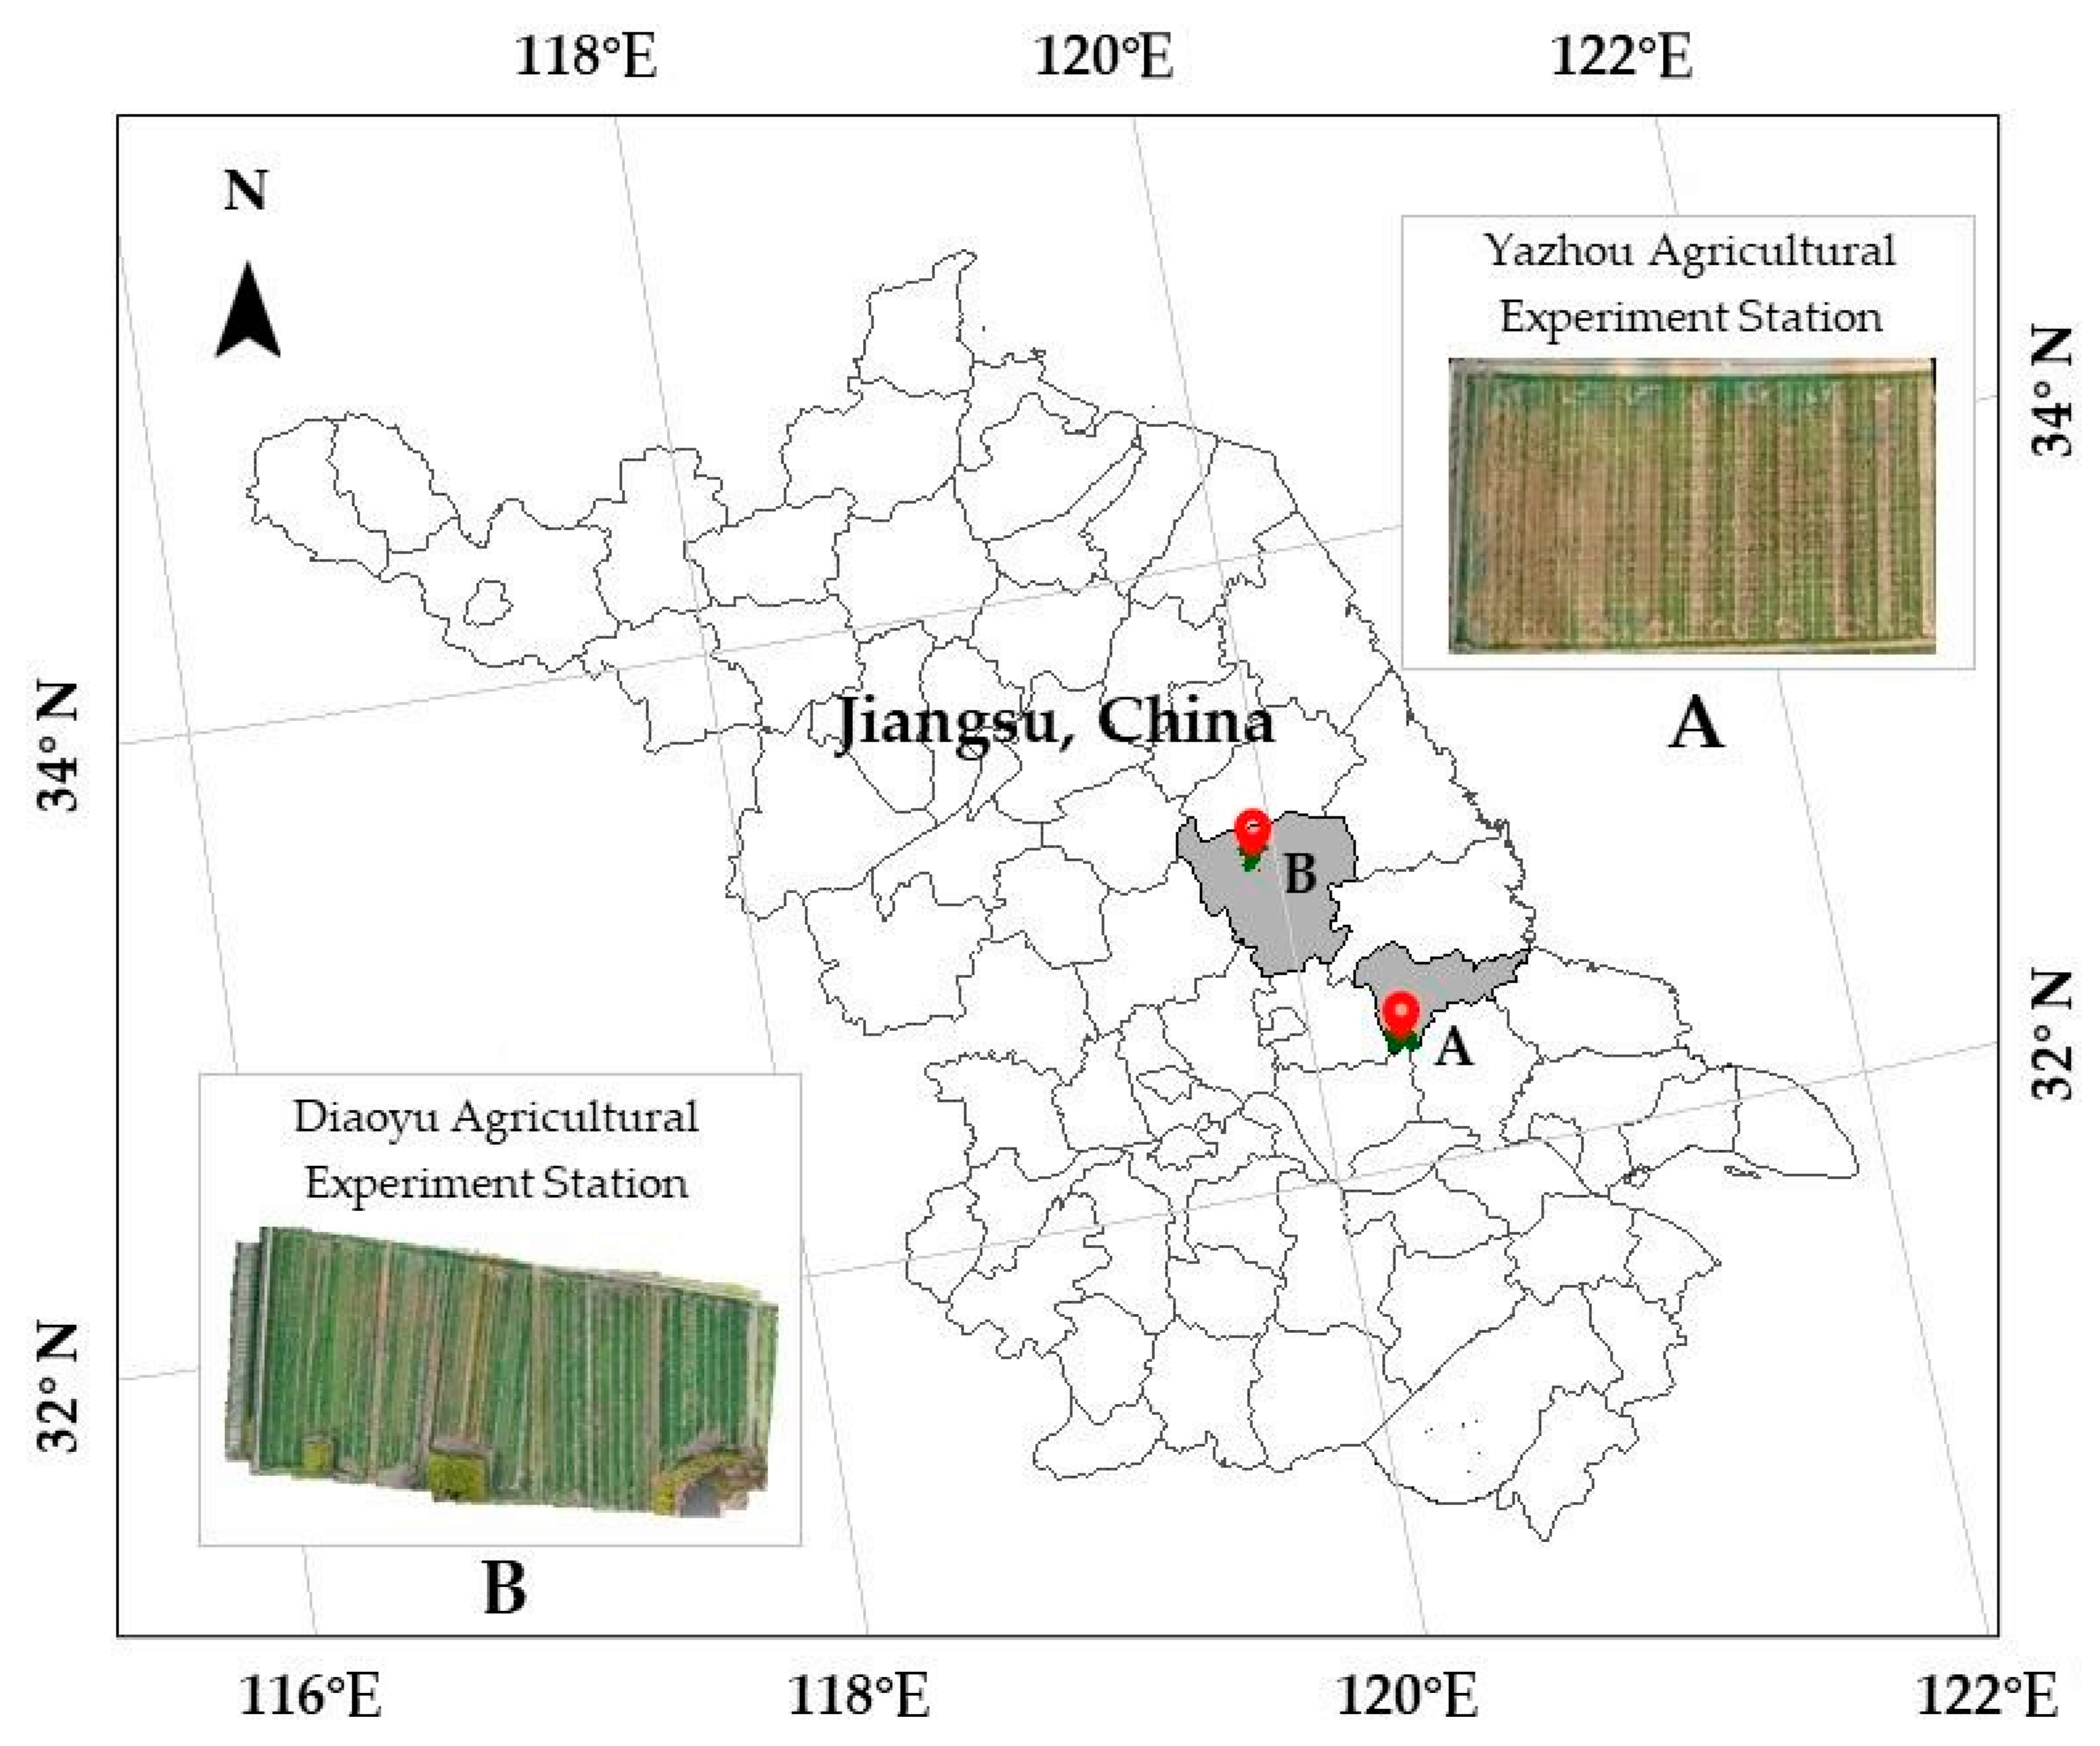
2.1. Experiment

To construct wheat ear counting scenarios with different gradients, we conducted field experiments over two consecutive years (2018–2019, 2019–2020) of variety, density and nitrogen fertilizer experiments at two test stations. Specifically, the field experiment of Ningmai No.13 (NM13) was carried out at Yazhou Agricultural Experimental Station, including two densities (150 × 104 hm−2 and 300 × 104 hm−2) and three nitrogen fertilizers (150 kg · hm−2, 225 kg · hm−2 and 300 kg · hm−2). The field experiment of Yangfumai No.4 (YFM4) was carried out at Diaoyu Agricultural Experimental Station, including two densities (150 × 104 hm−2 and 300 × 104 hm−2) and three nitrogen fertilizers (150 kg · hm−2, 225 kg · hm−2 and 300 kg · hm−2). The strip field with the size of 3 × 30 m, and each cell was treated in the same way for two years. The overview of the study area is shown in Figure 1.

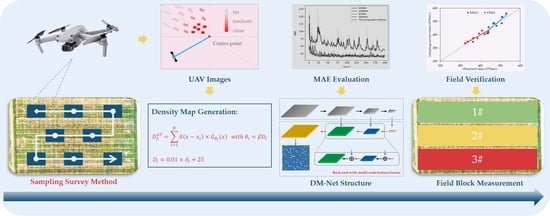
2.2. Sampling Survey Pipeline

The overall sampling survey pipeline of wheat ear number is shown in Figure 2. It mainly includes 3 steps: image acquisition design, dataset generation, and density map regression network (DM-Net) construction and optimization.

2.2.1. Image Acquisition Design

The five-point sampling method is recognized as a general method for agricultural data collection. We refer to the five-point sampling method for UAV image acquisition to achieve the purpose of the efficient survey of wheat ear number (Figure 2). The sampling points are flexibly determined by the field size, image sensor and flight parameters. In this study, a DJI Mavic 2 Pro (SZ DJI Technology Co., Ltd., Shenzhen, China) equipped with a 1-inch CMOS camera was used, and the flight altitude was 5 m. As the experimental field was a strip field, its width was just in the frame of the image sensor. Therefore, the sampling points were determined by equally spaced linear sampling. For each flight campaign, the UAV followed a predefined zigzag-shaped flight path planned using the PhenoFly Planning Tool [32] and implemented using the autopilot software DJI GS Pro (SZ DJI Technology Co. Ltd.). The image acquisition time was 7 days after flowering. The image size is 5472 × 3648 pixels and the image resolution is 0.8 mm/pixel. In 2018–2019, two images were collected for each treatment, a total of 24 original images, for model training and verification. In 2019–2020, five images were collected for each treatment, a total of 60 original images, mainly for model testing. A total of 84 original images were collected in two years.

2.2.2. Dataset and Image Labeling

The training set and validation set were collected in 2018–2019. Wheat ears were consistent in different UAV images, and 24 images were enough to train a reliable model. Since the original images contained a large number of wheat ears, they were divided into six equal parts according to their length and width. Thus, one original image was segmented into 36 sub-images with a size of 912 × 608 pixels. There were a 24 × 36 = 864 sub-images in total. A total of 50% of them were divided into the training set and 50% into the validation set randomly. Finally, 432 sub-images were used for model training and 432 sub-images were used for validation. Labelme 4.5.10 (https://github.com/wkentaro/labelme, accessed on 5 November 2022) was used to point-label the wheat ears, with the marker location being the center point of the ears and the label being ear, then saving them in the format of a .json file. A total of 153,699 wheat ears were labeled. Those sub-images and labels constituted the new dataset, named the UEC dataset. The test dataset was collected in 2019–2020, including 60 original images. The test images were used to compare with the field-measured data. Therefore, image segmentation and manual labeling work were unnecessary.

2.2.3. Density Map Generation

Two methods were used to obtain the ground-truth density maps. One is to generate density maps with the same size of Gaussian kernels for all objects [29]. Supposing there is a point at the pixel x i that denotes the position of wheat ears in the scene, the corresponding ground-truth density map D 1 G T can be computed by blurring each ear annotation using a Gaussian kernel. The D 1 G T is defined as below:
D 1 G T = i = 1 N δ x x i × G μ , σ 2 x ,
For each annotation ear x i in the ground truth δ , we convolve δ x x i by a Gaussian kernel G μ , σ 2 with parameter μ (kernel size) and σ (standard deviation), where x is the matrix consistent with the size of the labeled image, and the initial values are all 0; where x i is the pixel position of the annotation ear, δ x x i is a function that sets 0 of the position x i of matrix x to 1; N is the number of ear annotations. In the experiment, we set μ = 15 and σ = 4 , 8 , 12 for further testing.
As shown in Figure 3, the scale and characteristics of wheat ears in the edge view differed greatly from that in the center view. In order to reduce the influence of this difference, the density map generation was optimized. The second method was through geometry-adaptive kernels. An adaptive Gaussian kernel based on the distance between the target point and the image center point in the camera view was proposed. The D 2 G T was defined as below:
D 2 G T = i = 1 N δ x x i × G θ i x ,         w i t h   θ i = β D i ,
D i = 0.01 × d i + 25 ,
where G θ i is an adaptive Gaussian kernel, D i is the function between diagonal line and distance (Section 3.1), β is the conversion coefficient between diagonal line and kernel size, and β = 0.1 .

2.2.4. The Proposed Method

As a classical crowd counting algorithm, CSRNet [33] demonstrates a good performance. This research took it as the basic model framework, and added multi-scale feature fusion on the back-end network to enhance the quality of density map generation. The performance will be compared with other density map algorithms (Section 3.2). The proposed network is shown in Figure 4.
The image and the corresponding ground truth were randomly cut into 400 × 400 pixels and input into the model. The front-end network used VGG16 as the backbone to extract basic image features. In the back-end network, a 1 × 1 convolutional kernel, a 3 × 3 convolutional kernel, and up-sampling were used to continuously improve the density map quality. Then, focusing on the same-sized feature layers in the front-end network, we combined them with the up-sampled feature layers. Finally, a high-quality density map of the same size as the cropped image was generated.

2.3. Model Training

The DM-Net was straightforwardly trained as an end-to-end structure. The first 10 convolutional layers were fine-tuned using a well-trained VGG-16. For the other layers, the initial values came from a Gaussian initialization with a 0.01 standard deviation. Stochastic gradient descent (SGD) was applied with a fixed learning rate at 1 × 10⁻⁵ during training. The loss function is given below:
L Θ = 1 2 N i = 1 N Z X i ; Θ Z i G T 2 2
where Θ is a set of learnable parameters in the DM-Net; N is the number of training images; X i represents the input image, while Z i G T is the ground truth result of the input image X i ; Z X i ; Θ is the estimated density map generated by the DM-Net with parameters shown as Θ for the sample X i . L is the loss between the estimated density map and the ground truth density map.
The environment configuration for model training is shown in Table 1.

2.4. Model Evaluation

The mean absolute error (MAE) and mean square error (MSE) were used for the model evaluation, which were defined as follows:
M A E = 1 N i = 1 N z i z ^ i
M S E = 1 N i = 1 N z i z ^ i 2
where N is the number of images in one test sequence; z i is the ground truth of counting; z ^ i is the value of estimation; its formula is shown below:
z ^ i = l = 1 L w = 1 W z l , w
where L and W represent the length and width of the density map, respectively, while z l , w is the pixel at the coordinates of the generated density map l , w .

2.5. Manual Measurement and Evaluation

The number of wheat ears in 1 m2 was counted manually at maturity. Measurement of each treatment was repeated 5 times, and the average value of it was taken. Then, it was converted to standard units as evaluation data.
The root mean square error (RMSE) and mean absolute percentage error (MAPE) were used to evaluate the accuracy of the UAV sampling survey method. The formula is as follows:
R M S E = i x i y i 2 n
M A P E = 1 n i x i y i y i × 100 %
where x i is the UAV sampling survey data, y i is the manual measurement data, and n is the number of survey regions.

3. Results

3.1. Density Map Generation

A high-quality density map was a basis for training a good model. This research used a Gaussian kernel to generate the density map, where kernel size was the biggest factor affecting the quality of the density map. As mentioned in Section 2.2.3, the first method used the same size of Gaussian kernels to generate density maps. The second method used adaptive Gaussian kernels to generate a density map. Zhang et al. [28] used the k-nearest neighbor algorithm to determine the kernel size. The method solved the problem of different target scales in crowd images, but the scene in this paper did not conform to the rule. By analyzing the relationship between the diagonal length of wheat ears at the different views and their distance from the image center (Figure 5), it could be found that the scale of wheat ears was related to the angle of the image view. The results showed that there was a significant linear relationship between them, and R2 was 0.6121. Therefore, it was taken as the basic index of adaptive kernel size, and used the conversion coefficient to determine the final kernel size.
The results of density map generation are shown in Figure 6. It shows that the method using the same kernel size did not take into account the scale of wheat ears, and the density maps were consistent. The proposed method by adaptive kernel size could generate density maps with different scales of wheat ears, which was more consistent with the actual scene.

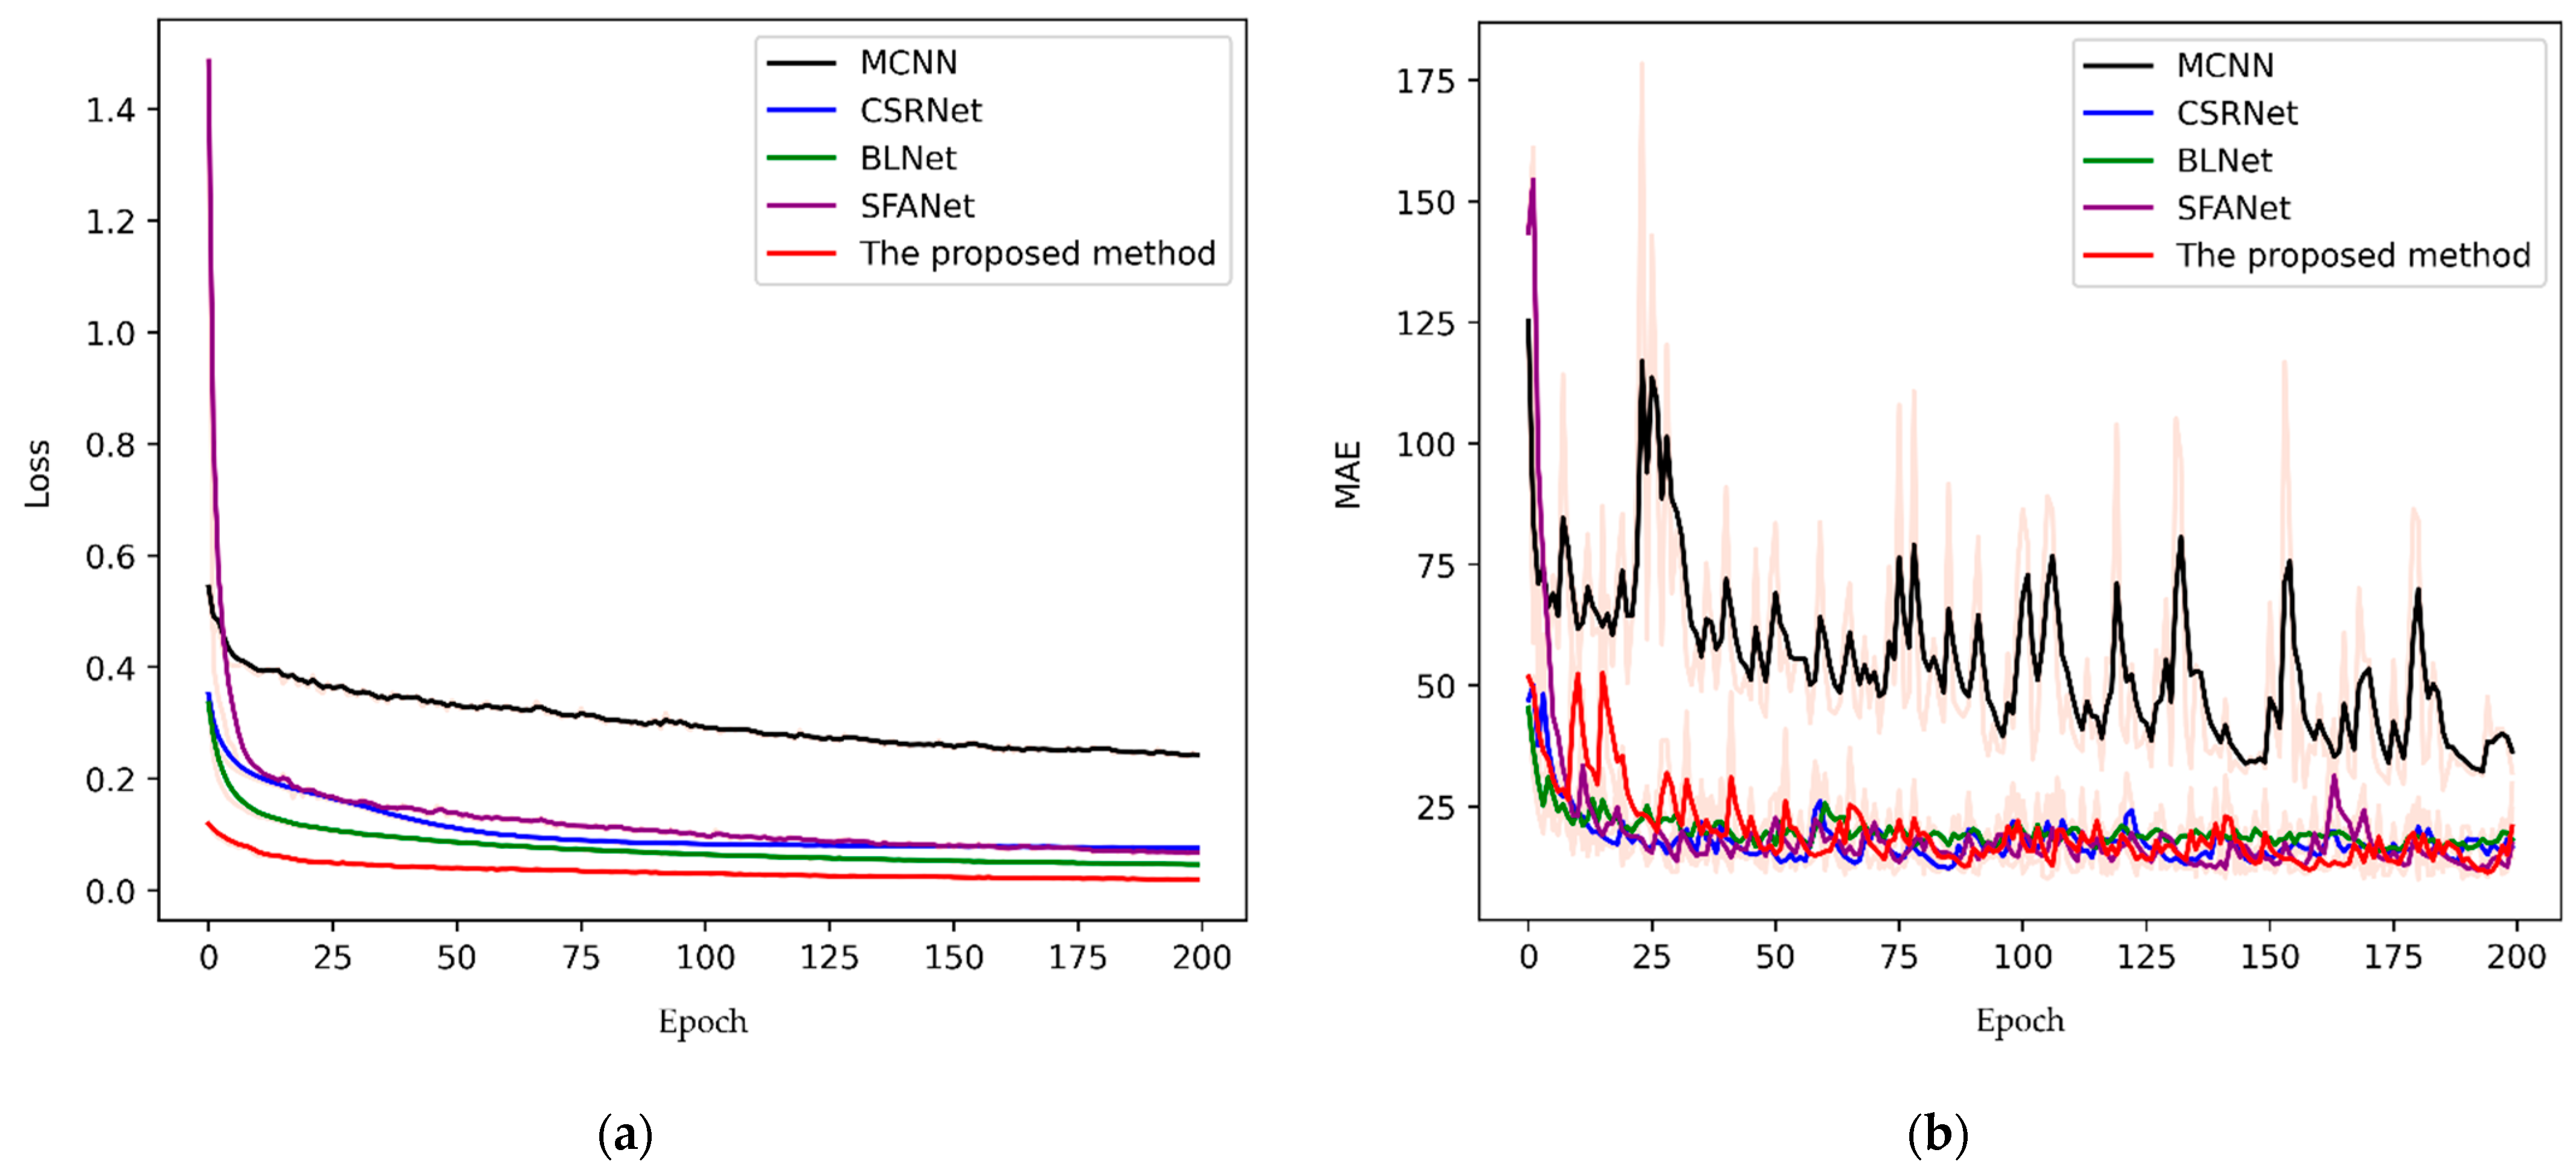
3.2. DM-Net Construction

The density map regression algorithm has developed rapidly in recent years. According to different network structures, it could be subdivided into multi-scale fusion and attention-based, among which the representative networks are MCNN, CSRNet, SFANet, etc. [27]. In order to construct a DM-Net suitable for UAV images, the proposed method was compared with those algorithms. The training results are shown in Figure 7. After 200 iterations, the training loss and MAE value of all models tended to be stable. The training result of the proposed method in this paper was better than that of other methods. The accuracy of all models under the validation data is shown in Table 2. The MAE and MSE of the proposed method were 9.01 and 11.85, respectively. Compared with CSRNet, it was improved by 16.42%. The estimated density maps of different models are shown in Figure 8. Among them, SFANet and the proposed method were the closest to the density map of ground truth. The proposed method was better than the former, which may be affected by the generation method of the density map.
The performance of the deep learning model was not only related to its network structure but also closely related to data quality. For the density map regression algorithm, the quality of the ground truth density map was particularly important. This study compared the effects of the density maps generated by different Gaussian kernel sizes on the accuracy of the proposed model (Table 3). When a fixed Gaussian kernel size was used, the smaller the kernel size, the higher the accuracy. The MAE and MSE of the best size were 10.03 and 13.34, respectively. However, none of them had higher accuracy compared with the adaptive Gaussian kernel size proposed in this paper.

3.3. The Result of the Sampling Survey

The last goal was to count regional wheat ear number in the form of the sampling survey, which was a way to improve the efficiency of the work. The proposed DM-Net was to segment a sample image into sub-images for further estimation. Therefore, it was necessary to splice the estimation of sub-images into a complete sample image. In the test period, the image segmentation method was different from the training period. There were overlapping areas between adjacent sub-images. After obtaining the estimated density map of each sub-image, half of their overlapping areas were cut and deleted. Then the estimated density map of a complete sample was spliced with them (Figure 9). The width (or height) of the overlapping area was determined by the wheat ear scale. Generally, it was not lower than the maximum value of the wheat ear scale, and it was recommended to be two times. This method can solve the problem of repeat counting caused by the splicing of segmented images, and it is also valuable for other repeat counting research.
Since the ground truth of the test data were not obtained, we integrated the density map estimation results of the training and validation samples (Figure 10a). The R2 between the estimated value and the ground truth was 0.9919, which was a highly significant correlation. It showed that the method of DM-Net construction and density map splicing was effective. All test data were estimated and converted into standard units by sampling area, which was compared with the value of the manual survey (Figure 10b). The results showed that the RMSE and MAPE of NM13 were 18.95 × 10⁴/hm2 and 3.37%, respectively. The RMSE and MAPE of YFM4 were 13.65 × 10⁴/hm2 and 2.94%, respectively. Therefore, the method proposed in this paper is reliable and effective.

4. Discussion

4.1. The Challenge of UAV Image Datasets

The scene of UAV images is very different from that of near ground images in the wheat ear counting task. This can be seen from the comparison between the public dataset Global Wheat Head Detection (GWHD, https://www.kaggle.com/c/global-wheat-detection, accessed on 5 November 2022) and the UEC dataset of this study (Figure 11). The challenge of the GWHD dataset is complex and involves diverse scenarios. Because of its high resolution, it can be accurately recognized by the object detection algorithm. The challenge of the UEC dataset is a large number of ears at low resolution. The number of images in the GWHD dataset is four times that of the UEC dataset. However, the total number of labels is equal (Figure 12a,b). The number of ears in one image of the GWHD dataset is usually less than 100, with an average of 43.19, while the average of the UEC dataset is 194.06 (Figure 12c). Therefore, this study improved the survey efficiency of wheat ear counting using UAV images.

4.2. Advantages in Efficiency

The goal of this paper is to improve survey efficiency while ensuring high accuracy. This research tested the difference in data collection between the two UAV survey modes at different flight altitudes (Table 4). The first mode is to obtain all regional images and then splice them. The second is the five-point sampling method in this paper. The results showed that with the increase in flight altitude, the number of images, the time of image acquisition and the time of image mosaic decreased in both modes. However, the number of wheat ears in one image increased. Due to the large number, it could only be counted by the deep learning model through image segmentation. The flight height of 5 m seems to be a suitable level, because it has higher image resolution when the image acquisition time is short. The number of images in image mosaic mode was 160 times more than in sample survey mode, and the total time consumed was about 2500 times. The loss of image processing and model computation were not taken into account. Despite the higher accuracy, the extremely low efficiency of the image mosaic mode is a deterrent, because it is difficult to adapt to the actual survey work.

5. Conclusions

Wheat ear number is one of the most important yield components of wheat, and timely and accurate estimation of ear numbers is an important basis for predicting wheat yield. This paper proposed a sampling survey method based on UAV to achieve efficient acquisition of wheat ear number in the field. The research showed that the adaptive Gaussian kernel is used to generate a ground truth density map, which is more consistent with the actual scene. Multi-scale feature fusion network structure can improve the quality of the estimated density map. By using overlapping regions, the problem of duplicate counting caused by image segmentation can be solved. Five-point sampling method based on UAV images and the density map regression algorithm based on a convolution neural network were used to complete the task of regional wheat ear counting. Unfortunately, due to the limitations of the experimental design, the analysis of different resolutions and periods needs further study. The effect of wheat ear distribution and shelter on yield prediction is also worth studying.

Author Contributions

Conceptualization, W.W., X.Z., T.S. and S.L.; methodology, W.W.; software, W.W.; validation, C.L.; formal analysis, W.W.; investigation, C.L. and Y.Z.; resources, X.Z., T.L., C.S., W.G. and T.S.; data curation, C.L. and Y.Z.; writing—original draft preparation, W.W. and C.L.; writing—review and editing, X.Z. and S.L.; visualization, W.W. and Y.Z.; supervision, X.Z., T.L. and S.L.; project administration, X.Z., T.L. and S.L.; funding acquisition, T.L., C.S. and S.L. All authors have read and agreed to the published version of the manuscript.

Funding

This research was funded by the National Key Research and Development Program of China (2022YFD2001000, 2022YFD2001002), the Central Public-interest Scientific Institution Basal Research Fund (JBYW-AII-2022-09, JBYW-AII-2022-16, JBYW-AII-2022-17), the Science and Technology Innovation Project of the Chinese Academy of Agricultural Sciences (CAAS-ASTIP-2016-AII), the Bingtuan Science and Technology Program (2021DB001), the Special Fund for Independent Innovation of Agricultural Science and Technology in Jiangsu, China (CX(21)3065, CX(21)3063), the National Natural Science Foundation of China (32172110, 32001465, 31872852) and the Key Research and Development Program (Modern Agriculture) of Jiangsu Province (BE2020319).

Data Availability Statement

Not applicable.

Acknowledgments

The authors would like to thank the editors and the anonymous reviewers for their crucial comments, which improved the quality of this paper.

Conflicts of Interest

The authors declare no conflict of interest.

References

  1. Eversole, K.; Feuillet, C.; Mayer, K.F.X.; Rogers, J. Slicing the wheat genome. Science 2014, 345, 285–287. [Google Scholar] [CrossRef] [Green Version]
  2. Bognár, P.; Kern, A.; Pásztor, S.; Lichtenberger, J.; Koronczay, D.; Ferencz, C. Yield estimation and forecasting for winter wheat in Hungary using time series of MODIS data. Int. J. Remote Sens. 2017, 38, 3394–3414. [Google Scholar] [CrossRef] [Green Version]
  3. Slafer, G.A.; Calderini, D.F.; Miralles, D.J. Yield components and compensation in wheat: Opportunities for further increasing yield potential. In Increasing Yield Potential in Wheat: Breaking the Barriers, Proceedings of the Workshop Held in Ciudad Obregon, Sonora, Mexico, 28–30 April 1986; CIMMYT: Mexico City, Mexico, 1996; pp. 101–133. [Google Scholar]
  4. Del Moral, L.F.G.; Rharrabti, Y.; Villegas, D.; Royo, C. Evaluation of grain yield and its components in durum wheat under Mediterranean conditions: An ontogenic approach. Agron. J. 2003, 95, 266–274. [Google Scholar] [CrossRef]
  5. Slafer, G.A.; Savin, R.; Sadras, V.O. Coarse and fine regulation of wheat yield components in response to genotype and environment. Field Crop Res. 2014, 157, 71–83. [Google Scholar] [CrossRef]
  6. Ferrante, A.; Cartelle, J.; Savin, R.; Slafer, G.A. Yield determination, interplay between major components and yield stability in a traditional and a contemporary wheat across a wide range of environments. Field Crop Res. 2017, 203, 114–127. [Google Scholar] [CrossRef]
  7. Prystupa, P.; Savin, R.; Slafer, G.A. Grain number and its relationship with dry matter, N and P in the spikes at heading in response to N× P fertilization in barley. Field Crop Res. 2004, 90, 245–254. [Google Scholar] [CrossRef]
  8. Peltonen-Sainio, P.; Kangas, A.; Salo, Y.; Jauhiainen, L. Grain number dominates grain weight in temperate cereal yield determination: Evidence based on 30 years of multi-location trials. Field Crops Res. 2007, 100, 179–188. [Google Scholar] [CrossRef]
  9. Jin, X.; Liu, S.; Baret, F.; Hemerlé, M.; Comar, A. Estimates of plant density of wheat crops at emergence from very low altitude UAV imagery. Remote Sens. Environ. 2017, 198, 105–114. [Google Scholar] [CrossRef] [Green Version]
  10. Liu, T.; Sun, C.; Wang, L.; Zhong, X.; Zhu, X.; Guo, W. In-field wheatear counting based on image processing technology. Trans. Chin. Soc. Agric. Mach. 2014, 45, 282–290. [Google Scholar]
  11. Fernandez-Gallego, J.A.; Kefauver, S.C.; Gutiérrez, N.A.; Nieto-Taladriz, M.T.; Araus, J.L. Wheat ear counting in-field conditions: High throughput and low-cost approach using RGB images. Plant Methods 2018, 14, 22. [Google Scholar] [CrossRef] [Green Version]
  12. Bao, W.; Lin, Z.; Hu, G.; Liang, D.; Huang, L.; Zhang, X. Method for wheat ear counting based on frequency domain decomposition of MSVF-ISCT. Info. Proc. Agric. 2022, 1, 1. [Google Scholar] [CrossRef]
  13. Hasan, M.M.; Chopin, J.P.; Laga, H.; Miklavcic, S.J. Detection and analysis of wheat spikes using convolutional neural networks. Plant Methods 2018, 14, 100. [Google Scholar] [CrossRef] [Green Version]
  14. Madec, S.; Jin, X.; Lu, H.; Solan, B.D.; Liu, S.; Duyme, F.; Heritier, E.; Baret, F. Ear density estimation from high resolution RGB imagery using deep learning technique. Agric. Forest Meteorol. 2019, 264, 225–234. [Google Scholar] [CrossRef]
  15. Sadeghi-Tehran, P.; Virlet, N.; Ampe, E.M.; Reyns, P.; Hawkesford, M.J. DeepCount: In-field automatic quantification of wheat spikes using simple linear iterative clustering and deep convolutional neural networks. Front. Plant Sci. 2019, 10, 1176. [Google Scholar] [CrossRef]
  16. Misra, T.; Arora, A.; Marwaha, S.; Chinnusamy, V.; Rao, A.R.; Jain, R.; Sahoo, R.N.; Ray, M.; Kumar, S.; Raju, D.; et al. SpikeSegNet-a deep learning approach utilizing encoder-decoder network with hourglass for spike segmentation and counting in wheat plant from visual imaging. Plant Methods 2020, 16, 40. [Google Scholar] [CrossRef] [PubMed] [Green Version]
  17. Xu, C.; Jiang, H.; Yuen, P.; Ahmad, K.Z.; Chen, Y. MHW-PD: A robust rice panicles counting algorithm based on deep learning and multi-scale hybrid window. Comput. Electron. Agric. 2020, 173, 105375. [Google Scholar] [CrossRef]
  18. Zhao, J.; Zhang, X.; Yan, J.; Qiu, X.; Yao, X.; Tian, Y.; Zhu, Y.; Cao, W. A wheat spike detection method in UAV images based on improved YOLOv5. Remote Sens. 2021, 13, 3095. [Google Scholar] [CrossRef]
  19. Hong, Q.; Jiang, L.; Zhang, Z.; Ji, S.; Gu, C.; Mao, W.; Li, W.; Liu, T.; Li, B.; Tan, C. A Lightweight Model for Wheat Ear Fusarium Head Blight Detection Based on RGB Images. Remote Sens. 2022, 14, 3481. [Google Scholar] [CrossRef]
  20. Dandrifosse, S.; Ennadifi, E.; Carlier, A.; Gosselin, B.; Dumont, B.; Mercatoris, B. Deep learning for wheat ear segmentation and ear density measurement: From heading to maturity. Comput. Electron. Agric. 2022, 199, 107161. [Google Scholar] [CrossRef]
  21. Xiong, H.; Cao, Z.; Lu, H.; Madec, S.; Liu, L.; Shen, C. TasselNetv2: In-field counting of wheat spikes with context-augmented local regression networks. Plant Methods 2019, 15, 150. [Google Scholar] [CrossRef]
  22. Wang, D.; Zhang, D.; Yang, G.; Xu, B.; Luo, Y.; Yang, X. SSRNet: In-field counting wheat ears using multi-stage convolutional neural network. IEEE T. Geosci. Remote. 2021, 60, 1–11. [Google Scholar] [CrossRef]
  23. Bendig, J.; Yu, K.; Aasen, H.; Bolten, A.; Bennertz, S.; Broscheit, J.; Gnyp, M.L.; Bareth, G. Combining UAV-based plant height from crop surface models, visible, and near infrared vegetation indices for biomass monitoring in barley. Int. J. Appl. Earth Obs. 2015, 39, 79–87. [Google Scholar] [CrossRef]
  24. Pérez-Ortiz, M.; Peña, J.M.; Gutiérrez, P.A.; Torres-Sánchez, J.; Hervás-Martínez, C.; López-Granados, F. Selecting patterns and features for between-and within-crop-row weed mapping using UAV-imagery. Expert Syst. Appl. 2016, 47, 85–94. [Google Scholar] [CrossRef] [Green Version]
  25. Chang, A.; Jung, J.; Maeda, M.M.; Landivar, J. Crop height monitoring with digital imagery from Unmanned Aerial System (UAS). Comput. Electron. Agric. 2017, 141, 232–237. [Google Scholar] [CrossRef]
  26. Schut, A.G.T.; Traore, P.C.S.; Blaes, X.; De By, R.A. Assessing yield and fertilizer response in heterogeneous smallholder fields with UAVs and satellites. Field Crop Res. 2018, 221, 98–107. [Google Scholar] [CrossRef]
  27. Li, B.; Huang, H.; Zhang, A.; Liu, P.; Liu, C. Approaches on crowd counting and density estimation: A review. Pattern Anal Applic. 2021, 24, 853–874. [Google Scholar] [CrossRef]
  28. Zhang, Y.; Zhou, D.; Chen, S.; Gao, S.; Ma, Y. Single-image crowd counting via multi-column convolutional neural network. In Proceedings of the IEEE Conference on Computer Vision and Pattern Recognition, Las Vegas, NV, USA, 27–30 June 2016; pp. 589–597. [Google Scholar]
  29. Sindagi, V.A.; Patel, V.M. Generating high-quality crowd density maps using contextual pyramid cnns. In Proceedings of the IEEE International Conference on Computer Vision, Venice, Italy, 22–29 October 2017; pp. 1861–1870. [Google Scholar]
  30. Ma, Z.; Wei, X.; Hong, X.; Gong, Y. Bayesian loss for crowd count estimation with point supervision. In Proceedings of the IEEE/CVF International Conference on Computer Vision, Seoul, Republic of Korea, 27 October–2 November 2019; pp. 6142–6151. [Google Scholar]
  31. Song, Q.; Wang, C.; Wang, Y.; Tai, Y.; Wang, C.; Li, J.; Wu, J.; Ma, J. To choose or to fuse? Scale selection for crowd counting. In Proceedings of the AAAI Conference on Artificial Intelligence, Online, 2–9 February 2021; Volume 35, pp. 2576–2583. [Google Scholar]
  32. Roth, L.; Hund, A.; Aasen, H. PhenoFly Planning Tool: Flight planning for high-resolution optical remote sensing with unmanned areal systems. Plant Methods 2018, 14, 116. [Google Scholar] [CrossRef] [Green Version]
  33. Li, Y.; Zhang, X.; Chen, D. Csrnet: Dilated convolutional neural networks for understanding the highly congested scenes. In Proceedings of the IEEE Conference on Computer Vision and Pattern Recognition, Salt Lake, UT, USA, 18–23 June 2018; pp. 1091–1100. [Google Scholar]
  34. Zhu, L.; Zhao, Z.; Lu, C.; Lin, Y.; Peng, Y.; Yao, T. Dual path multi-scale fusion networks with attention for crowd counting. arXiv 2019, arXiv:1902.01115. [Google Scholar]
Figure 1. Overview of the study area.
Remotesensing 15 01280 g001
Figure 2. UAV-based sampling survey pipeline of wheat ear numbers.
Remotesensing 15 01280 g002
Figure 3. Differences in the characteristics of wheat ears in different camera views.
Remotesensing 15 01280 g003
Figure 4. The structure of DM-Net.
Remotesensing 15 01280 g004
Figure 5. Determination of adaptive gaussian kernel size. (a) Schematic diagram of different views, the rectangle represents wheat ears. Different color depths represent the distance between the wheat ear center and the image center. The deeper the color is, the closer the distance is, and the lighter the color is, the farther the distance is. (b) The relationship between the diagonal length of ears and its distance from the image center.
Remotesensing 15 01280 g005
Figure 6. Density maps with different Gaussian kernel.
Remotesensing 15 01280 g006
Figure 7. The results of DM-Nets training: (a) training loss curve; (b) MAE curve of validation.
Remotesensing 15 01280 g007
Figure 8. Estimated density maps of different DM-Nets.
Remotesensing 15 01280 g008
Figure 9. The result of the estimated density map of one sample.
Remotesensing 15 01280 g009
Figure 10. The results of the sampling survey method. (a) The relationship between the estimated value of training sample images and its ground truth. (b) The comparison between the regional sample survey method and manual survey method.
Remotesensing 15 01280 g010
Figure 11. Representative images of GWHD dataset and UEC dataset.
Remotesensing 15 01280 g011
Figure 12. Comparison between GWHD dataset and UEC dataset. (a) Number of images. (b) Total number of labeled ears. (c) The number of ears in one image.
Remotesensing 15 01280 g012
Table 1. Environment configuration.
HardwareSoftware
ProjectContentProjectContent
CPUAMD EPYC 7742
64-Core Processor
LanguagePython 3.7
GPUNVIDIA A100 40 G × 4FrameworkPytorch 1.7
RAM512 GCUDACUDA 11.0
Operating systemUbuntu 20.04 LTSMonitorTensorboard X
Table 2. The accuracy of different DM-Nets.
MethodsMAEMSE
MCNN [28]28.5036.62
CSRNet [33]10.7813.73
BLNet [30]12.8316.32
SFANet [34]10.0412.83
The proposed method9.0111.85
Table 3. The influence of different Gaussian kernel sizes on the model accuracy.
Kernel SizeMAEMSE
D 1 G T , σ = 4 10.0313.34
D 1 G T , σ = 8 10.7414.25
D 1 G T , σ = 12 13.3116.65
D 2 G T , β = 0.1 9.0111.85
D 2 G T , β = 0.2 9.9713.00
Table 4. Comparison of different survey modes of UAV in wheat ear number.
ProjectsFlight Altitude
2 m5 m10 m20 m50 m
Image
Mosaic
Number of imagesNull26,32766231676280
Time of image acquisition (min)Null2110.9536.6103.811.5
Time of image mosaic (min)Null7898.11986.9502.884.0
Sampling
survey
Number of images532982261
Time of image acquisition (min)11.13.92.62.42.3
Image resolution (mm/pixel)0.30.81.63.27.9
Number of ears in one image1000800040,000136,000880,000
Number of ears in one sub-image (1/25)403201600544035,200
The size of the test region is 1 hm2. The test equipment is DJI Inspire 2 (DJI, Shenzhen, China) equipped with a ZENMUSE X5S camera. In image mosaic mode, the heading repetition rate is 85%, and the side repetition rate is 75%. The image mosaic software is Pix4Dmapper. The test computer is configured with Intel Core i9-10900X processor, 128 G memory, NVIDIA GeForce RTX 2080 Ti graphics card. The sampling survey mode refers to this paper.
Disclaimer/Publisher’s Note: The statements, opinions and data contained in all publications are solely those of the individual author(s) and contributor(s) and not of MDPI and/or the editor(s). MDPI and/or the editor(s) disclaim responsibility for any injury to people or property resulting from any ideas, methods, instructions or products referred to in the content.

