Article

Assessment of AIRS Version 7 Temperature Profiles and Low-Level Inversions with GRUAN Radiosonde Observations in the Arctic

State Key Laboratory of Severe Weather, Chinese Academy of Meteorological Sciences, Beijing 100081, China
*
Author to whom correspondence should be addressed.
Remote Sens. 2023, 15(5), 1270; https://doi.org/10.3390/rs15051270
Submission received: 23 December 2022 / Revised: 27 January 2023 / Accepted: 10 February 2023 / Published: 25 February 2023

Abstract

:
The extensive global climate observing system (GCOS) reference upper-air network (GRUAN) datasets provide a chance to validate newly released Atmospheric Infrared Sounder (AIRS) version 7 (v7) products over the Arctic. This manuscript reports on the analysis performed to evaluate errors from AIRS version 6 (v6) and v7 temperature profiles and to characterize the derived low-level temperature inversion (LLI) representativeness in the Arctic region. The AIRS averaging kernel, representing the AIRS measurement sensitivity, is applied to reduce the vertical resolution of the radiosonde profiles for comparison. Due to improved retrieval algorithms, v7 produces smaller biases in the troposphere and suppresses the cold bias in v6. Nevertheless, the profile-averaged root mean square error (RMSE) increased by over 30% in v7, particularly in the winter half-year when v7 showed a larger RMSE below 800 hPa. The AIRS temperature retrieval accuracy is primarily sensitive to surface type and cloud fraction. Compared to v6, v7 has less bias over frozen land and sea ice in different cloud fraction conditions. However, the RMSEs of v7 are more sensitive to the effective cloud fraction (ECF) and are highly influenced by a more significant contribution from nonfrozen land samples. Compared to the kernel-averaged radiosonde profiles, more than 80% of the temperature profiles from v6 and v7 accurately detect LLIs. The discreteness of the AIRS’s predefined pressure level results is consistent with the radiosondes only 65% of the time for LLI depth calculation. In contrast, the AIRS can obtain LLI intensity with a relatively high correlation (>0.9). With the AIRS temperature retrieval in the boundary layer further improved, it has the potential to be used as an independent LLI detector in the Arctic region.

Graphical Abstract

1. Introduction

The Arctic is experiencing accelerated sea-ice loss, increased permafrost thaw, and extremely high temperatures at magnitudes and rates that have substantially and profoundly impacted global climate system regulation [1]. The nearly four-times-faster warming rate in the Arctic compared to the global average, known as the Arctic amplification (AA), is currently considered a robust fact [2]. Rather than being attributed to one mechanism in isolation, AA results from multiple tightly coupled feedbacks operating on distinct temporal and spatial scales [3,4]. Low-level temperature inversions (LLIs) are a prominent and pervasive feature of the lower-tropospheric atmosphere in the Arctic, with crucial AA impacts [5]. Compared to the situation in the tropics, in which deep convection creates a tight coupling between surface and upper-tropospheric temperature, the stably stratified wintertime boundary layer inhibits the bidirectional exchange of energy and mass between the surface atmospheric boundary layer and the free troposphere [6,7]. The ability of surface infrared radiative cooling in winter decreases with LLI strength, resulting in a positive lapse-rate feedback, which has been verified to predominantly intensify the AA [8,9]. Its fundamental role in driving the AA necessitates LLI characteristic research.
In situ measurements can acquire atmospheric temperature profiles with a refined vertical resolution on a one-point scale. Several efforts have been made to investigate the vertical structure of the atmospheric boundary layer using radiosondes or microwave radiometers, which provide insight into multiple processes affecting LLI generation and properties at the point scale [10,11,12,13,14,15,16,17]. Unfortunately, the scarcity and uneven spatial distribution of in situ observations (mainly at the coast and interior) introduce artificial uncertainties in representing LLIs [18]. On the other hand, changes in radiosonde sounding vertical resolution may affect the long-term trend of temperature inversion depth and intensity estimations [19]. Atmospheric reanalyses are widely employed to document and interpret ongoing Arctic changes; however, they are known to simulate temperature inversions poorly in the Arctic [20,21,22,23,24,25]. Graham et al. (2019) evaluated five global atmospheric reanalyses in the Arctic and found that most suffer from a significant cold bias between 975 and 850 hPa, consequently underestimating the strength of temperature inversions [26]. Polar-orbiting satellite monitoring can supplement upper-atmosphere observations to provide better spatial and temporal coverage of the polar region. In addition, the development of hyperspectral technology onboard satellites has led to considerable improvements in retrieving atmospheric temperature profiles and bridges the gap in the coarser vertical resolution of conventional space-borne observations [27,28,29,30].
Measurements from the Atmospheric Infrared Sounder (AIRS) have the potential to obtain temperature profiles in scenes lacking in situ observations. The expected AIRS accuracy goal requires temperature soundings to be produced under partial cloud cover with RMS errors better than 1.0 K in 1 km vertical layers below 100 hPa [27]. Various validation efforts have been conducted worldwide, showing good agreement between AIRS and radiosonde observations [31,32,33,34]. In the tropics, the performance has essentially met or exceeded the requirement partly due to the far less spatial and temporal variability of air temperature than in middle and high latitudes [35,36]. With advances in the AIRS retrieval algorithm, the AIRS v6 bias in Antarctica was reduced compared to that of AIRS v5, although a cold bias of approximately 0.5 K remained in the troposphere [31]. In the Arctic, the AIRS measurements are susceptible to specific seasonal and monthly biases in the lower troposphere, which introduces artificial errors in the analysis of associated physical processes in the planetary boundary layer [37].
A growing number of studies have focused on assessing and applying the AIRS temperature profile in LLI calculations. By analyzing the clear-sky LLI characteristics over the entire Arctic Ocean, Devasthale et al. (2010) found that the LLI in the summer months was stronger when the sea ice was at an extreme minimum in 2007 [38]. Pavelsky et al. (2011) proved that the correlation of the inversion strength with the mean annual sea-ice concentration yields robust results in both the Arctic and Antarctic [39]. Thomas et al. (2019) evaluated the covariability of the vertical distribution of aerosols and temperature inversion and observed that more aerosols are trapped below the inversion layer during winter in the Arctic [40].
The AIRS has provided observations with dense sampling, good calibration, and little secular drift for two decades and has obtained rich information on a global scale, including LLIs in the Arctic. However, the AIRS measurements are sensitive to the presence of clouds, and the cloud fraction leads to a systematic bias in LLI calculation [41]. The AIRS data from version 7 of the algorithm (AIRS v7) were released in July 2020, replacing version 6 (AIRS v6) with significant improvements leading to better temperature products, especially in the atmospheric boundary layer [42]. The performance of AIRS v7 temperature profiles in the polar region have not been well-validated until now, particularly on complex underlying surface conditions with sea ice, snow, tundra, and ocean. To address this void, we summarize the detailed specifications of the AIRS v6 and v7 temperature profiles to determine the potential of the AIRS in studying LLIs.
This manuscript first introduces the in situ radiosonde archives from the global climate observing system (GCOS) reference upper-air network (GRUAN) and highlights the AIRS v7 improvements and then outlines the validation methodology to assess AIRS temperature biases in Section 2. In Section 3, the AIRS v7 temperature profiles are validated, and the differences between v7 and v6 are discussed. Moreover, an analysis of the LLI characteristics shared between the AIRS and radiosonde data is presented to investigate the ability of the AIRS to accurately detect LLIs. Next, the cloud dependency of AIRS temperature retrieval over different surface conditions is discussed in Section 4. We conclude with a summary of key findings in Section 5.

2. Data and Methods

2.1. AIRS Level 2 Data

The AIRS has been collecting data with global coverage since May 2002. The instrument is onboard the Aqua platform launched into a sun-synchronous polar orbit, with descending and ascending orbits crossing the equator at approximately 1:30 A.M. and 1:30 P.M. local time. As a new-generation hyperspectral infrared sounder, the AIRS acquires 2378 continuous channels covering infrared bands from 3.7 μm to 15.4 μm at a spectral resolution (λ/∆λ) of 1200 and with a nadir spatial resolution of 13.5 km [43].
AIRS level 2 support products (AIRS2SUP) are retrieved with geolocation information corresponding to the radiance and brightness temperature and contain many more predefined vertical levels than the standard product. They are always chosen for validation because they represent the actual AIRS retrieval skill [44]. It should be noted that the actual vertical resolution is not equal to the separation of the pressure levels, but the information content is slightly higher than that of the standard products [45]. The first-guess profiles and averaging kernel matrices needed for profile validation are stored in the support product. The AIRS v6 and v7 algorithms use a stochastic cloud clearing–neural network (SCCNN) based on the first guess, which derives the training coefficients from matched observed infrared and microwave radiances with selected colocated European Centre for Medium-Range Weather Forecasts (ECMWF) reanalyses. Therefore, this study used the AIRS2SUP temperature profiles from two versions.

2.2. GRUAN Upper-Air Measurements

The GRUAN measurements provide long-term and high-quality data records above the surface into the stratosphere, which are used to determine climate change trends, validate and calibrate satellite data, and study atmospheric processes [46]. Most GRUAN sites switched to RS41 as an operational radiosonde, following the discontinuation of RS92 in the last quarter of 2017 [47]. According to the results of twin-radiosonde flights over the Arctic Ocean, RS41 radiosonde measurements satisfied the performance specifications of 0.15 K (temperature) and 2% (relative humidity) in most cases. Moreover, the RS41 sensor was not unaffected by the solar radiation correction error and the wet-bulbing effect [48]. To avoid introducing inhomogeneities, the datasets from 2012 to 2016 were selected to avoid the RS92–RS41 transition.
In this study, we used radiosonde data from three GRUAN stations in the Arctic (see Figure 1). Barrow (BAR, 71.32°N, 156.62°W) is located at the northernmost point in Alaska along the Arctic Ocean, which is one of the cloudiest places on Earth due to the Arctic maritime climate, and the land surface is predominantly open tundra and desert. Ny-Ålesund (NYA, 78.92°N, 11.93°E) is on the west coast of the Svalbard archipelago, situated at a fjord surrounded by glaciers, moraines, rivers, mountains, and a typical tundra system. Sodankylä (SOD, 67.367°N, 26.629°E, 179 m a.s.l.), located in Finnish Lapland, is within the boreal forest zone due to the warming effect of the Gulf Stream.

2.3. Method of Validation

For two different measurement systems with spatial and temporal inconsistencies in the same atmosphere state, sensible colocation criteria must be used to match the AIRS and radiosonde measurements point by point. The temperature bias variability between satellite and radiosonde profiles is proportional to the size of the time and distance mismatch within the colocation window of 6 h and 250 km [49]. Boylan et al. (2015) use colocation criteria of ±3 h time difference and 150 km horizontal separation because the limited diurnal cycle in the early Antarctic summer allows looser colocation criteria [31]. Other researchers have used similar matching methods with various thresholds [50,51]. In this study, the AIRS profile is considered colocated with the radiosonde profile within ±1 h and separated by less than 50 km of the radiosonde launch, which is the same as the colocation thresholds taken in the AIRS validation report [52]. The colocation process removes numerous initial colocations to reduce non-instrument comparison errors due to the inevitable mismatch in space and time, yet 6838 matched pairs remain after filtering. Due to the homogeneity of adjacent footprints within an AIRS granule, only the closest footprint in time and distance from any granule is used. The satellite provides dense orbital coverage at high latitudes, so several independent footprints from different granules may fall within the colocation criteria and be matched to one sonde profile, which enlarges the number of comparisons available for analysis.
The full-resolution sonde profiles are between 12:00 (GMT) and 20:00 (GMT), and the number of pressure levels is approximately 20 times higher than the AIRS profiles depending on surface elevation. The AIRS averaging kernels can be applied to degrade the correlative radiosonde temperature profiles to the AIRS’s effective resolution. The profiles retrieved from remote sensing instruments are not simple measurements or representations of the atmospheric state, but rather the best estimate to which a smoothing function has been applied [53]. Therefore, radiosonde observations convolved by averaging the kernel function are usually employed as the “true” state to simulate the effect of the AIRS retrievals rather than a direct comparison between the AIRS and radiosonde data [54]. The averaging kernel represents the sensitivity of the AIRS observations to changes in the atmosphere, describes the vertical smoothing error, and quantifies the weight of the actual atmospheric state to the retrieved quantities. For the AIRS retrievals, the averaging kernel differs depending on the data version. This analysis applied the AIRS temperature averaging kernels to smooth the high-resolution radiosonde measurements to the AIRS’s effective resolution through the following equation:
T k = T 0 + A ˜ ( T s T 0 )
where Tk is the kernel-averaged (”kerned” for short) radiosonde temperature profile as the AIRS “should have” seen it, given its sensitivity to the prior and limited vertical resolution; T0 is the first-guess temperature profile; Ts is the radiosonde profile linearly interpolated into the AIRS’s 100 pressure levels; and (A) is the averaging kernel that has been mapped to the AIRS’s entire retrieval grid using the trapezoid function ( F T ) and its pseudoinverse (F′):
A ˜ = F A F
F = [ F T F ] 1 F T
These trapezoid functions define the upper and lower bounds for which the retrieved layer quantities of water vapor, atmospheric temperature, and trace gases are defined [32]. In AIRS v7, the number of temperature retrieval trapezoids was increased in the boundary layer and the tropopause, which were made more uniform vertically, leading to a better representation and stability of the retrieval. The size of the trapezoid matrix is based on the number of pressure levels in the AIRS retrievals, and its setting was described by Susskind et al. (2003) [27]. The specific process of kerned sonde profile producing is shown in Figure 2.
The retrievals are evaluated using four parameters: the mean bias (MB), standard deviation (σ), root mean square error (RMSE), and correlation coefficient (R), which are elaborated below.
B i a s ( p , i ) = x A I R S ( p , i ) x s o n d e ( p , i )
M B ( p ) = 1 n i = 1 n b i a s ( p , i )  
σ ( p ) = 1 n i = 1 n ( B i a s ( p , i ) M B ( p ) ) 2  
R M S E ( p ) = 1 n i = 1 n B i a s ( p , i ) 2  
Quality control (QC) flags for the AIRS temperature profiles are used, and are expressed as values of 0 (best), 1 (good), or 2 (rejected). Users are advised to use the QC flags provided with all variables and avoid using results flagged with QC = 2 even when physically plausible values are present. More details on the quality assessment information can be found in Susskind et al. (2011) [29]. The information that evaluates the publicly available AIRS2SUP is contained in the data product.

3. Results

The performance between AIRS v6 and v7 was evaluated by comparing the temperatures at each pressure level from the AIRS retrievals to the kerned radiosonde measurements for all 6838 matched profiles. Bias statistics at each level are based on the subset of radiosondes that reach that level, and only the temperature retrievals of good and acceptable quality for each level were used in the analysis, with the capacity ranging from 5188 samples at 10 hPa to 1685 samples at 986 hPa.

3.1. Intercomparison between the AIRS and Radiosonde Temperature Profiles

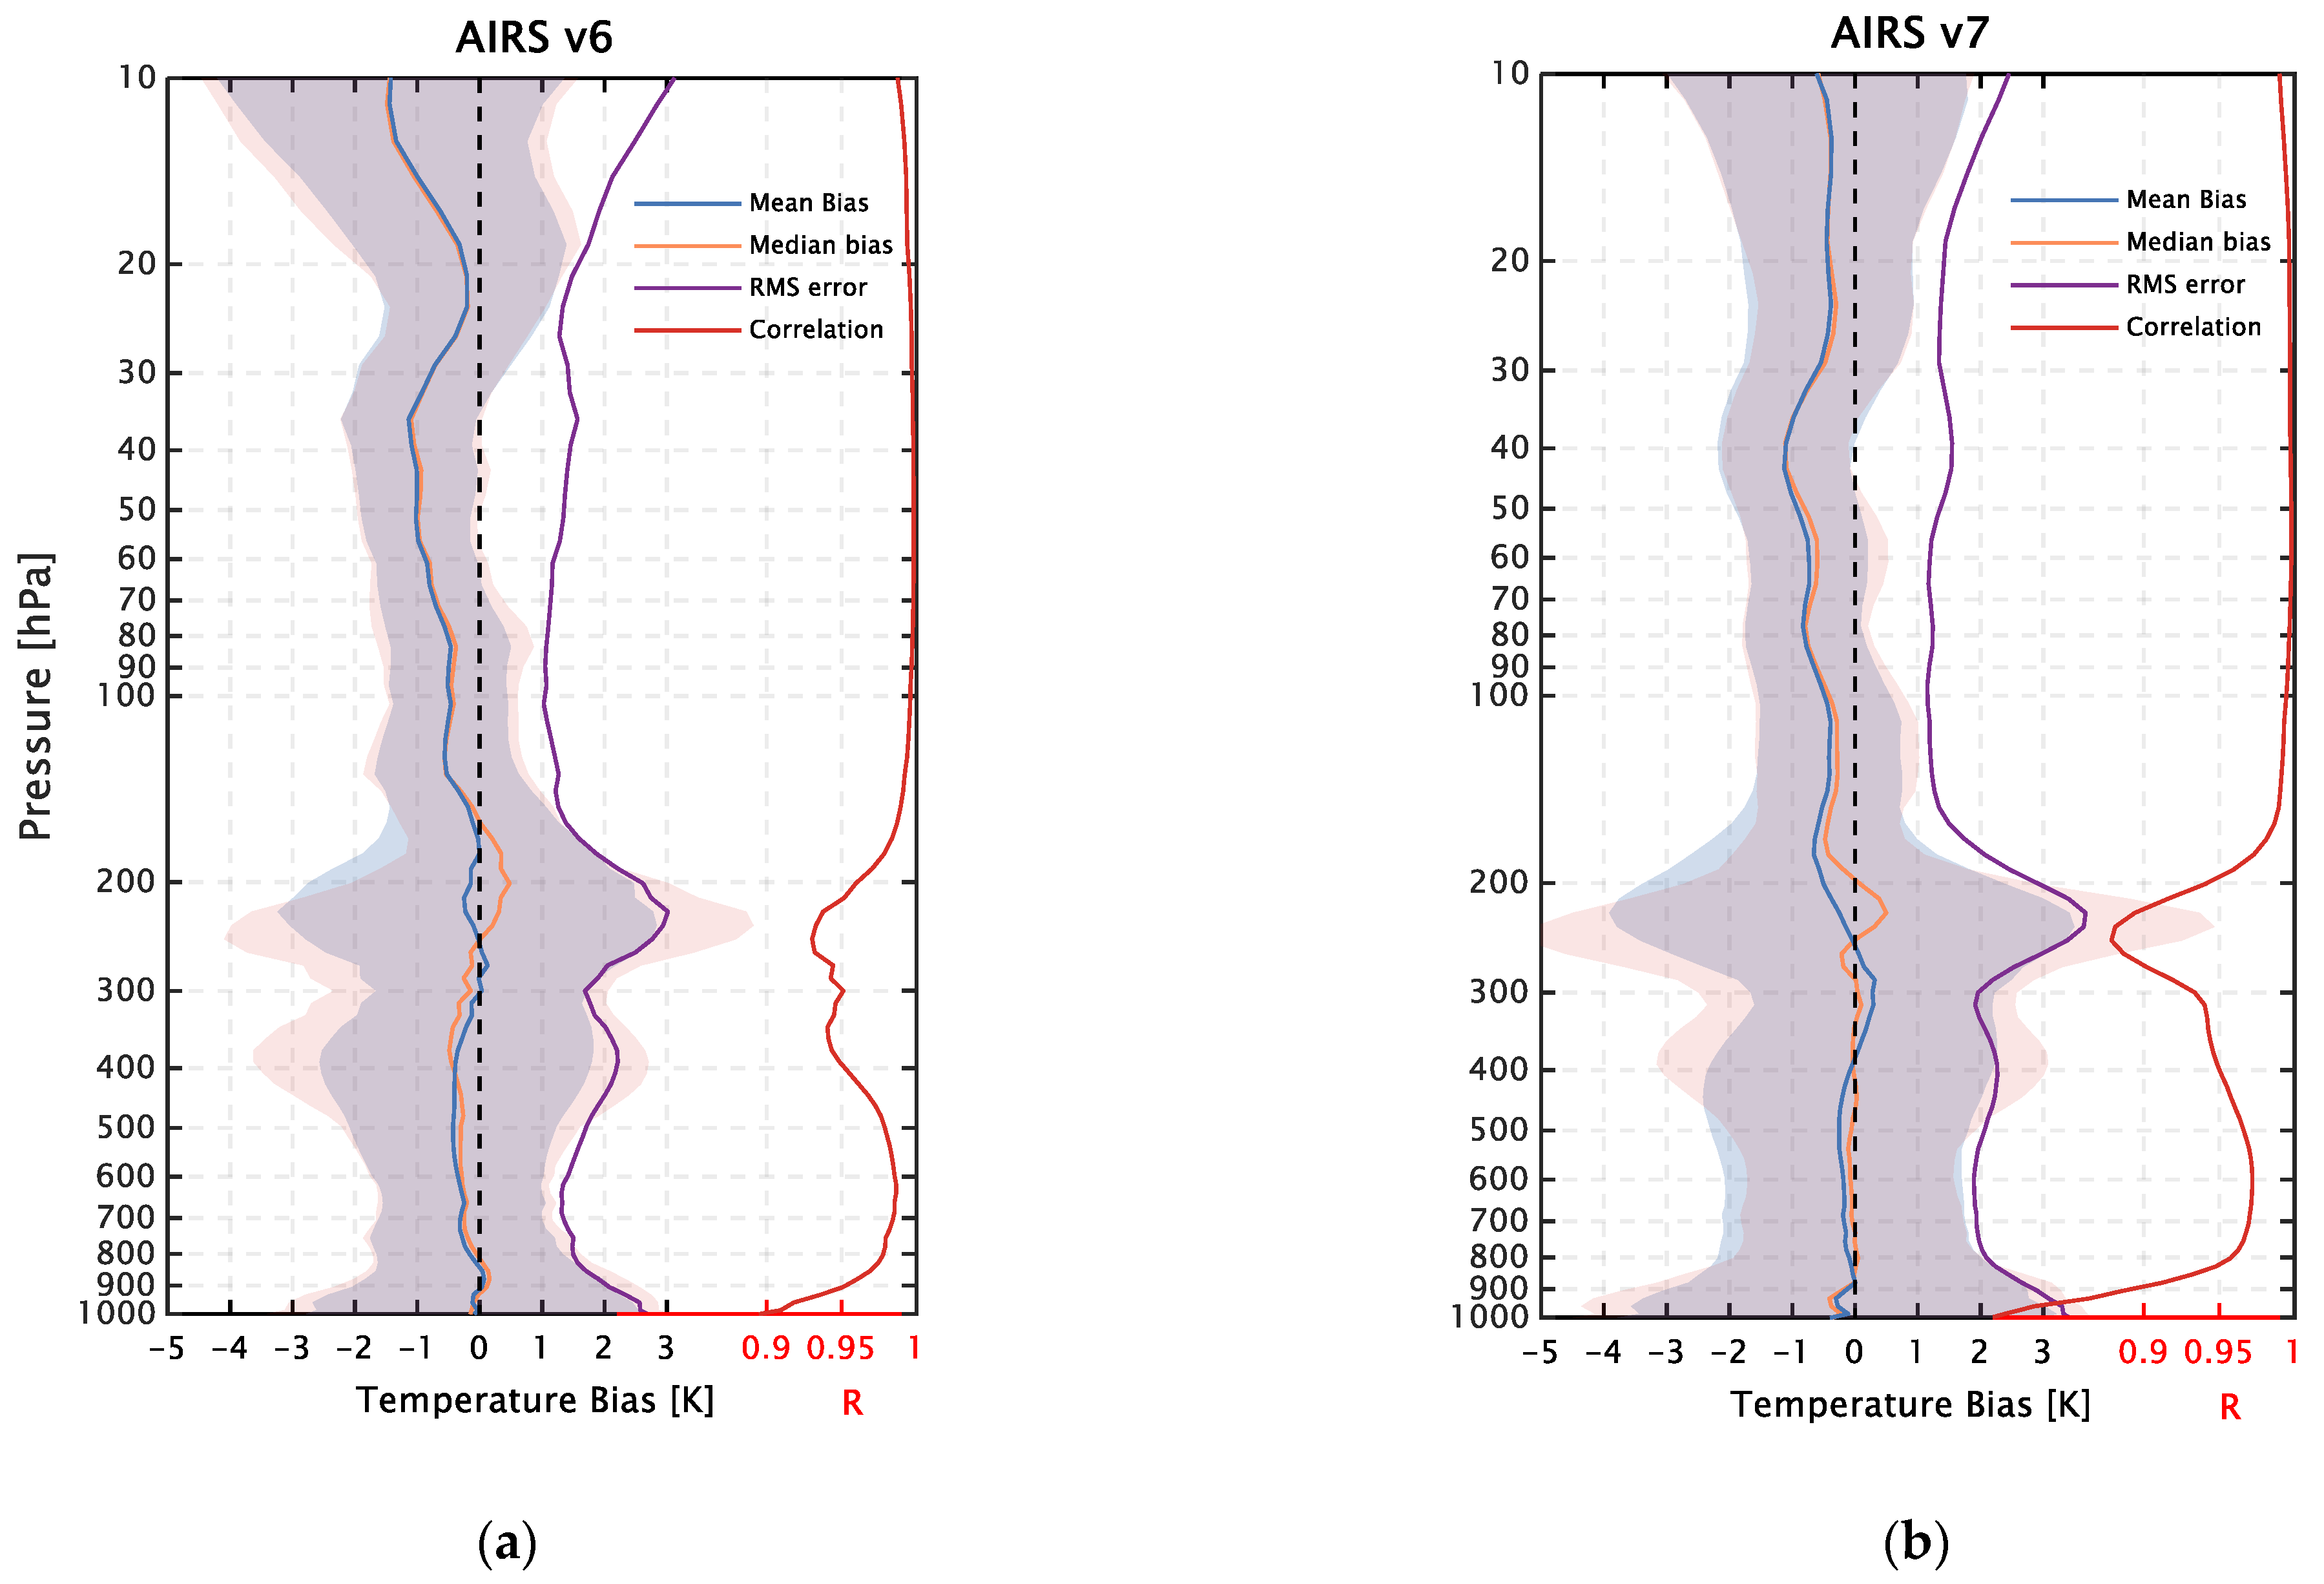
The retrievals at different atmospheric levels are evaluated using several validation statistics, as shown in Figure 3: the mean bias, root mean square error, correlation coefficient, and standard deviation. Generally, AIRS v6 and v7 agree well with the sonde profiles with near-zero cold biases (−0.5–0 K) at nearly all individual levels below 150 hPa, and the mean bias averaged over all levels slightly decreased from −0.4 K in v6 to −0.3 K in v7. The median biases for v6 and v7 are close to the mean biases at most levels, indicating that the calculated cold biases are robust to statistical assumptions, except for the warm biases at several levels near the tropopause (160–250 hPa). The averaged RMS error (standard deviation) increased from 1.6 K (1.7 K) to 1.9 K (2.0 K). The range of the minimum and maximum RMS error values remained low in v6, equal to 1.0 K and 4.8 K, relative to those in v7 (1.2 K and 5.8 K, respectively). There are two peaks in the RMS error center at 391 hPa and 223 hPa for AIRS v6 and v7, respectively. The RMS errors increase gradually with height during the whole year from 600 hPa to 400 hPa, leading to a minor peak surpassing 2 K at 400 hPa. Subsequently, there is a slight decrease in the RMSE profile until sharp vertical gradients occur near the tropopause below 200 hPa (3.0 K and 3.5 K for v6 and v7, respectively). The large RMS may reflect the AIRS observation’s inability to capture sharply changing temperature gradients and inappropriate channel selection around the tropopause [55].
The magnitude of the STD increases in v6 (1.6 K) relative to v7 (1.9 K), with the exception that the stratosphere is effectively unchanged (1.3 K). The STD in the lower troposphere increased slightly, 0.4 K larger in v7, but the corresponding correlation did not decline. The correlation coefficients vary from 0.9–1.0; most are greater than 0.95 for v6. The increasing STD and decreasing correlation further indicate that the v7 retrievals have more noise in the upper troposphere to lower stratosphere (UT–LS) and near the surface. The MB, RMS error, STD, and correlation coefficient statistics in this research are all statistically significant based on a t-test (p < 0.05), representing how well the AIRS captures the variability of the vertical temperature. Furthermore, the vertical oscillations in the bias profile found in the Antarctic are not evident in the Arctic [56].

3.2. Seasonal Variability of the AIRS Temperature Bias

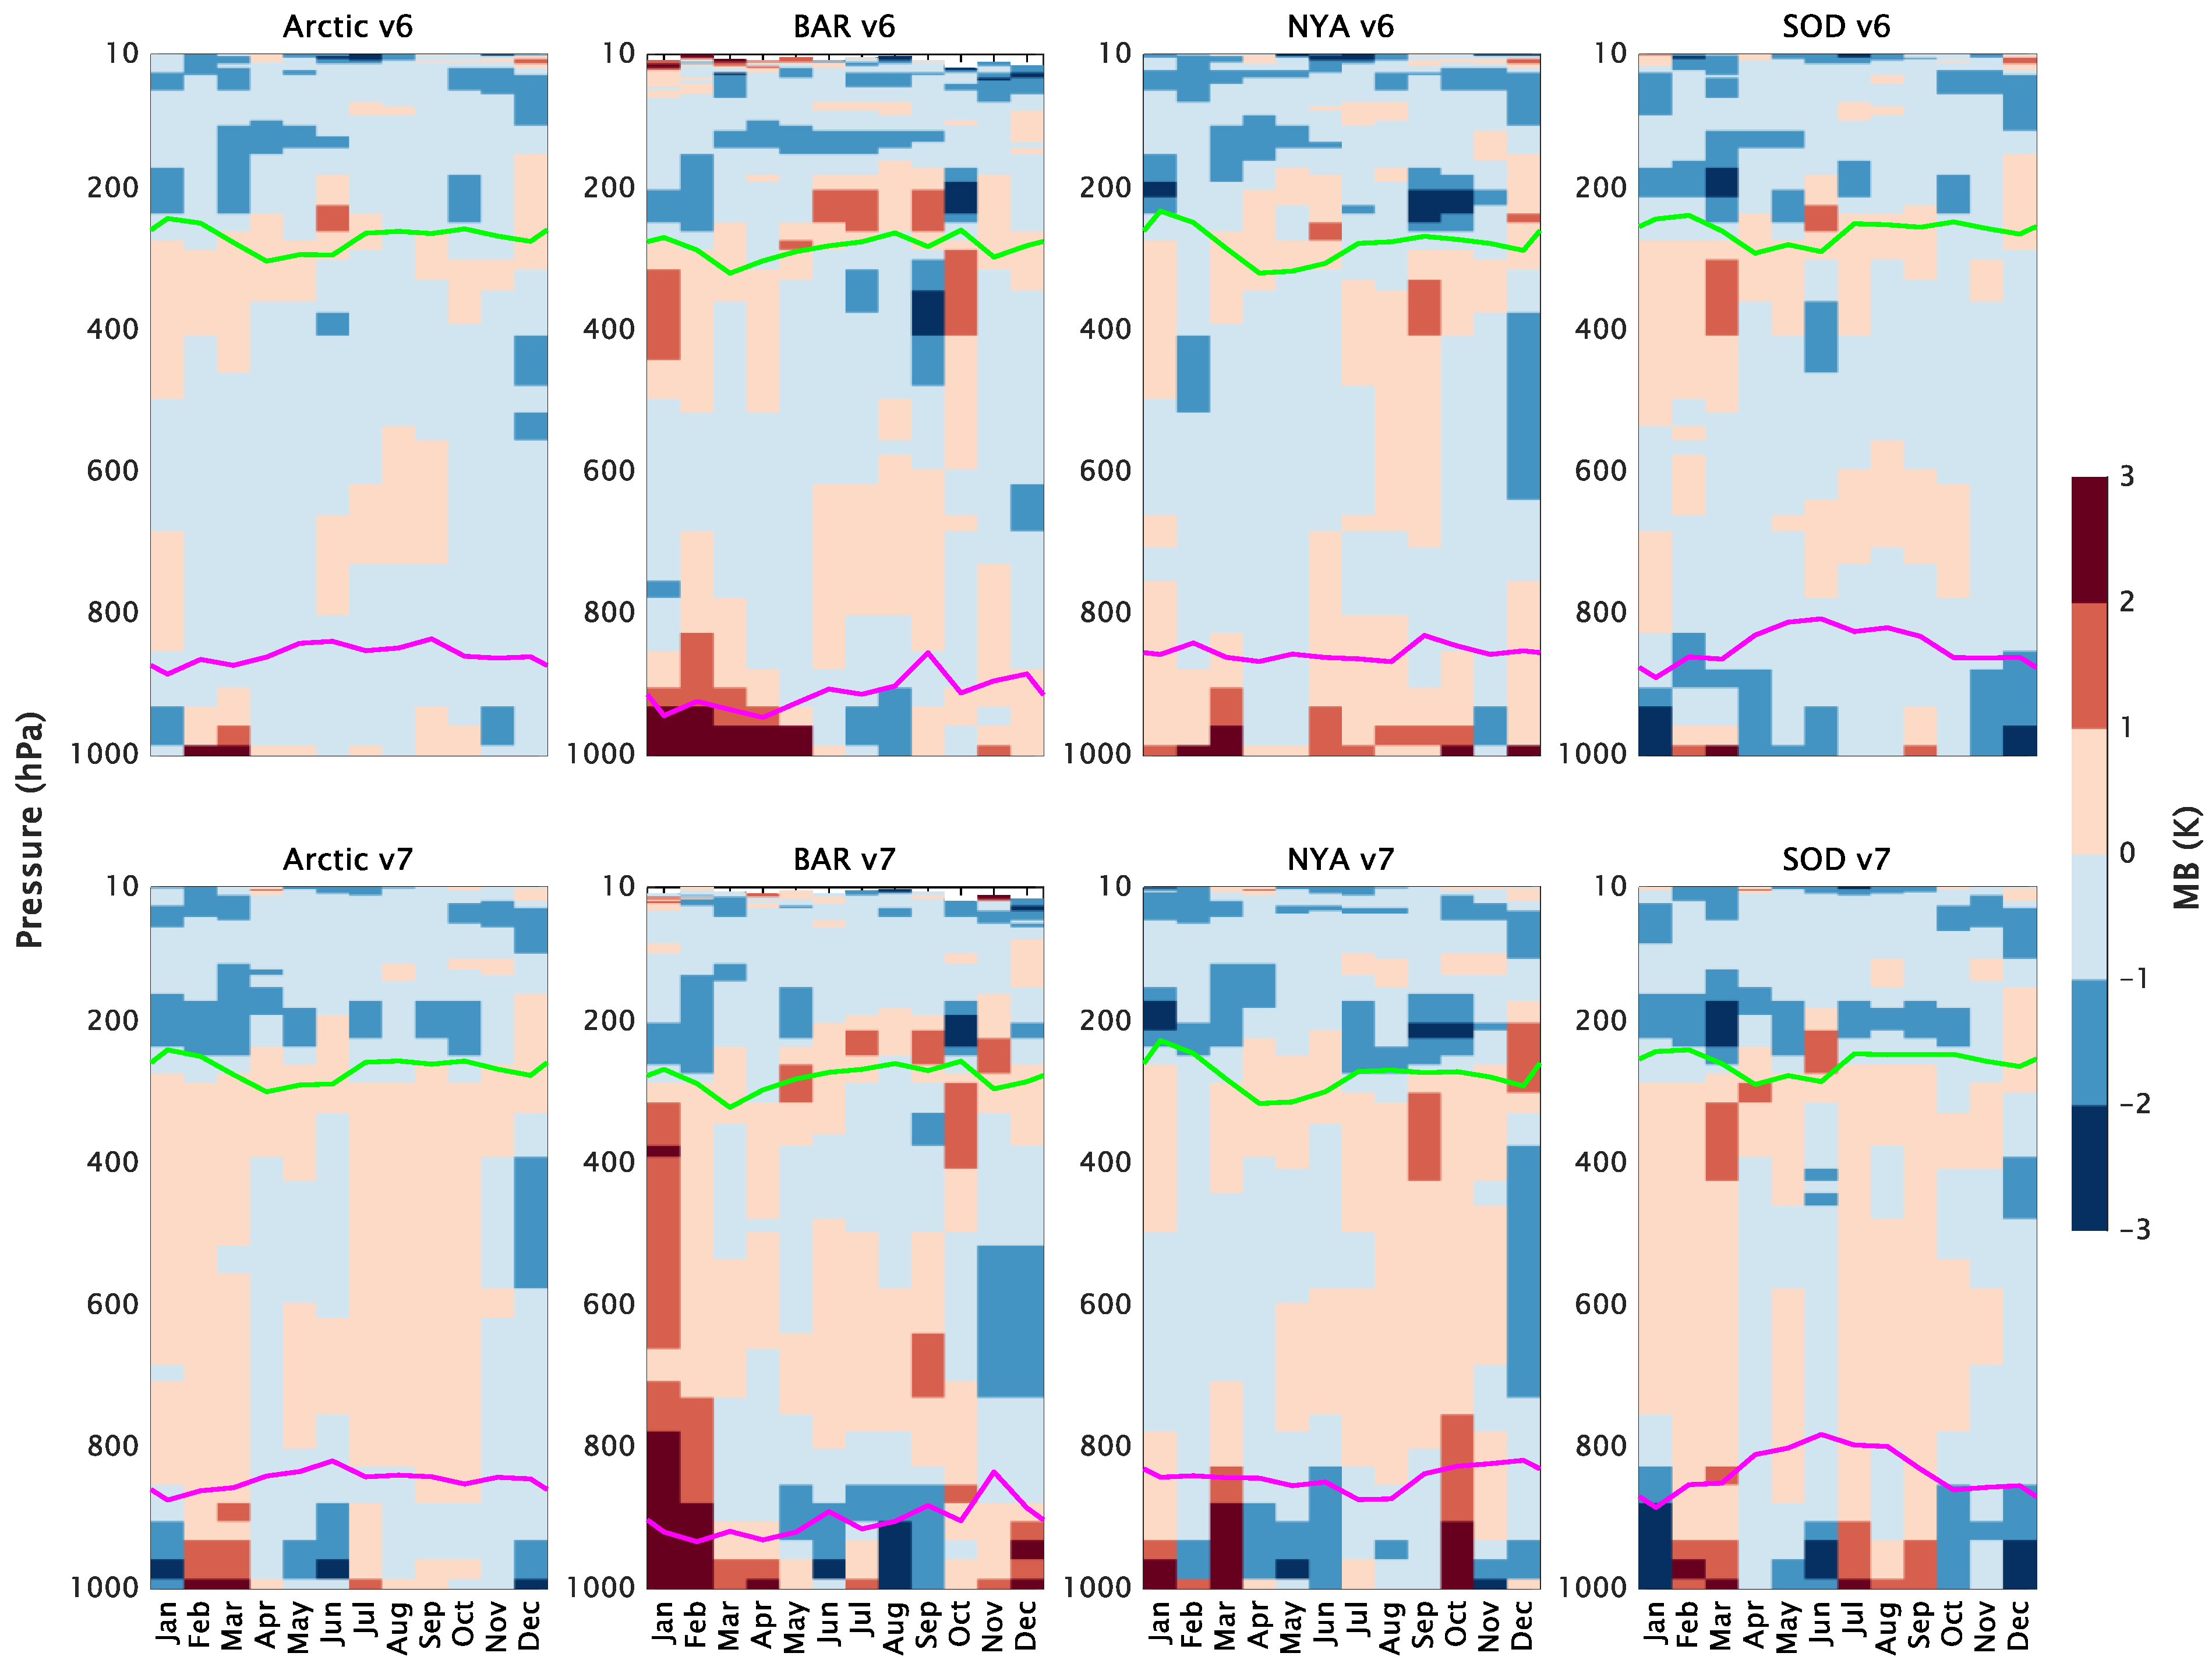
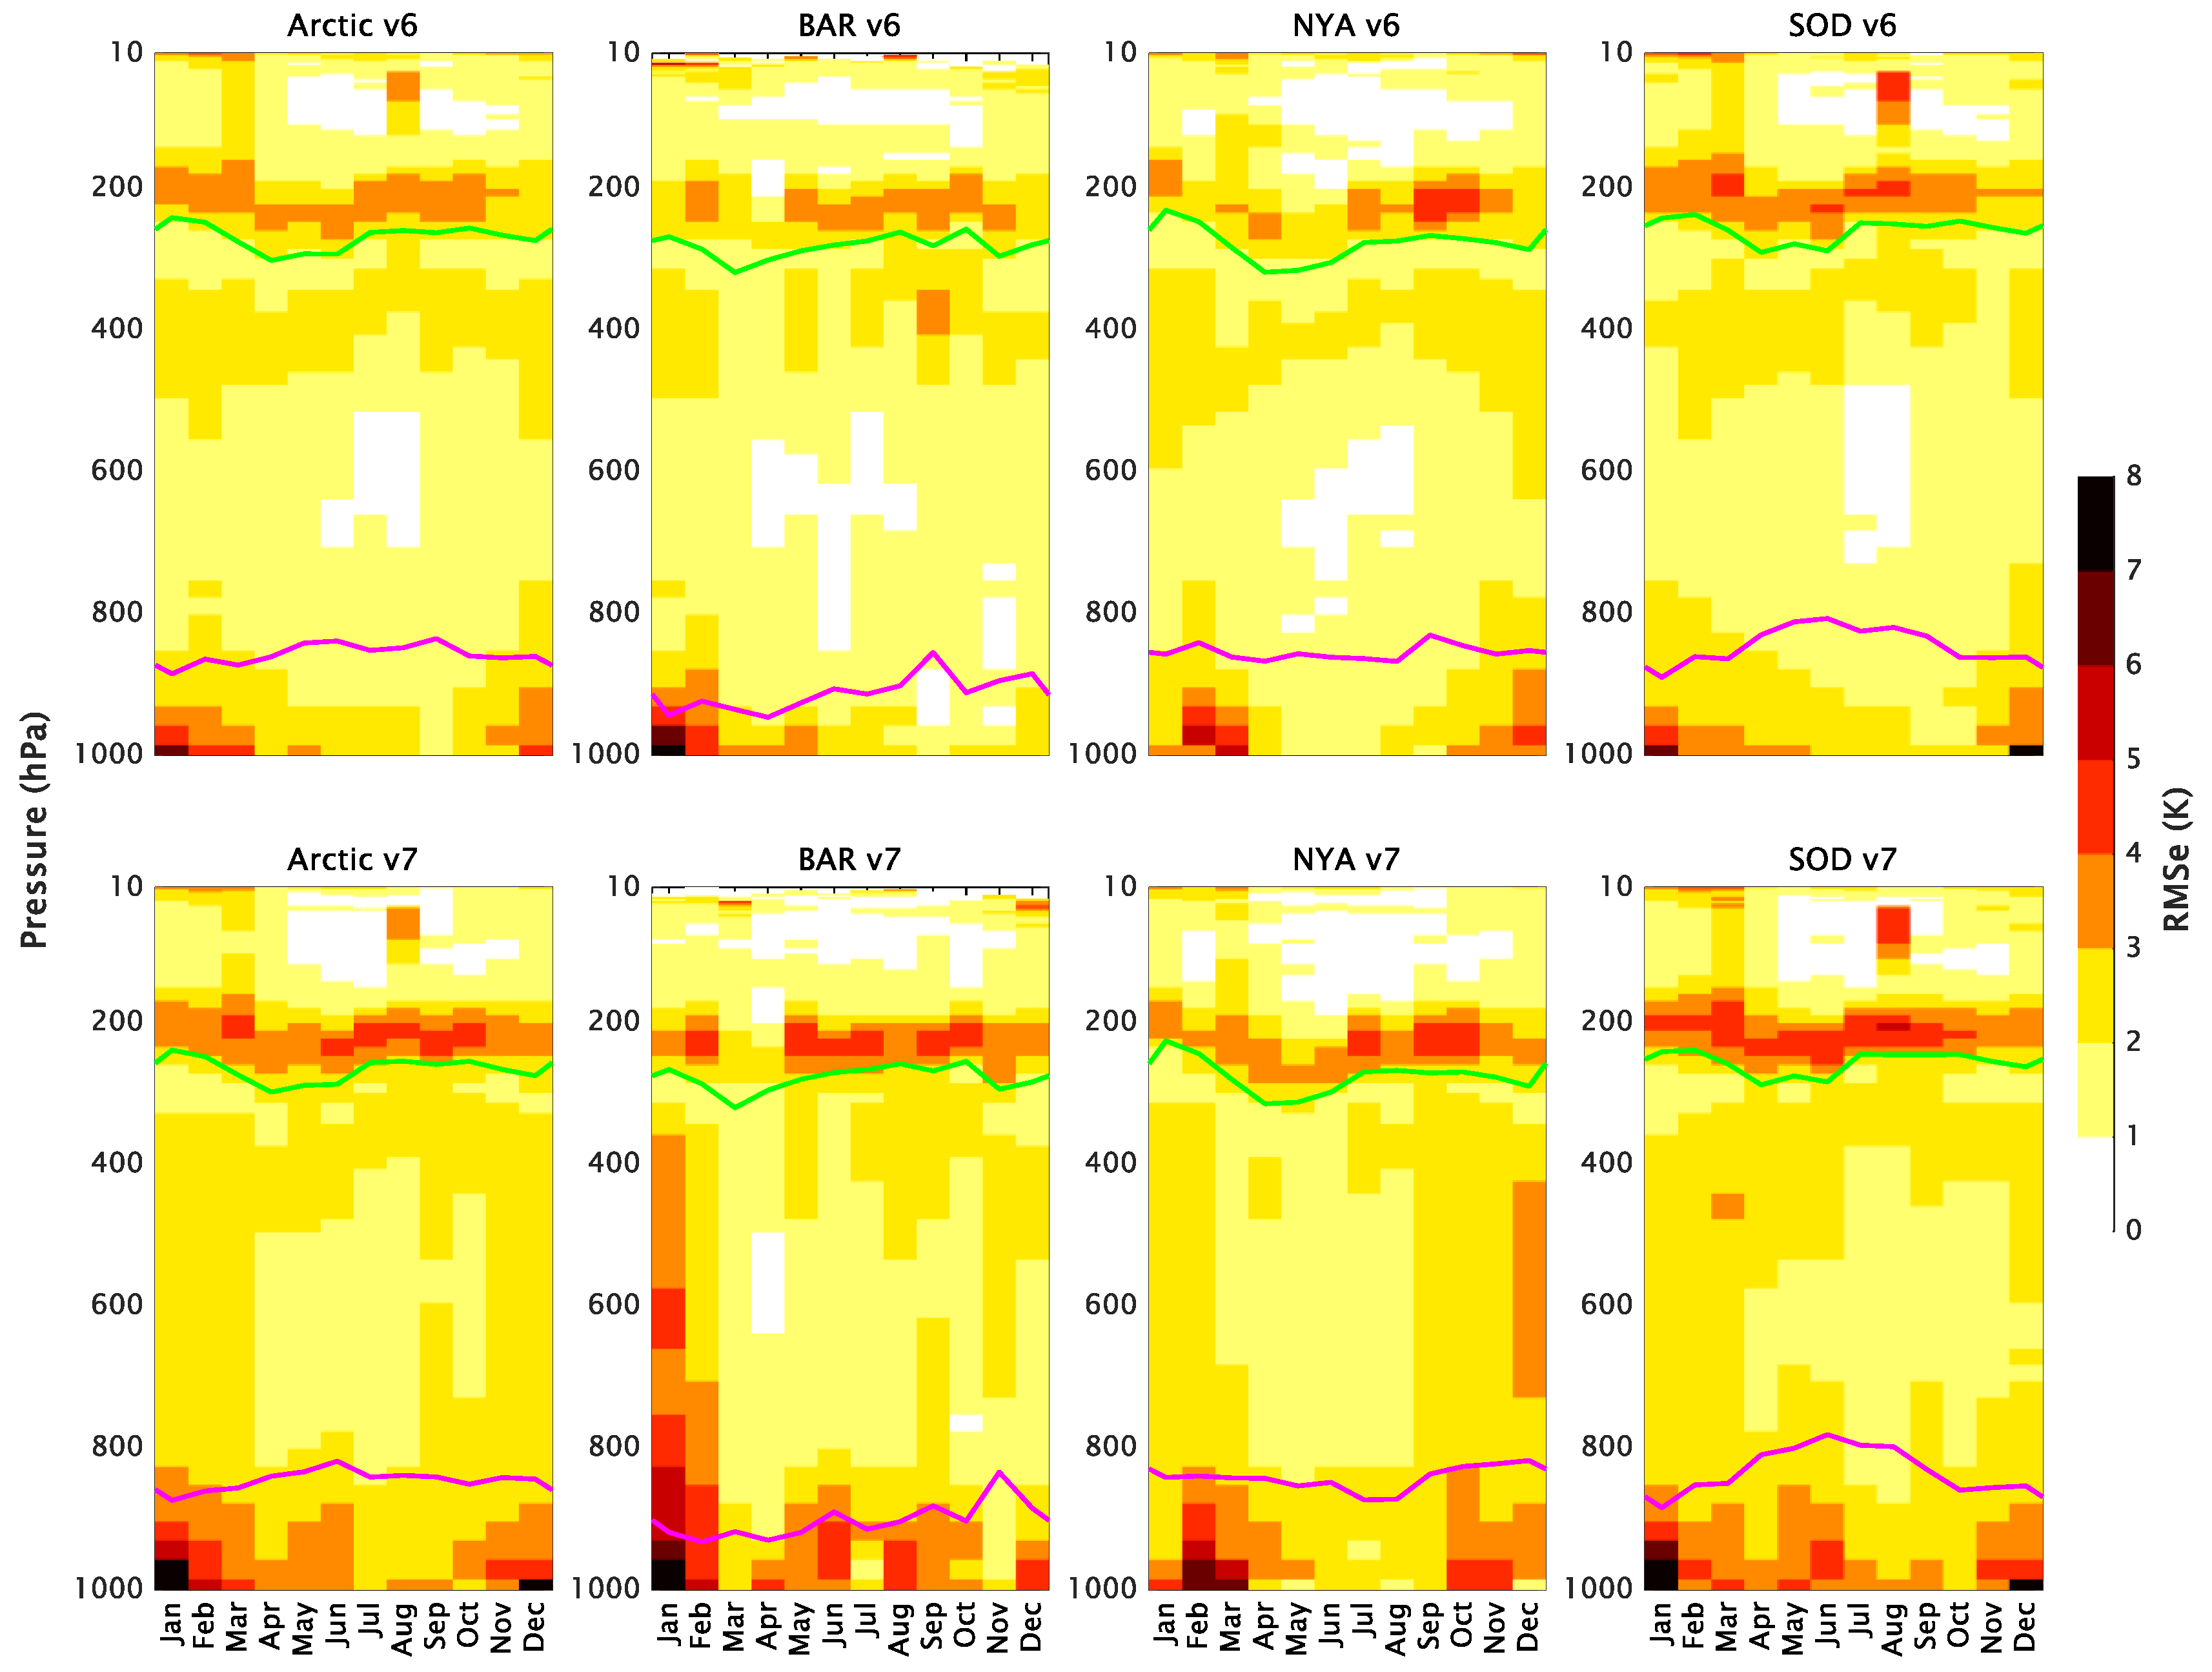
Given the distinct seasonal variability of thermodynamic structure in the Arctic, the AIRS data have been binned monthly to avoid seasonal effects skewing the statistical results. In this section, we present the mean biases (Figure 4) for the AIRS relative to the GRUAN as a function of the month with associated RMS errors (Figure 5) and correlation coefficients (Figure 6). Here, the relative global sampling of the GRUAN can be used to examine the monthly dependence of the AIRS biases. Colocations are grouped into 12 results binned by month for each pressure layer.
Both AIRS v6 and v7 exhibit a predominant cold bias most of the year from the surface to high altitudes. However, there are apparent differences in the mean bias among the three stations, particularly at the BAR station, which presents a larger warm bias and RMSE in the winter half-year. The bias is relatively small within ±1 K in the troposphere and varies with the seasons at the three sites, presenting a warm bias in summer. The sharp RMSE vertical gradients near the tropopause coincide with the large cold and warm biases, thus canceling out and resulting in a statistically slight mean bias. In the boundary layer, the AIRS v6 temperature at the NYA station is warmer, while the other two sites mainly show cold biases. The largest warm and cold biases near the surface are seen in winter and spring, with corresponding RMS errors increasing significantly with altitude from ~2.5 K (~3.5 K for v7) at 800 hPa to more than 4 K at the surface due to the more substantial surface effect on temperature variability in the boundary layer. Meanwhile, the yield of the flagged profiles has a considerable reduction in the winter half-year, which is consistent with the larger RMSE and lower correlation in the cold season.
According to the AIRS v7 validation report, cold biases arise when the near-surface temperature is colder than 285 K because of the steeper lapse rate in the retrievals compared to the radiosonde measurements [52]. During JAS, the cold bias changes to a warm bias in the troposphere, with both AIRS v6 and v7 exhibiting the smallest RMSE. This is probably related to the complex spatial and temporal variation in surface classes in these regions and the limitations of training the SCCNN on the transition between frozen and nonfrozen surfaces, which warrants further study in Section 3.2. The larger bias and poorer correlation at the BAR station are probably subject to cloudy conditions throughout the year. In general, AIRS v6 and v7 are similar in bias, RMSE, and correlation pattern, suggesting a wide variation in RMSE by season but showing a more widely distributed and longer-lasting warm bias with a larger corresponding RMSE in v7.

3.3. Detection of Low-Level Temperature Inversions

The ability of the AIRS v6 and v7 temperature products to detect LLIs are determined by comparing them to the kerned sonde, identifying the accuracy in detecting and characterizing LLIs given their limited vertical resolutions.
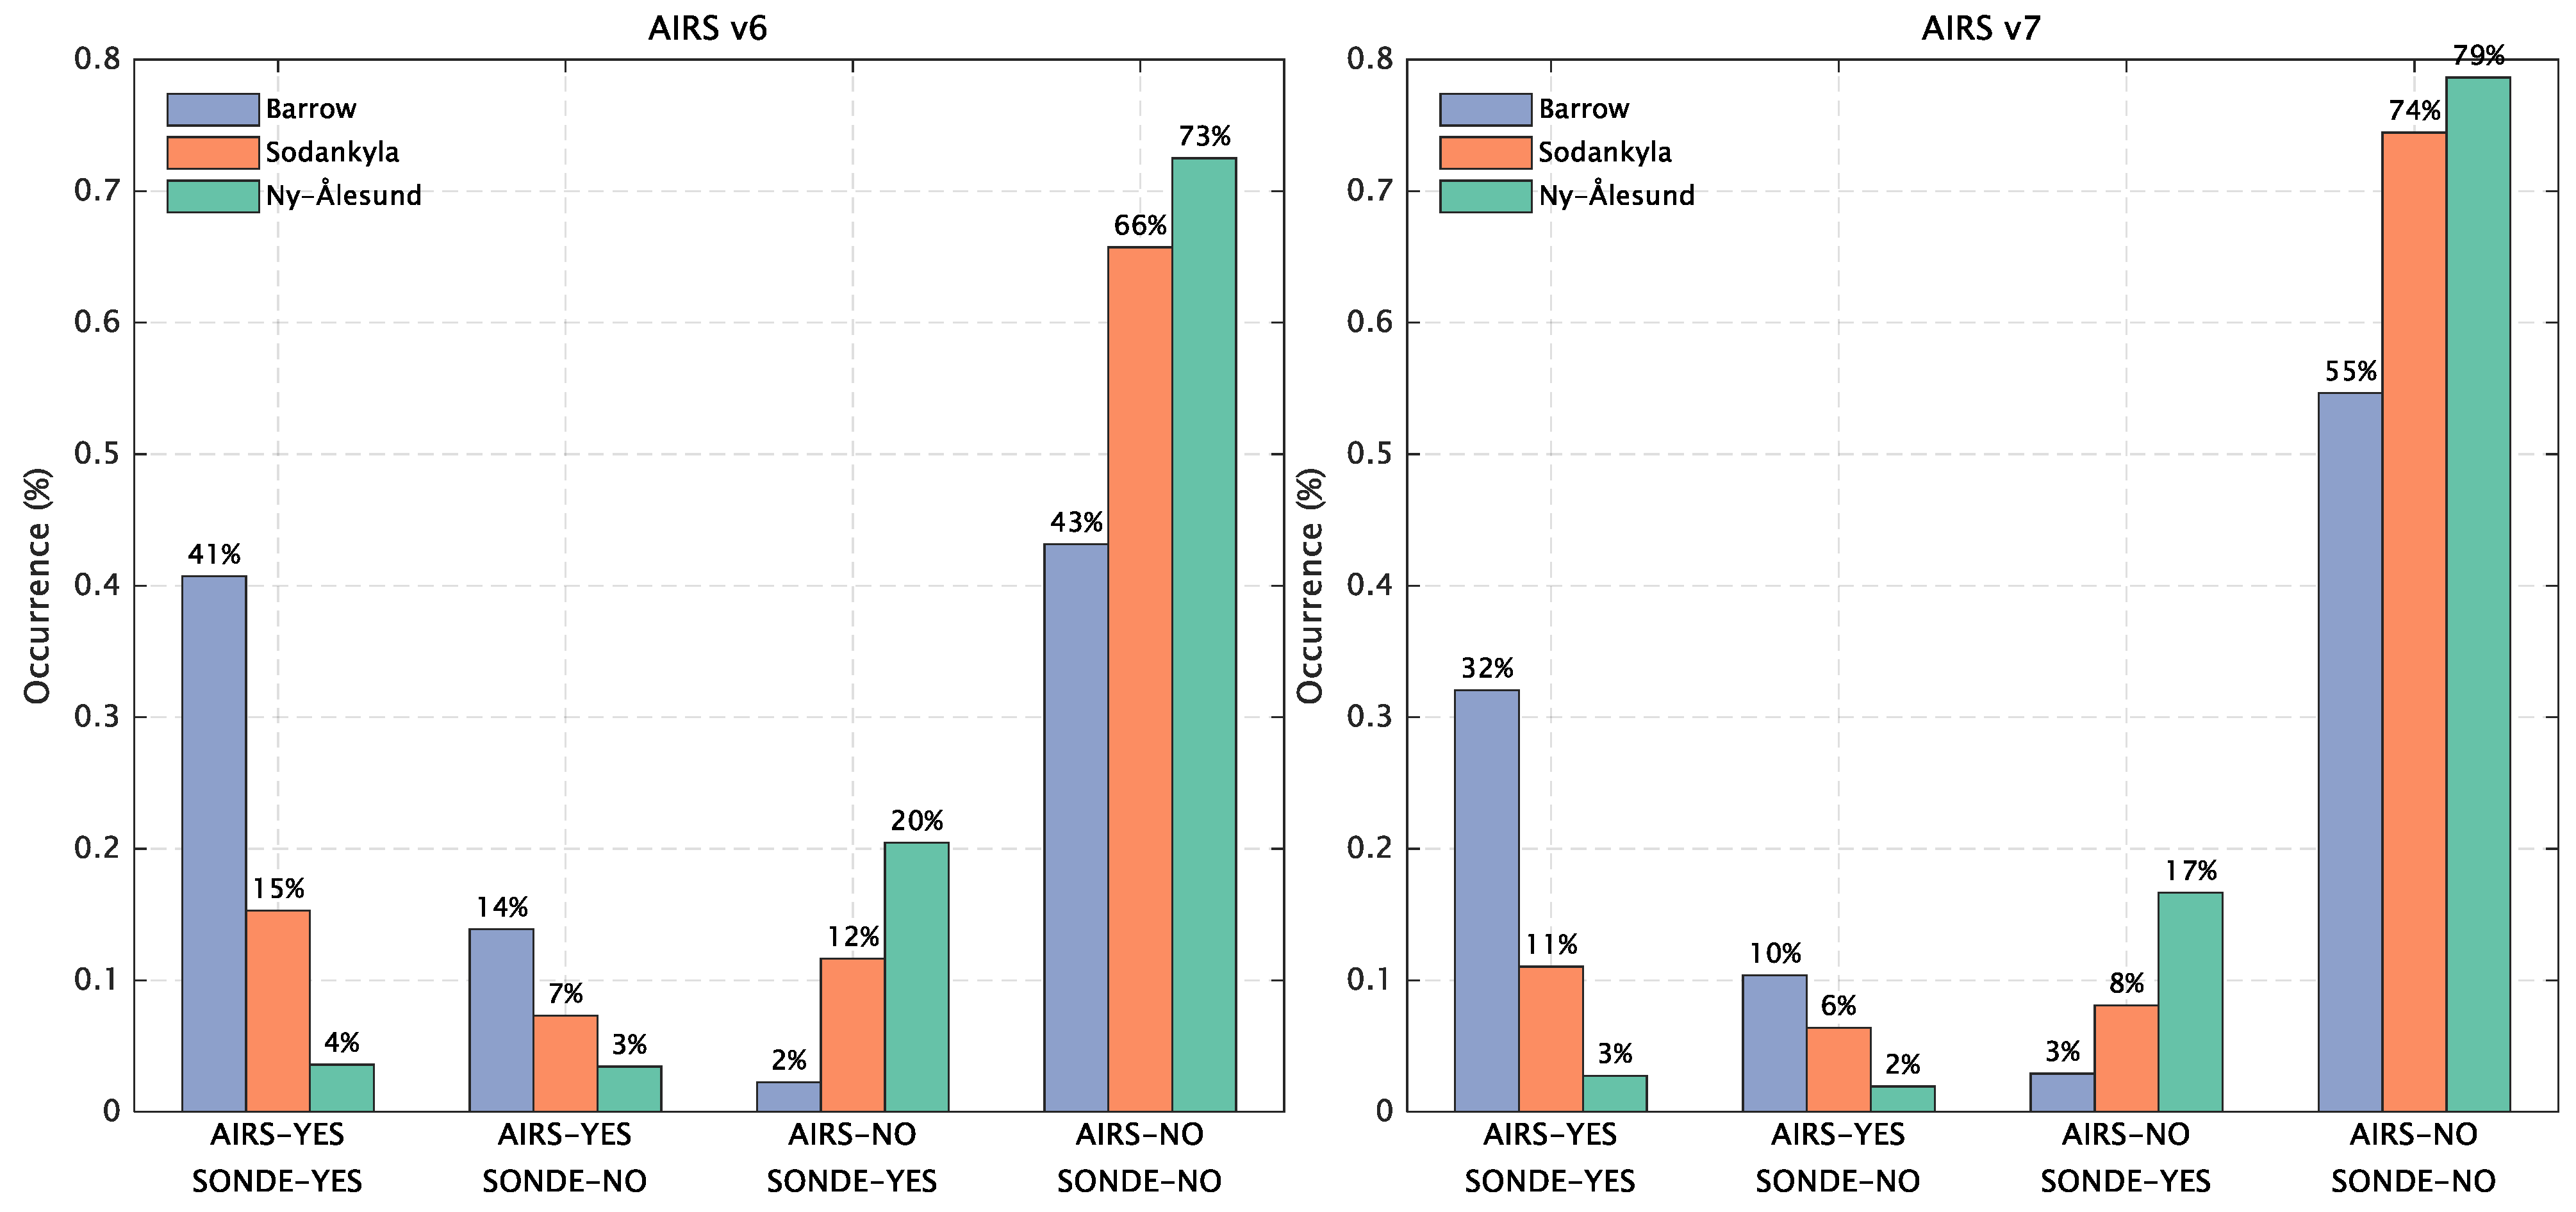
A temperature inversion occurs when the temperature increases or remains constant with height from a certain level. Generally, the presence of an LLI has been estimated using data from temperature profiles below 2 km when the lapse rate (dT/dz) exceeds or is equal to zero. Two quantitative characteristics of an LLI are its depth and intensity, separately defined as the differences in height and temperature between the inversion top and bottom. The LLI detection algorithm steps are described in detail by [16], and the same algorithm is applied to the kerned radiosonde and AIRS datasets. We assessed the performance of the AIRS’s LLI detection ability by defining commission and omission errors. Commission errors occur when an LLI is detected by the AIRS but not by the radiosonde (AIRS-YES, SONDE-NO), and omission errors occur when the radiosonde detects an LLI but the AIRS does not (AIRS-NO, SONDE-YES). The AIRS’s detection is considered correct when both the AIRS and the radiosonde detect an LLI (AIRS-YES, SONDE-YES) or when both do not (AIRS-NO and SONDE-NO).
The bars in Figure 7 summarize the agreement of the AIRS and the kerned radiosonde temperature profiles in capturing the presence or absence of LLIs. On average, the AIRS v6 (v7) correctly identified LLI events in 81% (86%) of the matched profiles, while 19% (14%) of cases disagreed, including cases where the AIRS incorrectly identified or missed LLIs in 8% (6%) and 11% (9%) of profiles, respectively. For the three Arctic sites, the detection accuracy is highest at Barrow at 84% (87%) and lowest at Ny-Ålesund at 77% (82%); the highest commission error of 14% (10%) appears at Ny-Ålesund, and omission errors are highest at Barrow at 20% (17%).
As Boylan et al. (2015) discussed [31], surface type affects AIRS temperature retrievals and may also affect the ability to detect LLIs. The retrieved surface type property is included in the “SurfClass” parameter, which is set by thresholding microwave and infrared emissivity data. In this study, the SurfClass variable in the AIRS L2 product is used to classify the profiles into three land cover types: nonfrozen land (SurfClass = 1), sea ice (SurfClass = 3), and frozen land (SurfClass = 5, 6). Of the cases where the radiosonde detects an LLI, but the AIRS does not, nearly 65% (88%) are over snow. In contrast, only 44~47% of the other cases were over snow for AIRS v6, and 56% of events emerged over nonfrozen land. For AIRS v7, regarding the cases where both measurements detected an LLI, 54% were over snow, and 36% were over sea ice. These results indicate that the instances where the AIRS could not detect an LLI were primarily over snow, and LLIs occur more frequently over sea ice for AIRS v7 than for v6. Cloud cover was investigated, but no relationship was found between the total cloud fraction and LLI detection agreement.

3.4. Assessment of the Accuracy of the AIRS Inversion

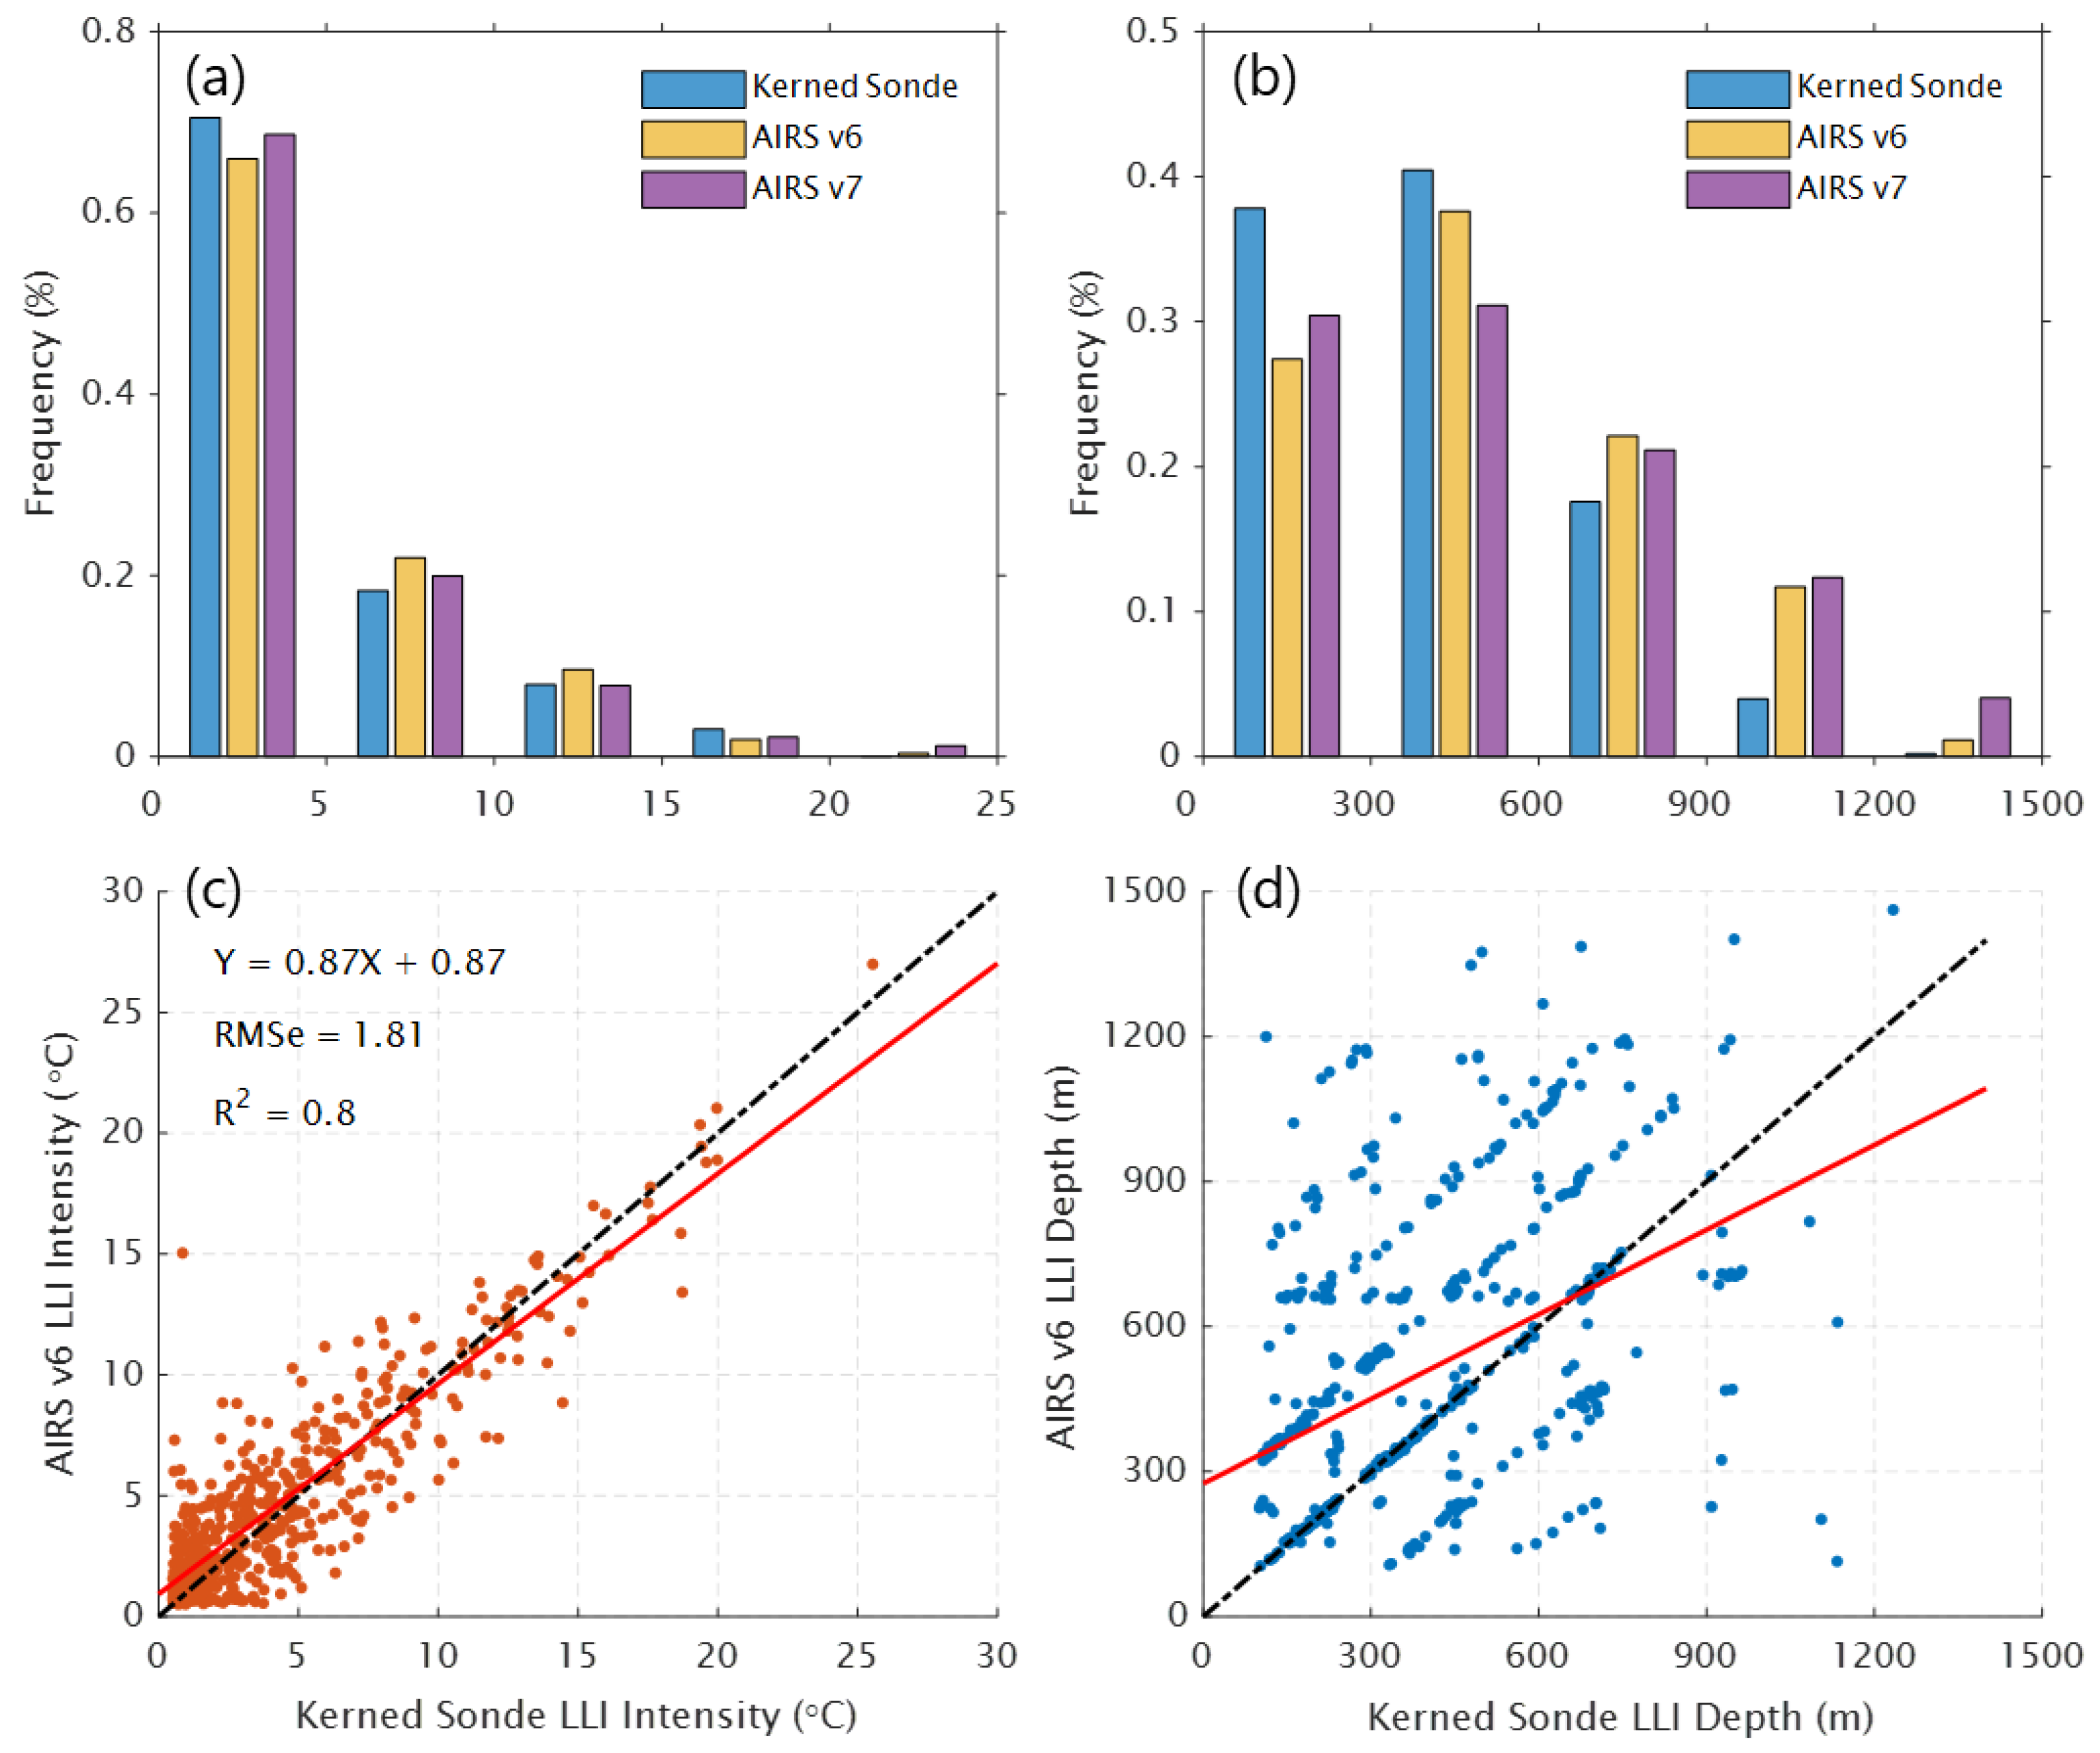
Figure 8 shows the distribution of LLI intensities and depths for the cases where the AIRS and sonde profiles both detected an LLI.
The LLI intensity calculated by the AIRS and radiosonde correlates over 0.9. The frequency distribution of the AIRS v6 intensities in Figure 8a is skewed toward lower values, with cases of an intensity less than 15 °C contributing over 95%, which is largely consistent with the radiosonde profiles. The LLI intensity difference in each bin is within 5% between the kerned sonde and AIRS. The scatterplot of intensities in Figure 8c clearly illustrates the underestimation of LLI intensities by the AIRS when the intensity exceeds 10 °C. AIRS v6 greatly overestimates the inversion intensity for a subset of cases where the radiosonde indicates a small intensity. Further investigation shows that these profiles are mainly located over snow or sea ice at Barrow and Ny-Ålesund in the winter season.
By contrast, the scatterplot of depths (Figure 8d) reveals that when both AIRS v6 and the kerned sonde detect an LLI, the depths agree in only 65% (not significant) of the profiles. The fitting statistics are not shown in the panel because of the low correlation and non-significance. The underestimated depths are aggregated into 300 m and 600 m bins, with the largest difference reaching ~10%. Additionally, AIRS v7 found that ~5% of the depths were greater than 1500 m, compared to scarcely any with the radiosonde. The discrete nature of the depths is due to the predefined pressure levels of the AIRS data. In other words, the observed top of the surface-based inversion (SBI) can only occur at one of the predefined AIRS pressure levels. The AIRS depths were within one pressure level of the kerned sonde depths in 90% of the profiles.

4. Discussion

The bias in the AIRS temperature profiles was primarily related to the surface type and cloud fraction. In clear-sky conditions, the cases over nonfrozen land are close to the AIRS accuracy goal, whereas there is significant degradation over frozen land and sea ice. The AIRS v7 algorithm is based on cloud clearing as in previous versions, setting a typical threshold on the high side so that many thin cirrus clouds or shallow and broken cumulus clouds are removed. In turn, more clouds retain a lower threshold but more spurious clouds are included. AIRS cloud detection typically struggles to quantify thin cirrus clouds, and spurious cirrus clouds can occasionally appear near the tropopause and low cloud layers, which are associated with an effective cloud fraction (ECF) < 0.05 [57]. Nalli et al. (2012, 2013) illustrated that the residual cloud and aerosol contamination remaining in clear-sky window radiances could have a measurable impact on the angular agreement and lead to a cold-biased observation [58,59].
The AIRS temperature retrievals are examined as a function of the ECF to assess and track the impact of changes in cloud-clearing algorithms. The SurfClass variable provides the surface classification in the AIRS L2 product. Geolocation and a digital elevation model determine the land, ocean, and coastline. For v6 retrieval, the surface temperature from the forecast or climatology is used to distinguish frozen and nonfrozen surfaces. However, the v7 algorithm uses the auxiliary ice concentration and snow depth information from the global forecasting system. Although the surface classification method is quite different in v6 and v7, more than 75% of the profiles are still from frozen surfaces for both versions.
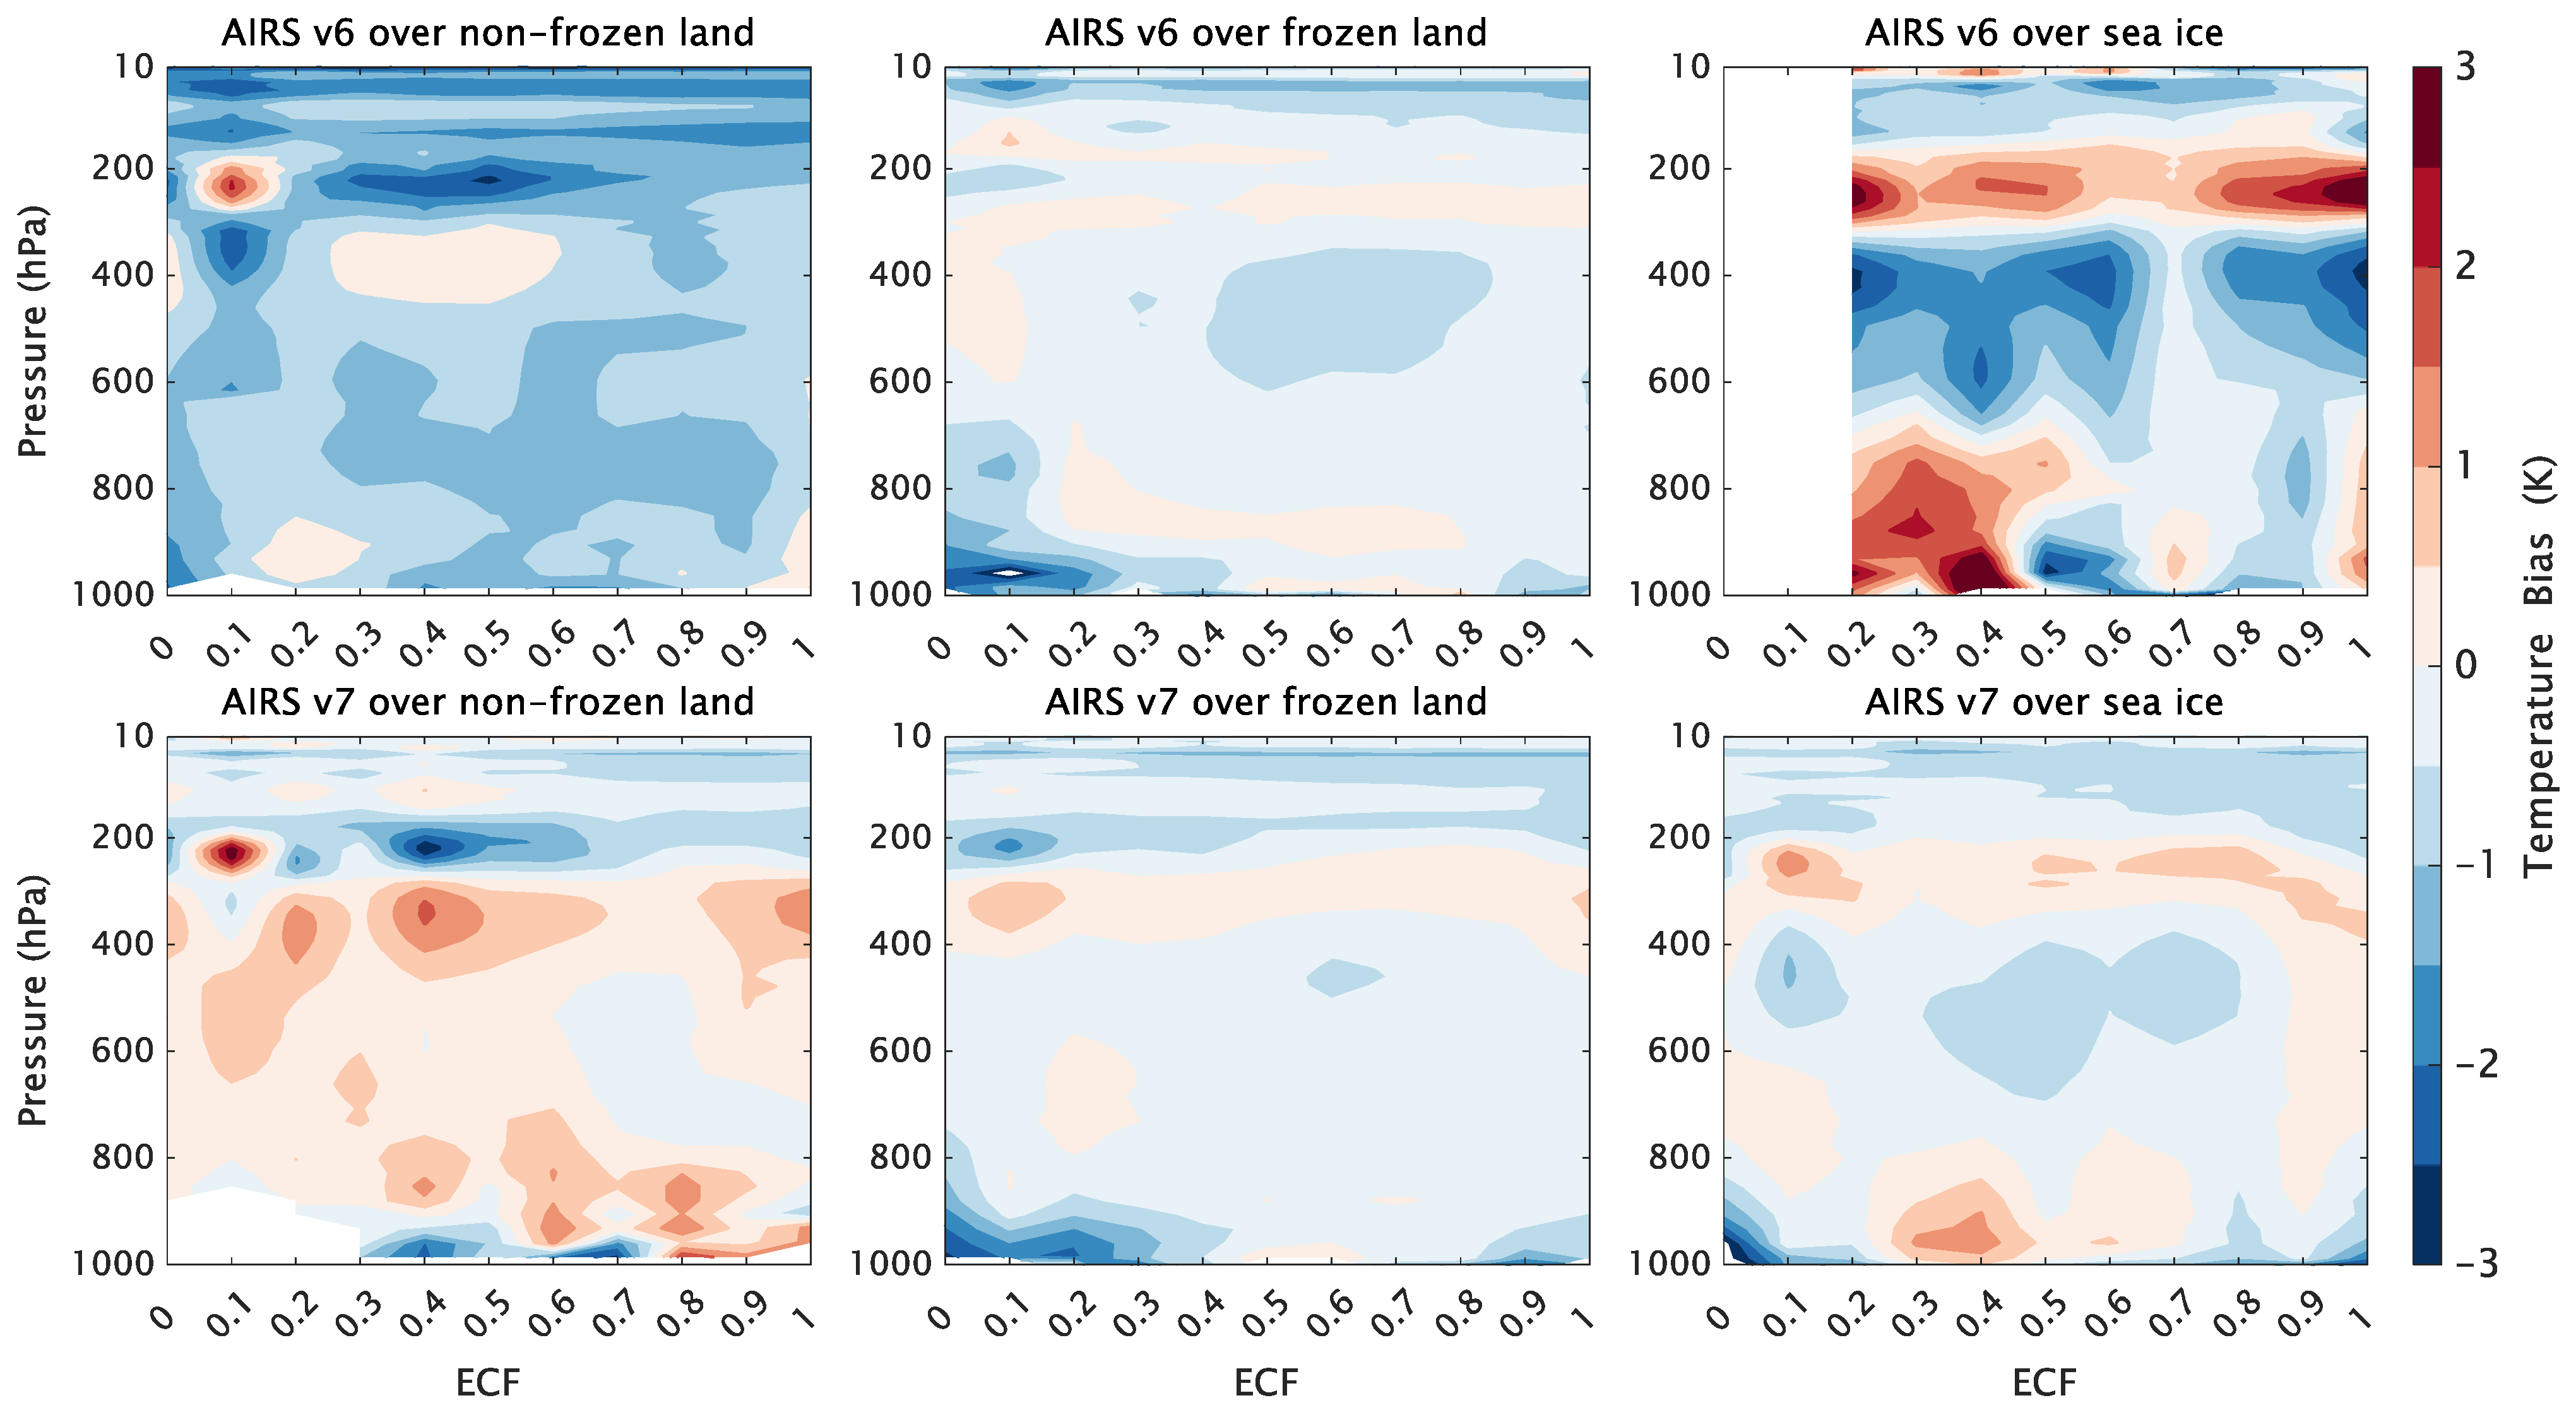
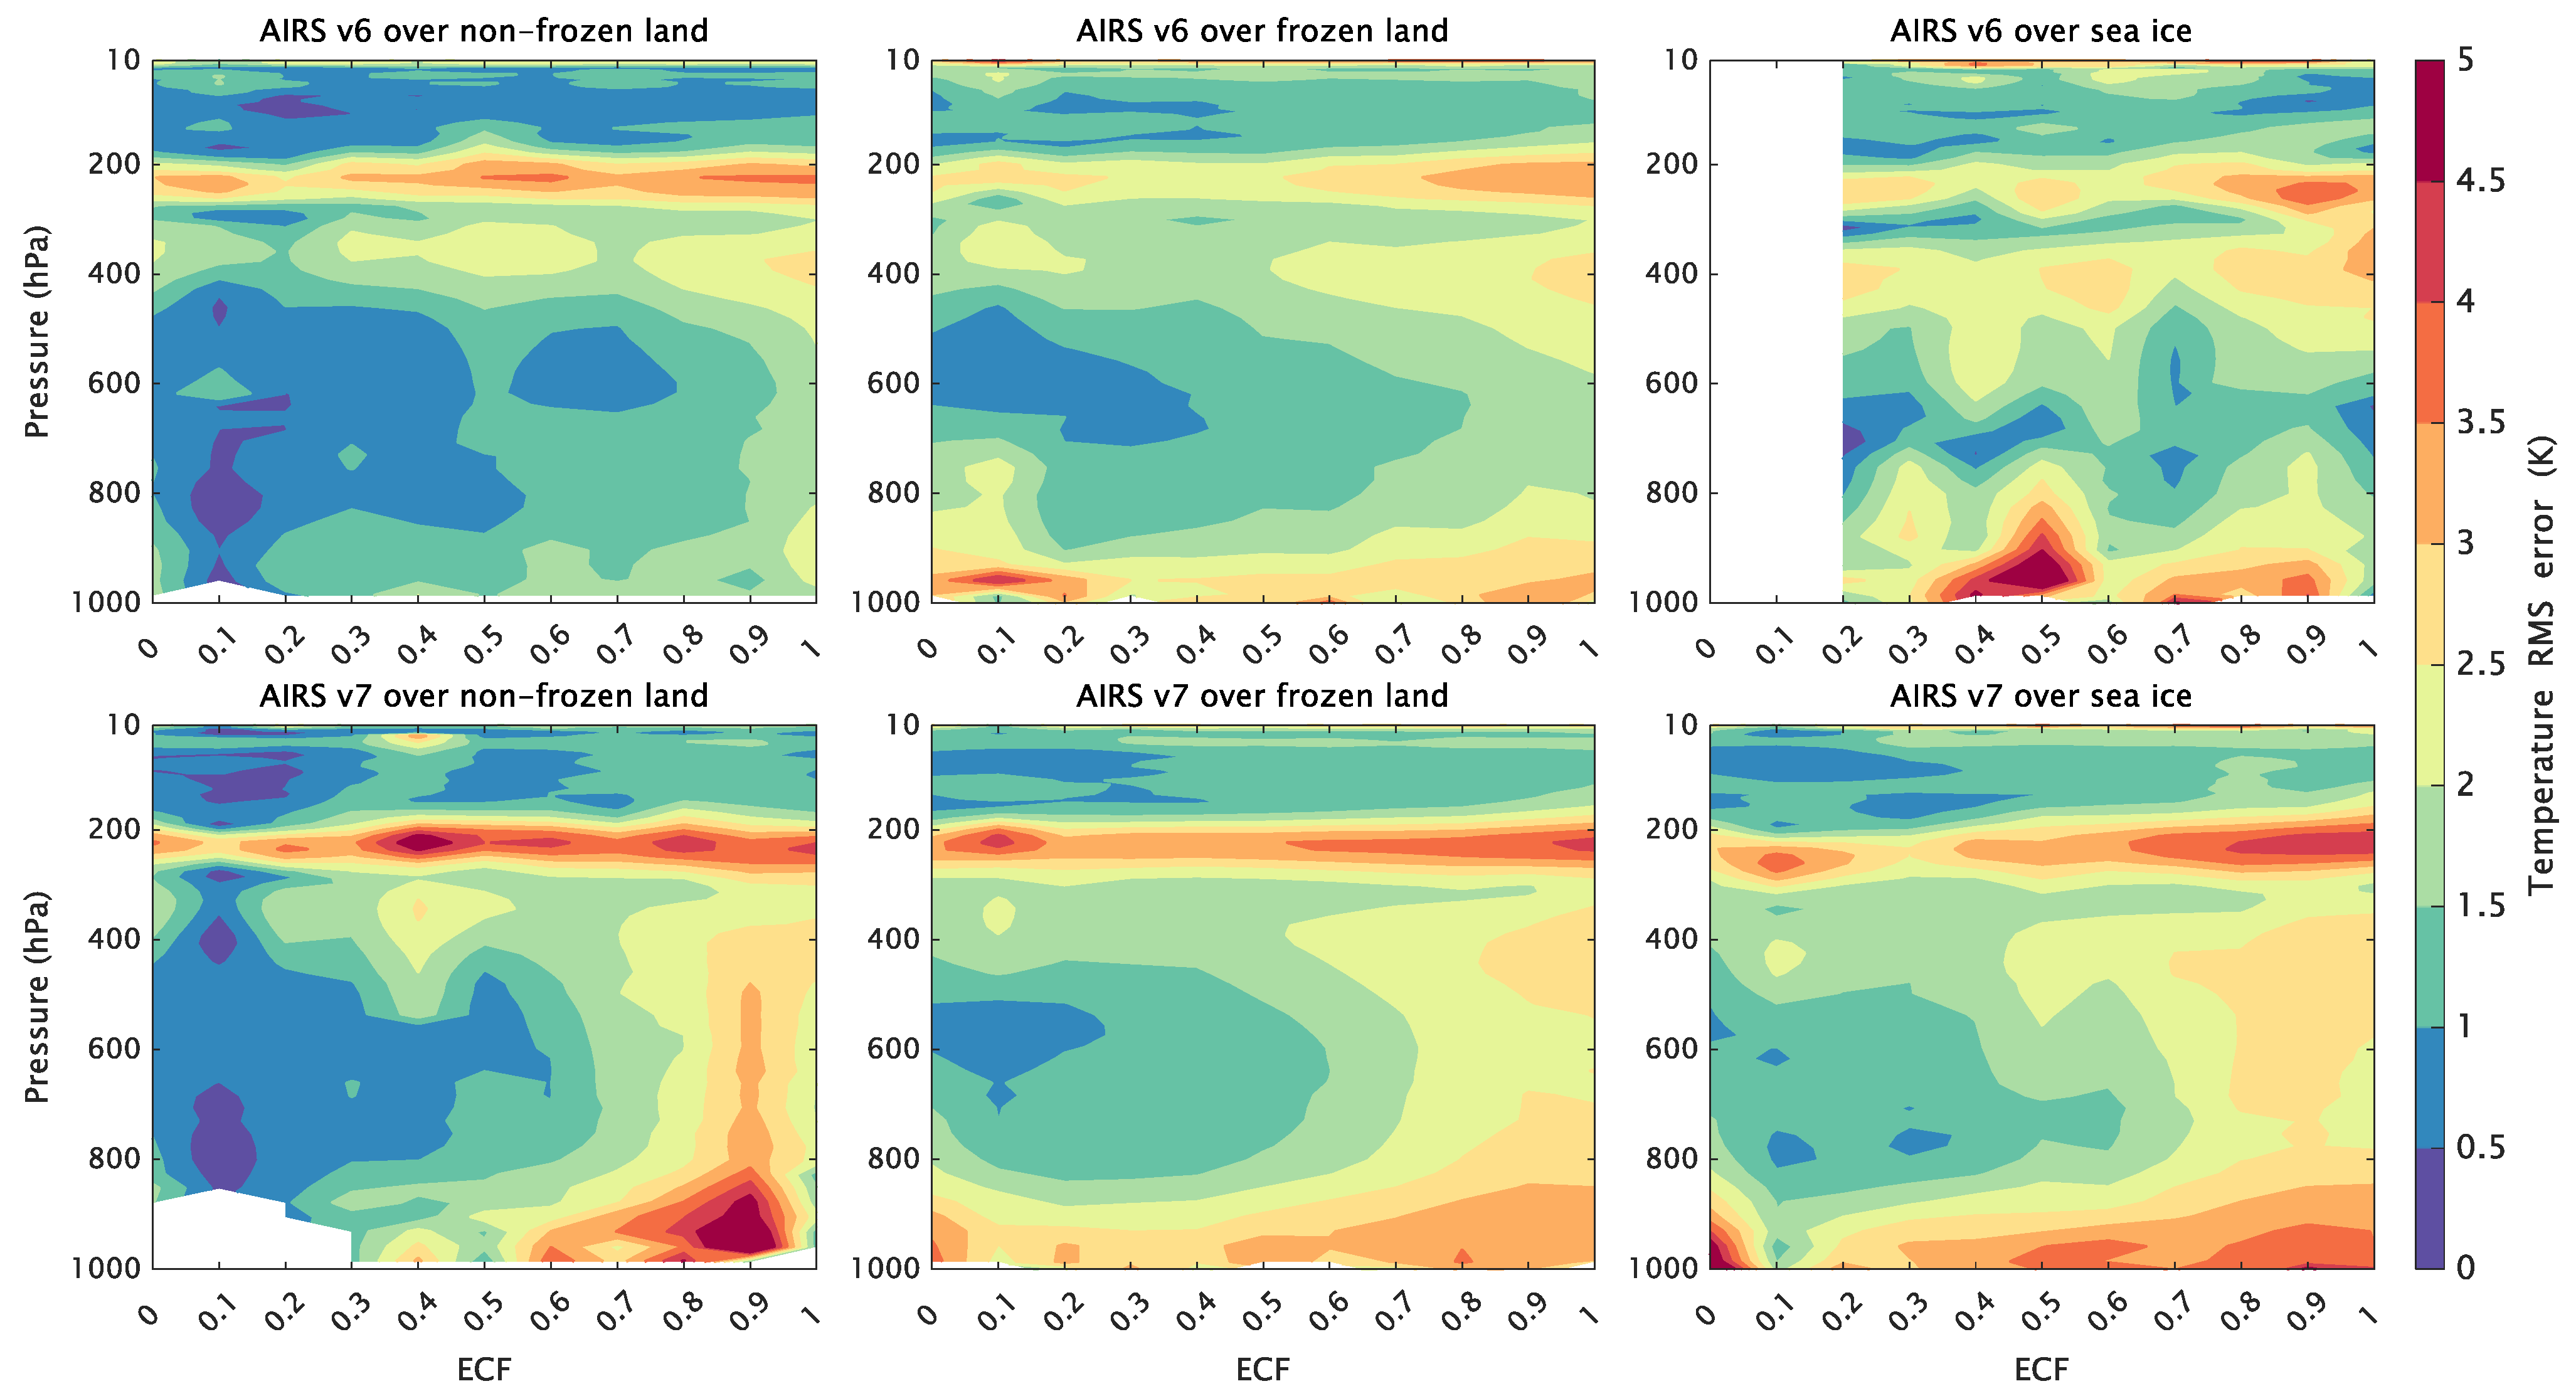
The mean profiles of the biases and RMS errors for the three surface types binned by ECF are shown in Figure 9 and Figure 10. Over frozen land, the mean bias of the two versions is generally small (magnitude < 1.0 K) and primarily cold in the stratosphere and middle troposphere. In contrast, warm biases are observed at ~300 hPa and below 800 hPa. In clear skies (0 < ECF < 0.2), a significant cold bias (~−2 K) with a large RMS error (3~4 K) is noticed below 800 hPa in v6. This spurious temperature bias has been suppressed in v7. Over nonfrozen land, the AIRS v6 retrievals produce colder temperatures than those of v7, whose warm bias predominates below 300 hPa. Although the magnitude of the mean bias increases relative to that over the frozen land, the RMS errors in the two versions have an apparent reduction, especially at smaller ECFs.
The vertical bias oscillations are generally independent of cloud fraction, excluding the bias of v6 over sea ice, which increases with ECF when ECF > 0.8; whichthis has been partly removed in v7. In contrast, the accuracy degradation with increasing cloud cover is evident in the RMSE at most levels. On average, the RMS differences with 100% cloud cover are approximately 1.5~2.0 K larger than those for clear cases, varying sharply in the middle and lower troposphere (below 400 hPa). Below 700 hPa, the cases flagged as acceptable fall slowly with increasing cloud cover, from approximately 67% at low cloud fractions to 27% close to 1.0 ECF. The ECF and accuracy of the AIRS temperature profiles are also highly dependent on the cloud state, and AIRS retrieval yields range from values surpassing 90% for clear skies to values less than 10% for deep convection and nimbostratus [60]. Thus, the typical decrease in the retrieval yield near the surface is probably due to the ubiquitous presence of low-level clouds, which are more frequent in summer melt over the Arctic Ocean [61,62].
Over frozen land, the spurious cloud-free temperature bias observed below 800 hPa in v6 is suppressed in v7. The RMS errors in v6 and v7 are relatively small over nonfrozen land. In the infrared-only (IR-only) system, v6 solely uses surface temperature to determine whether the surface is frozen, causing reduced retrieval performance near the freezing point. In addition, since the surface emissivity in high-latitude regions is less accurate, v6 IR-only retrievals have less precise discrimination of the surface types, affecting the retrieval yield, accuracy, and precision of various parameters in these regions. The AIRS v7 validation report illustrates that the v7 IR-only surface classification is similar to data from the National Snow and Ice Data Center (NSIDC) and more consistent with combined infrared–microwave algorithms at high latitudes compared with the v6 IR-only algorithm [52].

5. Conclusions

Whether directly used or assimilated into reanalyses, the AIRS data have been proven to improve local weather and climate forecast skills worldwide. With excellent consistency, refined vertical resolution, and multiple daily transits, the AIRS can improve the spatial and temporal coverage of upper-air observations in the Arctic [63]. However, the low contrast between frozen surfaces and clouds in the infrared spectrum challenges AIRS temperature profiles. Although the most recently released AIRS v7 improved overall performance, the accuracy of the temperature profile still has large uncertainties in the Arctic, particularly in the boundary layer below 800 hPa, where the temperature variability is sharp relative to the layers above.
Temperature profiles from the GRUAN upper-air data are used to evaluate the AIRS profiles. The AIRS averaging kernels were applied to interpolate the radiosonde data, accounting for the inherent sensitivity and first-guess profiles of the AIRS. The intercomparison results generally reveal that the AIRS temperature retrievals agree with the radiosonde data. The v7 mean bias is reduced compared to that of v6; for the mean bias profile, the cold bias of ~0.5 K below 300 hPa is eliminated, but the RMSE near 250 hPa remained and slightly increased. The AIRS exhibits a predominant cold bias in the stratosphere, and v7 is warmer than v6 in the troposphere. In the boundary layer, v7 shows a larger bias and RMSE, particularly in the winter half-year. This may be related to the changes in temperature quality control methodology at high latitudes, such that the numerical threshold for frozen cases near the surface is slightly loosened in v7, increasing the yield over frozen surfaces.
The AIRS LLI results were compared to LLIs from radiosondes, and it was found that the AIRS correctly detected most LLIs, excluding ~10% of the profiles, which were missed. The AIRS correctly identified LLI absence in over 60% of the profiles and accurately determined the depth 65% of the time. LLI intensities can be accurately obtained with a strong correlation (>0.9) but cause some underestimation due to a warm bias in the boundary layer. The temperature at the bottom of the inversion was the greater source of disagreement in LLI intensity determination. Despite the limits identified because of its inherent resolution and accuracy in the boundary layer, our analysis has shown that the AIRS can be a useful LLI detection tool over the Arctic. With the AIRS temperature estimation further improved in the boundary layer, it might dramatically improve AIRS LLI detection and intensity capability.

Author Contributions

Conceptualization, M.D. and L.B.; methodology, X.Z.; software, L.Z.; validation, L.Z.; formal analysis, L.Z.; investigation, J.G.; resources, J.C.; data curation, L.Z.; writing—original draft preparation, L.Z.; writing—review and editing, L.Z.; visualization, L.Z.; supervision, M.D.; project administration, M.D.; funding acquisition, M.D. All authors have read and agreed to the published version of the manuscript.

Funding

This project is funded by the National Key R&D Project under grant number 2022YFE0106700, the Basic Research Fund of CAMS (2022Y012), and the National Natural Science Foundation of China (41941012). And The APC was funded by 2022YFE0106700.

Data Availability Statement

The radiosonde observations used in this paper are available from the GCOS Reference Upper Air Network repository at https://www.gruan.org/data/file-archive. Aqua AIRS V6 and V7 is available from the GES DISC repository (10.5067/Aqua/AIRS/DATA208, 10.5067/APJ6EEN0PD0Z).

Conflicts of Interest

The authors declare no conflict of interest.

References

  1. Constable, A.J.; Harper, S.; Dawson, J.; Holsman, K.; Mustonen, T.; Piepenburg, D.; Rost, B. Cross-Chapter Paper 6: Polar Regions. In Climate Change 2022: Impacts, Adaptation and Vulnerability. Contribution of Working Group II to the Sixth Assessment Report of the Intergovernmental Panel on Climate Change; Pörtner, H.-O., Roberts, D.C., Tignor, M., Poloczanska, E.S., Mintenbeck, K., Alegría, A., Craig, M., Langsdorf, S., Löschke, S., Möller, V., et al., Eds.; Cambridge University Press: Cambridge, UK; New York, NY, USA, 2022; pp. 2319–2368. [Google Scholar] [CrossRef]
  2. Rantanen, M.; Karpechko, A.Y.; Lipponen, A.; Nordling, K.; Hyvärinen, O.; Ruosteenoja, K.; Vihma, T.; Laaksonen, A. The Arctic Has Warmed Nearly Four Times Faster than the Globe since 1979. Commun. Earth Environ. 2022, 3, 168. [Google Scholar] [CrossRef]
  3. Goosse, H.; Kay, J.E.; Armour, K.C.; Bodas-Salcedo, A.; Chepfer, H.; Docquier, D.; Jonko, A.; Kushner, P.J.; Lecomte, O.; Massonnet, F.; et al. Quantifying Climate Feedbacks in Polar Regions. Nat. Commun. 2018, 9, 1919. [Google Scholar] [CrossRef] [PubMed] [Green Version]
  4. Previdi, M.; Smith, K.L.; Polvani, L.M. Arctic Amplification of Climate Change: A Review of Underlying Mechanisms. Environ. Res. Lett. 2021, 16, 093003. [Google Scholar] [CrossRef]
  5. Serreze, M.C.; Barry, R.G. The Arctic Climate System, 2nd ed.; Cambridge Atmospheric and Space Science Series; Cambridge University Press: Cambridge, UK, 2014; ISBN 978-1-107-03717-5. [Google Scholar]
  6. Pithan, F.; Mauritsen, T. Arctic Amplification Dominated by Temperature Feedbacks in Contemporary Climate Models. Nat. Geosci. 2014, 7, 181–184. [Google Scholar] [CrossRef]
  7. Stuecker, M.F.; Bitz, C.M.; Armour, K.C.; Proistosescu, C.; Kang, S.M.; Xie, S.-P.; Kim, D.; McGregor, S.; Zhang, W.; Zhao, S.; et al. Polar Amplification Dominated by Local Forcing and Feedbacks. Nat. Clim. Chang. 2018, 8, 1076–1081. [Google Scholar] [CrossRef]
  8. Bintanja, R.; Graversen, R.G.; Hazeleger, W. Arctic Winter Warming Amplified by the Thermal Inversion and Consequent Low Infrared Cooling to Space. Nat. Geosci. 2011, 4, 758–761. [Google Scholar] [CrossRef]
  9. Kaufman, Z.S.; Feldl, N. Causes of the Arctic’s Lower-Tropospheric Warming Structure. J. Clim. 2022, 35, 1983–2002. [Google Scholar] [CrossRef]
  10. Kahl, J.D. Characteristics of the Low-Level Temperature Inversion along the Alaskan Arctic Coast. Int. J. Climatol. 1990, 10, 537–548. [Google Scholar] [CrossRef]
  11. Serreze, M.C.; Kahl, J.D.; Schnell, R.C. Low-Level Temperature Inversions of the Eurasian Arctic and Comparisons with Soviet Drifting Station Data. J. Clim. 1992, 5, 615–629. [Google Scholar] [CrossRef]
  12. Bourne, S.M.; Bhatt, U.S.; Zhang, J.; Thoman, R. Surface-Based Temperature Inversions in Alaska from a Climate Perspective. Atmos. Res. 2010, 95, 353–366. [Google Scholar] [CrossRef]
  13. Miller, N.B.; Turner, D.D.; Bennartz, R.; Shupe, M.D.; Kulie, M.S.; Cadeddu, M.P.; Walden, V.P. Surface-Based Inversions above Central Greenland. J. Geophys. Res. Atmos. 2013, 118, 495–506. [Google Scholar] [CrossRef]
  14. Palo, T.; Vihma, T.; Jaagus, J.; Jakobson, E. Observations of Temperature Inversions over Central Arctic Sea Ice in Summer. Q. J. R. Meteorol. Soc. 2017, 143, 2741–2754. [Google Scholar] [CrossRef]
  15. Wang, D.; Guo, J.; Xu, H.; Li, J.; Lv, Y.; Solanki, R.; Guo, X.; Han, Y.; Chen, T.; Ding, M.; et al. Vertical Structures of Temperature Inversions and Clouds Derived from High-Resolution Radiosonde Measurements at Ny-Ålesund, Svalbard. Atmos. Res. 2021, 254, 105530. [Google Scholar] [CrossRef]
  16. Zhang, L.; Li, J.; Ding, M.; Guo, J.; Bian, L.; Sun, Q.; Yang, Q.; Dou, T.; Zhang, W.; Tian, B.; et al. Characteristics of Low-Level Temperature Inversions over the Arctic Ocean during the CHINARE 2018 Campaign in Summer. Atmos. Environ. 2021, 253, 118333. [Google Scholar] [CrossRef]
  17. Zhang, Y.; Zhang, B.; Yang, N. Characteristics of Temperature and Humidity Inversions Based on High-Resolution Radiosonde Observations at Three Arctic Stations. J. Appl. Meteorol. Climatol. 2022, 61, 415–428. [Google Scholar] [CrossRef]
  18. Huang, J.; Zhang, X.; Zhang, Q.; Lin, Y.; Hao, M.; Luo, Y.; Zhao, Z.; Yao, Y.; Chen, X.; Wang, L.; et al. Recently Amplified Arctic Warming Has Contributed to a Continual Global Warming Trend. Nat. Clim. Chang. 2017, 7, 875–879. [Google Scholar] [CrossRef]
  19. Zhang, Y.; Seidel, D.J. Challenges in Estimating Trends in Arctic Surface-Based Inversions from Radiosonde Data. Geophys. Res. Lett. 2011, 38, L17806. [Google Scholar] [CrossRef] [Green Version]
  20. Tjernström, M.; Graversen, R.G. The Vertical Structure of the Lower Arctic Troposphere Analysed from Observations and the ERA-40 Reanalysis. Q. J. R. Meteorol. Soc. 2009, 135, 431–443. [Google Scholar] [CrossRef]
  21. Mernild, S.H.; Liston, G.E. The Influence of Air Temperature Inversions on Snowmelt and Glacier Mass Balance Simulations, Ammassalik Island, Southeast Greenland. J. Appl. Meteorol. Climatol. 2010, 49, 47–67. [Google Scholar] [CrossRef]
  22. Zhang, Y.; Seidel, D.J.; Golaz, J.-C.; Deser, C.; Tomas, R.A. Climatological Characteristics of Arctic and Antarctic Surface-Based Inversions. J. Clim. 2011, 24, 5167–5186. [Google Scholar] [CrossRef] [Green Version]
  23. Wesslén, C.; Tjernström, M.; Bromwich, D.H.; de Boer, G.; Ekman, A.M.L.; Bai, L.-S.; Wang, S.-H. The Arctic Summer Atmosphere: An Evaluation of Reanalyses Using ASCOS Data. Atmos. Chem. Phys. 2014, 14, 2605–2624. [Google Scholar] [CrossRef] [Green Version]
  24. Graham, R.M.; Rinke, A.; Cohen, L.; Hudson, S.R.; Walden, V.P.; Granskog, M.A.; Dorn, W.; Kayser, M.; Maturilli, M. A Comparison of the Two Arctic Atmospheric Winter States Observed during N-ICE2015 and SHEBA. J. Geophys. Res. Atmos. 2017, 122, 5716–5737. [Google Scholar] [CrossRef]
  25. Shahi, S.; Abermann, J.; Heinrich, G.; Prinz, R.; Schöner, W. Regional Variability and Trends of Temperature Inversions in Greenland. J. Clim. 2020, 33, 9391–9407. [Google Scholar] [CrossRef]
  26. Graham, R.M.; Cohen, L.; Ritzhaupt, N.; Segger, B.; Graversen, R.G.; Rinke, A.; Walden, V.P.; Granskog, M.A.; Hudson, S.R. Evaluation of Six Atmospheric Reanalyses over Arctic Sea Ice from Winter to Early Summer. J. Clim. 2019, 32, 4121–4143. [Google Scholar] [CrossRef] [Green Version]
  27. Susskind, J.; Barnet, C.D.; Blaisdell, J.M. Retrieval of Atmospheric and Surface Parameters from AIRS/AMSU/HSB Data in the Presence of Clouds. IEEE Trans. Geosci. Remote Sens. 2003, 41, 390–409. [Google Scholar] [CrossRef]
  28. Susskind, J.; Barnet, C.; Blaisdell, J.; Iredell, L.; Keita, F.; Kouvaris, L.; Molnar, G.; Chahine, M. Accuracy of Geophysical Parameters Derived from Atmospheric Infrared Sounder/Advanced Microwave Sounding Unit as a Function of Fractional Cloud Cover. J. Geophys. Res. Atmos. 2006, 111, D09S17. [Google Scholar] [CrossRef] [Green Version]
  29. Susskind, J.; Blaisdell, J.M.; Iredell, L.; Keita, F. Improved Temperature Sounding and Quality Control Methodology Using AIRS/AMSU Data: The AIRS Science Team Version 5 Retrieval Algorithm. IEEE Trans. Geosci. Remote Sens. 2011, 49, 883–907. [Google Scholar] [CrossRef] [Green Version]
  30. Susskind, J.; Blaisdell, J.M.; Iredell, L. Improved Methodology for Surface and Atmospheric Soundings, Error Estimates, and Quality Control Procedures: The Atmospheric Infrared Sounder Science Team Version-6 Retrieval Algorithm. JARS 2014, 8, 084994. [Google Scholar] [CrossRef]
  31. Boylan, P.; Wang, J.; Cohn, S.A.; Fetzer, E.; Maddy, E.S.; Wong, S. Validation of AIRS Version 6 Temperature Profiles and Surface-Based Inversions over Antarctica Using Concordiasi Dropsonde Data: AIRS v6 Antarctic Surface Inversions. J. Geophys. Res. Atmos. 2015, 120, 992–1007. [Google Scholar] [CrossRef]
  32. Trent, T.; Schröder, M.; Remedios, J. GEWEX Water Vapor Assessment: Validation of AIRS Tropospheric Humidity Profiles With Characterized Radiosonde Soundings. J. Geophys. Res. Atmos. 2019, 124, 886–906. [Google Scholar] [CrossRef] [Green Version]
  33. Wang, H.; Chai, S.; Tang, X.; Zhou, B.; Bian, J.; Vömel, H.; Yu, K.; Wang, W. Verification of Satellite Ozone/Temperature Profile Products and Ozone Effective Height/Temperature over Kunming, China. Sci. Total Environ. 2019, 661, 35–47. [Google Scholar] [CrossRef]
  34. Osei, M.A.; Amekudzi, L.K.; Ferguson, C.R.; Danuor, S.K. Inter-Comparison of AIRS Temperature and Relative Humidity Profiles with AMMA and DACCIWA Radiosonde Observations over West Africa. Remote Sens. 2020, 12, 2631. [Google Scholar] [CrossRef]
  35. Divakarla, M.G.; Barnet, C.D.; Goldberg, M.D.; McMillin, L.M.; Maddy, E.; Wolf, W.; Zhou, L.; Liu, X. Validation of Atmospheric Infrared Sounder Temperature and Water Vapor Retrievals with Matched Radiosonde Measurements and Forecasts. J. Geophys. Res. Atmos. 2006, 111, D09S15. [Google Scholar] [CrossRef] [Green Version]
  36. Tobin, D.C.; Revercomb, H.E.; Knuteson, R.O.; Lesht, B.M.; Strow, L.L.; Hannon, S.E.; Feltz, W.F.; Moy, L.A.; Fetzer, E.J.; Cress, T.S. Atmospheric Radiation Measurement Site Atmospheric State Best Estimates for Atmospheric Infrared Sounder Temperature and Water Vapor Retrieval Validation. J. Geophys. Res. Atmos. 2006, 111, D09S14. [Google Scholar] [CrossRef] [Green Version]
  37. Sedlar, J.; Tjernström, M. A Process-Based Climatological Evaluation of AIRS Level 3 Tropospheric Thermodynamics over the High-Latitude Arctic. J. Appl. Meteorol. Climatol. 2019, 58, 1867–1886. [Google Scholar] [CrossRef]
  38. Devasthale, A.; Willén, U.; Karlsson, K.-G.; Jones, C.G. Quantifying the Clear-Sky Temperature Inversion Frequency and Strength over the Arctic Ocean during Summer and Winter Seasons from AIRS Profiles. Atmos. Chem. Phys. 2010, 10, 5565–5572. [Google Scholar] [CrossRef] [Green Version]
  39. Pavelsky, T.M.; Boé, J.; Hall, A.; Fetzer, E.J. Atmospheric Inversion Strength over Polar Oceans in Winter Regulated by Sea Ice. Clim. Dyn. 2011, 36, 945–955. [Google Scholar] [CrossRef]
  40. Thomas, M.A.; Devasthale, A.; Tjernström, M.; Ekman, A.M.L. The Relation Between Aerosol Vertical Distribution and Temperature Inversions in the Arctic in Winter and Spring. Geophys. Res. Lett. 2019, 46, 2836–2845. [Google Scholar] [CrossRef] [Green Version]
  41. Chang, L.; Feng, G.; Zhang, Y.; He, X. Effect of Cloud Fraction on Arctic Low-Level Temperature Inversions in AIRS Observations Over Both Land and Ocean. IEEE Trans. Geosci. Remote Sens. 2018, 56, 2025–2032. [Google Scholar] [CrossRef]
  42. Ding, F.; Iredell, L.; Theobald, M.; Wei, J.; Meyer, D. PBL Height From AIRS, GPS RO, and MERRA-2 Products in NASA GES DISC and Their 10-Year Seasonal Mean Intercomparison. Earth Space Sci. 2021, 8, e2021EA001859. [Google Scholar] [CrossRef]
  43. Aumann, H.H.; Chahine, M.T.; Gautier, C.; Goldberg, M.D.; Kalnay, E.; McMillin, L.M.; Revercomb, H.; Rosenkranz, P.W.; Smith, W.L.; Staelin, D.H.; et al. AIRS/AMSU/HSB on the Aqua Mission: Design, Science Objectives, Data Products, and Processing Systems. IEEE Trans. Geosci. Remote Sens. 2003, 41, 253–264. [Google Scholar] [CrossRef] [Green Version]
  44. Wong, S.; Fetzer, E.J.; Schreier, M.; Manipon, G.; Fishbein, E.F.; Kahn, B.H.; Yue, Q.; Irion, F.W. Cloud-Induced Uncertainties in AIRS and ECMWF Temperature and Specific Humidity. J. Geophys. Res. Atmos. 2015, 120, 1880–1901. [Google Scholar] [CrossRef]
  45. Gettelman, A.; Weinstock, E.M.; Fetzer, E.J.; Irion, F.W.; Eldering, A.; Richard, E.C.; Rosenlof, K.H.; Thompson, T.L.; Pittman, J.V.; Webster, C.R.; et al. Validation of Aqua Satellite Data in the Upper Troposphere and Lower Stratosphere with in Situ Aircraft Instruments. Geophys. Res. Lett. 2004, 31, L22107. [Google Scholar] [CrossRef] [Green Version]
  46. Immler, F.J.; Dykema, J.; Gardiner, T.; Whiteman, D.N.; Thorne, P.W.; Vömel, H. Reference Quality Upper-Air Measurements: Guidance for Developing GRUAN Data Products. Atmos. Meas. Tech. 2010, 3, 1217–1231. [Google Scholar] [CrossRef] [Green Version]
  47. Dirksen, R.J.; Bodeker, G.E.; Thorne, P.W.; Merlone, A.; Reale, T.; Wang, J.; Hurst, D.F.; Demoz, B.B.; Gardiner, T.D.; Ingleby, B.; et al. Managing the Transition from Vaisala RS92 to RS41 Radiosondes within the Global Climate Observing System Reference Upper-Air Network (GRUAN): A Progress Report. Geosci. Instrum. Methods Data Syst. 2020, 9, 337–355. [Google Scholar] [CrossRef]
  48. Kawai, Y.; Katsumata, M.; Oshima, K.; Hori, M.E.; Inoue, J. Comparison of Vaisala Radiosondes RS41 and RS92 Launched over the Oceans from the Arctic to the Tropics. Atmos. Meas. Tech. 2017, 10, 2485–2498. [Google Scholar] [CrossRef] [Green Version]
  49. Sun, B.; Reale, A.; Seidel, D.J.; Hunt, D.C. Comparing Radiosonde and COSMIC Atmospheric Profile Data to Quantify Differences among Radiosonde Types and the Effects of Imperfect Collocation on Comparison Statistics. J. Geophys. Res. Atmos. 2010, 115, D23104. [Google Scholar] [CrossRef] [Green Version]
  50. Diao, M.; Jumbam, L.; Sheffield, J.; Wood, E.F.; Zondlo, M.A. Validation of AIRS/AMSU-A Water Vapor and Temperature Data with in Situ Aircraft Observations from the Surface to UT/LS from 87°N–67°S. J. Geophys. Res. Atmos. 2013, 118, 6816–6836. [Google Scholar] [CrossRef] [Green Version]
  51. Yan, X.; Wright, J.S.; Zheng, X.; Livesey, N.J.; Vömel, H.; Zhou, X. Validation of Aura MLS Retrievals of Temperature, Water Vapour and Ozone in the Upper Troposphere and Lower–Middle Stratosphere over the Tibetan Plateau during Boreal Summer. Atmos. Meas. Tech. 2016, 9, 3547–3566. [Google Scholar] [CrossRef] [Green Version]
  52. Yue, Q.; Lambrigtsen, B. AIRS Version 7 Level 2 Performance Test and Validation Report; Jet Propulsion Laboratory, California Institute of Technology: Pasadena, CA, USA, 2020. [Google Scholar]
  53. Rodgers, C.D.; Connor, B.J. Intercomparison of Remote Sounding Instruments. J. Geophys. Res. Atmos. 2003, 108, 4116. [Google Scholar] [CrossRef] [Green Version]
  54. Maddy, E.S.; Barnet, C.D. Vertical Resolution Estimates in Version 5 of AIRS Operational Retrievals. IEEE Trans. Geosci. Remote Sens. 2008, 46, 2375–2384. [Google Scholar] [CrossRef]
  55. Arai, K.; Liang, X.M. Sensitivity Analysis for Air Temperature Profile Estimation Methods around the Tropopause Using Simulated Aqua/AIRS Data. Adv. Space Res. 2009, 43, 845–851. [Google Scholar] [CrossRef]
  56. Zhang, L.; Ding, M.; Bian, L.; Li, J. Validation of AIRS Temperature and Ozone Profiles over Antarctica. Chin. J. Geophys. 2020, 63, 1318–1331. (In Chinese) [Google Scholar]
  57. Kahn, B.H.; Chahine, M.T.; Stephens, G.L.; Mace, G.G.; Marchand, R.T.; Wang, Z.; Barnet, C.D.; Eldering, A.; Holz, R.E.; Kuehn, R.E.; et al. Cloud Type Comparisons of AIRS, CloudSat, and CALIPSO Cloud Height and Amount. Atmos. Chem. Phys. 2008, 8, 1231–1248. [Google Scholar] [CrossRef] [Green Version]
  58. Nalli, N.R.; Barnet, C.D.; Maddy, E.S.; Gambacorta, A. On the Angular Effect of Residual Clouds and Aerosols in Clear-Sky Infrared Window Radiance Observations: Sensitivity Analyses. J. Geophys. Res. Atmos. 2012, 117, D12208. [Google Scholar] [CrossRef]
  59. Nalli, N.R.; Barnet, C.D.; Gambacorta, A.; Maddy, E.S.; Xie, H.; King, T.S.; Joseph, E.; Morris, V.R. On the Angular Effect of Residual Clouds and Aerosols in Clear-Sky Infrared Window Radiance Observations 2. Satellite Experimental Analyses. J. Geophys. Res. Atmos. 2013, 118, 1420–1435. [Google Scholar] [CrossRef] [Green Version]
  60. Yue, Q.; Fetzer, E.J.; Kahn, B.H.; Wong, S.; Manipon, G.; Guillaume, A.; Wilson, B. Cloud-State-Dependent Sampling in AIRS Observations Based on CloudSat Cloud Classification. J. Clim. 2013, 26, 8357–8377. [Google Scholar] [CrossRef]
  61. Shupe, M.D. Clouds at Arctic Atmospheric Observatories. Part II: Thermodynamic Phase Characteristics. J. Appl. Meteorol. Climatol. 2011, 50, 645–661. [Google Scholar] [CrossRef]
  62. Sotiropoulou, G.; Tjernström, M.; Sedlar, J.; Achtert, P.; Brooks, B.J.; Brooks, I.M.; Persson, P.O.G.; Prytherch, J.; Salisbury, D.J.; Shupe, M.D.; et al. Atmospheric Conditions during the Arctic Clouds in Summer Experiment (ACSE): Contrasting Open Water and Sea Ice Surfaces during Melt and Freeze-Up Seasons. J. Clim. 2016, 29, 8721–8744. [Google Scholar] [CrossRef] [Green Version]
  63. Devasthale, A.; Sedlar, J.; Kahn, B.H.; Tjernström, M.; Fetzer, E.J.; Tian, B.; Teixeira, J.; Pagano, T.S. A Decade of Spaceborne Observations of the Arctic Atmosphere: Novel Insights from NASA’s AIRS Instrument. Bull. Am. Meteorol. Soc. 2016, 97, 2163–2176. [Google Scholar] [CrossRef]
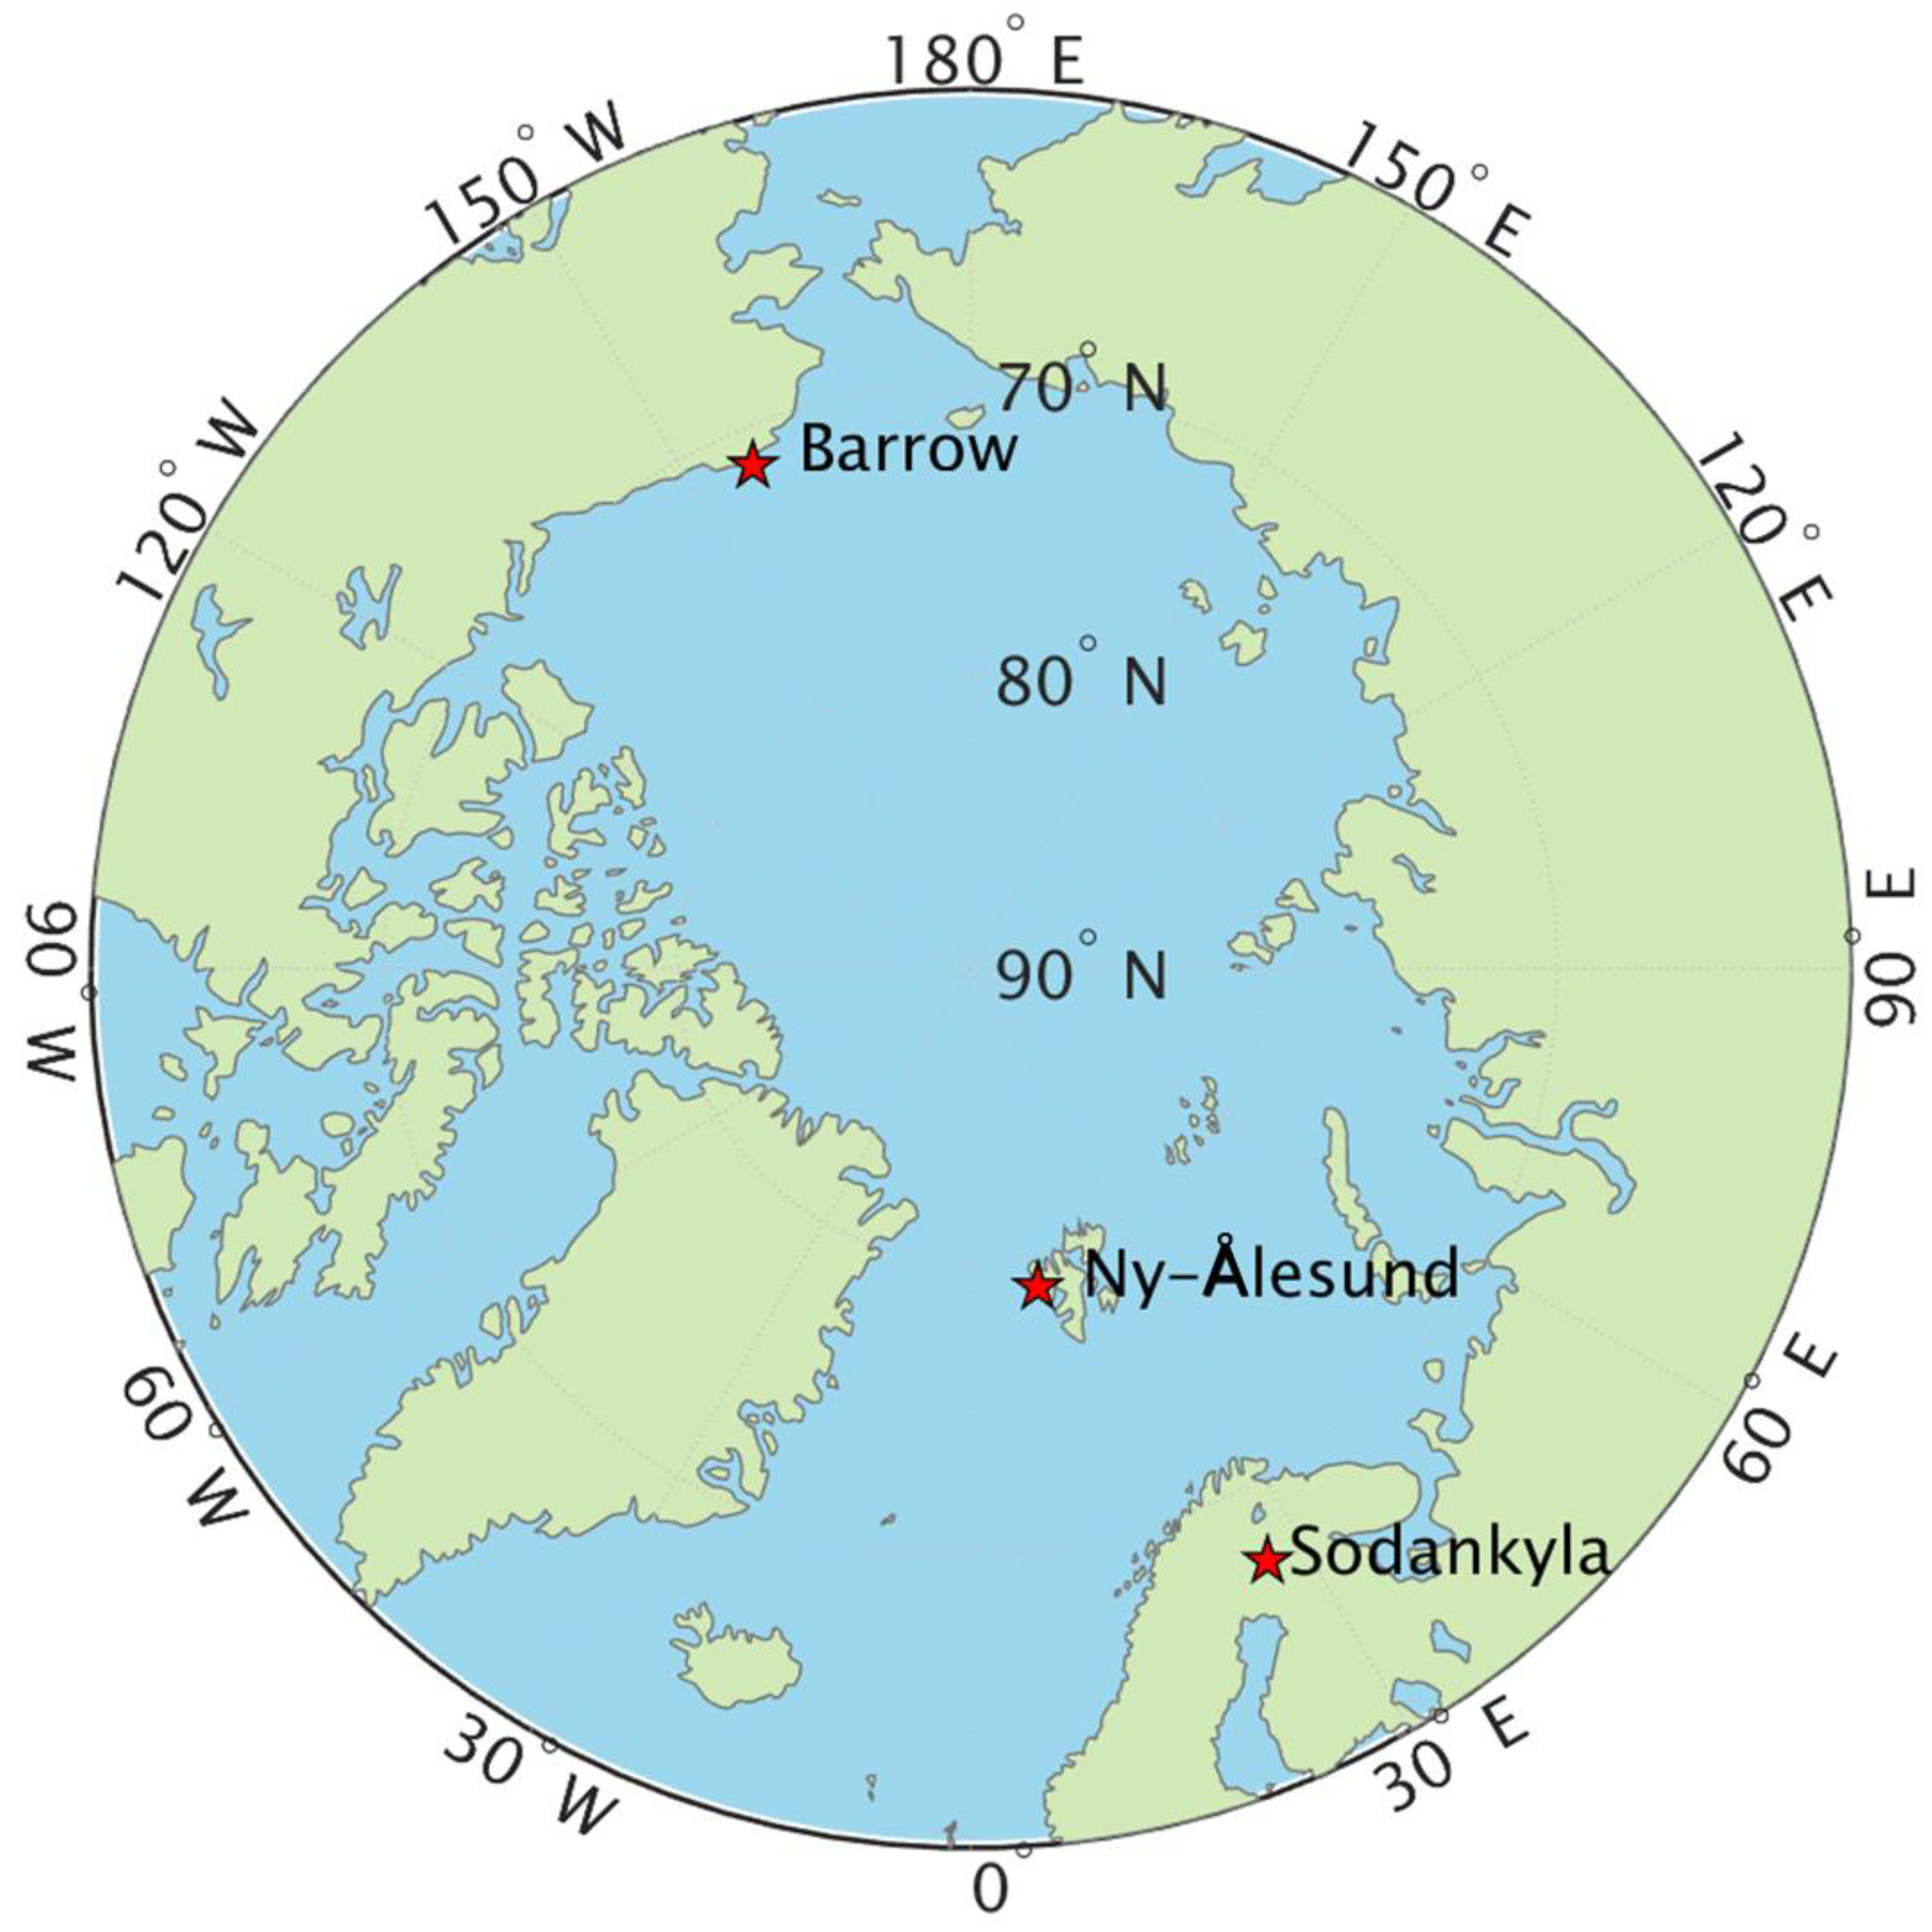
Figure 1. The GRUAN radiosonde stations in the Arctic. The red stars denote the locations of the sites.
Remotesensing 15 01270 g001
Figure 2. Flowchart of the producing the kerned sonde profiles using the AIRS averaging kernel.
Remotesensing 15 01270 g002
Figure 3. The mean, median, and root mean square biases for the AIRS v6 (a) and v7 (b) temperature profiles relative to simultaneous radiosonde measurements as a function of pressure averaged over 3 Arctic radiosonde sounding sites. The sonde temperature profiles are interpolated to the AIRS pressure levels using the corresponding AIRS averaging kernel. The 1σ variation (interquartile range) is shaded in blue (red).
Remotesensing 15 01270 g003
Figure 4. Seasonal variation in the mean bias profiles for AIRS v6 and v7 and the 3 GRUAN Arctic sites and their average using data from 2012 to 2016. Data are grouped into 12 bins, and the results are presented as a function of pressure at each bin’s center point. The green and magenta lines show the pressure of the tropopause and boundary layer top estimated from AIRS retrievals, respectively. The result is statistically significant (t-test, p < 0.05).
Remotesensing 15 01270 g004
Figure 5. Same as in Figure 4, but for RMS errors between the RS92 and AIRS v6 (upper) and v7 (lower) temperature profiles.
Remotesensing 15 01270 g005
Figure 6. Same as in Figure 4, but for correlation coefficients between the RS92 and AIRS v6 (upper) and v7 (lower) temperature profiles.
Remotesensing 15 01270 g006
Figure 7. LLI detection agreement between the AIRS and the kerned sonde products. The label “AIRS-YES and SONDE-YES” indicates the matched profiles where both the AIRS and the sonde detected an LLI. The label “AIRS-NO and SONDE-YES” indicates the matched profiles where the AIRS did not detect an LLI, but the sonde did. The blue, orange, and green bars each represent the results of the three stations.
Remotesensing 15 01270 g007
Figure 8. Comparisons of LLI depths and intensities. The frequency distributions of LLI intensity and depth are shown in panels (a,b) using bin sizes of 5 °C and 300 m, respectively. The correlations of LLI intensities and depths between the AIRS v6 and kerned sonde profiles are shown in panels (c,d). The identity (1:1) line is shown in a black chain line, and a line representing linear regression is shown in red. Regression statistics are also shown.
Remotesensing 15 01270 g008
Figure 9. The mean bias of the AIRS temperature profiles as a function of the AIRS ECF over different subclasses. The results for v6 are shown in the top row and those for v7 in the bottom row. The columns from left to right represent retrievals over nonfrozen land, frozen land, and sea ice, respectively.
Remotesensing 15 01270 g009
Figure 10. Similar to Figure 9 but showing the RMS error results.
Remotesensing 15 01270 g010
Disclaimer/Publisher’s Note: The statements, opinions and data contained in all publications are solely those of the individual author(s) and contributor(s) and not of MDPI and/or the editor(s). MDPI and/or the editor(s) disclaim responsibility for any injury to people or property resulting from any ideas, methods, instructions or products referred to in the content.