Article

GOCE Downward Continuation to the Earth’s Surface and Improvements to Local Geoid Modeling by FFT and LSC

by
Dimitrios A. Natsiopoulos
,
Elisavet G. Mamagiannou
,
Eleftherios A. Pitenis
,
Georgios S. Vergos
* and
Ilias N. Tziavos
Laboratory of Gravity Field Research and Applications (GravLab), Department of Geodesy and Surveying, Aristotle University of Thessaloniki, University Box 440, GR 54124 Thessaloniki, Greece
*
Author to whom correspondence should be addressed.
Remote Sens. 2023, 15(4), 991; https://doi.org/10.3390/rs15040991
Submission received: 13 January 2023 / Revised: 6 February 2023 / Accepted: 7 February 2023 / Published: 10 February 2023

Abstract

:
One of the main applications of the gravity field and steady-state Ocean Circulation Explorer (GOCE) satellite data is their combination with local gravity anomalies for geoid and gravity field modeling purposes. The aim of the present paper was the determination of an improved geoid model for the wider Hellenic area, using original GOCE SGG data filtered to retain only useful signals inside the measurement bandwidth (MBW) of the satellite. The filtered SGGs, originally at the satellite altitude, were projected to a mean orbit (MO) and then downward continued to the Earth’s surface (ES) in order to be combined with local gravity anomalies. For the projection to an MO, grids of disturbing gravity gradients from a global geopotential model (GGM) were used, computed per 1 km from the maximum satellite altitude to that of the MO. The downward continuation process was then undertaken using an iterative Monte Carlo (MC) simulated annealing method with GGM gravity anomalies on the ES used as ground truth data. The final geoid model over the wider Hellenic area was estimated, employing the remove–compute–restore method and both Fast Fourier Transform (FFT) and Least Squares Collocation (LSC). Gravity-only, GOCE-only and combined models using local gravity and GOCE data were determined and evaluation of the results was carried out against available GNSS/levelling data in the study area. From the results achieved, it was concluded that even when FFT is used, so that a combined grid of local gravity and GOCE data is used, improvements to the differences regarding GNSS/levelling data by 14.53% to 27.78% can be achieved. The geoid determination with LSC was focused on three different areas over Greece, with different characteristics in the topography and gravity variability. From these results, improvements from 14.73%, for the well-surveyed local data of Thessaly, to 32.88%, over the mountainous area of Pindos, and 57.10% for the island of Crete for 57.10% were found.

1. Introduction

The state-of-the-art Gravity field and steady-state Ocean Circulation Explorer (GOCE) satellite mission has contributed significantly during its lifespan, from 2009 to 2013, to a better understanding of the Earth’s gravity field and geoid, employing satellite gravity gradiometry [1,2]. GOCE products have been extensively used throughout the last decade in fields as diverse as solid-Earth physics, glaciology and oceanography [3]. The main application of GOCE data though has been their use in geodesy for the purpose of geoid determination [4], where accuracies as high as 1–2 cm, for wavelengths of ~100 km, are achievable [3]. GOCE data have been used mainly for continuous improvements in the determination of Global Geopotential Models (GGMs) [5] and for regional geoid and potential determination, in terms of reductions in gravity observables [6,7,8,9,10,11,12,13] and the long-wavelength estimation of vertical datum offsets [14,15,16,17,18,19,20,21]. Nevertheless, until now, little effort has been put in the possible exploitation of GOCE data through their direct collocated use with in situ gravity data for geoid determination. The exploitation of the GOCE satellite observables requires their reduction to a mean orbit, as in the case of the space-wise approach [22,23], a method used for computation of GOCE-based gravity field models that takes advantage of the spatial correlation of the gradients by projecting them in grid form at a mean satellite altitude. GOCE satellite observations can be employed in terms of spherical harmonic expansions of the gravity field, which is their most common application in the geodetic literature, and in the form of grids at some altitude [24]. Moreover, they can be directly used in the space domain [4], utilizing a downward continuation process. Following the ever-developing availability of satellite data during the last few decades, various upward/downward continuation methodologies have been proposed for potential field data [25], which mainly concern the Poisson integral. Specifically, the use of the Poisson integral for the downward continuation of GOCE data was studied by [4,26], regarding both theoretical and practical limitations of the method, while an iterative downward continuation process, taking advantage both of the Poisson integral and the Fourier transform, was developed by [25]. In [27], GOCE data at the satellite level were combined with local gravity and altimetry data using spherical radial basis functions, with Poison wavelets as the basis functions for regional gravity field recovery. Further, [28] employed the European Space Agency’s (ESA) recently compiled PolarGAP gravity campaign, for determination following a point mass modeling method and variance component estimation to derive the IGT_R1C GGM. Different analysis using Input–Output Systems Theory (IOST) [29,30] along with an iterative Monte Carlo (MC) simulated annealing method for regional gravity recovery has also been suggested [31], which is the one examined in the present paper. Studies have shown, moreover, that the use of terrestrial gravity data in the case of calibrating GOCE Satellite Gravity Gradiometry (SGG) data [32], specifically, has interesting implications for their upward/downward continuation in different surfaces. After the downward continuation of GOCE data, the main goal of this paper is to employ them in classic geoid determination with local gravity anomalies, using spectral, Fast Fourier Transform (FFT) and stochastic, Least Squares Collocation (LSC)-based methods. The aim is to investigate whether GOCE observables can contribute not only to global gravity and geoid improvements, at long to medium wavelengths on the spectrum, but also to improvements in local geoid determination.

2. SGG Data Filtering and Reduction to a Mean Orbit

In the present study, the data used were original Level 2 GOCE gravity gradients, for the entire duration of the mission, and specifically EGG_NOM_2 and SST_PSO_2 products [33], available from ESA’s GOCE Online Dissemination Service (https://goce-ds.eo.esa.int/oads/access/collection/GOCE_Level_2 Accessed on 7 January 2020). Considering that the measured gravity gradients are affected by noise outside the Measurement Bandwidth (MBW) of the satellite (from 0.005 Hz to 0.1 Hz), filtering was applied to retain only useful signals and remove undesirable noise. The design of the various filters tested, the analytical results and their evaluation are presented in [34]. For the filtering to be carried out, first, the GOCE SGG data were inspected for gross errors, flags in the records and gaps, as outlined in [34,35]. Then, residual gravity gradients were constructed after subtracting the contribution on a combined GO_CONS_GCF_2_TIM_R6 [36] and EGM2008 [37] GGM as:
V i j r e s   = V i j G O C E V i j T I M   R 6 165 V i j E G M 2008 166 2190 ,
In Equation (1), V i j r e s   denotes the residuals, V i j G O C E GOCE observations and V i j T I M   R 6 165 ,   V i j E G M 2008 166 2190 the contributions of the GO_CONS_GCF_2_TIM_R6 GGM to degree and order 165 and that of EGM2008 from degree and order 166 to 2190, respectively. As mentioned in [34], the selection of the particular GGMs for the construction of the residual gravity gradients was based on evaluation performed against GNSS/levelling data over Greece. Note that all the computations are performed in the Gradiometer Reference Frame (GRF); hence, the GGM contribution computed in the Local North-Oriented Frame (LNOF) are transformed into the GRF. This is important, since in order to construct the residuals, both the GOCE and GGM contributions should be in the same frame. It is preferable to not transform the GOCE SGG data from the GRF to the LNOF prior to filtering, as in that case, the errors from the less-accurate components V x y G O C E and V y z G O C E would propagate to the other ones. From the various filtering techniques tested, an FIR filter with order 1500 was the one deemed to provide the overall best results, while the filtering was carried out with the newly developed GeoGravGOCE software [35]. Once the filtering is completed, the removed contribution of the GGM combination is restored so that, finally, filtered GOCE gradients are available. The filtered SGGs were then transformed from the GRF to the Earth Centered Earth Fixed (ECEF) and the LNOF [38] and converted to derivatives of disturbing potential ( T i j ) by subtracting gravity gradients ( V ¯ i j ) based on a GRS80 normal gravity field [39].
The reduction in GOCE SGG data from the satellite altitude to a mean orbit (MO) is a necessary procedure before their downward continuation to the Earth’s surface (ES) [4,31,40]. In the geodetic literature, a handful of methodologies have been proposed for this purpose, such as the use of Taylor expansion of the gravity gradients in the radial direction for radial distances of projection up to 10 km [41] and the 5-point stencil one [25,42].
In this study, and in order to reduce the GOCE filtered data to an MO, the Taylor expansion described in [41] was used. According to that, the reduction to a mean sphere can be performed as:
V i j s p h e r e   φ , λ , r s p h e r e = V i j o b s φ , λ , r + V i j o b s φ , λ , r r d r + 1 2 2 V i j o b s φ , λ , r 2 r + ,
where V i j o b s φ , λ , r and V i j s p h e r e   φ , λ , r s p h e r e refer to the original filtered GOCE gradients and the projected ones on the MO, and r and r s p h e r e refer to the respective geocentric distance. Note that in Equation (2), the magnitude of the projection distance d r = r r s p h e r e is crucial, since for values larger than 10 km, higher-order terms are needed, while according to [41], for smaller values, the effect of the quadratic term in Equation (2) is negligible. Since a low MO of 230 km was selected, and given that the original GOCE data reach satellite heights of up to ~290 km, the actual evaluation for each GOCE observable was not performed directly from the satellite altitude to 230 km. On the other hand, what was carried out was a piecewise reduction per km from the original altitude down to the MO. This was in order to avoid performing the projection over large values of d r , to guarantee that no errors were introduced by neglecting high-order terms in Equation (2). Since a GGM is needed to provide the third-order derivatives in the EFRF with respect to the radial distance r , this was carried out by estimating the contribution of the GGM on grids of the disturbing gravity gradients ( T i j ) at different altitudes at a 5 × 5 spatial resolution per 1 km, from the maximum GOCE height (approximately 296 km) to that of the MO (230 km). This procedure was carried out with GrafLab software [43] using the GO_CONS_GCF_2_TIM_R6 model [36] to its maximum degree and order (d/o) of expansion of 300. Note that, in this procedure, first, the projection is performed from the satellite altitude to the next lower integer altitude (e.g., from 256.2 km to 256 km) and then from that per 1 km down to an MO of 230 km. This may seem cumbersome, since each third-order derivative needed in Equation (2) in [41] should be determined at the original altitude and then per 1 km on a grid. Nevertheless, given that we employed the entire record of GOCE data and the altitude variation was much larger than 10 km, we decided to follow this procedure. The gain is that after the projection from the original altitude to the next integer, one is performed; then, for every GOCE observation, the contribution of the GGM is given from the computed 5 × 5 grid after spline interpolation. It should be noted that GO_CONS_GCF_2_TIM_R6 uses GOCE data, but any correlations between that fact and the projection to an MO of SGG data is not relevant, as what we are seeking from the GGM is to provide information for the third-order derivatives in Equation (2). A similar experiment performed using XGM2019e, to its full d/o, to determine the projection to the MO, resulted in very small differences relative to the results with GO_CONS_GCF_2_TIM_R6, with standard deviations of between 0.02 mE and up to 0.81 mE (mili-Eötvös) (see also Table S1 in the Supplementary Materials), which is clearly negligible.
Figure 1 shows, for the three diagonal disturbing tensor components ( T x x , T y y , T z z ) , the variation per 1 km of the projection to the MO, as derived for the original GOCE data, while their statistics are summarized in Table 1. It can be seen that, for all terms, the mean value is zero, while the standard deviations are small, reaching a maximum of just 1.6 mE.
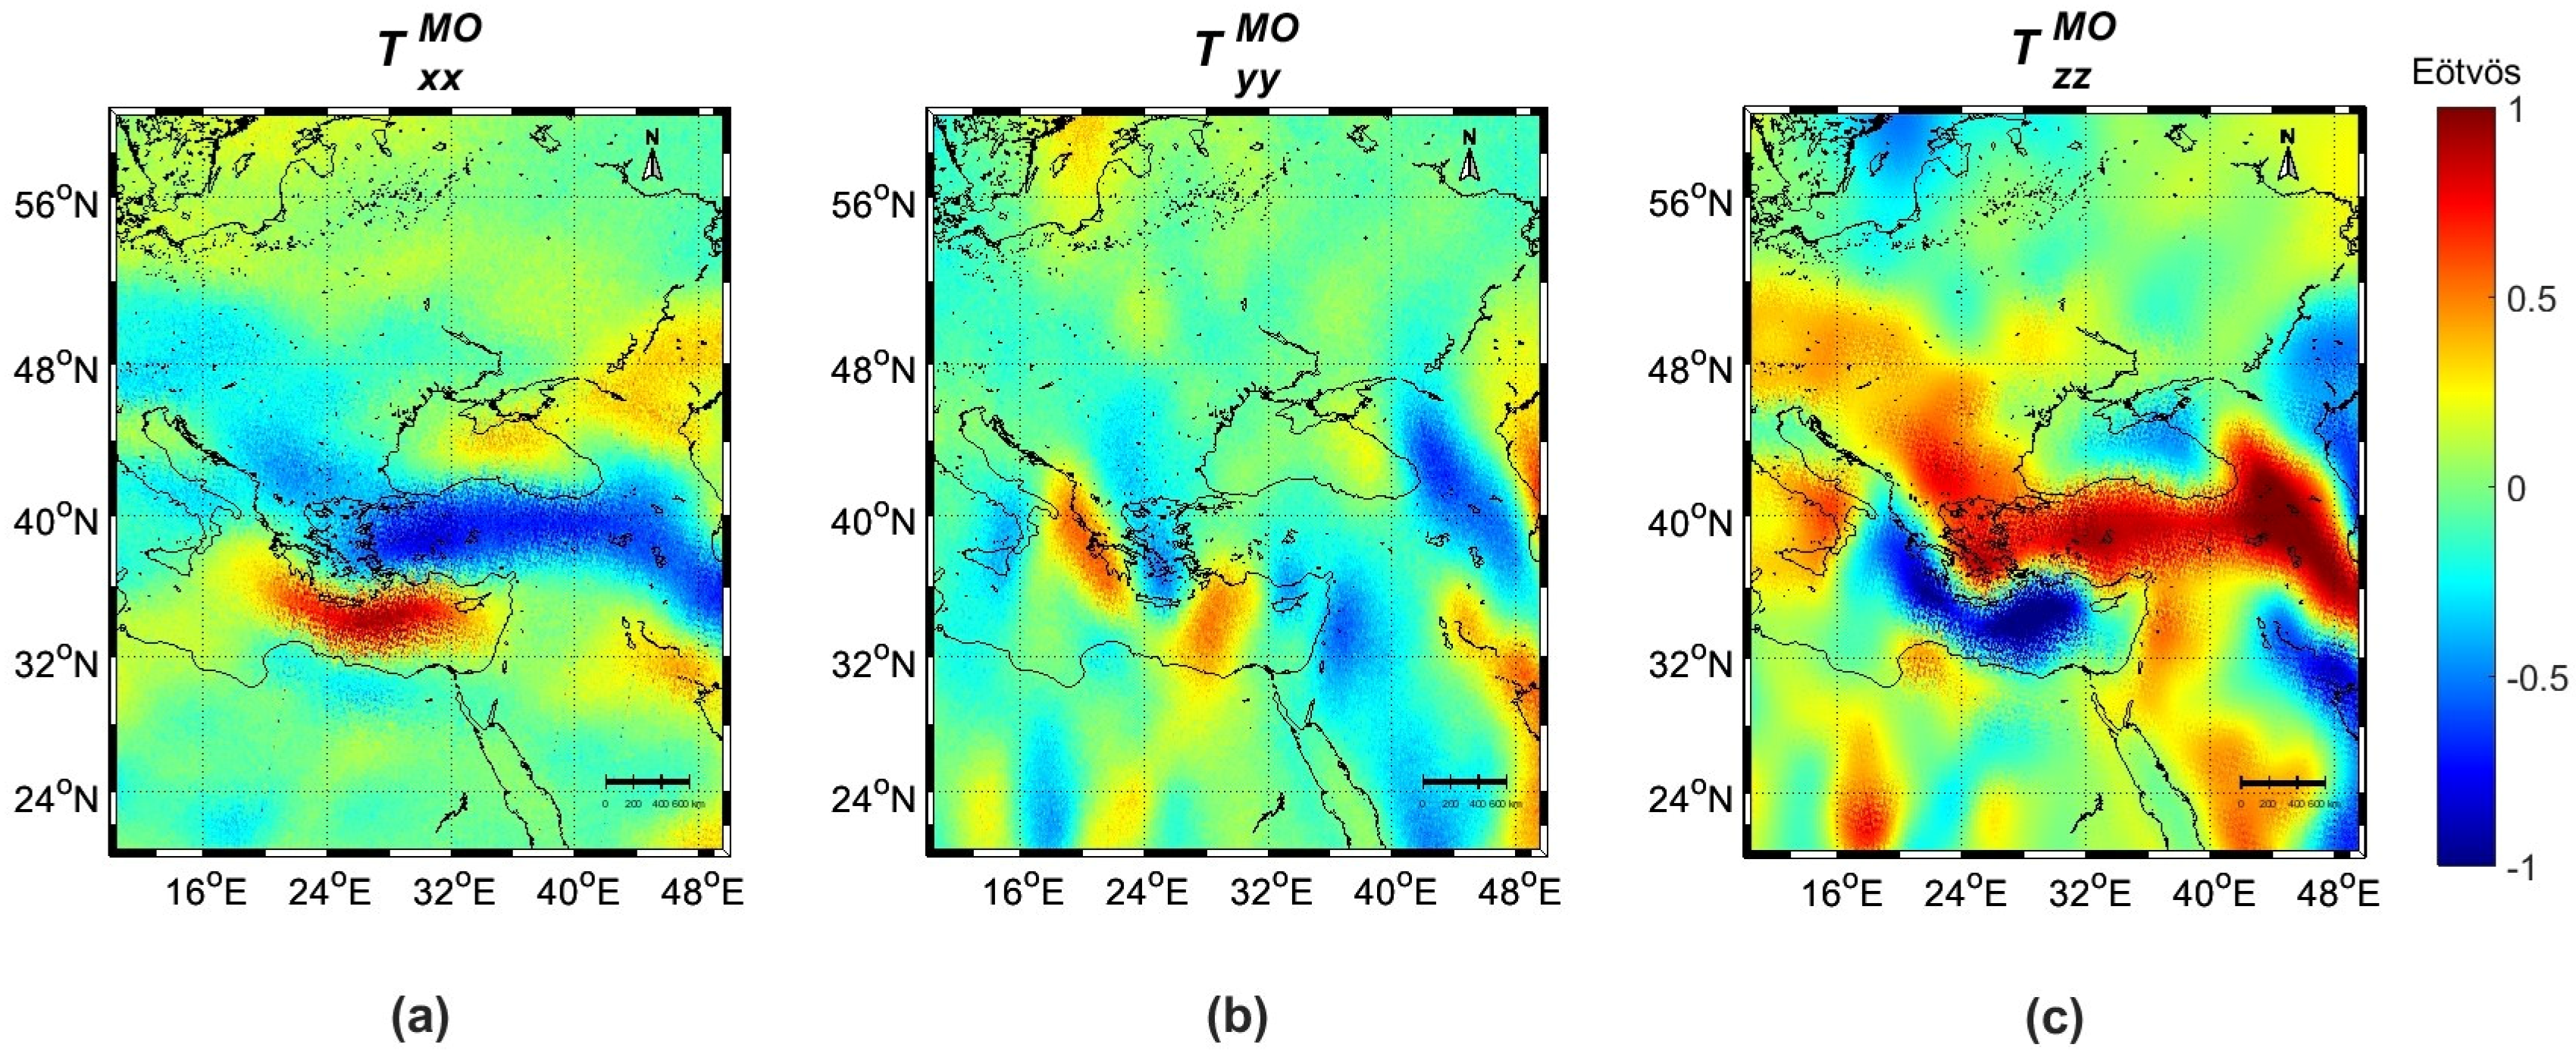
Thus, the filtered  T i j values at the original GOCE positions were projected from the satellite altitude to the mean orbit, while it should be noted that the projected to the MO data are the original filtered gradients of the disturbing potential. After their projection to the MO ( T i j M O ), they were gridded at a resolution of 1 × 1 globally. The present study focuses on the wider area of the Eastern Mediterranean Sea, where local gravity data for geoid determination are available; hence, in the following, all figures and statistics refer to that area. Figure 2 presents the projected to the MO gradients over the Eastern Mediterranean, which are ready to be downward continued to the Earth’s surface. The statistics of the T i j components, before and after the projection to the MO, i.e., to the satellite altitude and to the MO, are shown in detail in Table 2. As expected, the T z z and T x x components are the stronger ones at both the orbital height and the MO, while the ones at the MO have logically larger standard deviations due to the smaller distance to the attracting masses.

3. SGG Downward Continuation to the Earth’s Surface

Downward continuation (DC) is the operation of continuing a dataset along the vertical direction. It is an effective technique for transferring gravity field information measured from one height level to another lower one. Usually, DC is required when the observations do not refer to Earth’s surface and/or the geoid and is mainly used to combine heterogeneous data observed both on the ground and in space to model the Earth’s gravity field regionally. Another option is to combine the data directly at different height levels via, e.g., LSC based on the derived analytical covariance functions of the collocation solution. However, in the case of GOCE, this is impractical as there are too many available observations to handle within a reasonable processing time by LSC. Hence, our approach, for the investigation of the possible contribution of GOCE data to local geoid modeling through their combination with local gravity data, referred to their DC to the geoid Earth’s surface and then the geoid and their combination with local data at that level. DC of gravity-field-related data has been the focus of extensive research in physical geodesy during the last few decades, since it is a fundamental step to interpret the underlying attracting masses and, consequently, the Earth’s interior, and also determine local and regional geoid models. Many strategies for the DC of gravity data exist [4,26,44,45,46], which are generally divided to direct and iterative methods, with the key in the former being the regularization and, in the latter, the reference values that will form the threshold in order to stop the iteration. A more analytical discussion of the DC of gravity data and the used geodetic boundary value problems can be found in [45,47,48,49].

3.1. Iterative Approach for Downward Continuation

DC is an ill-posed problem [45,49,50], so that, in the present work, we employ an iterative method based on Monte Carlo (MC) simulation [51,52]. It is based on a simulated annealing probabilistic method [31,53,54] that can be used to solve problems numerically when it is too complicated to solve analytically. MC simulation is one of the most widespread methods that uses sequences of randomly uniformly distributed data to perform simulations and solve complex processes, such as the DC.
Within the MC algorithm, we define specific acceptance and rejection criteria in order to evaluate the iterations/trials and the method’s effectiveness. Usually, these criteria are the error probability and the root mean square error of the differences between the reference gravity field, coming from, e.g., a GGM or local gravity representations, and the GOCE DC gravity data. In the simulation, iterations are performed until the DC data are fitted to a certain threshold level of agreement with the ground true free-air gravity anomalies Δ g f , which, in the performed experiments, come from various GGMs and are generated with GrafLab software [16]. The GOCE downward continued and ground truth data are compared and evaluated in each iteration, so that the process is automatically stopped, when either a) a defined convergence criterion is satisfied or b) if there is no convergence at all when a selected number of iterations, set up arbitrarily at 10,000 iterations, is met.

3.2. Formulation of the Downward Continuation Problem

Poison’s integral is used to upward continue some gravity field functional from the geoid or the Earth’s surface to some height, so that the inverse Poison integral can be used to downward continue gravity data, SGG observations in our case, to some reference boundary surface, which is, in most cases, the Earth’s surface or the geoid. Therefore, the solution can be expressed in the form of the Poisson integral equation in spherical approximation [55]:
T r = 1 4 π Ω Τ r * Κ r , r * d Ω *
where r and r * are the unit vectors, Κ is the Poisson kernel and Ω * symbolizes the spherical coordinates φ , λ . DC is carried out using the inverse Poisson integral and its kernel function, which, in fact, links each value of T r at the MO to T r * on the Earth’s surface or the geoid over a regular grid. Note that, observing the kernel of such an integral, we can detect how significant the contribution of the data is in the frequency domain. The kernel function Κ can be written as the following Legendre expansion [4]:
Κ r , r * = l = 2 r * r l + 1 2 l + 1 P l r ^ · r ^ *  
where P l represents the Legendre polynomial and l is the degree of the Legendre polynomial expansion starting from degree two l = 2 , as the zero- and first-degree terms are absent. Various approaches to evaluate, among others, the Poison integral equations and their kernel function with closed formulas are extensively discussed in [56].
In the present work, we employ the Input Output System Theory (IOST) [29], which allows for the fast and efficient use of heterogeneous data to evaluate gravity-field- and geoid-related functionals. It has been used extensively in physical geodesy for geoid [57,58,59] and dynamic ocean topography determination [30,60] as an alternative to least squares collocation due to its efficiency in the fast evaluation of convolution integrals and the ability to handle large datasets [61,62]. The efficiency of IOST combined with the fact that the results of the iterations are controlled relative to a ground truth dataset are the main driving forces for utilizing the proposed methodology. IOST is used to evaluate, in the spectral domain, the upward/downward continuation [31] of GOCE gradients in order to relate the GOCE SGG data with the free-air gravity anomalies at the Earth’s surface and the geoid. This is performed by applying the two-dimensional Fast Fourier-transformation (FFT) operator F · to all terms of the Poisson integral equation. In this way, the downward continuation operator in the frequency domain can be expressed as [31]:
F T i j M O = F K i j M O , E S L T E S F L T E S
where T i j M O is the disturbing gradients at the MO along the axis i , j , K i j M O , E S represents the kernel function for each of the gradient components according to Equations 5(d), 6(d) and 7(c) in [63], L T E S is the functional of the disturbing gravity potential at the Earth’s surface, i.e., local and free-air gravity anomalies derived from GGMs, MO symbolizes the mean orbit, ES symbolizes the Earth’s surface and denotes the element-by-element multiplication. Within the context of the present work, the functional of the disturbing gravity potential at the ES ( L T E S ) is gravity anomalies, coming from some GGMs, which serve as ground truth, which, in the first step in the iteration, are upward continued with MIMOST, i.e., Equation (3), to the MO. For this upward continuation, the spectra of the kernel K i j M O , E S [63,64] for the transformation of the disturbing gravity potential at the ES ( L T E S ) to gradients at the MO are convolved, i.e., multiplied element by element in the frequency domain, with the spectra of L T E S , so that gradients at the MO are determined. These are compared with the GOCE SGG data, so that those that satisfy the simulated annealing threshold are frozen. In our study, this threshold is the root mean square of the differences, between the upward continued local gravity data and the SGG observations at the MO. In MIMOST, as in its equivalent LSC in the space domain, the relationship between the input data and the predicted functionals is performed through their respective auto- and cross-power spectral density functions (PSDs), as in the space domain through the auto- and cross-covariance functions [29,61,62,65]. The “frozen” observations are downward continued to the ES while the entire procedure is repeated for those GOCE gradients that did not satisfy the set threshold. As already mentioned, the iterative procedure continues until all observations at the MO meet the threshold criterion or a set number of repetitions are completed (see Section 3.1).

3.3. Numerical Experiments using GOCE Data

In this study, we investigate the DC of GOCE data by employing both the T z z M O disturbing tensor component and the synthesized T x x y y M O one, based on Laplace’s equation ( T x x M O + T y y M O + T z z M O = 0 )    [55]. Taking the T z z M O component as an example, the DC process was tested considering various sets of ground truth data Δ g f . This was deemed necessary in order to evaluate which set of ground truth data would provide the overall best results when performing the DC. Therefore, a set of experiments was performed, during which the input T z z M O data were downward continued from the MO of 230 km to the geoid, over an extended (40° × 40°) region around the Hellenic area, between 20°–60°N and 10°–50°E. For the simulations, 1 × 1 grids of free-air gravity anomalies Δ g f were generated based on the following GGMs: (a) TIM_R6 to degree and order (d/o) 200 [36], (b) TIM_R6 to d/o 250, (c) TIM_R6 to d/o 300, (d) EGM2008 to d/o 2190 [37] and (e) XGM2019e_2159 to d/o 2190 [66]. These GGMs were among the various choices to provide the ground truth free-air gravity anomalies, but were selected since they provide the overall best results over the study area [34,35,67,68].
In the first test, and in order to evaluate the performance of the DC algorithm, we used, as ground truth data, gravity anomalies from TIM-R6 to d/o 230 and, as a simulated SGG field to be downward continued, gradients from TIM-R6 at the MO of 230 km. Therefore, this is a closed-loop experiment where the input and output are stemmed from the same GGM; therefore, the effect of the upward/downward continuation can be evaluated. Within that frame, the free-air gravity anomalies are upward continued to the MO, compared to the TIM-R6-synthesized ones and then the DC is carried out. Table S2 summarizes the statistical values of the original TIM-R6 T z z M O data and the generated T z z g e n e r a t e d ones from the upward continuation of the free-air gravity anomalies, where it can be seen that in this upward continuation experiment, the results are replicated exactly, so there is no error introduced by the upward/downward continuation algorithm.
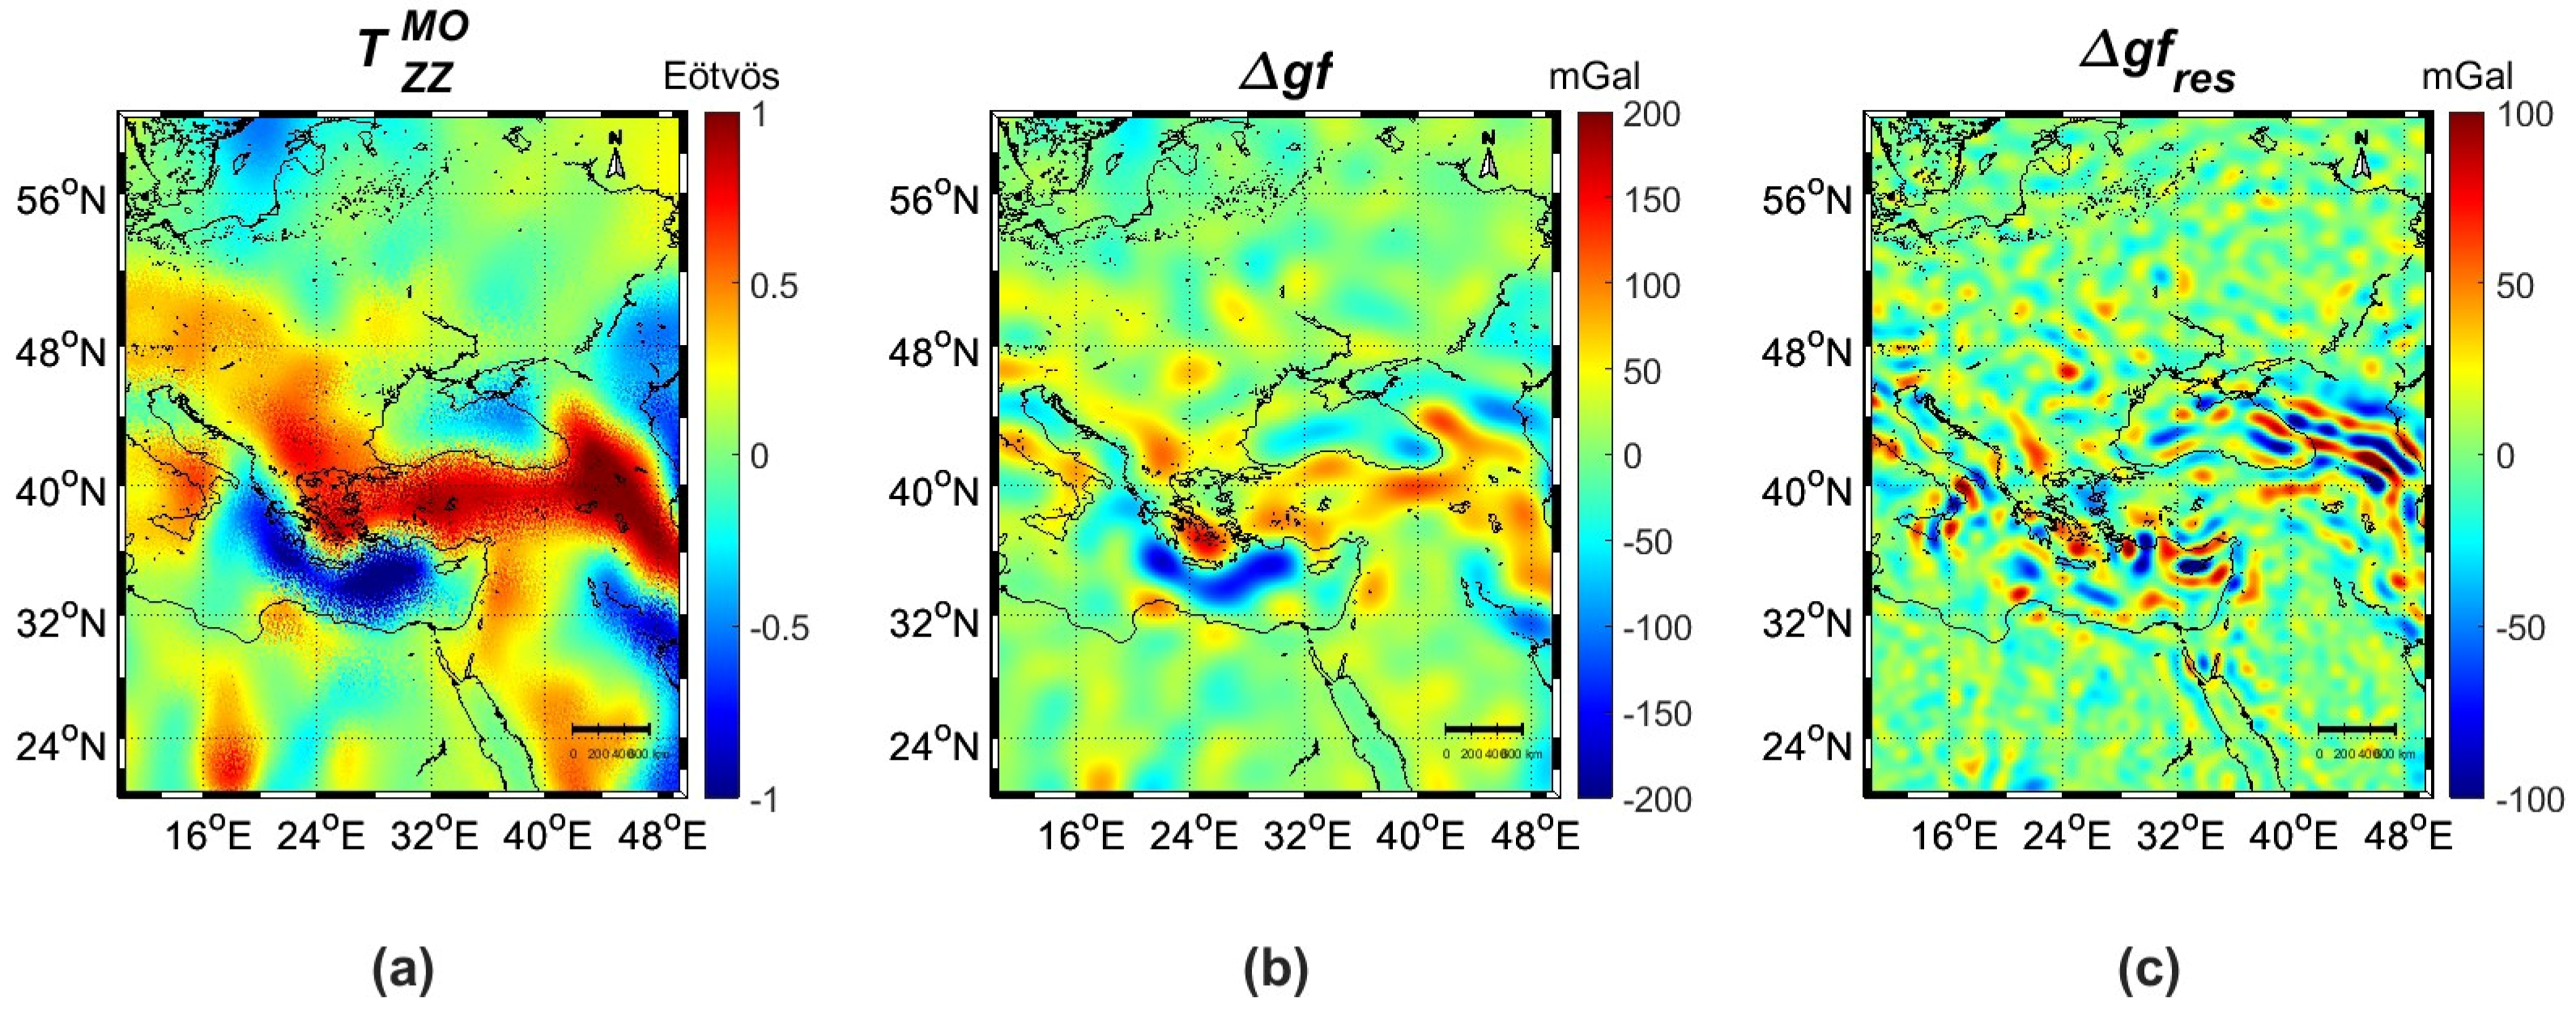
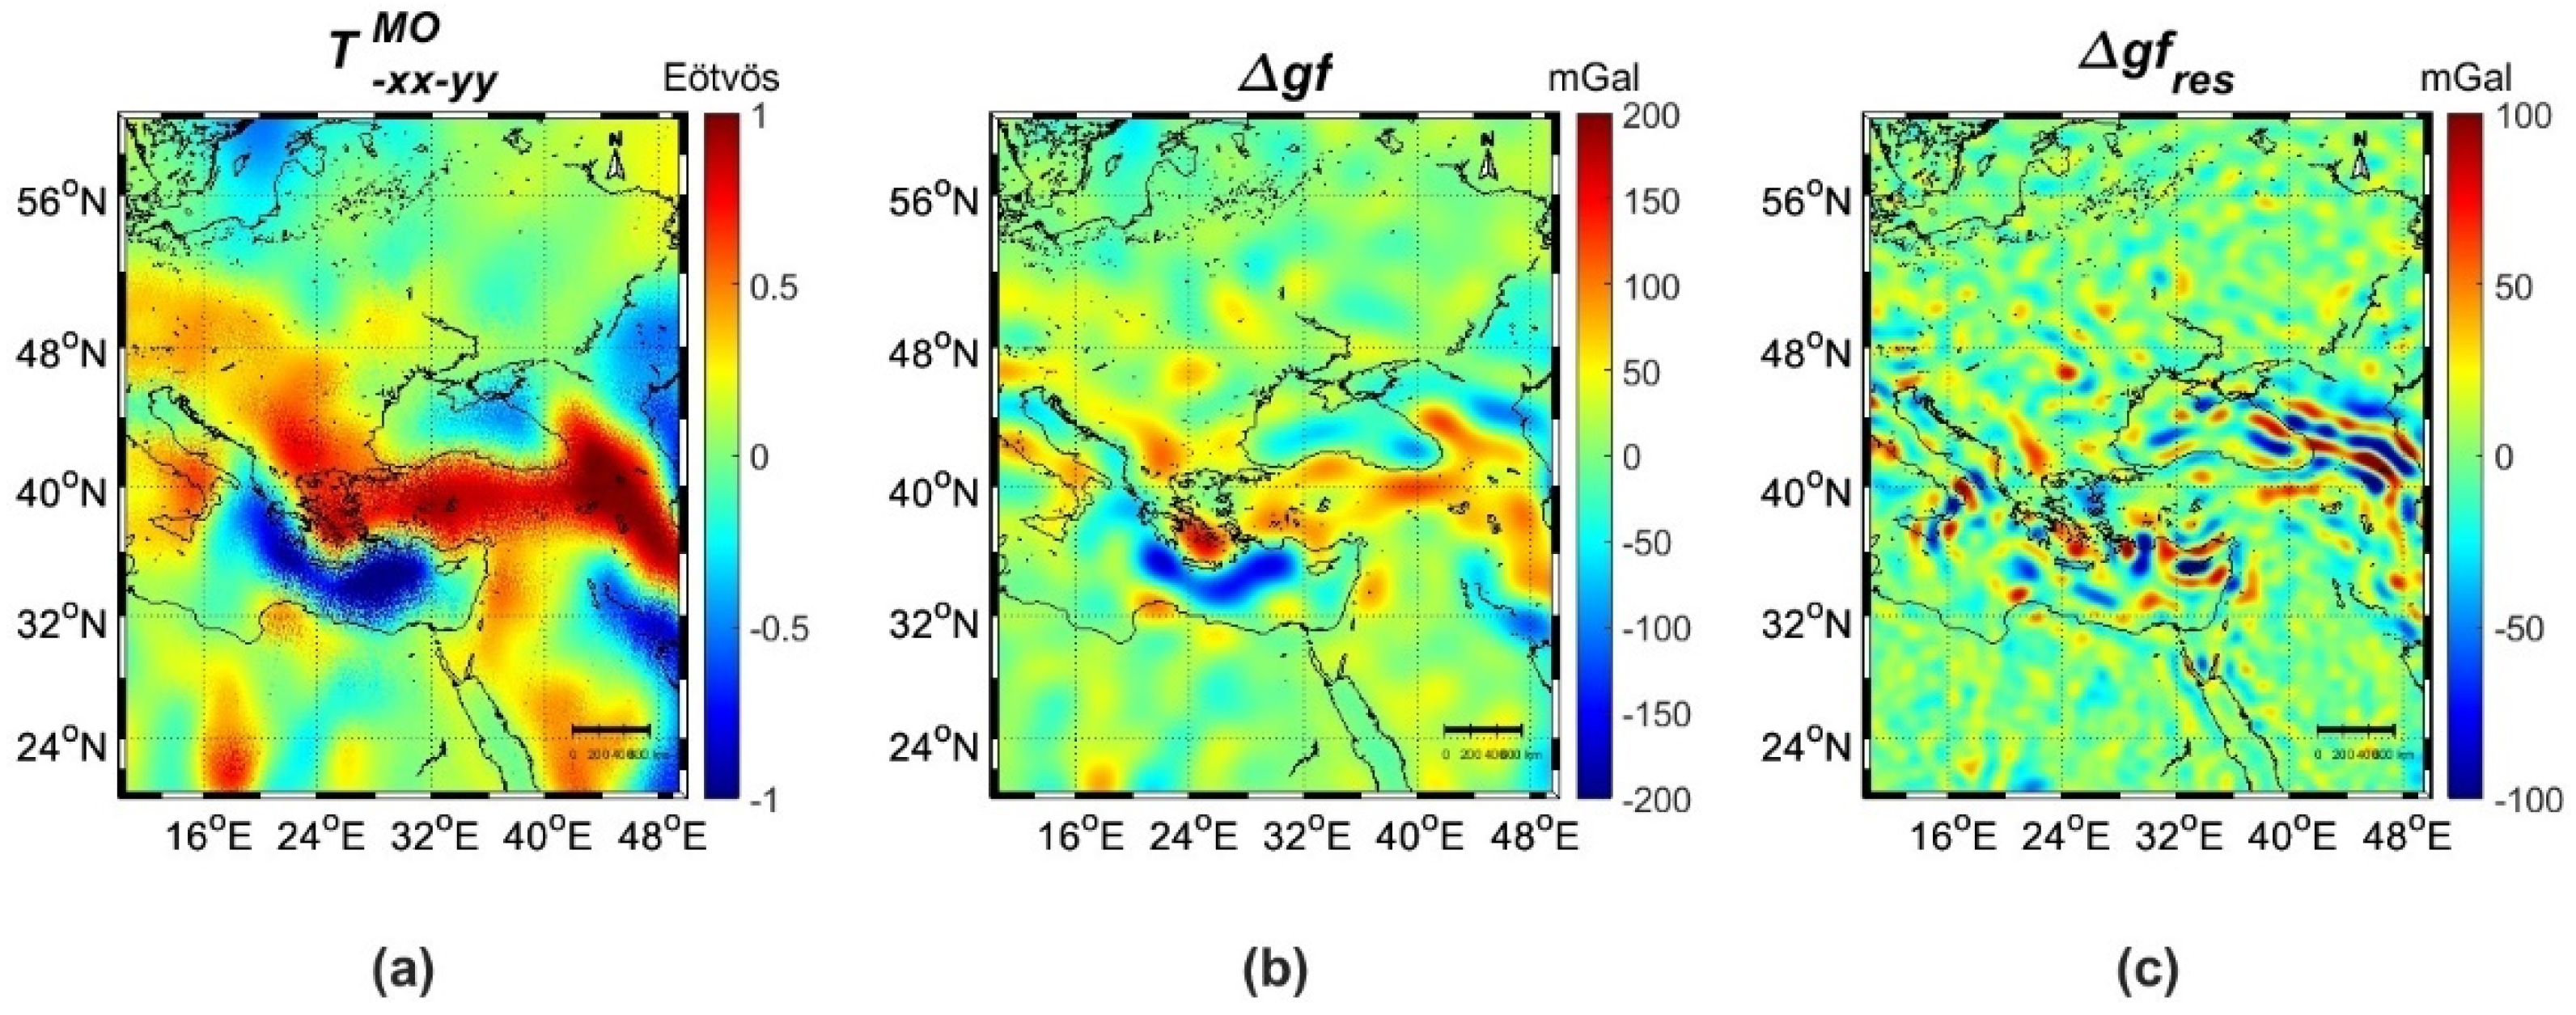
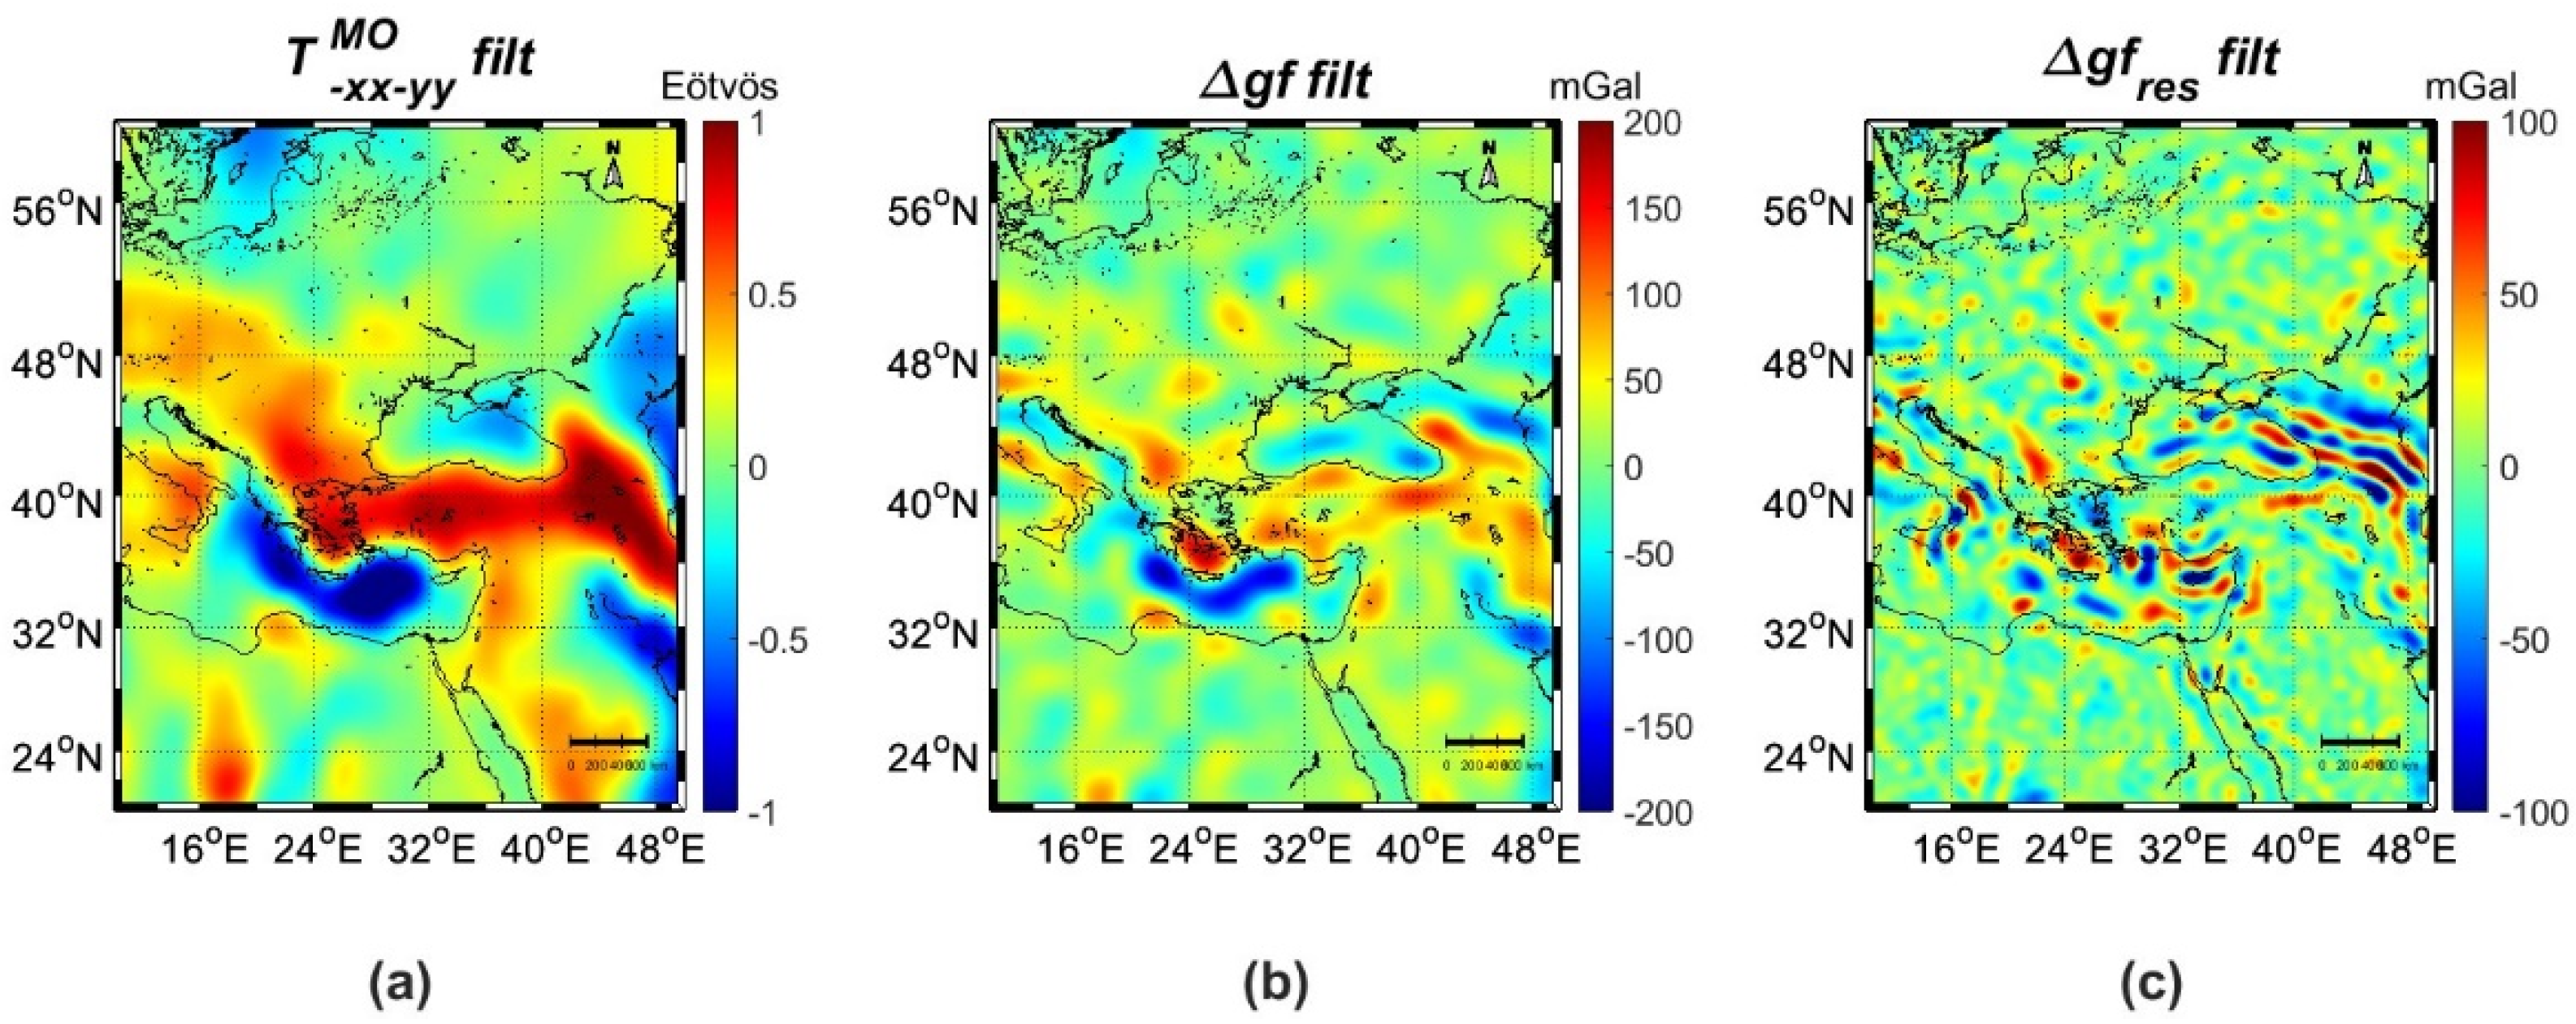
Following the verification of the algorithm, the DC of the real GOCE data to the MO was carried out using various choices of GGMs and d/o of expansion to provide the GOCE-derived gravity anomalies. To investigate the effect of the smaller omission error with increasing degrees of expansion of the GGM, and the influence of the satellite-only or combined GGMs, several DC solutions were performed using, as ground truth data, gravity anomalies from TIM_R6 to d/o 200/250/300, EGM2008 to d/o 2190 and XGM2019e_2159 to d/o 2190 and 1-year of GOCE data projected to the MO. The various results achieved when investigating the influence of using various GGMs to different d/o of expansion as ground truth data are presented analytically in the supplement. From the various solutions investigated, it was concluded that TIM_R6 to d/o 300 provided the overall best results with differences to the control data being almost unbiased with a mean value of 0.05 mGal, while for the TIM-R6 d/o 250 solution, they were an order of magnitude larger (see Table S3). To investigate the effect of the smaller omission error with increasing degrees of expansion of the GGM, and the influence of the satellite-only or combined GGMs, several DC solutions were performed using, as ground truth data, gravity anomalies from TIM_R6 to d/o 200/250/300, EGM2008 to d/o 2190 and XGM2019e_2159 to d/o 2190. Based on the aforementioned results, DC to the geoid was carried out for the entire SGG GOCE time series (5 years of data) using the free-air gravity anomalies from TIM_R6 d/o 300 as ground truth. Figure 2 and Figure 3 present the original T z z M O and Figure 4 the synthesized T x x y y M O ones at an MO = 230 km, the downward continued free-air gravity anomalies on the geoid and their residuals Δ g f   r e s with the ground truth data, while Table 3 shows their statistics.
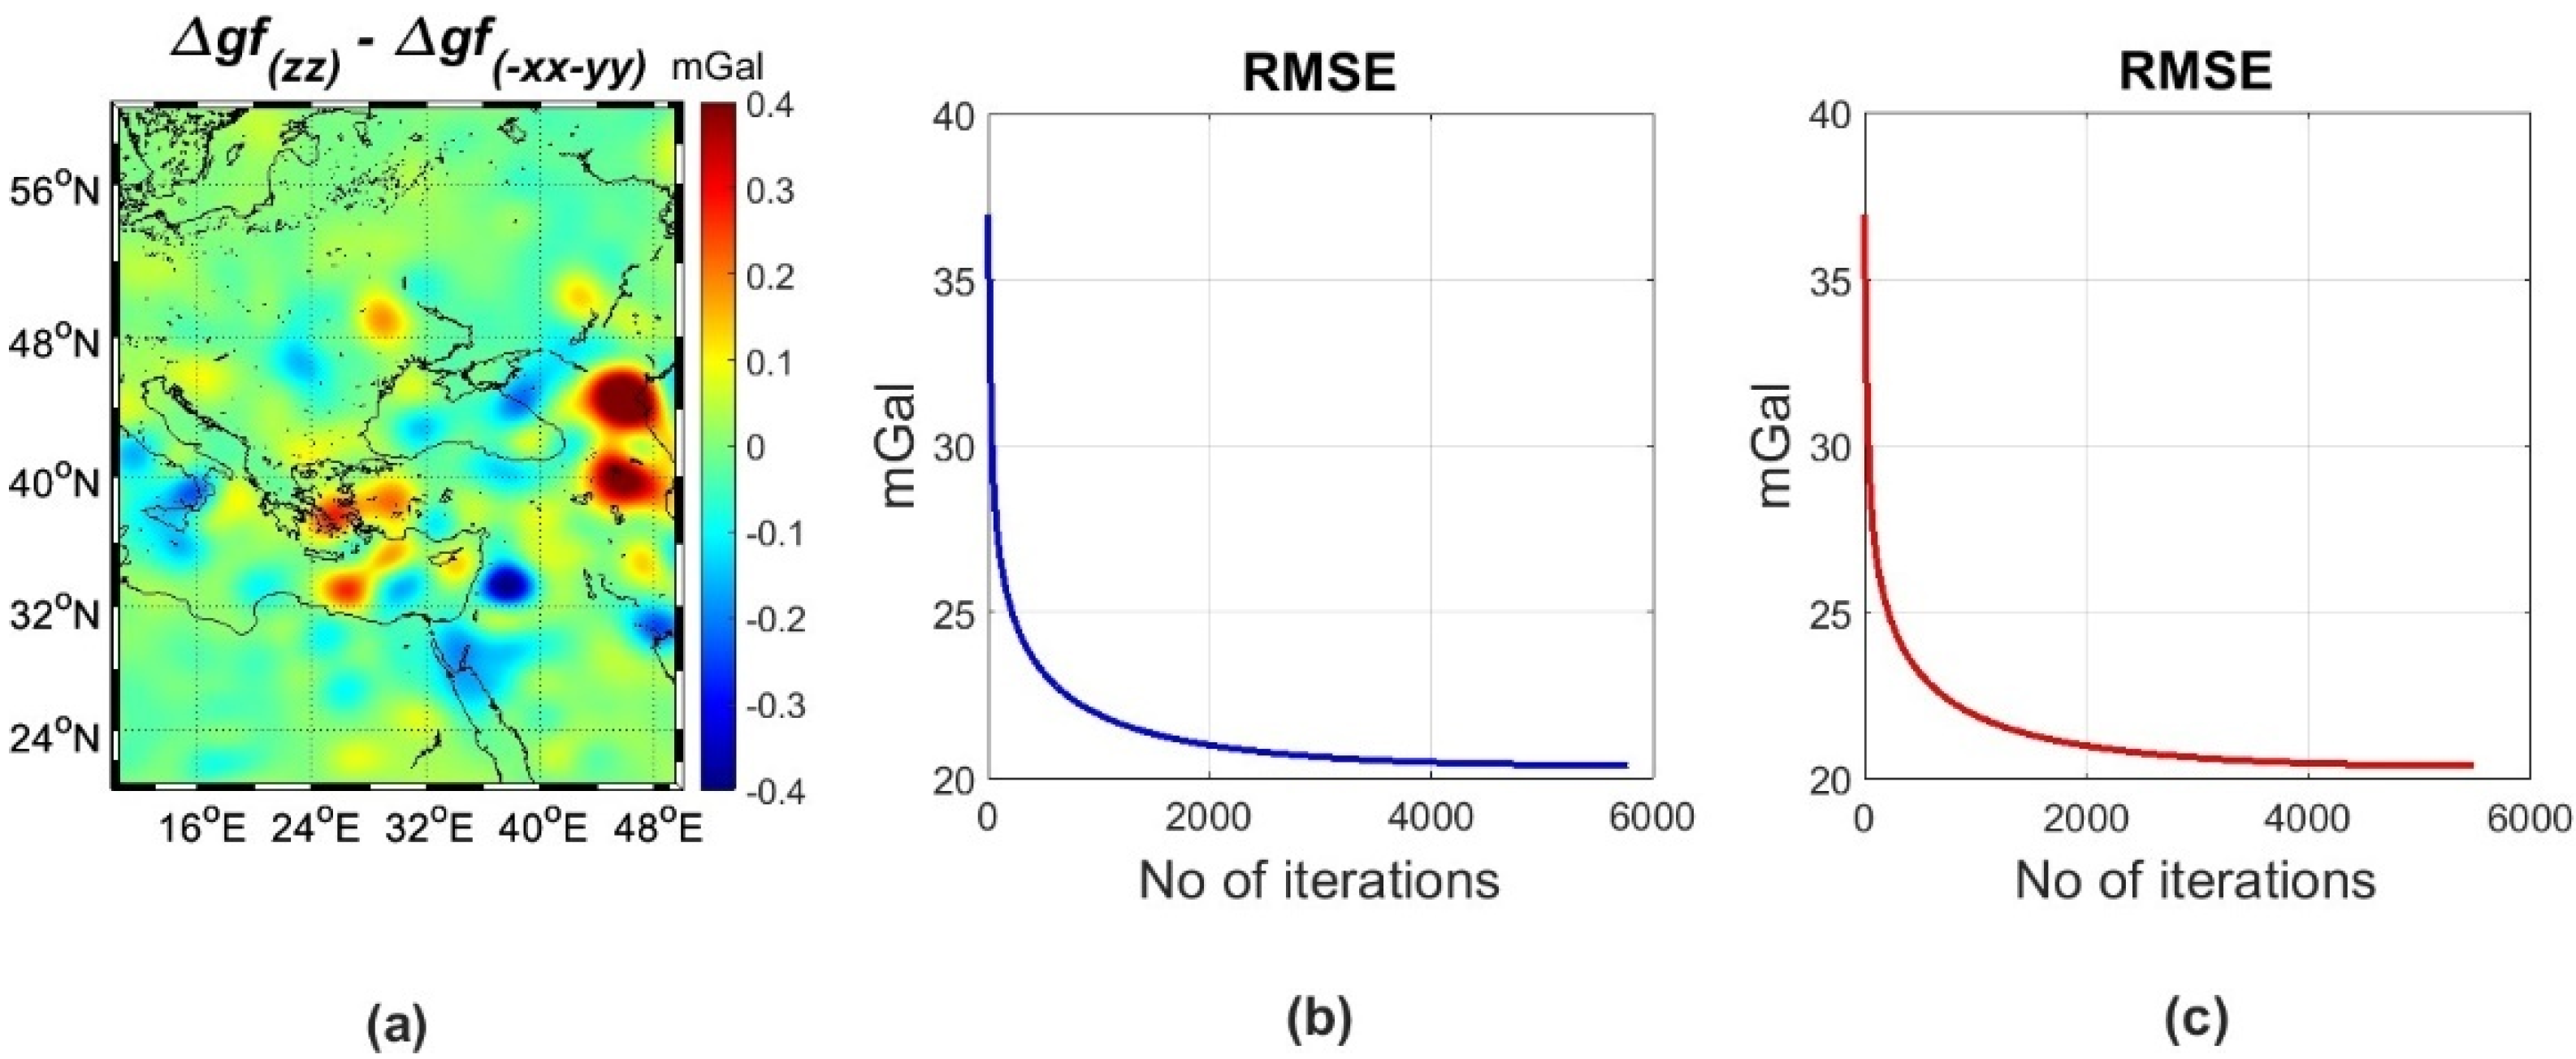
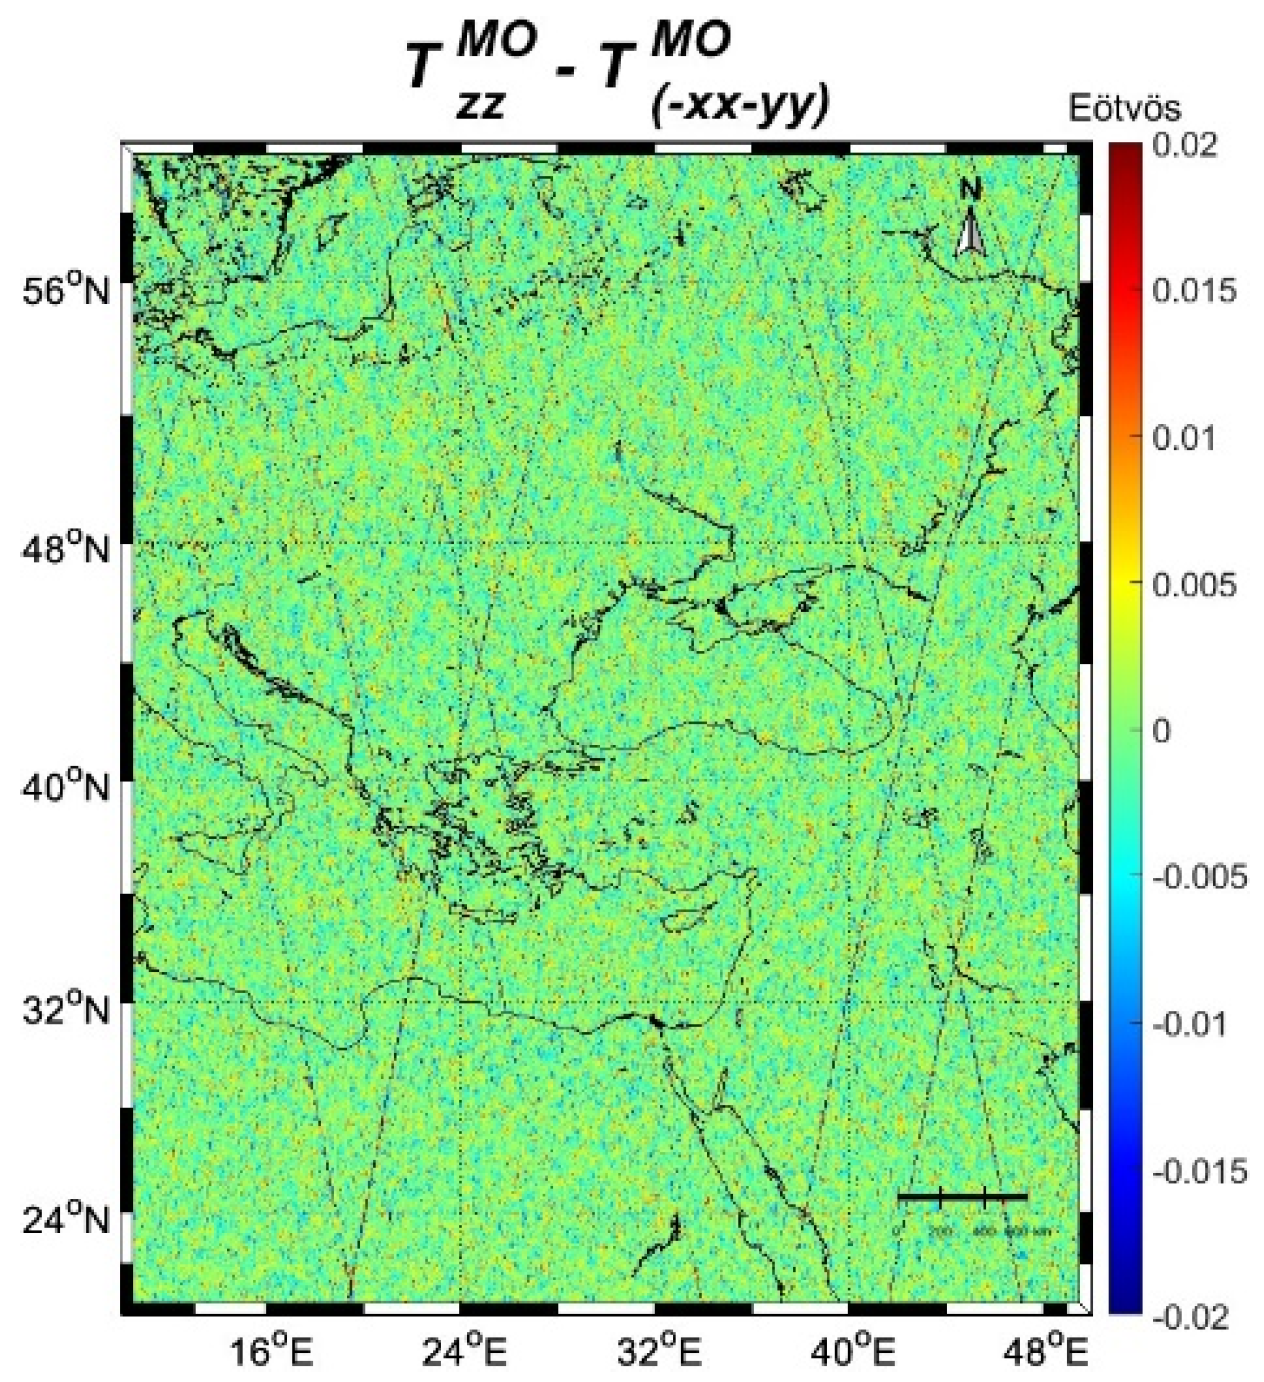
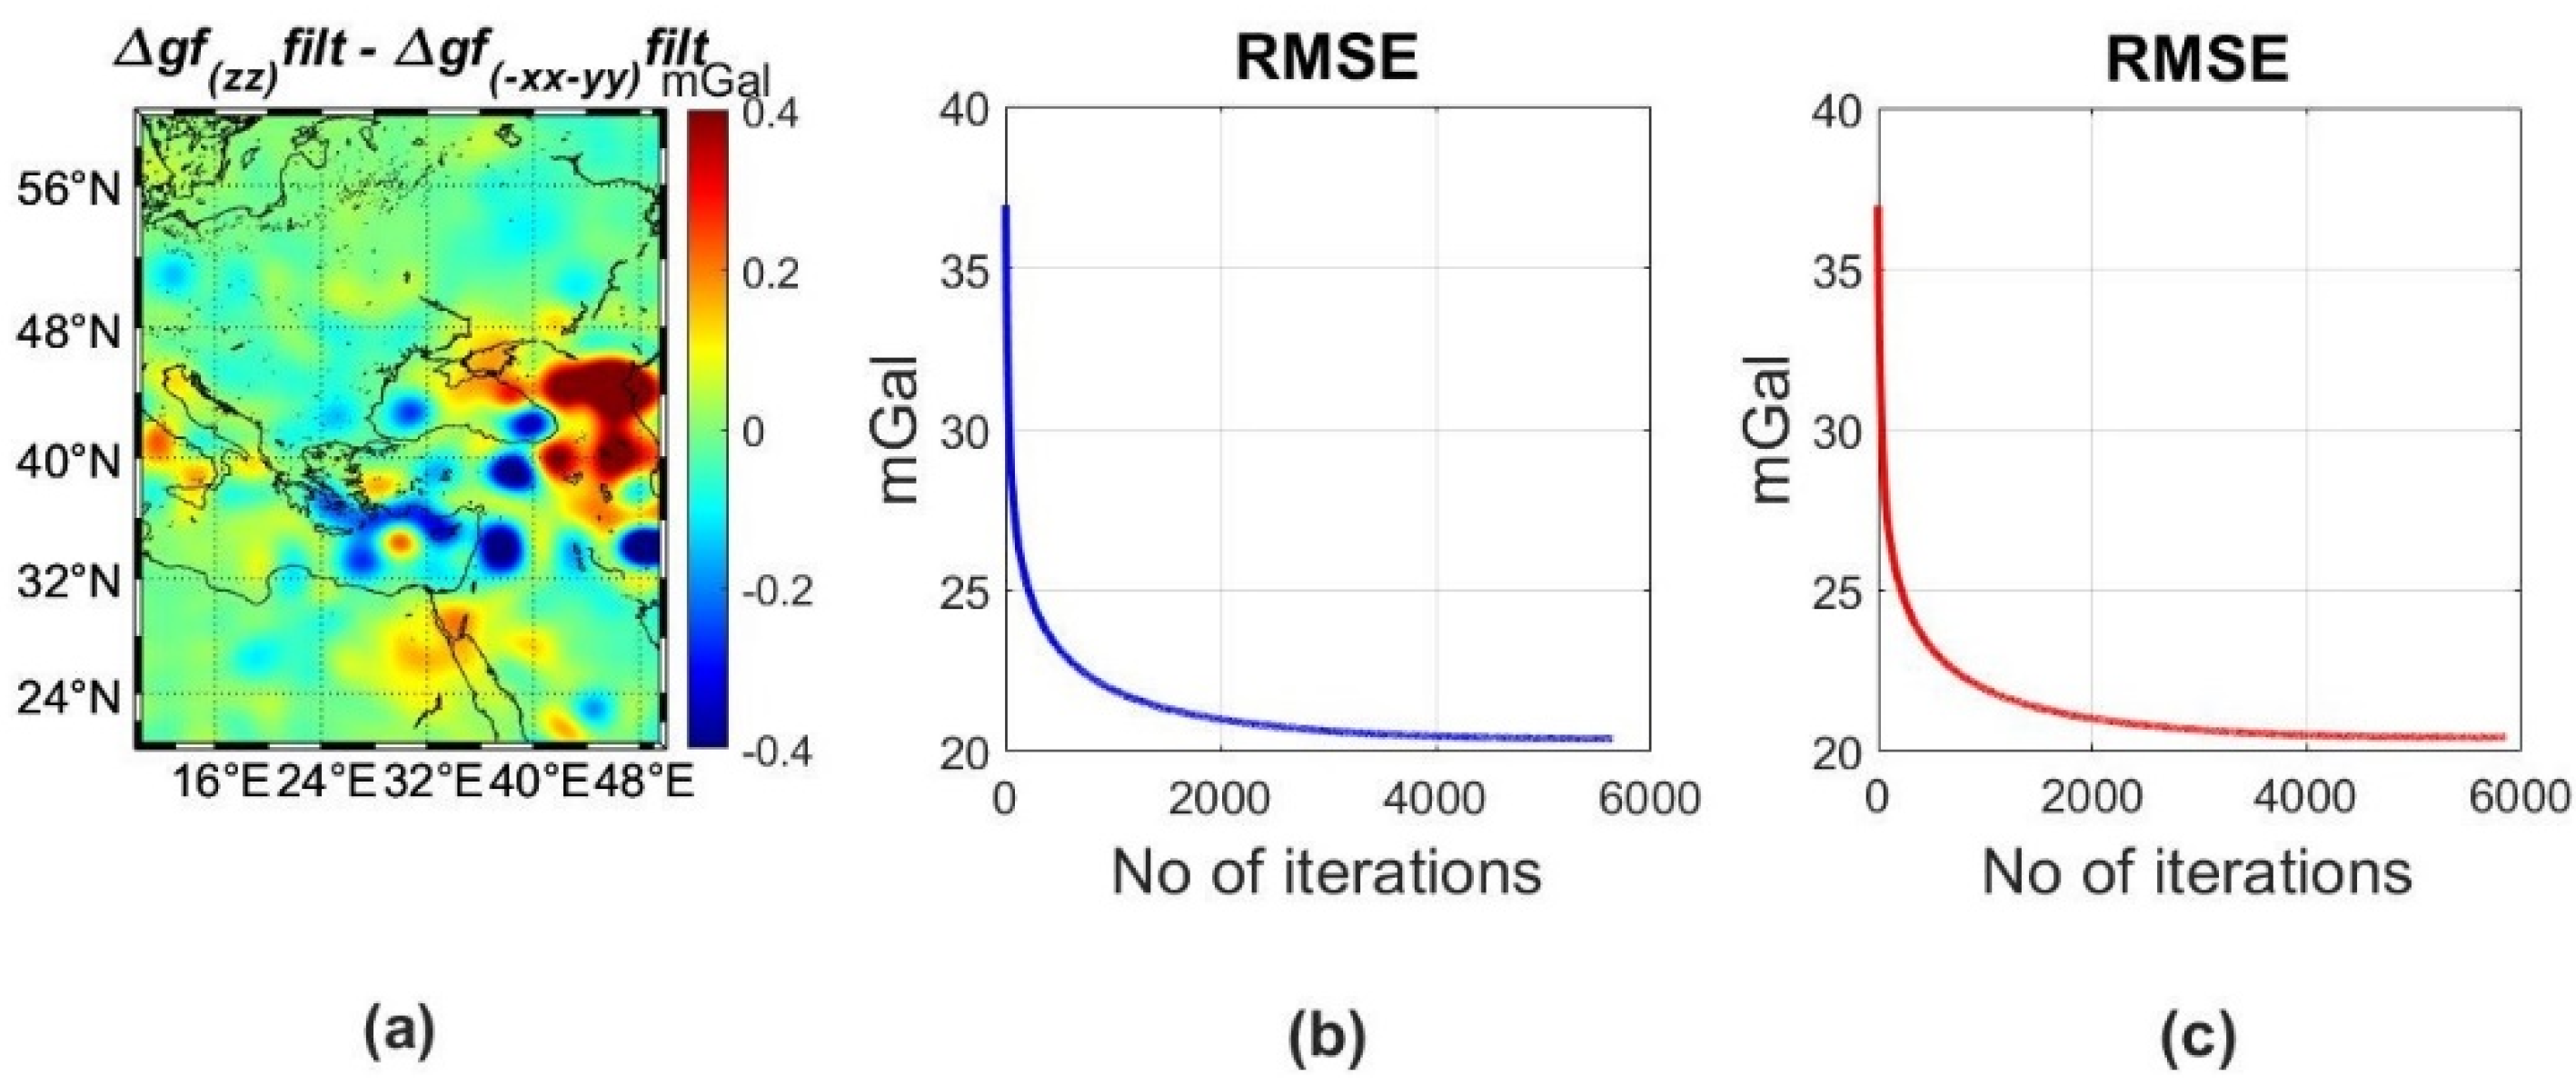
It should be noted that the iterations are terminated in both cases when the simulated annealing criterion is satisfied, i.e., when the RMSE variation between the previous and current solution is less than 0.00001 mGal. In these final experiments, 5769 and 5489 iterations were needed for the T z z M O and the synthesized T x x y y M O fields, respectively. Figure 5 presents the RMSE of these experiments, which decays fast from ~37 mGal to ~23 mGal after 50 iterations, and then slowly, approaching an asymptotic value of ~20 mGal, for both cases. Figure 5 also illustrates the difference between the DC free-air gravity anomalies from the T z z M O  and  T x x y y M O tests, respectively. Based on the statistics in Table 3, this difference indicates proper compatibility between the two DC solutions, with an std at the 0.03 mGal and a negligible mean. Therefore, both solutions can be used for further processing.
Finally, one last experiment for the downward continuation process was undertaken, where Wavelet Multi-Resolution Analysis [31,34,69] is applied in the gravity gradients at the MO. After closely inspecting Laplace’s equation for the gradients at the MO, when incorporating the 5th and last year of GOCE data, some satellite tracks were visible, as shown in Figure 6. The T z z M O  and  T x x y y M O gravity gradients at the MO were filtered using a db10 Daubechies wavelet with 14 levels of decomposition [34,70]. A reconstruction using only the coefficients of levels 7–14, corresponding to a spatial resolution of ~69 km and larger, was used. Once more, free-air gravity anomalies based on the TIM-R6 d/o 300 were used as ground truth data for the DC process for the filtered T z z M O f i l t and T x x y y M O f i l t gradients, with the results shown in Figure 7 and Figure 8, and the statistics in Table 4. In this test, 5646 and 5858 iterations (see Figure 9) were required for convergence for the T z z M O f i l t and T x x y y M O f i l t fields, reaching, again, a std of ~20 mGal with the TIM-R6 d/o gravity anomalies. Figure 9 shows the differences between the two downward continued fields, and their statistics are presented in Table 4. The DC gravity anomalies have very small differences with a zero mean and a std at 0.03 mGal. Finally, the differences between the DC solutions from the T z z M O  and the  T z z M O f i l t tests and those between the T x x y y M O    and the  T x x y y M O f i l t tests are shown in Figure 10 and the statistics in Table 5. The spatial features of these double differences are the same in both cases, with the main being over the Aegean Sea and Caucasus, while, in the rest of the area, they appear rather small and within ±2–3 mGal. The std of 4.2 mGal and the mean 0.4 mGal are due to the filtering and the DC; hence, their final impact on the geoid will be investigated subsequently.

4. Geoid Estimation with GOCE and Local Gravity Data

Geoid modeling over the wider area of Greece has been the focus of extensive research during the last fifty years. Reference [71] carried out computations based on observed astrogeodetic deflections of the vertical; reference [72] evaluated both the Stokes integral and LSC; reference [73] investigated combination solutions; reference [74] made estimations using LSC gravimetric deflections of the vertical; reference [75] employed, for the first time, satellite altimetry observations in the developed geoid model; reference [58] estimated altimetry-only, gravimetric and combined with LSC and IOST geoid models in support of a dedicated altimetry calibration site; reference [58,59,76] presented the entire processing chain to determine a high-resolution gravimetric geoid model for Greece, called Greek Geoid 2010, based on the remove–compute–restore (RCR) concept, employing EGM2008 as a reference field, heterogeneous (land, marine, airborne) gravity data and 1D FFT for the evaluation of the Stokes kernel; finally, [77] incorporated, for the first time, GOCE observations in the determination of the geoid and the dynamic ocean topography to estimate a local high-resolution geoid in south Crete.

4.1. Methodology, Local Data and Gravity Reductions

As already mentioned, the main goal of the present work is, after the reduction to the MO and the DC to the geoid of the original GOCE SGG data, to combine them with local free-air gravity anomalies so as to estimate an improved geoid model for the wider Hellenic region between 33.5° ≤ φ ≤ 42.4° and 18.5° ≤ λ ≤ 30° and investigate the possible improvements that they can bring. The development of the various geoid models will be based on all cases in the RCR technique [6,10,78], during which the long and short wavelengths of the gravity field spectrum are removed from the available input data; then, prediction of the geoid is carried out and, finally, the removed effects are restored to derive the final model. To model the long-wavelength part of the spectrum, XGM2019e [66] was used as a reference while the topographic effects are evaluated based on a spherical harmonics expansion of the Earth’s potential and ultra-high-resolution residual terrain correction (RTC) effects from a global model [79,80,81]. The actual prediction of the geoid was carried out using both spectral and stochastic methods, i.e., classical FFT evaluation of Stokes’ kernel function [82] and LSC [83,84]. Given that the study area is quite extensive and the input data comprise a large dataset, FFT-based solutions were employed for the entire region while LSC for more focused, as will be presented in subsequent studies. In any case, the scope of this work is to evaluate the contribution of GOCE to geoid modeling rather than compare the two methods, something that has been carried out extensively in the literature, signaling the similarities between the two [61]. Here, we exploit the spectral methods, which allow for the fast evaluation of convolution integrals, given that for the wider Greek area, large amounts of data need to be combined. On the other hand, since FFT-based methods do not allow, easily, for the combination of heterogeneous irregular data and the proper error propagation, something that is inherent in LSC, the latter is applied in more focused studies.
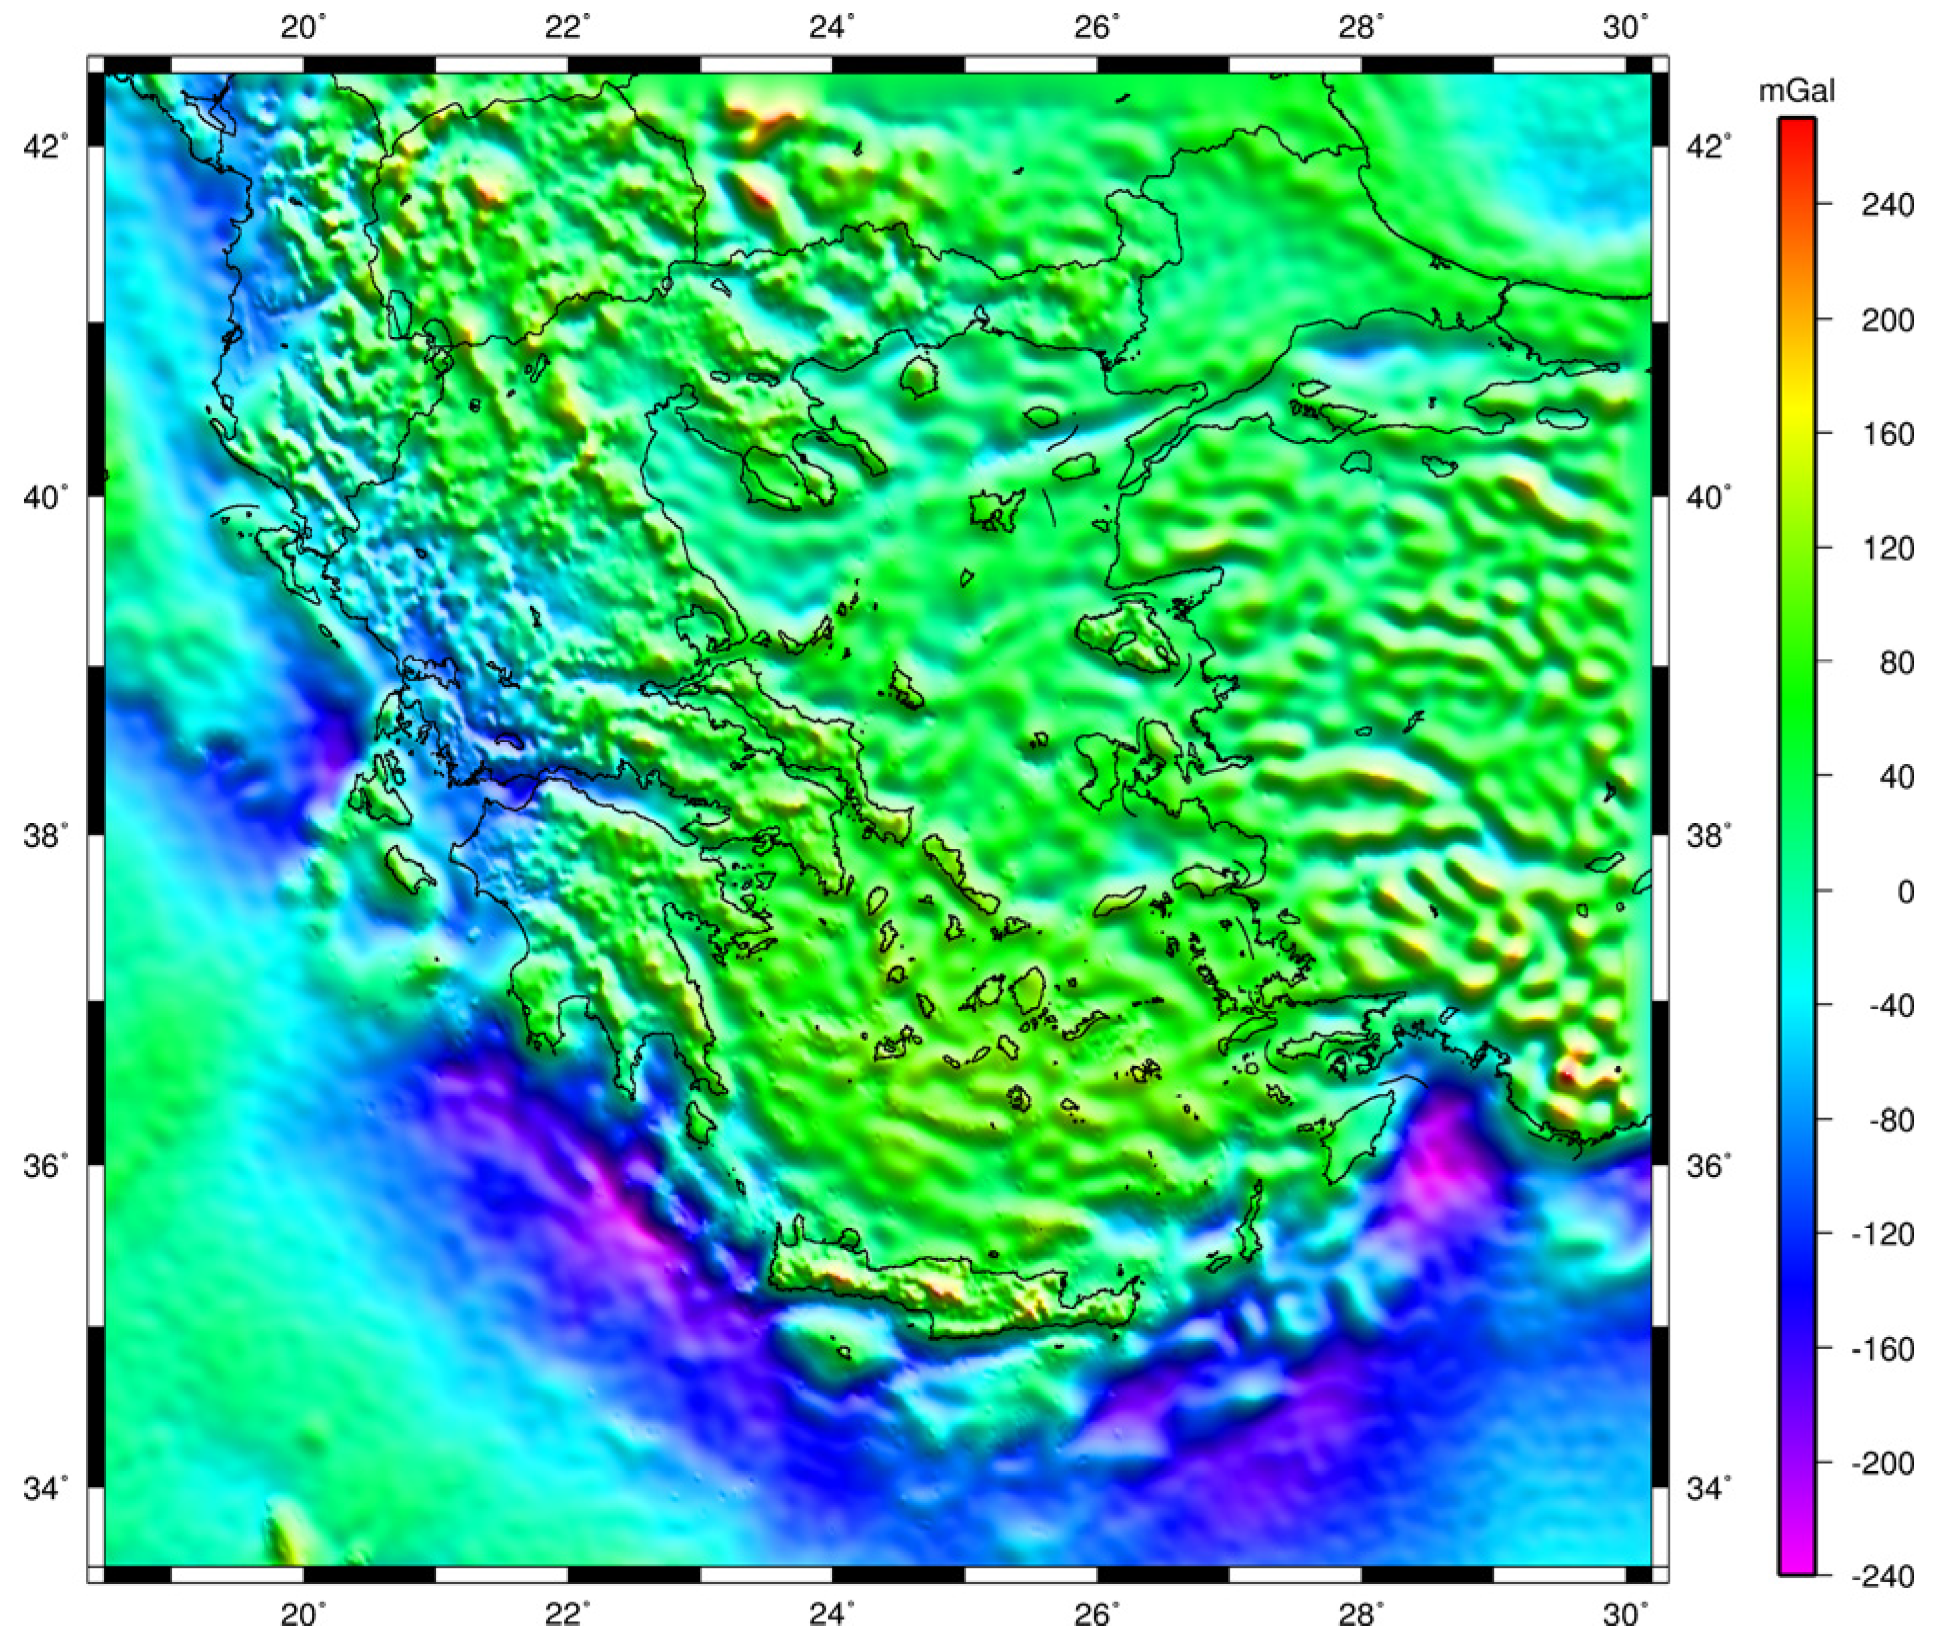
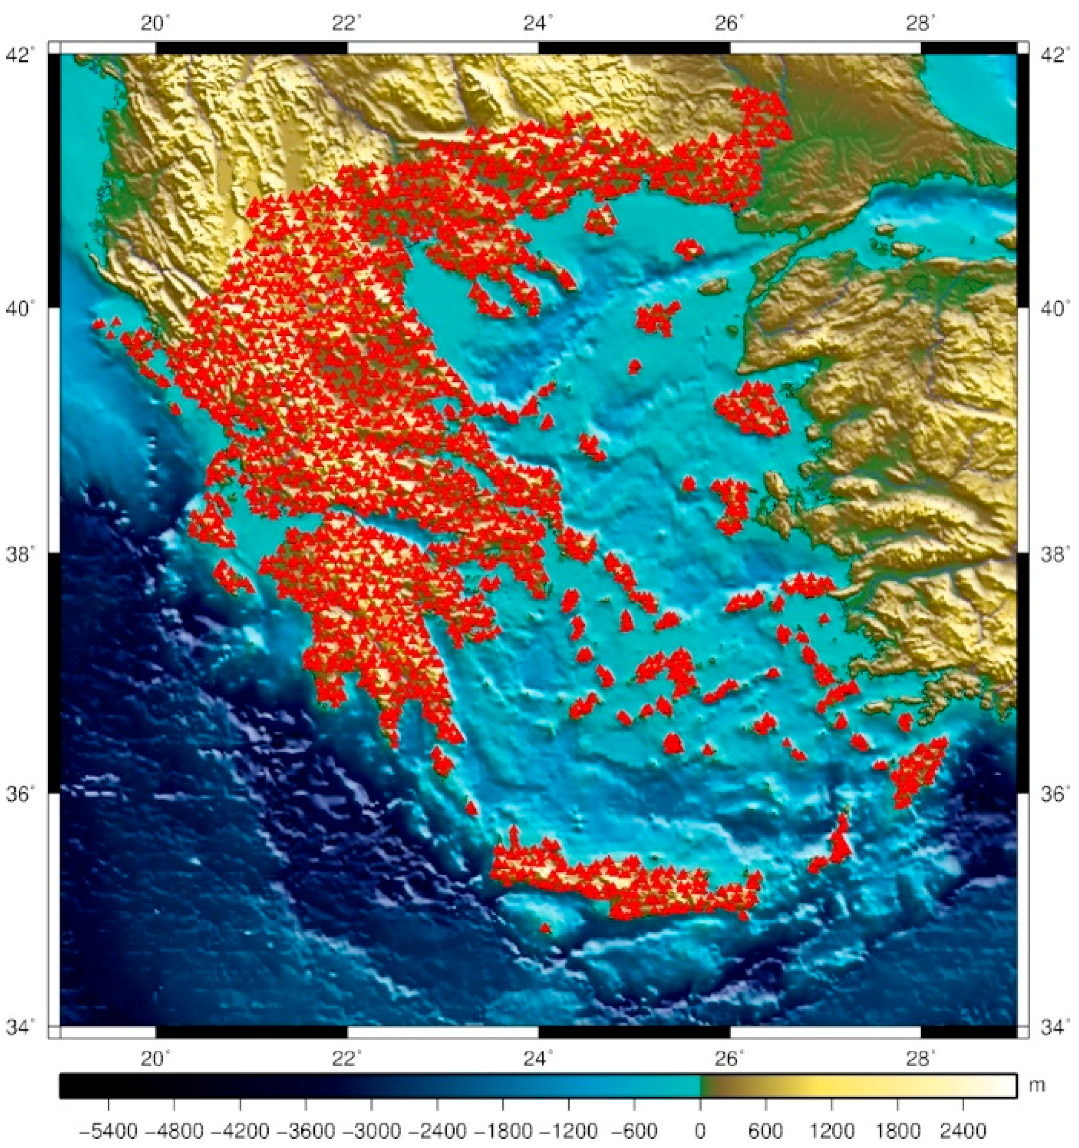
The geoid prediction was based on the DC GOCE free-air gravity anomalies previously described (see Figure 3c, Figure 4c, Figure 7c, Figure 8c), as well as local free-air gravity anomalies. The latter form a land and marine gravity database over the wider Hellenic area compiled by [85] and used in the latest geoid models over Greece [77,86]. The total amount of land free-air gravity anomalies was 294,777 irregularly distributed point values, depicted in Figure 11 with their statistics in Table 6, along with a gridded 2′ × 2′ dataset, which was determined from the irregular values with kriging.
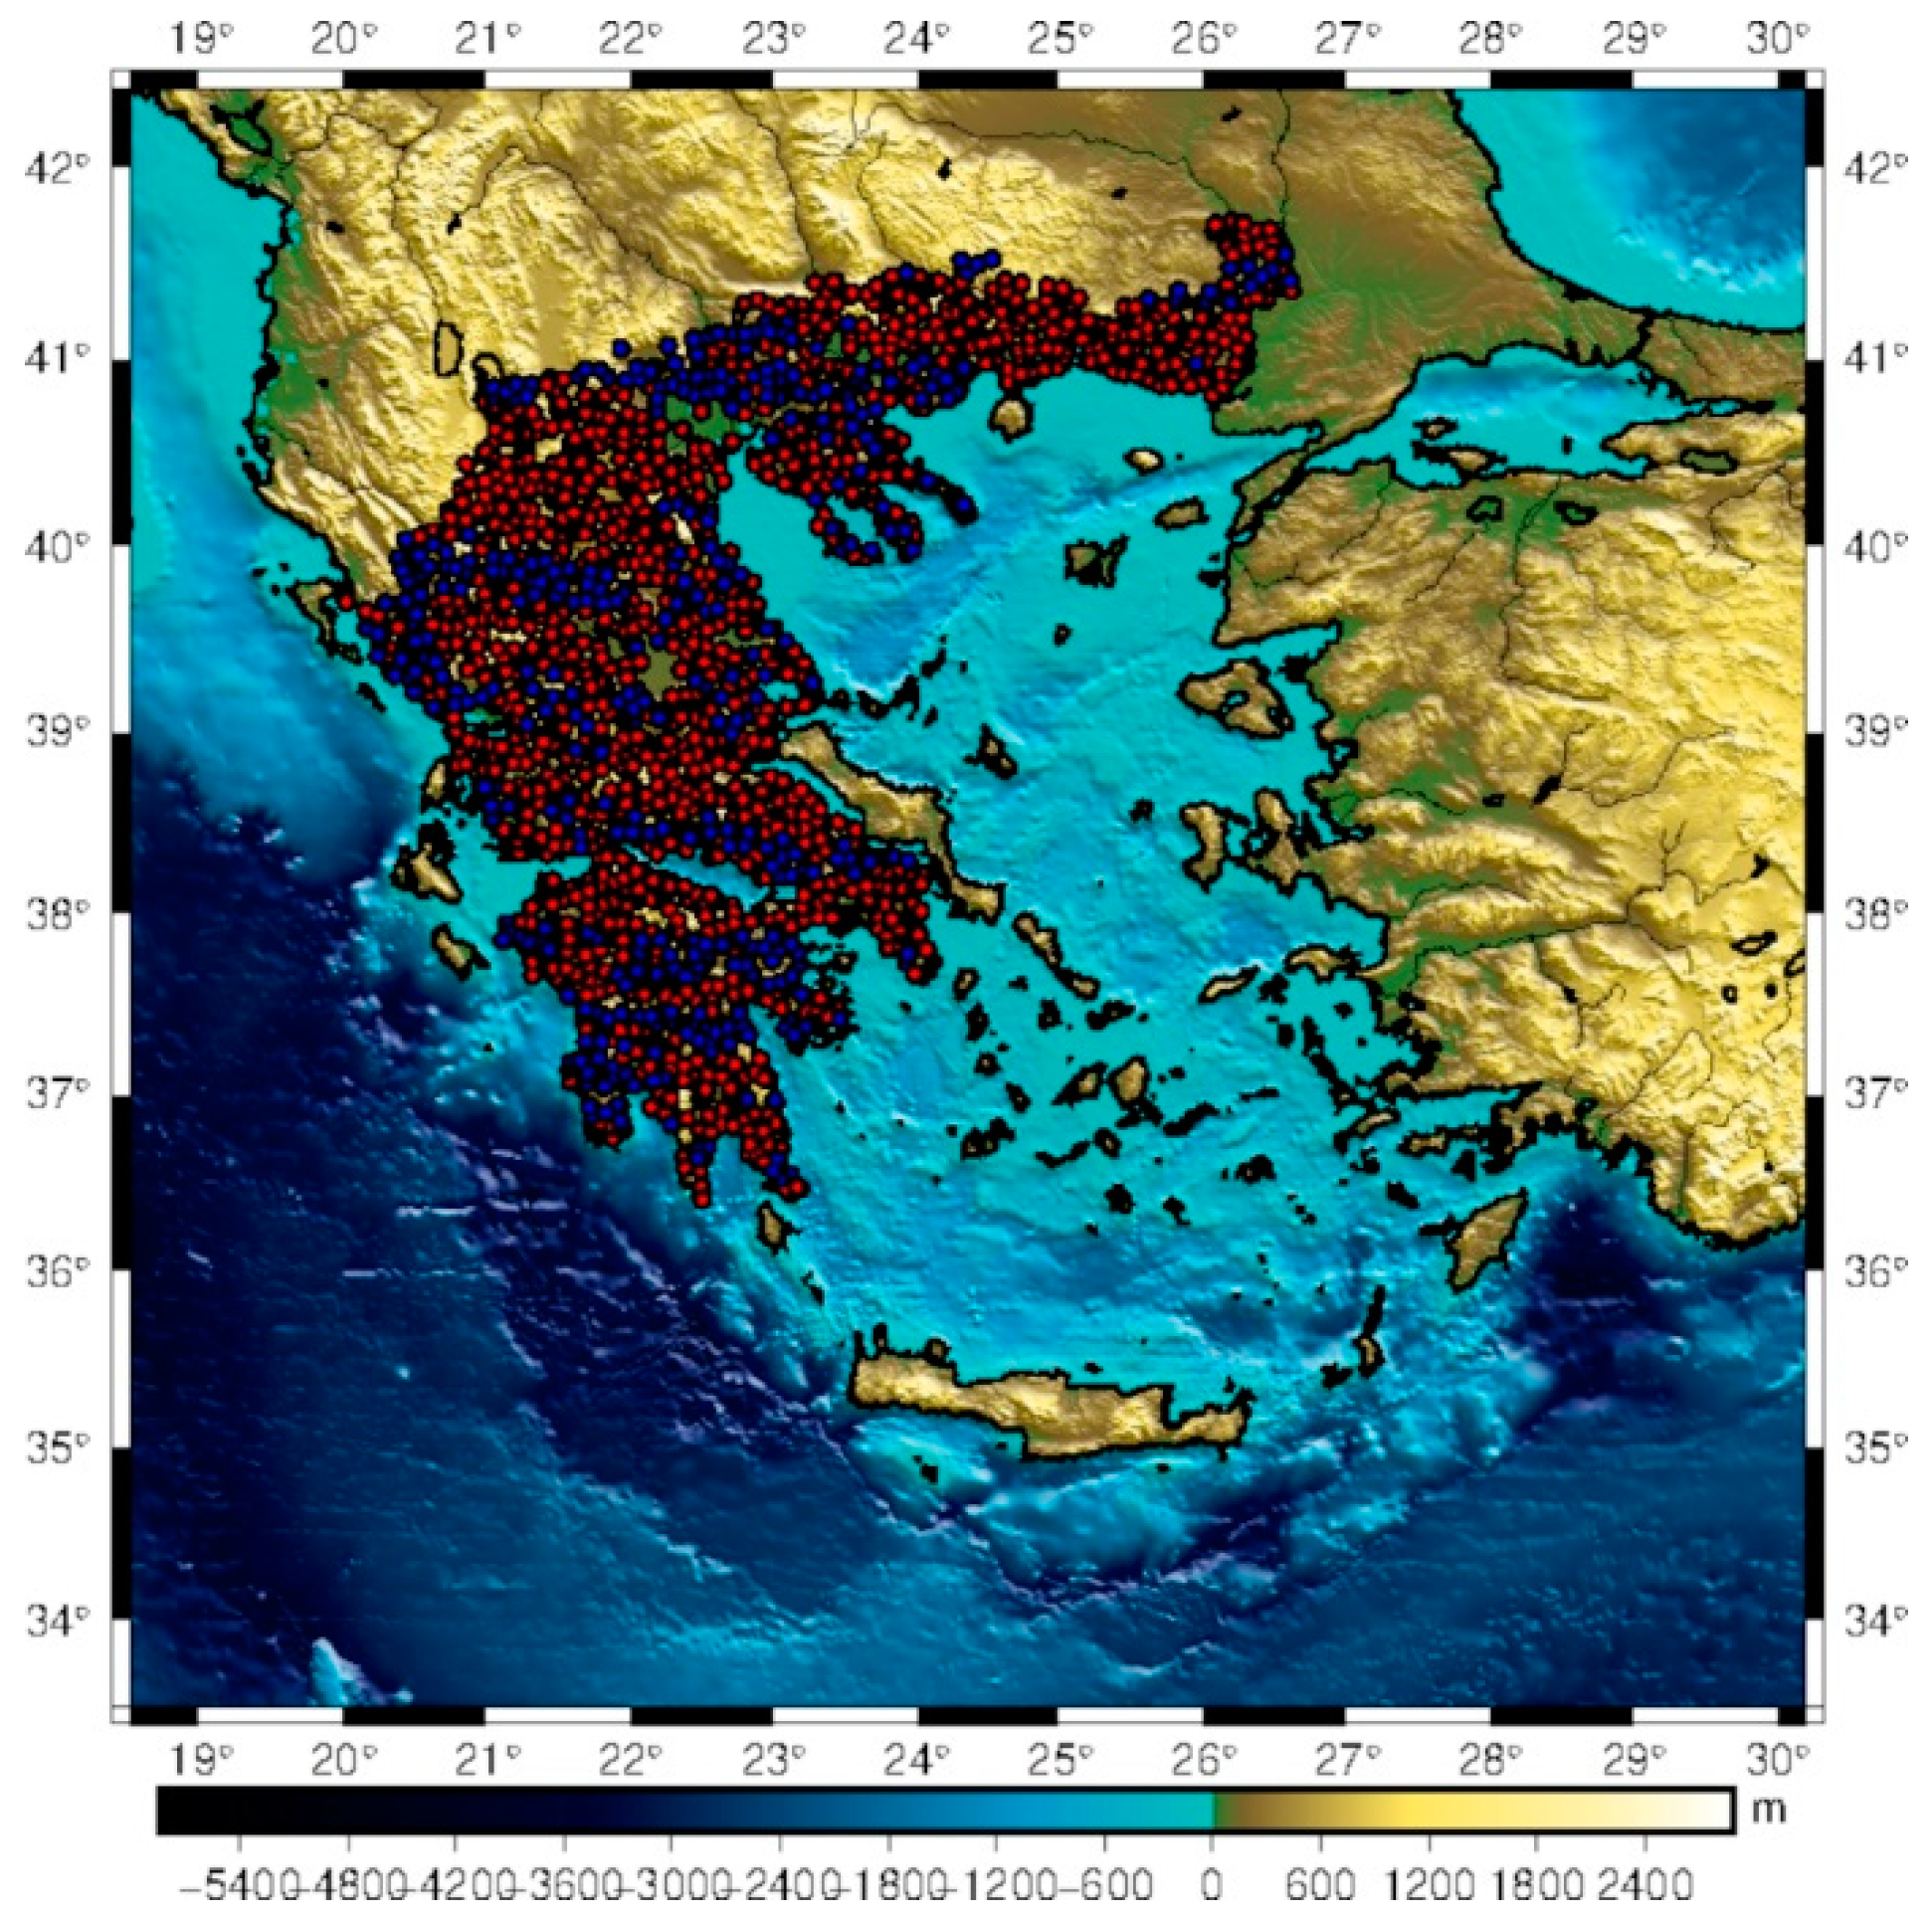
The evaluation of the derived geoid models over Greece was performed against a set of available collocated GNSS/leveling observations on benchmarks (BMs) over the entire Hellenic area (see Figure 12). Greece does not have a unified vertical network with all orthometric heights referring to the same zero level, located in the TG station at the Piraeus harbor [14,67,68]. Hence, evaluation of the Greece-wide models was performed using only the BMs over mainland Greece (1542 BMs), while the local solution that will be presented over Crete, South Greece, will employ the BMs only over that island. The geometric heights of these BMs were determined in the frame of the organization of the Hellenic cadaster by Ktimatologio S.A., performing a nationwide GNSS campaign to collect high-quality GNSS observations on geodetic BMs, with a mean accuracy of 2–5 cm [87]. The leveling heights correspond to Helmert-type orthometric heights coming from the Hellenic Geographic Military Service (HMGS), with their formal accuracy being at the 1-2 cm level, but, in reality, their accuracy is largely unknown [67,68,87].
As already mentioned, during the remove step, the long-wavelength part of the spectrum is removed from the available gravity anomalies using the XGM2019e model and the short-wavelength part from the topographic effects. Thus, residual free-air gravity anomalies can be constructed as:
Δ g f   r e s = Δ g f Δ g G G M Δ g t o p o
where Δ g f   r e s denotes the residual gravity anomalies, Δ g f the available free-air gravity anomalies, Δ g G G M the contribution of the GGM and Δ g t o p o the contribution of the topography. The GOCE-derived gravity anomalies were documented in the previous sections, so the respective statistics for the land gravity data are shown in Table 6, where it is evident that the residual signal has a very small mean value, statistically insignificant and a std of just 4.2 mGal.
For the geoid determination with LSC, an empirical covariance function needs to be determined so that after the fit of an analytical model, the necessary covariance and cross-covariance matrices can be determined to derive the final geoid model as [83,84]
N ^ = C s N T C s s + C v v 1 y
In Equation (4), y is the vector of observed gravity, C s s is the covariance matrix of the observations, C s N is the cross-covariance matrix of the observed Δ g f   r e s with the predicted N r e s and C v v describes the observed gravity anomaly noise. Within the present study, the input residual gravity anomalies will be based on both local gravity data ( Δ g f   r e s ) and the DC GOCE gravity anomalies, based on the T z z ( Δ g f   r e s   z z ) and T x x y y ( Δ g f   r e s   x x y y ) data and the ones after filtering with wavelets ( Δ g f   r e s   f i l t   z z and Δ g f   r e s   f i l t   x x y y , respectively).
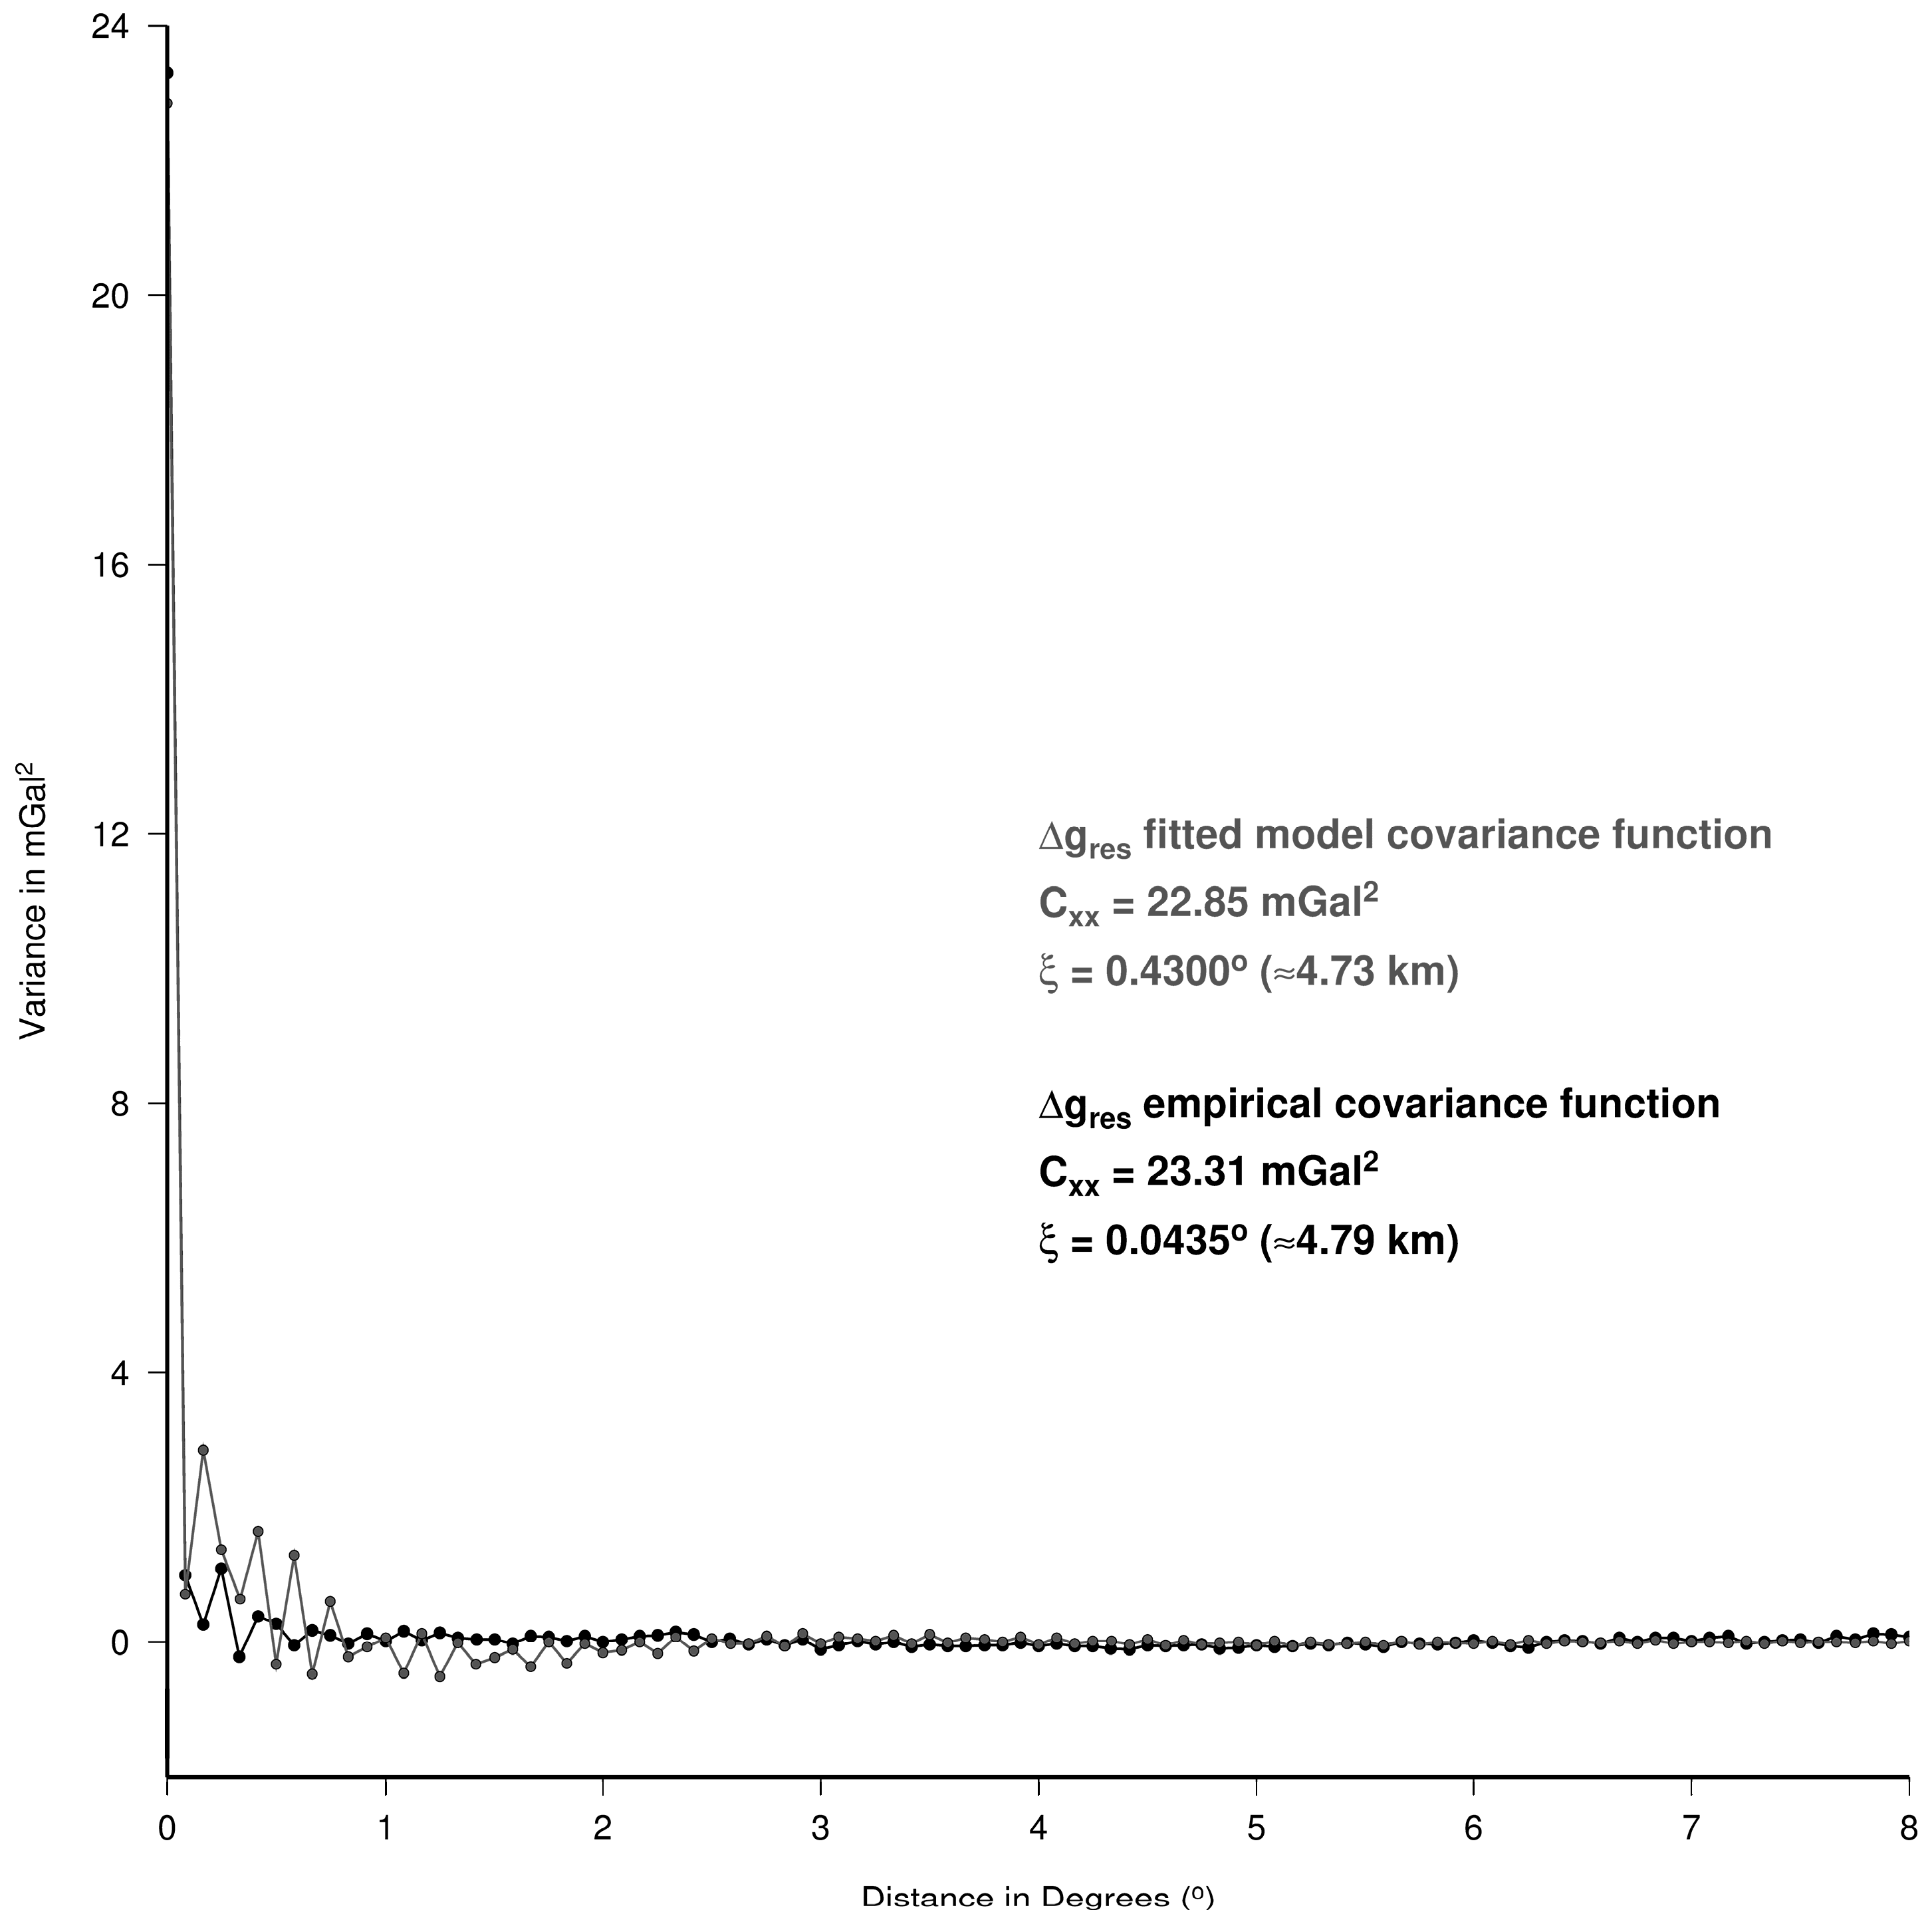
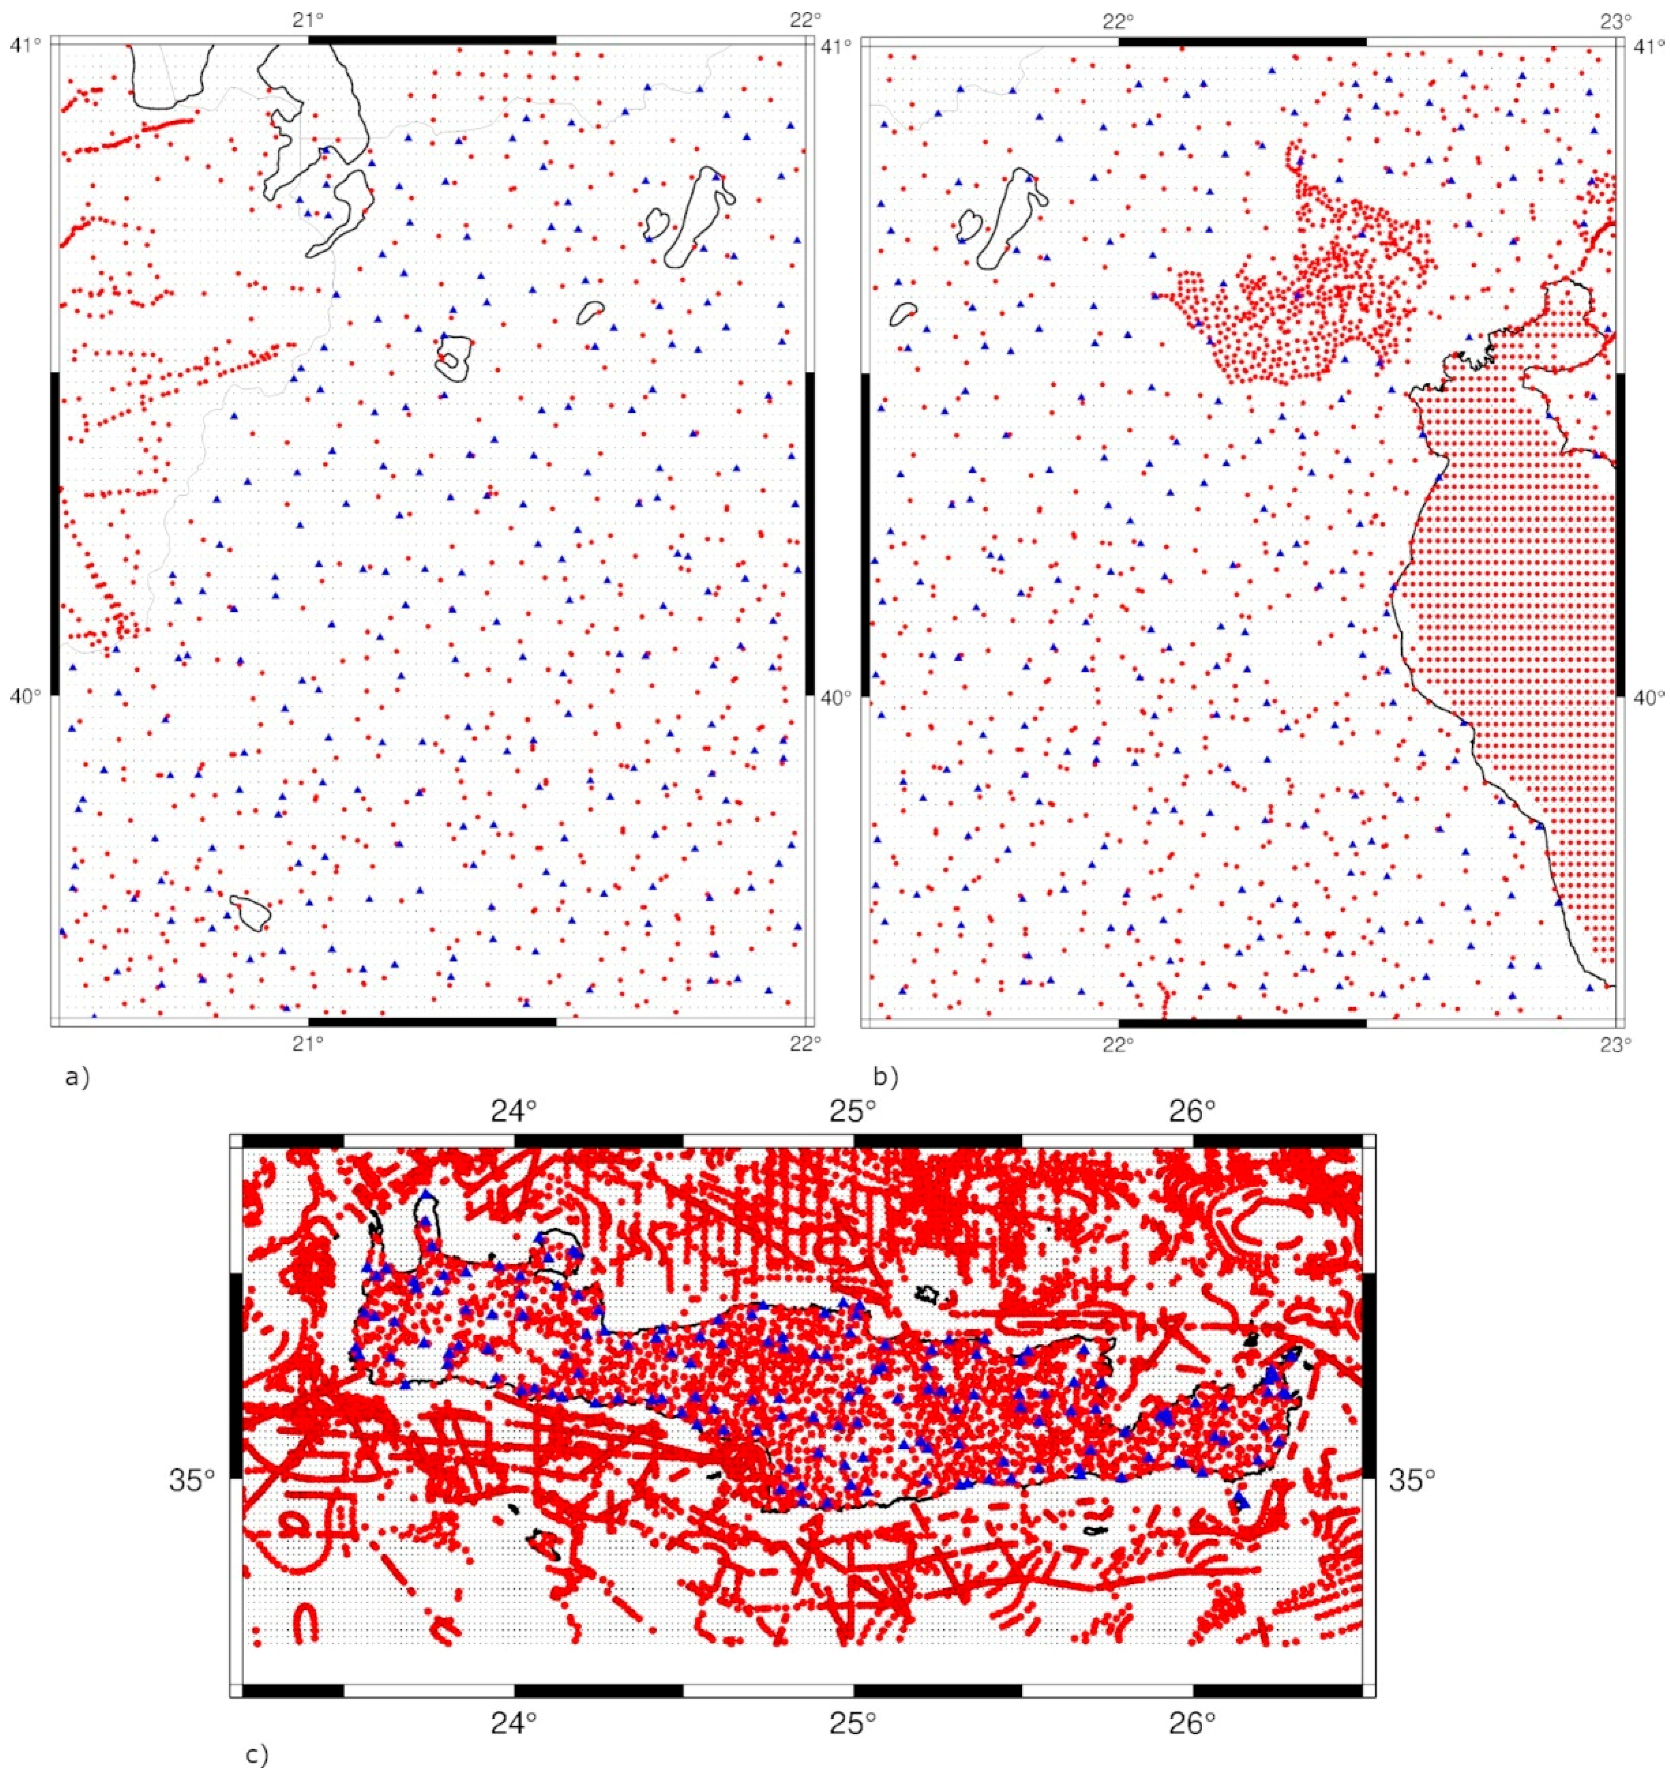
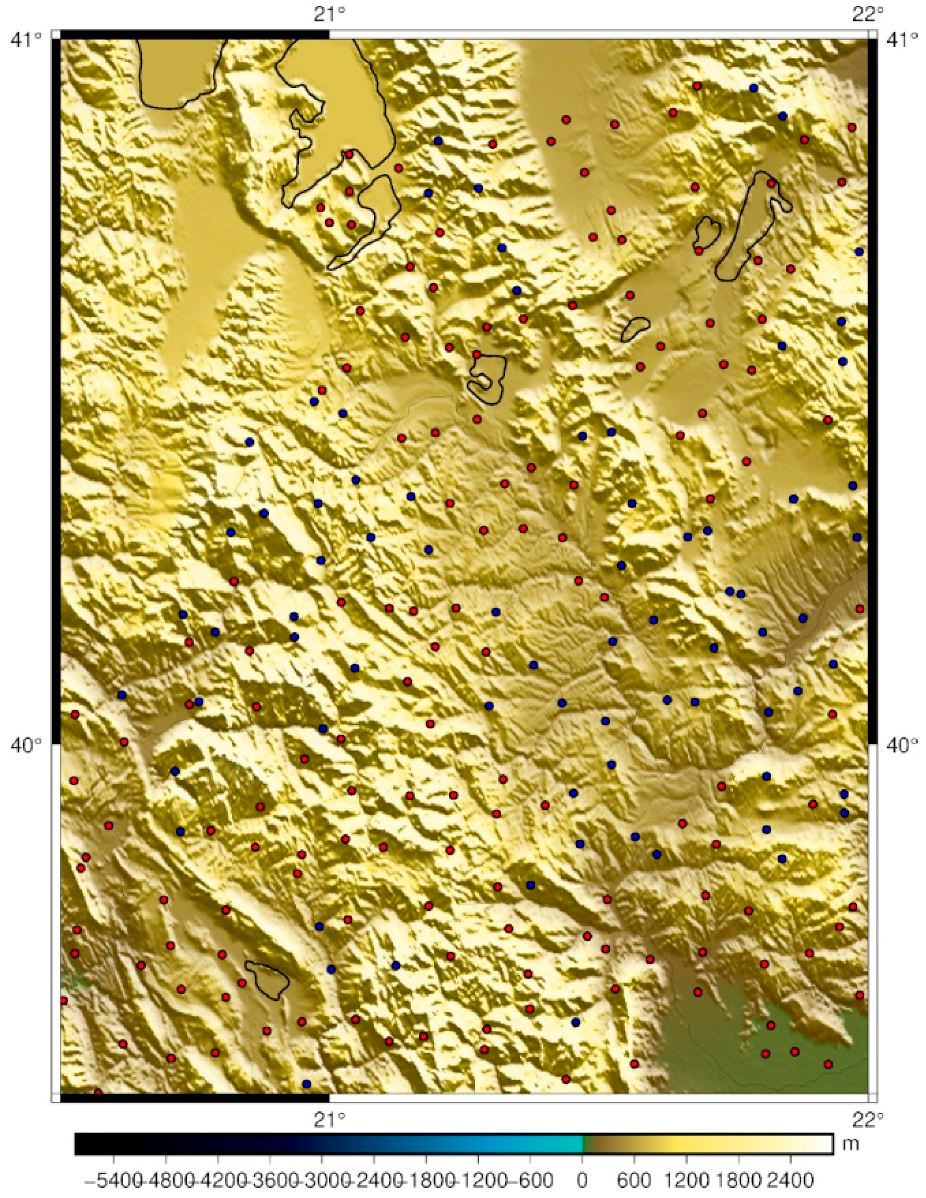
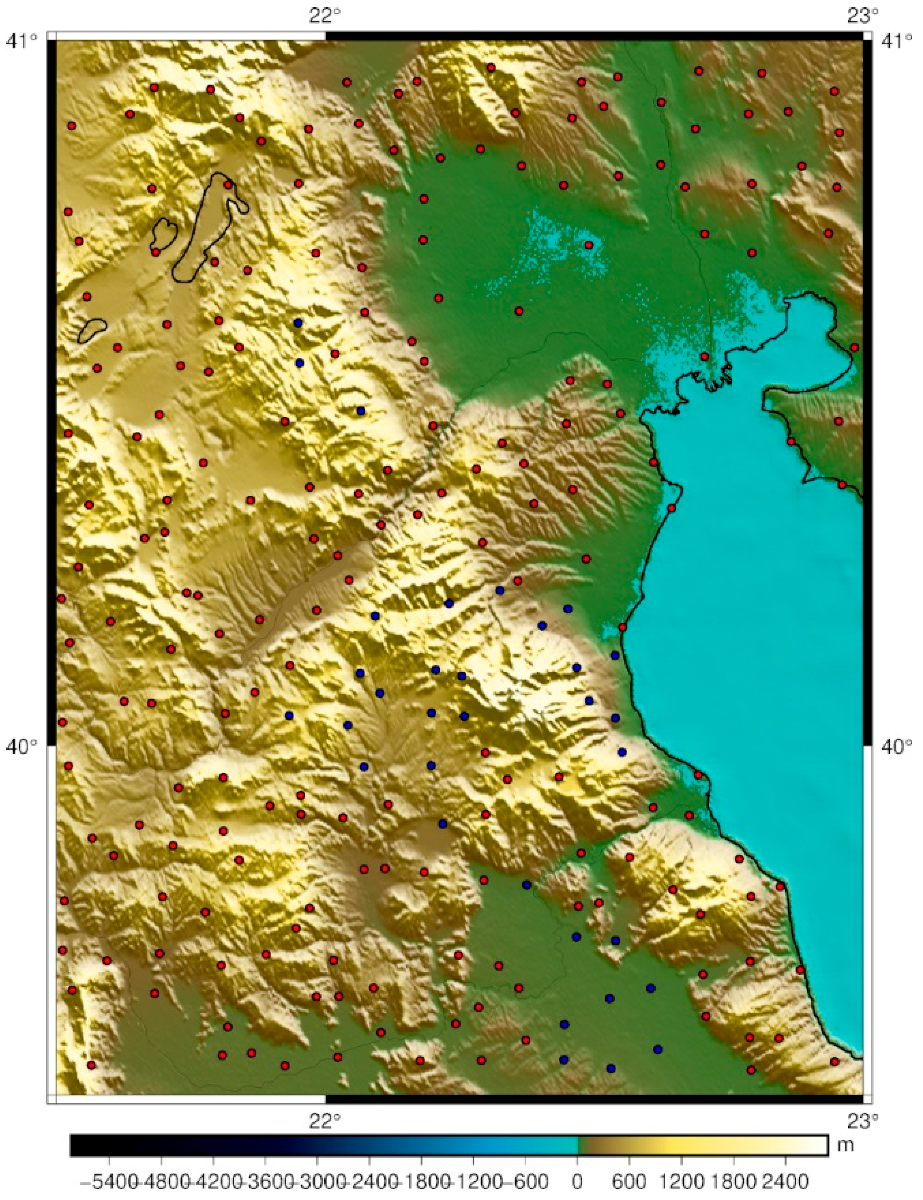
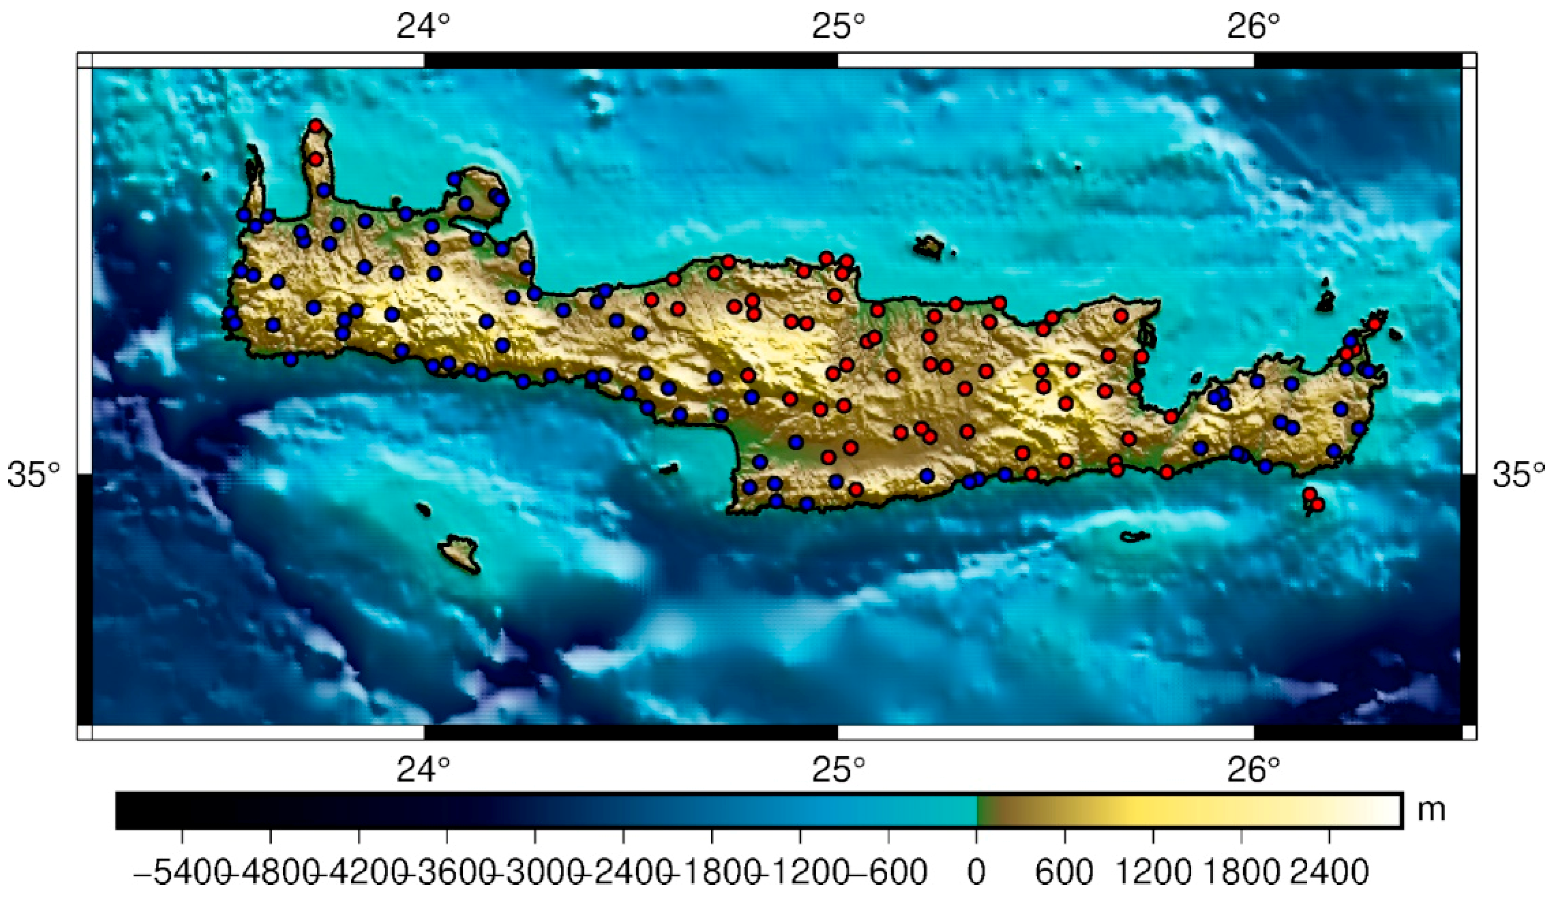
In the latter case, a combined local and GOCE geoid model can be determined. The analytical covariance function model used is that of Tscherning and Rapp [88], with the characteristics shown in Figure 13. Since LSC is time consuming and cannot handle large amounts of data, it was limited to three areas around the Pindos mountain (39.5° ≤ φ ≤ 41° and 20.5° ≤ λ ≤ 22°), over Thessaly, Central Greece (39.5° ≤ φ ≤ 41° and 21.5° ≤ λ ≤ 23°), and over the island of Crete (34.5° ≤ φ ≤ 36° and 23° ≤ λ ≤ 26.5). Over these three areas, the irregular land gravity data were used in combination with the GOCE-derived gravity, as shown in Figure 14.
On the other hand, the geoid evaluation by FFT was carried out for the entire area of Greece, as shown in Figure 11, since FFT allows for the efficient evaluation of convolution integrals in the spectral domain. The evaluation of Stokes’ integral by FFT was carried out with the classical 1d-FFT spherical Stokes convolution [89], with the Wong–Gore modification for the Stokes kernel [90] and 100% zero padding in all directions. After various tests against the GNSS/levelling data, a cut-off degree for the Wong–Gore modification equal to 80 was selected as the optimal one for the FFT-based geoid determination.
The FFT solutions were based on using, solely, the local gravity data and in combination with the ones available from the DC GOCE databases. In the latter case, a single residual gravity anomaly grid had to be computed, so that kriging was employed, within the geogrid program in GRAVSOFT [91], using the std of the residual signals as weight in the prediction on a grid. In all cases, the final evaluation of the derived geoid models was performed with the benchmarks located in each region or over the entirety of mainland Greece.

4.2. Geoid Models and Validation

The determination of the various geoid models referred first to the entire Greek territory employing the 1d-FFT evaluation of Stokes’ integral in the frequency domain. Depending on the input data, various solutions were determined, land only, GOCE only and combined ones. As a result, the geoid models determined were based on the GOCE-only gravity solutions Δ g f   r e s   x x y y ,   Δ g f   r e s   z z ,   Δ g f   r e s   f i l t   x x y y and Δ g f   r e s   f i l t   z z (models a-d, respectively), land-only gravity data (model e) and four combined solutions with both GOCE and terrestrial data (models f–i, corresponding to the previous order of GOCE-only models). As already mentioned, for the wider Greek area, the prediction was perfor-med on a regular 1′ × 1′grid, so that after the estimation of residual geoid heights and the restore step of the GGM and RTC contributions, the final geoid models were estimated. Table 7 tabulates the statistics of the residual geoid heights from all solutions, where large fluctuations can be seen. Clearly, the use of GOCE-only data does not manage to map the fine details of the gravity field, something that is expected, since the signal is band limited due to the attenuation with height. The residuals when using the land-only gravity data (model e) have a std of ~11 cm, while the GOCE models reach a std of ~1 m. It should be kept in mind that XGM2019 and the topographic effects were removed during the remove step of RCR from the GOCE and local gravity anomalies. Given that the GOCE-only residual geoid heights represent a limited part of the geoid spectrum, it is expected to contain larger residual values. Moreover, GOCE’s observations map the geoid and gravity spectrum up to ~280–300; hence, the residuals to XGM2019 also contain the geoid omission error from that degree to d/o 2190 (~25 cm based on Kaula’s rule and ~30 cm based on Tscherning and Rapp’s degree variance model) and differences to XGM2019 itself. On the other hand, all solutions have a zero mean, which for the GOCE-only models, is a good indication as to being unbiased. On the other hand, when combined with terrestrial gravity, the geoid residuals become more reasonable and especially in model i, where the Δ g f   r e s   f i l t   z z GOCE data are used, and the results seem promising. The validation of the new models was performed against the benchmarks over the mainland (1542 points) and as reference, against which all other models are evaluated, the land-gravity-only solution is used. Table 8 presents the statistics of the differences between the GNSS/leveling geoid heights and the FFT-based solutions, where model e shows the reference std of 12.3 cm, which, as expected, is the overall best one. Among the combined solutions, model i shows the overall best results, with an std of 32.3 cm, which is 11–36 cm better than the other models. It is interesting to note that, despite the fact that the overall statistics are not improved, as expected, there are a number of BMs that are improved for all combined solutions (see Table 8). Therefore, there is an improvement to the agreement with GNSS/levelling data by 24.58%, 18.03%, 14.53% and 27.78% for models f, g, h and i, respectively. Figure 15 presents, for model i, the spatial distribution of the BMs, where the use of GOCE data improves the differences to the GNSS/levelling data compared to the land-only solution. As can be seen, the improvement is mainly located where land gravity data are sparse, i.e., across the main mountain areas of Greece, close to the border areas with neighboring countries, and in northern Greece and the Chalkidiki peninsula (φ = 41° and λ = 23.5°), where voids exist in the gravity database. Of course, in such combined solutions with FFT, where a single input can be used, the information of land gravity is merged with that of GOCE without considering the statistical characteristics of the local gravity field, as in LSC using the determined analytical covariance function.
For the geoid development with LSC, the tests were based on the three smaller regions, which were selected due to their different topographic characteristics. The area over Pindos is one of rugged terrain; the one over Thessaly is a mixed lowland and rugged terrain, close to the coastline; and Crete is an island, with little shipborne gravity and with very steep terrain and significant gravity gradients. Note that LSC does not require the data to be on a regular grid, so the original irregular gravity anomalies combined with GOCE SGG were used. This is a main advantage compared to spectral methods, since every gridding and prediction operation introduces additional errors. The geoid prediction by LSC was performed directly on the available GNSS/levelling points of each area in order to avoid the introduction of additional and unwanted errors due to the interpolation of geoid height at GPS BMs. In Pindos, 224 BMs were available, 228 in Thessaly and 156 in Crete, which were used for the validation. For each area, two different scenarios were examined, one employing only the terrestrial gravity and the second employing the Δ g f   r e s   f i l t   z z by GOCE that provided the overall best results for the combined models in the FFT solutions.
Table 9 presents the statistics of the differences between the GNSS/levelling data and the LSC-based geoid models, land only ( L S C l a n d ) and combined ones ( L S C c o m b ), and Figure 16, Figure 17 and Figure 18, the BMs with improved differences when the LSC combined model is used. Thus, 89 points out of 156 BMs in Crete (57.10%), 74 out of 224 in Pindos (32.88%) and 33 out of 228 (14.73%) in Thessaly were improved compared to the solution with only land data, while the FFT solution improved by 28.08% in the mainland (428 out of 1524 BMs). Particularly, the results over Crete are very interesting, as the std of the differences of the combined solution is, even marginally, better than the land-only one, as is the mean value. The spatial distribution of the improved BMs is also interesting as they are focused on the western and eastern part of the island where land gravity is not as dense as in the central part and is not located on the mountains (see also Figure 14). Improvements are also found in Crete along the coastline, where both shipborne and land gravity values are not close to the GNSS/levelling BMs and in the north-west part of the island (35.2° ≤ φ ≤ 35.5° and 23.5° ≤ λ ≤24°). Especially over the southern coastline of Crete, where gravity is sparse and the land-sea boundary is characterized by very steep gravity gradients due to the proximity of high mountains to the sea, the improvement brought by the used of GOCE data in this local geoid determination is overwhelming. In Thessaly, where the improvement is the smallest, the main benefits are found over the mountains, which are poorly surveyed, and in the lowlands in the south-east (φ = 39.6° and λ = 22.75°), where land gravity is absent (see Figure 14). Contrary to that, in well-surveyed areas, such as the one in the region of Thessaly at (φ = 40.7° and λ = 22.4°), no improvement is found. Similar results can be found also in Pindos, where when land gravity data are close to the GNSS/levelling BM, the solution with GOCE does not improve the results. On the other hand, in non-surveyed areas (e.g., φ = 40 ° and λ = 21.7°) and close to the boarders where no land data exist, the GOCE-combined solution improves the results.

5. Conclusions

A methodological scheme for a reduction in filtered GOCE SGG data to an MO and then to the ES and/or the geoid was presented, with the main aim being to use GOCE observables directly for geoid modeling, rather than through spherical harmonics expansion. The goal was to investigate whether GOCE data can contribute, and under what circumstances, to improved local geoid estimates, when combined with local gravity data. The projection to an MO was performed using an analytical Taylor expansion and TIM_R6 to provide information for the radial derivatives of the potential. For the DC to the Earth’s surface and the geoid, an iterative MC simulation method based on IOST was devised, during which a ground truth dataset was used to provide the reference values at the level of DC so that the GOCE data at the MO can be moved. In this iteration process, upward/downward continuation is repeated until the process converges to a difference in the std between a consecutive solution at the 0.00001 mGal level. From the various ground truth fields tested, the one that provided the overall best results was that with gravity anomalies form TIM-R6 to c/o 300, which was used for the DC of both the T z z M O and the synthesized T x x y y M O fields, after 5769 and 5489 iterations, respectively.
The geoid determination was based on both spectral and stochastic methods, employing FFT and LSC, respectively. When using the GOCE gravity anomalies Δ g f   r e s   x x y y ,   Δ g f   r e s   z z ,   Δ g f   r e s   f i l t   x x y y and Δ g f   r e s   f i l t   z z , even in the FFT solution where they are merged with the local gravity data, an improvement to the agreement with GNSS/levelling data by 24.58%, 18.03%, 14.53% and 27.78%, respectively, is found relative to the local-gravity-only solution. LSC was then used for local geoid modeling as there is no need to merge and grid the data while heterogenous data can be employed. The prediction was performed over three areas with different topographic and land/sea characteristics. In the worst case, over Thessaly, the use of GOCE data improved the differences to the available GNSS/leveling data by 14.73%, while over the mountainous area of Pindos, improved results were found for 32.88% of BMs and over the island of Crete for 57.10% of the BMs. Improvements were found, in most cases, in areas along the land/sea boundary with sparse shipborne data, at the geographic border of Greece where gravity data were not available, and over rough terrain where, in general, gravity observations are very few or absent. The results achieved are very promising, since they can lead to more reliable geoid estimates for areas with few land gravity observations or/and over islands where, in general, marine gravity is scarce. Moreover, the use of GOCE data in such local geoid estimations can assist the efforts for the realization of the International Horizontal Reference System (IHRS) by estimating potential values at IHRS stations with few and/or problematics land observations.

Supplementary Materials

The following supporting information can be downloaded at: https://www.mdpi.com/article/10.3390/rs15040991/s1. In the supplementary material part of the extensive tests for the projection to the MO and the DC are given. Table S1: Statistics of the differences for the GOCE Tzz projection to the MO when using XGM2019e and GO_CONS_GCF_2_TIM_R6. Units: (Eötvös), Table S2: Statistics of the original TOM-R6 T z z M O and the generated T z z g enerated ones with the upward/downward continuation algorithm. Units: [Eötvös]. Figure S1: Differences for the GOCE Tzz projection to the MO when using XGM2019e and GO_CONS_GCF_2_TIM_R6. (Color bar axes (-0.005, 0.005) Eötvös), Figure S2. (a) The downward-continued free-air gravity anomalies Δ g f , and (b) their residuals ( Δ g f r e s ) with the ground data based on TIM_R6 d/o 200, Figure S3. (a) The downward continued free-air gravity anomalies Δ g f , and (b) their residuals Δ g f r e s with the ground data based on TIM_R6 d/o 250, Figure S4. (a) The downward continued free-air gravity anomalies Δ g f , and (b) their residuals Δ g f r e s with the ground data based on TIM_R6 d/o 300, Figure S5. (a) The downward continued free-air gravity anomalies Δ g f , and (b) their residuals Δ g f r e s with the ground data based on EGM2008 d/o 2190, Figure S6. (a) The downward continued free-air gravity anomalies Δ g f , and (b) their residuals Δ g f r e s with the ground data based on XGM2019e_2159 d/o 2190, Table S3. Statistics of the downward continued free-air gravity anomalies Δ g f and their residuals Δ g f r e s with the ground truth data. Unit: (mGal), Figure S7. Gravity anomaly differences between the DC solutions: (a) TIM_R6 d/o 200 and TIM_R6 d/o 250, (b) TIM_R6 d/o 200 and TIM_R6 d/o 300, (c) TIM_R6 d/o 200 and EGM2008 d/o 2190, Figure S8. Gravity anomaly differences between the DC solutions: (d) TIM_R6 d/o 200 and XGM2190e d/o 2190, (e) TIM_R6 d/o 250 and TIM_R6 d/o 300, (f) TIM_R6 d/o 250 and EGM2008 d/o 2190, Figure S9. Gravity anomaly differences between the DC solutions: (g) TIM_R6 d/o 250 and XGM2190e d/o 2190, (h) TIM_R6 d/o 300 and XGM2190e d/o 2190, (i) TIM_R6 d/o 300 and EGM2008 d/o 2190, Figure S10. Gravity anomaly differences between the DC solutions: (j) EGM2008 d/o 2190 and XGM2190e d/o 2190, Table S4. Statistics of the differences between the DC solutions. Unit: (mGal).

Author Contributions

Conceptual design of the experiment and analysis, G.S.V. and I.N.T.; GOCE gradient reference to the Mean Orbit D.A.N., E.G.M. and E.A.P.; GOCE downward continuation to the Earth’s surface D.A.N. and E.G.M.; gravity reductions and geoid estimation by FFT D.A.N. and I.N.T.; geoid estimation by LSC D.A.N. and G.S.V.; geoid validation D.A.N.; writing—original draft preparation, E.G.M., E.A.P. and D.A.N.; writing—review and editing, I.N.T. and G.S.V.; visualization, E.A.P., E.G.M., D.A.N. and G.S.V.; supervision, G.S.V. and I.N.T.; project administration, I.N.T.; funding acquisition, I.N.T. All authors have read and agreed to the published version of the manuscript.

Funding

This research was funded by the Hellenic Foundation for Research and Innovation (H.F.R.I.) under the “1st Call for H.F.R.I. Research Projects to support Faculty members and Researchers and the procurement of high-cost research equipment grant” in the frame of the GeoGravGOCE Project (Project Number: 3488).

Data Availability Statement

In the frame of the GeoGravGOCE project, dedicated software was designed, where filtering can be tested as well. The software source code as well as sample 1-day GOCE data can be downloaded from https://github.com/gsvergos/GeoGravGOCE and http://olimpia.topo.auth.gr/GeoGravGOCE/software/software.html to investigate the filtering tools used to produce the GOCE gradients residuals. The GNSS/leveling data were provided by the Hellenic Cadaster, Ktimalogio S.A., in the frame of a memorandum of understanding with the Department of Geodesy and Surveying, AUTH. The gravity data were provided by the Hellenic Geographic Military Service in the frame of a memorandum of understanding with the Department of Geodesy and Surveying, AUTH.

Acknowledgments

We gratefully acknowledge the three anonymous reviewers for their constructive comments.

Conflicts of Interest

The authors declare no conflict of interest.

References

  1. Rummel, R.; Yi, W.; Stummer, C. GOCE Gravitational Gradiometry. J. Geod. 2011, 85, 777–790. [Google Scholar] [CrossRef]
  2. Rummel, R.; Gruber, T.; Flury, J.; Schlicht, A. ESA’s Gravity Field and Steady-State Ocean Circulation Explorer GOCE. ZFV—Z. Fur Geodasie Geoinf. Und Landmanag. 2009, 134, 125–130. [Google Scholar]
  3. Drinkwater, M.R.; Haagmans, R.; Muzi, D.; Popescu, A.; Floberghagen, R.; Kern, M.; Fehringer, M. The GOCE Gravity Mission: ESA’S First Core Earth Explorer. In Proceedings of the 3rd GOCE User Workshop, ESA SP-627, Frascati, Italy, 6–8 November 2006; European Space Agency: Noordwijk, The Netherlands, 2007; pp. 1–7. [Google Scholar]
  4. Tóth, G.; Földvári, L.; Tziavos, I.N.; Ádám, J. Upward/Downward Continuation of Gravity Gradients for Precise Geoid Determination. Acta Geod. Geophys. Hung. 2006, 41, 21–30. [Google Scholar] [CrossRef]
  5. Sinem Ince, E.; Barthelmes, F.; Reißland, S.; Elger, K.; Förste, C.; Flechtner, F.; Schuh, H. ICGEM—15 Years of Successful Collection and Distribution of Global Gravitational Models, Associated Services, and Future Plans. Earth Syst. Sci. Data 2019, 11, 647–674. [Google Scholar] [CrossRef]
  6. Barzaghi, R.; Carrion, D.; Vergos, G.S.; Tziavos, I.N.; Grigoriadis, V.N.; Natsiopoulos, D.A.; Bruinsma, S.; Reinquin, F.; Seoane, L.; Bonvalot, S.; et al. GEOMED2: High-Resolution Geoid of the Mediterranean. In Proceedings of the International Symposium on Advancing Geodesy in a Changing World, Kobe, Japan, 30 July–August 2017; Freymueller, J., Sánchez, L., Eds.; Springer: Berlin/Heidelberg, Germany, 2019; Volume 149, pp. 43–50. [Google Scholar] [CrossRef]
  7. Matsuo, K.; Kuroishi, Y. Refinement of a Gravimetric Geoid Model for Japan Using GOCE and an Updated Regional Gravity Field Model. Earth Planets Sp. 2020, 72, 1–18. [Google Scholar] [CrossRef]
  8. Van der Meijde, M.; Pail, R.; Bingham, R.; Floberghagen, R. GOCE Data, Models, and Applications: A Review. Int. J. Appl. Earth Obs. Geoinf. 2015, 35, 4–15. [Google Scholar] [CrossRef]
  9. Vu, D.T.; Bruinsma, S.; Bonvalot, S.; Remy, D.; Vergos, G.S. A Quasigeoid-Derived Transformation Model Accounting for Land Subsidence in the Mekong Delta towards Height System Unification in Vietnam. Remote Sens. 2020, 12, 817. [Google Scholar] [CrossRef]
  10. Grigoriadis, V.N.; Vergos, G.S.; Barzaghi, R.; Carrion, D.; Koç, Ö. Collocation and FFT-Based Geoid Estimation within the Colorado 1 Cm Geoid Experiment. J. Geod. 2021, 95, 1–18. [Google Scholar] [CrossRef]
  11. Wang, Y.M.; Sánchez, L.; Ågren, J.; Huang, J.; Forsberg, R.; Abd-Elmotaal, H.A.; Ahlgren, K.; Barzaghi, R.; Bašić, T.; Carrion, D.; et al. Colorado Geoid Computation Experiment: Overview and Summary. J. Geod. 2021, 95, 1–21. [Google Scholar] [CrossRef]
  12. Marchenko, A.N.; Marchenko, D.A.; Lopushansky, A.N. Gravity Field Models Derived from the Second Degree Radial Derivatives of the GOCE Mission: A Case Study. Ann. Geophys. 2017, 59, S0649. [Google Scholar] [CrossRef]
  13. Marchenko, A.; Abrikosov, O. Geoid in the West Ukraine Area Derived by Means of Non-Central Multipole Analysis Technique. In Gravity and Geoid; International Association of Geodesy Symposia; Sünkel, H., Marson, I., Eds.; Springer: Berlin/Heidelberg, Germany, 1995; Volume 113, pp. 624–630. [Google Scholar]
  14. Vergos, G.S.; Erol, B.; Natsiopoulos, D.A.; Grigoriadis, V.N.; Işık, M.S.; Tziavos, I.N. Preliminary Results of GOCE-Based Height System Unification between Greece and Turkey over Marine and Land Areas. Acta Geod. Geophys. 2018, 53, 61–79. [Google Scholar] [CrossRef]
  15. Andritsanos, V.D.; Grigoriadis, V.N.; Natsiopoulos, D.A.; Vergos, G.S.; Gruber, T.; Fecher, T. GOCE Variance and Covariance Contribution to Height System Unification. In Proceedings of the International Symposium on Gravity, Geoid and Height Systems, Thessaloniki, Greece, 19–23 September 2016; Vergos, G., Pail, R., Barzaghi, R., Eds.; Springer: Berlin/Heidelberg, Germany, 2019; Volume 148, pp. 157–164. [Google Scholar] [CrossRef]
  16. Andritsanos, V.; Grigoriadis, V.; Vergos, G.; Pagounis, V.; Tziavos, I. GOCE/GRACE GGM Evaluation over Attica and Thessaloniki, Greece and Local Geoid Modelling in Support of Height Unification. South-East. Eur. J. Earth Obs. Geomat. 2015, 4, 105–122. [Google Scholar]
  17. Sánchez, L. Towards a Vertical Datum Standardisation under the Umbrella of Global Geodetic Observing System. J. Geod. Sci. 2012, 2, 325–342. [Google Scholar] [CrossRef]
  18. Sánchez, L.; Ågren, J.; Huang, J.; Wang, Y.M.; Mäkinen, J.; Pail, R.; Barzaghi, R.; Vergos, G.S.; Ahlgren, K.; Liu, Q. Strategy for the Realisation of the International Height Reference System (IHRS). J. Geod. 2021, 95, 1–33. [Google Scholar] [CrossRef]
  19. Ihde, J.; Sánchez, L.; Barzaghi, R.; Drewes, H.; Foerste, C.; Gruber, T.; Liebsch, G.; Marti, U.; Pail, R.; Sideris, M. Definition and Proposed Realization of the International Height Reference System (IHRS). Surv. Geophys. 2017, 38, 549–570. [Google Scholar] [CrossRef]
  20. Gruber, T.; Gerlach, C.; Haagmans, R. Intercontinental Height Datum Connection with GOCE and GPS-Levelling Data. J. Geod. Sci. 2012, 2, 270–280. [Google Scholar] [CrossRef]
  21. Willberg, M.; Gruber, T.; Vergos, G.S. Analysis of GOCE Omission Error and Its Contribution to Vertical Datum Offsets in Greece and Its Islands. In Proceedings of the International Symposium on Gravity, Geoid and Height Systems, Thessaloniki, Greece, 19–23 September 2016; Vergos, G., Pail, R., Barzaghi, R., Eds.; Springer: Berlin/Heidelberg, Germany, 2019; Volume 148, pp. 143–148. [Google Scholar] [CrossRef]
  22. Migliaccio, F.; Reguzzoni, M.; Gatti, A. A GOCE-Only Global Gravity Field Model by the Space-Wise Approach. Geophys. Res. Abstr. 2011, 13, EGU2011-10063-3. [Google Scholar]
  23. Pail, R.; Bruinsma, S.; Migliaccio, F.; Förste, C.; Goiginger, H.; Schuh, W.-D.; Höck, E.; Reguzzoni, M.; Brockmann, J.; Abrikosov, O.; et al. First GOCE Gravity Field Models Derived by Three Different Approaches. J. Geod. 2011, 85, 819–843. [Google Scholar] [CrossRef]
  24. Bouman, J.; Ebbing, J.; Fuchs, M.; Sebera, J.; Lieb, V.; Szwillus, W.; Haagmans, R.; Novak, P. Satellite Gravity Gradient Grids for Geophysics. Sci. Rep. 2016, 6, 1–11. [Google Scholar] [CrossRef]
  25. Sebera, J.; Šprlák, M.; Novák, P.; Bezděk, A.; Va’ko, M. Iterative Spherical Downward Continuation Applied to Magnetic and Gravitational Data from Satellite. Surv. Geophys. 2014, 35, 941–958. [Google Scholar] [CrossRef]
  26. Xiaogang, L.; Kai, W. Downward Continuation of Satellite Gravity Gradient Data Based on Poisson Integral Iteration Method. Procedia Environ. Sci. 2012, 12, 721–728. [Google Scholar] [CrossRef]
  27. Wu, Y.; Zhou, H.; Zhong, B.; Luo, Z. Regional Gravity Field Recovery Using the GOCE Gravity Gradient Tensor and Heterogeneous Gravimetry and Altimetry Data. J. Geophys. Res. Solid Earth 2017, 122, 6928–6952. [Google Scholar] [CrossRef]
  28. Lu, B.; Förste, C.; Barthelmes, F.; Petrovic, S.; Flechtner, F.; Luo, Z.; Zhong, B.; Zhou, H.; Wang, X.; Wu, T. Using Real Polar Ground Gravimetry Data to Solve the GOCE Polar Gap Problem in Satellite-Only Gravity Field Recovery. J. Geod. 2020, 94, 1–12. [Google Scholar] [CrossRef]
  29. Sideris, M.G. On the Use of Heterogeneous Noisy Data in Spectral Gravity Field Modeling Methods. J. Geod. 1996, 70, 470–479. [Google Scholar] [CrossRef]
  30. Andritsanos, V.D.; Sideris, M.G.; Tziavos, I.N. Quasi-Stationary Sea Surface Topography Estimation by the Multiple Input/Output Method. J. Geod. 2001, 75, 216–226. [Google Scholar] [CrossRef]
  31. Grebenitcharsky, R.; Moore, P. Application of Wavelets for Along-Track Multi-Resolution Analysis of GOCE SGG Data. Int. Assoc. Geod. Symp. 2014, 141, 41–50. [Google Scholar] [CrossRef]
  32. Arabelos, D.N.; Tscherning, C.C.; Veicherts, M. External Calibration of GOCE SGG Data with Terrestrial Gravity Data: A Simulation Study. In Dynamic Planet; International Association of Geodesy Symposia; Springer: Berlin/Heidelberg, Germany, 2007. [Google Scholar]
  33. ESA. GOCE High Level Processing Facility GOCE Level 2 Product Data Handbook; ESA: Paris, France, 2014. [Google Scholar]
  34. Pitenis, E.; Mamagiannou, E.; Natsiopoulos, D.A.; Vergos, G.S.; Tziavos, I.N.; Grigoriadis, V.N.; Sideris, M.G. FIR, IIR and Wavelet Algorithms for the Rigorous Filtering of GOCE SGG Data to the GOCE MBW. Remote Sens. 2022, 14, 3024. [Google Scholar] [CrossRef]
  35. Mamagiannou, E.; Pitenis, E.; Natsiopoulos, D.A.; Vergos, G.S.; Tziavos, I.N. GeoGravGOCE: A Standalone MATLAB GUI for Processing GOCE Satellite Gradient Data. Comput. Geosci. 2022, 166, 105184. [Google Scholar] [CrossRef]
  36. Jan Martin, B.; Till, S.; Torsten, M.-G.; Schuh, W.-D. The Earth’s Gravity Field as Seen by the GOCE Satellite—An Improved Sixth Release Derived with the Time-Wise Approach (GO_CONS_GCF_2_TIM_R6); GFZ Data Services; ICGEM: Trieste, Italy, 2019; Volume 3, pp. 1–9. [Google Scholar] [CrossRef]
  37. Pavlis, N.K.; Holmes, S.A.; Kenyon, S.C.; Factor, J.K. The Development and Evaluation of the Earth Gravitational Model 2008 (EGM2008). J. Geophys. Res. Solid Earth 2012, 117, 8916. [Google Scholar] [CrossRef] [Green Version]
  38. Gruber, T.; Rummel, R.; Koop, R. HOW to Use GOCE Level 2 Products. In Proceedings of the 3rd International GOCE User Workshop, ESA-ESRIN, Frascati, Italy, 6–8 November 2006; European Space Agency: Paris, France, 2007; Volume 2006, pp. 205–211. [Google Scholar]
  39. Šprlák, M. A Graphical User Interface Application for Evaluation of the Gravitational Tensor Components Generated by a Level Ellipsoid of Revolution. Comput. Geosci. 2012, 46, 77–83. [Google Scholar] [CrossRef]
  40. Piretzidis, D. Study and Data Process of GOCE Satellite Mission, and Approximation of the Gravity Field of the Earth in Global and Regional Scale. Ph.D. Thesis, Aristotle University of Thessaloniki, Thessaloniki, Greece, 2014. [Google Scholar]
  41. Tóth, G.; Földváry, L. Effect of Geopotential Model Errors on the Projection of GOCE Gradiometer Observables. In Gravity, Geoid and Space Missions; International Association of Geodesy Symposia; Jekeli, C., Bastos, L., Fernandes, J., Eds.; Springer: Berlin/Heidelberg, Germany, 2005; Volume 129, pp. 72–76. [Google Scholar]
  42. Novák, P.; Sebera, J.; Vaľko, M.; Šprlák, M.; Zdenek, M.; Sneeuw, N.; Roth, M.; Vermerseen, B.; van der Wal, W.; Baur, O.; et al. Towards a Better Understanding of the Earth’s Interior and Geophysical Exploration Research; EGU: Munich, Germany, 2013. [Google Scholar]
  43. Bucha, B.; Janák, J. A MATLAB-Based Graphical User Interface Program for Computing Functionals of the Geopotential up to Ultra-High Degrees and Orders. Comput. Geosci. 2013, 56, 186–196. [Google Scholar] [CrossRef]
  44. Sebera, J.; Pitoňák, M.; Hamáčková, E.; Novák, P. Comparative Study of the Spherical Downward Continuation. Surv. Geophys. 2015, 36, 253–267. [Google Scholar] [CrossRef]
  45. Janák, J.; Mikula, K.; Šprlák, M. Downward Continuation of Satellite Gradiometry Data. In Proceedings of the 3rd International GOCE User Workshop, ESA-ESRIN, Frascati, Italy, 6–8 November 2006; European Space Agency: Paris France, 2007; pp. 109–113. [Google Scholar]
  46. Martinec, Z. Stability Investigations of a Discrete Downward Continuation Problem for Geoid Determination in the Canadian Rocky Mountains. J. Geod. 1996, 70, 805–828. [Google Scholar] [CrossRef]
  47. Novák, P.; Šprlák, M.; Pitoňák, M. On Determination of the Geoid from Measured Gradients of the Earth’s Gravity Field Potential. Earth-Sci. Rev. 2021, 221, 103773. [Google Scholar] [CrossRef]
  48. Huang, J.; Véronneau, M. Applications of Downward-Continuation in Gravimetric Geoid Modeling: Case Studies in Western Canada. J. Geod. 2005, 79, 135–145. [Google Scholar] [CrossRef]
  49. Novák, P.; Heck, B. Downward Continuation and Geoid Determination Based on Band-Limited Airborne Gravity Data. J. Geod. 2002, 76, 269–278. [Google Scholar] [CrossRef]
  50. Chen, M.; Yang, W. An Enhancing Precision Method for Downward Continuation of Gravity Anomalies. J. Appl. Geophys. 2022, 204, 104753. [Google Scholar] [CrossRef]
  51. Kusche, J. A Monte-Carlo Technique for Weight Estimation in Satellite Geodesy. J. Geod. 2003, 76, 641–652. [Google Scholar] [CrossRef]
  52. Mosegaard, K.; Tarantola, A. Monte Carlo Sampling of Solutions to Inverse Problems. J. Geophys. Res. 1995, 100, 12431–12447. [Google Scholar] [CrossRef]
  53. Kirkpatrick, S.; Gelatt, C.D.; Vecchi, M.P. Optimization by Simulated Annealing. Science 1983, 220, 671–680. [Google Scholar] [CrossRef]
  54. Grebenitcharsky, R.S.; Vergos, G.S.; Piretzidis, D.; Tziavos, I.N. GOCE Gradient Downward Continuation for Local/Regional Gravity Field Recovery. In Proceedings of the 5th International GOCE User Workshop, Paris, France, 25–28 November 2014. [Google Scholar]
  55. Heiskanen, W.; Moritz, H. Physical Geodesy; W. H. Freeman: San Francisco, CA, USA, 1967; 364p. [Google Scholar]
  56. Novák, P.; Šprlák, M.; Tenzer, R.; Pitoňák, M. Integral Formulas for Transformation of Potential Field Parameters in Geosciences. Earth-Sci. Rev. 2017, 164, 208–231. [Google Scholar] [CrossRef]
  57. Andritsanos, V.D.; Tziavos, I.N. Estimation of Gravity Field Parameters by a Multiple Input/Output System. Phys. Chem. Earth Part A Solid Earth Geod. 2000, 25, 39–46. [Google Scholar] [CrossRef]
  58. Andritsanos, V.D.; Vergos, G.S.; Tziavos, I.N.; Pavlis, E.C.; Mertikas, S.P. A High-Resolution Geoid for the Establishment of the GAVDOS Multi-Satellite Calibration Site. In Gravity, Geoid and Geodynamics 2000; Springer: Berlin/Heidelberg, Germany, 2002; Volume 123, pp. 347–354. [Google Scholar]
  59. Vergos, G.S.; Tziavos, I.N.; Andritsanos, V.D. On the Determination of Marine Geoid Models by Least-Squares Collocation and Spectral Methods Using Heterogeneous Data. In A Window on the Future of Geodesy; International Association of Geodesy Symposia; Springer: Berlin/Heidelberg, Germany, 2005; Volume 128, pp. 332–337. [Google Scholar] [CrossRef]
  60. Barzaghi, R.; Maggi, A.; Tselfes, N.; Tsoulis, D.; Tziavos, I.N.; Vergos, G.S. Combination of Gravimetry, Altimetry and GOCE Data for Geoid Determination in the Mediterranean: Evaluation by Simulation. In Observing our Changing Earth; Springer: Berlin/Heidelberg, Germany, 2009; Volume 133, pp. 195–201. [Google Scholar]
  61. Sanso, F.; Sideris, M. On the Similarities and Differences between Systems Theory and Least-Squares Collocation in Physical Geodesy. Bolletino Di Geod. Sci. Affin. 1997, 2, 173–206. [Google Scholar]
  62. Barzaghi, R.; Tselfes, N.; Tziavos, I.N.; Vergos, G.S. Geoid and High Resolution Sea Surface Topography Modelling in the Mediterranean from Gravimetry, Altimetry and GOCE Data: Evaluation by Simulation. J. Geod. 2009, 83, 751–772. [Google Scholar] [CrossRef]
  63. Eshagh, M. On Integral Approach to Regional Gravity Field Modelling from Satellite Gradiometric Data. Acta Geophys. 2010, 59, 29–54. [Google Scholar] [CrossRef]
  64. Eshagh, M. Alternative Expressions for Gravity Gradients in Local North-Oriented Frame and Tensor Spherical Harmonics. Acta Geophys. 2009, 58, 215–243. [Google Scholar] [CrossRef]
  65. Sansò, F.; Vergos, G.; Tziavos, I.; Venuti, G.; Grigoriadis, V. Geoid and Sea Surface Topography from Satellite and Ground Data in the Mediterranean Region—A Review and New Proposals. Bull. Geod. Geomat. 2008, 67, 155–201. [Google Scholar]
  66. Zingerle, P.; Pail, R.; Gruber, T.; Oikonomidou, X. The Combined Global Gravity Field Model XGM2019e. J. Geod. 2020, 94, 1–12. [Google Scholar] [CrossRef]
  67. Tziavos, I.N.; Vergos, G.S.; Grigoriadis, V.N.; Tzanou, E.A.; Natsiopoulos, D.A. Validation of GOCE/GRACE Satellite Only and Combined Global Geopotential Models Over Greece in the Frame of the GOCESeaComb Project. In IAG 150 Years, Proceedings of the IAG Scientific Assembly, Postdam, Germany, 1–6 September 2013; Rizos, C., Willis, P., Eds.; Springer International Publishing: Berlin/Heidelberg, Germany, 2016; pp. 297–304. ISBN 978-3-319-30895-1. [Google Scholar]
  68. Vergos, G.S.; Grigoriadis, V.N.; Tziavos, I.N.; Kotsakis, C. Evaluation of GOCE/GRACE Global Geopotential Models over Greece with Collocated GPS/Levelling Observations and Local Gravity Data. In Gravity, Geoid and Height Systems; International Association of Geodesy Symposia; Marti, U., Ed.; Springer: Cham, Switzerland, 2014; Volume 141, pp. 85–92. [Google Scholar]
  69. Mallat, S.G. A Theory for Multiresolution Signal Decomposition: The Wavelet Representation. IEEE Trans. Pattern Anal. Mach. Intell. 1989, 11, 674–693. [Google Scholar] [CrossRef]
  70. Daubechies, I. Ten Lectures on Wavelets; Society for Industrial and Applied Mathematics: Philadelphia, PA, USA, 1992; ISBN 9780898712742. [Google Scholar]
  71. Balodimos, D.D. Geoidal Studies in Greece; University of Oxford: Oxford, UK, 1972. [Google Scholar]
  72. Arabelos, D.N. Undersuchungen Zur Gravimetrischen Geoidbestimmung Dagerstellt Am Testgebiet Griechenland, Wiss. Arb. Ph.D. Thesis, University Hannover, Hannover, Germany, 1980. [Google Scholar]
  73. Tziavos, I.N. Study of the Optimal Combination of Heterogeneous Data on Geoid Determination with Applications for the Area of Greece. Ph.D. Thesis, Aristotle University of Thessaloniki, Thessaloniki, Greece, 1984. [Google Scholar]
  74. Arabelos, D.; Tziavos, I.N. Determination of Deflections of the Vertical Using a Combination of Spherical Harmonics and Gravimetric Data for the Area of Greece. Bull. Géodésique 1983, 57, 240–256. [Google Scholar] [CrossRef]
  75. Tziavos, I.N.; Andritsanos, V.D. Recent Geoid Computations for the Hellenic Area. Phys. Chem. Earth Part A Solid Earth Geod. 1999, 24, 91–96. [Google Scholar] [CrossRef]
  76. Tziavos, I.N.; Vergos, G.S.; Grigoriadis, V.N. Investigation of Topographic Reductions and Aliasing Effects on Gravity and the Geoid over Greece Based on Various Digital Terrain Models. Surv. Geophys. 2010, 31, 23–67. [Google Scholar] [CrossRef]
  77. Tziavos, I.N.; Vergos, G.S.; Mertikas, S.P.; Daskalakis, A.; Grigoriadis, V.N.; Tripolitsiotis, A. The Contribution of Local Gravimetric Geoid Models to the Calibration of Satellite Altimetry Data and an Outlook of the Latest GOCE GGM Performance in Gavdos. Adv. Sp. Res. 2013, 51, 1502–1522. [Google Scholar] [CrossRef]
  78. Tscherning, C.C.; Forsberg, R. Geoid Determination in the Nordic Countries from Gravity and Height Data. Boll. Geod. Sci. Affin. 1987, 46, 21–43. [Google Scholar]
  79. Hirt, C.; Kuhn, M.; Claessens, S.; Pail, R.; Seitz, K.; Gruber, T. Study of the Earth’s Short-Scale Gravity Field Using the ERTM2160 Gravity Model. Comput. Geosci. 2014, 73, 71–80. [Google Scholar] [CrossRef]
  80. Rexer, M.; Hirt, C.; Bucha, B.; Holmes, S. Solution to the Spectral Filter Problem of Residual Terrain Modelling (RTM). J. Geod. 2017, 92, 675–690. [Google Scholar] [CrossRef]
  81. Rexer, M.; Hirt, C.; Claessens, S.; Tenzer, R. Layer-Based Modelling of the Earth’s Gravitational Potential up to 10-Km Scale in Spherical Harmonics in Spherical and Ellipsoidal Approximation. Surv. Geophys. 2016, 37, 1035–1074. [Google Scholar] [CrossRef]
  82. Sideris, M.G. Geoid Determination by FFT Techniques. In Geoid Determination: Theory and Methods; Lecture Notes in Earth System Sciences; Springer: Berlin/Heidelberg, Germany, 2013; Volume 110, pp. 453–516. [Google Scholar] [CrossRef]
  83. Sansò, F.; Sideris, M.G. The Local Modelling of the Gravity Field by Collocation. In Geoid Determination: Theory and Methods; Lecture Notes in Earth System Sciences; Springer: Berlin/Heidelberg, Germany, 2013; Volume 110, pp. 203–258. [Google Scholar] [CrossRef]
  84. Tscherning, C.C. Geoid Determination by 3D Least-Squares Collocation. In Geoid Determination: Theory and Methods; Lecture Notes in Earth System Sciences; Springer: Berlin/Heidelberg, Germany, 2013; Volume 110, pp. 311–336. [Google Scholar] [CrossRef]
  85. Grigoriadis, V.N. Geodetic and Geophysical Approximation of the Earth’s Gravity Field and Applications in the Hellenic Area. Ph.D. Thesis, Aristotle Unversity of Thessaloniki, Thessaloniki, Greece, 2009. [Google Scholar]
  86. Mertikas, S.P.; Daskalakis, A.; Tziavos, I.N.; Andersen, O.B.; Vergos, G.S.; Tripolitsiotis, A.; Zervakis, V.; Frantzis, X.; Partsinevelos, P. Altimetry, Bathymetry and Geoid Variations at the Gavdos Permanent Cal/Val Facility. Adv. Sp. Res. 2013, 51, 1418–1437. [Google Scholar] [CrossRef]
  87. Kotsakis, C.; Katsambalos, K.; Ampatzidis, D. Estimation of the Zero-Height Geopotential Level WoLVD in a Local Vertical Datum from Inversion of Co-Located GPS, Leveling and Geoid Heights: A Case Study in the Hellenic Islands. J. Geod. 2012, 86, 1–17. [Google Scholar] [CrossRef]
  88. Tscherning, C.C.; Rapp, R.H. Closed Covariance Expressions for Gravity Anomalies, Geoid Undulations, and Deflections of the Vertical Implied by Anomaly Degree Variance Models; Rep. No 208; Ohio State University: Columbus, OH, USA, 1974; pp. 1–89. [Google Scholar]
  89. Haagmans, R.; de Min, E.; von Gelderen, M. Fast Evaluation of Convolution Integrals on the Sphere Using 1D FFT, and a Comparison with Existing Methods for Stokes’ Integral. Manuscr. Geod. 1993, 18, 227–241. [Google Scholar]
  90. Wong, L.; Gore, R. Accuracy of Geoid Heights from Modified Stokes Kernels. Geophys. J. R. Astron. Soc. 1969, 18, 81–91. [Google Scholar] [CrossRef] [Green Version]
  91. Forsberg, R.; Tscherning, C.C. An Overview Manual for the GRAVSOFT Geodetic Gravity Field Modelling Programs 208AD; DTU: Copenhagen, Denmark, 2008; p. 68. [Google Scholar]
Figure 1. Variation in T i j differences per km of altitude relative for (a) T x x , (b)   T y y and (c) T z z gradients.
Remotesensing 15 00991 g001
Figure 2. The projected to the MO (a) T x x M O , (b)   T y y M O and (c) T z z M O gradients.
Remotesensing 15 00991 g002
Figure 3. (a) The original T z z M O  at MO = 230 km, (b) the DC free-air gravity anomalies, (c) their residuals  Δ g f r e s with the ground data based on TIM_R6 d/o 300.
Remotesensing 15 00991 g003
Figure 4. (a) The synthesized T x x y y M O at MO = 230 km, (b) the DC free-air gravity anomalies, (c) their residuals Δ g f r e s with the ground data based on TIM_R6 d/o 300.
Remotesensing 15 00991 g004
Figure 5. (a) The difference between the DC solutions from the T z z M O  and T x x y y M O tests, (b) RMSE from T z z M O test, (c) RMSE from T x x y y M O test.
Remotesensing 15 00991 g005
Figure 6. The difference between the T z z M O  and T x x y y M O gradients.
Remotesensing 15 00991 g006
Figure 7. (a) The filtered synthesized T zz M O f i l t at MO = 230 km, (b) the DC free-air gravity anomalies on earth’s surface Δ g f   f i l t , (c) their residuals Δ g f r e s   f i l t with the ground data based on TIM_R6 d/o 300.
Remotesensing 15 00991 g007
Figure 8. (a) The filtered synthesized T x x y y M O f i l t at MO = 230 km, (b) the DC free-air gravity anomalies on earth’s surface Δ g f   f i l t , (c) their residuals Δ g f r e s   f i l t with the ground data based on TIM_R6 d/o 300.
Remotesensing 15 00991 g008
Figure 9. (a) The difference between the DC solutions from the T z z M O f i l t and T x x y y M O f i l t tests, (b) RMSE from T z z M O f i l t test, (c) RMSE from T x x y y M O f i l t test.
Remotesensing 15 00991 g009
Figure 10. (a) The difference between the DC solutions from the T z z M O  and the T z z M O f i l t tests and (b) the T x x y y M O   and the T x x y y M O f i l t tests.
Remotesensing 15 00991 g010
Figure 11. The available free-air gravity anomaly field (mGal).
Remotesensing 15 00991 g011
Figure 12. Geographical distribution of the 2431 GNSS/levelling benchmarks over Greece.
Remotesensing 15 00991 g012
Figure 13. Empirical covariance function of the residual local gravity anomalies (black dashed line) and fitted model covariance function of the residual field (gray dashed line).
Remotesensing 15 00991 g013
Figure 14. Distribution of available gravity and GNSS/levelling data over (a) Pindos, (b) Thessaly and (c) Crete. In all figures, red dots depict the available terrestrial gravity values, black dots the 1′ × 1′ GOCE-derived gravity and the blue triangles the GNSS/leveling BMs.
Remotesensing 15 00991 g014
Figure 15. GNSS/levelling BMs with improved differences when using model i (blue dots) and BMs with no improvement (red dots).
Remotesensing 15 00991 g015
Figure 16. GNSS/levelling BMs over Pindos with improved differences when using the LSC combined model (blue dots) and BMs where the LSC with land gravity is better (red dots).
Remotesensing 15 00991 g016
Figure 17. GNSS/levelling BMs over Thessaly with improved differences when using the LSC combined model (blue dots) and BMs where the LSC with land gravity is better (red dots).
Remotesensing 15 00991 g017
Figure 18. GNSS/levelling BMs over Crete with improved differences when using the LSC combined model (blue dots) and BMs where the LSC with land gravity is better (red dots).
Remotesensing 15 00991 g018
Table 1. Statistics of the T i j differences per km of altitude. Units: (Eötvös).
IdkmMinMaxMeanStd
T x x (295–296)−0.00710.00620.00000.0006
(290–291)−0.00750.00660.00000.0006
(280–281)−0.00820.00720.00000.0006
(270–281)−0.00900.00800.00000.0007
(260–261)−0.00990.00890.00000.0007
(250–251)−0.01100.01000.00000.0008
(240–241)−0.01220.01120.00000.0009
(230–231)−0.01360.01270.00000.0010
T y y (295–296)−0.00520.00480.00000.0005
(290–291)−0.00550.00510.00000.0006
(280–281)−0.00620.00560.00000.0006
(270–281)−0.00700.00620.00000.0007
(260–261)−0.00800.00700.00000.0007
(250–251)−0.00910.00780.00000.0008
(240–241)−0.01050.00880.00000.0009
(230–231)−0.01200.00990.00000.0010
T z z (295–296)−0.00800.00840.00000.0009
(290–291)−0.00850.00890.00000.0009
(280–281)−0.00930.00990.00000.0010
(270–281)−0.01040.01130.00000.0011
(260–261)−0.01160.01280.00000.0012
(250–251)−0.01300.01460.00000.0013
(240–241)−0.01470.01670.00000.0015
(230–231)−0.01660.01910.00000.0016
Table 2. Statistics of the T i j before and after their projection to the MO. Units: (Eötvös).
OrbitIdMinMaxMeanStd
Satellite Orbit T x x −1.10201.3058−0.03320.2318
T y y −0.85450.833−0.05080.1807
T z z −1.56531.09650.08390.3223
Mean Orbit T x x M O −1.17481.405−0.03410.2596
T y y M O −0.94671.0361−0.05230.2071
T z z M O −1.70631.15310.08640.3707
Table 3. Statistical values of the DC results for the entire GOCE time series.
MinMaxMeanStdUnit
T z z M O −1.8071.1980.0880.359Eötvös
Δ g f −175.889161.2037.33535.764mGal
Δ g f z z   r e s −139.008148.2060.19620.389mGal
T x x y y M O −2.8332.2050.0880.359Eötvös
Δ g f −175.888161.0457.33635.768mGal
Δgfxxyy res−139.080148.0430.19720.394mGal
Δ g f z z Δ g f x x y y −0.4500.6610.0000.032mGal
Table 4. Statistical values of the WL-filtered DC results for the entire GOCE time series.
MinMaxMeanStdUnit
T z z M O f i l t −1.3961.0760.0880.347Eötvös
Δ g f   f i l t −190.029177.3066.95337.617mGal
Δ g f r e s   f i l t −130.086139.079−0.18620.607mGal
T x x y y M O   f i l t −1.3941.0760.0880.347Eötvös
Δ g f   f i l t −190.070177.5356.95036.471mGal
Δ g f r e s   f i l t −130.636138.718−0.18920.622mGal
Δ g f z z   f i l t Δ g f x x y y   f i l t −0.7651.0240.0030.003mGal
Table 5. Statistical values of the difference between the DC solutions and the WL-filtered DC results. Units: (mGal).
MinMaxMeanStd
Δ g f z z Δ g f z z   f i l t −20.73821.7530.3824.170
Δ g f x x y y Δ g f x x y y   f i l t −20.96022.0350.3864.180
Table 6. Statistics of the local free-air gravity anomaly field and their residuals. Units: (mGal).
MinMaxMeanStd
Δ g f −236.100269.930−22.730±74.110
Δ g X G M −236.464212.762−22.405±74.164
Δ g T O P O −178.69382.077−2.389±11.463
Δ g f   r e s −20.96022.0350.386±4.180
Table 7. Statistics of the residual geoid heights ( N r e s ) for the various models. Units: (m).
Geoid ModelsMinMaxMeanStd
a−4.7795.163−0.003±0.999
b−4.5625.2380.001±0.973
c−4.7805.162−0.004±1.000
d−4.5685.2320.000±0.973
e−0.3531.2010.003±0.109
f−1.9972.4890.006±0.500
g−3.8562.6630.008±0.659
h−3.8512.5930.008±0.662
i−1.2761.1800.000±0.307
Table 8. Statistics of geoid height differences between the GNSS/leveling data and the FFT geoid models. Units: (m).
Geoid ModelsMinMaxMeanStdPoints Improved
N G P S N M O D E L   E −0.6640.402−0.107±0.123
N G P S N M O D E L   F −1.3521.222−0.042±0.438379
N G P S N M O D E L   G 2.016−1.8770.005±0.682278
N G P S N M O D E L   H 2.593−3.8510.008±0.682224
N G P S N M O D E L   I 0.712−1.173−0.126±0. 323428
Table 9. Statistics of geoid height differences between the GNSS/leveling data and the LSC models with number of BMs with improved differences compared to terrestrial gravity only model. Unit: (m).
MinMaxMeanStdPoints
Improved
P i n d o s   N G P S L S C l a n d −0.5290.379−0.053±0.120
P i n d o s   N G P S L S C c o m b −0.6200.568−0.059±0.18374
T h e s s .   ( N G P S L S C l a n d ) −0.6880.140−0.198±0.134
T h e s s .   N G P S L S C c o m b −1.1510.404−0.375±0. 37233
C r e t e   N G P S L S C l a n d −0.7210.088−0.258±0.157
C r e t e   N G P S L S C c o m b −0.6300.071−0.241±0.15389
Disclaimer/Publisher’s Note: The statements, opinions and data contained in all publications are solely those of the individual author(s) and contributor(s) and not of MDPI and/or the editor(s). MDPI and/or the editor(s) disclaim responsibility for any injury to people or property resulting from any ideas, methods, instructions or products referred to in the content.