
Scientific Evidence from Space—A Review of Spaceborne Remote Sensing Applications at the Science–Policy Interface

 , , , and
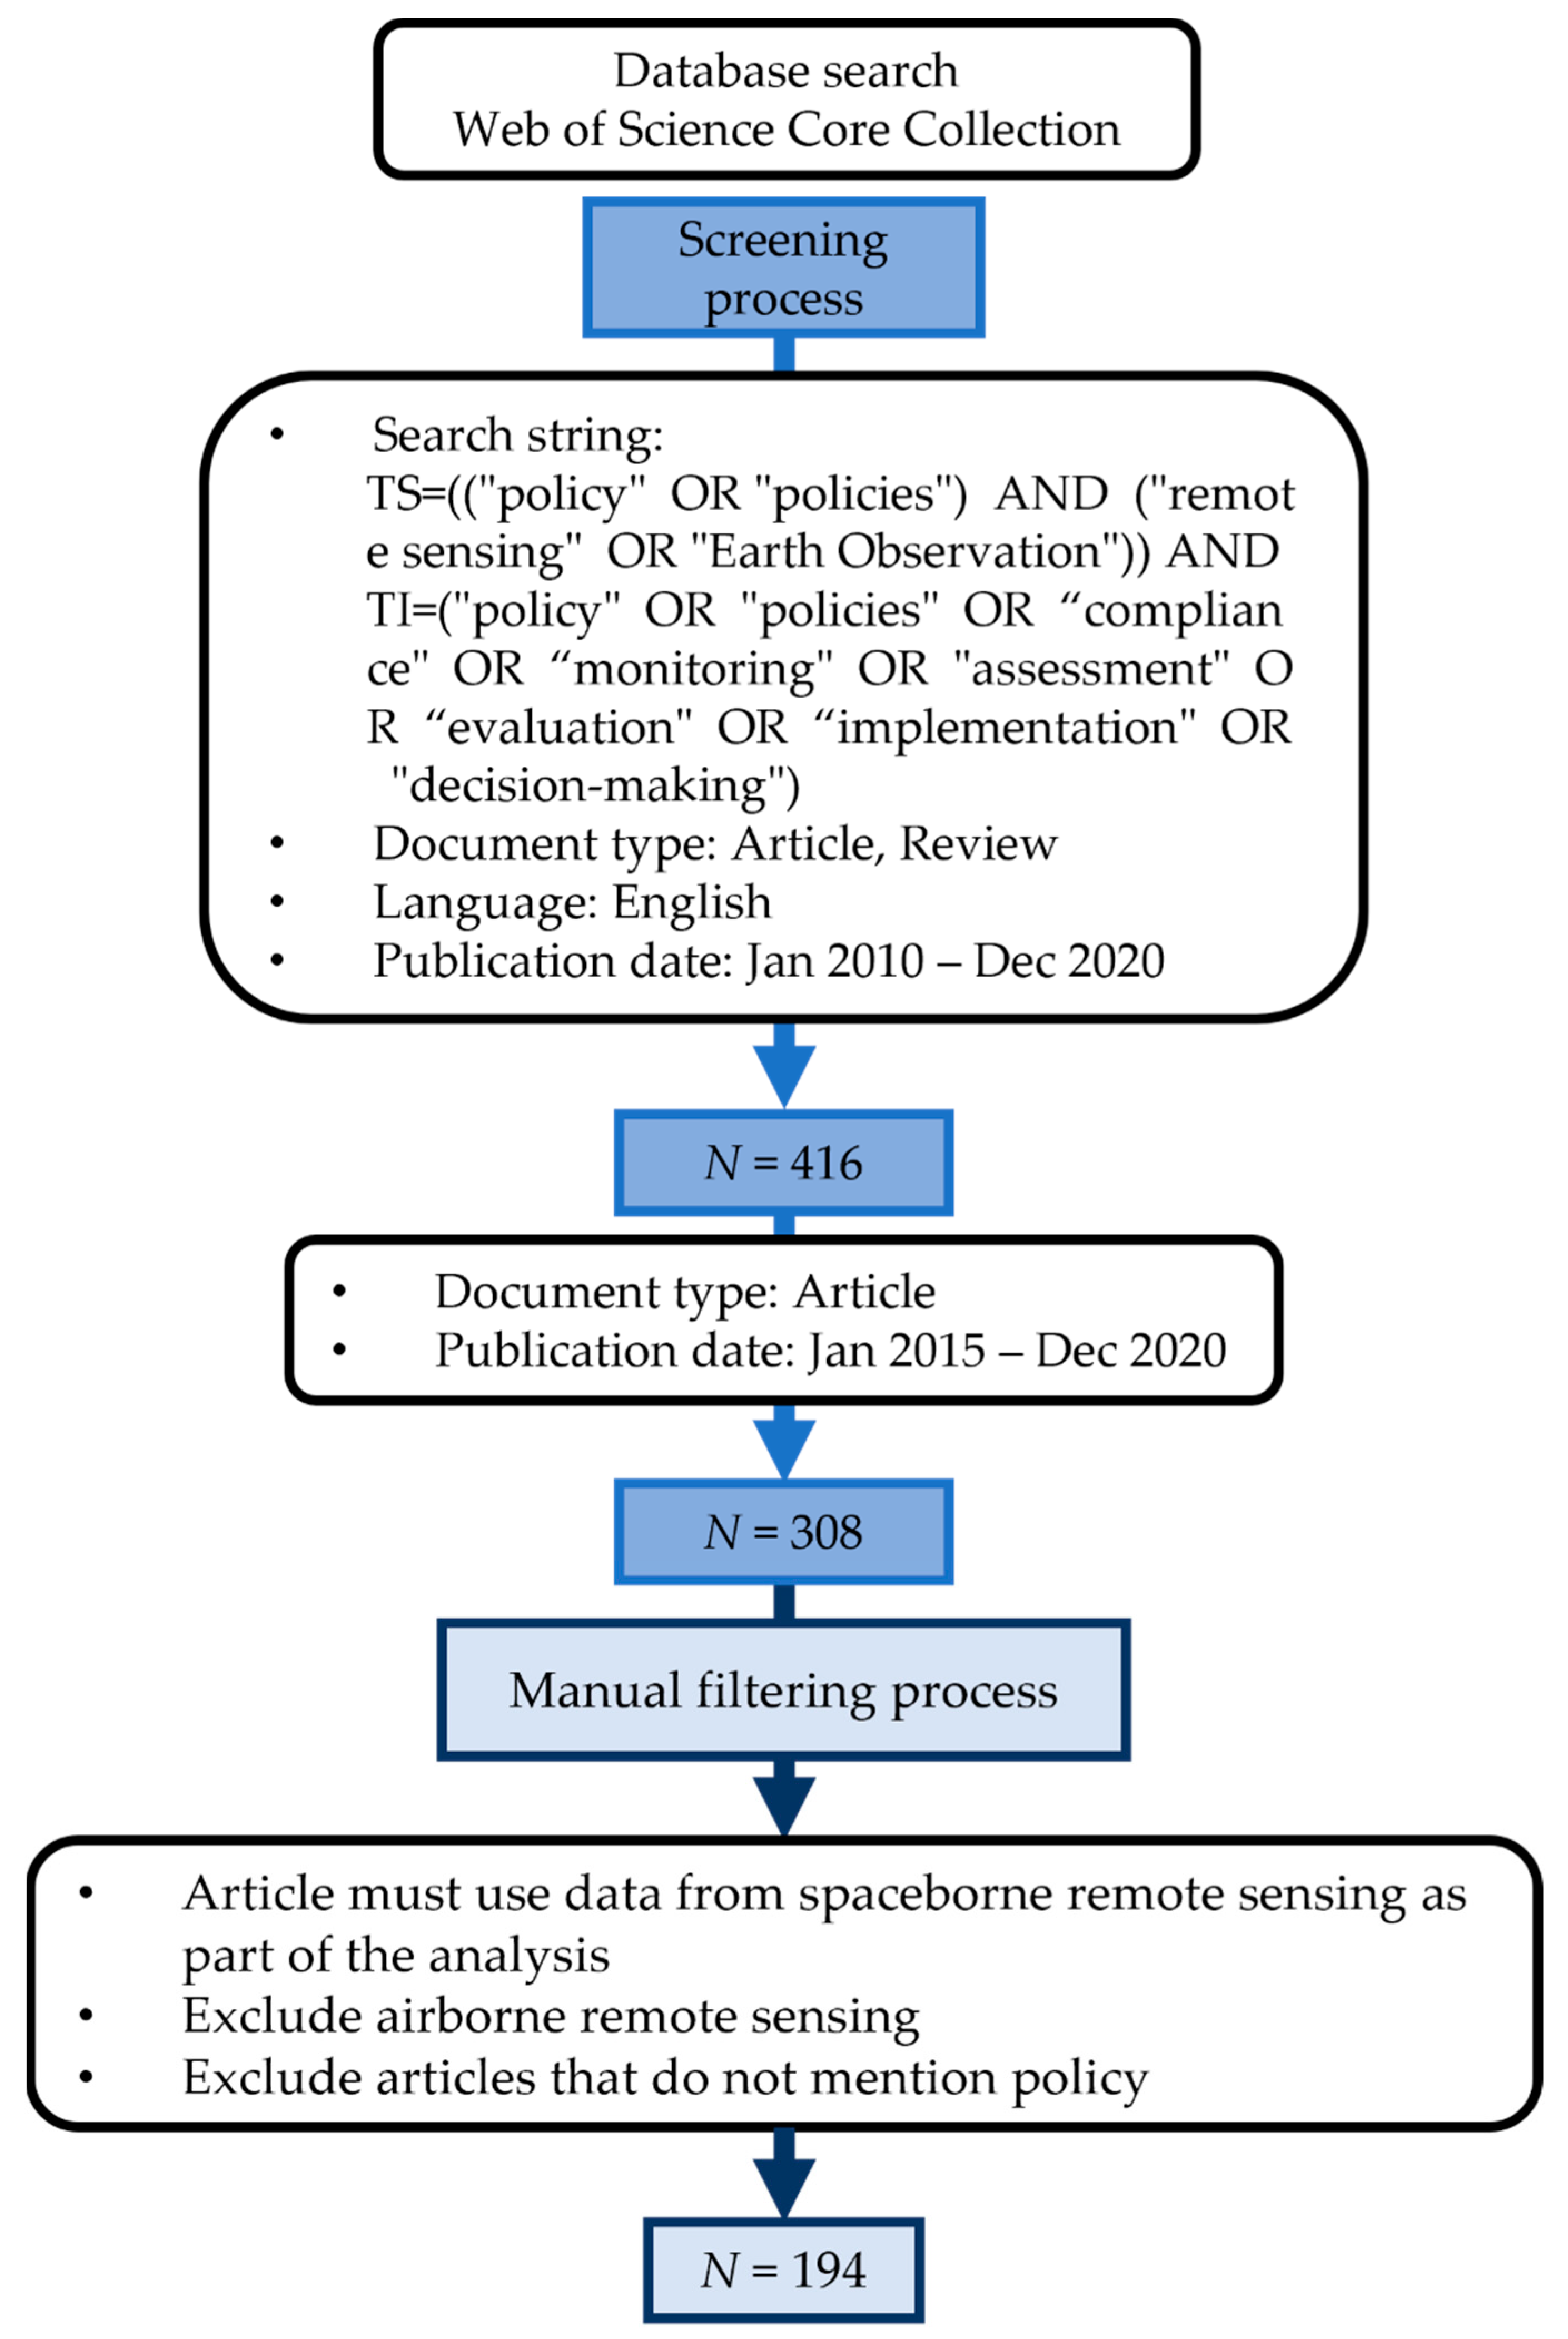
Abstract
1. Introduction
Objective of the Review
2. Materials and Methods
2.1. General Insights
2.2. Spaceborne Remote Sensing Application
2.3. Science–Policy Integration
2.3.1. Policy Focus
- “Policy-applied”: Studies that clearly made a link with policy, i.e., studies which developed methodological approaches or provided research results that are evidently used in policy, such as for the policymaking process, or who worked with policymakers or representatives to develop and provide research and methods.
- “Pre-policy”: Studies that developed an approach or method to look at, e.g., LULC trajectories to investigate and define drivers, including those from policy, in an analytical or descriptive manner.
- “Scientific”: Studies that solely stated the relevance of the methodology or the information or evidence provided by the analysis for policy.
2.3.2. Policy Cycle
3. Results
3.1. General Insights
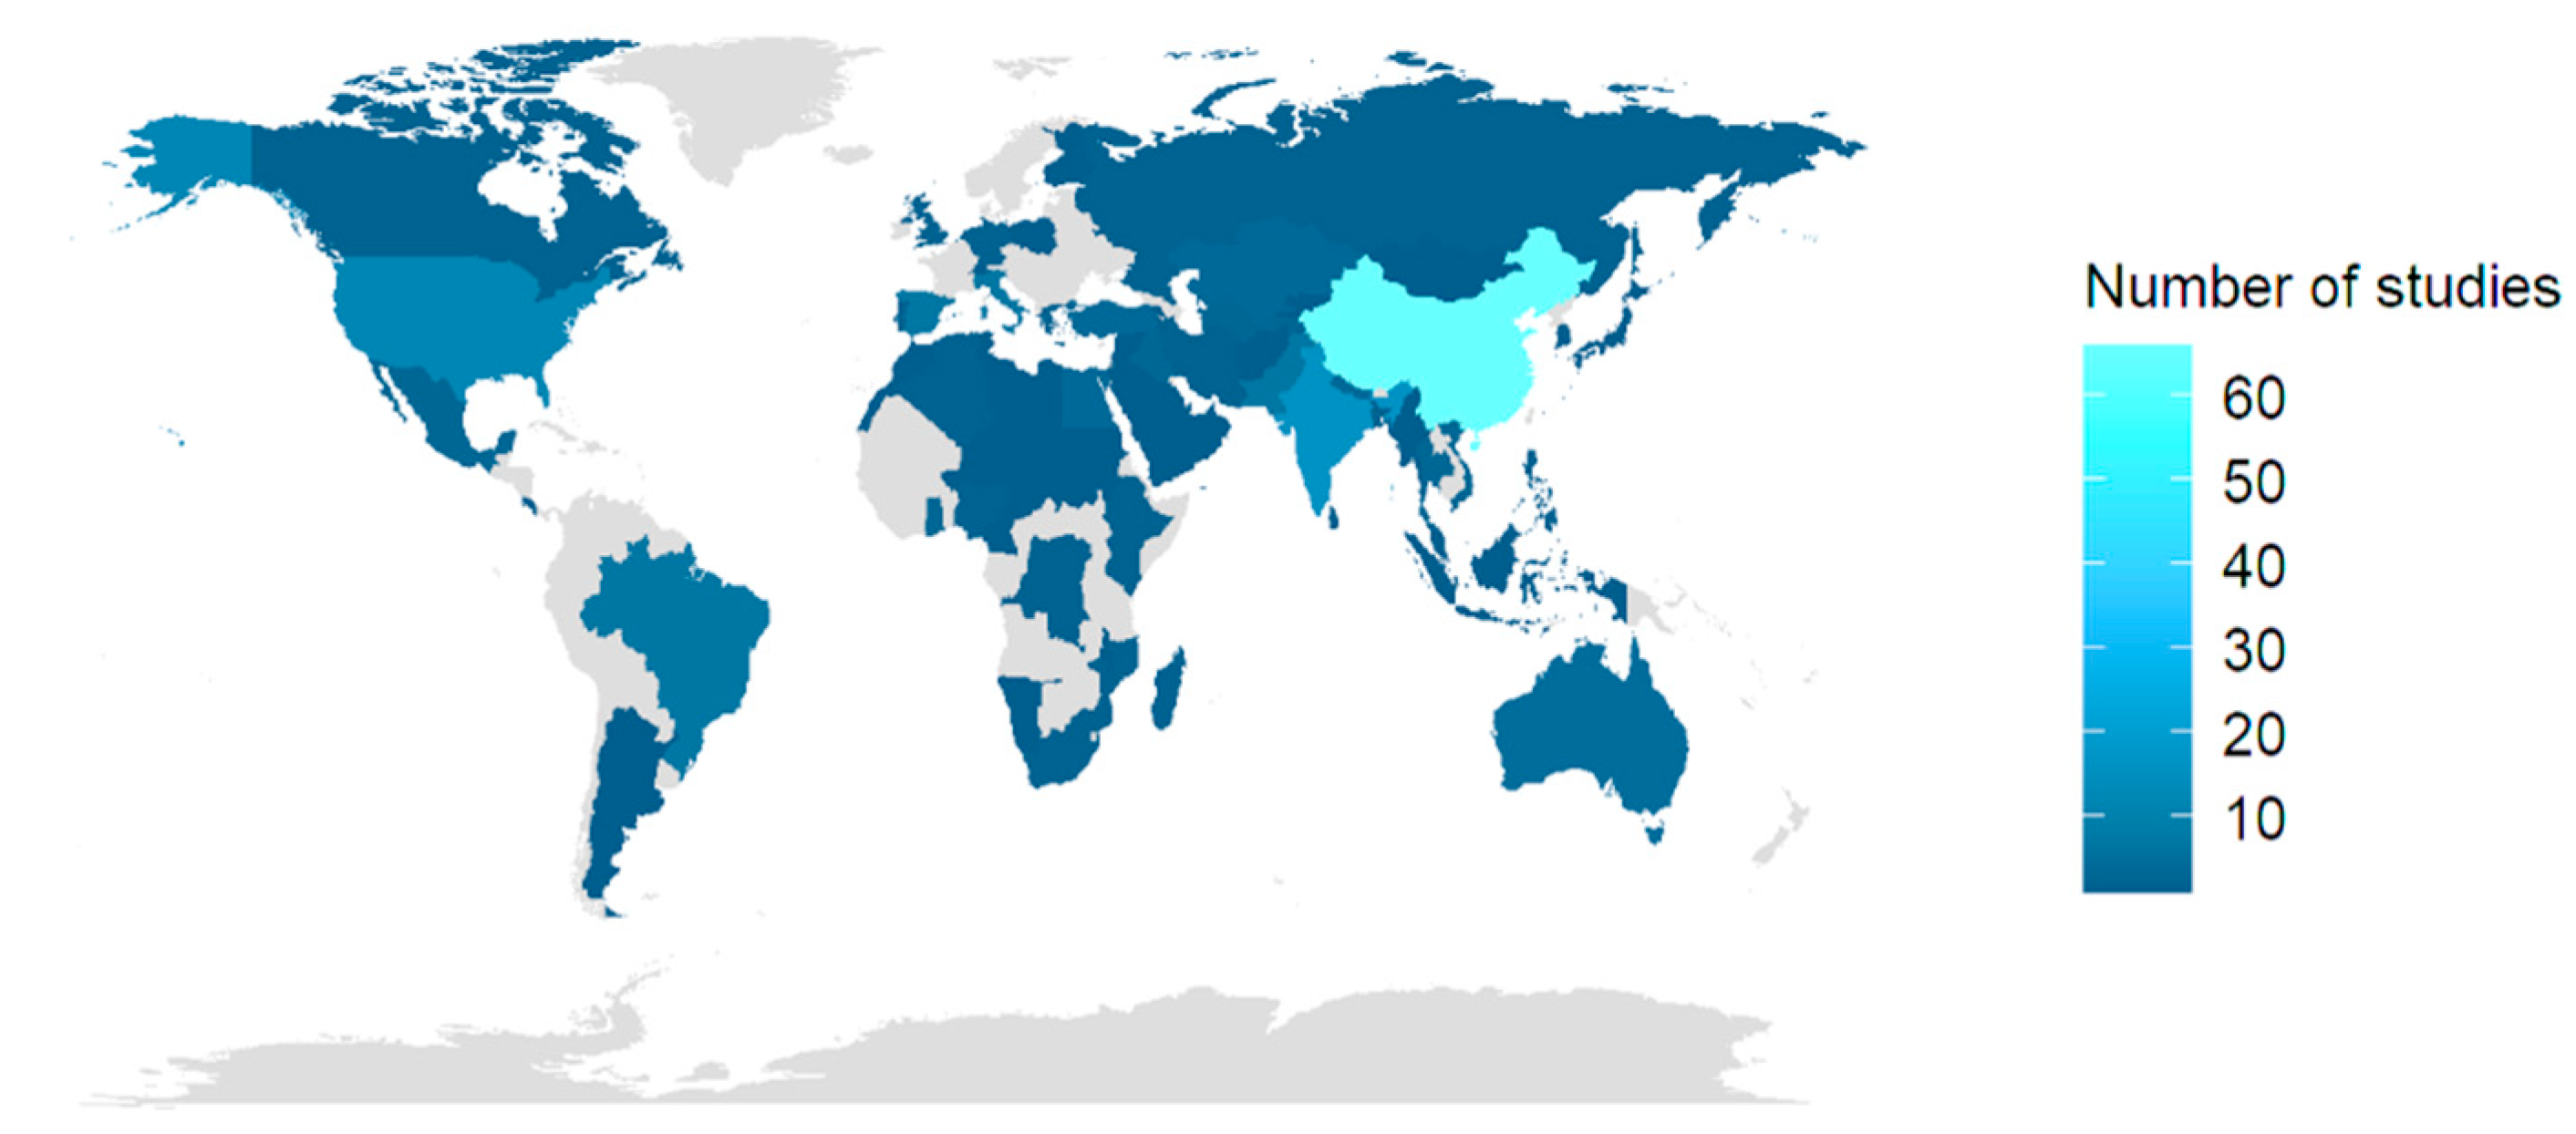
3.1.1. Overview of the Countries in Focus
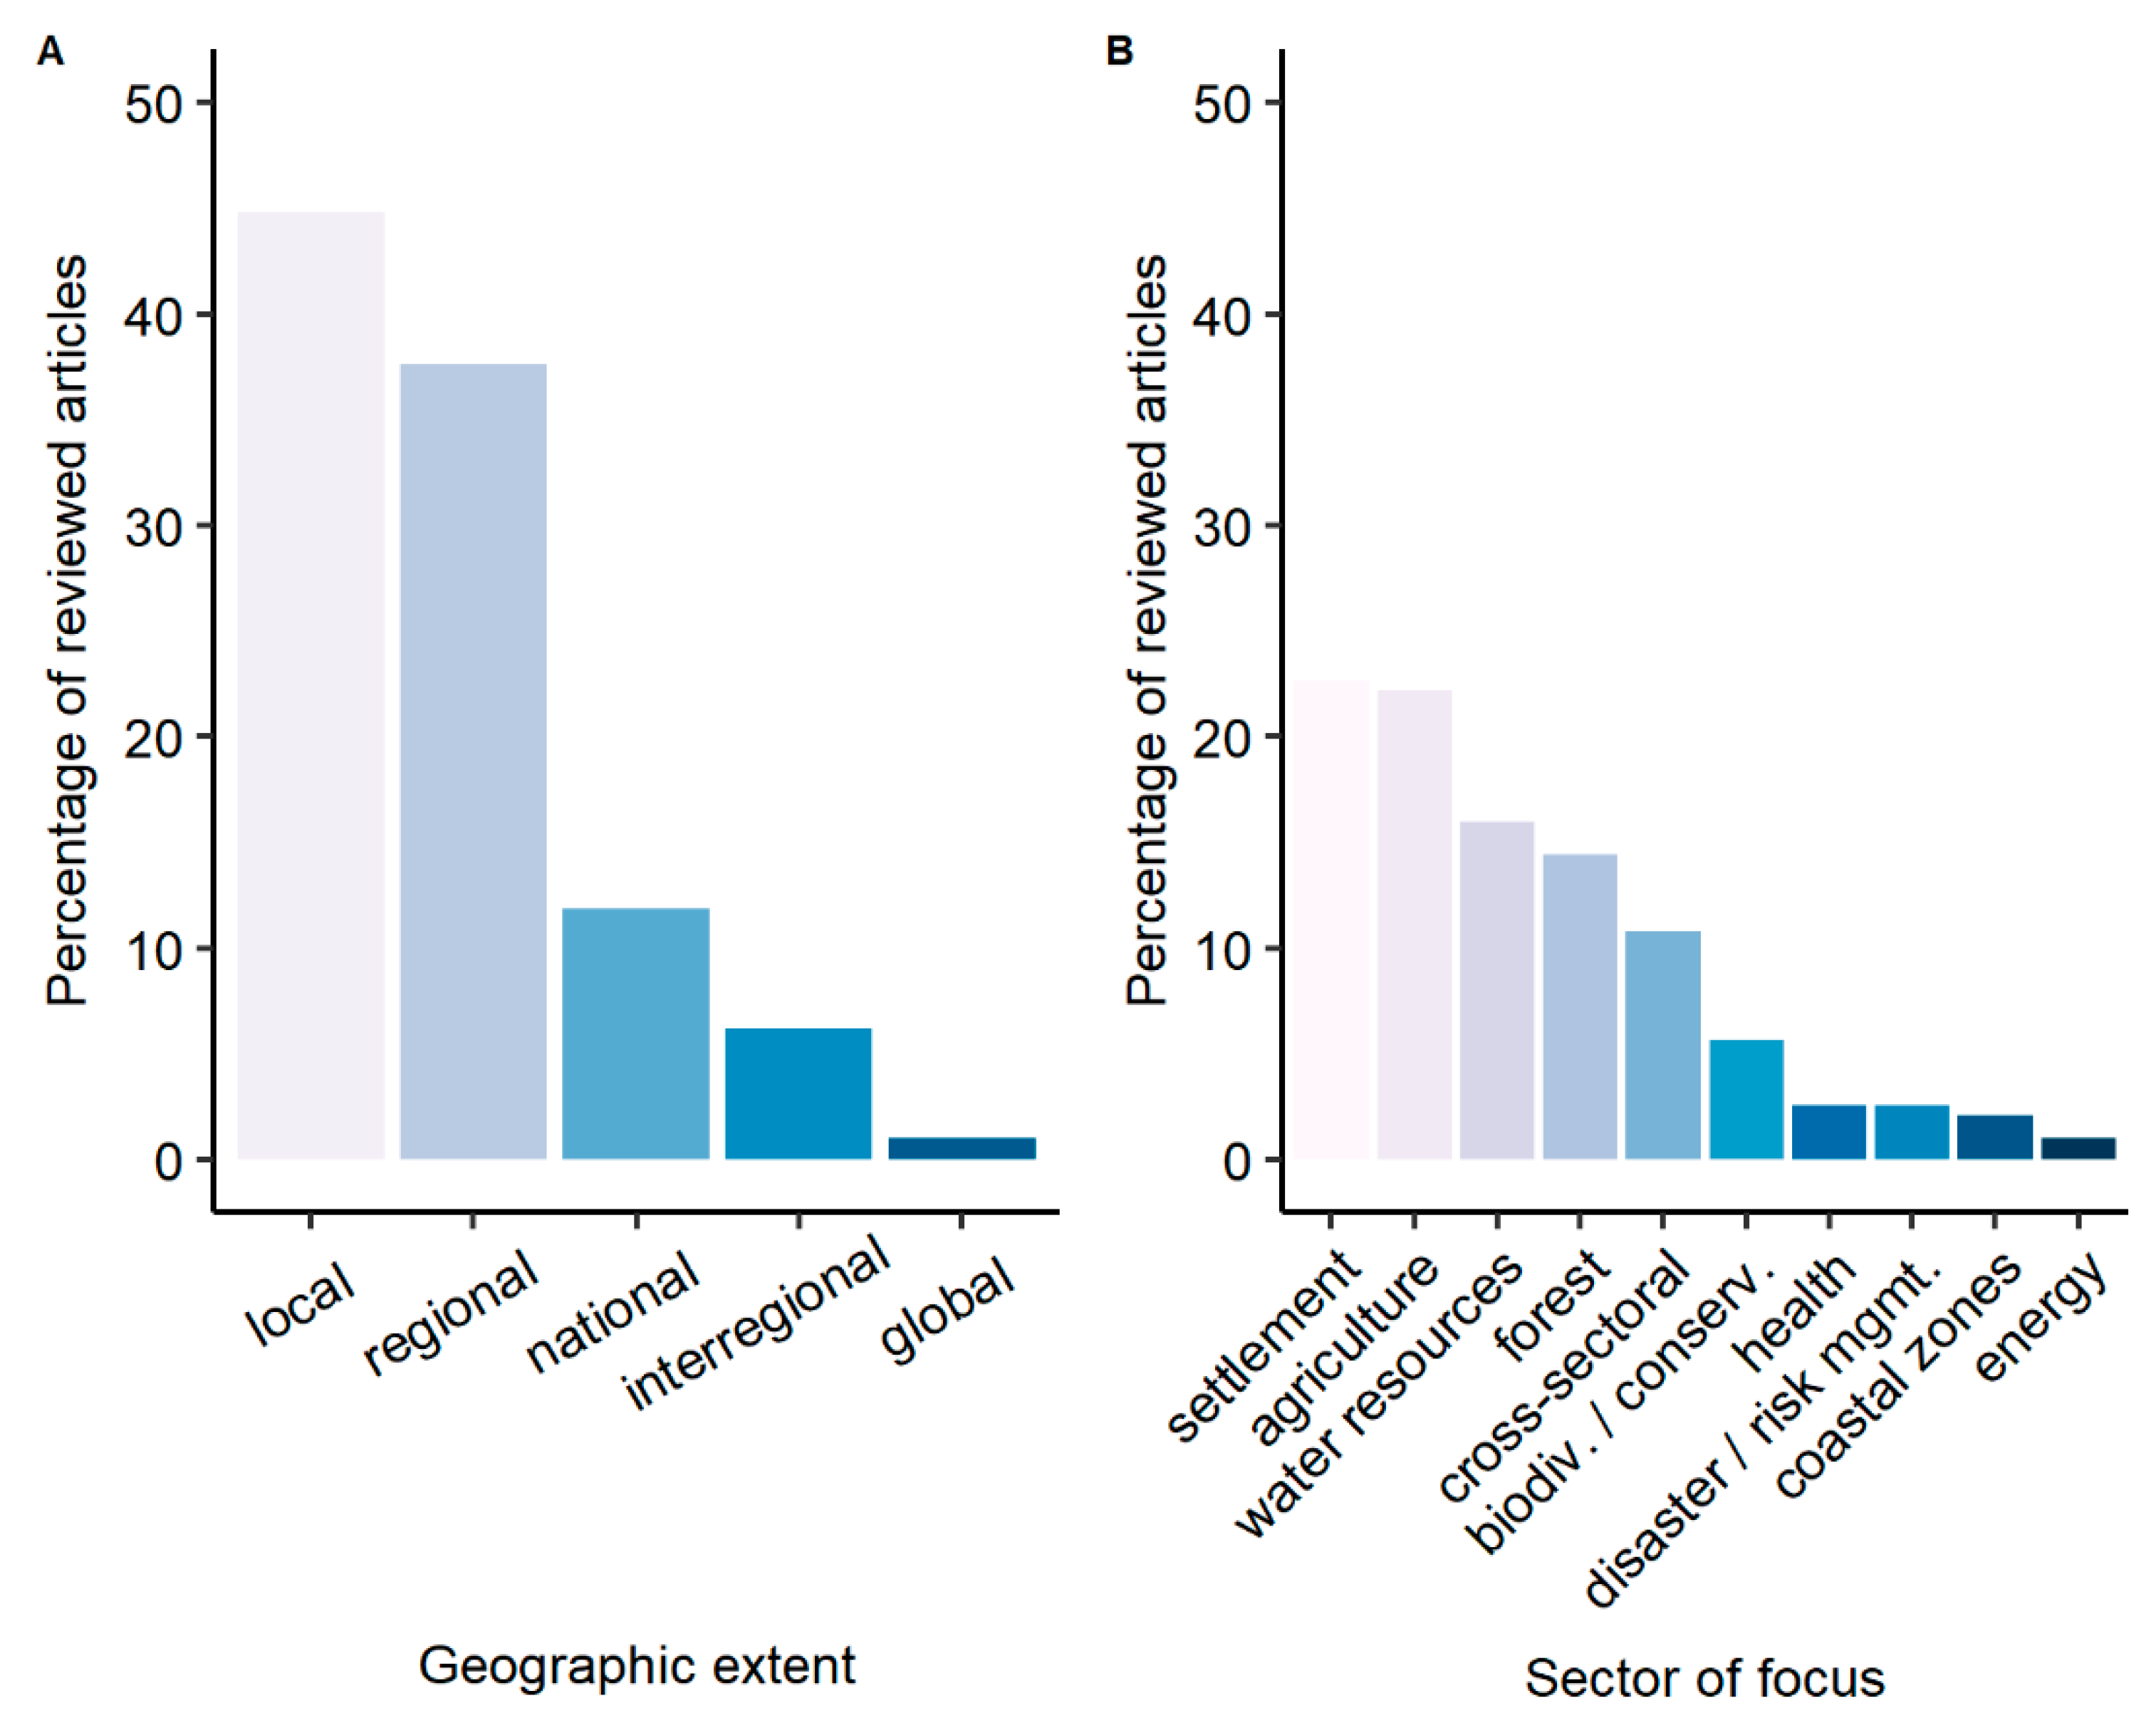
3.1.2. Geographic Extent of the Studies
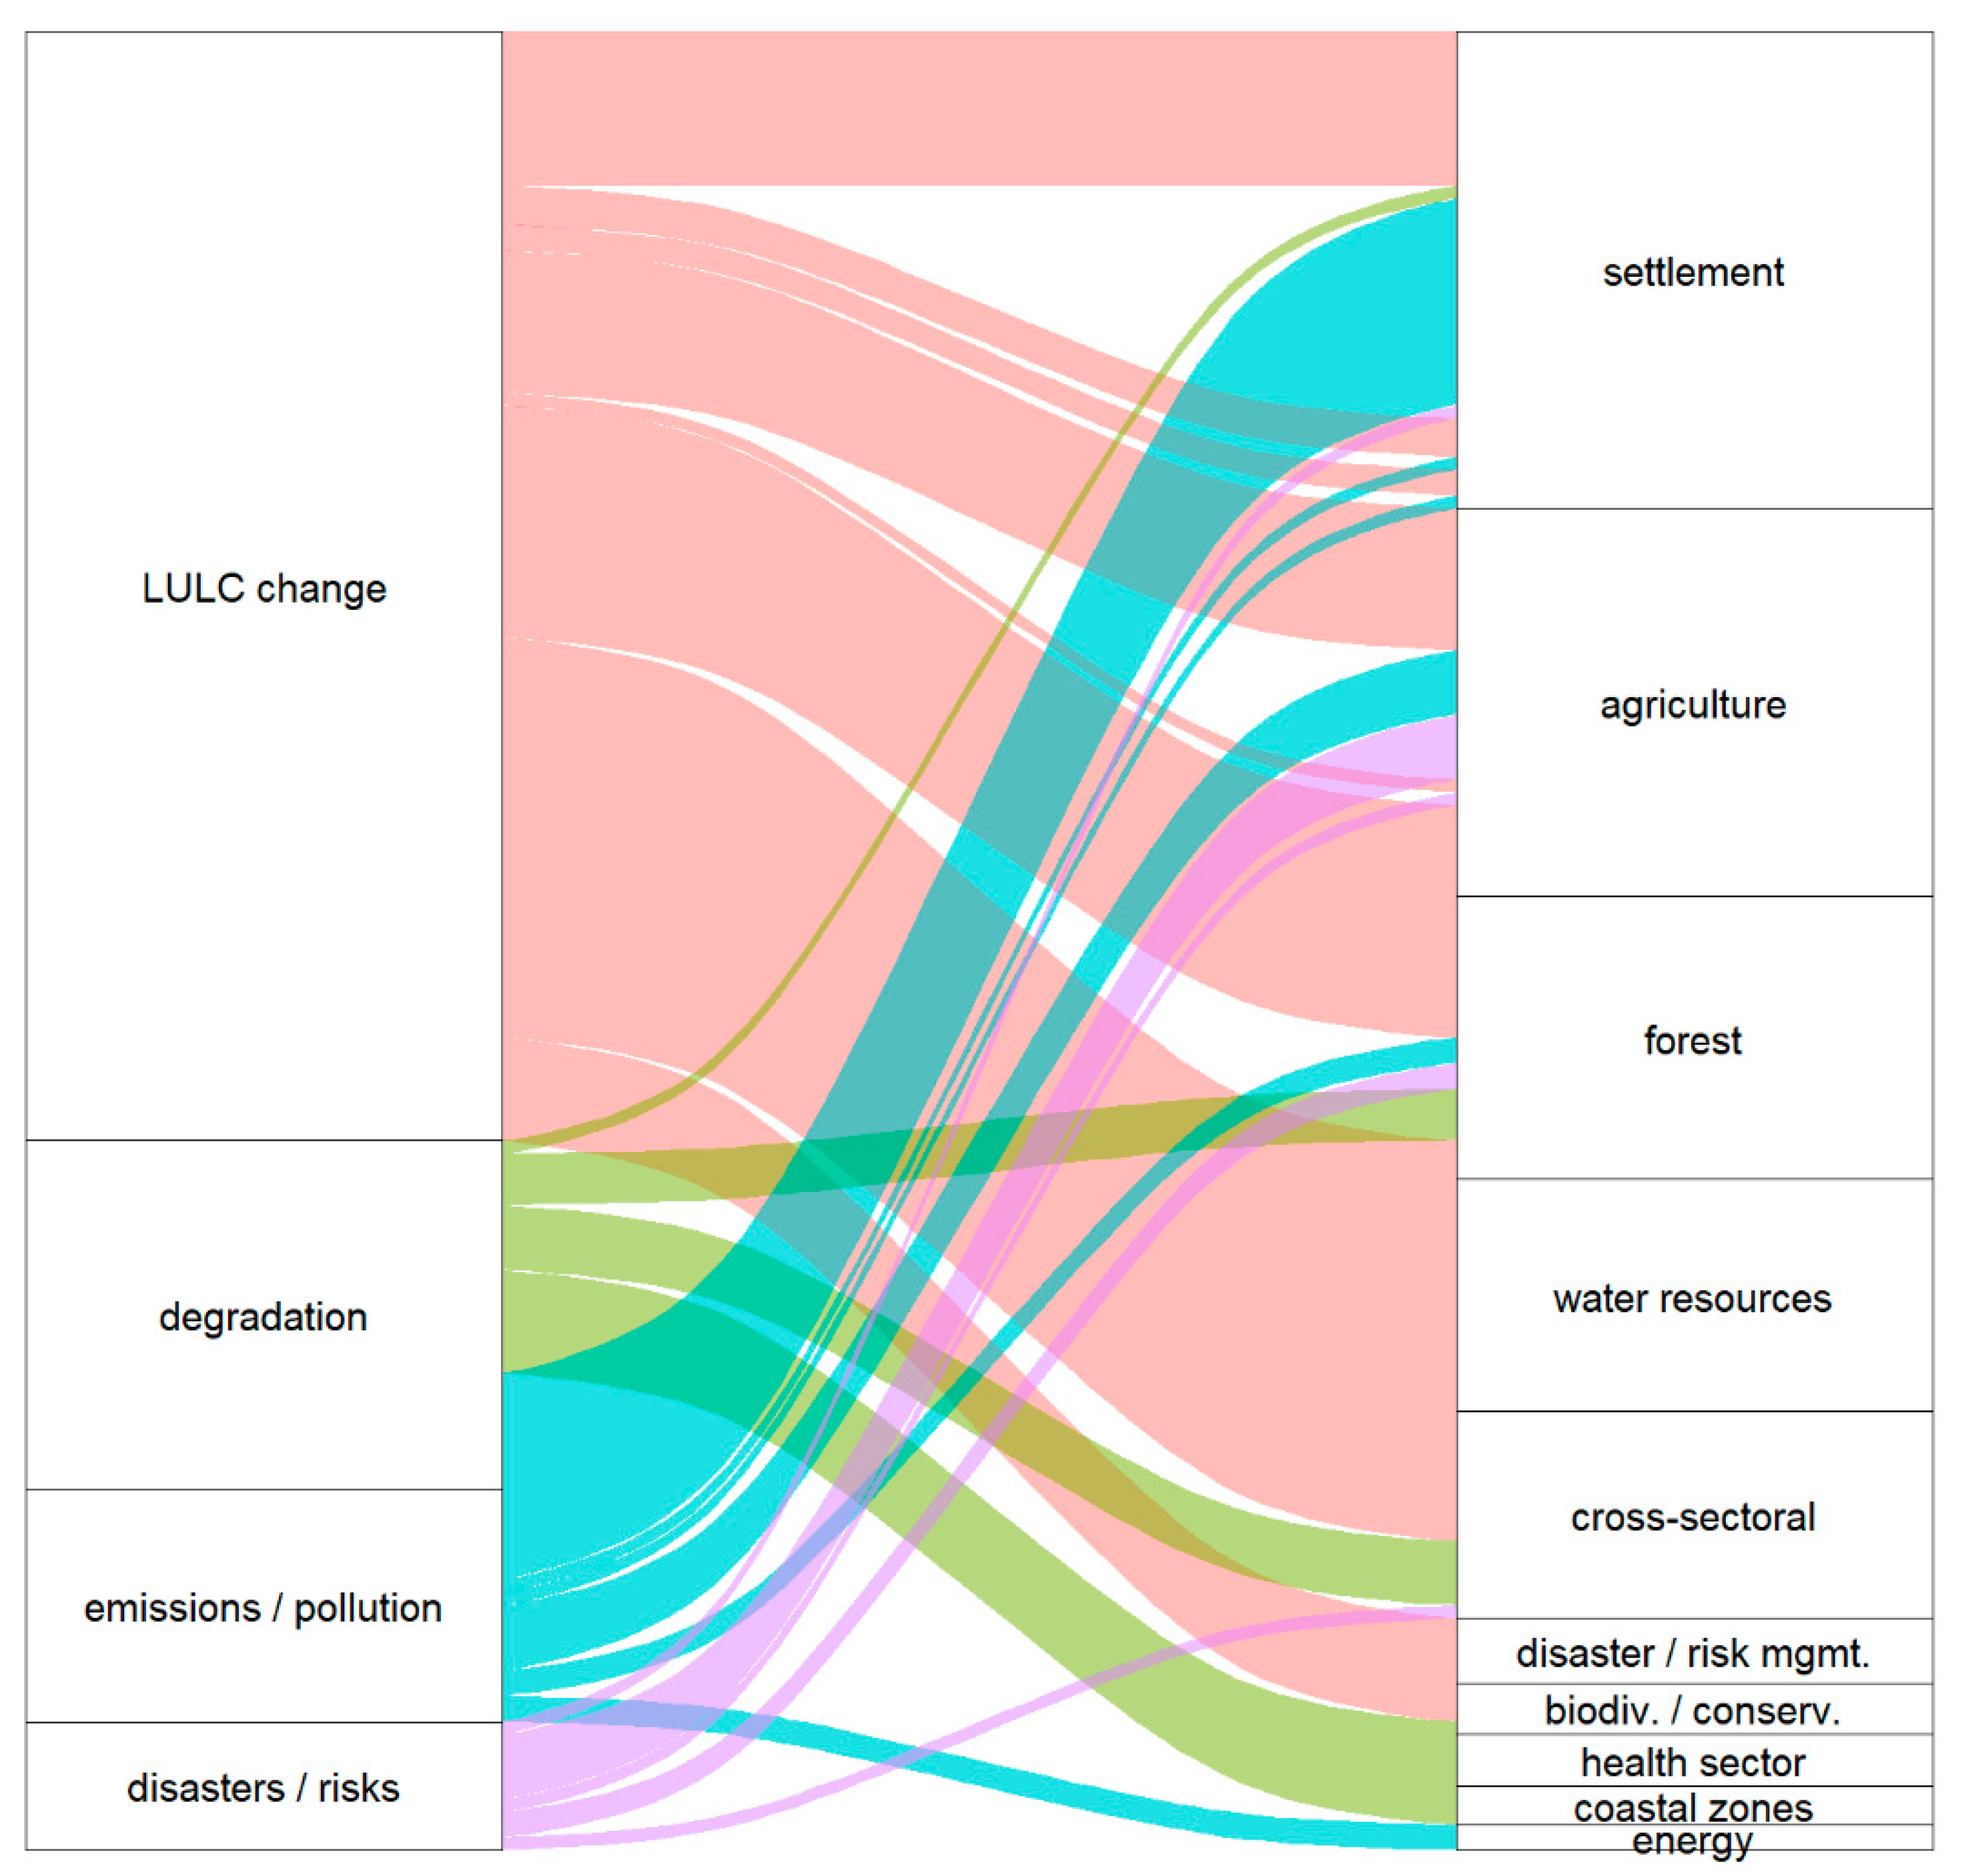
3.1.3. Sectors of Focus
3.1.4. Applications and Processes
3.2. Spaceborne RS Application
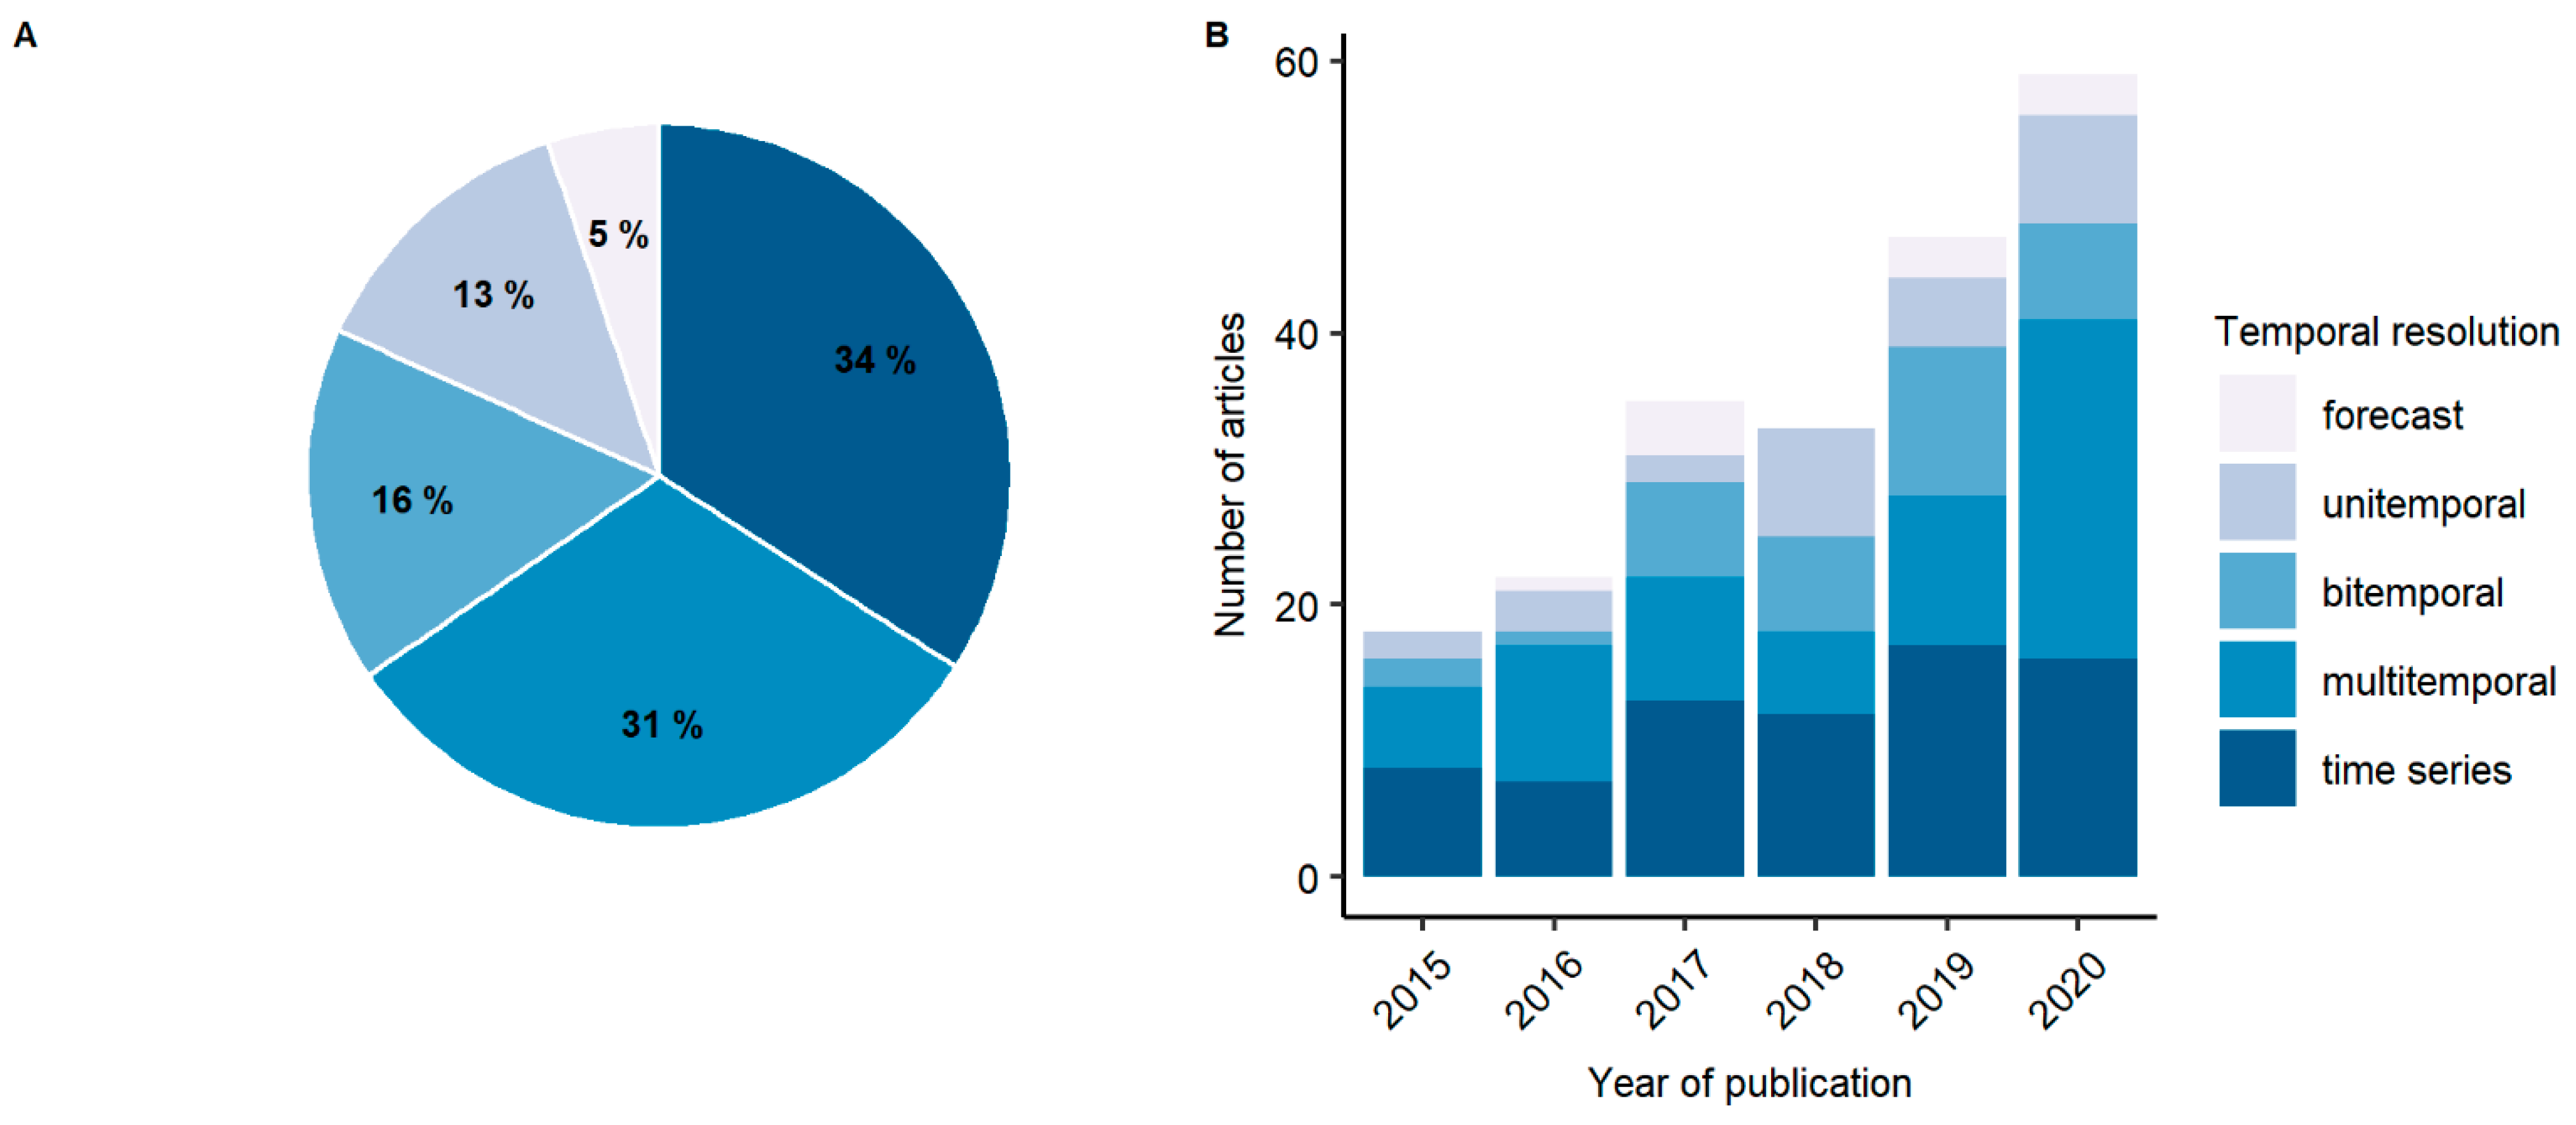
3.2.1. Temporal Resolution of the RS Analysis
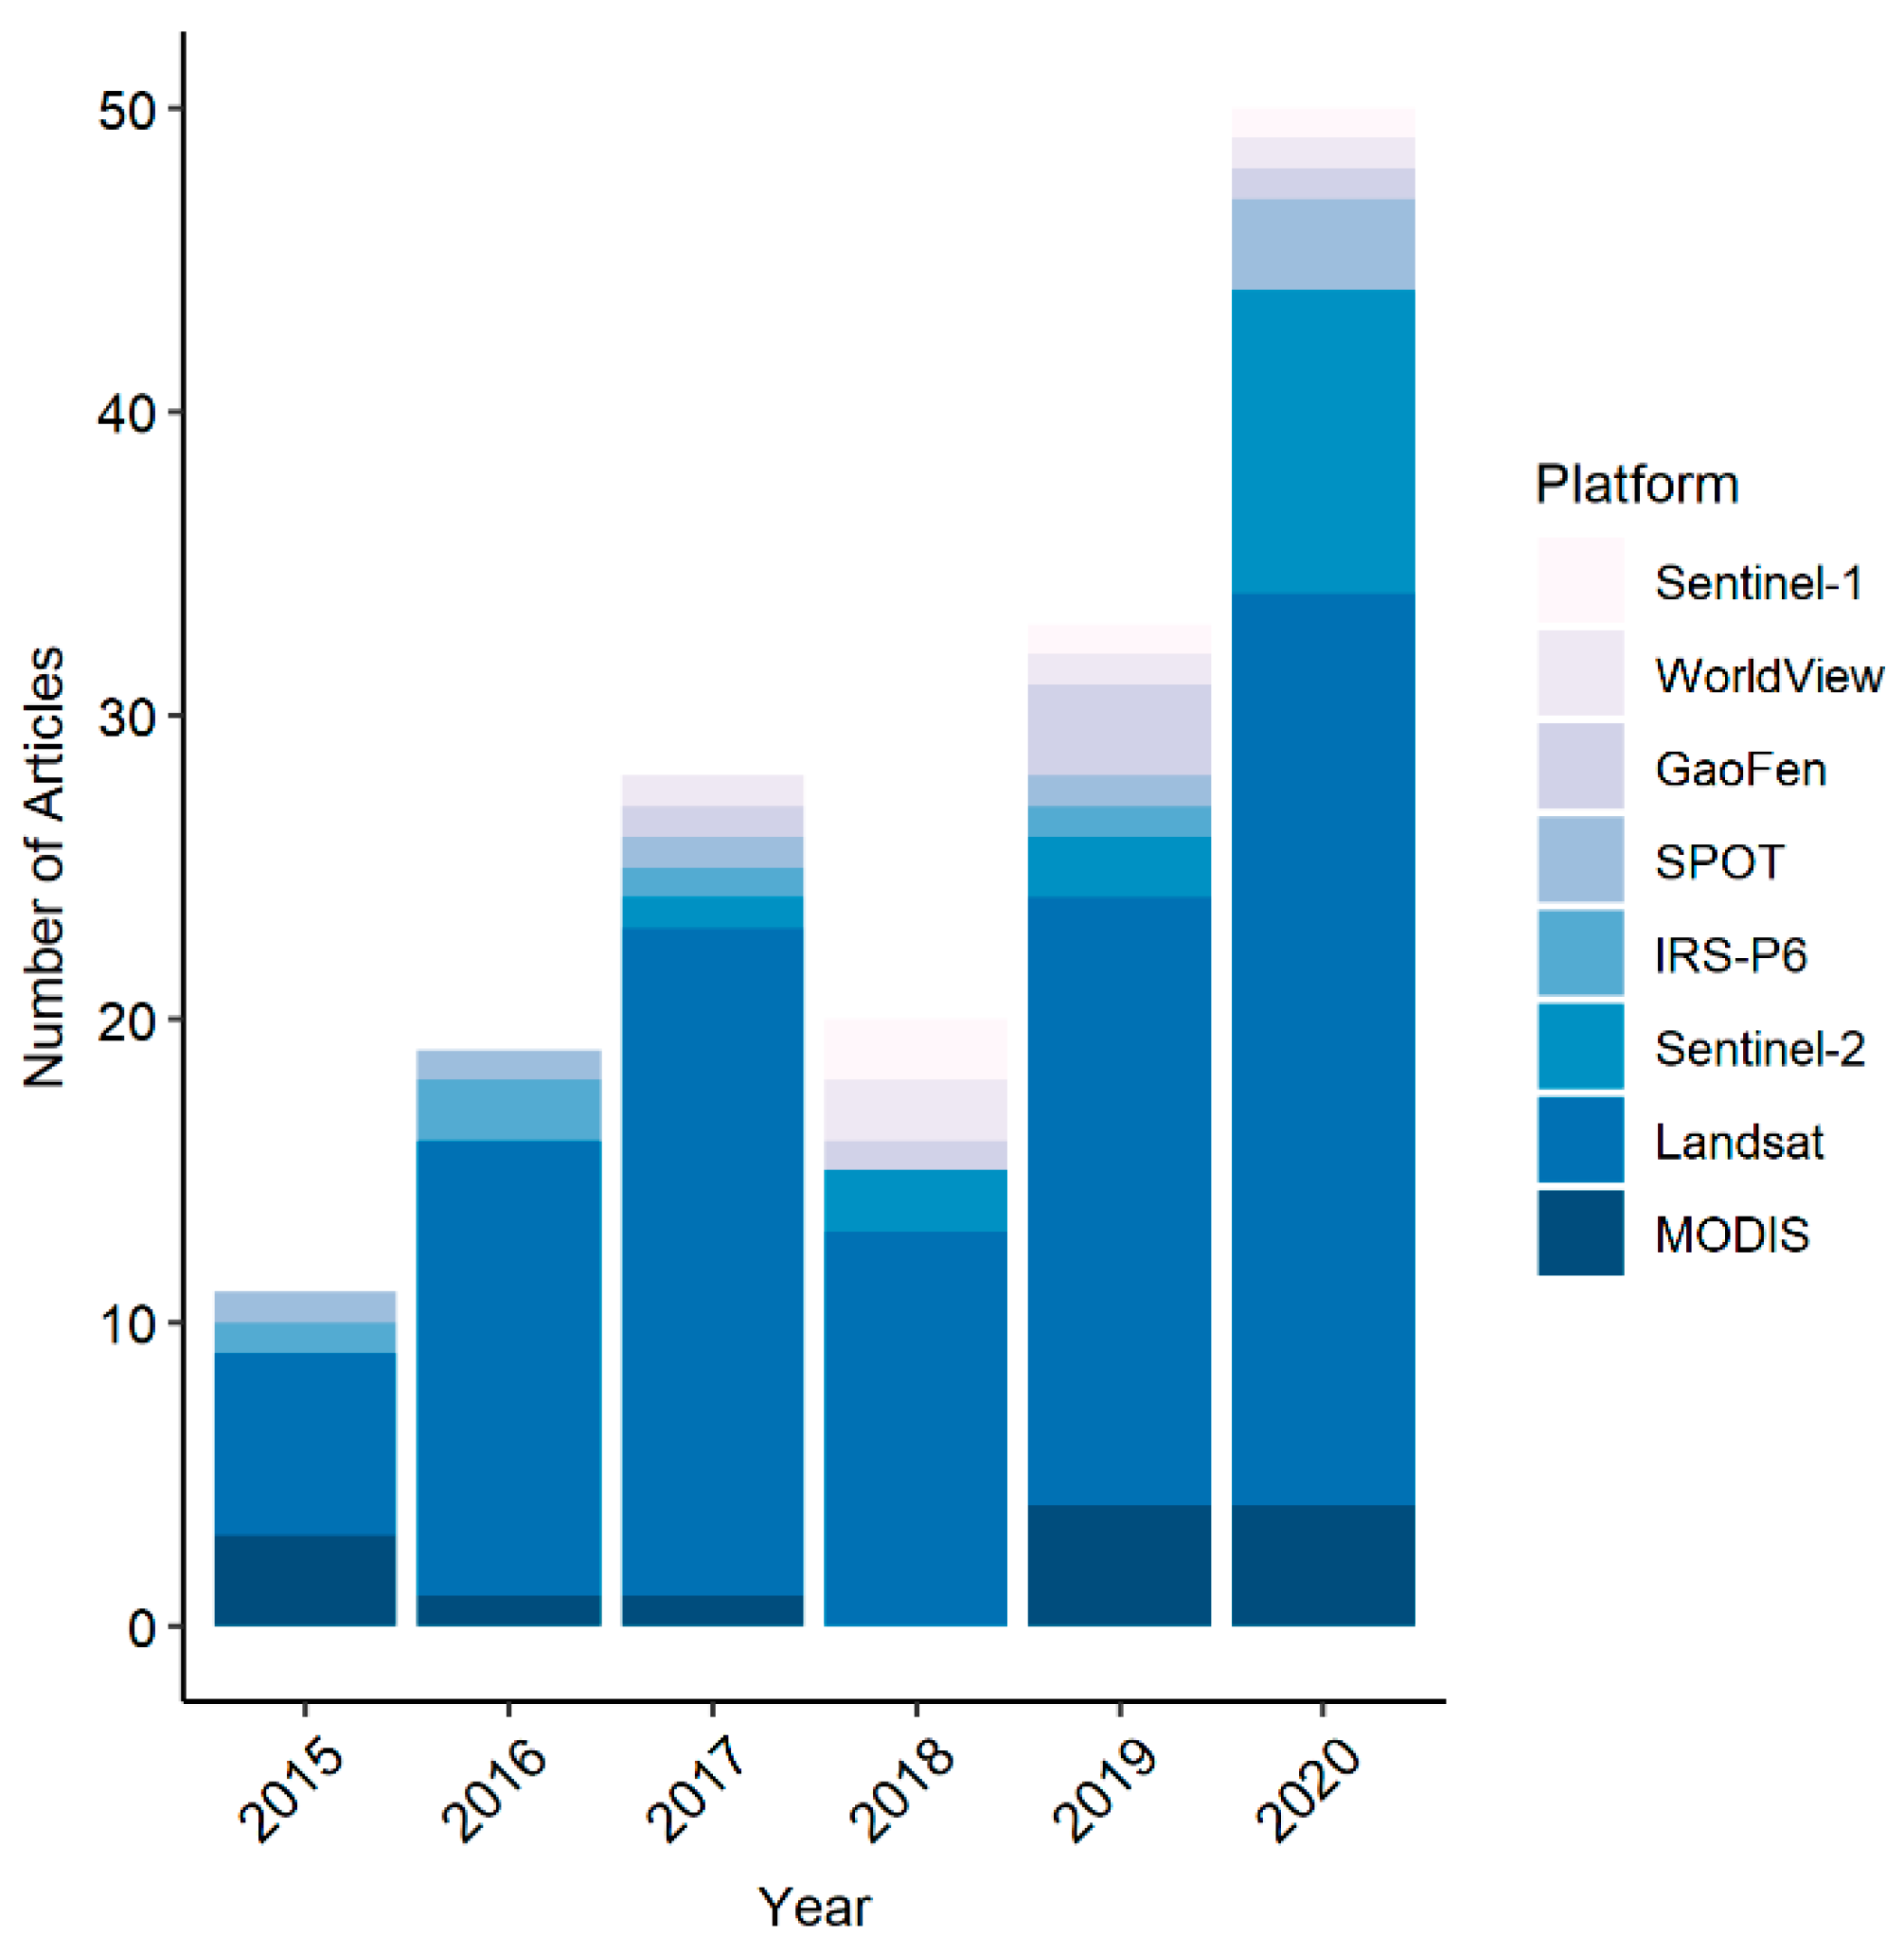
3.2.2. Spaceborne Remote Sensing Platforms and Products
3.2.3. Non-Remote Sensing Data for Analysis at the Science–Policy Interface
3.3. Science–Policy Integration
3.3.1. Policy Focus
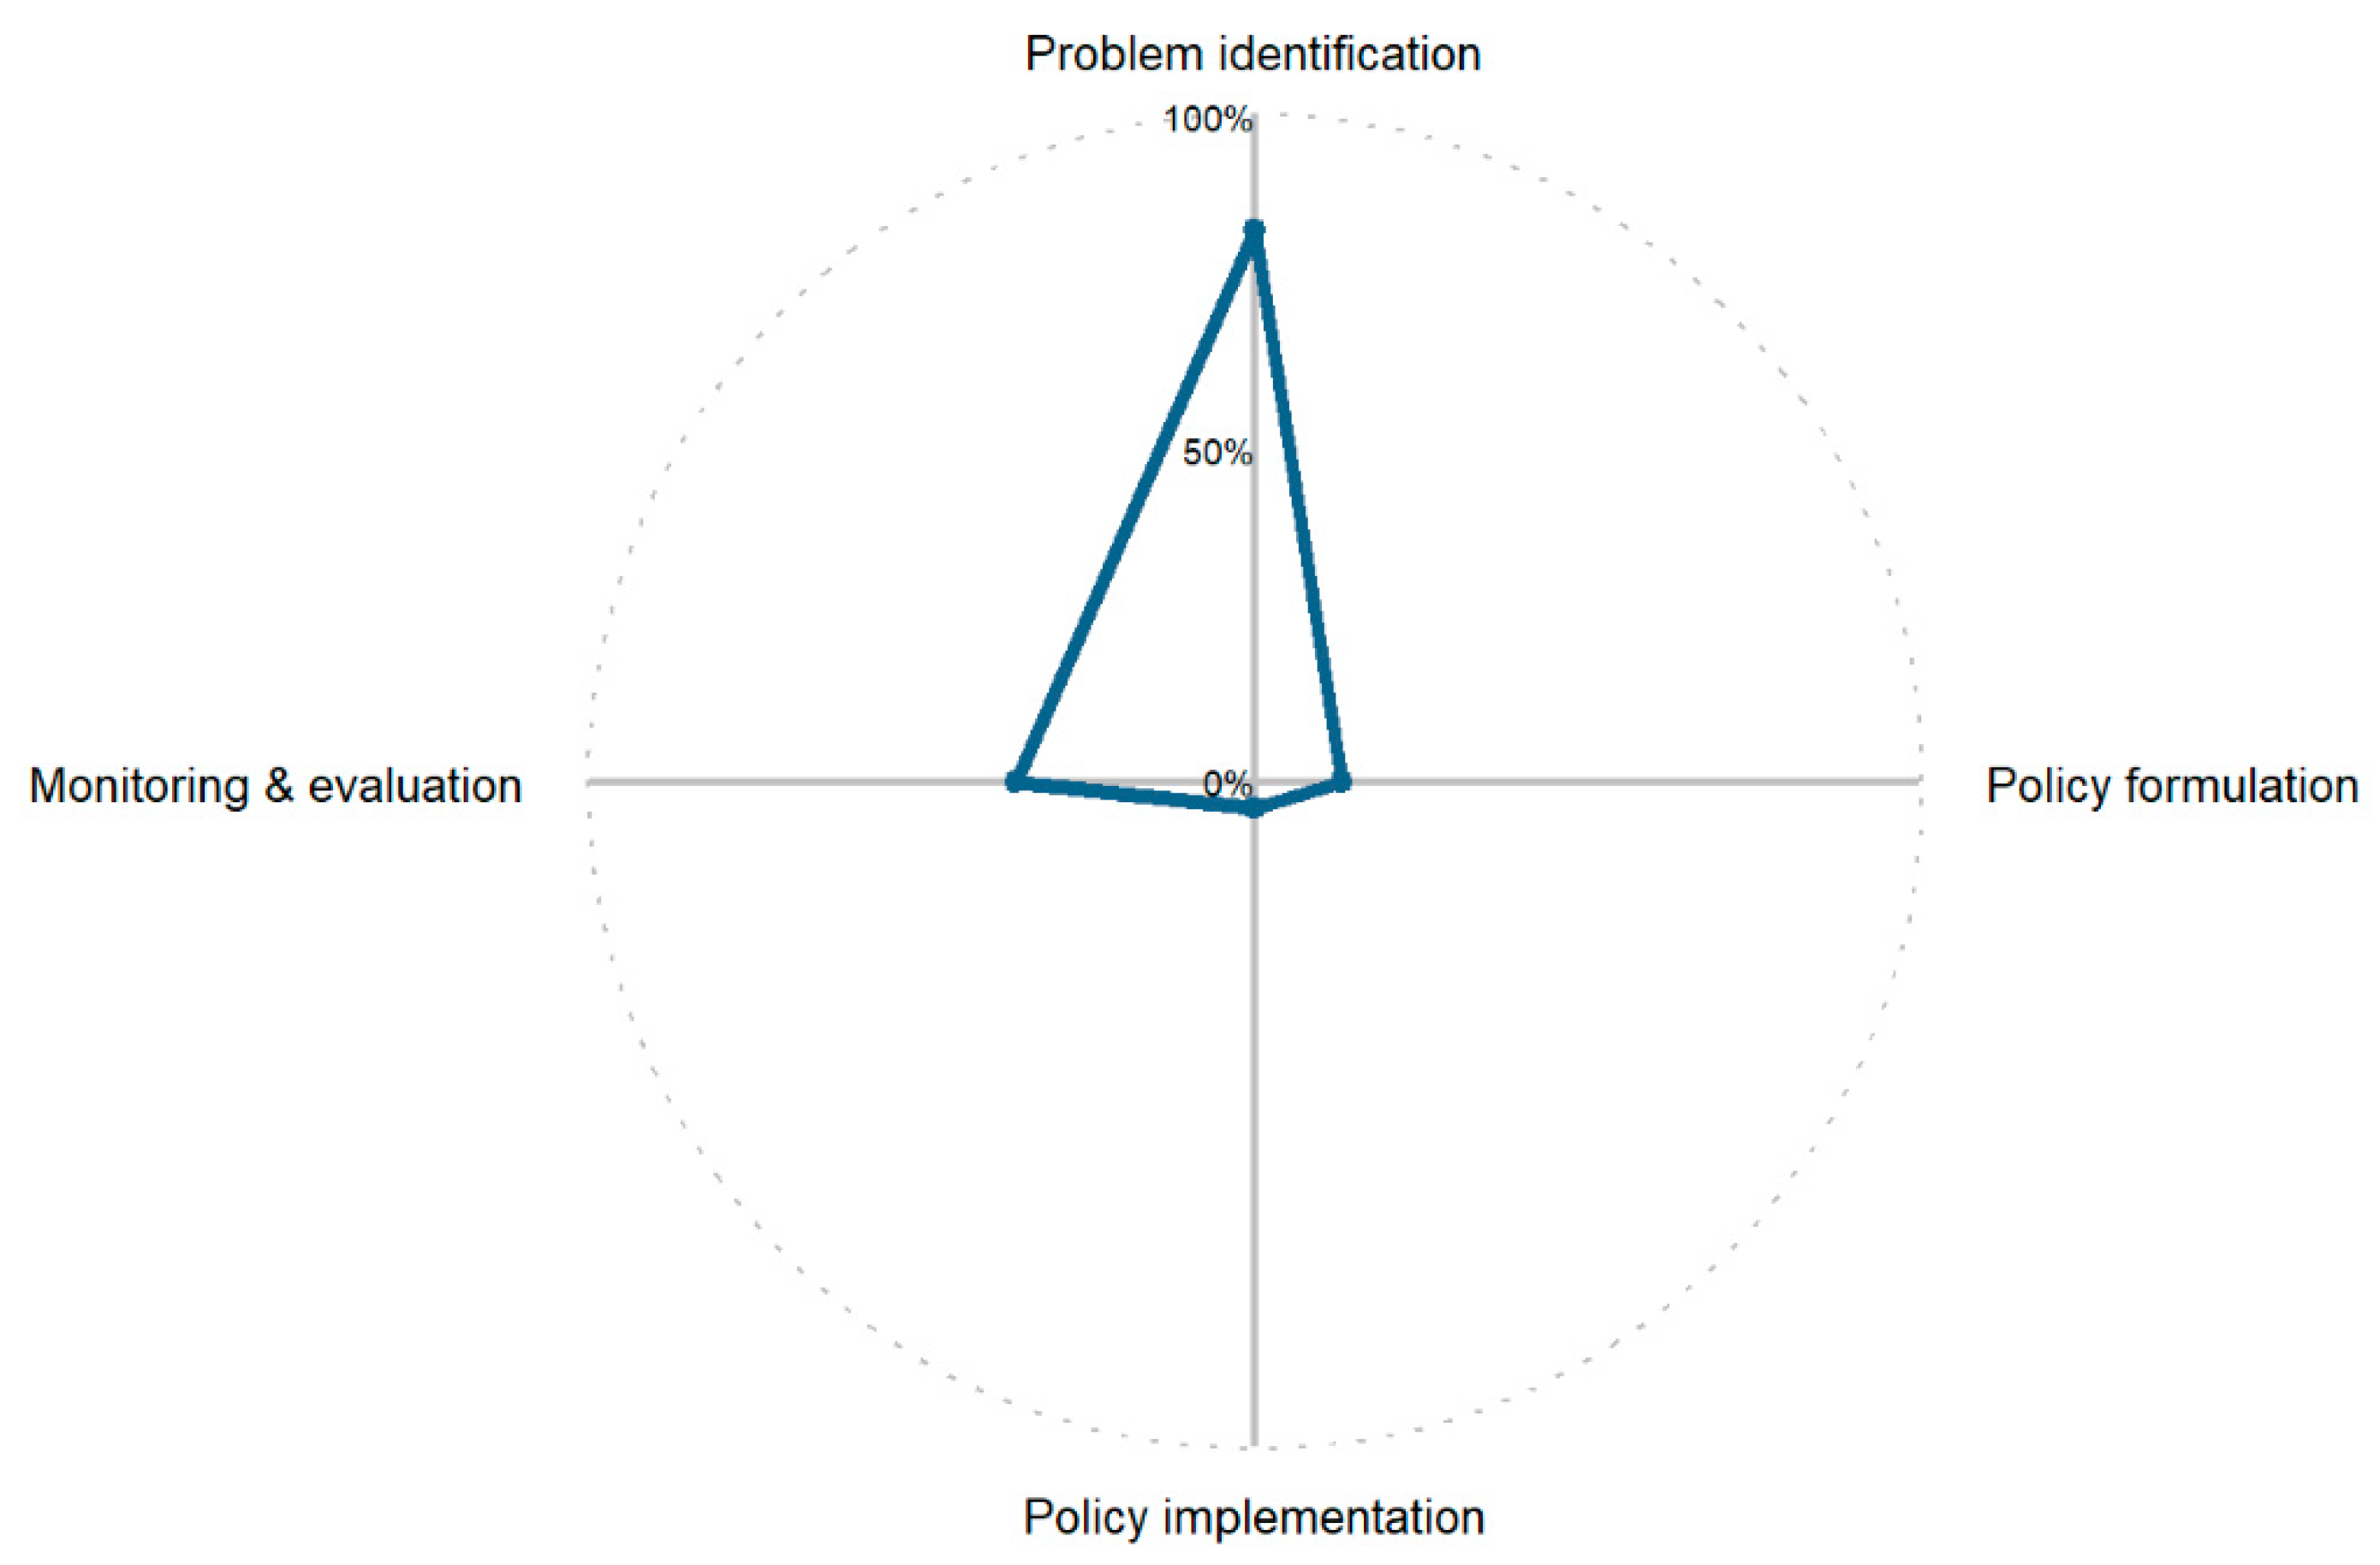
3.3.2. Policy Cycle
3.3.3. Integration of RS Data, Products, and Non-RS Data along the Policy Cycle
3.3.4. Potential Policy Areas and Processes of Application
4. Discussion
4.1. Narrowing the Science–Policy Gap: The Policy Cycle from a RS Perspective
4.1.1. Stage Problem Definition/Knowledge Building
4.1.2. Stage Policy Formulation
4.1.3. Stage Policy Implementation
4.1.4. Stage Monitoring and Evaluation
4.2. Topics Gaining Importance for RS at the Science–Policy Interface
4.2.1. Ex Post and Ex Ante Policy Assessment
4.2.2. Interdisciplinary Approaches
4.2.3. Methodological Development and Integration
4.2.4. RS Indicators and Proxies for EBP Studies
4.2.5. Emerging Sectoral Topics
4.3. RS Requirements at the Science–Policy Interface
4.3.1. Data Availability and Quality
4.3.2. Product Requirements and Consensus on Definitions
4.3.3. Ground Truth and Field Data
4.3.4. Accounting for Scale
5. Conclusions
Supplementary Materials
Author Contributions
Funding
Data Availability Statement
Acknowledgments
Conflicts of Interest
References
- Sutcliffe, S.; Court, J. Toolkit for Progressive Policymakers in Developing Countries; Overseas Development Institute: London, UK, 2006. [Google Scholar]
- Davies, P. The State of Evidence-Based Policy Evaluation and its Role in Policy Formation. Natl. Inst. Econ. Rev. 2012, 219, R41–R52. [Google Scholar] [CrossRef]
- OECD (Ed.) Better Policies for Sustainable Development 2016: A New Framework for Policy Coherence; OECD Publishing: Paris, France, 2016. [Google Scholar]
- Baron, J. A Brief History of Evidence-Based Policy. Ann. Am. Acad. Politi- Soc. Sci. 2018, 678, 40–508. [Google Scholar] [CrossRef]
- Hoekstra, A.Y.; Wiedmann, T.O. Humanity’s unsustainable environmental footprint. Science 2014, 344, 1114–1117. [Google Scholar] [CrossRef]
- UNFCCC. Paris Agreement; UNFCCC: Bonn, Germany, 2015. [Google Scholar]
- Transforming our World: The 2030 Agenda for Sustainable Development A/RES/70/1; United Nations: New York, NY, USA, 2015.
- Scientific Advisory Board. Science for Sustainable Development: Science for Sustainable Development: Policy Brief by Policy Brief the Scientific Advisory Board of the UN Secretary-General. 2016. Available online: http://unesdoc.unesco.org/images/0024/002461/246105E.pdf (accessed on 22 September 2022).
- Listorti, G.; Basyte-Ferrari, E.; Acs, S.; Smits, P. Towards an Evidence-Based and Integrated Policy Cycle in the EU: A Review of the Debate on the Better Regulation Agenda. JCMS: J. Common Mark. Stud. 2020, 58, 1558–1577. [Google Scholar] [CrossRef]
- Oliver, K.; Lorenc, T.; Innvær, S. New directions in evidence-based policy research: A critical analysis of the literature. Health Res. Policy Syst. 2014, 12, 34. [Google Scholar] [CrossRef] [PubMed]
- EPA. EPA Resource Kit: Bridging the Gap between Science and Policy: BRIDGE: Good Practice Guide for Science-Policy Communication; EPA 132: Wexford, Irland, 2014. [Google Scholar]
- HM Treasury. The Green Book: Central Government Guidance on Appraisal and Evaluation; HM Treasury: London, UK, 2018. Available online: www.gov.uk/government/publications (accessed on accessed on 3 May 2020).
- Muller, P.; Conlon, G.; Devnani, S.; Bénard, C. (Eds.) Performance-based Full Policy Cycle for Digital Single Market; European Parliament: Brussels, Belgium, 2013. [Google Scholar]
- Hartley, K.; Vu, M.K. Fighting fake news in the COVID-19 era: Policy insights from an equilibrium model. Policy Sci. 2020, 53, 735–758. [Google Scholar] [CrossRef]
- Head, B. Chapter 2 Evidence-Based Policy: Principles and Requirements—Volume 1: Proceedings—Strengthening Evidence-based Policy in the Australian Federation—Roundtable Proceedings; Productivity Commission: Canberra, Australia, 2010.
- Horning, N.; Robinson, J.A.; Sterling, E.J.; Turner, W.; Spector, S. Remote Sensing for Ecology and Conservation: A Handbook of Techniques; Oxford University Press: Oxford, UK, 2010. [Google Scholar]
- Lean, K.; Bormann, N.; Healy, S.; English, S. Final Report: Study to Assess Earth Observation with Small Satellites and Their Prospects for Future Global Numerical Weather Prediction. Available online: https://www.ecmwf.int/node/20513 (accessed on 26 January 2023).
- ECMWF. Annual Report 2021; ECMWF: Reading, UK, 2021. [Google Scholar]
- European Commission. Directorate-General for Internal Market, Industry, Entrepreneurship and SMEs, “Copernicus Market Report—February 2019”; Publications Office of the European Union: Luxembourg, 2019. [Google Scholar]
- European Union Agency for the Space Programme. EUSPA EO and GNSS Market Report Issue 1; European Union Agency: Luxembourg, 2022. [Google Scholar]
- Szantoi, Z.; Geller, G.N.; Tsendbazar, N.-E.; See, L.; Griffiths, P.; Fritz, S.; Gong, P.; Herold, M.; Mora, B.; Obregón, A. Addressing the need for improved land cover map products for policy support. Environ. Sci. Policy 2020, 112, 28–35. [Google Scholar] [CrossRef]
- Van Tricht, K.; Gobin, A.; Gilliams, S.; Piccard, I. Synergistic Use of Radar Sentinel-1 and Optical Sentinel-2 Imagery for Crop Mapping: A Case Study for Belgium. Remote Sens. 2018, 10, 1642. [Google Scholar] [CrossRef]
- World Meteorological Organization (WMO). Executive Summary. Scientific Assessment of Ozone Depletion: 2022; WMO: Geneva, Switzerland, 2022. [Google Scholar]
- Wulder, M.A.; Roy, D.P.; Radeloff, V.C.; Loveland, T.R.; Anderson, M.C.; Johnson, D.M.; Healey, S.; Zhu, Z.; Scambos, T.A.; Pahlevan, N.; et al. Fifty years of Landsat science and impacts. Remote Sens. Environ. 2022, 280, 113195. [Google Scholar] [CrossRef]
- López-Andreu, F.J.; López-Morales, J.A.; Erena, M.; Skarmeta, A.F.; Martínez, J.A. Monitoring System for the Management of the Common Agricultural Policy Using Machine Learning and Remote Sensing. Electronics 2022, 11, 325. [Google Scholar] [CrossRef]
- Regulation (EU) No 1306/2013 of the European Parliament and of the Council of 17 December 2013 on the financing, management and monitoring of the common agricultural policy and repealing Council Regulations (EEC) No 352/78, (EC) No 165/94, (EC) No 2799/98, (EC) No 814/2000, (EC) No 1290/2005 and (EC) No 485/2008. Off. J. Eur. Union 2013, 1306, 549–607.
- De Leeuw, J.; Georgiadou, Y.; Kerle, N.; De Gier, A.; Inoue, Y.; Ferwerda, J.; Smies, M.; Narantuya, D. The Function of Remote Sensing in Support of Environmental Policy. Remote Sens. 2010, 2, 1731–1750. [Google Scholar] [CrossRef]
- Wellmann, T.; Lausch, A.; Andersson, E.; Knapp, S.; Cortinovis, C.; Jache, J.; Scheuer, S.; Kremer, P.; Mascarenhas, A.; Kraemer, R.; et al. Remote sensing in urban planning: Contributions towards ecologically sound policies? Landsc. Urban Plan. 2020, 204, 103921. [Google Scholar] [CrossRef]
- United Nations Environment Programme. Emissions Gap Report 2020; United Nations Environment Programme: Nairobi, Kenya, 2020. [Google Scholar]
- Direction Générale de l’Environnement et du Climat (Benin). Contribution Déterminées au Niveau National Actualisee du Benin au Titre de L’accord de Paris: Document Final; Republic of Benin. 2021. [Google Scholar]
- Republic of Togo. Intended Nationally Determined Contribution (INDC) within the Framework of the United Nations Framework Convention on Climate Change (UNFCCC); Togo. 2015. [Google Scholar]
- Yurui, L.; Yi, L.; Pengcan, F.; Hualou, L. Impacts of land consolidation on rural human–environment system in typical watershed of the Loess Plateau and implications for rural development policy. Land Use Policy 2019, 86, 339–350. [Google Scholar] [CrossRef]
- Cao, S.; Hu, D.; Zhao, W.; Mo, Y.; Chen, S. Monitoring Spatial Patterns and Changes of Ecology, Production, and Living Land in Chinese Urban Agglomerations: 35 Years after Reform and Opening Up, Where, How and Why? Sustainability 2017, 9, 766. [Google Scholar] [CrossRef]
- Dai, Y.; Feng, L.; Hou, X.; Choi, C.Y.; Liu, J.; Cai, X.; Shi, L.; Zhang, Y.; Gibson, L. Policy-driven changes in enclosure fisheries of large lakes in the Yangtze Plain: Evidence from satellite imagery. Sci. Total. Environ. 2019, 688, 1286–1297. [Google Scholar] [CrossRef]
- Duan, H.; Wang, T.; Xue, X.; Yan, C. Dynamic monitoring of aeolian desertification based on multiple indicators in Horqin Sandy Land, China. Sci. Total. Environ. 2018, 650, 2374–2388. [Google Scholar] [CrossRef]
- El-Tantawi, A.M.; Bao, A.; Chang, C.; Liu, Y. Monitoring and predicting land use/cover changes in the Aksu-Tarim River Basin, Xinjiang-China (1990–2030). Environ. Monit. Assess. 2019, 191, 480. [Google Scholar] [CrossRef]
- Filonchyk, M.; Hurynovich, V.; Yan, H.; Gusev, A.; Shpilevskaya, N. Impact Assessment of COVID-19 on Variations of SO2, NO2, CO and AOD over East China. Aerosol Air Qual. Res. 2020, 20, 1530–1540. [Google Scholar] [CrossRef]
- Fu, B.; Yu, D.; Zhang, Y. The livable urban landscape: GIS and remote sensing extracted land use assessment for urban livability in Changchun Proper, China. Land Use Policy 2019, 87, 104048. [Google Scholar] [CrossRef]
- Guo, B.; Fang, Y.; Jin, X.; Zhou, Y. Monitoring the effects of land consolidation on the ecological environmental quality based on remote sensing: A case study of Chaohu Lake Basin, China. Land Use Policy 2020, 95, 104569. [Google Scholar] [CrossRef]
- Hasan, S.; Shi, W.; Zhu, X.; Abbas, S. Monitoring of Land Use/Land Cover and Socioeconomic Changes in South China over the Last Three Decades Using Landsat and Nighttime Light Data. Remote Sens. 2019, 11, 1658. [Google Scholar] [CrossRef]
- Hou, K.; Li, X.; Wang, J.J.; Zhang, J. An analysis of the impact on land use and ecological vulnerability of the policy of returning farmland to forest in Yan’an, China. Environ. Sci. Pollut. Res. 2015, 23, 4670–4680. [Google Scholar] [CrossRef]
- Hu, Y.; Nacun, B. An Analysis of Land-Use Change and Grassland Degradation from a Policy Perspective in Inner Mongolia, China, 1990–2015. Sustainability 2018, 10, 4048. [Google Scholar] [CrossRef]
- Huang, X.; Han, X.; Ma, S.; Lin, T.; Gong, J. Monitoring ecosystem service change in the City of Shenzhen by the use of high-resolution remotely sensed imagery and deep learning. Land Degrad. Dev. 2019, 30, 1490–1501. [Google Scholar] [CrossRef]
- Kuang, W. National urban land-use/cover change since the beginning of the 21st century and its policy implications in China. Land Use Policy 2020, 97, 104747. [Google Scholar] [CrossRef]
- Lei, G.; Li, A.; Zhang, Z.; Bian, J.; Hu, G.; Wang, C.; Nan, X.; Wang, J.; Tan, J.; Liao, X. The Quantitative Estimation of Grazing Intensity on the Zoige Plateau Based on the Space-Air-Ground Integrated Monitoring Technology. Remote Sens. 2020, 12, 1399. [Google Scholar] [CrossRef]
- Li, F.; Ding, D.; Chen, Z.; Chen, H.; Shen, T.; Wu, Q.; Zhang, C. Change of sea reclamation and the sea-use management policy system in China. Mar. Policy 2020, 115, 103861. [Google Scholar] [CrossRef]
- Li, H.; Wang, C.; Huang, X.; Hug, A. Spatial Assessment of Water Quality with Urbanization in 2007–2015, Shanghai, China. Remote Sens. 2018, 10, 1024. [Google Scholar] [CrossRef]
- Li, H.; Mao, D.; Li, X.; Wang, Z.; Wang, C. Monitoring 40-Year Lake Area Changes of the Qaidam Basin, Tibetan Plateau, Using Landsat Time Series. Remote Sens. 2019, 11, 343. [Google Scholar] [CrossRef]
- Li, N.; Yan, C.Z.; Xie, J.L. Remote sensing monitoring recent rapid increase of coal mining activity of an important energy base in northern China, a case study of Mu Us Sandy Land. Resour. Conserv. Recycl. 2015, 94, 129–135. [Google Scholar] [CrossRef]
- Li, S.; Wang, T.; Yan, C. Assessing the Role of Policies on Land-Use/Cover Change from 1965 to 2015 in the Mu Us Sandy Land, Northern China. Sustainability 2017, 9, 1164. [Google Scholar] [CrossRef]
- Li, S.; Zhang, Z.; Wang, T.; Yan, C.; Du, H. Oasis Functional Stability Evaluation Based on Multiple Indicators, Northwest China. Acta Geol. Sin. 2020, 94, 624–636. [Google Scholar] [CrossRef]
- Li, Y.; Li, Y.; Karácsonyi, D.; Liu, Z.; Wang, Y.; Wang, J. Spatio-temporal pattern and driving forces of construction land change in a poverty-stricken county of China and implications for poverty-alleviation-oriented land use policies. Land Use Policy 2019, 91, 104267. [Google Scholar] [CrossRef]
- Lin, L.; Jia, H.; Pan, Y.; Qiu, L.; Gan, M.; Lu, S.; Deng, J.; Yu, Z.; Wang, K. Exploring the Patterns and Mechanisms of Reclaimed Arable Land Utilization under the Requisition-Compensation Balance Policy in Wenzhou, China. Sustainability 2017, 10, 75. [Google Scholar] [CrossRef]
- Liu, M.; Dries, L.; Huang, J.; Min, S.; Tang, J. The impacts of the eco-environmental policy on grassland degradation and livestock production in Inner Mongolia, China: An empirical analysis based on the simultaneous equation model. Land Use Policy 2019, 88, 104167. [Google Scholar] [CrossRef]
- Liu, M.; Li, H.; Li, L.; Man, W.; Jia, M.; Wang, Z.; Lu, C. Monitoring the Invasion of Spartina alterniflora Using Multi-source High-resolution Imagery in the Zhangjiang Estuary, China. Remote Sens. 2017, 9, 539. [Google Scholar] [CrossRef]
- Liu, W.; Liu, J.; Kuang, W.; Ning, J. Examining the influence of the implementation of Major Function-oriented Zones on built-up area expansion in China. J. Geogr. Sci. 2017, 27, 643–660. [Google Scholar] [CrossRef]
- Luo, K.; Li, G.; Fang, C.; Sun, S. PM2.5 mitigation in China: Socioeconomic determinants of concentrations and differential control policies. J. Environ. Manag. 2018, 213, 47–55. [Google Scholar] [CrossRef]
- Luo, K.; Li, B.; Moiwo, J.P. Monitoring Land-Use/Land-Cover Changes at a Provincial Large Scale Using an Object-Oriented Technique and Medium-Resolution Remote-Sensing Images. Remote Sens. 2018, 10, 2012. [Google Scholar] [CrossRef]
- Ma, Z.; Liu, R.; Liu, Y.; Bi, J. Effects of air pollution control policies on PM2.5 pollution improvement in China from 2005 to 2017: A satellite-based perspective. Atmos. Chem. Phys. 2019, 19, 6861–6877. [Google Scholar] [CrossRef]
- Mao, D.; He, X.; Wang, Z.; Tian, Y.; Xiang, H.; Yu, H.; Man, W.; Jia, M.; Ren, C.; Zheng, H. Diverse policies leading to contrasting impacts on land cover and ecosystem services in Northeast China. J. Clean. Prod. 2019, 240, 117961. [Google Scholar] [CrossRef]
- Meng, L.; Dong, J. LUCC and Ecosystem Service Value Assessment for Wetlands: A Case Study in Nansi Lake, China. Water 2019, 11, 1597. [Google Scholar] [CrossRef]
- Mu, B.; Mayer, A.L.; He, R.; Tian, G. Land use dynamics and policy implications in Central China: A case study of Zhengzhou. Cities 2016, 58, 39–49. [Google Scholar] [CrossRef]
- Qu, L.; Chen, Z.; Li, M. CART-RF Classification with Multifilter for Monitoring Land Use Changes Based on MODIS Time-Series Data: A Case Study from Jiangsu Province, China. Sustainability 2019, 11, 5657. [Google Scholar] [CrossRef]
- Shao, J.; Zhang, S.; Li, X. Farmland marginalization in the mountainous areas: Characteristics, influencing factors and policy implications. J. Geogr. Sci. 2015, 25, 701–722. [Google Scholar] [CrossRef]
- Shen, Y.; Shen, H.; Cheng, Q.; Huang, L.; Zhang, L. Monitoring Three-Decade Expansion of China’s Major Cities Based on Satellite Remote Sensing Images. Remote Sens. 2020, 12, 491. [Google Scholar] [CrossRef]
- Shrestha, B.; Ye, Q.; Khadka, N. Assessment of Ecosystem Services Value Based on Land Use and Land Cover Changes in the Transboundary Karnali River Basin, Central Himalayas. Sustainability 2019, 11, 3183. [Google Scholar] [CrossRef]
- Song, W.; Zhang, Y. Expansion of agricultural oasis in the Heihe River Basin of China: Patterns, reasons and policy implications. Phys. Chem. Earth 2015, 89–90, 46–55. [Google Scholar] [CrossRef]
- Sun, T.; Lin, W.; Chen, G.; Guo, P.; Zeng, Y. Wetland ecosystem health assessment through integrating remote sensing and inventory data with an assessment model for the Hangzhou Bay, China. Sci. Total Environ. 2016, 566–567, 627–640. [Google Scholar] [CrossRef]
- Wang, K.; Wang, W.; Wang, W.; Jiang, X.; Yu, T.; Ciren, P. Spatial Assessment of Health Economic Losses from Exposure to Ambient Pollutants in China. Remote Sens. 2020, 12, 790. [Google Scholar] [CrossRef]
- Wang, S.; Zhang, X.; Wu, T.; Yang, Y. The evolution of landscape ecological security in Beijing under the influence of different policies in recent decades. Sci. Total Environ. 2018, 646, 49–57. [Google Scholar] [CrossRef]
- Wang, S.; Zeng, J.; Huang, Y.; Shi, C.; Zhan, P. The effects of urbanization on CO2 emissions in the Pearl River Delta: A comprehensive assessment and panel data analysis. Appl. Energy 2018, 228, 1693–1706. [Google Scholar] [CrossRef]
- Wang, Y.; Peng, D.; Yu, L.; Zhang, Y.; Yin, J.; Zhou, L.; Zheng, S.; Wang, F.; Li, C. Monitoring Crop Growth During the Period of the Rapid Spread of COVID-19 in China by Remote Sensing. IEEE J. Sel. Top. Appl. Earth Obs. Remote Sens. 2020, 13, 6195–6205. [Google Scholar] [CrossRef] [PubMed]
- Wang, Z.; Yang, Z.; Shi, H.; Han, F.; Liu, Q.; Qi, J.; Lu, Y. Ecosystem Health Assessment of World Natural Heritage Sites Based on Remote Sensing and Field Sampling Verification: Bayanbulak as Case Study. Sustainability 2020, 12, 2610. [Google Scholar] [CrossRef]
- Wen, Y.; Zhang, Z.; Liang, D.; Xu, Z. Rural Residential Land Transition in the Beijing-Tianjin-Hebei Region: Spatial-Temporal Patterns and Policy Implications. Land Use Policy 2020, 96, 104700. [Google Scholar] [CrossRef]
- Wu, N.; Liu, A.; Wang, Y.; Li, L.; Chao, L.; Liu, G. An Assessment Framework for Grassland Ecosystem Health with Consideration of Natural Succession: A Case Study in Bayinxile, China. Sustainability 2019, 11, 1096. [Google Scholar] [CrossRef]
- Xiao, Y.; Xiong, Q.; Pan, K. What Is Left for Our Next Generation? Integrating Ecosystem Services into Regional Policy Planning in the Three Gorges Reservoir Area of China. Sustainability 2018, 11, 3. [Google Scholar] [CrossRef]
- Xin, Z.; Li, C.; Liu, H.; Shang, H.; Ye, L.; Li, Y.; Zhang, C. Evaluation of Temporal and Spatial Ecosystem Services in Dalian, China: Implications for Urban Planning. Sustainability 2018, 10, 1247. [Google Scholar] [CrossRef]
- Xu, D.; Song, A.; Song, X. Assessing the effect of desertification controlling projects and policies in northern Shaanxi Province, China by integrating remote sensing and farmer investigation data. Front. Earth Sci. 2016, 11, 689–701. [Google Scholar] [CrossRef]
- Xu, K.; Wang, J.; Wang, J.; Wang, X.; Chi, Y.; Zhang, X. Environmental function zoning for spatially differentiated environmental policies in China. J. Environ. Manag. 2019, 255, 109485. [Google Scholar] [CrossRef]
- Xue, X.; Liao, J.; Hsing, Y.; Huang, C.; Liu, F. Policies, Land Use, and Water Resource Management in an Arid Oasis Ecosystem. Environ. Manag. 2015, 55, 1036–1051. [Google Scholar] [CrossRef] [PubMed]
- You, H. Orienting rocky desertification towards sustainable land use: An advanced remote sensing tool to guide the conservation policy. Land Use Policy 2017, 61, 171–184. [Google Scholar] [CrossRef]
- Zhai, J.; Liu, Y.; Hou, P.; Xiao, T.; Cao, G. Water Conservation Service Assessment and Its Spatiotemporal Features in National Key Ecological Function Zones. Adv. Meteorol. 2016, 2016, 1–11. [Google Scholar] [CrossRef]
- Zhang, D.; Jia, Q.; Xu, X.; Yao, S.; Chen, H.; Hou, X. Contribution of ecological policies to vegetation restoration: A case study from Wuqi County in Shaanxi Province, China. Land Use Policy 2018, 73, 400–411. [Google Scholar] [CrossRef]
- Zhang, F.; Kung, H.-T.; Johnson, V.C. Assessment of Land-Cover/Land-Use Change and Landscape Patterns in the Two National Nature Reserves of Ebinur Lake Watershed, Xinjiang, China. Sustainability 2017, 9, 724. [Google Scholar] [CrossRef]
- Zhang, Y.; Li, Q.; Wang, H.; Du, X.; Huang, H. Community scale livability evaluation integrating remote sensing, surface observation and geospatial big data. Int. J. Appl. Earth Obs. Geoinformation 2019, 80, 173–186. [Google Scholar] [CrossRef]
- Zhang, Z.; Ke, C. Monitoring and analysis of changes in a wetland landscape in Xingzi county. Earth Sci. Informatics 2015, 9, 35–45. [Google Scholar] [CrossRef]
- Zhang, Z.; Wen, Q.; Liu, F.; Zhao, X.; Liu, B.; Xu, J.; Yi, L.; Hu, S.; Wang, X.; Zuo, L.; et al. Urban expansion in China and its effect on cultivated land before and after initiating “Reform and Open Policy”. Sci. China Earth Sci. 2016, 59, 1930–1945. [Google Scholar] [CrossRef]
- Zhao, J.; Ding, F.; Wang, Z.; Ren, J.; Zhao, J.; Wang, Y.; Tang, X.; Wang, Y.; Yao, J.; Li, Q. A Rapid Public Health Needs Assessment Framework for after Major Earthquakes Using High-Resolution Satellite Imagery. Int. J. Environ. Res. Public Health 2018, 15, 1111. [Google Scholar] [CrossRef] [PubMed]
- Zhou, T.; Akiyama, T.; Horita, M.; Kharrazi, A.; Kraines, S.; Li, J.; Yoshikawa, K. The Impact of Ecological Restoration Projects in Dry Lands: Data-based Assessment and Human Perceptions in the Lower Reaches of Heihe River Basin, China. Sustainability 2018, 10, 1471. [Google Scholar] [CrossRef]
- Zhou, Y.; Dong, J.; Liu, J.; Metternicht, G.; Shen, W.; You, N.; Zhao, G.; Xiao, X. Are There Sufficient Landsat Observations for Retrospective and Continuous Monitoring of Land Cover Changes in China? Remote Sens. 2019, 11, 1808. [Google Scholar] [CrossRef]
- Zhuang, Z.; Li, K.; Liu, J.; Cheng, Q.; Gao, Y.; Shan, J.; Cai, L.; Huang, Q.; Chen, Y.; Chen, D. China’s New Urban Space Regulation Policies: A Study of Urban Development Boundary Delineations. Sustainability 2016, 9, 45. [Google Scholar] [CrossRef]
- Yang, C.; Zhang, C.; Li, Q.; Liu, H.; Gao, W.; Shi, T.; Liu, X.; Wu, G. Rapid urbanization and policy variation greatly drive ecological quality evolution in Guangdong-Hong Kong-Macau Greater Bay Area of China: A remote sensing perspective. Ecol. Indic. 2020, 115, 106373. [Google Scholar] [CrossRef]
- Xiao, Q.; Tao, J.; Xiao, Y.; Qian, F. Monitoring vegetation cover in Chongqing between 2001 and 2010 using remote sensing data. Environ. Monit. Assess. 2017, 189, 493. [Google Scholar] [CrossRef] [PubMed]
- Liu, G.; Jin, Q.; Li, J.; Li, L.; He, C.; Huang, Y.; Yao, Y. Policy factors impact analysis based on remote sensing data and the CLUE-S model in the Lijiang River Basin, China. Catena 2017, 158, 286–297. [Google Scholar] [CrossRef]
- Lu, Y.; Coops, N.C.; Hermosilla, T. Regional assessment of pan-Pacific urban environments over 25 years using annual gap free Landsat data. Int. J. Appl. Earth Obs. Geoinformation 2016, 50, 198–210. [Google Scholar] [CrossRef]
- Chen, Y.; Fei, X.; Groisman, P.; Sun, Z.; Zhang, J.; Qin, Z. Contrasting policy shifts influence the pattern of vegetation production and C sequestration over pasture systems: A regional-scale comparison in Temperate Eurasian Steppe. Agric. Syst. 2019, 176, 102679. [Google Scholar] [CrossRef]
- Xu, H.; Qi, S.; Gong, P.; Liu, C.; Wang, J. Long-term monitoring of citrus orchard dynamics using time-series Landsat data: A case study in southern China. Int. J. Remote Sens. 2018, 39, 8271–8292. [Google Scholar] [CrossRef]
- Azmi, S.; Agarwadkar, Y.; Bhattacharya, M.; Apte, M.; Inamdar, A.B. Monitoring and trend mapping of sea surface temperature (SST) from MODIS data: A case study of Mumbai coast. Environ. Monit. Assess. 2015, 187, 165. [Google Scholar] [CrossRef]
- Chettry, V.; Surawar, M. Urban sprawl assessment in Raipur and Bhubaneswar urban agglomerations from 1991 to 2018 using geoinformatics. Arab. J. Geosci. 2020, 13, 667. [Google Scholar] [CrossRef]
- Jadhav, A.; Anderson, S.; Dyer, M.J.B.; Sutton, P.C. Revisiting Ecosystem Services: Assessment and Valuation as Starting Points for Environmental Politics. Sustainability 2017, 9, 1755. [Google Scholar] [CrossRef]
- Jana, C.; Mandal, D.; Shrimali, S.S.; Alam, N.M.; Kumar, R.; Sena, D.R.; Kaushal, R. Assessment of urban growth effects on green space and surface temperature in Doon Valley, Uttarakhand, India. Environ. Monit. Assess. 2020, 192, 257. [Google Scholar] [CrossRef] [PubMed]
- Jayakumar, K.; Malarvannan, S. Assessment of shoreline changes over the Northern Tamil Nadu Coast, South India using WebGIS techniques. J. Coast. Conserv. 2016, 20, 477–487. [Google Scholar] [CrossRef]
- Machiwal, D.; Rangi, N.; Sharma, A. Integrated knowledge- and data-driven approaches for groundwater potential zoning using GIS and multi-criteria decision making techniques on hard-rock terrain of Ahar catchment, Rajasthan, India. Environ. Earth Sci. 2014, 73, 1871–1892. [Google Scholar] [CrossRef]
- Pasha, S.V.; Reddy, C.S.; Jha, C.S.; Rao, P.V.V.P.; Dadhwal, V.K. Assessment of Land Cover Change Hotspots in Gulf of Kachchh, India Using Multi-Temporal Remote Sensing Data and GIS. J. Indian Soc. Remote Sens. 2016, 44, 905–913. [Google Scholar] [CrossRef]
- Rahaman, S.; Kumar, P.; Chen, R.; Meadows, M.E.; Singh, R.B. Remote Sensing Assessment of the Impact of Land Use and Land Cover Change on the Environment of Barddhaman District, West Bengal, India. Front. Environ. Sci. 2020, 8, 27. [Google Scholar] [CrossRef]
- Ramachandran, R.M.; Reddy, C.S. Monitoring of deforestation and land use changes (1925–2012) in Idukki district, Kerala, India using remote sensing and GIS. J. Indian Soc. Remote Sens. 2016, 45, 163–170. [Google Scholar] [CrossRef]
- Rawat, K.S.; Mishra, A.K.; Bhattacharyya, R. Soil erosion risk assessment and spatial mapping using LANDSAT-7 ETM+, RUSLE, and GIS—A case study. Arab. J. Geosci. 2016, 9, 288. [Google Scholar] [CrossRef]
- Sahoo, R.N.; Dutta, D.; Khanna, M.; Kumar, N.; Bandyopadhyay, S.K. Drought assessment in the Dhar and Mewat Districts of India using meteorological, hydrological and remote-sensing derived indices. Nat. Hazards 2015, 77, 733–751. [Google Scholar] [CrossRef]
- Sembhi, H.; Wooster, M.; Zhang, T.; Sharma, S.; Singh, N.; Agarwal, S.; Boesch, H.; Gupta, S.; Misra, A.; Tripathi, S.N.; et al. Post-monsoon air quality degradation across Northern India: Assessing the impact of policy-related shifts in timing and amount of crop residue burnt. Environ. Res. Lett. 2020, 15, 104067. [Google Scholar] [CrossRef]
- Sinha, M.K.; Verma, M.K.; Ahmad, I.; Baier, K.; Jha, R.; Azzam, R. Assessment of groundwater vulnerability using modified DRASTIC model in Kharun Basin, Chhattisgarh, India. Arab. J. Geosci. 2016, 9, 98. [Google Scholar] [CrossRef]
- Somvanshi, S.S.; Bhalla, O.; Kunwar, P.; Singh, M.; Singh, P. Monitoring spatial LULC changes and its growth prediction based on statistical models and earth observation datasets of Gautam Budh Nagar, Uttar Pradesh, India. Environ. Dev. Sustain. 2020, 22, 1073–1091. [Google Scholar] [CrossRef]
- Sushanth, K.; Bhardwaj, A. Assessment of landuse change impact on runoff and sediment yield of Patiala-Ki-Rao watershed in Shivalik foot-hills of northwest India. Environ. Monit. Assess. 2019, 191, 757. [Google Scholar] [CrossRef]
- AbdelRahman, M.A.; Natarajan, A.; Hegde, R.; Prakash, S. Assessment of land degradation using comprehensive geostatistical approach and remote sensing data in GIS-model builder. Egypt. J. Remote Sens. Space Sci. 2018, 22, 323–334. [Google Scholar] [CrossRef]
- Wilson, S.A.; Wilson, C.O. Land Use/Land Cover Planning Nexus: A Space-Time Multi-Scalar Assessment of Urban Growth in the Tulsa Metropolitan Statistical Area. Hum. Ecol. 2016, 44, 731–750. [Google Scholar] [CrossRef]
- Weber, S.; Sadoff, N.; Zell, E.; de Sherbinin, A. Policy-relevant indicators for mapping the vulnerability of urban populations to extreme heat events: A case study of Philadelphia. Appl. Geogr. 2015, 63, 231–243. [Google Scholar] [CrossRef]
- Scudiero, E.; Skaggs, T.H.; Corwin, D.L. Regional-scale soil salinity assessment using Landsat ETM + canopy reflectance. Remote Sens. Environ. 2015, 169, 335–343. [Google Scholar] [CrossRef]
- Jones, M.O.; Naugle, D.E.; Twidwell, D.; Uden, D.R.; Maestas, J.D.; Allred, B.W. Beyond Inventories: Emergence of a New Era in Rangeland Monitoring. Rangel. Ecol. Manag. 2020, 73, 577–583. [Google Scholar] [CrossRef]
- Hivin, L.F.; Pfaender, H.; Mavris, D.N. Regional climate impact of aerosols emitted by transportation modes and potential effects of policies on demand and emissions. Transp. Res. Part D: Transp. Environ. 2015, 41, 24–39. [Google Scholar] [CrossRef]
- Gillespie, T.W.; Willis, K.S.; Ostermann-Kelm, S.; Longcore, T.; Federico, F.; Lee, L.; Macdonald, G.M. Inventorying and Monitoring Nighttime Light Distribution and Dynamics in the Mediterranean Coast Network of Southern California. Nat. Areas J. 2017, 37, 350–360. [Google Scholar] [CrossRef]
- Foster, T.; Gonçalves, I.Z.; Campos, I.; Neale, C.M.; Brozovic, N. Assessing landscape scale heterogeneity in irrigation water use with remote sensing and in situ monitoring. Environ. Res. Lett. 2018, 14, 024004. [Google Scholar] [CrossRef]
- Fickas, K.C.; Cohen, W.B.; Yang, Z. Landsat-based monitoring of annual wetland change in the Willamette Valley of Oregon, USA from 1972 to 2012. Wetl. Ecol. Manag. 2015, 24, 73–92. [Google Scholar] [CrossRef]
- Di, L.; Yu, E.G.; Kang, L.; Shrestha, R.; Bai, Y.-Q. RF-CLASS: A remote-sensing-based flood crop loss assessment cyber-service system for supporting crop statistics and insurance decision-making. J. Integr. Agric. 2017, 16, 408–423. [Google Scholar] [CrossRef]
- Davis, T.W.; Stumpf, R.; Bullerjahn, G.S.; McKay, R.M.L.; Chaffin, J.D.; Bridgeman, T.B.; Winslow, C. Science meets policy: A framework for determining impairment designation criteria for large waterbodies affected by cyanobacterial harmful algal blooms. Harmful Algae 2018, 81, 59–64. [Google Scholar] [CrossRef]
- Chappell, A.; Webb, N.P.; Guerschman, J.P.; Thomas, D.T.; Mata, G.; Handcock, R.N.; Leys, J.F.; Butler, H.J. Improving ground cover monitoring for wind erosion assessment using MODIS BRDF parameters. Remote Sens. Environ. 2018, 204, 756–768. [Google Scholar] [CrossRef]
- Sciortino, M.; De Felice, M.; De Cecco, L.; Borfecchia, F. Remote sensing for monitoring and mapping Land Productivity in Italy: A rapid assessment methodology. Catena 2019, 188, 104375. [Google Scholar] [CrossRef]
- Piedelobo, L.; Taramelli, A.; Schiavon, E.; Valentini, E.; Molina, J.-L.; Xuan, A.N.; González-Aguilera, D. Assessment of Green Infrastructure in Riparian Zones Using Copernicus Programme. Remote Sens. 2019, 11, 2967. [Google Scholar] [CrossRef]
- Marcantonio, M.; Metz, M.; Baldacchino, F.; Arnoldi, D.; Montarsi, F.; Capelli, G.; Carlin, S.; Neteler, M.; Rizzoli, A. First assessment of potential distribution and dispersal capacity of the emerging invasive mosquito Aedes koreicus in Northeast Italy. Parasites Vectors 2016, 9, 63. [Google Scholar] [CrossRef]
- Di Palma, F.; Amato, F.; Nolè, G.; Martellozzo, F.; Murgante, B. A SMAP Supervised Classification of Landsat Images for Urban Sprawl Evaluation. ISPRS Int. J. Geo-Inf. 2016, 5, 109. [Google Scholar] [CrossRef]
- Borrelli, P.; Panagos, P.; Märker, M.; Modugno, S.; Schütt, B. Assessment of the impacts of clear-cutting on soil loss by water erosion in Italian forests: First comprehensive monitoring and modelling approach. Catena 2017, 149, 770–781. [Google Scholar] [CrossRef]
- Aquilino, M.; Tarantino, C.; Adamo, M.; Barbanente, A.; Blonda, P. Earth Observation for the Implementation of Sustainable Development Goal 11 Indicators at Local Scale: Monitoring of the Migrant Population Distribution. Remote Sens. 2020, 12, 950. [Google Scholar] [CrossRef]
- Petropoulos, G.P.; Ireland, G.; Cass, A.; Srivastava, P.K. Performance Assessment of the SEVIRI Evapotranspiration Operational Product: Results Over Diverse Mediterranean Ecosystems. IEEE Sensors J. 2015, 15, 3412–3423. [Google Scholar] [CrossRef]
- Rudke, A.P.; de Souza, V.A.S.; dos Santos, A.M.; Xavier, A.C.F.; Filho, O.C.R.; Martins, J.A. Impact of mining activities on areas of environmental protection in the southwest of the Amazon: A GIS- and remote sensing-based assessment. J. Environ. Manag. 2020, 263, 110392. [Google Scholar] [CrossRef]
- Parras, R.; De Mendonça, G.C.; Costa, R.C.A.; Pissarra, T.C.T.; Valera, C.A.; Fernandes, L.F.S.; Pacheco, F.A.L. The Configuration of Forest Cover in Ribeirão Preto: A Diagnosis of Brazil’s Forest Code Implementation. Sustainability 2020, 12, 5686. [Google Scholar] [CrossRef]
- Nascimento, N.; West, T.A.P.; Biber-Freudenberger, L.; de Sousa-Neto, E.R.; Ometto, J.; Börner, J. A Bayesian network approach to modelling land-use decisions under environmental policy incentives in the Brazilian Amazon. J. Land Use Sci. 2019, 15, 127–141. [Google Scholar] [CrossRef]
- Ledru, M.-P.; Jeske-Pieruschka, V.; Bremond, L.; Develle, A.-L.; Sabatier, P.; Martins, E.S.P.R.; Filho, M.R.D.F.; Fontenele, D.P.; Arnaud, F.; Favier, C.; et al. When archives are missing, deciphering the effects of public policies and climate variability on the Brazilian semi-arid region using sediment core studies. Sci. Total. Environ. 2020, 723, 137989. [Google Scholar] [CrossRef]
- Guadalupe, V.; Sotta, E.D.; Santos, V.F.; Aguiar, L.J.G.; Vieira, M.; de Oliveira, C.P.; Siqueira, J.V.N. REDD+ implementation in a high forest low deforestation area: Constraints on monitoring forest carbon emissions. Land Use Policy 2018, 76, 414–421. [Google Scholar] [CrossRef]
- de Alencar, P.G.; de Espindola, G.M.; Carneiro, E.L.N.D.C. Dwarf cashew crop expansion in the Brazilian semiarid region: Assessing policy alternatives in Pio IX, Piauí. Land Use Policy 2018, 79, 1–9. [Google Scholar] [CrossRef]
- Brovelli, M.A.; Sun, Y.; Yordanov, V. Monitoring Forest Change in the Amazon Using Multi-Temporal Remote Sensing Data and Machine Learning Classification on Google Earth Engine. ISPRS Int. J. Geo-Inf. 2020, 9, 580. [Google Scholar] [CrossRef]
- Akhtar, S.M.; Iqbal, J. Assessment of emerging hydrological, water quality issues and policy discussion on water sharing of transboundary Kabul River. Water Policy 2017, 19, 650–672. [Google Scholar] [CrossRef]
- Zeb, A. Spatial and temporal trends of forest cover as a response to policy interventions in the district Chitral, Pakistan. Appl. Geogr. 2018, 102, 39–46. [Google Scholar] [CrossRef]
- Khan, K.; Iqbal, J.; Ali, A.; Khan, S. Assessment of Sentinel-2-Derived Vegetation Indices for the Estimation of above-Ground Biomass/Carbon Stock, Temporal Deforestation and Carbon Emissions Estimation in the Moist Temperate Forests of Pakistan. Appl. Ecol. Environ. Res. 2020, 18, 783–815. [Google Scholar] [CrossRef]
- Imran, M.; Sumra, K.; Mahmood, S.A.; Sajjad, S.F. Mapping flood vulnerability from socioeconomic classes and GI data: Linking socially resilient policies to geographically sustainable neighborhoods using PLS-SEM. Int. J. Disaster Risk Reduct. 2019, 41, 101288. [Google Scholar] [CrossRef]
- Ullah, S.; Farooq, M.; Shafique, M.; Siyab, M.A.; Kareem, F.; Dees, M. Spatial assessment of forest cover and land-use changes in the Hindu-Kush mountain ranges of northern Pakistan. J. Mt. Sci. 2016, 13, 1229–1237. [Google Scholar] [CrossRef]
- Imran, M.; Sumra, K.; Abbas, N.; Majeed, I. Spatial distribution and opportunity mapping: Applicability of evidence-based policy implications in Punjab using remote sensing and global products. Sustain. Cities Soc. 2019, 50, 101652. [Google Scholar] [CrossRef]
- Awais, M.; Shahzad, M.I.; Nazeer, M.; Mahmood, I.; Mehmood, S.; Iqbal, M.F.; Yasmin, N.; Shahid, I. Assessment of aerosol optical properties using remote sensing over highly urbanised twin cities of Pakistan. J. Atmospheric Solar-Terrestrial Phys. 2018, 173, 37–49. [Google Scholar] [CrossRef]
- Tornos, L.; Huesca, M.; Dominguez, J.A.; Moyano, M.C.; Cicuendez, V.; Recuero, L.; Palacios-Orueta, A. Assessment of MODIS spectral indices for determining rice paddy agricultural practices and hydroperiod. ISPRS J. Photogramm. Remote Sens. 2015, 101, 110–124. [Google Scholar] [CrossRef]
- Regos, A.; Gómez-Rodríguez, P.; Arenas-Castro, S.; Tapia, L.; Vidal, M.; Domínguez, J. Model-Assisted Bird Monitoring Based on Remotely Sensed Ecosystem Functioning and Atlas Data. Remote Sens. 2020, 12, 2549. [Google Scholar] [CrossRef]
- Picos, J.; Alonso, L.; Bastos, G.; Armesto, J. Event-Based Integrated Assessment of Environmental Variables and Wildfire Severity through Sentinel-2 Data. Forests 2019, 10, 1021. [Google Scholar] [CrossRef]
- Gómez, V.P.; Gutiérrez, A.; Del Blanco, V.; Nafría, D.A. A Methodological Approach for Irrigation Detection in the Frame of Common Agricultural Policy Checks by Monitoring. Agronomy 2020, 10, 867. [Google Scholar] [CrossRef]
- Estrada, J.; Sánchez, H.; Hernanz, L.; Checa, M.J.; Roman, D. Enabling the Use of Sentinel-2 and LiDAR Data for Common Agriculture Policy Funds Assignment. ISPRS Int. J. Geo-Inf. 2017, 6, 255. [Google Scholar] [CrossRef]
- Caballero, I.; Navarro, G.; Ruiz, J. Multi-platform assessment of turbidity plumes during dredging operations in a major estuarine system. Int. J. Appl. Earth Obs. Geoinf. 2018, 68, 31–41. [Google Scholar] [CrossRef]
- Deilami, K. Kamruzzaman Modelling the urban heat island effect of smart growth policy scenarios in Brisbane. Land Use Policy 2017, 64, 38–55. [Google Scholar] [CrossRef]
- Petus, C.; Waterhouse, J.; Lewis, S.; Vacher, M.; Tracey, D.; Devlin, M. A flood of information: Using Sentinel-3 water colour products to assure continuity in the monitoring of water quality trends in the Great Barrier Reef (Australia). J. Environ. Manag. 2019, 248, 109255. [Google Scholar] [CrossRef]
- Nery, T.; Sadler, R.; Aulestia, M.S.; White, B.; Polyakov, M. Discriminating native and plantation forests in a Landsat time-series for land use policy design. Int. J. Remote Sens. 2019, 40, 4059–4082. [Google Scholar] [CrossRef]
- Radwan, T.M. Monitoring Agricultural Expansion in a Newly Reclaimed Area in the Western Nile Delta of Egypt Using Landsat Imageries. Agriculture 2019, 9, 137. [Google Scholar] [CrossRef]
- Allen, K.E.; Vásquez, S.P. Forest cover, development, and sustainability in Costa Rica: Can one policy fit all? Land Use Policy 2017, 67, 212–221. [Google Scholar] [CrossRef]
- AlQattan, N.; Acheampong, M.; Jaward, F.M.; Vijayakumar, N.; Enomah, L.E.D. Evaluation of the potential hydrological impacts of land use/cover change dynamics in Ghana’s oil city. Environ. Dev. Sustain. 2019, 22, 7313–7330. [Google Scholar] [CrossRef]
- Angiuli, E.; Pecharromán, E.; Ezquieta, P.V.; Gorzynska, M.; Ovejanu, I. Satellite Imagery-Based Damage Assessment on Nineveh and Nebi Yunus Archaeological Site in Iraq. Remote Sens. 2020, 12, 1672. [Google Scholar] [CrossRef]
- Ariti, A.T.; van Vliet, J.; Verburg, P.H. Land-use and land-cover changes in the Central Rift Valley of Ethiopia: Assessment of perception and adaptation of stakeholders. Appl. Geogr. 2015, 65, 28–37. [Google Scholar] [CrossRef]
- Arsanjani, J.J.; Fibæk, C.S.; Vaz, E. Development of a cellular automata model using open source technologies for monitoring urbanisation in the global south: The case of Maputo, Mozambique. Habitat Int. 2018, 71, 38–48. [Google Scholar] [CrossRef]
- Badamfirooz, J.; Mousazadeh, R. Quantitative assessment of land use/land cover changes on the value of ecosystem services in the coastal landscape of Anzali International Wetland. Environ. Monit. Assess. 2019, 191, 694. [Google Scholar] [CrossRef]
- Burke, M.; Lobell, D.B. Satellite-Based Assessment of Yield Variation and Its Determinants in Smallholder African Systems. Proc. Natl. Acad. Sci. USA 2017, 114, 2189–2194. [Google Scholar] [CrossRef]
- Cengiz, S.; Atmiş, E.; Görmüş, S. The impact of economic growth oriented development policies on landscape changes in Istanbul Province in Turkey. Land Use Policy 2019, 87, 104086. [Google Scholar] [CrossRef]
- Christensen, M.; Arsanjani, J.J. Stimulating Implementation of Sustainable Development Goals and Conservation Action: Predicting Future Land Use/Cover Change in Virunga National Park, Congo. Sustainability 2020, 12, 1570. [Google Scholar] [CrossRef]
- Cristina, S.; Icely, J.; Goela, P.C.; DelValls, T.A.; Newton, A. Using remote sensing as a support to the implementation of the European Marine Strategy Framework Directive in SW Portugal. Cont. Shelf Res. 2015, 108, 169–177. [Google Scholar] [CrossRef]
- Crochelet, E.; Roberts, J.; Lagabrielle, E.; Obura, D.; Petit, M.; Chabanet, P. A model-based assessment of reef larvae dispersal in the Western Indian Ocean reveals regional connectivity patterns—Potential implications for conservation policies. Reg. Stud. Mar. Sci. 2016, 7, 159–167. [Google Scholar] [CrossRef]
- D’Andrimont, R.; Lemoine, G.; van der Velde, M. Targeted Grassland Monitoring at Parcel Level Using Sentinels, Street-Level Images and Field Observations. Remote Sens. 2018, 10, 1300. [Google Scholar] [CrossRef]
- Delavar, M.; Morid, S.; Morid, R.; Farokhnia, A.; Babaeian, F.; Srinivasan, R.; Karimi, P. Basin-wide water accounting based on modified SWAT model and WA+ framework for better policy making. J. Hydrol. 2020, 585, 124762. [Google Scholar] [CrossRef]
- Demattê, J.A.M.; Safanelli, J.L.; Paiva, A.F.D.S.; Souza, A.B.; Dos Santos, N.V.; Nascimento, C.M.; De Mello, D.C.; Bellinaso, H.; Neto, L.G.; Amorim, M.T.A.; et al. Bare Earth’s Surface Spectra as a Proxy for Soil Resource Monitoring. Sci. Rep. 2020, 10, 4461. [Google Scholar] [CrossRef]
- Duveiller, G.; Caporaso, L.; Abad-Viñas, R.; Perugini, L.; Grassi, G.; Arneth, A.; Cescatti, A. Local biophysical effects of land use and land cover change: Towards an assessment tool for policy makers. Land Use Policy 2019, 91, 104382. [Google Scholar] [CrossRef]
- Estoque, R.C.; Pontius, R.G., Jr.; Murayama, Y.; Hou, H.; Thapa, R.B.; Lasco, R.D.; Villar, M.A. Simultaneous comparison and assessment of eight remotely sensed maps of Philippine forests. Int. J. Appl. Earth Obs. Geoinf. 2018, 67, 123–134. [Google Scholar] [CrossRef]
- Giezen, M.; Balikci, S.; Arundel, R. Using Remote Sensing to Analyse Net Land-Use Change from Conflicting Sustainability Policies: The Case of Amsterdam. ISPRS Int. J. Geo-Inf. 2018, 7, 381. [Google Scholar] [CrossRef]
- Gumma, M.K.; Tsusaka, T.W.; Mohammed, I.; Chavula, G.; Rao, N.V.P.R.G.; Okori, P.; O Ojiewo, C.; Varshney, R.; Siambi, M.; Whitbread, A. Monitoring Changes in the Cultivation of Pigeonpea and Groundnut in Malawi Using Time Series Satellite Imagery for Sustainable Food Systems. Remote Sens. 2019, 11, 1475. [Google Scholar] [CrossRef]
- Haakana, H.; Hirvelä, H.; Hanski, I.K.; Packalen, T. Comparing regional forest policy scenarios in terms of predicted suitable habitats for the Siberian flying squirrel (Pteromys volans). Scand. J. For. Res. 2016, 32, 185–195. [Google Scholar] [CrossRef]
- Hackman, K.O.; Gong, P.; Wang, J. New land-cover maps of Ghana for 2015 using Landsat 8 and three popular classifiers for biodiversity assessment. Int. J. Remote Sens. 2017, 38, 4008–4021. [Google Scholar] [CrossRef]
- Hoang, T.T.; Truong, V.T.; Hayashi, M.; Tadono, T.; Nasahara, K.N. New JAXA High-Resolution Land Use/Land Cover Map for Vietnam Aiming for Natural Forest and Plantation Forest Monitoring. Remote Sens. 2020, 12, 2707. [Google Scholar] [CrossRef]
- Jasim, M.A.; Shafri, H.Z.M.; Hamedianfar, A.; Sameen, M. Land transformation assessment using the integration of remote sensing and GIS techniques: A case study of Al-Anbar Province, Iraq. Arab. J. Geosci. 2016, 9, 667. [Google Scholar] [CrossRef]
- Karimi, P.; Bastiaanssen, W.G.M.; Sood, A.; Hoogeveen, J.; Peiser, L.; Bastidas-Obando, E.; Dost, R.J. Spatial evapotranspiration, rainfall and land use data in water accounting—Part 2: Reliability of water acounting results for policy decisions in the Awash Basin. Hydrol. Earth Syst. Sci. 2015, 19, 533–550. [Google Scholar] [CrossRef]
- Khoshnoodmotlagh, S.; Verrelst, J.; Daneshi, A.; Mirzaei, M.; Azadi, H.; Haghighi, M.; Hatamimanesh, M.; Marofi, S. Transboundary Basins Need More Attention: Anthropogenic Impacts on Land Cover Changes in Aras River Basin, Monitoring and Prediction. Remote Sens. 2020, 12, 3329. [Google Scholar] [CrossRef]
- Lezzaik, K.; Milewski, A. A quantitative assessment of groundwater resources in the Middle East and North Africa region. Hydrogeol. J. 2017, 26, 251–266. [Google Scholar] [CrossRef]
- Loc, H.H.; Diep, N.T.H.; Can, N.T.; Irvine, K.N.; Shimizu, Y. Integrated evaluation of Ecosystem Services in Prawn-Rice rotational crops, Vietnam. Ecosyst. Serv. 2017, 26, 377–387. [Google Scholar] [CrossRef]
- Markert, K.N.; Schmidt, C.M.; Griffin, R.E.; Flores, A.I.; Poortinga, A.; Saah, D.S.; Muench, R.E.; Clinton, N.E.; Chishtie, F.; Kityuttachai, K.; et al. Historical and Operational Monitoring of Surface Sediments in the Lower Mekong Basin Using Landsat and Google Earth Engine Cloud Computing. Remote Sens. 2018, 10, 909. [Google Scholar] [CrossRef]
- Meier, J.; Mauser, W.; Hank, T.; Bach, H. Assessments on the impact of high-resolution-sensor pixel sizes for common agricultural policy and smart farming services in European regions. Comput. Electron. Agric. 2020, 169, 105205. [Google Scholar] [CrossRef]
- Mubako, S.; Belhaj, O.; Heyman, J.; Hargrove, W.; Reyes, C. Monitoring of Land Use/Land-Cover Changes in the Arid Transboundary Middle Rio Grande Basin Using Remote Sensing. Remote Sens. 2018, 10, 2005. [Google Scholar] [CrossRef]
- Mulligan, M.; van Soesbergen, A.; Hole, D.G.; Brooks, T.M.; Burke, S.; Hutton, J. Mapping nature’s contribution to SDG 6 and implications for other SDGs at policy relevant scales. Remote Sens. Environ. 2020, 239, 111671. [Google Scholar] [CrossRef]
- Nagabhatla, N.; Brahmbhatt, R. Geospatial Assessment of Water-Migration Scenarios in the Context of Sustainable Development Goals (SDGs) 6, 11, and 16. Remote Sens. 2020, 12, 1376. [Google Scholar] [CrossRef]
- Naumov, V.; Angelstam, P.; Elbakidze, M. Satisfying rival forestry objectives in the Komi Republic: Effects of Russian zoning policy change on wood production and riparian forest conservation. Can. J. For. Res. 2017, 47, 1339–1349. [Google Scholar] [CrossRef]
- Norton, L.; Smart, S.; Maskell, L.; Henrys, P.; Wood, C.; Keith, A.; Emmett, B.; Cosby, B.; Thomas, A.; Scholefield, P.; et al. Identifying effective approaches for monitoring national natural capital for policy use. Ecosyst. Serv. 2018, 30, 98–106. [Google Scholar] [CrossRef]
- Olorunfemi, I.E.; Komolafe, A.A.; Fasinmirin, J.T.; Olufayo, A.A.; Akande, S.O. A GIS-based assessment of the potential soil erosion and flood hazard zones in Ekiti State, Southwestern Nigeria using integrated RUSLE and HAND models. Catena 2020, 194, 104725. [Google Scholar] [CrossRef]
- Orimoloye, I.R.; Ololade, O.O. Spatial evaluation of land-use dynamics in gold mining area using remote sensing and GIS technology. Int. J. Environ. Sci. Technol. 2020, 17, 4465–4480. [Google Scholar] [CrossRef]
- Ozcan, O.; Aksu, G.; Erten, E.; Musaoglu, N.; Cetin, M. Degradation monitoring in Silvo-pastoral systems: A case study of the Mediterranean region of Turkey. Adv. Space Res. 2018, 63, 160–171. [Google Scholar] [CrossRef]
- Pieńkowski, P.; Podlasiński, M.; Dusza–Zwolińska, E. Evaluation of the location of cities in terms of land cover on the example of Poland. Urban Ecosyst. 2019, 22, 619–630. [Google Scholar] [CrossRef]
- Pelletier, J.; Horning, N.; Laporte, N.; Samndong, R.A.; Goetz, S. Anticipating social equity impacts in REDD+ policy design: An example from the Democratic Republic of Congo. Land Use Policy 2018, 75, 102–115. [Google Scholar] [CrossRef]
- Phiri, D.; Morgenroth, J.; Xu, C. Long-term land cover change in Zambia: An assessment of driving factors. Sci. Total. Environ. 2019, 697, 134206. [Google Scholar] [CrossRef]
- Poletti, C.; Dioszegi, G.; Nyongesa, K.W.; Vacik, H.; Barbujani, M.; Kigomo, J.N. Characterization of Forest Fires to Support Monitoring and Management of Mount Kenya Forest. Mt. Res. Dev. 2019, 39, R1–R12. [Google Scholar] [CrossRef]
- Psomiadis, E.; Charizopoulos, N.; Efthimiou, N.; Soulis, K.X.; Charalampopoulos, I. Earth Observation and GIS-Based Analysis for Landslide Susceptibility and Risk Assessment. ISPRS Int. J. Geo-Information 2020, 9, 552. [Google Scholar] [CrossRef]
- Putz, F.E.; Ruslandi; Ellis, P.W.; Griscom, B.W. Topographic restrictions on land-use practices: Consequences of different pixel sizes and data sources for natural forest management policies in the tropics. For. Ecol. Manag. 2018, 422, 108–113. [Google Scholar] [CrossRef]
- Rabehi, W.; Guerfi, M.; Mahi, H.; Rojas-Garcia, E. Spatiotemporal Monitoring of Coastal Urbanization Dynamics: Case Study of Algiers’ Bay, Algeria. J. Indian Soc. Remote Sens. 2019, 47, 1917–1936. [Google Scholar] [CrossRef]
- Rahman, M.; Lagomasino, D.; Lee, S.; Fatoyinbo, T.; Ahmed, I.; Kanzaki, M. Improved assessment of mangrove forests in Sundarbans East Wildlife Sanctuary using WorldView 2 and Tan DEM -X high resolution imagery. Remote Sens. Ecol. Conserv. 2019, 5, 136–149. [Google Scholar] [CrossRef]
- Ranagalage, M.; Gunarathna, M.H.J.P.; Surasinghe, T.D.; Dissanayake, D.; Simwanda, M.; Murayama, Y.; Morimoto, T.; Phiri, D.; Nyirenda, V.R.; Premakantha, K.T.; et al. Multi-Decadal Forest-Cover Dynamics in the Tropical Realm: Past Trends and Policy Insights for Forest Conservation in Dry Zone of Sri Lanka. Forests 2020, 11, 836. [Google Scholar] [CrossRef]
- Rimal, B.; Zhang, L.; Keshtkar, H.; Wang, N.; Lin, Y. Monitoring and Modeling of Spatiotemporal Urban Expansion and Land-Use/Land-Cover Change Using Integrated Markov Chain Cellular Automata Model. ISPRS Int. J. Geo-Inf. 2017, 6, 288. [Google Scholar] [CrossRef]
- Robinson, D.A.; Panagos, P.; Borrelli, P.; Jones, A.; Montanarella, L.; Tye, A.; Obst, C.G. Soil natural capital in europe; a framework for state and change assessment. Sci. Rep. 2017, 7, 6706. [Google Scholar] [CrossRef]
- Sanli, F.B.; Delen, A. Assessment of vegetation indices for the determination of agricultural crop types. J. Environ. Prot. Ecol. 2018, 19, 417–425. [Google Scholar]
- Sedano, F.; Lisboa, S.N.; Duncanson, L.; Ribeiro, N.; Sitoe, A.; Sahajpal, R.; Hurtt, G.; Tucker, C.J. Monitoring forest degradation from charcoal production with historical Landsat imagery. A case study in southern Mozambique. Environ. Res. Lett. 2020, 15, 015001. [Google Scholar] [CrossRef]
- Sharma, R.; Rimal, B.; Stork, N.; Baral, H.; Dhakal, M. Spatial Assessment of the Potential Impact of Infrastructure Development on Biodiversity Conservation in Lowland Nepal. ISPRS Int. J. Geo-Inf. 2018, 7, 365. [Google Scholar] [CrossRef]
- Shoman, W.; Demirel, H. Spatio-temporal evaluation of transport accessibility of the Istanbul metrobus line. Geocarto Int. 2018, 35, 602–622. [Google Scholar] [CrossRef]
- Soulis, K.; Psomiadis, E.; Londra, P.; Skuras, D. A New Model-Based Approach for the Evaluation of the Net Contribution of the European Union Rural Development Program to the Reduction of Water Abstractions in Agriculture. Sustainability 2020, 12, 7137. [Google Scholar] [CrossRef]
- Stapp, J.R.; Lilieholm, R.J.; Upadhaya, S.; Johnson, T. Evaluating the Impacts of Forest Management Policies and Community-Level Institutions in the Buffer Zone of Chitwan National Park, Nepal. J. Sustain. For. 2015, 34, 445–464. [Google Scholar] [CrossRef]
- Tassi, A.; Gil, A. A Low-cost Sentinel-2 Data and Rao’s Q Diversity Index-based Application for Detecting, Assessing and Monitoring Coastal Land-cover/Land-use Changes at High Spatial Resolution. J. Coast. Res. 2020, 95, 1315–1319. [Google Scholar] [CrossRef]
- Tun, K.K.; Shrestha, R.P.; Datta, A. Assessment of land degradation and its impact on crop production in the Dry Zone of Myanmar. Int. J. Sustain. Dev. World Ecol. 2015, 22, 533–544. [Google Scholar] [CrossRef]
- Waiyasusri, K.; Yumuang, S.; Chotpantarat, S. Monitoring and predicting land use changes in the Huai Thap Salao Watershed area, Uthaithani Province, Thailand, using the CLUE-s model. Environ. Earth Sci. 2016, 75, 533. [Google Scholar] [CrossRef]
- Wang, J.; Pauleit, S.; Banzhaf, E. An Integrated Indicator Framework for the Assessment of Multifunctional Green Infrastructure—Exemplified in a European City. Remote Sens. 2019, 11, 1869. [Google Scholar] [CrossRef]
- Wu, T.; Sang, S.; Wang, S.; Yang, Y.; Li, M. Remote sensing assessment and spatiotemporal variations analysis of ecological carrying capacity in the Aral Sea Basin. Sci. Total Environ. 2020, 735, 139562. [Google Scholar] [CrossRef]
- Zaehringer, J.G.; Hett, C.; Ramamonjisoa, B.; Messerli, P. Beyond deforestation monitoring in conservation hotspots: Analysing landscape mosaic dynamics in north-eastern Madagascar. Appl. Geogr. 2016, 68, 9–19. [Google Scholar] [CrossRef]
- Venter, Z.S.; Scott, S.L.; Desmet, P.G.; Hoffman, M.T. Application of Landsat-derived vegetation trends over South Africa: Potential for monitoring land degradation and restoration. Ecol. Indic. 2020, 113, 106206. [Google Scholar] [CrossRef]
- Hong, H.T.C.; Avtar, R.; Fujii, M. Monitoring changes in land use and distribution of mangroves in the southeastern part of the Mekong River Delta, Vietnam. Trop. Ecol. 2019, 60, 552–565. [Google Scholar] [CrossRef]
- Chowdhury, M.; Hasan, M.E.; Abdullah-Al-Mamun, M.M. Land use/land cover change assessment of Halda watershed using remote sensing and GIS. Egypt. J. Remote Sens. Space Sci. 2020, 23, 63–75. [Google Scholar] [CrossRef]
- Braun, D.; Damm, A.; Hein, L.; Petchey, O.L.; Schaepman, M.E. Spatio-temporal trends and trade-offs in ecosystem services: An Earth observation based assessment for Switzerland between 2004 and 2014. Ecol. Indic. 2018, 89, 828–839. [Google Scholar] [CrossRef]
- Aitekeyeva, N.; Li, X.; Guo, H.; Wu, W.; Shirazi, Z.; Ilyas, S.; Yegizbayeva, A.; Hategekimana, Y. Drought Risk Assessment in Cultivated Areas of Central Asia Using MODIS Time-Series Data. Water 2020, 12, 1738. [Google Scholar] [CrossRef]
- Felardo, J.; Lippitt, C.D. Spatial forest valuation: The role of location in determining attitudes toward payment for ecosystem services policies. For. Policy Econ. 2016, 62, 158–167. [Google Scholar] [CrossRef]
- Romagnoli, M.; Portapila, M.; Rigalli, A.; Maydana, G.; Burgués, M.; García, C.M. Assessment of the SWAT model to simulate a watershed with limited available data in the Pampas region, Argentina. Sci. Total Environ. 2017, 596–597, 437–450. [Google Scholar] [CrossRef]
- Sowter, A.; Athab, A.; Novellino, A.; Grebby, S.; Gee, D. Supporting energy regulation by monitoring land motion on a regional and national scale: A case study of Scotland. Proc. Inst. Mech. Eng. Part A J. Power Energy 2017, 232, 85–99. [Google Scholar] [CrossRef]
- Abdelkader, M.; Sliuzas, R.; Boerboom, L.; Elseicy, A.; Zevenbergen, J. Spatial and Temporal Human Settlement Growth Differentiation with Symbolic Machine Learning for Verifying Spatial Policy Targets: Assiut Governorate, Egypt as a Case Study. Remote Sens. 2020, 12, 3799. [Google Scholar] [CrossRef]
- Howarth, C.; Monasterolo, I. Understanding barriers to decision making in the UK energy-food-water nexus: The added value of interdisciplinary approaches. Environ. Sci. Policy 2016, 61, 53–60. [Google Scholar] [CrossRef]
- Acheampong, M.; Yu, Q.; Enomah, L.D.; Anchang, J.; Eduful, M. Land use/cover change in Ghana’s oil city: Assessing the impact of neoliberal economic policies and implications for sustainable development goal number one–A remote sensing and GIS approach. Land Use Policy 2018, 73, 373–384. [Google Scholar] [CrossRef]
- Al Zayed, I.S.; Elagib, N.A. Implications of non-sustainable agricultural water policies for the water-food nexus in large-scale irrigation systems: A remote sensing approach. Adv. Water Resour. 2017, 110, 408–422. [Google Scholar] [CrossRef]
- Fuchs, R.; Alexander, P.; Brown, C.; Cossar, F.; Henry, R.C.; Rounsevell, M. Why the US–China trade war spells disaster for the Amazon. Nature 2019, 567, 451–454. [Google Scholar] [CrossRef]
- Federal Agency for Cartography and Geodesy. Annual Report 2021; Federal Agency for Cartography and Geodesy: Frankfurt am Main, Germany, 2022. [Google Scholar]
- Astrand, P.-J.; Wirnhardt, C.; Biagini, B.; Weber, M.; Hellerman, R. Controls with remote sensing of Common Agricultural Policy (CAP) arable- and forage- area-based subsidies: A yearly more than 700-image and 3-M euro affair. Proc. SPIE 2004, 5570, 577–589. [Google Scholar] [CrossRef]
- Cairney, P.; Oliver, K. How Should Academics Engage in Policymaking to Achieve Impact? Politi- Stud. Rev. 2018, 18, 228–244. [Google Scholar] [CrossRef]
- Mercer, T.; Ayres, R.; Head, B.; Wanna, J. (Eds.) . Learning Policy, Doing Policy: Interactions Between Public Policy Theory, Practice and Teaching; ANU Press: Canberra, Australia, 2021. [Google Scholar]
- OECD. Policy Framework on Sound Public Governance: Baseline Features of Governments that Work Well. 2020. Available online: https://www.oecd-ilibrary.org/content/publication/c03e01b3-en (accessed on 10 November 2022).
- Gilbert, N.; Ahrweiler, P.; Barbrook-Johnson, P.; Narasimhan, K.P.; Wilkinson, H. Computational Modelling of Public Policy: Reflections on Practice. J. Artif. Soc. Soc. Simul. 2018, 21, 14. [Google Scholar] [CrossRef]
- Kolkman, D. The usefulness of algorithmic models in policy making. Gov. Inf. Q. 2020, 37, 101488. [Google Scholar] [CrossRef]
- National Research Council. Advancing Land Change Modeling: Opportunities and Research Requirements; The National Academies Press: Washington, DC, USA, 2014. [Google Scholar]
- Swart, R.; Raskin, P.; Robinson, J. The problem of the future: Sustainability science and scenario analysis. Glob. Environ. Chang. 2004, 14, 137–146. [Google Scholar] [CrossRef]
- Balvanera, P.; Jacobs, S.; Nagendra, H.; O’Farrell, P.; Bridgewater, P.; Crouzat, E.; Dendoncker, N.; Goodwin, S.; Gustafsson, K.M.; Kadykalo, A.N.; et al. The science-policy interface on ecosystems and people: Challenges and opportunities. Ecosyst. People 2020, 16, 345–353. [Google Scholar] [CrossRef]
- Hara, P.; Piekutowska, M.; Niedbała, G. Selection of Independent Variables for Crop Yield Prediction Using Artificial Neural Network Models with Remote Sensing Data. Land 2021, 10, 609. [Google Scholar] [CrossRef]
- Sarker, I.H. Machine Learning: Algorithms, Real-World Applications and Research Directions. SN Comput. Sci. 2021, 2, 160. [Google Scholar] [CrossRef] [PubMed]
- Yang, J.; Gong, P.; Fu, R.; Zhang, M.; Chen, J.; Liang, S.; Xu, B.; Shi, J.; Dickinson, R. Erratum: The role of satellite remote sensing in climate change studies. Nat. Clim. Chang. 2013, 3, 1001. [Google Scholar] [CrossRef]
- Koma, Z.; Seijmonsbergen, A.C.; Grootes, M.W.; Nattino, F.; Groot, J.; Sierdsema, H.; Foppen, R.P.B.; Kissling, W.D. Better together? Assessing different remote sensing products for predicting habitat suitability of wetland birds. Divers. Distrib. 2022, 28, 685–699. [Google Scholar] [CrossRef]
- Benami, E.; Jin, Z.; Carter, M.R.; Ghosh, A.; Hijmans, R.J.; Hobbs, A.; Kenduiywo, B.; Lobell, D.B. Uniting remote sensing, crop modelling and economics for agricultural risk management. Nat. Rev. Earth Environ. 2021, 2, 140–159. [Google Scholar] [CrossRef]
- Adelle, C.; Weiland, S. Policy assessment: The state of the art. Impact Assess. Proj. Apprais. 2012, 30, 25–33. [Google Scholar] [CrossRef]
- Oliver, K.; Parolin, Z. Assessing the policy and practice impact of an international policy initiative: The State of the World’s Midwifery 2014. BMC Health Serv. Res. 2018, 18, 499. [Google Scholar] [CrossRef]
- Capano, G.; Howlett, M. The Knowns and Unknowns of Policy Instrument Analysis: Policy Tools and the Current Research Agenda on Policy Mixes. SAGE Open 2020, 10, 2158244019900568. [Google Scholar] [CrossRef]
- Wu, H.; Li, Z.-L. Scale Issues in Remote Sensing: A Review on Analysis, Processing and Modeling. Sensors 2009, 9, 1768–1793. [Google Scholar] [CrossRef] [PubMed]
- Nativi, S.; Mazzetti, P.; Craglia, M. Digital Ecosystems for Developing Digital Twins of the Earth: The Destination Earth Case. Remote Sens. 2021, 13, 2119. [Google Scholar] [CrossRef]
- Louw, A.S.; Fu, J.; Raut, A.; Zulhilmi, A.; Yao, S.; McAlinn, M.; Fujikawa, A.; Siddique, M.T.; Wang, X.; Yu, X.; et al. The role of remote sensing during a global disaster: COVID-19 pandemic as case study. Remote Sens. Appl. Soc. Environ. 2022, 27, 100789. [Google Scholar] [CrossRef]
- Andries, A.; Morse, S.; Murphy, R.; Lynch, J.; Woolliams, E.; Fonweban, J. Translation of Earth observation data into sustainable development indicators: An analytical framework. Sustain. Dev. 2018, 27, 366–376. [Google Scholar] [CrossRef]
- Liu, J.; Hull, V.; Godfray, H.C.J.; Tilman, D.; Gleick, P.; Hoff, H.; Pahl-Wostl, C.; Xu, Z.; Chung, M.G.; Sun, J.; et al. Nexus approaches to global sustainable development. Nat. Sustain. 2018, 1, 466–476. [Google Scholar] [CrossRef]
- Waylen, K.A.; Blackstock, K.L.; van Hulst, F.J.; Damian, C.; Horváth, F.; Johnson, R.K.; Kanka, R.; Külvik, M.; Macleod, C.J.; Meissner, K.; et al. Policy-driven monitoring and evaluation: Does it support adaptive management of socio-ecological systems? Sci. Total Environ. 2019, 662, 373–384. [Google Scholar] [CrossRef]


Disclaimer/Publisher’s Note: The statements, opinions and data contained in all publications are solely those of the individual author(s) and contributor(s) and not of MDPI and/or the editor(s). MDPI and/or the editor(s) disclaim responsibility for any injury to people or property resulting from any ideas, methods, instructions or products referred to in the content. |
© 2023 by the authors. Licensee MDPI, Basel, Switzerland. This article is an open access article distributed under the terms and conditions of the Creative Commons Attribution (CC BY) license (https://creativecommons.org/licenses/by/4.0/).
Share and Cite
Bell, A.; Klein, D.; Rieser, J.; Kraus, T.; Thiel, M.; Dech, S. Scientific Evidence from Space—A Review of Spaceborne Remote Sensing Applications at the Science–Policy Interface. Remote Sens. 2023, 15, 940. https://doi.org/10.3390/rs15040940
Bell A, Klein D, Rieser J, Kraus T, Thiel M, Dech S. Scientific Evidence from Space—A Review of Spaceborne Remote Sensing Applications at the Science–Policy Interface. Remote Sensing. 2023; 15(4):940. https://doi.org/10.3390/rs15040940
Chicago/Turabian StyleBell, Alexandra, Doris Klein, Jakob Rieser, Tanja Kraus, Michael Thiel, and Stefan Dech. 2023. "Scientific Evidence from Space—A Review of Spaceborne Remote Sensing Applications at the Science–Policy Interface" Remote Sensing 15, no. 4: 940. https://doi.org/10.3390/rs15040940
APA StyleBell, A., Klein, D., Rieser, J., Kraus, T., Thiel, M., & Dech, S. (2023). Scientific Evidence from Space—A Review of Spaceborne Remote Sensing Applications at the Science–Policy Interface. Remote Sensing, 15(4), 940. https://doi.org/10.3390/rs15040940