Article

Future Scenarios of Land Use/Land Cover (LULC) Based on a CA-Markov Simulation Model: Case of a Mediterranean Watershed in Morocco

1
Georisk & Georesources (G2R) Research Team, Department of Earth Sciences, Faculty of Sciences and Techniques of Tangier (FST), Abdelmalek Essaadi University (UAE), Tangier 90000, Morocco
2
Department of Environment and Natural Resources, Scientific Division, National Institute for Agricultural Research of Rabat (INRA), P.O. Box 415, Rabat 10000, Morocco
3
Center of Excellence for Soil and Fertilizer Research in Africa (CESFRA), Mohammed VI Polytechnic University (UM6P), 660 Lot, Ben Guerir 43150, Morocco
4
Institute for Systems and Robotics, Instituto Superior Técnico, 1049-001 Lisboa, Portugal
5
National Institute of Oceanography and Applied Geophysics (OGS), Centre for Management of Maritime Infrastructure (CGN), Borgo Grotta Gigante 42/C, Sgonico, 34010 Trieste, Italy
6
Process Engineering and Environment Laboratory, Faculty of Sciences and Techniques of Mohammedia, Hassan II University of Casablanca, PB 146 Road to Rabat, Mohammadia 20650, Morocco
*
Author to whom correspondence should be addressed.
Remote Sens. 2023, 15(4), 1162; https://doi.org/10.3390/rs15041162
Submission received: 16 January 2023 / Revised: 10 February 2023 / Accepted: 15 February 2023 / Published: 20 February 2023
(This article belongs to the Special Issue Image Analysis for Forest Environmental Monitoring)

Abstract

:
Modeling of land use and land cover (LULC) is a very important tool, particularly in the agricultural field: it allows us to know the potential changes in land area in the future and to consider developments in order to prevent probable risks. The idea is to give a representation of probable future situations based on certain assumptions. The objective of this study is to make future predictions in land use and land cover in the watershed “9 April 1947”, and in the years 2028, 2038 and 2050. Then, the maps obtained with the climate predictions will be integrated into an agro-hydrological model to know the water yield, the sediment yield and the water balance of the studied area by 2050.The future land use and land cover (LULC) scenarios were created using a CA-Markov forecasting model. The results of the simulation of the LULC changes were considered satisfactory, as shown by the values obtained from the kappa indices for agreement (κstandard) = 0.73, kappa for lack of information (κno) = 0.76, and kappa for location at grid cell level (κlocation) = 0.80. Future scenarios modeled in LULC indicate a decrease in agricultural areas and wetlands, both of which can be seen as a warning of crop loss. There is, on the other hand, an increase in forest areas that could be an advantage for the biodiversity of the fauna and flora in the “9 April 1947” watershed.

Graphical Abstract

1. Introduction

Anthropogenic land use activities, both globally and locally, have significantly influenced the terrestrial ecosystem and global environmental change [1]. Over the past century, the mechanism of land use and land cover change (LULC) has greatly expanded. This is mainly due to the intensification of human-mediated processes, like agricultural development, deforestation and urban expansion [2]. The shift from natural systems to agricultural or urban environments can impede (can hamper) the sustainability of ecosystems and deteriorate their ability to deliver ecosystem services [3]. This can exacerbate land degradation and soil erosion, which are directly involved in food production and can also endanger human health and ecological security [4]. To strengthen ecosystems and limit the problems related to soil degradation, it is important to study the impacts of land use change on ecosystems using different scenarios. This will be able to help for adaptive management strategies, which are of paramount importance for the sustainable development of environmental resources [5].
In order to achieve maximum efficiency in land use policy and planning, it is necessary to make a reasonable forecast of land use demand and to simulate it in possible future scenarios [6]. Thus, many possible scenarios for the evolution of the earth system should be simulated and discussed through models (LULC) in order to facilitate strategy formulation and research on land use valuation [7]. The use of geospatial technology is an important human discovery that has progressed from prehistoric times [8,9]. The three basic categories of geospatial technology are Remote Sensing (RS), geographic information system (GIS) and global positioning system (GPS) [10,11,12]. RS is a good instrument for frequent monitoring and measuring LULC change in the natural environment, as well as the evolution of landforms through geomorphological analysis [13,14]. Similarly, it has played an important part in geography, geology, and the environment for academics and scientists [15]. The availability of free satellite data such as Landsat-4–5, Landsat-7 and Landsat-8 images has enhanced the usage of machine learning image classifiers in remote sensing [16]. Both supervised and unsupervised machine learning methods for land cover mapping/modeling are gaining popularity [17]. Several models (LULC) have been designed and applied during the last two decades to estimate and simulate the effect of land use changes on the Earth system and to study future land use scenarios at different scales and in several regions [18,19,20]. There are two types of forecasting methods: non-spatial models based on economic theories of development and econometric applications [21], and spatial models based on computational approaches such as probability modeling, agent-based modeling and cellular automata [22].
Spatial models are widely recognized and used, where the key functionality of the spatial model, which distinguishes it from non-spatial models, is the ability to explicitly demonstrate a change in land use on a map [23]. The suggested efficient alternative computing technique, cellular automata (CA), may be characterized as models of physical systems in which space and time are regarded as discrete and interactions are local [24]. CA models have been widely used in urban ecosystems, as they can successfully mimic both spatial and temporal changes and capture the complexity and unpredictability of urbanization processes as well as diverse urbanization scenarios [25]. This model’s bottom-up methodology allows it to model the overall behavior of urban expansion by considering the behavior of all urban cells that are affected by the current conditions of the center cell and nearby cells [26]. The structure of the individual model only considers the spatial data, which is why the traditional Cellular Automata (CA) is not adequate to make a realistic simulation [27]. Indeed, the CA is also a limited model in implementing driving forces for land use change, making it difficult to manage [28].
Combined modeling methodologies are thought to be better suited for simulating land use change processes [29]. On the basis of this, it is advisable to evolve and integrate the traditional CA model with a spatio-temporal model like the Markov Chain (MC) to have a better result and exceed these constraints [30]. The temporal evolution of the land use type based on the transition matrices is monitored by the MC method. This can control temporal changes in land use if combined with the CA model (CA-MC) [31], whereas spatial changes will be defined by spatial filtering of the CA model [32].
The decrease in the area of agricultural land and the drop in the quantity of water in the dam are two of the most important problems and shortcomings of the last two decades [33]. In this work we will try to understand this loss and predict the future amount of change in the study area. The combined CA-Markov model had never been used before for land-use simulations in Morocco, which makes its application to land-use forecasts a new event in the 9th April watershed. The main objective is to demonstrate effectiveness and the importance of conjugating CA and MC models, as well as their compatibility for a good control of temporal changes in land use. This is through a case study in the Mediterranean watershed 9th April 1947 located in northern Morocco. From this general objective stems a set of specific objectives which are: (i) to make forecasts of land use in the watershed; (ii) to understand the future changes in forest areas, wetlands and agricultural land in order to make possible arrangements to inhibit the problems of soil loss, the decrease in water level in the watershed, as well as deforestation; and (iii) to integrate the results obtained in an agro-hydrological model to have an idea on the erosion and the water balance in the future.

2. Materials and Methods

2.1. Study Area

The watershed “9 April 1947” is located in northern Morocco with an area of 240 Km2 (Figure 1). It is a Mediterranean watershed characterized by a sub-humid climate [34]. The average annual rainfall is 725 mm, measured at the Dar Chaoui weather station, while the average annual temperature is 18 °C. The driest months are July and August, with the highest values recorded in December and January [35]. The size and shape of the study area, along with geographic characteristics, are the primary considerations for selecting the study area.
The region is characterized by a dominance of dry, hot and violent winds (Chergui) coming from the Eastern Zone, and which occupy a preponderant place, especially during the summer season [36]. The topography is characterized by great diversity, with an altitudinal variation ranging from 21 m at the base to 1004 m at the highest point, while the average slope is 45 m/km.
In the downstream of the watershed is located the “9 April 1947” dam near the Dar Chaoui locality, with a storage capacity equal to 300 mm3. This dam is intended to supply drinking water to the Atlantic Region between Asilah and Tangier [35]. As far as the irrigation system is concerned, it is mostly present downstream of the dam.
Geologically, the watershed presents lithological formations similar to the Moroccan Western Rif. It is mainly a marls and clay facies of the Tangier unit, which easily amplified the erosive process in the region [37]. Regarding the soils of the basin, it is mainly occupied by poorly developed and complex soils [38].

2.2. Satellite Images

Satellite images for the years 1998, 2008 and 2018 are taken by Landsat 5, 7 and 8, respectively, and then integrated into the Arc-Gis 10.6.1 to perform the classifications of each LULC. Band 7 of Landsat 5, 7 or 8 images are assumed to be present as stand-alone files, in a single directory structure for any given acquisition date (Composite Bands), by using simple naming conventions [39,40]. Landsat data products are cross-calibrated in orbit with Operational Land Imager (OLI) [41].
The determination of map classes for the years 1998 and 2008 is based on the “Band Composition for Landsat 7”. On the other hand, the chart used to determine the classes for the year 2018 is that of “Band composition for Landsat 8” [42].
In this study, four classes were determined for each satellite image (Water Bodies (WATR), Bare Land (SWRN), Forest (FRST), and Agriculture (AGRL)) [43]. These classes were processed from the Band Combination of Landsat 7 and 8 charters.

2.3. LULC Modeling

2.3.1. Assessment Accuracy

The assessment of the reliability of the LULC classification was obtained by four equations [44,45]:
-
User accuracy
Au = Pii/Pi+
-
The precision of the producer
AP = Pii/P+i
-
Overall accuracy
G A = 100 i = 1 m P i i n
-
The kappa coefficient
K = i = 1 m P i i i = 1 c P i + P + i n 2 i = 1 m P i + P + i
The Equation (1) is used in the context of the CA-Markov model, which is a type of cognitive architecture. It represents the probability of an action (Au) given the current state (Pii) and the previous state (Pi).
The second Equation (2) is used to calculate probability of a certain land use type at a certain location in the model.
The overall accuracy Equation (3) in the CA-Markov model land use is used to measure the accuracy of a land use map produced by the model. It is defined as the sum of the conditional accuracy of each land use type divided by the total number of cells in the land use map.
Finally, the kappa coefficient (4) is a measure of agreement between two sets of land use classifications. It is a statistic that is used to assess the accuracy of land use classification methods, where: Au is the user’s accuracy; AP is the producer’s accuracy; GA is the overall accuracy; K is the kappa coefficient; pii is the proportion of the classified and reference class areas; and pi+ = p+i = i = 1 m Pii is the proportion of the classified and field truth class areas.

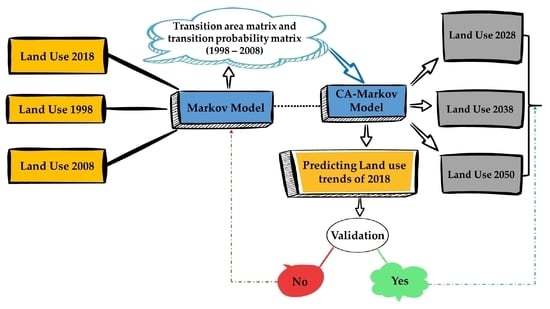
2.3.2. Predictions of Future Scenarios Using CA-Markov

CA-Markov is an open-structured spatial model that is typically used to enhance land cover simulation capability [46]. In this study, the CA-Markov model was applied to simulate and predict future land-use scenarios in the Dar Chaoui region.
The possible transitions between the LULC classes were analyzed using the change analysis tool, which can be found in the Markov model in IDRISI Selva 17.00 [47]. The Markov chain contains the ability to analyze changes that allow evaluation of gains/losses, persistence, and specific transitions using quantitative data and maps [48]. Maps for the years 1998, 2008 and 2018 were analyzed to identify past changes in LULC that have occurred over these two decades. Simulation of future LULC scenarios was applied by the CA-Markov model, which is widely used to model and simulate the dimensions and trends of LULC evolution [49]. The future scenarios of the LULC were also realized in the software IDRISI Selva 17.00 [50].
The Markov and CA-Markov models are applied in the following steps [18]:
-
Selection of LULC maps from 1998, 2008 and 2018;
-
Application of the Markov transition estimator to the 1998 and 2008 maps to compute the transition probability matrix for the change from one LULC class to the other classes in 2018;
-
Using the 2008 map and transition probability data as the basis for simulating LULC in 2018;
-
The 2018 land use map is used as a reference, to evaluate the accuracy of the simulated LULC 2018 map (model validation);
-
Simulation of future LULC scenarios using the calibrated and validated CA-Markov model (Figure 2).

3. Results

3.1. Land Use Maps Reclassification

To determine water bodies and bare land, the band combination (4 5 3) was used for Landsat 5–7, and (5 6 4) for Landsat 8. For agriculture and forestry, the combinations used are (6 5 2) and (5 4 3) for Landsat 8, and (5 4 1) and (4 3 2) for Landsat 5–7 (Figure 3a–c).
According to the land use maps of the last two decades, it can be observed that agricultural land has decreased from 42% to 27% [33], and water bodies have dropped from 7% to 4.3% since 1998 [51]. This can be explained by the data obtained from the loukkos hydraulic basin agency, wherein a significant decrease in precipitation occurs with increasing temperatures [35]. In addition, the forest land has been expanded from 26% to 37.5%. This increase in area is due to the fact that forests can withstand and grow in difficult climatic conditions and in different geographical locations [52].

3.2. Markov Transition Estimator to Simulate 2018 Land Use and Validate CA-Markov Model

This section may be divided by subheadings. It should provide a concise and precise description of the experimental results, their interpretation, as well as the experimental conclusions that can be drawn.
Table 1 represents the expected possible changes from one class to other classes. From the study’s results, it can be noted that the most important changes that will occur to have the simulated land use of the year 2018 are [17]: the probability to switch from WATR to SWRN is 0.19; from SWRN to AGRL is 0.17; from FRST to AGRL is 0.33; and from AGRL to SWRN is 0.29 (Table 1).
The results of the probability matrix are integrated as input data in the CA-Markov model to have the simulated map of 2018 (Figure 4b). This map was made to validate the model by comparing the reference 2018 land use and the simulated 2018 land use maps [21,53] (Figure 3c and Figure 4).
The validation bar obtained by the two land use maps shows a predominance of agreement content and a negligible part of the content of disagreement (Figure 4). In addition, the Kappa indices are responsible for the performance and reliability of the model to have the future scenarios closest to reality. In this case, the Kappa indices obtained by the validation are satisfactory according to criteria adopted by [54], with a Klocation of 0.80 (80%), Kn0 of 0.76 (76%) and Kstandard of 0.73 (73%) (Figure 5).
On the basis of the reference map and the simulated map of the year 2018 there is compatibility in three classes. Moreover, there is a small difference in the agriculture class with an increase of 1.5% of the area in the simulated map. However, this difference has not caused any problem in the validation of the model (Figure 3c, Figure 4 and Figure 5).

3.3. Markov Transition Estimator for the Projected 2028, 2038 and 2050 Years

The probability matrixes and transition area matrix obtained by Markov chain with the Number of projection periods of 10 for 2028, 20 for 2038 and 32 for 2050 show the following results: The AGRL class switched to FRST in the next fifty years in an increasing way with a probability of 49% in 2028, 59% in 2038 and 62% in the year 2050 (Table 2, Table 3 and Table 4; Figure A1, Figure A2 and Figure A3 in Appendix A). In contrast, the WATR class has decreased a little lower than the previous class with probability of changing to SWRN of 36%, 45% and 49% in the years 2028, 2038 and 2050, respectively (Table 2, Table 3 and Table 4; Figure A1, Figure A2 and Figure A3 in Appendix A).
In terms of area, the (WATR) and (AGRL) classes will decrease from 6.04 km2 to 3.15 km2 and from 64.70 km2 to 59.15 km2, respectively, from 2028 to 2050. However, the forest class will increase from 90.45 km2 in 2028 to 104.64 km2 in 2050 (Table 5).
The land use maps of the next three decades show an increase in the class of forests that reaches to 47.2% of the watershed area, while the water body has seriously decreased to a total area of 1.5%. Finally, bare land and agricultural land cover an area of 26.8% and 24.5%, respectively, which can be considered a slight decrease by 2050 [55] (Figure 6a–c).

4. Discussion

Because of their capacity to map the risks during the crisis on a bigger scale, RS and GIS drew a lot of attention from the government and the general public [10]. Over the last three decades, several approaches for identifying change using remotely sensed data have been developed [56,57,58]. For this reason, this study employed Landsat satellite images to give a greater knowledge of LULC changes for improved decision making and resource management. The application of a combined Cellular Automata and Markov (CA-Markov) model to Landsat satellite images has been used successfully in numerous studies to provide greater insights into Land Use and Land Cover (LULC) changes. However, northern Morocco and the April 9th watershed have not undertaken such studies, which makes this study particularly important. The LULC maps generated by this study will provide a valuable foundation for further research, allowing for thorough assessment of future land use and improved policy-making and resource management. Utilizing these future land use maps, researchers can begin to plan for the preservation of water resources, better management of agricultural areas, and other key areas of focus for the region, which includes the dam supplying the region with drinking water. According to land use maps from the previous two decades, agricultural land and aquatic bodies have declined since 1998. This is explained by data received from the loukkos hydraulic basin agency, which shows that increasing temperatures cause a considerable drop in precipitation [35] and also supports the findings by [33,51]. Furthermore, the forest land has been expanded. The combined CA-Markov model was then utilized, based on the remotely sensed maps, to forecast LULC in the future.
From a methodological standpoint, the CA-Markov model offers both simplicity and flexibility of use because several options can be chosen depending on the state of knowledge. At the same time these advantages are also limitations, as the apparent simplicity of the options often masks the complexity of the operations carried out, which are not always clear to the user who would like to have a better understanding of the consequences of the choices made in these options [15]. Socioeconomic characteristics were not included in this study for a variety of reasons. The lack of information in this region is one of the data constraints, which prevents the integration of certain features. Additionally, difficulties related to simplification and technical realization have limited some modeling solutions. These complexities prevent the representation of socio-economic factors.
The methodology used confirms the one applied by [18,45,50,59] in terms of its efficiency and performance, through which satisfactory results have been obtained. Idrisi’s CA-Markov allows for the incorporation of suitability maps that are calibrated using independent variables. Moreover, the model performed “substantially” according to [54] criteria, with the following values: standard kappa (Kstandard) = 0.73; kappa for no information (Kno) = 0.76; and kappa for grid-cell level location (Klocation) = 0.80. The current findings support previous findings [45,60] and confirm the CA-Markov model’s ability to simulate future LULC situations.
The integrated CA-MC model in this study performed very well compared to other studies that used the CA model with different types of models. Ref. [61] only applied the CA model for simulating urban land use dynamics, with model accuracy found to be 69%. In parallel, ref. [41] has employed CA-Markov for the prediction of future cropland conditions, and this time the accuracy of the model was proven by 73%. Nevertheless, some studies obtained much better accuracies, such as [33], wherein they combined the CA model with ANN algorithm and obtained a simulation accuracy of 87%.
The wider dissemination of multi-temporal remote sensing data has facilitated environmental studies. Land degradation, which includes soil erosion, desertification, deforestation, and poor agricultural practices, has been particularly beneficial [62].
In fact, the future land use maps made by the Markov and CA-Markov models showed significant results until 2050, which agree with the results of the climate scenarios in the Moroccan context [63,64,65].
Predictions indicate a significant downturn in aquatic areas and agricultural lands, confirming the hypothesis put forward in previous research regarding climate change predictions [35]. This decrease will have negative effects on each of the crop yields, and with the decrease in the amount of water in the dams, on the other hand, there is a significant increase in forests, which can be considered an important benefit for the reproduction of fauna and flora as well as for the preservation of the environment in the study area. The main reason for the decline in agricultural land and the proportion of aquatic land is due to the decrease in the rainfall percentage, as well as the high temperature in the coming years [35]. Concerning the forest lands, their expansion can be explained by the resistance of some species of trees and shrubs to drought and high temperature [52].
This research project confirms the results of other studies conducted on land use predictions in the Moroccan context [51,53,55]. In the case of the Ourika watershed located in the High Atlas, the study showed a 34% increase in carbon sequestration due to forest expansion, and a 0.75% decrease in water yield [55]. Moving to the Drâa Valley, a sub-Saharan region in southeastern Morocco at the foot of the Anti-Atlas Mountains and north of the Sahara, there is a significant loss in agricultural areas and this is due to the development of urban areas [51]. Concerning the Oum Er Rbia River that is part of the Middle Atlas Mountains, the results also show an expansion of forests and a decrease in aquatic areas [53], which is consistent with all previous studies.
In a nutshell, the future LULC scenarios allowed us to consider and to determine the optimal Best Management Practices (BMPs) arrangements to the real situation in the April 9th watershed, such as maintaining the dam with water preservation in the area and expanding the amount of agricultural and forest lands.
Authors should discuss the results and how they can be interpreted from the perspective of previous studies and of the working hypotheses. The findings and their implications should be discussed in the broadest context possible. Future research directions may also be highlighted.

5. Conclusions

Satellite image analysis is an essential element in understanding the nature, pattern, and degree of change in land use and wildlife, and subsequently in finding alternative measures to reduce environmental problems. Similarly, by applying different land use models it is easy to predict future land use by taking into account the natural and socio-economic factors that influence land use change. In this study, the changes in LULC over the last two decades (1998–2018) were analyzed with a focus on water, forest and agriculture. Accordingly, predictions were made using a fusion of two models, Markov Chain and Cellular Automaton (CA-Markov). The combined use of the Markov model and CA for modeling LULC change is likely to make the closest predictions to reality using the transition probability matrix. Furthermore, Land use forecasts by 2050 in the Dar Chaoui region (Northern of Morocco) showed the results to be feared. The future scenarios modeled in LULC indicate a decrease in agricultural areas and water resources, both of which can be considered a warning of crop loss, so it is then necessary to improve the productivity and profitability of the crops while preserving the resources. In order to achieve a sustainable balance between human activities and natural resources it is essential to implement strategies to protect and conserve water resources and agricultural areas, such as promoting efficient agricultural practices, increasing investment in the conservation and rehabilitation of degraded areas, maintaining water sources, and strengthening public policies. On the contrary, an expansion of forest areas was marked in the study area, which reflects positively on the improvement in the fauna and flora. Furthermore, these results can be used to examine the impact of increasing forest areas on biodiversity, including the effects on animal and plant species. Lastly, they could investigate how these LULC results could be used to inform sustainable land use planning and management.

Author Contributions

Conceptualization, M.B., H.B. and K.A.; methodology, M.B., H.B. and K.A.; software, M.B., H.B. and K.A.; validation, M.B., H.B., R.M., F.K. and K.A.; formal analysis, M.B., H.B., R.M., F.K. and K.A.; investigation, M.B., H.B., R.M., F.K. and K.A.; resources, M.B., I.B. and A.O.; data curation, M.B., H.B. and K.A.; writing—original draft preparation, M.B., H.B. and K.A.; writing—review and editing, M.B., H.B., I.B., A.O., R.M., F.K. and K.A.; visualization, M.B., H.B. and K.A.; supervision, M.B., H.B., E.K.C., A.B. and K.A.; funding acquisition, E.K.C. and A.B. All authors have read and agreed to the published version of the manuscript.

Funding

This research received no external funding.

Data Availability Statement

We are available for any data or material concerning this article.

Acknowledgments

This work would not have been possible without the support of the professors and doctors who contributed to this paper, in all institutions such as the Faculty of Sciences and Techniques, the University Mohammed 6 Polytechnics and the National Institute of the Agronomic Research of Rabat. El Khalil Cherif and Alexandre Bernardino were supported by FCT with the LARSyS—FCT Project UIDB/50009/2020.

Conflicts of Interest

The authors declare no conflict of interest.

Appendix A

Figure A1. (a) Waterbody “land suitability” for the year 2028; (b) Bareland “land suitability” for the year 2028; (c) Forest “land suitability” for the year 2028; (d) Agricultural “land suitability” for the year 2028.
Remotesensing 15 01162 g0a1
Figure A2. (a) Waterbody “land suitability” for the year 2038; (b) Bareland “land suitability” for the year 2038; (c) Forest “land suitability” for the year 2038; (d) Agricultural “land suitability” for the year 2038.
Remotesensing 15 01162 g0a2
Figure A3. (a) Waterbody “land suitability” for the year 2050; (b) Bareland “land suitability” for the year 2050; (c) Forest “land suitability” for the year 2050; (d) Agricultural “land suitability” for the year 2050.
Remotesensing 15 01162 g0a3

References

  1. Ramankutty, N.; Graumlich, L.; Achard, F.; Alves, D.; Chhabra, A.; DeFries, R.S.; Foley, J.A.; Geist, H.; Houghton, R.A.; Goldewijk, K.K.; et al. Global Land-Cover Change: Recent Progress, Remaining Challenges. In Land-Use and Land-Cover Change; Lambin, E.F., Geist, H., Eds.; Global Change—The IGBP Series; Springer Berlin Heidelberg: Berlin/Heidelberg, Germany, 2006; pp. 9–39. ISBN 978-3-540-32201-6. [Google Scholar]
  2. Rivas-Tabares, D.; Tarquis, A.M.; De Miguel, Á.; Gobin, A.; Willaarts, B. Enhancing LULC Scenarios Impact Assessment in Hydrological Dynamics Using Participatory Mapping Protocols in Semiarid Regions. Sci. Total Environ. 2022, 803, 149906. [Google Scholar] [CrossRef] [PubMed]
  3. Sun, Q.; Qi, W.; Yu, X. Impacts of Land Use Change on Ecosystem Services in the Intensive Agricultural Area of North China Based on Multi-Scenario Analysis. Alex. Eng. J. 2021, 60, 1703–1716. [Google Scholar] [CrossRef]
  4. Fu, Q.; Li, B.; Hou, Y.; Bi, X.; Zhang, X. Effects of Land Use and Climate Change on Ecosystem Services in Central Asia’s Arid Regions: A Case Study in Altay Prefecture, China. Sci. Total Environ. 2017, 607–608, 633–646. [Google Scholar] [CrossRef] [PubMed]
  5. Mingkuan, W.; Hongwei, M. The Impact of Spatial Heterogeneity on Ecosystem Service Value in a Case Study in Liuyang River Basin, China. J. Resour. Ecol. 2018, 9, 209–217. [Google Scholar] [CrossRef]
  6. Nourqolipour, R.; Mohamed Shariff, A.R.B.; Balasundram, S.K.; Ahmad, N.B.; Sood, A.M.; Buyong, T.; Amiri, F. A GIS-Based Model to Analyze the Spatial and Temporal Development of Oil Palm Land Use in Kuala Langat District, Malaysia. Enviorn. Earth Sci. 2015, 73, 1687–1700. [Google Scholar] [CrossRef] [Green Version]
  7. Liu, X.; Liang, X.; Li, X.; Xu, X.; Ou, J.; Chen, Y.; Li, S.; Wang, S.; Pei, F. A Future Land Use Simulation Model (FLUS) for Simulating Multiple Land Use Scenarios by Coupling Human and Natural Effects. Landsc. Urban Plan. 2017, 168, 94–116. [Google Scholar] [CrossRef]
  8. Hussain, S.; Lu, L.; Mubeen, M.; Nasim, W.; Karuppannan, S.; Fahad, S.; Tariq, A.; Mousa, B.G.; Mumtaz, F.; Aslam, M. Spatiotemporal Variation in Land Use Land Cover in the Response to Local Climate Change Using Multispectral Remote Sensing Data. Land 2022, 11, 595. [Google Scholar] [CrossRef]
  9. Revuelta-Acosta, J.D.; Guerrero-Luis, E.S.; Terrazas-Rodriguez, J.E.; Gomez-Rodriguez, C.; Alcalá Perea, G. Application of Remote Sensing Tools to Assess the Land Use and Land Cover Change in Coatzacoalcos, Veracruz, Mexico. Appl. Sci. 2022, 12, 1882. [Google Scholar] [CrossRef]
  10. Sundar, P.K.S.; Deka, P.C. Spatio-Temporal Classification and Prediction of Land Use and Land Cover Change for the Vembanad Lake System, Kerala—A Machine Learning Approach. Environ. Sci. Pollut. Res. 2021, 29, 86220–86236. [Google Scholar] [CrossRef]
  11. Abebe, G.; Getachew, D.; Ewunetu, A. Analysing Land Use/Land Cover Changes and Its Dynamics Using Remote Sensing and GIS in Gubalafito District, Northeastern Ethiopia. SN Appl. Sci. 2022, 4, 30. [Google Scholar] [CrossRef]
  12. Rehman, A.; Qin, J.; Shafi, S.; Khan, M.S.; Ullah, S.; Ahmad, K.; Rehman, N.U.; Faheem, M. Modelling of Land Use/Cover and LST Variations by Using GIS and Remote Sensing: A Case Study of the Northern Pakhtunkhwa Mountainous Region, Pakistan. Sensors 2022, 22, 4965. [Google Scholar] [CrossRef]
  13. Seyam, M.M.H.; Haque, M.R.; Rahman, M.M. Identifying the Land Use Land Cover (LULC) Changes Using Remote Sensing and GIS Approach: A Case Study at Bhaluka in Mymensingh, Bangladesh. Case Stud. Chem. Environ. Eng. 2023, 7, 100293. [Google Scholar] [CrossRef]
  14. Alshari, E.A.; Gawali, B.W. Development of Classification System for LULC Using Remote Sensing and GIS. Glob. Transit. Proc. 2021, 2, 8–17. [Google Scholar] [CrossRef]
  15. Ghosh, P.; Mukhopadhyay, A.; Chanda, A.; Mondal, P.; Akhand, A.; Mukherjee, S.; Nayak, S.K.; Ghosh, S.; Mitra, D.; Ghosh, T.; et al. Application of Cellular Automata and Markov-Chain Model in Geospatial Environmental Modeling—A Review. Remote Sens. Appl. Soc. Environ. 2017, 5, 64–77. [Google Scholar] [CrossRef]
  16. Jamali, A. Land Use Land Cover Modeling Using Optimized Machine Learning Classifiers: A Case Study of Shiraz, Iran. Model. Earth Syst. Environ. 2021, 7, 1539–1550. [Google Scholar] [CrossRef]
  17. Wang, M.; Wander, M.; Mueller, S.; Martin, N.; Dunn, J.B. Evaluation of Survey and Remote Sensing Data Products Used to Estimate Land Use Change in the United States: Evolving Issues and Emerging Opportunities. Environ. Sci. Policy 2022, 129, 68–78. [Google Scholar] [CrossRef]
  18. Aburas, M.M.; Ho, Y.M.; Ramli, M.F.; Ash’aari, Z.H. Improving the Capability of an Integrated CA-Markov Model to Simulate Spatio-Temporal Urban Growth Trends Using an Analytical Hierarchy Process and Frequency Ratio. Int. J. Appl. Earth Obs. Geoinf. 2017, 59, 65–78. [Google Scholar] [CrossRef]
  19. Gollnow, F.; Göpel, J.; de Barros Viana Hissa, L.; Schaldach, R.; Lakes, T. Scenarios of Land-Use Change in a Deforestation Corridor in the Brazilian Amazon: Combining Two Scales of Analysis. Reg. Environ. Chang. 2018, 18, 143–159. [Google Scholar] [CrossRef] [Green Version]
  20. Firozjaei, M.K.; Sedighi, A.; Argany, M.; Jelokhani-Niaraki, M.; Arsanjani, J.J. A Geographical Direction-Based Approach for Capturing the Local Variation of Urban Expansion in the Application of CA-Markov Model. Cities 2019, 93, 120–135. [Google Scholar] [CrossRef]
  21. Aburas, M.M.; Ahamad, M.S.S.; Omar, N.Q. Spatio-Temporal Simulation and Prediction of Land-Use Change Using Conventional and Machine Learning Models: A Review. Environ. Monit. Assess. 2019, 191, 205. [Google Scholar] [CrossRef]
  22. Briassoulis, H. Analysis of Land Use Change: Theoretical and Modeling Approaches, 2nd ed.; Loveridge, S., Jackson, R., Eds.; WVU Research Repository; University of the Aegean: Lesvos, Greece, 2020; p. 248. [Google Scholar]
  23. Yang, Y.; Bao, W.; Liu, Y. Scenario Simulation of Land System Change in the Beijing-Tianjin-Hebei Region. Land Use Policy 2020, 96, 104677. [Google Scholar] [CrossRef]
  24. Tsompanas, M.-A.; Fyrigos, I.-A.; Ntinas, V.; Adamatzky, A.; Sirakoulis, G.C. Cellular Automata Implementation of Oregonator Simulating Light-Sensitive Belousov–Zhabotinsky Medium. Nonlinear Dyn. 2021, 104, 4103–4115. [Google Scholar] [CrossRef]
  25. Santé, I.; García, A.M.; Miranda, D.; Crecente, R. Cellular Automata Models for the Simulation of Real-World Urban Processes: A Review and Analysis. Landsc. Urban Plan. 2010, 96, 108–122. [Google Scholar] [CrossRef]
  26. Falah, N.; Karimi, A.; Harandi, A.T. Urban Growth Modeling Using Cellular Automata Model and AHP (Case Study: Qazvin City). Model. Earth Syst. Environ. 2020, 6, 235–248. [Google Scholar] [CrossRef] [Green Version]
  27. Jokar Arsanjani, J.; Helbich, M.; Kainz, W.; Darvishi Boloorani, A. Integration of Logistic Regression, Markov Chain and Cellular Automata Models to Simulate Urban Expansion. Int. J. Appl. Earth Obs. Geoinf. 2013, 21, 265–275. [Google Scholar] [CrossRef]
  28. Mohammady, S.; Delavar, M.R.; Pahlavani, P. URBAN GROWTH MODELING USING AN ARTIFICIAL NEURAL NETWORK A CASE STUDY OF SANANDAJ CITY, IRAN. Int. Arch. Photogramm. Remote Sens. Spat. Inf. Sci. 2014, XL-2/W3, 203–208. [Google Scholar] [CrossRef] [Green Version]
  29. Karimi, H.; Jafarnezhad, J.; Khaledi, J.; Ahmadi, P. Monitoring and Prediction of Land Use/Land Cover Changes Using CA-Markov Model: A Case Study of Ravansar County in Iran. Arab. J. Geosci. 2018, 11, 592. [Google Scholar] [CrossRef]
  30. Gharaibeh, A.; Shaamala, A.; Obeidat, R.; Al-Kofahi, S. Improving Land-Use Change Modeling by Integrating ANN with Cellular Automata-Markov Chain Model. Heliyon 2020, 6, e05092. [Google Scholar] [CrossRef]
  31. Guan, D.; Li, H.; Inohae, T.; Su, W.; Nagaie, T.; Hokao, K. Modeling Urban Land Use Change by the Integration of Cellular Automaton and Markov Model. Ecol. Model. 2011, 222, 3761–3772. [Google Scholar] [CrossRef]
  32. Nouri, J.; Gharagozlou, A.; Arjmandi, R.; Faryadi, S.; Adl, M. Predicting Urban Land Use Changes Using a CA–Markov Model. Arab. J. Sci. Eng. 2014, 39, 5565–5573. [Google Scholar] [CrossRef]
  33. Kafy, A.-A.; Dey, N.N.; Al Rakib, A.; Rahaman, Z.A.; Nasher, N.M.R.; Bhatt, A. Modeling the Relationship between Land Use/Land Cover and Land Surface Temperature in Dhaka, Bangladesh Using CA-ANN Algorithm. Environ. Chall. 2021, 4, 100190. [Google Scholar] [CrossRef]
  34. Briak, H.; Moussadek, R.; Aboumaria, K.; Mrabet, R. Assessing Sediment Yield in Kalaya Gauged Watershed (Northern Morocco) Using GIS and SWAT Model. Int. Soil Water Conserv. Res. 2016, 4, 177–185. [Google Scholar] [CrossRef] [Green Version]
  35. Beroho, M.; Briak, H.; El Halimi, R.; Ouallali, A.; Boulahfa, I.; Mrabet, R.; Kebede, F.; Aboumaria, K. Analysis and Prediction of Climate Forecasts in Northern Morocco: Application of Multilevel Linear Mixed Effects Models Using R Software. Heliyon 2020, 6, e05094. [Google Scholar] [CrossRef]
  36. Briak, H.; Mrabet, R.; Moussadek, R.; Aboumaria, K. Use of a Calibrated SWAT Model to Evaluate the Effects of Agricultural BMPs on Sediments of the Kalaya River Basin (North of Morocco). Int. Soil Water Conserv. Res. 2019, 7, 176–183. [Google Scholar] [CrossRef]
  37. Ouallali, A.; Briak, H.; Aassoumi, H.; Beroho, M.; Bouhsane, N.; Moukhchane, M. Hydrological Foretelling Uncertainty Evaluation of Water Balance Components and Sediments Yield Using a Multi-Variable Optimization Approach in an External Rif’s Catchment. Morocco. Alex. Eng. J. 2020, 59, 775–789. [Google Scholar] [CrossRef]
  38. Inypsa Soil Survey at 1/100,000 (Edition at 1/50,000). Integrated Agricultural Development Project of Tangier-Tetouan, Tetouan Sector. Inypsa -Morocco, SA. and Provin. Direct. Agri. Tetouan, Map, 1p. 1987. Available online: https://horizon.documentation.ird.fr/exl-doc/pleins_textes/divers12-11/010052362.pdf (accessed on 13 February 2023).
  39. Li, X.; Feng, R.; Guan, X.; Shen, H.; Zhang, L. Remote Sensing Image Mosaicking: Achievements and Challenges. IEEE Geosci. Remote Sens. Mag. 2019, 7, 8–22. [Google Scholar] [CrossRef]
  40. Zhou, T.; Geng, Y.; Ji, C.; Xu, X.; Wang, H.; Pan, J.; Bumberger, J.; Haase, D.; Lausch, A. Prediction of Soil Organic Carbon and the C:N Ratio on a National Scale Using Machine Learning and Satellite Data: A Comparison between Sentinel-2, Sentinel-3 and Landsat-8 Images. Sci. Total Environ. 2021, 755, 142661. [Google Scholar] [CrossRef]
  41. Ahmed, K.R.; Akter, S. Analysis of Landcover Change in Southwest Bengal Delta Due to Floods by NDVI, NDWI and K-Means Cluster with Landsat Multi-Spectral Surface Reflectance Satellite Data. Remote Sens. Appl. Soc. Environ. 2017, 8, 168–181. [Google Scholar] [CrossRef]
  42. Mueller-Warrant, G. Multistep Block Mapping on Principal Component Uniformity Repairs Landsat 7 Defects. Int. J. Appl. Earth Obs. Geoinf. 2019, 79, 12–23. [Google Scholar] [CrossRef]
  43. Cooper, S.; Okujeni, A.; Pflugmacher, D.; van der Linden, S.; Hostert, P. Combining Simulated Hyperspectral EnMAP and Landsat Time Series for Forest Aboveground Biomass Mapping. Int. J. Appl. Earth Obs. Geoinf. 2021, 98, 102307. [Google Scholar] [CrossRef]
  44. Oliphant, A.J.; Thenkabail, P.S.; Teluguntla, P.; Xiong, J.; Gumma, M.K.; Congalton, R.G.; Yadav, K. Mapping Cropland Extent of Southeast and Northeast Asia Using Multi-Year Time-Series Landsat 30-m Data Using a Random Forest Classifier on the Google Earth Engine Cloud. Int. J. Appl. Earth Obs. Geoinf. 2019, 81, 110–124. [Google Scholar] [CrossRef]
  45. Da Cunha, E.R.; Santos, C.A.G.; da Silva, R.M.; Bacani, V.M.; Pott, A. Future Scenarios Based on a CA-Markov Land Use and Land Cover Simulation Model for a Tropical Humid Basin in the Cerrado/Atlantic Forest Ecotone of Brazil. Land Use Policy 2021, 101, 105141. [Google Scholar] [CrossRef]
  46. Aburas, M.M.; Ho, Y.M.; Ramli, M.F.; Ash’aari, Z.H. The Simulation and Prediction of Spatio-Temporal Urban Growth Trends Using Cellular Automata Models: A Review. Int. J. Appl. Earth Obs. Geoinf. 2016, 52, 380–389. [Google Scholar] [CrossRef]
  47. Eastman, J.R. IDRISI Selva; Clark University: Worcester, MA, USA, 2012; Available online: http://uhulag.mendelu.cz/files/pagesdata/eng/gis/idrisi_selva_tutorial.pdf (accessed on 13 February 2023).
  48. Kura, A.L.; Beyene, D.L. Cellular Automata Markov Chain Model Based Deforestation Modelling in the Pastoral and Agro-Pastoral Areas of Southern Ethiopia. Remote Sens. Appl. Soc. Environ. 2020, 18, 100321. [Google Scholar] [CrossRef]
  49. De Oliveira Barros, K.; Alvares Soares Ribeiro, C.A.; Marcatti, G.E.; Lorenzon, A.S.; Martins de Castro, N.L.; Domingues, G.F.; Romário de Carvalho, J.; Rosa dos Santos, A. Markov Chains and Cellular Automata to Predict Environments Subject to Desertification. J. Environ. Manag. 2018, 225, 160–167. [Google Scholar] [CrossRef]
  50. Varga, O.G.; Pontius, R.G.; Singh, S.K.; Szabó, S. Intensity Analysis and the Figure of Merit’s Components for Assessment of a Cellular Automata—Markov Simulation Model. Ecol. Indic. 2019, 101, 933–942. [Google Scholar] [CrossRef]
  51. Sfa, F.E.; Nemiche, M.; Rayd, H. A Generic Macroscopic Cellular Automata Model for Land Use Change: The Case of the Drâa Valley. Ecol. Complex. 2020, 43, 100851. [Google Scholar] [CrossRef]
  52. Vernon, M.J.; Sherriff, R.L.; van Mantgem, P.; Kane, J.M. Thinning, Tree-Growth, and Resistance to Multi-Year Drought in a Mixed-Conifer Forest of Northern California. For. Ecol. Manag. 2018, 422, 190–198. [Google Scholar] [CrossRef]
  53. Jazouli, A.E.; Barakat, A.; Khellouk, R.; Rais, J.; Baghdadi, M.E. Remote Sensing and GIS Techniques for Prediction of Land Use Land Cover Change Effects on Soil Erosion in the High Basin of the Oum Er Rbia River (Morocco). Remote Sens. Appl. Soc. Environ. 2019, 13, 361–374. [Google Scholar] [CrossRef]
  54. Landis, J.R.; Koch, G.G. The Measurement of Observer Agreement for Categorical Data. Biometrics 1977, 33, 159. [Google Scholar] [CrossRef] [Green Version]
  55. Kusi, K.K.; Khattabi, A.; Mhammdi, N.; Lahssini, S. Prospective Evaluation of the Impact of Land Use Change on Ecosystem Services in the Ourika Watershed, Morocco. Land Use Policy 2020, 97, 104796. [Google Scholar] [CrossRef]
  56. Serasinghe Pathiranage, I.S.; Kantakumar, L.N.; Sundaramoorthy, S. Remote Sensing Data and SLEUTH Urban Growth Model: As Decision Support Tools for Urban Planning. Chin. Geogr. Sci. 2018, 28, 274–286. [Google Scholar] [CrossRef] [Green Version]
  57. Huang, S.; Tang, L.; Hupy, J.P.; Wang, Y.; Shao, G. A Commentary Review on the Use of Normalized Difference Vegetation Index (NDVI) in the Era of Popular Remote Sensing. J. For. Res. 2021, 32, 1–6. [Google Scholar] [CrossRef]
  58. Saxena, A.; Jat, M.K.; Clarke, K.C. Development of SLEUTH-Density for the Simulation of Built-up Land Density. Comput. Environ. Urban Syst. 2021, 86, 101586. [Google Scholar] [CrossRef]
  59. Saadani, S.; Laajaj, R.; Maanan, M.; Rhinane, H.; Aaroud, A. Simulating Spatial–Temporal Urban Growth of a Moroccan Metropolitan Using CA–Markov Model. Spat. Inf. Res. 2020, 28, 609–621. [Google Scholar] [CrossRef]
  60. Palmate, S.S.; Pandey, A.; Mishra, S.K. Modelling Spatiotemporal Land Dynamics for a Trans-Boundary River Basin Using Integrated Cellular Automata and Markov Chain Approach. Appl. Geogr. 2017, 82, 11–23. [Google Scholar] [CrossRef]
  61. White, R.; Engelen, G.; Uljee, I. The Use of Constrained Cellular Automata for High-Resolution Modelling of Urban Land-Use Dynamics. Environ. Plann. B 1997, 24, 323–343. [Google Scholar] [CrossRef]
  62. Mwaniki, M.W.; Agutu, N.O.; Mbaka, J.G.; Ngigi, T.G.; Waithaka, E.H. Landslide Scar/Soil Erodibility Mapping Using Landsat TM/ETM+ Bands 7 and 3 Normalised Difference Index: A Case Study of Central Region of Kenya. Appl. Geogr. 2015, 64, 108–120. [Google Scholar] [CrossRef] [Green Version]
  63. Hirich, A.; Fatnassi, H.; Ragab, R.; Choukr-Allah, R. Prediction of Climate Change Impact on Corn Grown in the South of Morocco Using the Saltmed Model: Prediction of Climate Change Impact on Corn. Irrig. Drain. 2016, 65, 9–18. [Google Scholar] [CrossRef]
  64. Ouhamdouch, S.; Bahir, M. Climate Change Impact on Future Rainfall and Temperature in Semi-Arid Areas (Essaouira Basin, Morocco). Environ. Process. 2017, 4, 975–990. [Google Scholar] [CrossRef]
  65. Brouziyne, Y.; Abouabdillah, A.; Hirich, A.; Bouabid, R.; Zaaboul, R.; Benaabidate, L. Modeling Sustainable Adaptation Strategies toward a Climate-Smart Agriculture in a Mediterranean Watershed under Projected Climate Change Scenarios. Agric. Syst. 2018, 162, 154–163. [Google Scholar] [CrossRef]
Figure 1. Geographic location of 9th April Watershed, Northern Morocco.
Remotesensing 15 01162 g001
Figure 2. Methodological flowchart applied in the present study.
Remotesensing 15 01162 g002
Figure 3. (a) Land use of 1998; (b) Land use of 2008; (c) Land use of 2018.
Remotesensing 15 01162 g003
Figure 4. Simulated 2018 land use.
Remotesensing 15 01162 g004
Figure 5. Validation of CA-Markov model.
Remotesensing 15 01162 g005
Figure 6. (a) 2028 projected land use; (b) 2038 projected land use; (c) 2050 projected land use.
Remotesensing 15 01162 g006
Table 1. Transition probabilities matrix for the year 2018.
WATRSWRNFRSTAGRL
WATR0.80860.19140.00000.0000
SWRN0.00050.72930.09750.1727
FRST0.00000.03370.63220.3341
AGRL0.00000.29430.17370.5320
Table 2. Transition probabilities matrix for the year 2028.
WATRSWRNFRSTAGRL
WATR0.63410.36590.00000.0000
SWRN0.00000.65060.07030.2791
FRST0.00000.06860.67470.2567
AGRL0.00000.09510.49540.4095
Table 3. Transition probabilities matrix for the year 2038.
WATRSWRNFRSTAGRL
WATR0.47310.45610.01420.0566
SWRN0.00000.51300.19050.2965
FRST0.00000.11030.59740.2923
AGRL0.00000.13160.59770.2707
Table 4. Transition probabilities matrix for the year 2050.
WATRSWRNFRSTAGRL
WATR0.32900.49550.05840.1170
SWRN0.00000.39600.31340.2906
FRST0.00000.14880.54930.3019
AGRL0.00000.15710.62370.2192
Table 5. Land use class areas from 2028 to 2050.
Areas in Km2
YearsWATRSWRNFRSTAGRL
20286.0459.5590.4564.70
20384.5056.8398.3361.09
20503.1553.83104.6459.15
Disclaimer/Publisher’s Note: The statements, opinions and data contained in all publications are solely those of the individual author(s) and contributor(s) and not of MDPI and/or the editor(s). MDPI and/or the editor(s) disclaim responsibility for any injury to people or property resulting from any ideas, methods, instructions or products referred to in the content.

