Abstract
The science and application of the Earth observation system are receiving growing traction and wider application, and the scope is becoming wider and better owing to the availability of the higher resolution of satellite remote sensing products. A water quality monitoring model was developed using Sentinel-2 satellite remote sensing data set to investigate the spatiotemporal dynamics of water quality indicators at Koka Reservoir. L1C images were processed with an Atmospheric correction processor ACOLITE. The months from June 2021 to May 2022 and the years 2017 to 2022 were used for the temporal analyses. Algorithms were developed by using regression analysis and developing empirical models by correlating satellite reflectance data with in situ Chlorophyll-a (Chl-a), turbidity (TU), and Total suspended matter (TSS) measurements. All of the analyzed parameters have determination coefficients (R2) greater than 0.67, indicating that they can be turned into predictive models. R2 for the developed algorithms were 0.91, 0.92, and 0.67, indicating that good correlations have been found between field-based and estimated Chl-a, TU, and TSS, respectively. Accordingly, the mean monthly Chl-a, TU, and TSS levels have ranged from (59.69 to 144.25 g/L), (79.67 to 115.39 NTU), and (38.46 to 368.97 mg/L), respectively. The annual mean Chl-a, TU, and TSS vary from (52.86–96.19 µg/L), (71.04–83 NTU), and (36.58–159.26 mg/L), respectively, showing that the reservoir has been continuously polluted over the last seven years. The spatial study found that the distributions of Chl-a, TU, and TSS were heterogeneous, with Chl-a being greater in the south and southwest, and TU and TSS being higher on the western shore of the reservoir. In conclusion, these results show that there are spatial as well as temporal variations on water quality parameters. The proposed algorithms are capable of detecting optically active water quality indicators and can be applied in similar environmental situations.
1. Introduction
Water security and the sustainable management of water resources are critical; responsible policies that protect ecological and economic health are needed [1]. The United Nations has designated the provision of clean water and sanitation as one of the Sustainable Development Goals (SDGs), recognizing the importance of water security in global development (SDG 6) [2]. To achieve the SDGs, the integrated management of water resources has become the scientific paradigm. Water resource management requires the continuous monitoring of water quality, availability, and vulnerabilities over time and space [1]. Information is a necessary prerequisite if target 6.3, to improve water quality, is to be accomplished by 2030. The proportion of water bodies with good ambient water quality is monitored by SDG indicator 6.3.2 [3]. At present in Ethiopia, not all urban and rural areas have access to clean water. In most towns, rivers provide the main source of water for personal and household consumption as well as for any other activities. However, effluents from some industries are discharged into these rivers [4].
The two biggest threats to environmental water quality worldwide are pollution from agriculture and untreated wastewater, which release excess nutrients into rivers, lakes, and aquifers and impair ecosystem function [3]. Due to increased urbanization, agricultural intensification [5], and industrialization [6], Ethiopia’s water quality is deteriorating at an alarming rate, and freshwater contamination is a major problem [6,7].
Nutrient loadings affect water quality throughout the world and have resulted in the eutrophication of many freshwater lakes [8,9,10]. In the Koka reservoir, there was a regular occurrence of blue–green algal bloom during the high-temperature period [6]. The Mojo and the Akaki Rivers are heavily contaminated by anthropogenic influences from upstream to downstream and are deteriorating the Koka reservoir’s water quality [7], particularly affecting the reservoir’s aquatic life. The causes are the specifically indiscriminate dumping of refuse into the river and the indiscriminate dumping of industrial wastes [11].
Fixed-site hydrological monitoring, in situ reconnaissance investigations, physical models, numerical simulation, remote sensing (RS), and other methods are useful to monitor and understand concentrations of water quality parameters (WQPs) and to assess spatial and temporal fluctuations [12]. In situ monitoring involves water sampling and laboratory analysis, which can be time-consuming and resource intensive [13,14], especially when sampling across large water bodies and monitoring on a regular basis [15,16], both also require highly specialized technical skills [17]. With the emerging high resolution Earth Observation datasets, monitoring water quality parameters using satellite imagery can effectively reduce the aforementioned costs while providing the advantages of wide coverage [18,19], spatially distributed estimates with a higher temporal frequency [19,20], traceable history [19], and access to inaccessible water bodies [21]. Furthermore, the possibility to compose time series from remotely sensed historical data allows the evaluation of water quality variations over time [16], which can potentially support monitoring and management of pollution levels in the water bodies [14].
Studies on physico–chemical and biological characteristics [6], speciation of specific trace elements [22], limnological observations [23,24], and spatiotemporal dynamics of phytoplankton have previously been conducted in the Koka reservoir [25]. However, the data collected lacks a spatiotemporal representation of the reservoir’s water extent and only covers a very narrow time span. Furthermore, there are only a few scientific data concerning the pollution level and the threats posed to this reservoir [24]. There is no monitoring system and no regular water quality observations [5]. There is also a lack of effective tools that allow the assessment of the spatial and temporal water quality status of reservoirs and lakes in Ethiopia [5]. There has not been any prior remote sensing-based research undertaken in the study site specifically or indeed in the country as a whole.
In this study, we address this data scarcity gap by applying an RS-based water quality assessment. The objectives of this study are: (1) to evaluate the applications of Sentinel-2 imagery for water security, water quality assessment, and to map the spatiotemporal variations of chlorophyll-a (Chl-a), Turbidity (TU), and Total Suspended Solid (TSS) of the Koka reservoir; (2) to develop an empirical-based regression model that can be adopted as a future application as a water quality monitoring tool for sustainable water management in other inland lakes and reservoirs in Ethiopia, as well as in other data-scarce areas.
Related Work
Since the advent of satellite technology about 50 years ago, remote sensing methods have been used to measure the quality of inland waters [26,27]. In the last few decades, hundreds of RS publications have proposed solutions to overcome the challenges previously described and accurately quantify the WQPs [27]. Sentinel-2 multi-spectral imager (S2A-MSI) has shown some intriguing results when used for WQ analysis. For example, [28] investigated the potential applicability of S2A for estimating Chl-a concentrations in Lake Chad, which represented the concentrations in their study area. In [29], the authors’ findings suggested that empirical models based on optical properties involving water constituents have strong potential to estimate Chl-a using multispectral data in northeastern Brazil. Chl-a was retrieved from S2A-MSI in Estonian lakes, and [16] came to the conclusion that the sensor could be used for WQ monitoring parameters from small areas. Remote sensing-based alternatives to traditional techniques have recently found popularity because they may be more practical and cost-effective. For example, semi-analytical modeling techniques have been utilized to accurately and successfully forecast Chl-a concentrations in Brazil from S2A-MSI [30]. In [31], the authors concluded that Chl-a and TU can be estimated through remote sensing technology using multispectral S2A satellite images. [32] estimated Chl-a and TSS, and their assessment of the machine learning systems and S2A spectral images showed the robustness of the method for different types of water bodies. Despite the numerous applications for S2A images, there are some limitations such as cloud cover, which, particularly during rainy seasons, frequently obscures the view of the area, making it hard to use satellite imagery for monitoring water quality.
Models that control the relationship between optical qualities of a water body and its concentration of optically active water quality constituents are commonly referred to as bio-optical algorithms. Among various algorithms for estimating Chl-a, algorithms based on the relationship between Chl-a and reflectance at the “red edge (RE)” of the visible spectrum have shown a strong correlation between Chl-a and the difference of reflectance between NIR and red regions [33]. These regions correspond to low and high absorption ranges of Chl-a, even in waters with a high presence of suspended sediment loads and colored dissolved organic matter (CDOM) [33,34].
Examples of band ratios and band combinations from previous studies applied to Sentinel-2 and/or Landsat imagery for modeling Chl-a, TU, and TSS are listed in Table 1. As indicated in Table 1, visible and vegetation red edge (VRE) bands are the predominant bands that most studies employed for chlorophyll-a TU and TSS estimation of surface water quality analysis.

Table 1.
Bands, band combinations, and band ratios applied to Sentinel-2 and/or Landsat imagery in previous studies for the development of water quality models. SWIR—Short wave infrared.
For low biomass, oligotrophic to mesotrophic water bodies, the Chl-a spectrum is characterized by a sun-induced fluorescence peak around 680 nm [48,49]. For high biomass, eutrophic to water bodies, the florescence signal is masked by absorption features and backscatter peaks centered at 665 nm and 710 nm, respectively [49]. The ratio between these two wavelengths has been used to accurately estimate Chl-a concentration in numerous studies [50]. Beyond basic constituent retrieval, research focusing on chlorophyll includes the detection of harmful cyanobacteria [26]. The height of the reflectance peak between 700 and 720 nm has been used for estimating the Chl-a concentration in lake waters for more than two decades [51,52]. These reflectance peaks have been used in many studies by researchers [16,28,29,30,35,36].
There are a large number of studies (e.g., Table 1), where all the bands of the entire visible wavelength region are analyzed either individually or in combination for turbidity estimation. The literature suggests that even a single band, if chosen appropriately, can provide a robust estimate of turbidity [53]. Studies also mentioned the use of red and NIR together for better turbidity assessment [12].
Previous studies indicate that empirical models that estimate TSS as a function of RS reflectance (Rrs) in the visible and near-infrared (NIR) bands perform well in single-band adjusted linear regressions and with the NIR and Red bands ratio [54,55].
2. Materials and Methods
2.1. Study Site
The Koka reservoir is located (08°26′N; 39°10′E) at an altitude of about 1588 m above sea level (masl) at the dam outlet, 1625 masl in the north, 1882 masl in the east, 1965 masl in the south, and 1620 masl in the west; it is 90 km southeast of the capital city, Addis Ababa, Ethiopia. The reservoir covers a total area of 90 km2 at the end of the dry season (June). This expands to about 152 km2 just after the rainy season (October). Other than the Awash River, other sources of water to the reservoir are the Mojo and Akaki Rivers, as seen in Figure 1a. The Koka dam is 458 m long and rises to a maximum of 47 m in height. The storage capacity of the reservoir was 1850 million m3 when the dam was constructed in 1961 [22], but now it has been reduced by 35% due to sedimentation. The dam has also become useful to regulate high flows during the flood season, to supply water for the downstream irrigated land, to the fishing industry (with some 625 tons of fish landed each year [56]), for recreation [24], as well as to supply water for downstream towns and villages from which they generate electricity, although this was not originally planned for [56]. There is a variety of wildlife and birds around the reservoir [24], which makes it an important biodiversity ecosystem.
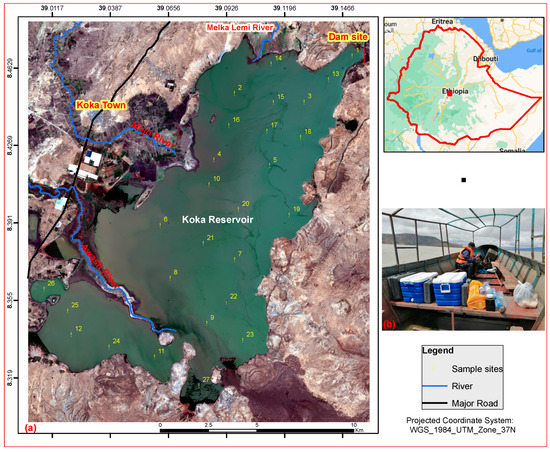
Figure 1.
(a) Overview of the Koka reservoir with the 27 sampling locations, superimposed over a Sentinel-2 image retrieved on 20 March 2017, as surveyed with a handheld GPS receiver on a boat seen in (b).
In Ethiopia, there are three major seasons, particularly, the Kiremt (June–September), Bega (October–January), and Belg (February–May); inter-annual rainfall variability in Kiremt and Belg can lead to droughts and flooding in the basin where the reservoir is found. The basin has an annual average rainfall of 832 mm. The rainfall in the study area is unimodal with main rainfall from June to September and low rainfall from February to May [57,58]. Rainfall during the Belg season is highly variable in time and space and high maximum temperature values are common [59]. This basin has a mean annual temperature of 27.18 °C. The mean minimum and mean maximum temperature are 25.87 and 28.98 °C, respectively [60].
2.2. Methodology
The methodological approach used in this study is shown in Figure 2 and consists of four main stages of analysis: (1) in situ water sampling and laboratory analysis; (2) Sentinel-2 image preprocessing and band combinations; (3) empirical analysis for the development of the WQP model (Chl-a, TSS, and TU) with performance evaluation; and (4) time-series derivation of WQP maps.
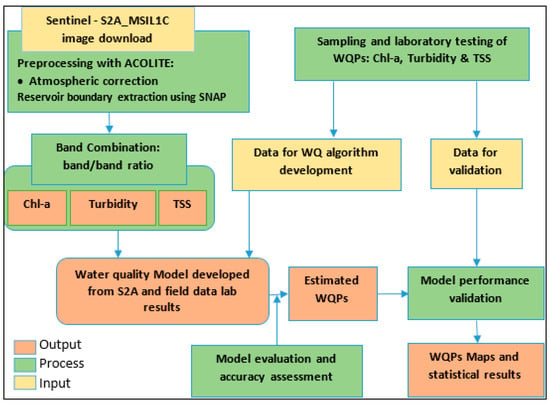
Figure 2.
A general framework of WQP model development.
The developed equations were used to investigate the spatiotemporal variation in WQPs in the Koka reservoir from 2017 to 2022. Sentinel-2A_MSIL1C images from the month of March were selected and processed. This was on different dates due to cloud cover and image clearance; the area of interest, the Koka Reservoir, was extracted from the images. Sentinel 2A satellite images from the years 2021 (June, November–December) and 2022 (January–May) were also used to track the temporal variability of WQPs monthly. To minimize error propagation, the satellite images were selected based on image quality. Satellite images with a sign of turbulence or water current on the reservoir were excluded based on visual inspection. As a result, each month’s images have a distinct date. Values of WQPs were computed in an ArcMap Raster Calculator tool from their band/band combination values and evaluated for the change detection study on both an annual and monthly basis, as detailed in Figure 2.
2.2.1. In Situ Water Sampling and Laboratory Analysis
On 25–26 February 2022, ground monitoring datasets were collected from 27 sample sites within two days. It was not possible to take and complete sample collection on the same day of the satellite overpass due to the turbulence. We collected the data the same day of the satellite overpass over the area and one day after the S2A images were acquired for the local scenes. The number of water quality samples and sites has been determined by examining the satellite image while taking into account inlets, outlets, noticeably turbid areas, visibly green areas, and area representation of the reservoir. Figure 1 shows the lake extent as seen in Sentinel-2 true color image composite on 20 March 2017, together with the in situ sampling locations that were surveyed with a handheld Garmin 60 s global positioning system (GPS) receiver. The samples were taken using a Van Dorn water sampler (Alpha Bottle Kit-2.2L Horizontal) [61] at a depth of 0.50 m. For Chl-a, the water sample was filtered on site, double wrapped in aluminum foil, and kept in a cold ice box.
In the laboratory, Chl-a, TU, and TSS were determined from the water samples. To determine Chl-a, 0.1 L water sample was passed through Whatman GF/F 47 mm glass fiber filter at the time of sampling and then extracted into 90% acetone. The Chl-a of the extracts was determined spectrophotometrically at a wavelength of 663, 665, and 750 nm using a SP-2000 spectrophotometer, which utilized 50 mm optical path, 10 mm × 10 mm × 45 mm standard glass cuvettes, and a 5 nm spectral bandwidth. Chl-a was calculated based on [62], as seen in Equation (1)
where F = Dilution Factor (if the extract requires dilution); E = the volume of acetone used for the extraction (mL); V = the volume of water filtered (L); L = the cell path length (cm); 665 a = the turbidity corrected Abs at 665 nm after acidification; 663 b = the turbidity corrected Abs at 663 nm before acidification.
TSS analysis was performed by collecting the total solids portion on a Whatman 47 mm microfiber filter, which has a nominal pore size of 1.5 μm. The filters were weighed before the samples were filtered. A volume of 100 mL was passed through the filter using vacuum flask continuing suction for about three minutes after filtration was completed. The filter was placed in a drying oven set at 104 ± 1 °C for at least one hour. After the filter was dried, filters/pans were removed from the oven and placed in a desiccator until they reached room temperature. Each filter was weighted after the samples were filtered and dried up. Finally, the concentration of TSS was calculated by dividing the difference in weight before and after filtering from the water sample volume equation, according to Kersley (2006) as seen in Equation (2):
2.2.2. Atmospheric Correction (AC)
Cloud-free Sentinel-2 images (Level 1C processing) were downloaded from the ESA Sentinels Scientific Data hub. Sentinel-2 L1C scenes in the SAFE format contain orthorectified, geolocated and radiometrically calibrated top-of-atmosphere reflectance in Universal Transverse Mercator (UTM) projection with the WGS84 datum [63]. All Sentinel-2 level-1C data were atmospherically corrected with ACOLITE software, which is completely image-based. Level-2A main output is an ortho-image Bottom-Of-Atmosphere (BOA) corrected reflectance product, as produced by ACOLITE [64].
The ACOLITE processor and atmospheric correction was developed in the EC-FP7 HIGHROC project [63]. It bundles the atmospheric correction (AC) algorithms and processing software developed by the Royal Belgian Institute of Natural Sciences (RBINS) for aquatic applications [65]. Model development was carried out considering all possible combinations of ACOLITE-derived imagery [65]. ACOLITE is an AC processor developed for coastal and inland waters [16,66] and applicable for processing high-resolution Landsat 8 OLI and S2 MSI images to give results (water-leaving reflectance) over extremely turbid, narrow, and small water bodies [16].
ACOLITE was chosen because it better reproduces the shape of the reflectance spectra. Additionally, ACOLITE is more flexible in configuration than SNAP plugins. It has the ability to apply coefficients for vicarious calibration, to choose AC algorithms (SWIR-SWIR or dark spectrum), and to select bands for AC [67].
2.2.3. Sentinel-2 Analysis and Boundary Extraction
The first of a series of Multi-Spectral Imager (MSI) instruments was launched in June 2015 by the European Space Agency (ESA) on board Sentinel-2A [68]. MSI optical sensors are a promising tool for studying inland freshwater ecosystems [67]. Sentinel-2A Level-1C images were selected for the month of March 2017 to 2022 as March typically includes cloud-free images over the Koka reservoir to analyze WQPs on annual basis. In addition to this, Sentinel-2 imagery was downloaded for a monthly based analysis in June 2021, October–December 2021, and January–May 2022. A total of 14 Sentinel-2 images (path/row: 116/34 and 115/34) were retrieved from the Copernicus Open Access Hub (https://scihub.copernicus.eu/ (accessed on 18 May 2022)). Sentinel-2 imagery was captured at approximately 3:40 GMT (corresponding to 10:40 Ethiopia’s local time) over the Koka Reservoir. The Sentinel-2 Level-1C product is ortho-images providing Top of Atmosphere (TOA) reflectance along with the parameters to transform them into radiances in WGS84 UTM zone 37 N. Level-1C products are resampled with a constant Ground Sampling Distance (GSD) of 10, 20, and 60 m depending on the native resolution of the different spectral bands. ACOLITE converts the bands internally to the same resolution. For bands at lower resolution than the processing resolution, values are replicated by nearest neighbor resampling, i.e., no new pixel values are computed, and for bands at higher resolution, pixels are spatially mean averaged. By default, the 10 m grid is used, which means the values from the 20 and 60 m bands are replicated four and 36 times to form a 10 m grid [63].
In this study, the water surface boundary was extracted from the RS image by the modified normalized difference water index (MNDWI) Equation (3), and the reservoir area boundary was masked out using the QGIS software package. MNDWI was developed by [69] and can enhance open water features while efficiently suppressing and even removing built-up land, vegetation, and soil noise. [70] showed that MNDWI outperformed the normalized difference water index (NDWI) in extracting water features mixed with vegetation when depth of standing water varied from 0.60 m to 0.75 m. Equation (3) shows how to calculate the MNDWI using Sentinel-2 image bands, with IR referring to infra-red [70].
2.2.4. Empirical Analysis for the WQPs Model Development
Firstly, pixel values of the processed Sentinel-2 images were extracted from each sampling location based on the GPS surveyed coordinates. To address GPS positional inaccuracies and potential boat drifting, the mean of a 3 × 3-pixel window was calculated, then compared with resampled mean observed data and mean Sentinel-2 spectra.
To construct the model expression between Sentinel-2 image bands and the measured Chl-a, TU, and TSS concentration of the Koka Reservoir, empirical analysis was adopted. Based on the measured and estimated values of the model, descriptive statistics such as R2, RMSE, MAE, and MAPE were calculated and used to evaluate the accuracy and stability of the regression model. The calculations of R2, RMSE, SI, MAE, and MAPE are described in Equations (4)–(8), respectively, as follows:
where represents the average value of Chl-a, TU, and TSS measured; y-represents the average value of the water surface reflectance on the image; yi is the value of the water surface reflectance on the image; xiestimated represents the simulated value of Chl-a, TU, and TSS concentration; ximeasured represents the measured value of Chl-a, TU, and TSS concentration; and N is the number of test points [71].
The RMSE gives the absolute scattering of the retrieved remote sensing reflectance as well as water quality parameter concentration [72]. A term called scatter index (SI) is defined to judge whether RMSE is sufficient or not. SI is RMSE normalized to the measured data mean, providing it gives the percentage of expected error for the parameter. If SI is less than one, estimations are considered acceptable [73].
where is measured data mean.
3. Results
3.1. In Situ Data
Chl-a, TU, and TSS of the surveyed sampling points exhibited high variability over time and space, as seen in Table 2. Chl-a ranged from 3.475 to 396.14 µg/L with an average value of 26.172 µg/L. TU varied from 34 to 148 mg/L with an average value of 54.09 mg/L and TSS varied from 192 to 860 mg/L with an average value of 328 mg/L.

Table 2.
Laboratory water quality parameters results averaged from the three surveys.
3.2. Remote Sensing Reflectance Rrs (λ) in Sampling Locations
The RS reflectance Rrs(λ) from the 27 sampling locations was extracted from the Sentinel-2 using the spatial analyst tool in ArcGIS software package. As presented in Figure 3, the reflectance across the Sentinel-2 bands ranges from 0.1123 to 0.2783 Sr−1. The red (B4) and red edge band (B5) show characteristically higher reflectance compared with other bands over the reservoir. The B5 band of the red edge spectral region shows the highest reflectance in all the sampling sites compared with the other bands. With the exception of the sampling sites B2, B3, B11, and B12, all bands show characteristically higher reflectance at station 8 than the other sampling points. Similarly, except for B2, B3, B4, B11, and B12, all bands show high reflectance at sampling sites 12, 24, 25, and 26. B2, B3, B4, B11, and B12 show lower reflectance at sampling sites 11.
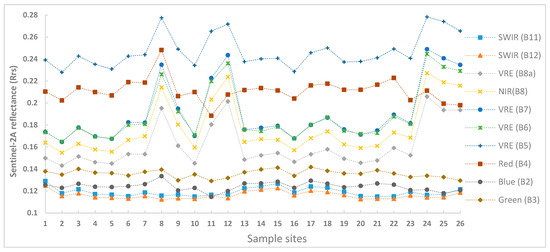
Figure 3.
RS reflectance variations over sampling points across Sentinel-2 bands.
Almost all bands show low reflectance at sampling sites 16. Similarly, with the exception of B2, B3, B4, B11, and B12, all bands show low reflectance at sampling site 10. In general, the reflectance pattern within the dam (see Figure 1) follows the same pattern from sampling site 1 to sampling site 12, but not under for the visible spectral region (B2, B3, B11, and B12).
3.3. Empirical Model Development for Chlorophyll a
After arranging the data as seen in Table 2, two outliers were identified for Chl-a (sampling site 1 3.475 μg/L and sampling site 26 and 396.14 μg/L). It is considered that using water quality data with outliers for modelling purposes may result in a model that is either unnecessary or incorrect. Based on this, we attempted to address outliers using linear regression by using the dataset to find the line that best fits the data, look for points that are far from the line, and remove points that are actually far away from the line by considering them as outliers. In the development of the empirical models, these outliers were omitted.
The central wavelength of Sentinel-2 band 5 is 705 nm, which is useful for mapping phytoplankton biomass (Chl-a). Therefore, we calculated the height of the peak against band 4 (665 nm), band 6 (740 nm), band 7 (783 nm), and band 8A (865 nm) and determined its correlation with the observed Chl-a in Koka reservoir.
All band combinations found in previous studies (see Table 1) were tested in this study. However, a few of them provided the strongest correlations, these being B5/B4, (1/B4 − 1/B5) ∗ B8A, (1/B4 − 1/B5) ∗ B7, (1/B4 − 1/B5) ∗ B6, and (1/B4 − 1/B5) ∗ B8.
Figure 4 shows the selected regression of in situ Chl-a and Sentinel-2 bands, band ratios, and band combinations, with the strongest correlation detected between Chl-a and (1/B4 − 1/B5) ∗ B8A (R2 = 0.887 and p = 0.09); (1/B4 − 1/B5) ∗ B6 (R2 = 0.886 and p = 0.07), B5/B4 (R2 = 0.9127 and p = 0.037); (1/B4 − 1/B5) ∗ B7 (R2 = 0.8762 and p = 0.083); and (1/B4 − 1/B5) ∗ B8 (R2 = 0.8692 and p = 0.075).
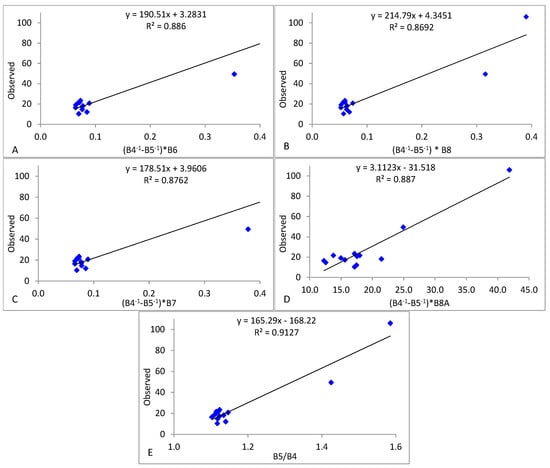
Figure 4.
Regression analysis of in situ Chl-a and reflectance corresponding to the S2A band ratios to estimate Chl-a in the reviewed literature (Table 1). Abbreviations of the Sentinel-2 band 1 to band 8a corresponding to B1 to B8a. (A) Observed and estimated (band ratio (B4−1-B5−1) ∗ B6) Chl-a, (B) Observed and estimated (band ratio (B4-1-B5-1) ∗ B8) Chl-a. (C) Observed and estimated (band (B4−1-B5−1) ∗ B7) Chl-a; (D) Observed and estimated (band ratio (B4−1-B5−1) ∗ B8A) Chl-a. (E) Observed and estimated (band ratio B5/B4) Chl-a.
The highest correlation and the smallest error of S2A (B5/B4) with in situ Chl-a confirmed the appropriateness of using this two-band ratio for estimating Chl-a in the Koka reservoir (Figure 4E). The standard error (µg/L) of the estimate Chl-a of selected band combinations (ratio) B5/B4, (1/B4 − 1/B5) ∗ B8A, (1/B4 − 1/B5) ∗ B7, (1/B4 − 1/B5) ∗ B6, and (1/B4 − 1/B5) ∗ B8 equals to 0.34, 0.11, 0.60, 0.53, and 0.55, respectively, corresponding to 5 % of the mean value of in situ Chl-a; see Table 3 (a). Therefore, (B5/B4) was selected as the best ratio for estimating Chl-a in the Koka reservoir in this study. Based on this selection, Chl-a can be calculated by Equation (9) below. Sentinel-2 derived Chl-a showed a linear correlation with in situ Chl-a R2 = (0.9127), RMSE = (9.86) which has SI 0.31, CI = (0.037) also confirming a relatively good similarity between satellite and field observed data as shown in Figure 4E.
Chl-a = 165.29 ∗ (B5/B4) − 168.22,

Table 3.
Selected regression model for the retrieval of WQPs from Sentinel 2A MSI bands and descriptive statistics of the in situ-measured and predicted water quality parameters.
3.4. Empirical Model Development for Turbidity
The selected regression of in situ turbidity and Sentinel-2 bands and band ratios, had the strongest correlation detected between TU and B3/B2 (R2 = 0.8578 and p = 0.028); B4/B3 (R2 = 0.9156 and p = 0.04); B2/B4 (R2 = 0.8851 and p = 0.074); and B2/B3 (R2 = 0.8617 and p = 0.06), as shown in Figure 5. The B3/B2, B2/B4, and B2/B3 of the TU and Sentinel-2 bad model results showed that this model was not statistically significant with p-values for each variable tested being greater than 0.05.


Figure 5.
Turbidity and Sentinel-2 band ratio analysis. (A) Observed and estimated (band ratio B3/B2) turbidity. (B) Observed and estimated (band ratio B2/B4) turbidity. (C) Observed and estimated (band B4/B3) turbidity. (D) Observed and estimated (band ratio B2/B3) turbidity.
The standard error (NTU) of the estimate TU of selected band ratio (B3/B2), (B2/B4), B4/B3, and band B2/B3 equals 4.536, 4.81, 3.421, and 4.112, respectively, corresponding to 5% of the mean value of in situ TU, (see Table 3 (b)). The highest correlation and the smallest error of Sentinel-2 band ratio is the B4/B3 ratio with in situ TU confirming the appropriateness of using this two-band ratio for estimating TU. Therefore, B4/B3 was selected as the best ratio for estimating TU in the Koka reservoir water in this study. Sentinel-2 derived TU showed a linear correlation with the in situ TU R2 of 0.9156 and an RMSE of 17.94, which has an SI of 0.24; also confirming a good similarity between satellite and field observed data, as shown in Figure 5D. TU can be calculated by using the following equation (Equation (10)).
TU = 282.88 ∗ (B4/B3) − 206.15,
3.5. Empirical Model Development for TSS
The TSS in the reservoir ranges between 150 mg/L and 860 mg/L, with an average of 331 mg/L. Adopting a regression model-based approach, the best results for the estimation of TSS concentration were obtained from Sentinel-2 using a linear regression function of a two-band ratio. The overall performance of the satellite sensors in the retrieval of TSS within the reservoir is summarized in Table 3 (c), where the top R2 estimations are 0.3067, 0.2979, 0.5892, and 0.6717. The standard error (mg/L) of the estimated TSS of the selected band combination (B7/B3), band (B7/B2), band (B4/B3), and band (B4) equals 25.45, 86.25, 48.97, and 18.46, respectively, corresponding to 5% of the mean value of the in situ TSS. Therefore, B4 was selected as the best band ratio for estimating TSS in Koka reservoir. The results from the current study show the significance of the red and vegetation red edge band wavelengths in the estimation of TSS in shallow reservoir inland water bodies. TSS can be calculated by Equation (11).
Sentinel-2-derived TSS showed a linear correlation with an in situ TSS R2 of 0. 6717 and an RMSE of 65.38, which has an SI of 0.23 and confidence level (CL) of 0.02, confirming a good similarity between satellite and field observed data as shown in Figure 6.
TSS = 3938.9(B4) − 536.9,
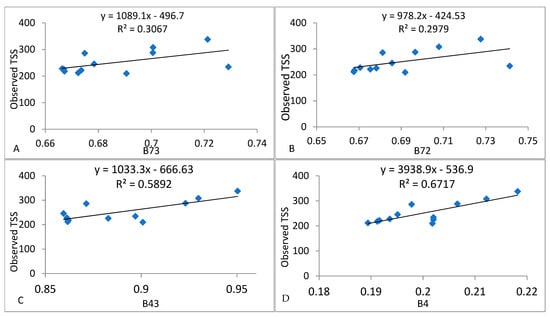
Figure 6.
(A–C) Cross-relationships of in situ TSS and reflectance corresponding to the S2A band ratios to estimate TSS in the reviewed literature (Table 1). The highest correlation and the smallest error of S2A band (B4) with in situ TSS confirmed the appropriateness of using this band for estimating TSS in Koka reservoir water Figure 6 (D).
3.6. Model Performance Validation with In Situ Measurements
Based on previously developed Equations (9)–(11), Chl-a, TU, and TSS concentrations were predicted for the validation dataset. The accuracy of the model prediction was assessed by comparing the estimated and the observed Chl-a, TU, and TSS concentration. Validation of the developed regression models was carried out using randomly selected sampling sites of twelve (12) sampling stations for Chl-a, nine (9) sampling sites for TU, and fifteen (15) sampling sites for TSS, with all observations collected on the same day. Table 4 includes the validation results, including the statistics from the selected stations which were used in the model development (see Section 3.3).

Table 4.
Descriptive statistics of the observed (laboratory-measured) and predicted (satellite image-based analysis) water quality parameters.
The results of the regression model assessment in Figure 4, Figure 5 and Figure 6 show the correlation between measured Chl-a, TU, TSS, and Sentinel-2 imagery band or band ratio, respectively. The regression model has significant descriptive statistics attributable to four parameters consisting of R2, RMSE, MAE, and MAPE to characterize the performance of the models. In this study, water samples were used to evaluate or validate the accuracy of the regression model for each parameter. Comparison between concentration of Chl-a, TU, and TSS at the measurement points and the results calculated from different bands or band ratios or band combinations was made.
Comparisons of analyzed Chl-a and estimated Chl-a from Sentinel-2 using Equation (9) are shown in Figure 7A. Estimated Chl-a has a relatively greater minimum and maximum value compared to in situ Chl-a; the mean value of the estimated and observed Chl-a is 31.7 (μg/L) and 25.2 (μg/L), respectively. It is clear that the RMSE = 9, MAE = 6.9, and MAPE = 20, corresponding to 18.6 (observed) and 21 (estimated) of standard deviation as well as 5.6 (observed) and 6.34 (estimated) of standard error with CV 0.77 (observed) 0.69 (estimated) confirming the appropriateness of the equation for estimating Chl-a in the Koka reservoir using Sentinel-2 images. These comparisons show that the Sentinel-2 satellite image, particularly the vegetation red (B4) and red edge (B5) band ratio, are suitable for the prediction of Chl-a in land water bodies, confirming the appropriateness of the developed empirical model. It is confirmed that the developed empirical model is appropriate for Chl-a monitoring using Sentinel-2 satellite imagery, although the predicted Chl-a for two sampling sites was underestimated (sample site 8 and 20) and overestimated for other sites as compared to observed Chl-a, with an MAE of 6.9 μg/L.
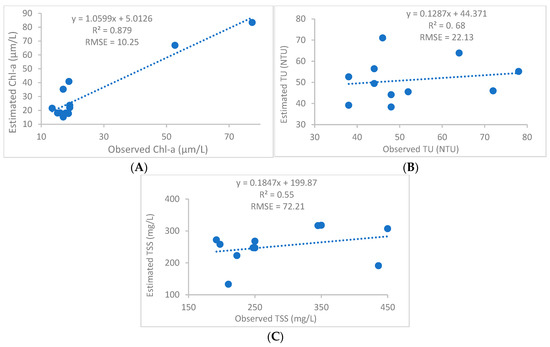
Figure 7.
Prediction and validation of Chl-a, TU, and TSS with Sentinel-2A band (band ratio). (A) Observed and estimated Chl-a concentration band ratio (B5/B4). (B) Observed and estimated Turbidity (band ratio B4/B3), and (C) observed and estimated TSS (B4) within the reservoir, using Equations (9)–(11), respectively.
Evaluations of analyzed turbidity and estimated turbidity obtained from Sentinel-2 using Equation (10) are shown in Figure 7B. Additionally, the bands through blue to NIR were analyzed for model development in their spectral response to estimate turbidity concentrations. It is evident that estimated turbidity has small MAE (14.79), MAPE (24.09), and RMSE (17.94) when compared to the observed turbidity, corresponding to 11.7 (observed) and 13.6 (estimated) of standard deviation as well as equal (3.89) observed and (3.42) estimated standard error with CV 0.23 (observed) 0.27 (estimated), confirming the appropriateness of the developed empirical model for estimating TU in the Koka reservoir.
Comparisons of analyzed TSS and estimated TSS from Sentinel-2 using Equation (11) are shown in Figure 7C. It is shown that the estimated TSS has MAE = 49.28, MAPE = 22.68, and RMSE = 65.38 values, corresponding to 42.61 (observed) and 61.23 (estimated) of standard deviation as well as 12.3 (observed) and 18.4 (estimated) of standard error with CV 0.35 (observed) 0.28 (estimated), confirming the appropriateness of the developed empirical model for estimating TSS in the Koka reservoir.
In addition to the descriptive and other statistical measures, the graphical assessment of the validation results is presented in Figure 7. For Chl-a, TU, and TSS, it shows that for their respective number of samples and validation sampling sites, the retrieval of Chl-a, TU, and TSS relatively matched the observed measurements for Sentinel-2 image bands or band combination model results, with the exception of sampling sites 1 and 20, where Sentinel-2 band combinations underestimated Chl-a by 1.85 and 0.96 μg/L; the remaining sites overestimated the Chl-a, ranging from 22.02 μg/L to 0.24 μg/L. See Figure 7A. The overall predicted TU from Sentinel-2 was overestimated in some sampling sites (1, 2, and 6) and underestimated for other sites as compared to the observed TU between satellite and field observed data, with MAE of 7.3 NTU as shown in Figure 7B; in addition, sampling sites 10, 14, 16, and 21 overestimated TSS by 80.9, 18.2, 108.4, and 109.2 mg/L, respectively. Other sample stations underestimated TSS concentrations ranging from 32.2 mg/L to 274.2 mg/L, as shown in Figure 7C.
3.7. Spatial and Temporal Patterns of Water Quality Parameters Mapping
3.7.1. Temporal Variation of Water Quality Parameters
The monthly mean, minimum, maximum, SD, and CV for Chl-a, TU, and TSS values are reported in Table 5. When satellite image assessment results were compared across a year (January 2021 to May 2022), the minimum and maximum values of Chl-a were widely dispersed. In the analyzed months, the mean value ranged from 59.69 µg/L in May to 144.25 µg/L in December (Appendix A Figure A4A and Table 5). From November to February, the maximum concentration of Chl-a decreased (354.64, 340.53, 287.34, and 205.29 µg/L, respectively). In March, April, and May, the maximum Chl-a (254.24, 246.08, and 155.47 µg/L) showed a decreasing trend. The mean Chl-a concentration showed a decreasing order or trend from December to March. November had the highest Chl-a concentration (354.64 µg/L) followed by December (340.53) and January (287.34 µg/L).

Table 5.
Selected regression model for the retrieval of monthly WQPs from Sentinel 2A MSI bands and descriptive statistics of the in situ-measured and predicted water quality parameters.
The highest concentration of TSS was obtained in April 2022 (574.51 mg/L) followed by May 2022 and June 2021 with 478.94 and 387.56 mg/L, respectively. The lowest minimum TSS concentration (0.05 mg/L) was observed in March 2022. The maximum lower concentration of TSS was observed in April 2022 (9.81 mg/L). From January to April, TSS showed an increasing trend (124.58, 128.77, 135.07, and 574.51 mg/L), respectively. This stretch starts the transition time of the dry season to the Belg season in the area. The mean concentration of TSS ranges from 38.46 to 368.97 mg/L. The mean TSS concentrations in the respective months follow a decreasing trend from June 2021 to February 2022 see Appendix A Figure A4C and Table 5.
The minimum and maximum turbidity showed a decreasing trend by 36.72 NTU from June to December 2021, and the maximum turbidity showed an increasing trend from February to May 2022 by 37.33 NTU. There is a similar trend of the mean turbidity as the maximum turbidity showed in the respected months. However, there was no consistent pattern in the lowest turbidity of the years studied in Appendix A Figure A4B and Table 5.
As seen in Table 5, for the whole reservoir, the monthly mean of Chl-a (59.69 µg/L) levels were at their lowest in May 2022 and their highest (144.25 µg/L) in December 2021. The average TU was low in December 2022 (79.67 NTU) and high in June 2021 and May 2022 (about 115 NTU). The monthly mean of TSS ranged from 38.46 mg/L in February 2022 to 368.97 mg/L in April 2022. Similarly, for the whole reservoir, the yearly mean of Chl-a was low in 2021 (52.86 µg/L) and high in 2017 (96.19 µg/L), the mean of TU was low in 2018 (71.04 NTU) and high in 2022 (83 NTU), and the mean of TSS was low in 2018 (36.58 mg/L) and high in 2020 (159.26 mg/L).
The maximum concentration of Chl-a levels dropped by 123.39 µg/L from 2020 to 2021 and increased by 149.53 µg/L from 2021 to 2022. In contrast, from 2019 to 2020, the maximum Chl-a concentration increased by 72.66 µg/L, and from 2018 to 2019, the maximum concentration of Chl-a decreased by 63.94 µg/L. In 2020, the lowest maximum (12.46 µg/L) and mean (94.53 µg/L) concentrations of Chl-a were recorded, with the lowest margin of maximum concentration. In comparison to previous years, 2022 had the highest maximum (254.24 µg/L) and mean (83.2 µg/L) of Chl-a concentration, followed by 2020 with the maximum Chl-a concentration of 228.1 µg/L. The annual mean Chl-a fluctuates between 52.86 µg/L in 2021 and 96.19 µg/L in 2017. As illustrated in Appendix A Figure A5A and Table 6, the annual minimum Chl-a ranges from 0.28 µg/L in (2017 and 2022) to 12.46 µg/L in 2020.

Table 6.
Selected regression model for the retrieval of yearly WQPs from Sentinel 2A MSI bands and descriptive statistics of the in situ-measured and predicted water quality parameters.
TU was the highest in 2022 (172.44 NTU). The mean turbidity ranges from 72.82 in 2017 to 83 in 2022. Similarly, the maximum TU ranges from 149.73 NTU in 2021 to 172.44 in 2022. The minimum TU ranges from 0.03 NTU in 2018 to 12.18 NTU in 2021. The minimum, maximum, and mean turbidity did not show a regular trend. The minimum turbidity concentration showed the highest turbidity value in the year 2021 (12.18 NTU) (Appendix A Figure A5B).
The satellite-based TU model results showed that the higher whole reservoir mean turbidity in the months of June 2021 and May 2022 was about 115 NTU. In contrast, the whole reservoir satellite-based data showed mean TU in the months of April 2022 (90.64 NTU) and November 2021 (98.24 NTU) to be lower than in the months of June 2021 and May 2022 (215 NTU). Lower turbidity was observed in the dry season than in Belg and Kiremt seasons (June), which was significant in the analyses of the evaluated months in Appendix A Figure A4B and Table 6.
TSS concentrations are highest in 2020 (358.41 mg/L), followed by 2019 (279.63 mg/L). From 2018 to 2020, TSS revealed an increasing trend (170.13, 279.63, and 358.41 mg/L). The mean value of the year 2020 was higher (159.26 mg/L) than the mean value of the remaining evaluated years. The maximum concentration of TSS ranges from 120.89 mg/l in 2021 to 358.41 mg/l in 2020. Similarly, the mean concentration of TSS ranges from 36.58 mg/L in 2018 to 159.26 in 2020; see Appendix A Figure A5C and Table 6.
3.7.2. Spatial Distribution of Chl-a, TU, and TSS and Time Series Analysis
The annual spatial distribution maps of Chl-a, TU, and TSS developed through time-derived observations from the Sentinel-2 are illustrated in Figure 8, Figure 9 and Figure 10, with monthly maps of Chl-a TU and TSS presented in Appendix A Figure A1, Figure A2 and Figure A3, respectively.
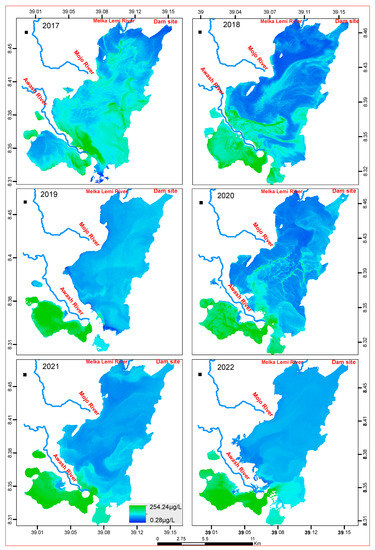
Figure 8.
Annual distribution map of Chl-a (µg/L) from Sentinel-2 imagery using linear regression models.
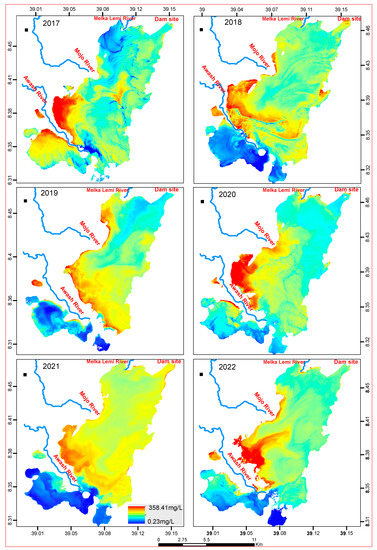
Figure 9.
Annual distribution map of TSS (mg/L) from Sentinel-2 imagery using linear regression models.
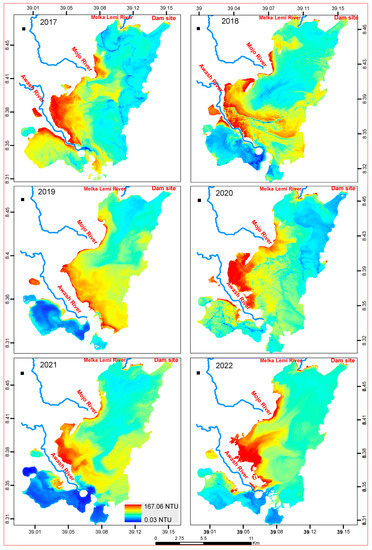
Figure 10.
Annual distribution map of TU (NTU) from Sentinel-2 imagery using linear regression models.
Spatial patterns reflected that the inlets of the Mojo and Awash Rivers (Figure 1) have high TSS and TU. Similarly, the south and southwestern side of the reservoir, which is the left side of the Awash River, showed the highest concentration of Chl-a. There is no spatial heterogeneity in all the months as well as the years of all the analyzed Sentinel-2 images for all WQ indicators.
The annual variation in Chl-a concentrations across the lake was noticeable (Figure 8). Chl-a concentrations were higher in the south and southwestern sections of the reservoir in all the studied years except in 2017. Except for the north and northeastern tip of the reservoir, the Chl-a was highly spread across the reservoir in 2017, regardless of concentration. The minimum concentration of Chl-a in all the examined years except 2017 had a larger area coverage than the maximum Chl-a concentration. The highest concentrations of Chl-a were found in the south and southwestern part of the reservoir.
The distribution of relatively lower TSS concentrations on the south and southwest sides of the reservoir were observed from 2018, 2019, 2021, and 2022. TSS and TU distributions in all years studied followed a similar trend (Figure 9 and Figure 10). Overall, the spatial pattern during the monitoring period showed a high concentration upstream (Awash River inlet to the reservoir) and decreased downstream (the Awash River outlet from the reservoir). This is consistent with the pattern observed in Chl-a, TU, and TSS in Figure 8, Figure 9 and Figure 10.
4. Discussion
In the absence of ground-based observations, reflectance data, and a lack of handheld radiospectrometers at the reservoir in Koka, we have developed an indirect method of extracting and validating Chl-a, TU, and TSS satellite data. We used the reflectance and reflectance ratios at different wavelengths and compared abridged set of in situ data for Chl-a (µg/L), TU (NTU), and TSS (mg/L), which was obtained concurrently to the images (2017–2022 and June 2021, October–December 2021, January–May 2022). The best linear regressions for the calculation and mapping of Chl-a, TU, and TSS from Sentinel-2 imagery are discussed in Section 3.3, Section 3.4 and Section 3.5.
Considering the performance of the extracted bands of Sentinel-2 and the developed water quality models, the specific spectral band of B4 (665 nm) provided the strongest correlations with both Chl-a, TU, and TSS. The findings of this investigation reveal that Sentinel-2 products can efficiently predict, quantify, and visualize temporal and spatial Chl-a, TU, and TSS trends in small water bodies. Furthermore, it was found that using interactions between optical and water quality parameters, the linear regression method can accurately predict Chl-a, TU, and TSS, as seen in the developed Equations (9)–(11).
For low biomass, oligotrophic to mesotrophic waterbodies, the Chl-a spectrum is characterized by a sun-induced fluorescence peak around 680 nm [48,49]. For high biomass, eutrophic waterbodies, the florescence signal is masked by absorption features and backscatter peaks centered at 665 nm and 710 nm, respectively [49]. The ratio between these two wavelengths has been used to accurately estimate Chl-a concentration in numerous studies (Table 1). The height of the reflectance peak between 700 and 720 nm has been used for estimating the Chl-a concentration in lake waters for more than two decades [51,52].
Among the many band–reflectance ratio algorithms that have been proposed for Chl-a estimation in lake waters, algorithms based on spectral band ratios (Table 3 (a)) are the more preferred because they help reduce the irradiance, atmospheric, and air–water surface effects on reflectance [34,36,74]. In comparison to other studies, such as [75] in Tunisia, the water-leaving radiance reflectance for the 705/665 nm band ratio (B5/B4) showed the best regression coefficient with the in situ Chl-a data with an R2 value of 0.72. Similar results were reported by [76,77], showing a good agreement between field and modeled Chl-a for the analyzed sites with R2 value of 0.925 and 0.87, respectively. The regression validation indicated successful correlations with R2 of 0.9127 for Chl-a estimations. The results showed that the blue, green, and red, vegetation red edge bands and band ratios yielded the best results with R2 greater than 0.8 for the estimation of Chl-a concentrations. In general, Chl-a concentrations rose in June with the start of algal bloom.
The distribution of Chl-a in a monthly analysis can be seen in Appendix A Figure A1. Smaller lakes were formed in June 2021, April, and May 2022 due to lower river flow into the reservoir (the dry season). The major portion of the formed lake had a low Chl-a concentration in June 2021. In April and May 2022, however, this reservoir’s segment had a higher Chl-a concentration than the main reservoir waterbody. Except for the shore areas (in May 2021) and southwestern section of the reservoir (June 2021), nearly every region of the reservoir had a large coverage of Chl-a distribution in November and December 2021 and April and May 2022. The reservoir’s western, southwestern, and southern portions had the largest coverage of higher concentration of Chl-a in November and December 2021. From January to March 2022, the south and southwestern parts of the reservoir had a larger area coverage of Chl-a than the rest of the reservoir, peaked in November, and then dropped in February. It showed decreases from November to February. In addition, Chl-a showed a decreasing trend from March to May. Chl-a concentrations ranged from 0.07 µg/L in January to 354.64 µg/L in November. January had the minimum lowest concentration (0.07 µg/L) of Chl-a, which was followed by March (0.35 µg/L). Appendix A Figure A4A shows that the mean highest and lowest concentrations followed a similar pattern. The highest maximum, minimum, and mean turbidity were recorded in June 2021 at the start of the rainy season, and in May 2022 in the middle of the Belg season.
The Koka reservoir was reported to have hazardous concentrations of toxic cyanobacteria [78]. Lake water quality issues related to algal blooms are a serious problem in basins with abundant agricultural land, causing harmful effects on freshwater ecosystems such as taste and odor issues in drinking water, oxygen depletion causing fish kills, and water exceeding safe drinking water standards [79]. In addition to this, water hyacinth (Eichhornia crassipes) invasion and harmful toxic algal occurrence owing to eutrophication caused by anthropogenic factors have been observed in the Koka reservoir [7].
Clear water has low reflectance in the visible spectrum and has no reflection in the NIR region, as this wavelength is absorbed by clear water. However, high reflectance measurements in red (600–700 nm) and NIR region (750–1400 nm) show a strong correlation with TSS concentrations [80]. Organic-dominated systems derive their spectral signatures from algae concentrations and can share the pronounced absorption features and backscatter peaks described above for chlorophyll [81]. As inorganic TSS concentrations increase within a waterbody, the location of the spectral maximum moves from around 550 nm into the red or near-infrared wavelengths [82] with waterbody specific variation dependent on chlorophyll and CDOM concentrations [26]. This study confirms that sentinel 2 image red (B4), and green (B3) band ratio is suitable for the prediction of TU inland water bodies.
Ref. [46] predicted TSS in the Guadalquivir estuary based on the band calculated from 664 nm (band 4) with an R2 value of 0.70 as the model developed by this study. The reflectance in visible region specifically red region increases with increase in sediments in the water or turbidity, as also evidenced in [83].
In November to December 2021; January to March 2022, with the exception of the south and southwestern parts of the reservoir; the northwestern part (June 2021); and the northern tip (April 2022), TSS was spread more or less consistently in all areas of the reservoir, regardless of concentration value. TSS concentrations and distributions were lowest in the southern and southwestern sections of the reservoir in November and December 2021, and from January to March 2022. In April and May 2022, the highest concentrations of TSS were found in the reservoir’s western and central areas. TSS concentrations were highest in the western and southwestern parts of the reservoir in June 2021 and May 2022. The increasing concentration of TSS from February to April is related to the Belg rainfall, which washes the exposed soil from agricultural lands from upstream watersheds as well as urban areas. Ethiopia is characterized by three distinct seasons. These are locally known as Bega (October to January), Belg (February to May), and Kiremt (June to September) [18].
Soil erosion is very common in Ethiopia, and some of the lakes are affected by the consequences of sedimentation and increased turbidity [5]. In almost all the years studied, there was a high concentration of TSS in the reservoir’s eastern area, which is where the Awash River enters the reservoir. The highest concentrations are attributed to the water inflow from the Awash and Mojo Rivers (Figure 10) at an area of low depth, which leads to the agitation of the settled sediment. The higher degree of the settling of sediment, therefore, leads to low turbidity in the reservoir.
With in situ turbidity varying from 34 NTU to 168 NTU and averaging at 54.09 NTU, low turbidities could be attributed to low flows into the reservoir, especially during the period in which the water samples were collected. As the reservoir is relatively deeper in the outlet, the sediment tends to settle faster, leading to generally low concentrations of particulate matter with minimal potential of resuspension [38] by water currents and waves. The higher degree of the settling of sediments, therefore, leads to low turbidity in the reservoir; however, the reservoir is shallow, causing this scenario. In all of the years studied, the spatial distribution of TU and TSS followed a remarkably similar pattern.
From July to October, it is difficult to obtain cloud-free satellite images to examine the circumstances and to compare dry and rainy season WQPs. Furthermore, acquiring steady and consistent RS Top of Atmosphere (TOA) reflectance for the purpose in all 5 days’ interval satellite image is particularly difficult due to the shallowness of the reservoir, water turbulence, and water current. To overcome these limitations, further verification should be performed using a drone or a handheld spectroradiometer instrument.
There are factors that influence the spatiotemporal WQPs in the reservoir. The Koka reservoir is one of the direct recipients of sedimentation-increased turbidity and algal blooms (toxic cyanobacteria) [84], as well as excessive chemicals and fertilizers washed from the nearby farms and disposed of by industries [85]. For example, phosphates entering the water from detergents in urban areas like Addis Ababa, Dukem, Mojo, and Debrezeit [86,87,88] can cause the nutrient levels in the water to rise and lead to algal blooms [88]. Furthermore, the surrounding agricultural land use has been a major source of nutrient input to the reservoir [78,85]. However, temporal shifts in water quality can be influenced by factors such as stream flow, which influences seasonal variability in the delivery of the constituent to the rivers and the reservoir, and rainfall and air temperature [89].
5. Conclusions
This study demonstrated that Sentinel 2 derived regression models can support the spatiotemporal estimation and mapping of the annual and monthly patterns of Chl-a, TU, and TSS over the Koka reservoir. This enables an improved capacity to diagnosis reservoir status and strategies for water resource management.
This research also confirmed the appropriateness of the linear function model for estimating WQ indicators, such as Chl-a, turbidity, and TSS in shallow waters from the Sentinel-2 image band ratio of B5/B4, B4/B3, and band 4 (B4), respectively. In addition to this, it has tested the suitability of Sentinel-2 data for mapping reservoir water quality parameters (Chl-a, turbidity, and TSS) by means of empirical models, which complement the traditional methods of WQ monitoring. This work will greatly expand the use of these procedures, not only by researchers but also by water management agencies and interested members of the public, with the long-term goal of improving societal knowledge and understanding of surface water resources and helping to improve data-driven resource management.
A unique water quality assessment method is here recommended, which breaks through the traditional water quality point sampling and analysis, taking advantage of remote sensing and open satellite datasets. The presented Sentinel-2-based method can directly associate the concentration level of Chl-a, TU, and TSS with the degree of progress to quantify the dynamic change process of Chl-a, TU, and TSS in multiple time series. The low operational cost of using freely available remotely sensed imagery is a strong incentive for water agencies to complement their field campaigns and produce spatially distributed maps of some water quality parameters. The algorithms could potentially be useful as a monitoring tool for water quality in other regions in the country or in other data-scarce areas of the world with comparable environmental and hydro-climatic contexts.
Author Contributions
E.A. is a researcher and lead author, investigation, design of methodology, conceptual framework development, and wrote the original draft. G.Z. and T.A. contributed to funding acquisition, project design and direction, and supervision. H.S., D.T., M.V.P., and C.L.W. reviewed and edited different versions of the manuscript. All authors listed have made a substantial, direct, and intellectual contribution to the work and approved it for publication. All authors have read and agreed to the published version of the manuscript.
Funding
This work was financially supported by Water and Land Resource Center (WLRC), Addis Ababa University (AAU), Water Security and Sustainable Development Hub funded by the UK Research and Innovation’s Global Challenges Research Fund (GCRF): ES/S008179/1.
Data Availability Statement
The original contributions presented in the study are included in the article; further inquiries can be directed to the corresponding author/s.
Acknowledgments
The authors gratefully acknowledge use of the services and facilities of the WLRC, AAU.
Conflicts of Interest
The authors declare no conflict of interest.
Appendix A
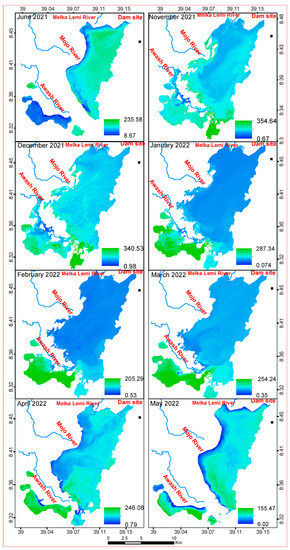
Figure A1.
Monthly chlorophyll a (in µg/L) spatial distribution.
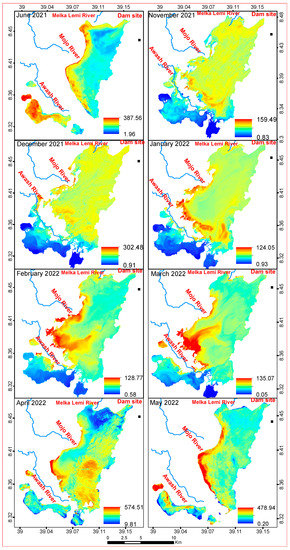
Figure A2.
Monthly TSS (in mg/L) spatial distribution.
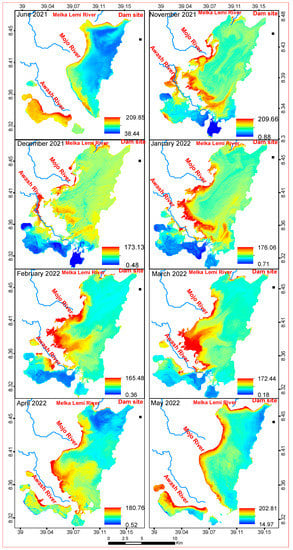
Figure A3.
Monthly TU (NTU) spatial distribution.
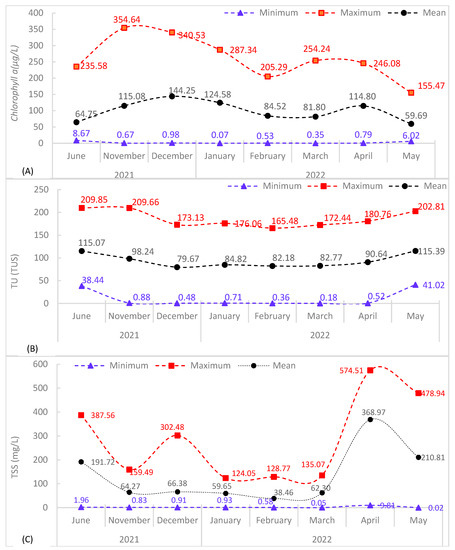
Figure A4.
Monthly basis temporal WQPs from Sentinel 2A satellite image using linear regression models Equations (8)–(10). (A) Chlorophyll a (µg/L), (B) Turbidity (NTU), (C) Total Suspended Sediment (mg/L).
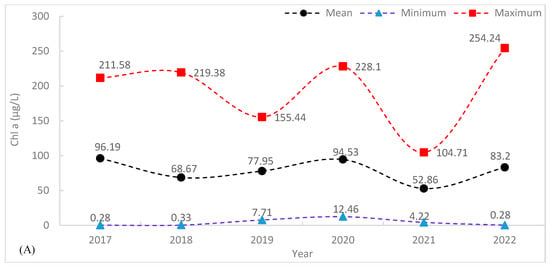
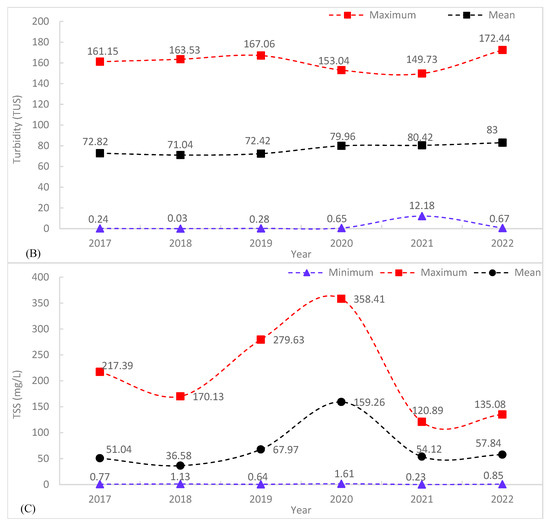
Figure A5.
Yearly temporal WQPs from Sentinel 2A satellite image using linear regression models. (A) Chlorophyll a (µg/L), (B) Turbidity (NTU), (C) Total Suspended Sediment (mg/L).
References
- Mishra, A.K.; Singh, V.P. A review of drought concepts. J. Hydrol. 2010, 391, 202–216. [Google Scholar] [CrossRef]
- Chawla, I.; Karthikeyan, L.; Mishra, A.K. A review of remote sensing applications for water security: Quantity, quality, and extremes. J. Hydrol. 2020, 585, 124826. [Google Scholar] [CrossRef]
- UNEP. Progress on Ambient Water Quality. Tracking SDG 6 Series: Global Indicator 6.3.2 Updates and Acceleration Needs; UNEP: Nairobi, Kenya, 2021. [Google Scholar]
- Ademe, A.S. Source and Determinants of Water Pollution in Ethiopia: Distributed Lag Modeling Approach. Intellect. Prop. Rights Open Access 2014, 2. [Google Scholar] [CrossRef]
- Assegide, E.; Alamirew, T.; Dile, Y.T.; Bayabil, H.; Tessema, B.; Zeleke, G. A Synthesis of Surface Water Quality in Awash Basin, Ethiopia. Front. Water 2022, 4, 782124. [Google Scholar] [CrossRef]
- Abhachire, L.W. Studies on Hydrobiological Features of Koka Reservoir and Awash River in Ethiopia. Int. J. Fish. Aquat. Stud. 2014, 1, 158–162. Available online: www.fisheriesjournal.com (accessed on 10 September 2019).
- Assegide, E.; Alamirew, T.; Bayabil, H.; Dile, Y.T.; Tessema, B.; Zeleke, G. Impacts of Surface Water Quality in the Awash River Basin, Ethiopia: A Systematic Review. Front. Water 2022, 3, 790900. [Google Scholar] [CrossRef]
- Ligdi, E.E.; El Kahloun, M.; Meire, P. Ecohydrological status of Lake Tana—A shallow highland lake in the Blue Nile (Abbay) basin in Ethiopia: Review. Ecohydrol. Hydrobiol. 2010, 10, 109–122. [Google Scholar] [CrossRef]
- Abell, J.M.; Özkundakci, D.; Hamilton, D.P.; Jones, J.R. Latitudinal variation in nutrient stoichiometry and chlorophyll-nutrient relationships in lakes: A global study. Fundam. Appl. Limnol. 2012, 181, 1–14. [Google Scholar] [CrossRef]
- Alemu, M.L.; Geset, M.; Mosa, H.M.; Zemale, F.A.; Moges, M.A.; Giri, S.K.; Tillahun, S.A.; Melesse, A.; Ayana, E.K.; Steenhuis, T.S. Spatial and Temporal Trends of Recent Dissolved Phosphorus Concentrations in Lake Tana and its Four Main Tributaries. Land Degrad. Dev. 2017, 28, 1742–1751. [Google Scholar] [CrossRef]
- Maschal Tarekegn, M.; Truye, A.Z. Causes and impacts of shankila river water pollution in Addis Ababa, Ethiopia. Environ. Risk Assess. Remediat. 2018, 2, 21–30. Available online: http://www.alliedacademies.org/environmental-risk-assessment-and-remediation/ (accessed on 23 September 2019).
- Toming, K.; Kutser, T.; Laas, A.; Sepp, M.; Paavel, B.; Nõges, T. First experiences in mapping lake water quality parameters with sentinel-2 MSI imagery. Remote Sens. 2016, 8, 640. [Google Scholar] [CrossRef]
- Yepez, S.; Laraque, A.; Martinez, J.M.; De Sa, J.; Carrera, J.M.; Castellanos, B.; Gallay, M.; Lopez, J.L. Retrieval of suspended sediment concentrations using Landsat-8 OLI satellite images in the Orinoco River (Venezuela). Comptes Rendus Geosci. 2018, 350, 20–30. [Google Scholar] [CrossRef]
- Ismail, K.; Boudhar, A.; Abdelkrim, A.; Mohammed, H.; Mouatassime, S.; Kamal, A.O.; Driss, E.; Idrissi, E.A.; Nouaim, W. Evaluating the potential of Sentinel-2 satellite images for water quality characterization of artificial reservoirs: The Bin El Ouidane Reservoir case study (Morocco). Meteorol. Hydrol. Water Manag. Res. Oper. Appl. 2019, 7, 31–39. [Google Scholar] [CrossRef]
- Mamun, M.; Ferdous, J.; An, K.G. Empirical estimation of nutrient, organic matter and algal chlorophyll in a drinking water reservoir using landsat 5 tm data. Remote Sens. 2021, 13, 2256. [Google Scholar] [CrossRef]
- Ansper, A.; Alikas, K. Retrieval of Chlorophyll a from Sentinel-2 MSI Data for the European Union Water Framework Directive Reporting Purposes. Remote Sens. 2019, 11, 64. [Google Scholar] [CrossRef]
- Giardino, C.; Bresciani, M.; Villa, P.; Martinelli, A. Application of Remote Sensing in Water Resource Management: The Case Study of Lake Trasimeno, Italy. Water Resour. Manag. 2010, 24, 3885–3899. [Google Scholar] [CrossRef]
- Zhao, J.; Zhang, F.; Chen, S.; Wang, C.; Chen, J.; Zhou, H.; Xue, Y. Remote Sensing Evaluation of Total Suspended Solids Dynamic with Markov Model: A Case Study of Inland Reservoir across Administrative Boundary in South China. Sensors 2020, 20, 6911. [Google Scholar] [CrossRef]
- Wang, M.; Yao, Y.; Shen, Q.; Gao, H.; Li, J.; Zhang, F.; Wu, Q. Time-Series Analysis of Surface-Water Quality in Xiong’an New Area, 2016–2019. J. Indian Soc. Remote Sens. 2021, 49, 857–872. [Google Scholar] [CrossRef]
- Pizani, F.M.C.; Maillard, P.; Ferreira, A.F.F.; de Amorim, C.C.; Federal, U.; Gerais, D.M.; Horizonte, B.; Federal, U.; Gerais, D.M.; Horizonte, B.; et al. Estimation of Water Quality in a Reservoir from Sentinel-2 MSI and Landsat-8 Oli Sensors. ISPRS Ann. Photogramm. Remote Sens. Spat. Inf. Sci. 2020, 3, 401–408. [Google Scholar] [CrossRef]
- Govedarica, M.; Jakovljevic, G. Monitoring spatial and temporal variation of water quality parameters using time series of open multispectral data. In Proceedings of the Proc. SPIE 11174, Seventh International Conference on Remote Sensing and Geoinformation of the Environment (RSCy2019), Paphos, Cyprus, 27 June 2019; p. 55. [Google Scholar] [CrossRef]
- Masresha, A.E.; Skipperud, L.; Rosseland, B.O.; Zinabu, G.M.; Meland, S.; Teien, H.C.; Salbu, B. Speciation of selected trace elements in three ethiopian rift valley lakes (koka, ziway, and awassa) and their major inflows. Sci. Total Environ. 2011, 409, 3955–3970. [Google Scholar] [CrossRef]
- Mesfin, M.; Tudorancea, C.; Baxter, R.M. Some limnological observations on two Ethiopian hydroelectric reservoirs: Koka (Shewa administrative district) and Finchaa (Welega administrative district). Hydrobiologia 1988, 157, 47–55. [Google Scholar] [CrossRef]
- Fasil, D.; Kibru, T.; Gashaw, T.; Fikadu, T.; Aschalew, D. Some limnological aspects of Koka reservoir, a shallow tropical artificial lake, Ethiopia. J. Recent Trends Biosci. 2011, 1, 94–100. [Google Scholar]
- Tesfay, H. Spatio-Temporal Variations of the Biomass and Primary Production of Phytoplankton in Koka Reservoir; Addis Ababa University, Collage of Natural Sciences: Addis Ababa, Ethiopia, 2007. [Google Scholar]
- Topp, S.N.; Pavelsky, T.M.; Jensen, D.; Simard, M.; Ross, M.R.V. Research trends in the use of remote sensing for inland water quality science: Moving towards multidisciplinary applications. Water 2020, 12, 169. [Google Scholar] [CrossRef]
- Sent, G.; Biguino, B.; Favareto, L.; Cruz, J.; Sá, C.; Dogliotti, A.I.; Palma, C.; Brotas, V.; Brito, A.C. Deriving water quality parameters using sentinel-2 imagery: A case study in the Sado Estuary, Portugal. Remote Sens. 2021, 13, 1043. [Google Scholar] [CrossRef]
- Buma, W.G.; Lee, S.I. Evaluation of Sentinel-2 and Landsat 8 images for estimating Chlorophyll-a concentrations in Lake Chad, Africa. Remote Sens. 2020, 12, 2437. [Google Scholar] [CrossRef]
- Lins, R.C.; Martinez, J.M.; Marques, D.D.M.; Cirilo, J.A.; Fragoso, C.R. Assessment of chlorophyll-a remote sensing algorithms in a productive tropical estuarine-lagoon system. Remote Sens. 2017, 9, 516. [Google Scholar] [CrossRef]
- Borges, H.D.; Cicerelli, R.E.; De Almeida, T.; Roig, H.L.; Olivetti, D. Monitoring cyanobacteria occurrence in freshwater reservoirs using semi-analytical algorithms and orbital remote sensing. Mar. Freshw. Res. 2020, 71, 569–578. [Google Scholar] [CrossRef]
- Subiyanto, S.; Ramadhanis, Z.; Baktiar, A.H. Integration of Remote Sensing Technology Using Sentinel-2A Satellite images for Fertilization and Water Pollution Analysis in Estuaries Inlet of Semarang Eastern Flood Canal. E3S Web Conf. 2018, 31, 12008. [Google Scholar] [CrossRef]
- Kupssinskü, L.S.; Guimarães, T.T.; De Souza, E.M.; Zanotta, D.C.; Veronez, M.R.; Gonzaga, L.; Mauad, F.F. A method for chlorophyll-a and suspended solids prediction through remote sensing and machine learning. Sensors 2020, 20, 2125. [Google Scholar] [CrossRef]
- Malthus, T.J.; Hestir, E.L.; Dekker, A.G.; Brando, V.E. The case for a global inland water quality product. In Proceedings of the 2012 IEEE International Geoscience and Remote Sensing Symposium, Munich, Germany, 22–27 July 2012; pp. 5234–5237. [Google Scholar]
- Schalles, J.F. Optical remote sensing techniques to estimate phytoplankton chlorophyll a concentrations in coastal waters with varying suspended matter and cdom concentrations. In Remote Sensing and Digital Image Processing; Springer: Berlin/Heidelberg, Germany, 2006; Volume 9, pp. 27–79. [Google Scholar]
- Cairo, C.; Barbosa, C.; Lobo, F.; Novo, E.; Carlos, F.; Maciel, D.; Jnior, R.F.; Silva, E.; Curtarelli, V. Hybrid chlorophyll-a algorithm for assessing trophic states of a tropical brazilian reservoir based on msi/sentinel-2 data. Remote Sens. 2019, 12, 40. [Google Scholar] [CrossRef]
- Ha, N.T.T.; Thao, N.T.P.; Koike, K.; Nhuan, M.T. Selecting the best band ratio to estimate chlorophyll-a concentration in a tropical freshwater lake using sentinel 2A images from a case study of Lake Ba Be (Northern Vietnam). ISPRS Int. J. Geo-Inf. 2017, 6, 290. [Google Scholar] [CrossRef]
- Mishra, S.; Mishra, D.R. Normalized difference chlorophyll index: A novel model for remote estimation of chlorophyll-a concentration in turbid productive waters. Remote Sens. Environ. 2012, 117, 394–406. [Google Scholar] [CrossRef]
- Ouma, Y.O.; Noor, K.; Herbert, K. Modelling Reservoir Chlorophyll-a, TSS, and Turbidity Using Sentinel-2A MSI and Landsat-8 OLI Satellite Sensors with Empirical Multivariate Regression. J. Sens. 2020, 2020, 8858408. [Google Scholar] [CrossRef]
- Rodríguez-Benito, C.V.; Navarro, G.; Caballero, I. Using Copernicus Sentinel-2 and Sentinel-3 data to monitor harmful algal blooms in Southern Chile during the COVID-19 lockdown. Mar. Pollut. Bull. 2020, 161, 111722. [Google Scholar] [CrossRef]
- Grendaitė, D.; Stonevičius, E.; Karosienė, J.; Savadova, K.; Kasperovičienė, J. Chlorophyll-a concentration retrieval in eutrophic lakes in Lithuania from Sentinel-2 data. Geol. Geogr. 2018, 4. [Google Scholar] [CrossRef]
- Quang, N.H.; Sasaki, J.; Higa, H.; Huan, N.H. Spatiotemporal variation of turbidity based on landsat 8 OLI in Cam Ranh Bay and Thuy Trieu Lagoon, Vietnam. Water 2017, 9, 570. [Google Scholar] [CrossRef]
- Ma, Y.; Song, K.; Wen, Z.; Liu, G.; Shang, Y.; Lyu, L.; Du, J.; Yang, Q.; Li, S.; Tao, H.; et al. Remote sensing of turbidity for lakes in Northeast China using sentinel-2 images with machine learning algorithms. IEEE J. Sel. Top. Appl. Earth Obs. Remote Sens. 2021, 14, 9132–9146. [Google Scholar] [CrossRef]
- Premkumar, R.; Venkatachalapathy, R.; Visweswaran, S. Mapping of Total Suspended Matter based on Sentinel-2 data on the Hooghly River, India. Indian J. Ecol. 2021, 48, 159–165. Available online: https://www.researchgate.net/profile/Prem-Kumar-82/publication/349683336_Mapping_of_Total_Suspended_Matter_based_on_Sentinel-2_data_on_the_Hooghly_River_India/links/603c6c98299bf1cc26fbd606/Mapping-of-Total-Suspended-Matter-based-on-Sentinel-2-data-on-the (accessed on 8 July 2021).
- Sòria-Perpinyà, X.; Vicente, E.; Urrego, P.; Pereira-Sandoval, M.; Tenjo, C.; Ruíz-Verdú, A.; Delegido, J.; Soria, J.M.; Peña, R.; Moreno, J. Validation of water quality monitoring algorithms for sentinel-2 and sentinel-3 in mediterranean inland waters with in situ reflectance data. Water 2021, 13, 686. [Google Scholar] [CrossRef]
- Liu, H.; Li, Q.; Shi, T.; Hu, S.; Wu, G.; Zhou, Q. Application of Sentinel 2 MSI Images to Retrieve Suspended Particulate Matter Concentrations in Poyang Lake. Remote Sens. 2017, 9, 761. [Google Scholar] [CrossRef]
- Caballero, I.; Steinmetz, F.; Navarro, G. Evaluation of the first year of operational Sentinel-2A data for retrieval of suspended solids in medium- to high-turbiditywaters. Remote Sens. 2018, 10, 982. [Google Scholar] [CrossRef]
- Nguyen, T.H.D.; Phan, K.D.; Nguyen, H.T.T.; Tran, S.N.; Tran, T.G.; Tran, B.L.; Doan, T.N. Total Suspended Solid Distribution in Hau River Using Sentinel 2A Satellite Imagery. ISPRS Ann. Photogramm. Remote Sens. Spat. Inf. Sci. 2020, 6, 91–97. [Google Scholar] [CrossRef]
- Dierssen, H.M.; Kudela, R.M.; Ryan, J.P.; Zimmerman, R.C. Red and black tides: Quantitative analysis of water-leaving radiance and perceived color for phytoplankton, colored dissolved organic matter, and suspended sediments. Limnol. Oceanogr. 2006, 51, 2646–2659. [Google Scholar] [CrossRef]
- Gitelson, A.; Mayo, M.; Yacobi, Y.Z.; Parparov, A.; Berman, T. The use of high-spectral-resolution radiometer data for detection of low chlorophyll concentrations in Lake Kinneret. J. Plankton Res. 1994, 16, 993–1002. [Google Scholar] [CrossRef]
- Matthews, M.W.; Bernard, S.; Robertson, L. An algorithm for detecting trophic status (chlorophyll-a), cyanobacterial-dominance, surface scums and floating vegetation in inland and coastal waters. Remote Sens. Environ. 2012, 124, 637–652. [Google Scholar] [CrossRef]
- Gower, J.; King, S.; Borstad, G.; Brown, L. Detection of intense plankton blooms using the 709 nm band of the MERIS imaging spectrometer. Int. J. Remote Sens. 2005, 26, 2005–2012. [Google Scholar] [CrossRef]
- Gitelson, A. The peak near 700 nm on radiance spectra of algae and water: Relationships of its magnitude and position with chlorophyll concentration. Int. J. Remote Sens. 1992, 13, 3367–3373. [Google Scholar] [CrossRef]
- Gholizadeh, M.H.; Melesse, A.M.; Reddi, L. A comprehensive review on water quality parameters estimation using remote sensing techniques. Sensors 2016, 16, 1298. [Google Scholar] [CrossRef]
- Martinez, J.-M.; Espinoza-Villar, R.; Armijos, E.; Moreira, L. The optical properties of river and floodplain waters in the Amazon River Basin: Implications for satellite-based measurements of suspended particulate matter. J. Geophys. Res. Earth Surf. 2015, 120, 1274–1287. [Google Scholar] [CrossRef]
- Marinho, R.R.; Harmel, T.; Martinez, J.M.; Filizola Junior, N.P. Spatiotemporal dynamics of suspended sediments in the negro river, amazon basin, from in situ and sentinel-2 remote sensing data. ISPRS Int. J. Geo-Inf. 2021, 10, 86. [Google Scholar] [CrossRef]
- SWECO. Review of Hydropower Multipurpose Project Coordination Regimes. 2008. Available online: http://nilebasin.org/nileis/system/files/NBI_BestPracticeCompendium_Final.pdf (accessed on 22 July 2022).
- Adane, G.B.; Hirpa, B.A.; Song, C.; Lee, W.K. Rainfall characterization and trend analysis of wet spell length across varied landscapes of the upper awash river basin, ethiopia. Sustainability 2020, 12, 9221. [Google Scholar] [CrossRef]
- Gebremichael, H.B.; Raba, G.A.; Beketie, K.T.; Feyisa, G.L.; Siyoum, T. Changes in daily rainfall and temperature extremes of upper Awash Basin, Ethiopia. Sci. Afr. 2022, 16, e01173. [Google Scholar] [CrossRef]
- Legese, W.; Koricha, D.; Ture, K. Characteristics of Seasonal Rainfall and its Distribution Over Bale Highland, Southeastern Ethiopia. J. Earth Sci. Clim. Chang. 2018, 9, 1–6. [Google Scholar] [CrossRef]
- Duguma, F.A.; Feyessa, F.F.; Demissie, T.A.; Januszkiewicz, K. Hydroclimate trend analysis of upper awash basin, Ethiopia. Water 2021, 13, 1680. [Google Scholar] [CrossRef]
- WILDCO. A Comprehensive Guide to Wildco Water Bottle Samplers. 2013, pp. 1–14. Available online: https://wildco.com/wp-content/uploads/2017/05/1200-G-Kemmerer.pdf (accessed on 11 July 2022).
- EPA ESS Method 150.1: Chlorophyll—Spectrophotometric 1991. no. September. Environmental Sciences Section Inorganic Chemistry Unit Wisconsin State Lab of Hygiene 465 Henry Mall Madison, WI 53706. 1991. Available online: http://polk.wateratlas.usf.edu/upload/documents/methd150.pdf (accessed on 11 July 2022).
- Vanhellemont, Q.; Ruddick, K. Acolite for Sentinel-2: Aquatic applications of MSI imagery. In Proceedings of the 2016 ESA Living Planet Symposium, Prague, Czech Republic, 9–13 May 2016. [Google Scholar]
- Saberioon, M.; Brom, J.; Nedbal, V.; Souček, P.; Císař, P. Chlorophyll-a and total suspended solids retrieval and mapping using Sentinel-2A and machine learning for inland waters. Ecol. Indic. 2020, 113, 106236. [Google Scholar] [CrossRef]
- Angelats, E.; Fern, M. First Results of Phytoplankton Spatial Dynamics in Two NW-Mediterranean Bays from Chlorophyll- a Estimates Using Sentinel 2: Potential Implications for Aquaculture. Remote Sens. 2019, 11, 1756. [Google Scholar]
- Vanhellemont, Q. Adaptation of the dark spectrum fitting atmospheric correction for aquatic applications of the Landsat and Sentinel-2 archives. Remote Sens. Environ. 2019, 225, 175–192. [Google Scholar] [CrossRef]
- Molkov, A.A.; Fedorov, S.V.; Pelevin, V.V.; Korchemkina, E.N. Regional models for high-resolution retrieval of chlorophyll a and TSM concentrations in the Gorky Reservoir by Sentinel-2 imagery. Remote Sens. 2019, 11, 1215. [Google Scholar] [CrossRef]
- Warren, M.A.; Simis, S.G.H.; Martinez-Vicente, V.; Poser, K.; Bresciani, M.; Alikas, K.; Spyrakos, E.; Giardino, C.; Ansper, A. Assessment of atmospheric correction algorithms for the Sentinel-2A MultiSpectral Imager over coastal and inland waters. Remote Sens. Environ. 2019, 225, 267–289. [Google Scholar] [CrossRef]
- Xu, H. Modification of normalised difference water index (NDWI) to enhance open water features in remotely sensed imagery. Int. J. Remote Sens. 2006, 27, 3025–3033. [Google Scholar] [CrossRef]
- Singh, K.V.; Setia, R.; Sahoo, S.; Prasad, A.; Pateriya, B. Evaluation of NDWI and MNDWI for assessment of waterlogging by integrating digital elevation model and groundwater level. Geocarto Int. 2015, 30, 650–661. [Google Scholar] [CrossRef]
- Lai, Y.; Zhang, J.; Song, Y.; Gong, Z. Retrieval and evaluation of chlorophyll-a concentration in reservoirs with main water supply function in beijing, china, based on landsat satellite images. Int. J. Environ. Res. Public Health 2021, 18, 4419. [Google Scholar] [CrossRef] [PubMed]
- Jaelani, L.M.; Limehuwey, R.; Kurniadin, N.; Pamungkas, A.; Koenhardono, E.S.; Sulisetyono, A. Estimation of Total Suspended Sediment and Chlorophyll-A Concentration from Landsat 8-Oli: The Effect of Atmospher and Retrieval Algorithm. IPTEK J. Technol. Sci. 2016, 27, 16–23. [Google Scholar] [CrossRef]
- Bryant, M.A.; Hesser, T.J.; Jensen, R.E. Evaluation Statistics Computed for the Wave Information Studies (WIS). 2016, pp. 1–10. Available online: https://apps.dtic.mil/sti/citations/AD1013235 (accessed on 25 April 2022).
- Ruddick, K.; Nechad, B.; Neukermans, G.; Park, Y.; Doxaran, D.; Sirjacobs, D.; Beckers, J.-M. Remote Sensing of Suspended Particulate Matter in Turbid Waters: State of the Art and Future Perspectives. In Proceedings of the Ocean Optics XIX Conference, Barga, Italy, 6–10 October 2008. [Google Scholar]
- Katlane, R.; Dupouy, C.; El Kilani, B.; Berges, J.C. Estimation of Chlorophyll and Turbidity Using Sentinel 2A and EO1 Data in Kneiss Archipelago Gulf of Gabes, Tunisia. Int. J. Geosci. 2020, 11, 708–728. [Google Scholar] [CrossRef]
- Matthews, M.W.; Bernard, S.; Winter, K. Remote sensing of cyanobacteria-dominant algal blooms and water quality parameters in Zeekoevlei, a small hypertrophic lake, using MERIS. Remote Sens. Environ. 2010, 114, 2070–2087. [Google Scholar] [CrossRef]
- Liu, Y.; Li, S.; Wallace, C.W.; Chaubey, I.; Flanagan, D.C.; Theller, L.O.; Engel, B.A. Comparison of Computer Models for Estimating Hydrology and Water Quality in an Agricultural Watershed. Water Resour. Manag. 2017, 31, 3641–3665. [Google Scholar] [CrossRef]
- Willén, E.; Ahlgren, G.; Tilahun, G.; Spoof, L.; Neffling, M.R.; Meriluoto, J. Cyanotoxin production in seven Ethiopian Rift Valley Lakes. Inland Waters 2011, 1, 81–91. [Google Scholar] [CrossRef]
- Ambrose-igho, G. Spatiotemporal Analysis of Lake Water Quality Indicators on Small Lakes, Lake Bloomington and Evergreen Lake in Central Illinois, Using Satellite Remote Sensing. Master’s Thesis, Illinois State University, Normal, IL, USA, 2020. [Google Scholar]
- Cahyono, B.E.; Jamilah, U.L.; Misto, M.; Nugroho, A.T.; Subekti, A. Analysis of Total Suspended Solids (TSS) at Bedadung River, Jember District of Indonesia Using Remote Sensing Sentinel 2A Data. Singap. J. Sci. Res. 2019, 9, 117. [Google Scholar] [CrossRef]
- Shi, K.; Li, Y.; Li, L.; Lu, H. Absorption characteristics of optically complex inland waters: Implications for water optical classification. J. Geophys. Res. Biogeosci. 2013, 118, 860–874. [Google Scholar] [CrossRef]
- Doxaran, D.; Froidefond, J.-M.; Lavender, S.; Castaing, P. Spectral signature of highly turbid waters: Application with SPOT data to quantify suspended particulate matter concentrations. Remote Sens. Environ. 2002, 81, 149–161. [Google Scholar] [CrossRef]
- Garg, V.; Aggarwal, S.P.; Chauhan, P. Changes in turbidity along Ganga River using Sentinel-2 satellite data during lockdown associated with COVID-19. Geomat. Nat. Hazards Risk 2020, 11, 1175–1195. [Google Scholar] [CrossRef]
- Tilahun, S.; Kifle, D.; Zewde, T.W.; Johansen, J.A.; Demissie, T.B.; Hansen, J.H. Temporal dynamics of intra-and extra-cellular microcystins concentrations in Koka reservoir (Ethiopia): Implications for public health risk. Toxicon 2019, 168, 83–92. [Google Scholar] [CrossRef] [PubMed]
- Zewde, T.W.; Johansen, J.A.; Kifle, D.; Demissie, T.B.; Hansen, J.H.; Tadesse, Z. Concentrations of microcystins in the muscle and liver tissues of fish species from Koka reservoir, Ethiopia: A potential threat to public health. Toxicon 2018, 153, 85–95. [Google Scholar] [CrossRef] [PubMed]
- Van Rooijen, D.; Taddesse, G. Urban sanitation and wastewater treatment in Addis Ababa in the Awash Basin, Ethiopia. In Proceedings of the In Water, Sanitation and Hygiene: Sustainable Development and Multisectoral Approaches—Proceedings of the 34th WEDC International Conference, Addis Ababa, Ethiopia, 18–22 May 2009; pp. 1–6. [Google Scholar]
- Moges, M.A.; Tilahun, S.A.; Ayana, E.K.; Moges, M.M.; Gabye, N.; Giri, S.; Steenhuis, T.S. Non-Point Source Pollution of Dissolved Phosphorus in the Ethiopian Highlands: The Awramba Watershed Near Lake Tana. Clean—Soil Air Water 2016, 44, 703–709. [Google Scholar] [CrossRef]
- Girma, K. The State of Freshwaters in Ethiopia. In Freshwater; Mount Holyoke College: South Hadley, MA, USA, 2016; p. 52. [Google Scholar]
- Guo, D.; Lintern, A.; Webb, J.A.; Ryu, D.; Liu, S.; Bende-Michl, U.; Leahy, P.; Wilson, P.; Western, A.W. Key Factors Affecting Temporal Variability in Stream Water Quality. Water Resour. Res. 2019, 55, 112–129. [Google Scholar] [CrossRef]
Disclaimer/Publisher’s Note: The statements, opinions and data contained in all publications are solely those of the individual author(s) and contributor(s) and not of MDPI and/or the editor(s). MDPI and/or the editor(s) disclaim responsibility for any injury to people or property resulting from any ideas, methods, instructions or products referred to in the content. |
© 2023 by the authors. Licensee MDPI, Basel, Switzerland. This article is an open access article distributed under the terms and conditions of the Creative Commons Attribution (CC BY) license (https://creativecommons.org/licenses/by/4.0/).