Article

Effects of Wave-Induced Doppler Velocity on the Sea Surface Current Measurements by Ka-Band Real-Aperture Radar with Small Incidence Angle

1
First Institute of Oceanography, Ministry of Natural Resources, Qingdao 266061, China
2
Technology Innovation Center for Ocean Telemetry, Ministry of Natural Resources, Qingdao 266061, China
3
Department of Electronics and Information, Huazhong University of Science and Technology, Wuhan 430074, China
*
Author to whom correspondence should be addressed.
Remote Sens. 2023, 15(4), 1127; https://doi.org/10.3390/rs15041127
Submission received: 18 January 2023 / Revised: 9 February 2023 / Accepted: 13 February 2023 / Published: 18 February 2023
(This article belongs to the Special Issue Radar Signal Processing and Imaging for Ocean Remote Sensing)

Abstract

:
The Doppler shift of microwave radar sea surface echoes serves as the foundation for sea surface current field retrieval; it includes the shift caused by satellite platform motion, ocean waves, and sea surface currents. The Doppler shift caused by ocean waves is known as the wave-induced Doppler velocity (UWD), and its removal is critical for the accurate retrieval of sea surface current fields. The low-incidence Ka-band real-aperture radar rotary scan regime has the capability of directly observing wide-swath two-dimensional current fields, but as a new regime to be further explored and validated, simulation and analysis of UWD in this regime have a significant influence on the hardware design and currently observed applications of this satellite system in its conceptual stage. In this study, we simulated and investigated the impacts of radar parameters and sea-state conditions on the UWD obtained from small-incidence-angle Ka-band rotational scanning radar data and verified the simulation results with the classical analytical solution of average specular scattering point velocity. Simulation results indicate that the change in the azimuth direction of platform observation affects UWD accuracy. Accuracy is the lowest when the antenna is in a vertical side-view. The UWD increases slowly with the incidence angle. Ocean waves are insensitive to polarization in the case of small-incidence-angle specular scattering. The increase in wind speed and the development of wind waves result in a substantial increase in UWD. We classified swell by wavelength and wave height and found that UWD increases with swell size, especially the contribution of swell height to UWD, which is more significant. The contribution of the swell to UWD is smaller than that of wind waves to UWD. Furthermore, the existence of sea surface currents changes the contribution of ocean waves to UWD, and the contribution weakens with increasing wind speed and increases with wind wave development.

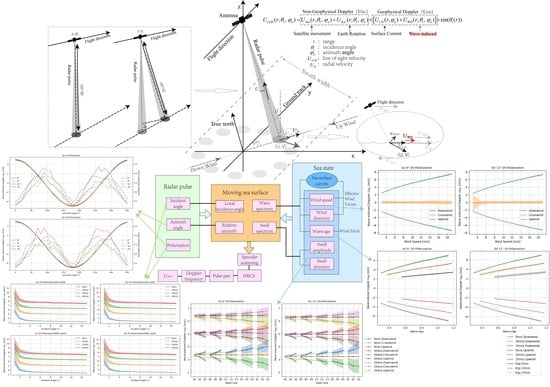
Graphical Abstract

1. Introduction

Currents are one of the most significant types of seawater movement. They occur over large scales, are relatively stable, and transfer surface heat, salt, and elements across the upper water column. They have a significant influence on air–sea interactions and are crucial climatic variables. The latest NASA decadal survey report [1] released by the US National Academy of Sciences puts ocean surface current measurements as a top priority for Earth observation missions for the next 10 years [2].
Remote sensing is one of the primary methods used to measure ocean surface currents. There are several limits to the relatively well-developed altimeter geostrophic currents estimation methods [3], synthetic aperture radar (SAR) Doppler centroid anomaly (DCA) [4], and along-track interferometric (ATI) approaches. Because of the relatively long revisit time of altimeters, altimeter data are only appropriate for measuring large-scale geostrophic currents at low resolution. The SAR, DCA, and ATI approaches may be used to obtain high-resolution radial velocity but not two-dimensional current fields. However, real-aperture radar rotating antennas combined with Doppler frequency measurements enable direct observation of wide-swath two-dimensional current fields, and this novel observation system has become a research focus in recent years. The European Space Agency (ESA) Earth Explorer 9 Sea Surface Kinematic Multiscale Monitoring (SKIM) Mission combines a real-aperture radar rotating beam system with small incidence angles and Doppler methods to detect surface velocity vectors and wave spectrum over almost the entire Earth’s oceans [5,6,7,8]. Additionally, The Winds and Currents Mission (WaCM) proposed by Rodríguez et al. [9], the Ocean Surface Current multiscale Observation Mission (OSCOM) presented by Du et al. [10], and the airborne Ka-band Doppler scatterometer funded by NASA’s Instrument Incubator Program (IIP) [11] are all significant explorations of similar systems.
To obtain accurate measurements of surface currents, the wave-induced Doppler velocity (UWD) needs to be removed from the total Doppler velocity. In addition to the current, wind and sea waves are also on the sea surface. Ocean waves consist of wind waves generated by local winds (always under the action of the winds) and swells coming from other sea areas or left on the sea surface after the local wind rapidly decreases or subsides or the wind direction changes. They cause the sea surface to move at random at all times, resulting in essential error information for the inversion of currents according to the Doppler principle [5,12]. Recent years have produced some results in the research of UWD. Several numerical models have been created to simulate UWD using wind and wave spectra and radar parameters [6,12,13,14,15]. Chapron et al. [12] investigated the link between the Doppler signal and the backscattering coefficient. They developed a simple theoretical model to retrieve sea surface current velocity fields from SAR images using the Doppler centroid frequency and analyzed the factors underlying the biases in Doppler velocities. Johannessen et al. [16] included a Doppler module in the two-dimensional radar imaging model (RIM) to study interactions between sea surface wind, waves, and currents. Hansen et al. [17] used the DopRIM model to simulate wave–current interactions in the tidal zone and analyzed the contributions of different scattering mechanisms. Several studies have also been based on oceanographic platform and airborne measurement data [13,18,19]. Yurovsky et al. [13] analyzed Ka-band radar data from a Black Sea research platform and investigated the joint modulation of the Ka-band sea surface normalized radar scattering cross-section and Doppler velocity. They combined DopRIM with an empirical modulation transfer function, developed a simpler semi-empirical dual-scale model (KaDOP) [18] suitable to small and medium incidence angles, and evaluated the effect of wind waves on the Doppler centroid under different incidence angles. Martin et al. [19] estimated the dependence of UWD on azimuth and incidence angles using airborne experimental data from Wavemill. Inversion results closely matched Acoustic Doppler Current Profiler (ADCP) current measurements. Magnitudes of UWD were higher at small incidence angles. Wind speed was the primary sea-state variable determining UWD [12,20,21]. Mouche et al. [22] derived an empirical geophysical model function (CDOP) that accounted for wind speed and direction. They reported that wind–wave development, swell, and wind speed contribute significantly to UWD [23]. Using KaDOP, Yurovsky et al. [24] demonstrated that the backscatter modulation and UWD contribution of long wind waves are higher at smaller incidence angles. They found that Doppler centroid estimation requires both wave and wind parameters. Miao et al. [25] examined the impact of wave direction spectrum on UWD for C and Ka-bands under medium and large incidence angles.
The small-incidence-angle Ka-band real-aperture radar rotating beam system is an important development for future sea surface current measurements. High system accuracy and spatial resolution facilitate the retrieval of the two-dimensional sea surface current field. Similar to the Doppler scatterometer at medium incidence angles, real aperture radar pulses with small incidence angles target the Doppler features of sea surface motion and enable direct capture of Doppler signals. The two-dimensional sea surface current field on a global scale can be retrieved using the interferometric phase difference in pulse pairs at different angles [9,26,27]. Specular scattering can be estimated with high accuracy using the small-incidence-angle Ka-band system [28]; the projection of the Bragg scattering component in the radar line-of-sight (LOS) direction tends to zero, which greatly reduces the contribution of Bragg scattering to UWD. However, methods to retrieve sea surface currents from small-incidence-angle Ka-band data still need to be developed. No operational small-incidence-angle Ka-band satellite system and few numerical and parametric sensitivity studies are available (for example, focusing on hardware and sea state). Understanding of the effects of sea surface waves on Doppler shift is still at an early stage.
Because the small-incidence-angle Ka-band real-aperture radar rotating beam regime has a high potential for sea current observation, the associated satellite system is still in the design and validation phase. This study investigates the UWD generated by waves on the sea surface, which allows accurate measurements of the sea surface current velocity in the future. In contrast to previous numerical modeling studies, which directly used wind and wave spectra and radar parameters to determine UWD, this paper establishes a full process simulation model of the moving sea surface and radar signals, simulates and analyzes the Doppler characteristics of Ka-band microwave pulses in the moving sea surface under small-incidence-angle conditions, and evaluates the sensitivity of UWD to key radar configurations and sea-state parameters. In Section 2, we introduce the sea surface motion and scattering models and the principles of Doppler velocity estimation. In Section 3, we present the design of our simulation experiments and some of the simulation data. Section 4 includes a discussion of pulse coherence and the effects of key radar and sea-state parameters on UWD. In Section 5, we present our conclusions and outlook for the future.

2. Materials and Methods

2.1. Sea Surface Motion Modeling

For ocean surface waves, the Gerstner wave [29] is the linear solution to the classical hydrodynamic equation, which describes the sea surface in terms of the motion of individual points on the surface [30,31]. The complex sea surface is eventually described as a superposition of an infinite number of waves [32,33]. The wave spectrum is also known as the ocean energy spectrum; it describes the distribution of energy within the waves as a function of frequency and direction. The wave height field can be represented as a function of the inverse fast Fourier transform (IFFT) in combination with the wave spectrum [32].
The sea surface height field h( x , t) is solved using the IFFT as follows:
h ( x , t ) = R e [ k h ˜ ( k , t ) exp ( j k · x ) ] = R e [ I F F T ( h ˜ ( k , t ) ) ]
where t denotes time; k = ( k x , k y ) is the wavenumber (bold symbols in this paper indicate vectors); h ˜ ( k , t ) is wave height amplitude and determines the shape of the wave surface. Empirical statistics indicate that h ˜ ( k , t ) is a stationary, independent Gaussian fluctuation, and its spatial domain spectrum can be expressed as:
Ψ ( k ) = | h ˜ ( k , t ) | 2
where < > denotes the overall mean of the estimate. Numerous theoretical and empirical investigations [34,35,36,37,38] focus on wave spectrum models. The Elfouhaily spectrum [39] was used in this study. Equation (3) can be used to filter the normalized Gaussian white noise in the frequency domain to obtain the wave height field:
h ˜ 0 ( k ) = 1 2 ( ξ r + j ξ i ) · Ψ ( k )
where ξ r and ξ i are mutually independent random numbers. The time-varying sea surface is obtained by adding the propagation term ω(k):
h ˜ ( k , t ) = h ˜ 0 ( k ) exp { j ω ( k ) t } + h ˜ 0 ( k ) exp { j ω ( k ) t }
In addition, for the swell on the sea surface, the spread and direction distribution of the swell is generated directly in the frequency domain using the Gaussian spectrum. The swell is then simulated using the obtained spectrum of the swell. As the Gerstner wave model is utilized in this research, nonlinear characteristics such as wave slope asymmetry and wave breaking are not included, and the simulated sea surface is entirely linear.

2.2. Sea Surface Scattering Model

When electromagnetic waves meet a rough sea surface, part of the incident energy is scattered back, and part is transmitted into the seawater. At the junction of a homogeneous medium, the reflected and transmitted parts of a plane wave can be solved accurately if there is a large difference between the scale of the scattering facet and the wavelength of the incident wave; that is, if facet scale is much larger or much smaller than incident wave wavelength [40]. However, because the sea surface is an irregular surface, it is difficult to obtain an accurate closed-form solution; therefore, many scattering models have been used to obtain approximate solutions [41,42]. The focus of this study is Ka-band at 35 GHz at an incidence angle of <15°. The response of these small-incidence-angle millimeter-wave sensors to rough ocean surfaces can be effectively approximated by the Kirchhoff approximation because the backscattering at the sea surface is mainly dominated by specular scattering [43]. Therefore, we calculated the specular scattering from the sea surface using the Kirchhoff approximation (KA) [44].
When the surface’s local radius of curvature r is substantially bigger than the radar incident wavelength, i.e.,   k 0 r c 3 c o s θ 1 , where k 0 is the wave number of the incident electromagnetic wave. The KA is used to calculate the approximate solutions of the scattered electric ( E s ) and magnetic ( H s ) fields on the surface S. In combination with the Stationary-Phase Approximation (SPA) [45], the following equation [40] can be used to calculate the scattered electric field:
E s = ϵ p K e j l · d 2 π | l z | | ζ x x ζ y y ζ x y 2 |
where K = jk 0 e jk 0 ( R i + R s ) / ( 4 π ) 2 R i R s . R i is range from the source to the center of the illuminated area, R S is range from the center of the illuminated area to the point of observation. In this paper R i = R S . p = n s × [ n × E η S n s × ( n × H ) ] , n s is unit vector in the scattered direction, n is local normal to the surface at the reflection point, η S is intrinstic impedance of the medium in which E S is scattered. E , H is total electric and magnetic fields on the interface. l z is the z components of the scattering vector l = k 0 ( n s n i ) , n i is unit vector in the incidence direction; d is the position vector of the scattering point. The value of ϵ can be determined from the slope of the sea surface in the x, y direction ζ x , ζ y and its spatial second derivatives (i.e., curvature) ζ x x , ζ y y , ζ x y . When ζ x x ζ y y ζ x y 2 > 0 , ζ x < 0 , ϵ = 1; when ζ x x ζ y y ζ x y 2 > 0 , ζ x > 0 , ϵ = −1; when ζ x x ζ y y ζ x y 2 < 0 , ϵ = +j. With SPA method, only points with stationary phase contribute to the integral. The calculation of the polarization parameter part is shown in ([40], Equations 12.23–12.26).

2.3. Doppler Frequency

In existing Doppler current measurement techniques, the phase information of the radar backscatter signal is used to obtain the Doppler frequency, which is inverted to retrieve the radial current velocity at the sea surface. For Doppler radar pulse measurements, the interferometric phase difference can be calculated using the backscattered signals of the two pulses as follows:
= A r g [ E p ( r ˜ ) E * p + 1 ( r ˜ ) p ]
where < >p denotes the pulse ensemble average. From the scattered electric field, it is possible to calculate the specular scattering point backward scattering energy with the composite signal E p ( r ˜ ) of the single pulse echo electromagnetic signal obtained by accumulating all the specular scattering energy and expressed as a function of the ground gate distance r ˜ (superscript p represents the pth pulse, superscript p+1 represents the next pulse, * denotes the complex conjugate). The complex principal value of the spoke angle ∅ is then obtained. A total Doppler shift fd in the satellite LOS direction is produced when there is relative motion between the satellite borne radar and the moving sea surface. The relationship between the Doppler shift f d and the interferometric phase of the radar backscattered signal can be approximated as [46]:
f = PRF 2 π
where PRF is the radar pulse repetition frequency. The coherence between two pulses needs to be ensured when solving the phase difference between pulse pairs; that is, the pulse repetition interval must be short enough. The linear projection relationship between the ground velocity U D and the Doppler frequency shift of the radar with respect to the moving target is as follows [17,47]:
U D = π f d k 0 sin θ
where θ is the radar incidence angle. For this study, a positive UD produces a negative fd, which corresponds to the target moving away from the radar. We used the symbol “-” only to denote the direction of relative motion between the target and the radar [6].
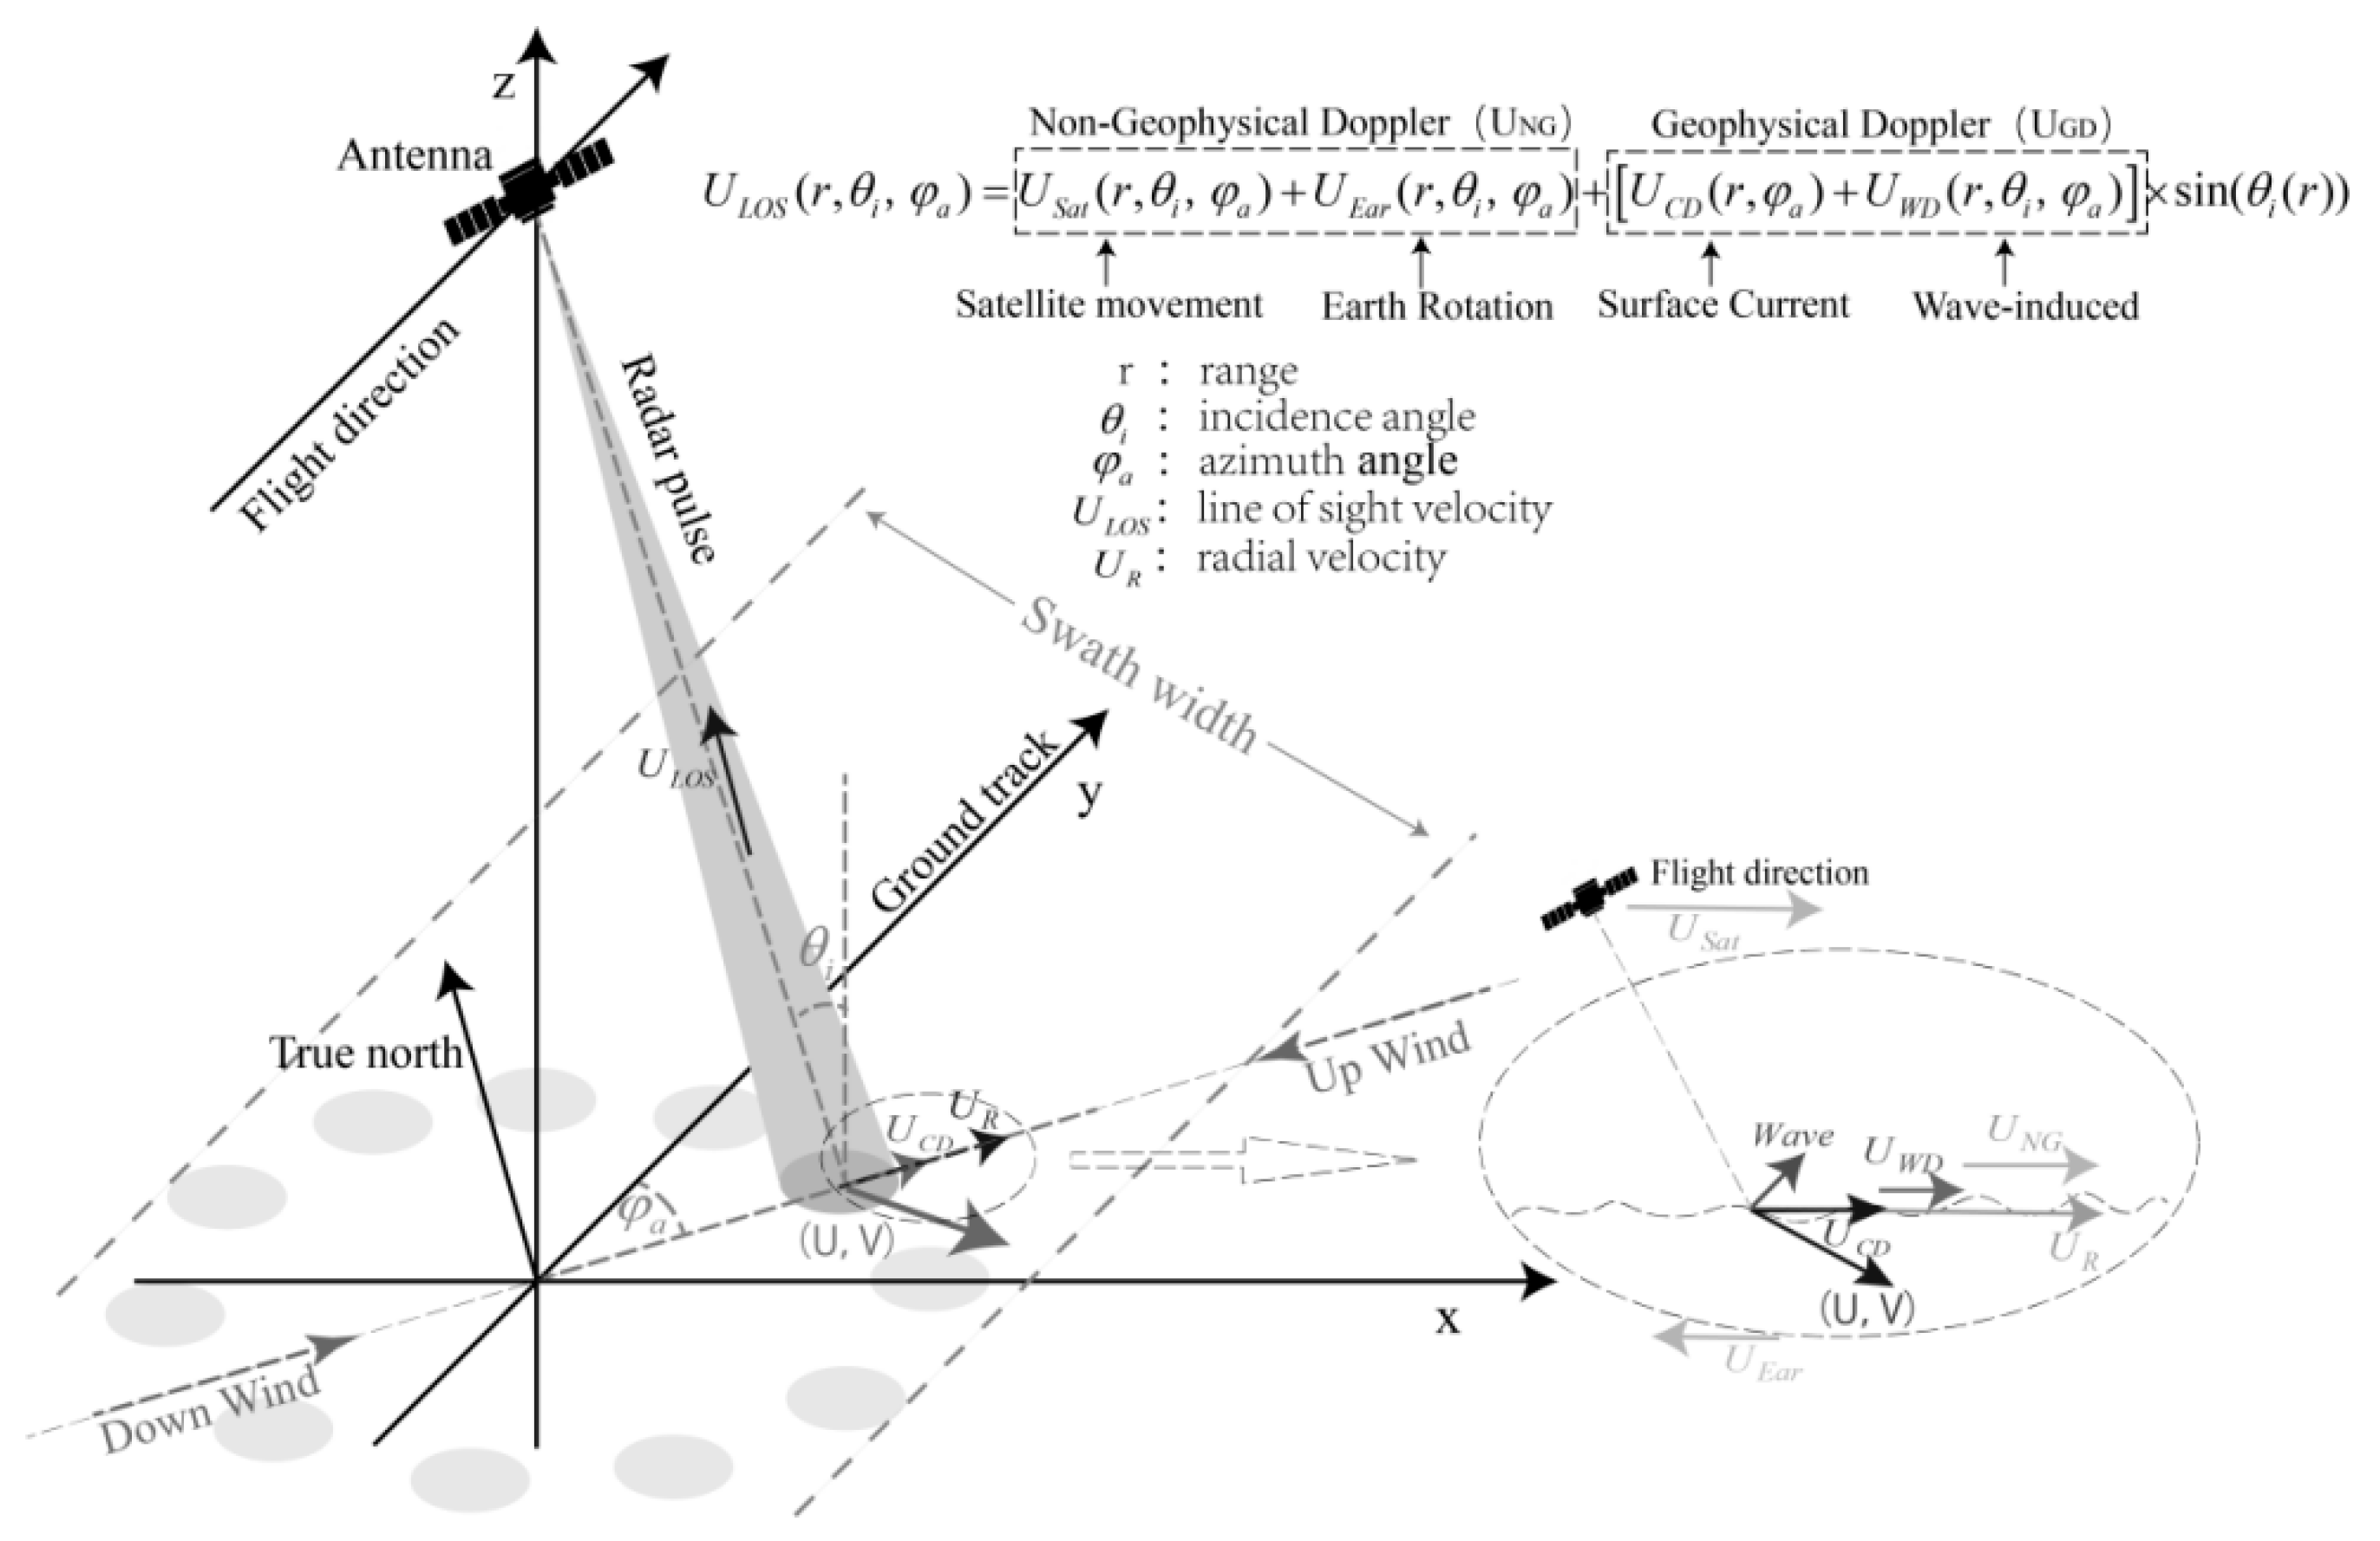
The schematic diagram of real-aperture radar interferometry is shown in Figure 1. The distance between the radar and the observed target at the moment t = 0 is r(t = 0), and the distance between the radar and the observed target at the moment t = τ is r(t = τ). The distance difference between the two moments is δr.

2.4. Wave-Induced Doppler Velocity

Using Equations (6)–(8), the Doppler shift in the LOS direction can be derived and used to retrieve sea surface motion. The total Doppler signal mainly consists of a non-geophysical part, fNG, and a geophysical part, fGD. Platform motion is the source of fNG and is mainly influenced by satellite motion and the rotation of the Earth; fGD mainly comes from sea surface motion, including currents and other fluctuations. To obtain the radial current velocity of the sea surface, the influence of other interfering factors needs to be filtered out. The interference phase difference due to the relative motion of the satellite is:
Φ p = 2 π V g sin ( θ i ) cos ( φ a ) P R F / c
where V g is the satellite ground velocity, θ i is the local electromagnetic vector incidence angle, and φ a is the antenna azimuth of pulse p. Removing the effect of its projection onto the ground after e i Φ p ( r ˜ ) , the final geophysical Doppler frequency f G D ( r ˜ ) is:
f G D ( r ˜ ) = P R F 2 π Arg [ E p ( r ˜ ) E * p + 1 ( r ˜ ) e i Φ p ( r ˜ ) p ]
The term Φ p ( r ˜ ) is only related to the geometry of the system and not to the geophysical signal. In this study, we focus on fGD and assume that accurate determination of fNG is possible via the precise control of satellite orbits and observation errors. The horizontal velocity UGD is determined from the geophysical Doppler frequency fGD [7]; UGD is the sum of UCD (the sea surface current, also known as the background current) and UWD (the wave-induced Doppler velocity, also known as the wave-induced bias); UWD has been expressed in terms of the mean velocity of the scattering surface and the effects from tilt modulation and hydrodynamic modulation of long waves [18,19]. For accurate retrievals of UCD, UWD must be accurately determined and removed [12].
A schematic diagram of the measurement of sea surface currents using a rotating beam radar system is given in Figure 2. The total apparent Doppler signal of the relative motion between the satellite and the sea surface is retrieved from the radar pulses. Doppler velocities not generated by currents are removed. Radial current velocities are calculated for each coordinate direction angle, and the two-dimensional current field is retrieved using antenna rotation. The experimental coordinate system takes the satellite flight direction as 0° and clockwise as the positive direction.

3. Simulation Experiments

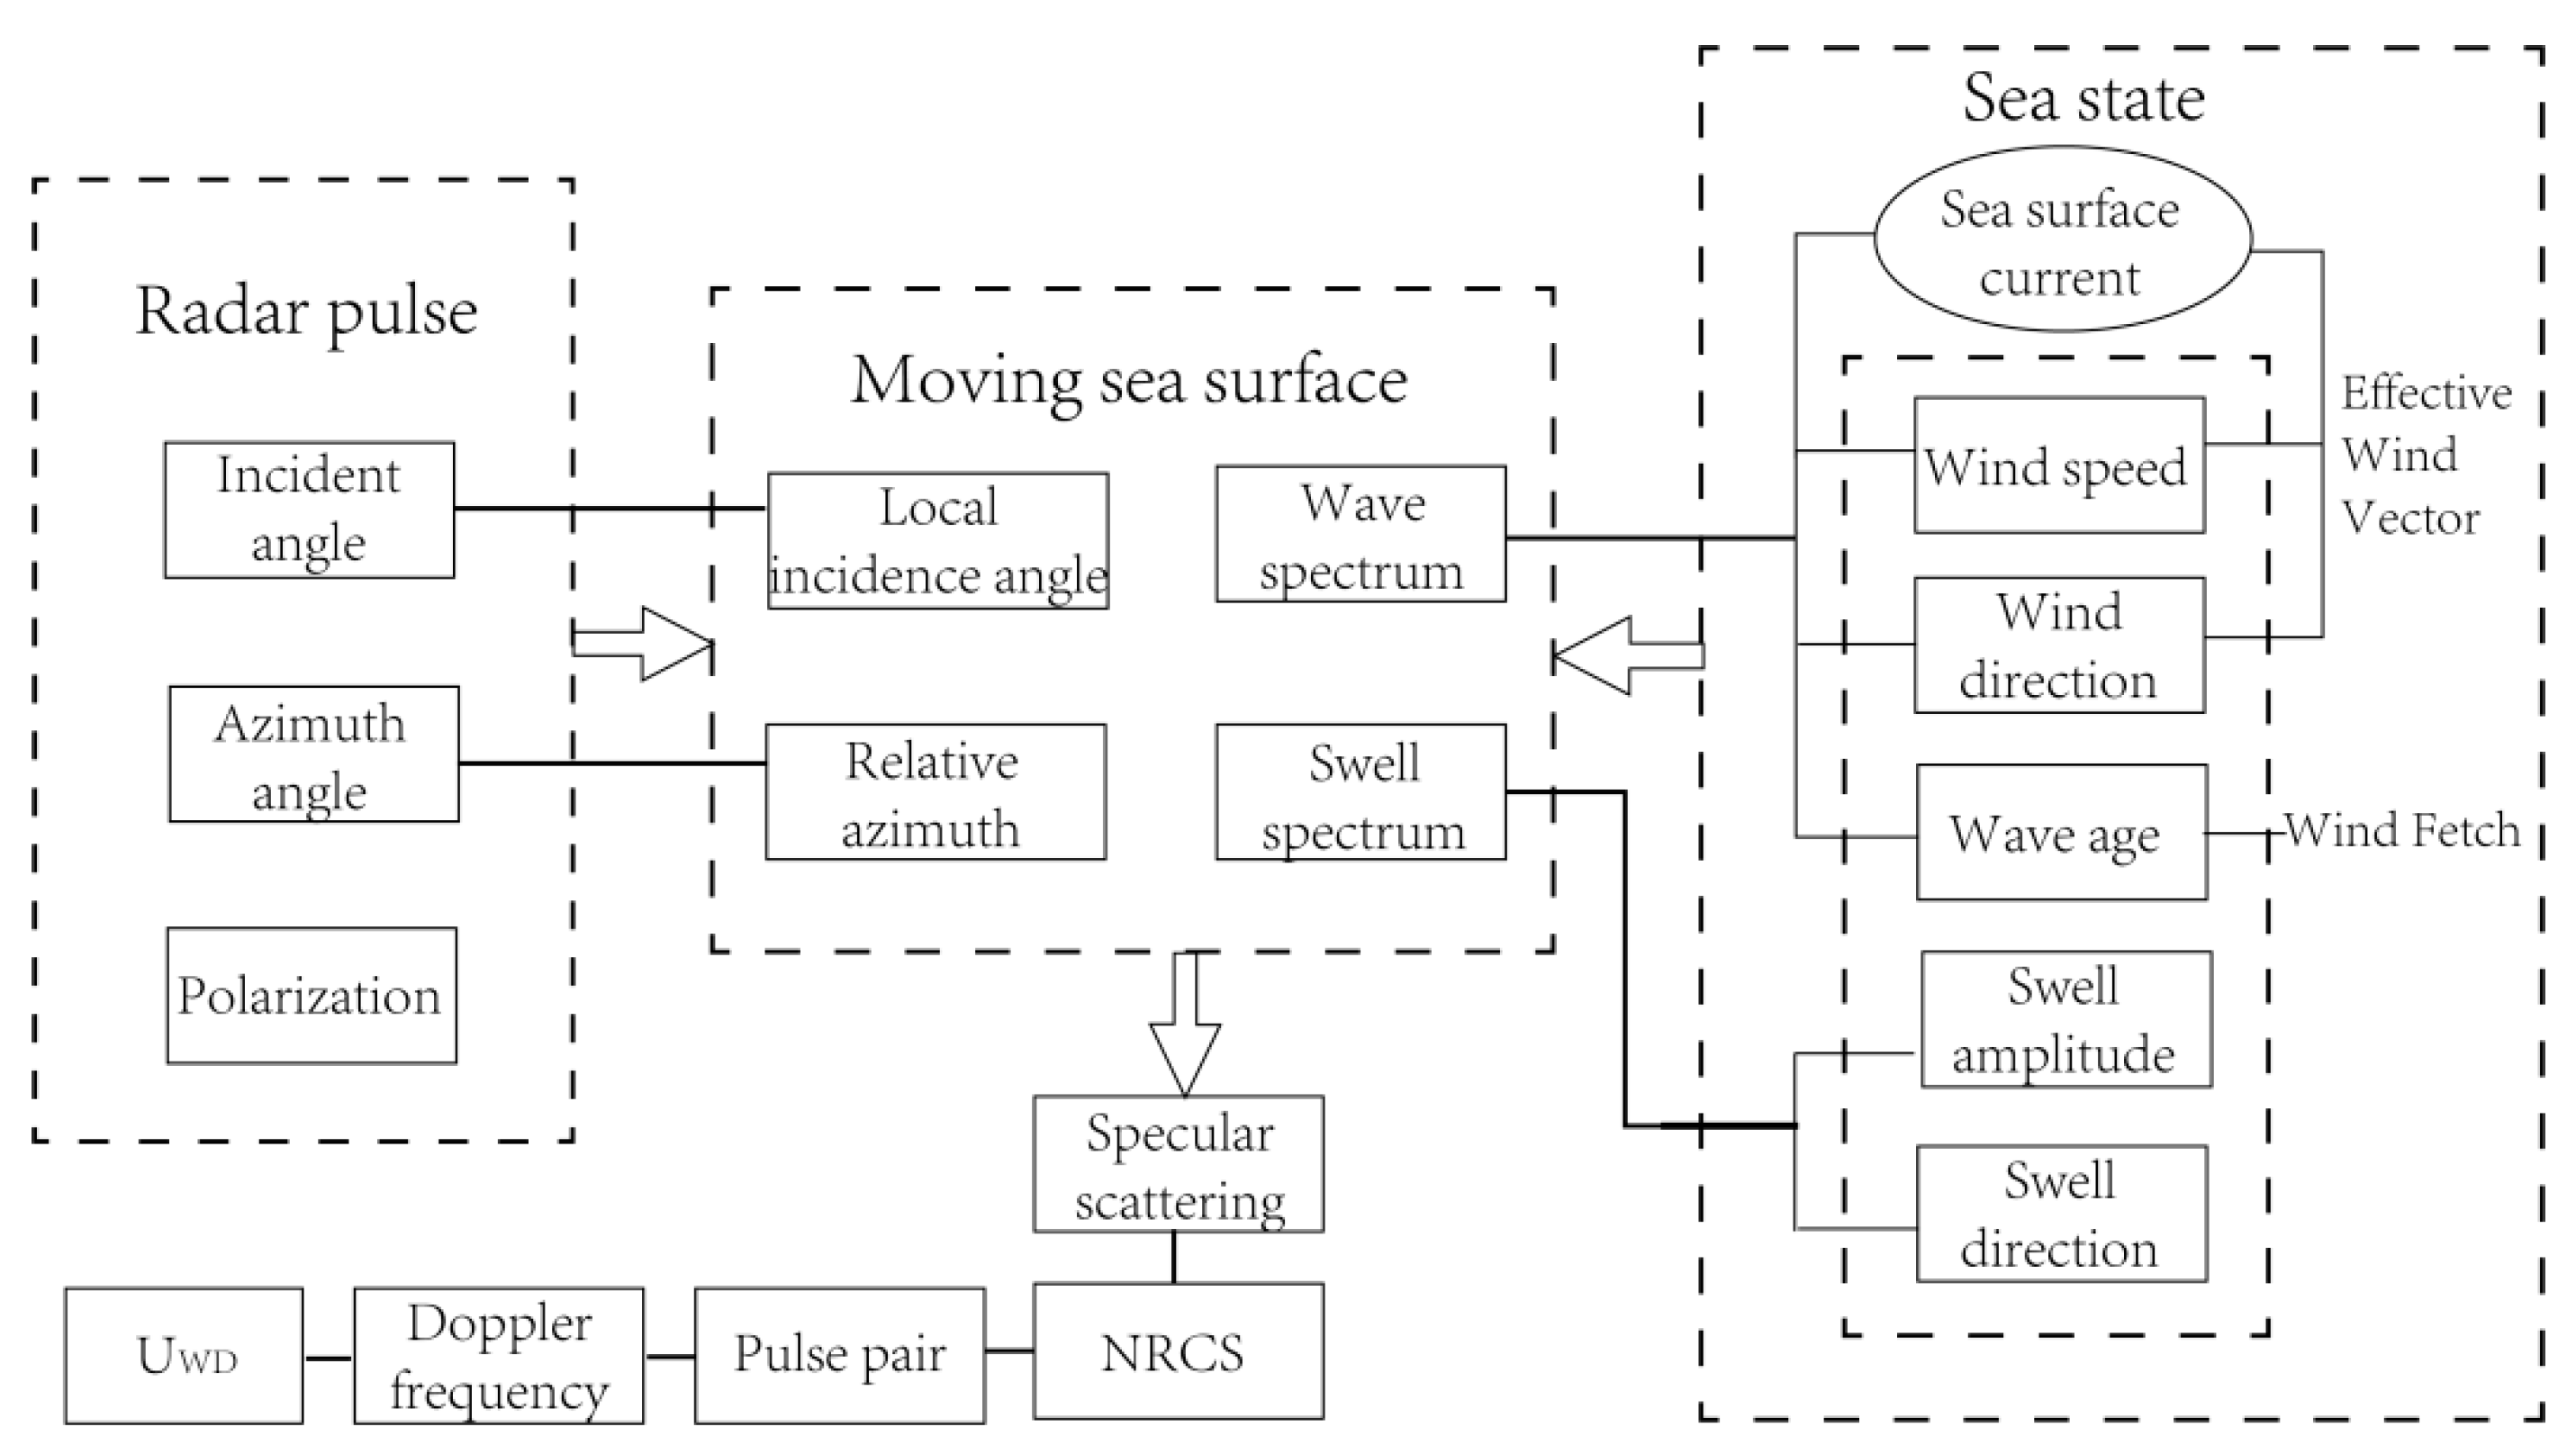
To study the sea surface Doppler characteristics of Ka-band small-incidence-angle real-aperture radar, we conducted a full process simulation of the dynamic sea surface, radar signals, and sea surface Doppler characteristics. We used the Elfouhaily spectrum to simulate the dynamic sea surface. Sea surface scattered echoes of the radar pulse and the interference phase between the pulse pairs were calculated. We calculated the pulse coherence coefficients and derived the Doppler velocities, which reflect the relative motion between the satellite and the sea surface. We calculated the UWD component of the total Doppler velocity. To analyze the influence of key radar parameters and sea-state parameters on UWD, different values of the parameters of the real-aperture radar rotating beam system (including polarization and incidence and azimuth angles) and sea-state parameter (including wind speed and age, swell scale, and surface currents affecting wave modulation) were considered. The simulation flowchart is shown in Figure 3.
The main simulation parameters are shown in Table 1.
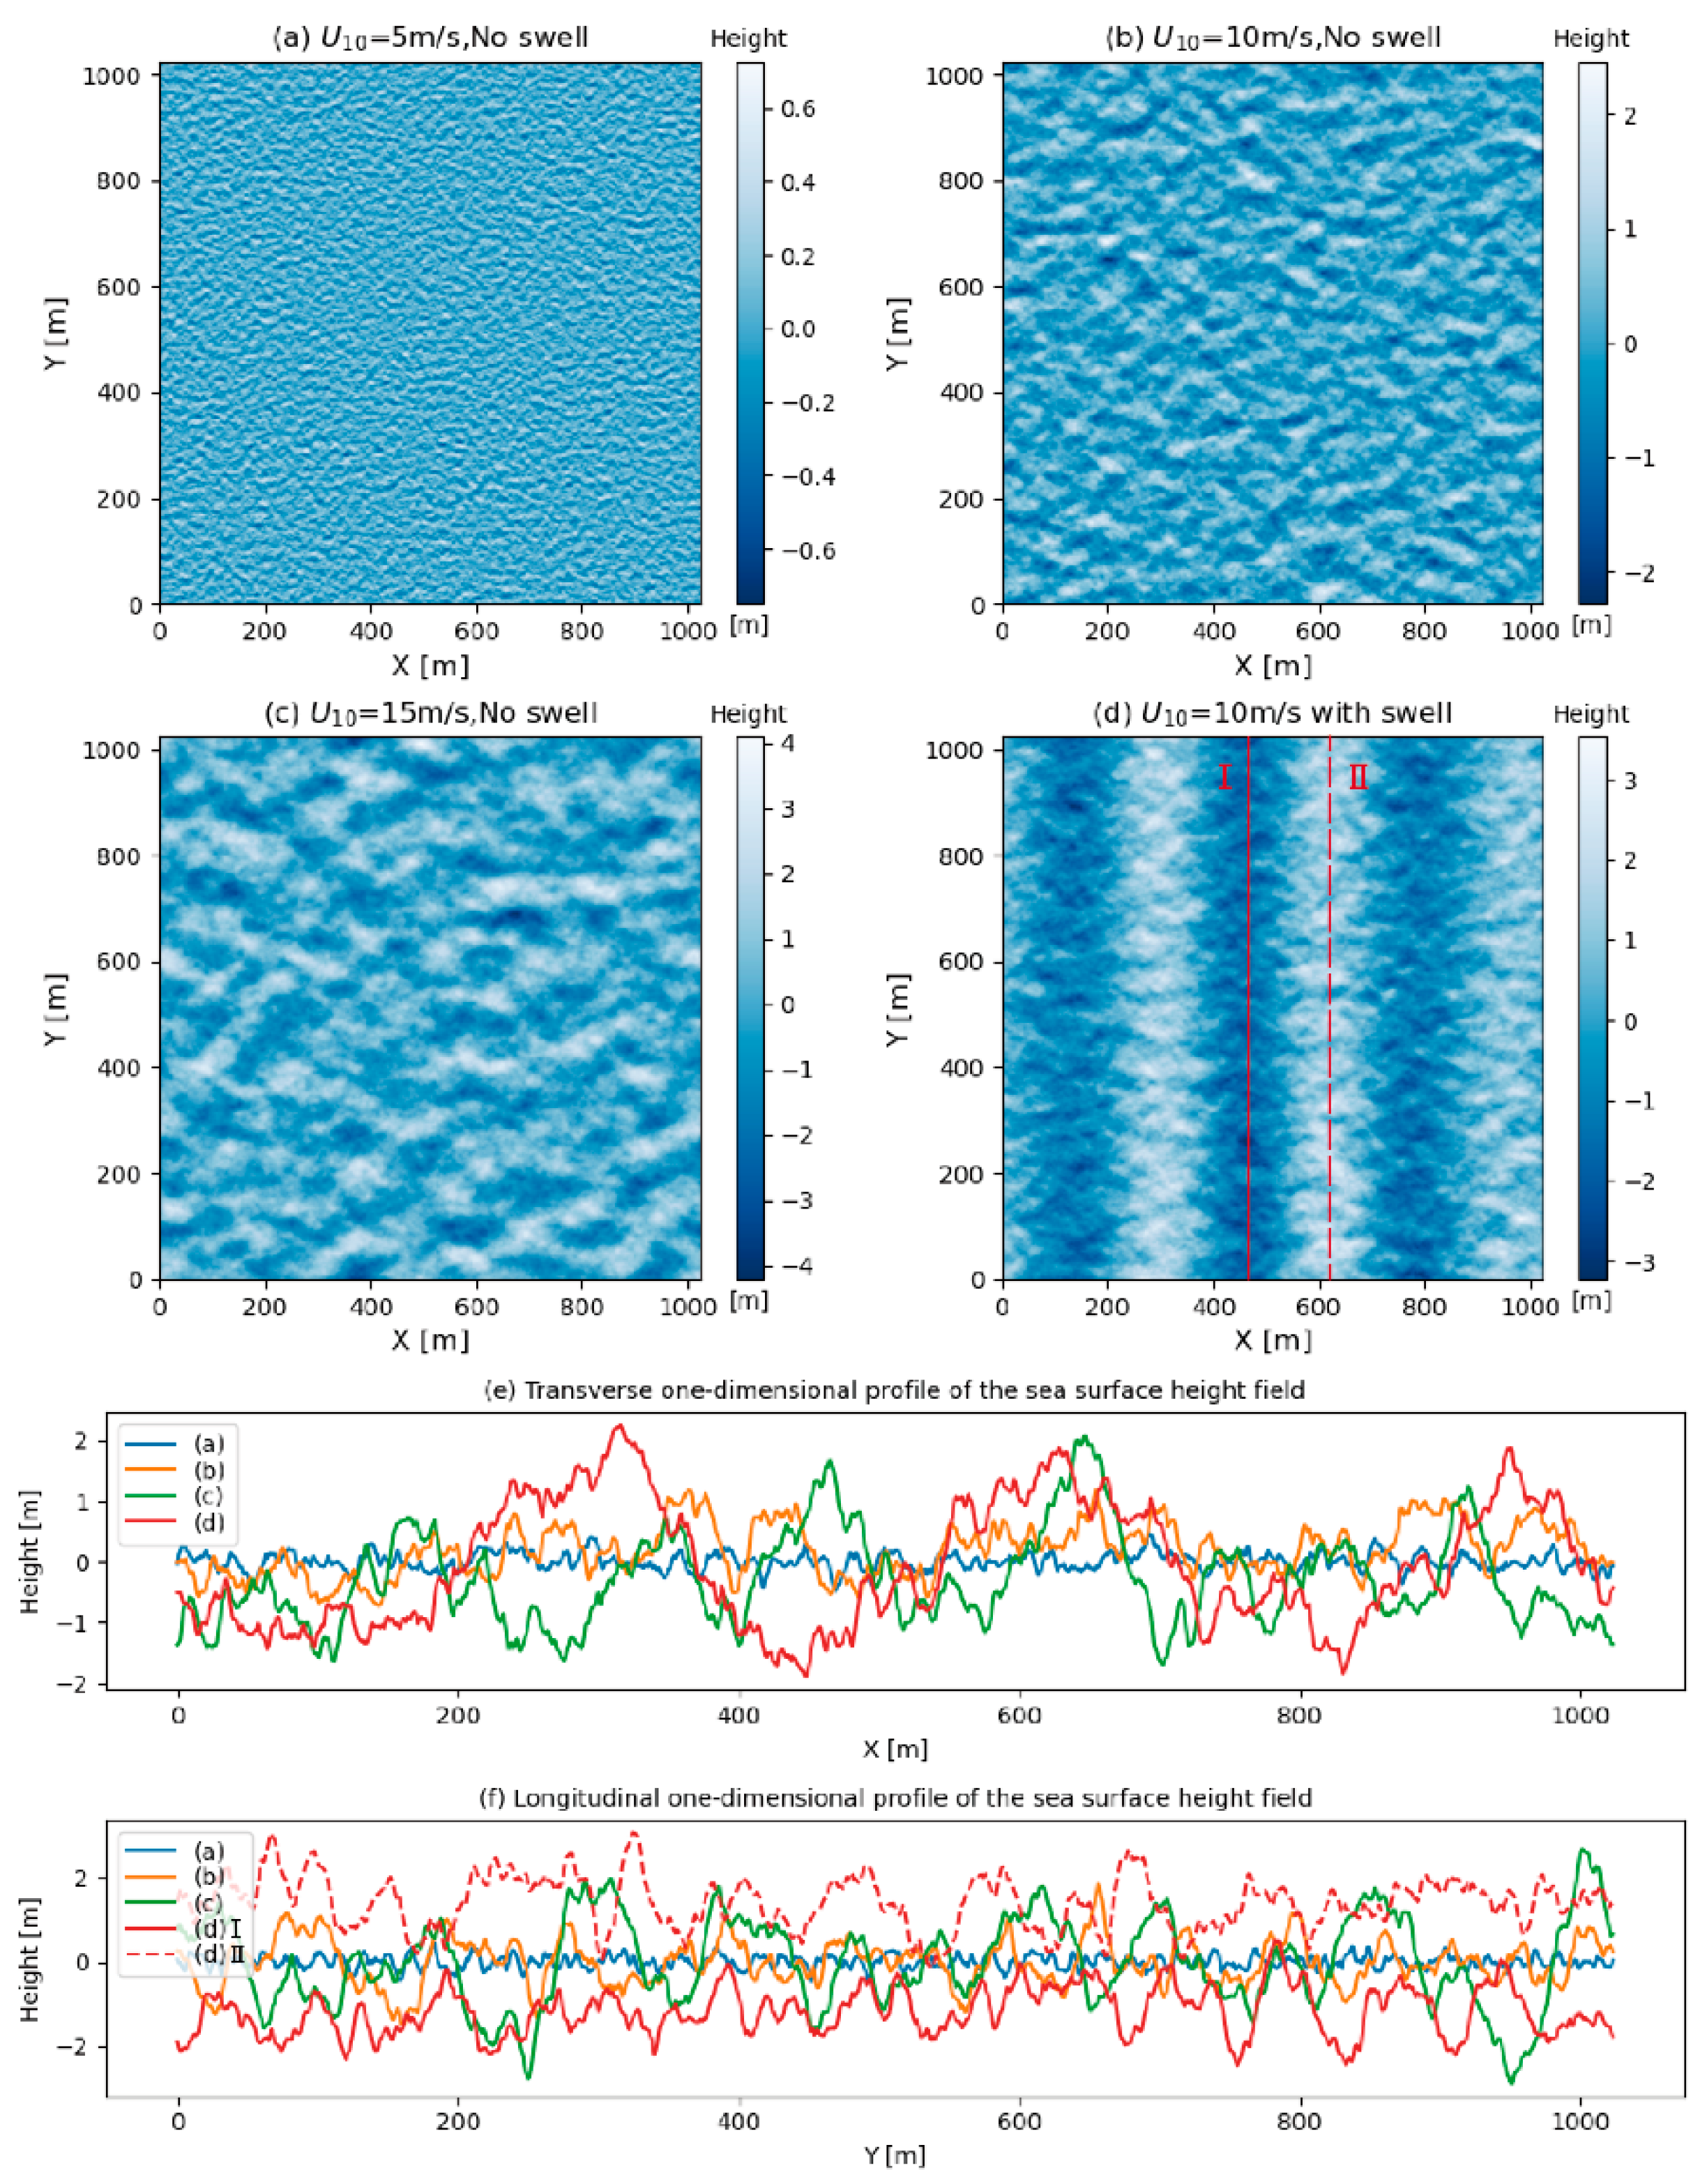
A random sea surface and different scenarios of wind speeds and swell were simulated (Figure 4). Figure 4a–d show the two-dimensional sea surface height field calculated from Equation (1). The simulated sea surface width is L x = L y = 1024   m , and the spatial sampling is d x = d y = 1   m . The wave spectrum is naturally truncated at k m i n = ( 2 π L x , 2 π L y ) and k m a x = ( 2 π 2 d x , 2 π 2 d y ) . Figure 4e,f are the one-dimensional profiles corresponding to the sea surface height field (a–d). The longitudinal profile in Figure 4d is truncated at the trough position and the crest position of the swell, respectively, while the other profiles are truncated in the middle of the two-dimensional image. In combination with the simulation of different sea conditions of the sea surface and its profile, it has been discovered that as the wind speed increases, the sea surface roughness increases, and the height undulation of the sea surface becomes more pronounced. According to the input spectrum equation [39], both long and short waves are affected by wind speed, and an increase in wind speed results in significant changes to the sea surface curvature spectrum and elevation spectrum, which impacts the simulation of the sea surface height field. The mean square slope (MSS) of the sea surface increases with the increase in wind speed, which is consistent with the fitting results obtained by Cox and Munk [48]. When a swell is present, the height undulation of the sea surface appears regular. The simulated output of the swell’s wave height and wavelength coincides with the input swell parameters. The sea surface height varies more dramatically when the swell is present, and the height at the crest of the swell is higher overall than the height at the trough (Figure 4f).
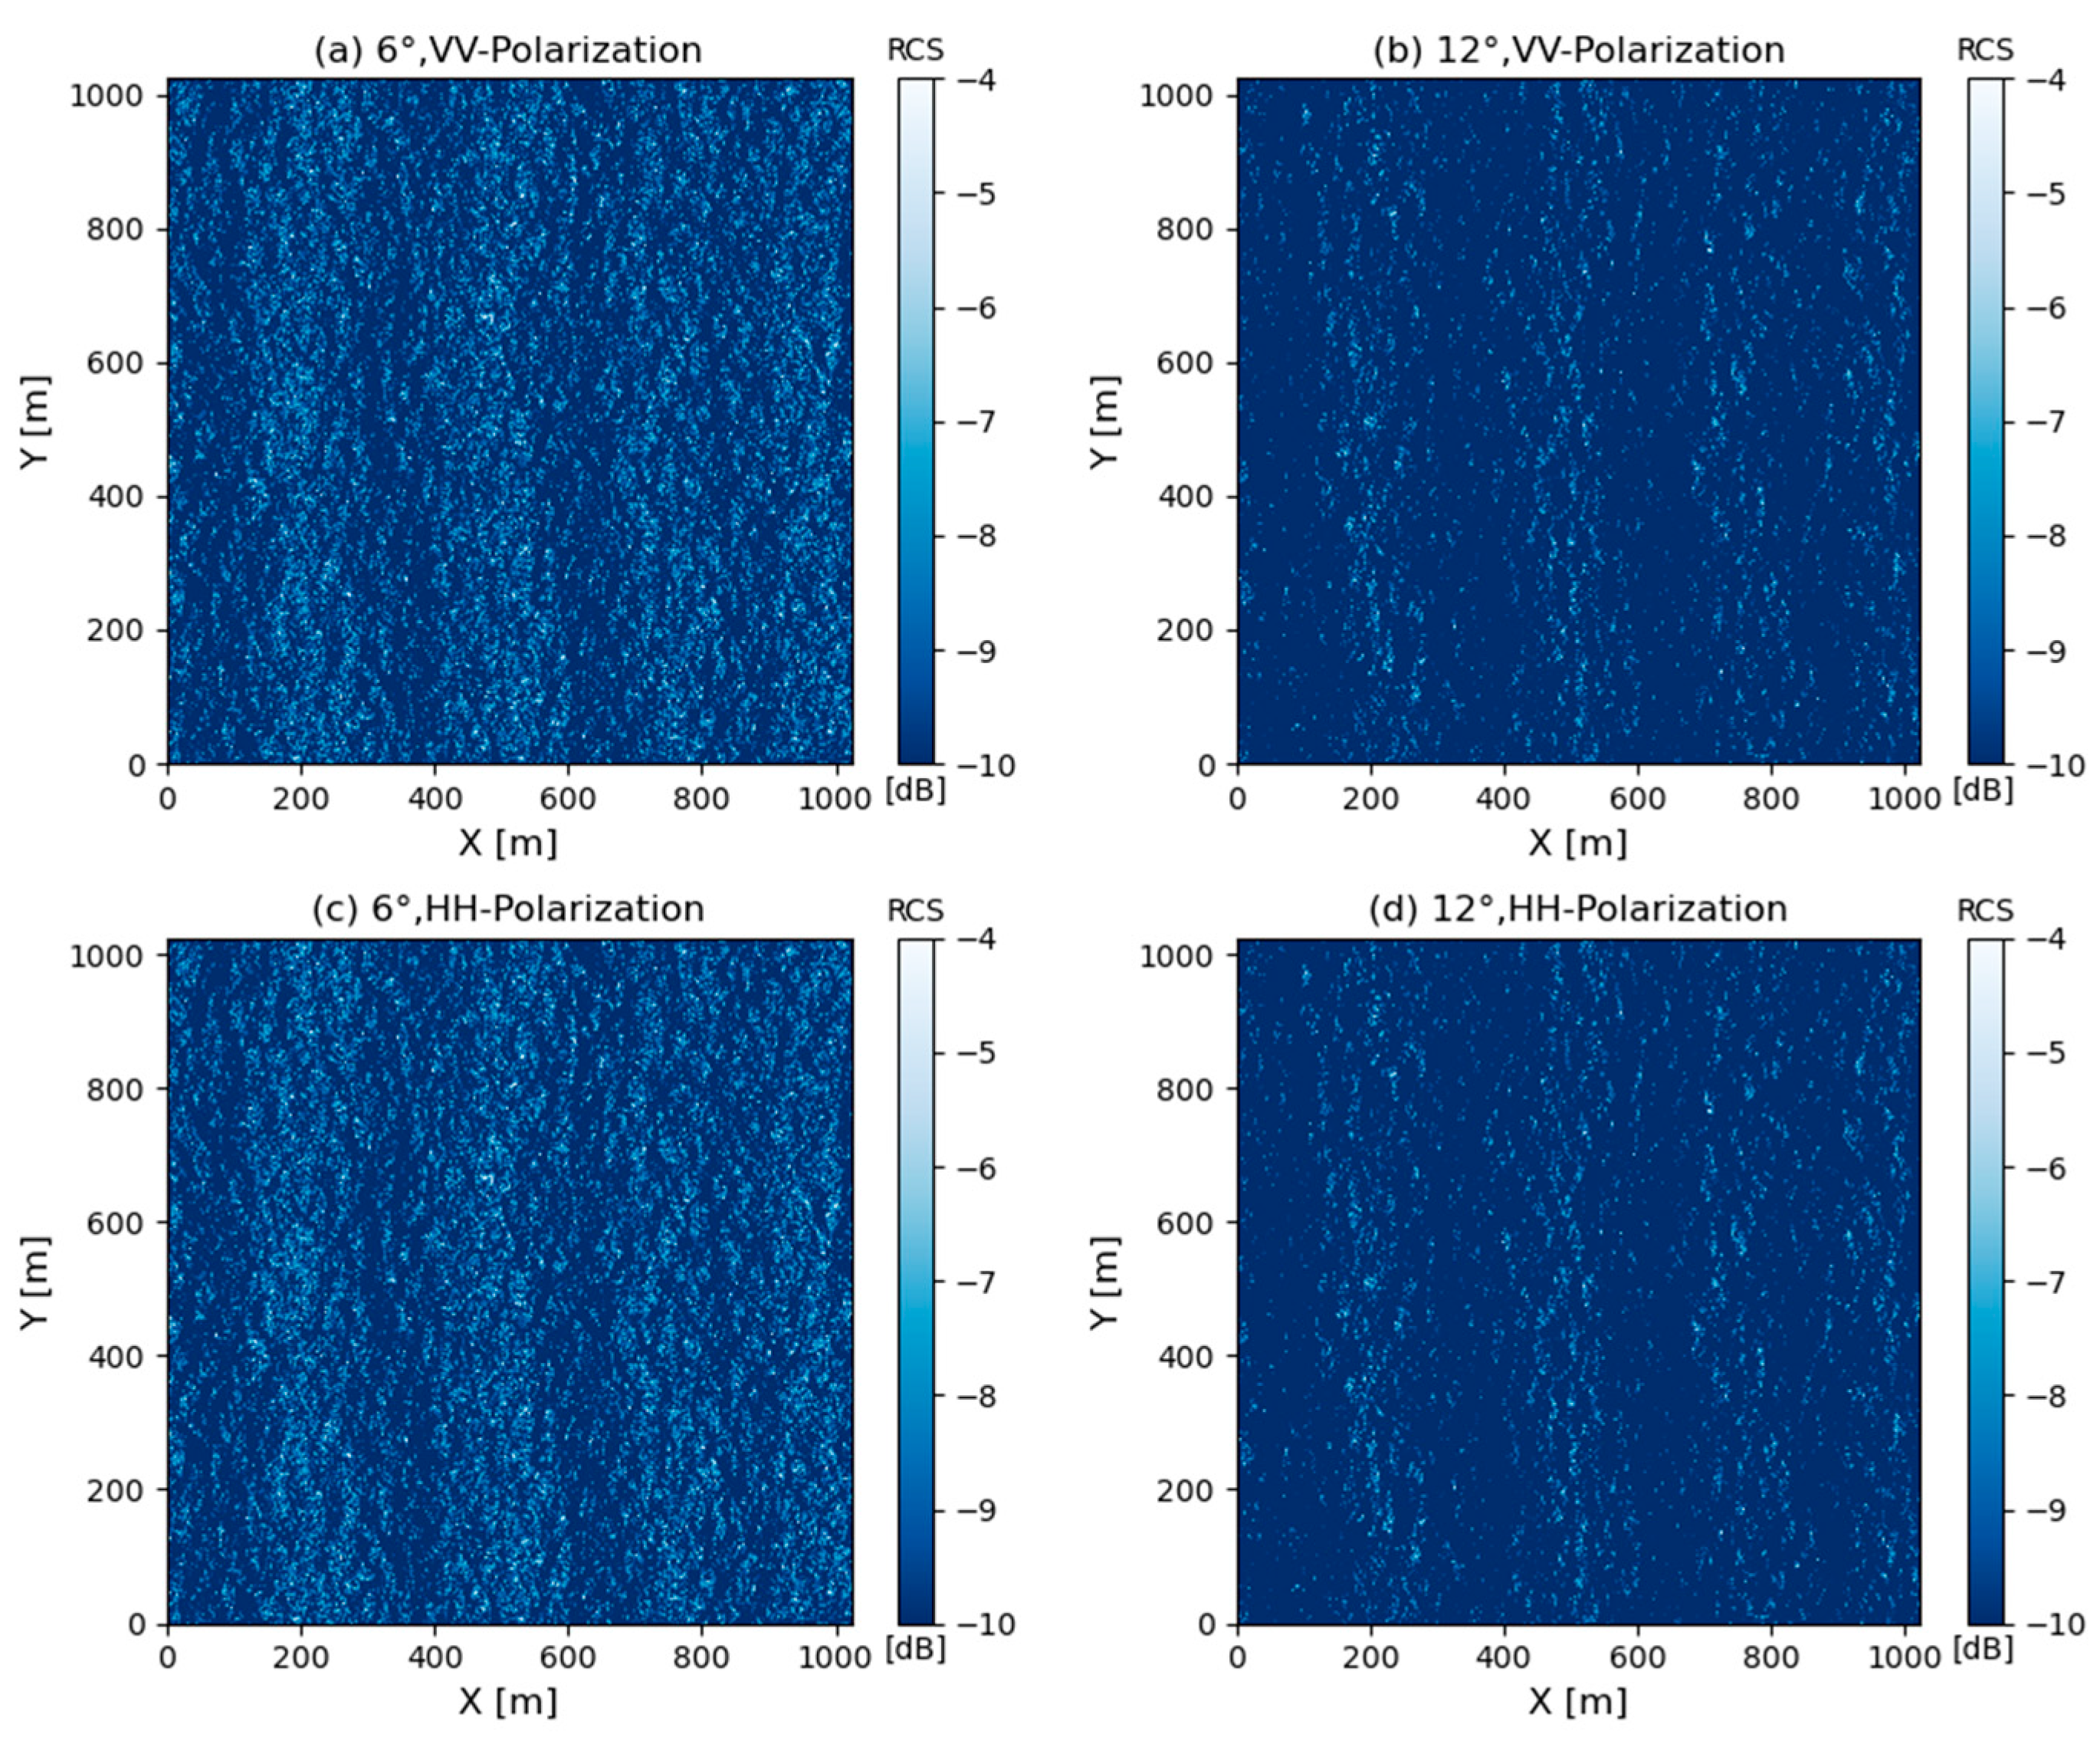
Because of the small incidence angle, backscattering at the sea surface is mainly dominated by specular scattering. Therefore, we calculated sea surface backscattering using the Kirchhoff approximation and SPA (as shown in Equation (5)) [45]. Figure 5 shows instantaneous backscattering coefficients for specular scattering. The backscattering energy at the sea surface at an incidence angle of 6° is larger than that at 12°. At 12°, scattering mainly occurs on the upslope surface of swell-induced undulations (facing the radar side). The number of specular scattering points at 12° is much smaller than that at 6°. There is little difference between the backscatter of VV polarization and that of HH polarization because there is only Bragg scattering and the tilted surface in the azimuth direction changes the position of the maximum response in the co-polarization signature. Maximum co-polarization response occurs when the antenna is at near vertical incidence [49]. For the small-incidence-angle condition in this study, the effect of specular scattering on the co-polarization response is not significant [44].
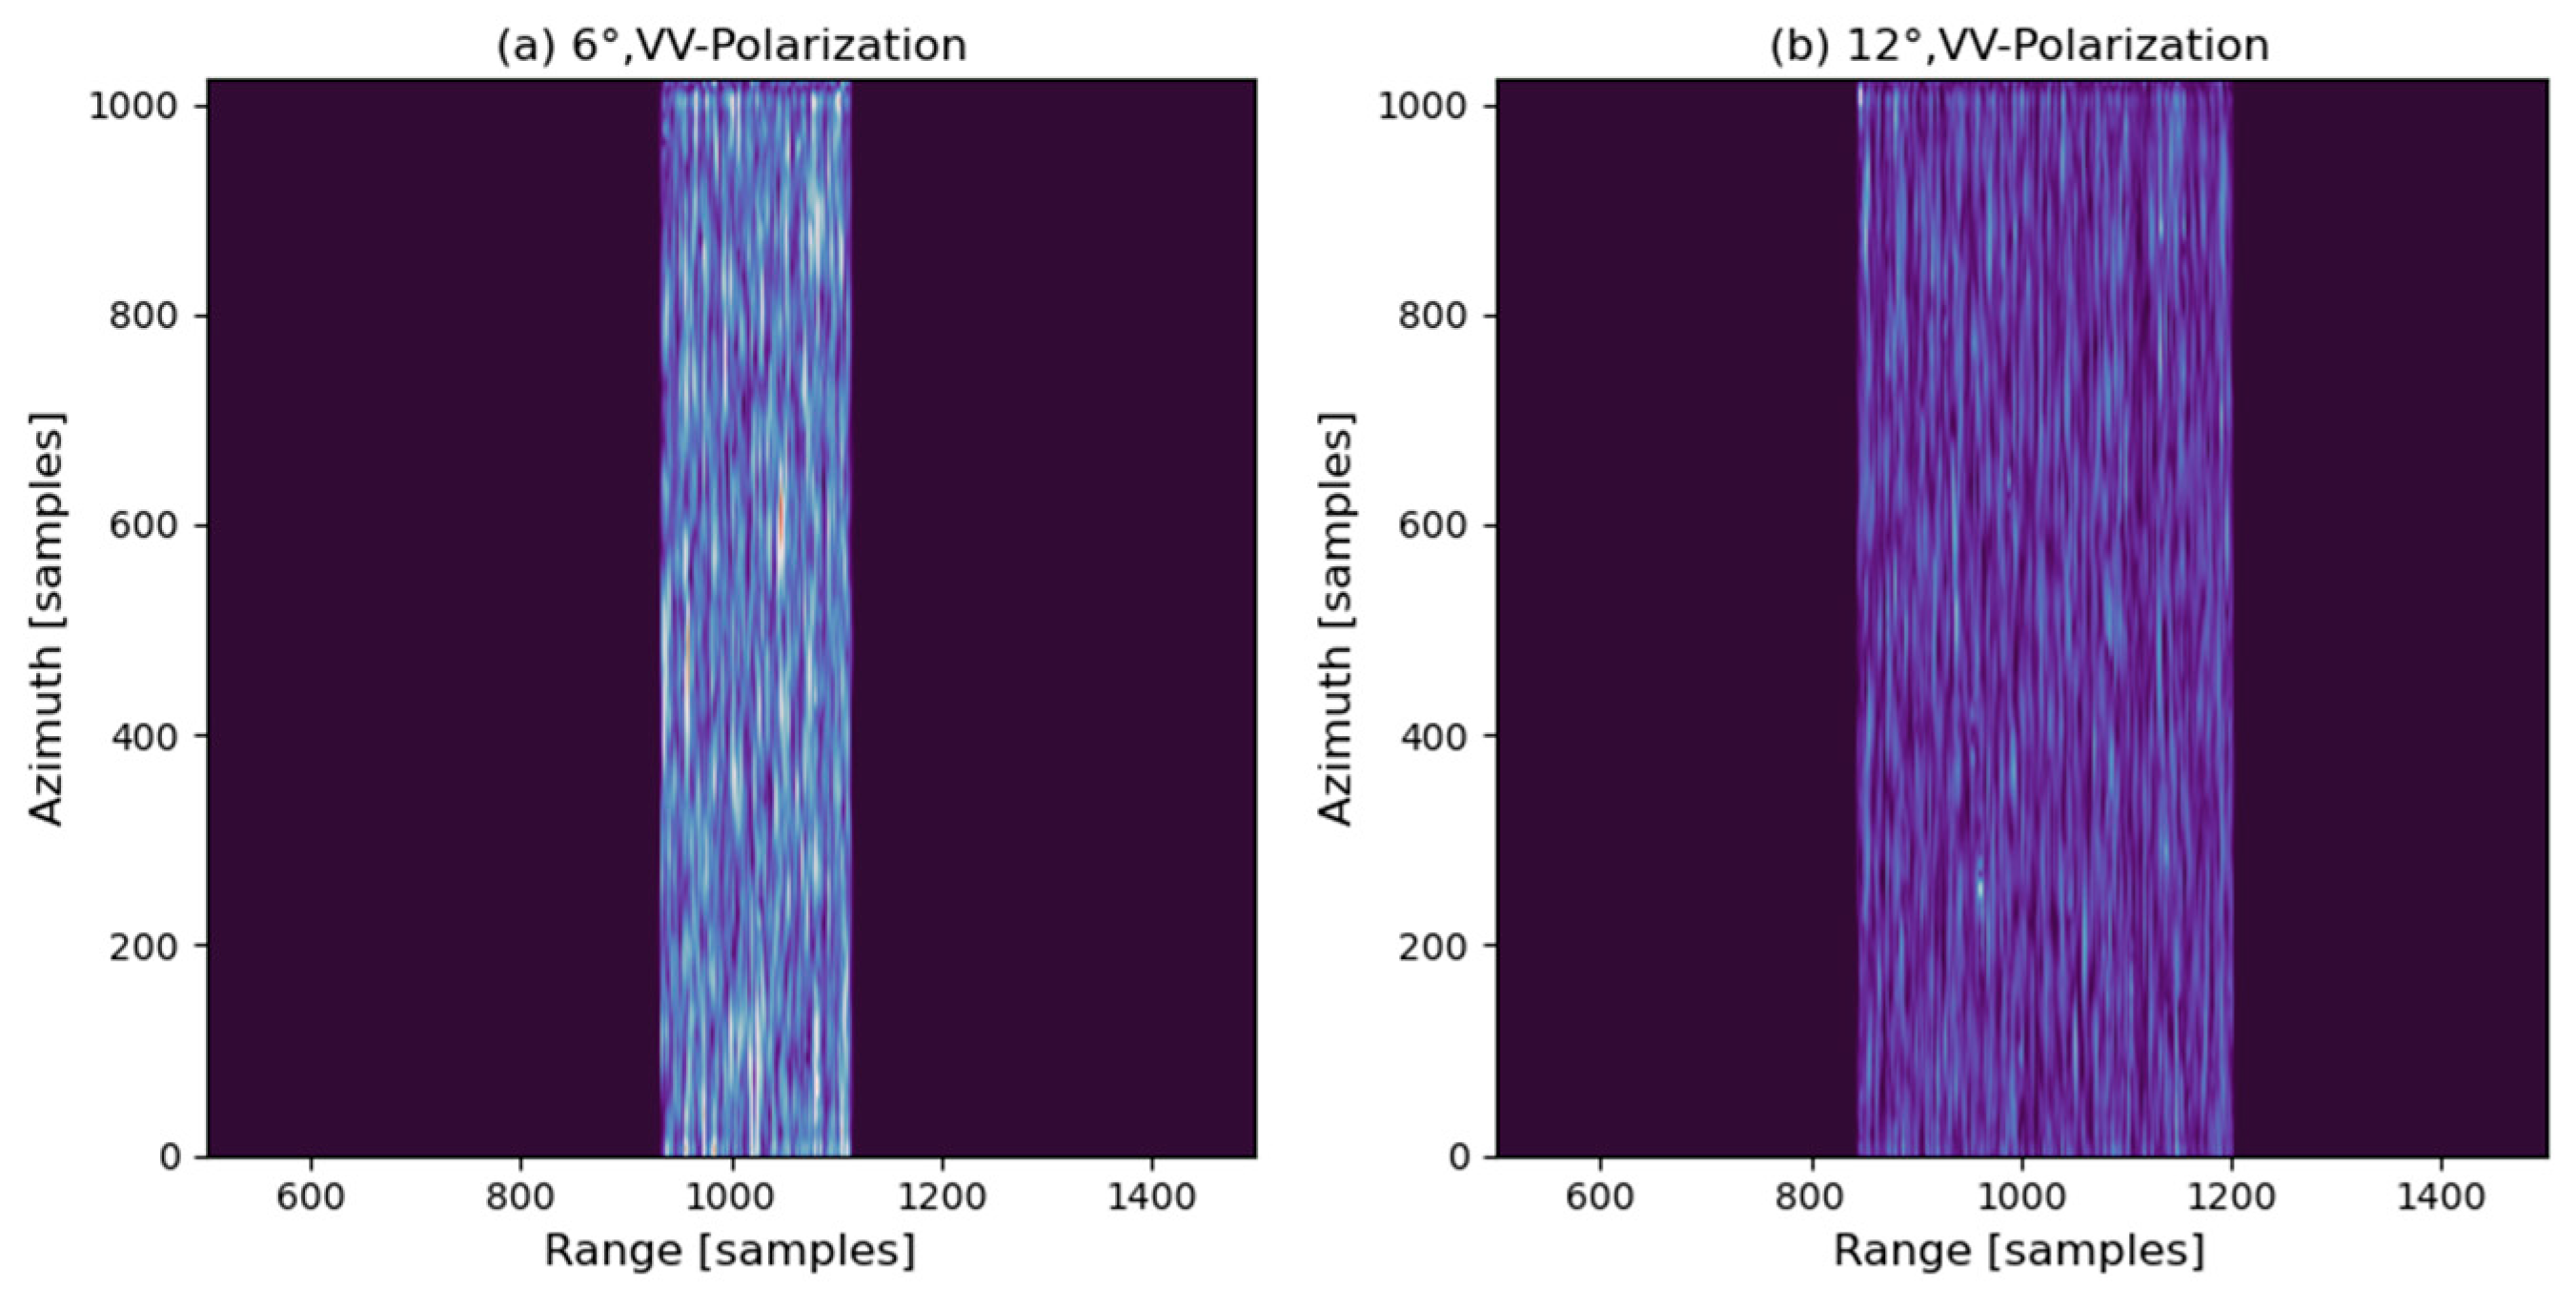
The backward scattering energy of the specular scattering point on the sea surface is accumulated to calculate the electromagnetic echo signal of radar pulse sea surface scattering, which is then stored in accordance with different pulse signals to obtain the original complex data intensity image, as depicted in Figure 6. The azimuth direction is 1024 pulses, and the range direction is 2048 sampling points.

4. Results

4.1. Coherence Analysis of Pulse Pairs

Using the phase information between pulse pairs to retrieve sea surface motion requires sufficient coherence between the pulses [6]. The accuracy of the estimate of the interferometric phase difference between pulse pairs is directly related to the coherence coefficient. A large coefficient is associated with high accuracy in the estimates. The coherence coefficient is derived as follows:
C o h e r e n c e = E p ( r ˜ ) E * p + 1 ( r ˜ ) p E p ( r ˜ ) E p ( r ˜ ) p · E p + 1 ( r ˜ ) E p + 1 ( r ˜ ) p
Following Bao et al. [50], the coherence coefficient was reformulated as the product of several four items:
C o h e r e n c e = γ thermal · γ footprint · γ spatial · γ temporal
where γthermal is decorrelation due to additive noise in the signal, γfootprint is decorrelation due to differences in the regions covered by the footprint of the satellite, γspatial is decorrelation due to differences in the observation geometry, and γtemporal is decorrelation due to changes in surface scattering characteristics. In this study, we disregard the impact of instrument thermal noise. For a number of additional decorrelation coefficients, we primarily evaluate the variations in radar azimuth and incidence angles, as well as wind speed, a crucial element influencing the sea surface roughness.
To ensure the reliability of the experimental data, the coherence of radar pulses was calculated for different radar and sea-state parameter values. The effects of incidence and azimuth angles and wind speed on pulse coherence coefficients were analyzed. In addition, owing to the random movements of the sea surface, large random fluctuations within a single group of data are present, and the number of independent samples is also an important factor that affects the interference phase difference. Therefore, to improve the accuracy of interference phase difference estimates, we constructed several random sea surfaces and calculated the average values of multiple continuous pulses on the same sea surface. The experimental results are taken from the average of 1023 pulse pairs (paired combinations of adjacent pulses) calculated under 100 random sea surfaces.

4.1.1. Effect of Radar Incidence and Azimuth Angles on Pulse Pair Coherence

Figure 7 shows the effects of radar azimuth and incidence angles on pulse coherence coefficients. Coherence coefficients vary sinusoidally with azimuth angles; they are large at 0–180°, very small at 90–270°. The correlation coefficient variation curves were basically the same at the incidence angles of 6°, 9°, and 12°, while the correlation coefficient was significantly smaller at the incidence angle of 15° (Figure 7a). The overall change in coherence coefficient is negligible, and the magnitude of change is 0.01. For a radar azimuth and wind direction of 0°, the coherence coefficient increases with the incidence angle, peaks at around 6°, and then decreases as the incidence angle increases beyond 6° (Figure 7b). Coherence coefficient variations at a wind speed of 5 m/s are larger than those at ≥10 m/s; the rate of the coherence coefficient decrease increases considerably at incidence angles of >10°. At 13°, the coherence coefficient at 5 m/s is lower than that at 10 m/s. For small incidence angles (1–15°), the overall change in the coherence coefficient at wind speeds of 5–20 m/s is negligible and is in the order of 0.001.

4.1.2. Effect of Wind Speed on Pulse Pair Coherence

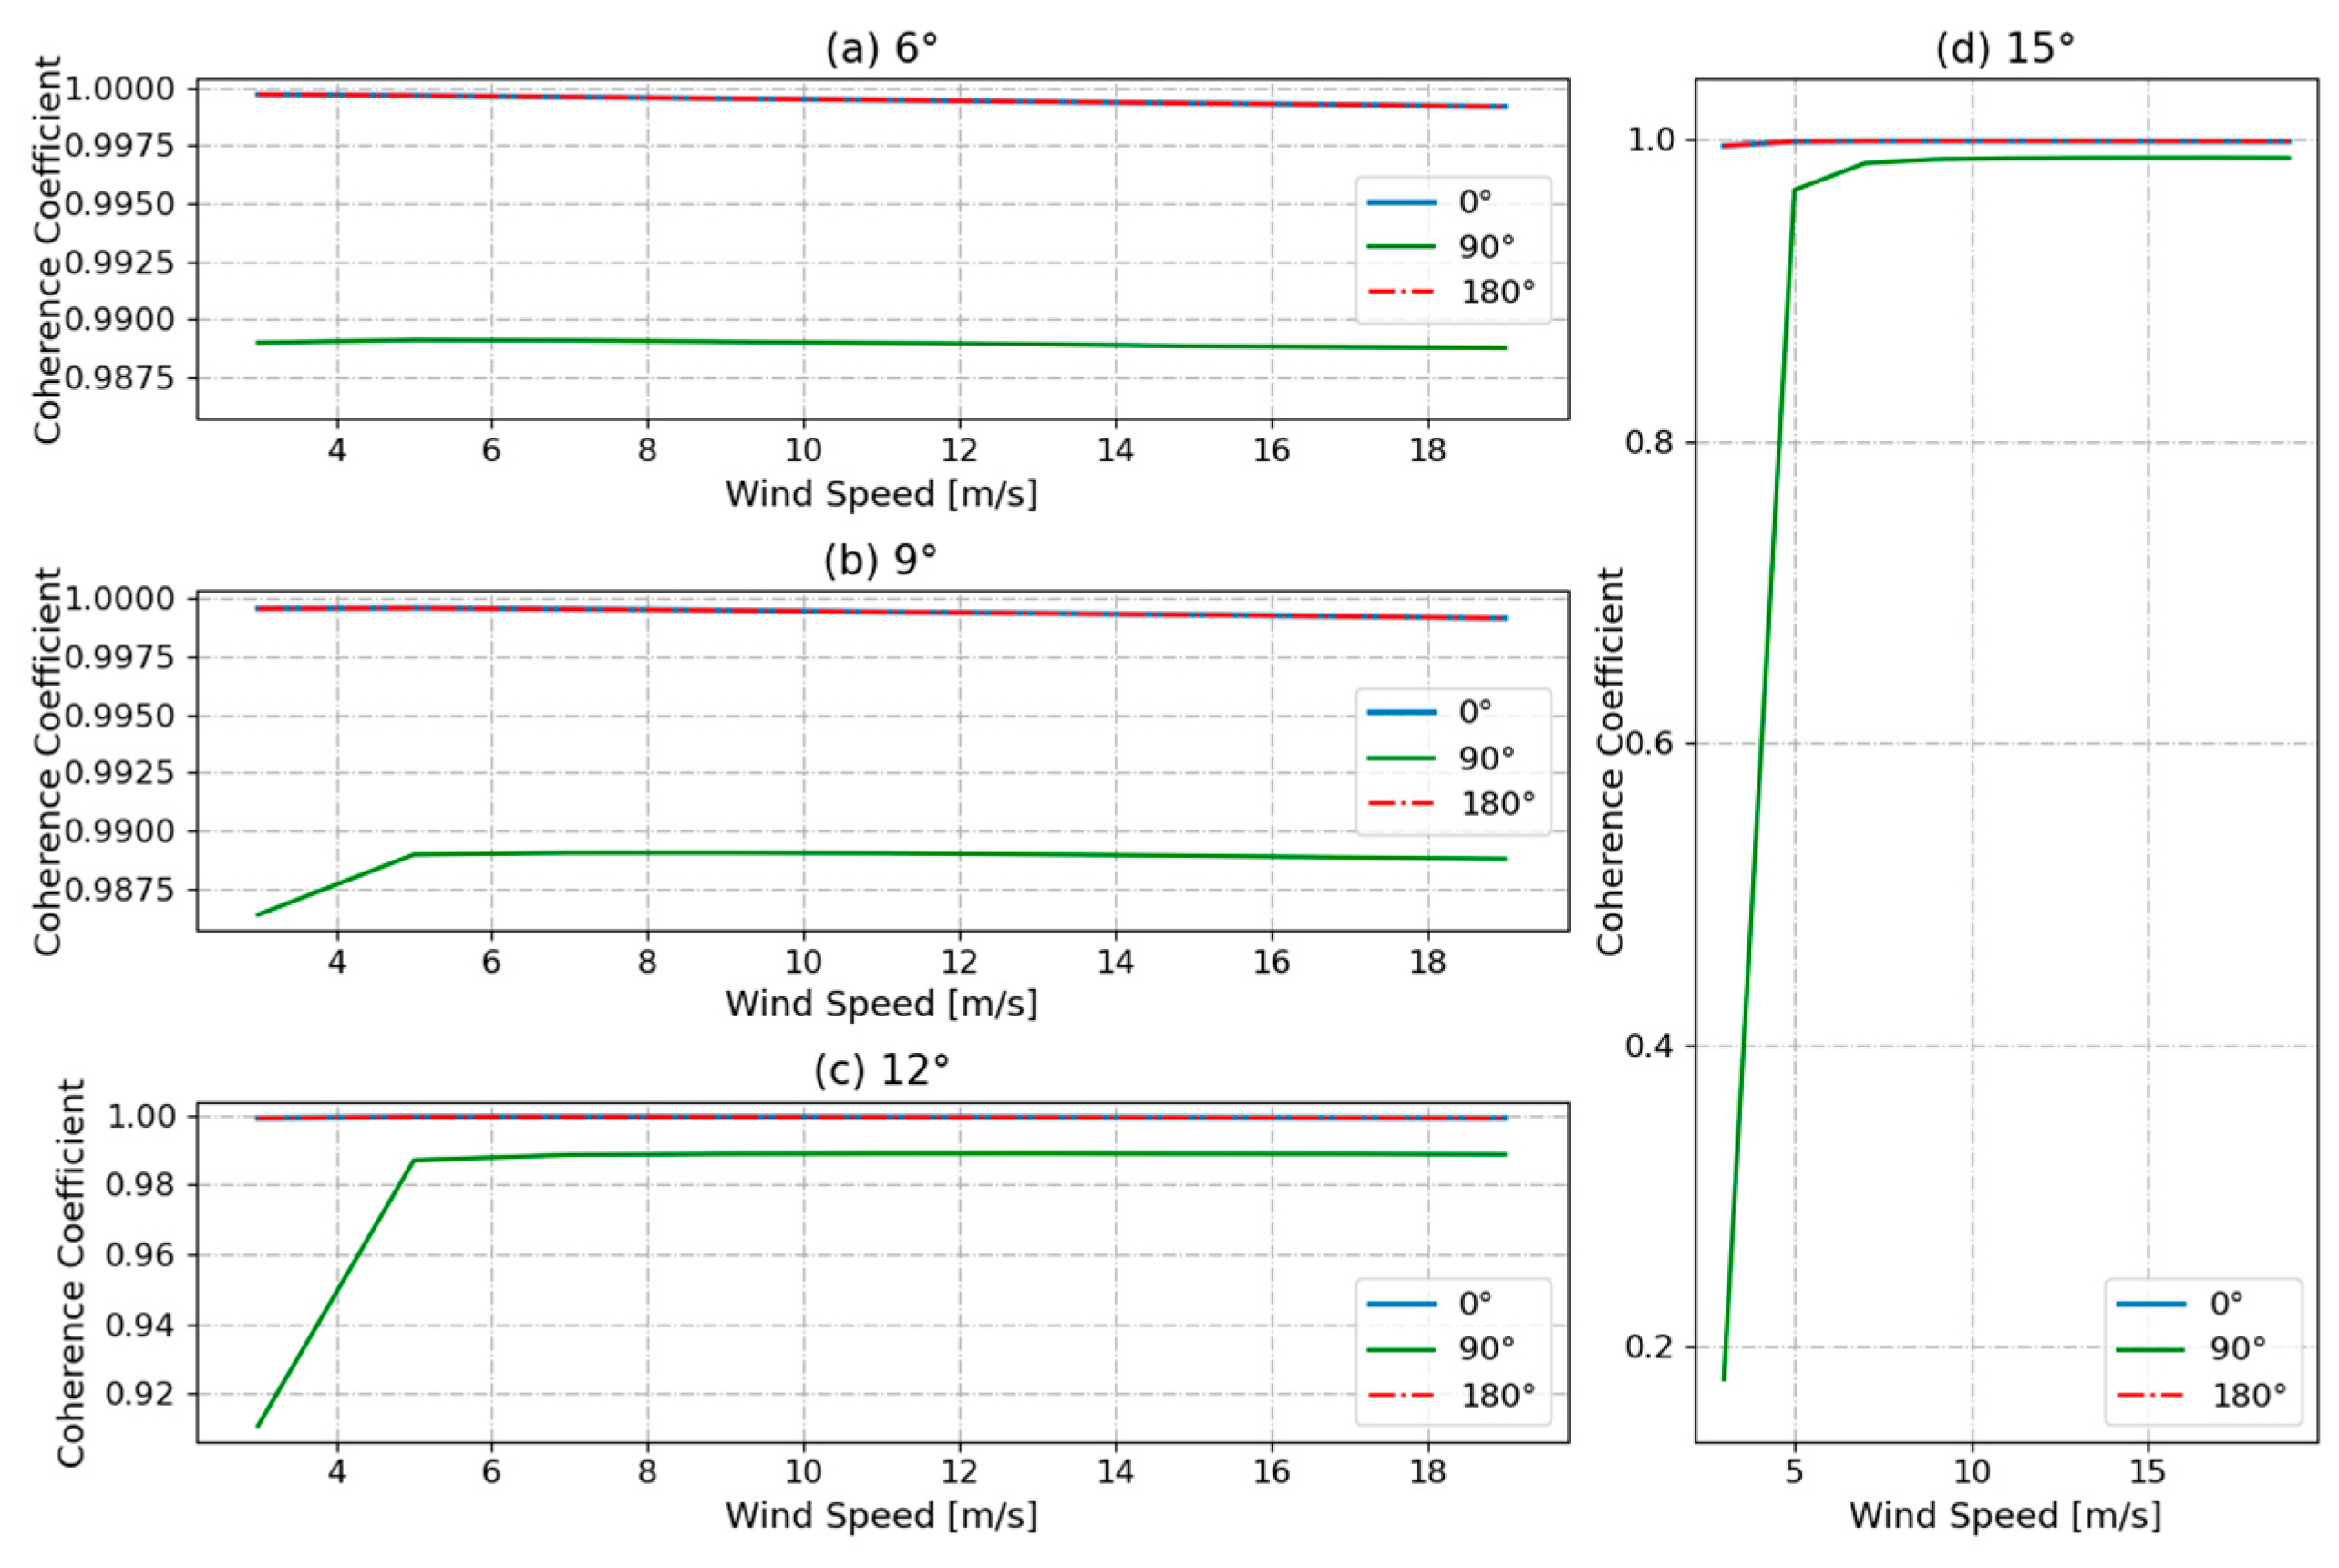
We analyzed the effect of wind speed on the coherence coefficient. Figure 8 shows the variation in coherence coefficient with wind speed at incidence angles of 6°, 9°, 12°, and 15°, wind speeds of 3–19 m/s, and relative wind directions of 0°, 90°, and 180°. There is little difference between the coherence coefficients in the upwind and downwind directions. The variation in the coherence coefficient with wind speed is small; the magnitude of change is only 0.001. The overall coherence coefficients for crosswind are lower than those for upwind and downwind. At large incidence angles and low wind speeds, coherence coefficients decrease considerably; the magnitude of the rate of change increases substantially as the incidence angle increases. At an incidence angle of 15°, the coherence coefficient corresponding to a wind speed of 3 m/s is below 0.2. Low wind speed is associated with a calm sea surface; increase in incidence angle lowers specular scattering energy and results in low pulse coherence. Therefore, radar incidence angle needs to be sufficiently small, and the influence of wave vertical motion and that of backscattering on pulse coherence should be considered.
In summary, the pulse coherence coefficient changes with radar incidence and azimuth angles and wind speed. Overall coherence is high. Coherence coefficients are below 0.98 only at low crosswind speed and large incidence angle. Therefore, we conclude that the Doppler frequency of the moving sea surface can be accurately acquired from radar pulses.
The effects of key radar and sea-state parameters on UWD are discussed in Section 4.2 and Section 4.3. According to Equations (6)–(8) and Figure 2, the key radar parameters are incidence angle θi and azimuth angle φa, and the key sea-state parameters are wind and swell parameters that affect sea surface roughness and determine sea surface motion.

4.2. Effect of Radar Parameters on Wave-Induced Doppler Velocity

For pulsed radar systems, spatial coverage and sensitivity to sea surface motion are affected by the parameters of the system itself. We analyzed the effect of radar incidence and azimuth angles on the UWD of the Ka-band radar rotating beam system.

4.2.1. Effect of Radar Azimuth Angle on Wave-Induced Doppler Velocity

At least two azimuthal observations are required to retrieve the two-dimensional sea surface current field using the interferometric phase of the radar [2,26,27,50]. As the rotating beam system needs to make measurements at multiple azimuth angles, the ability of the rotating antenna to work at different angles needs to be considered.
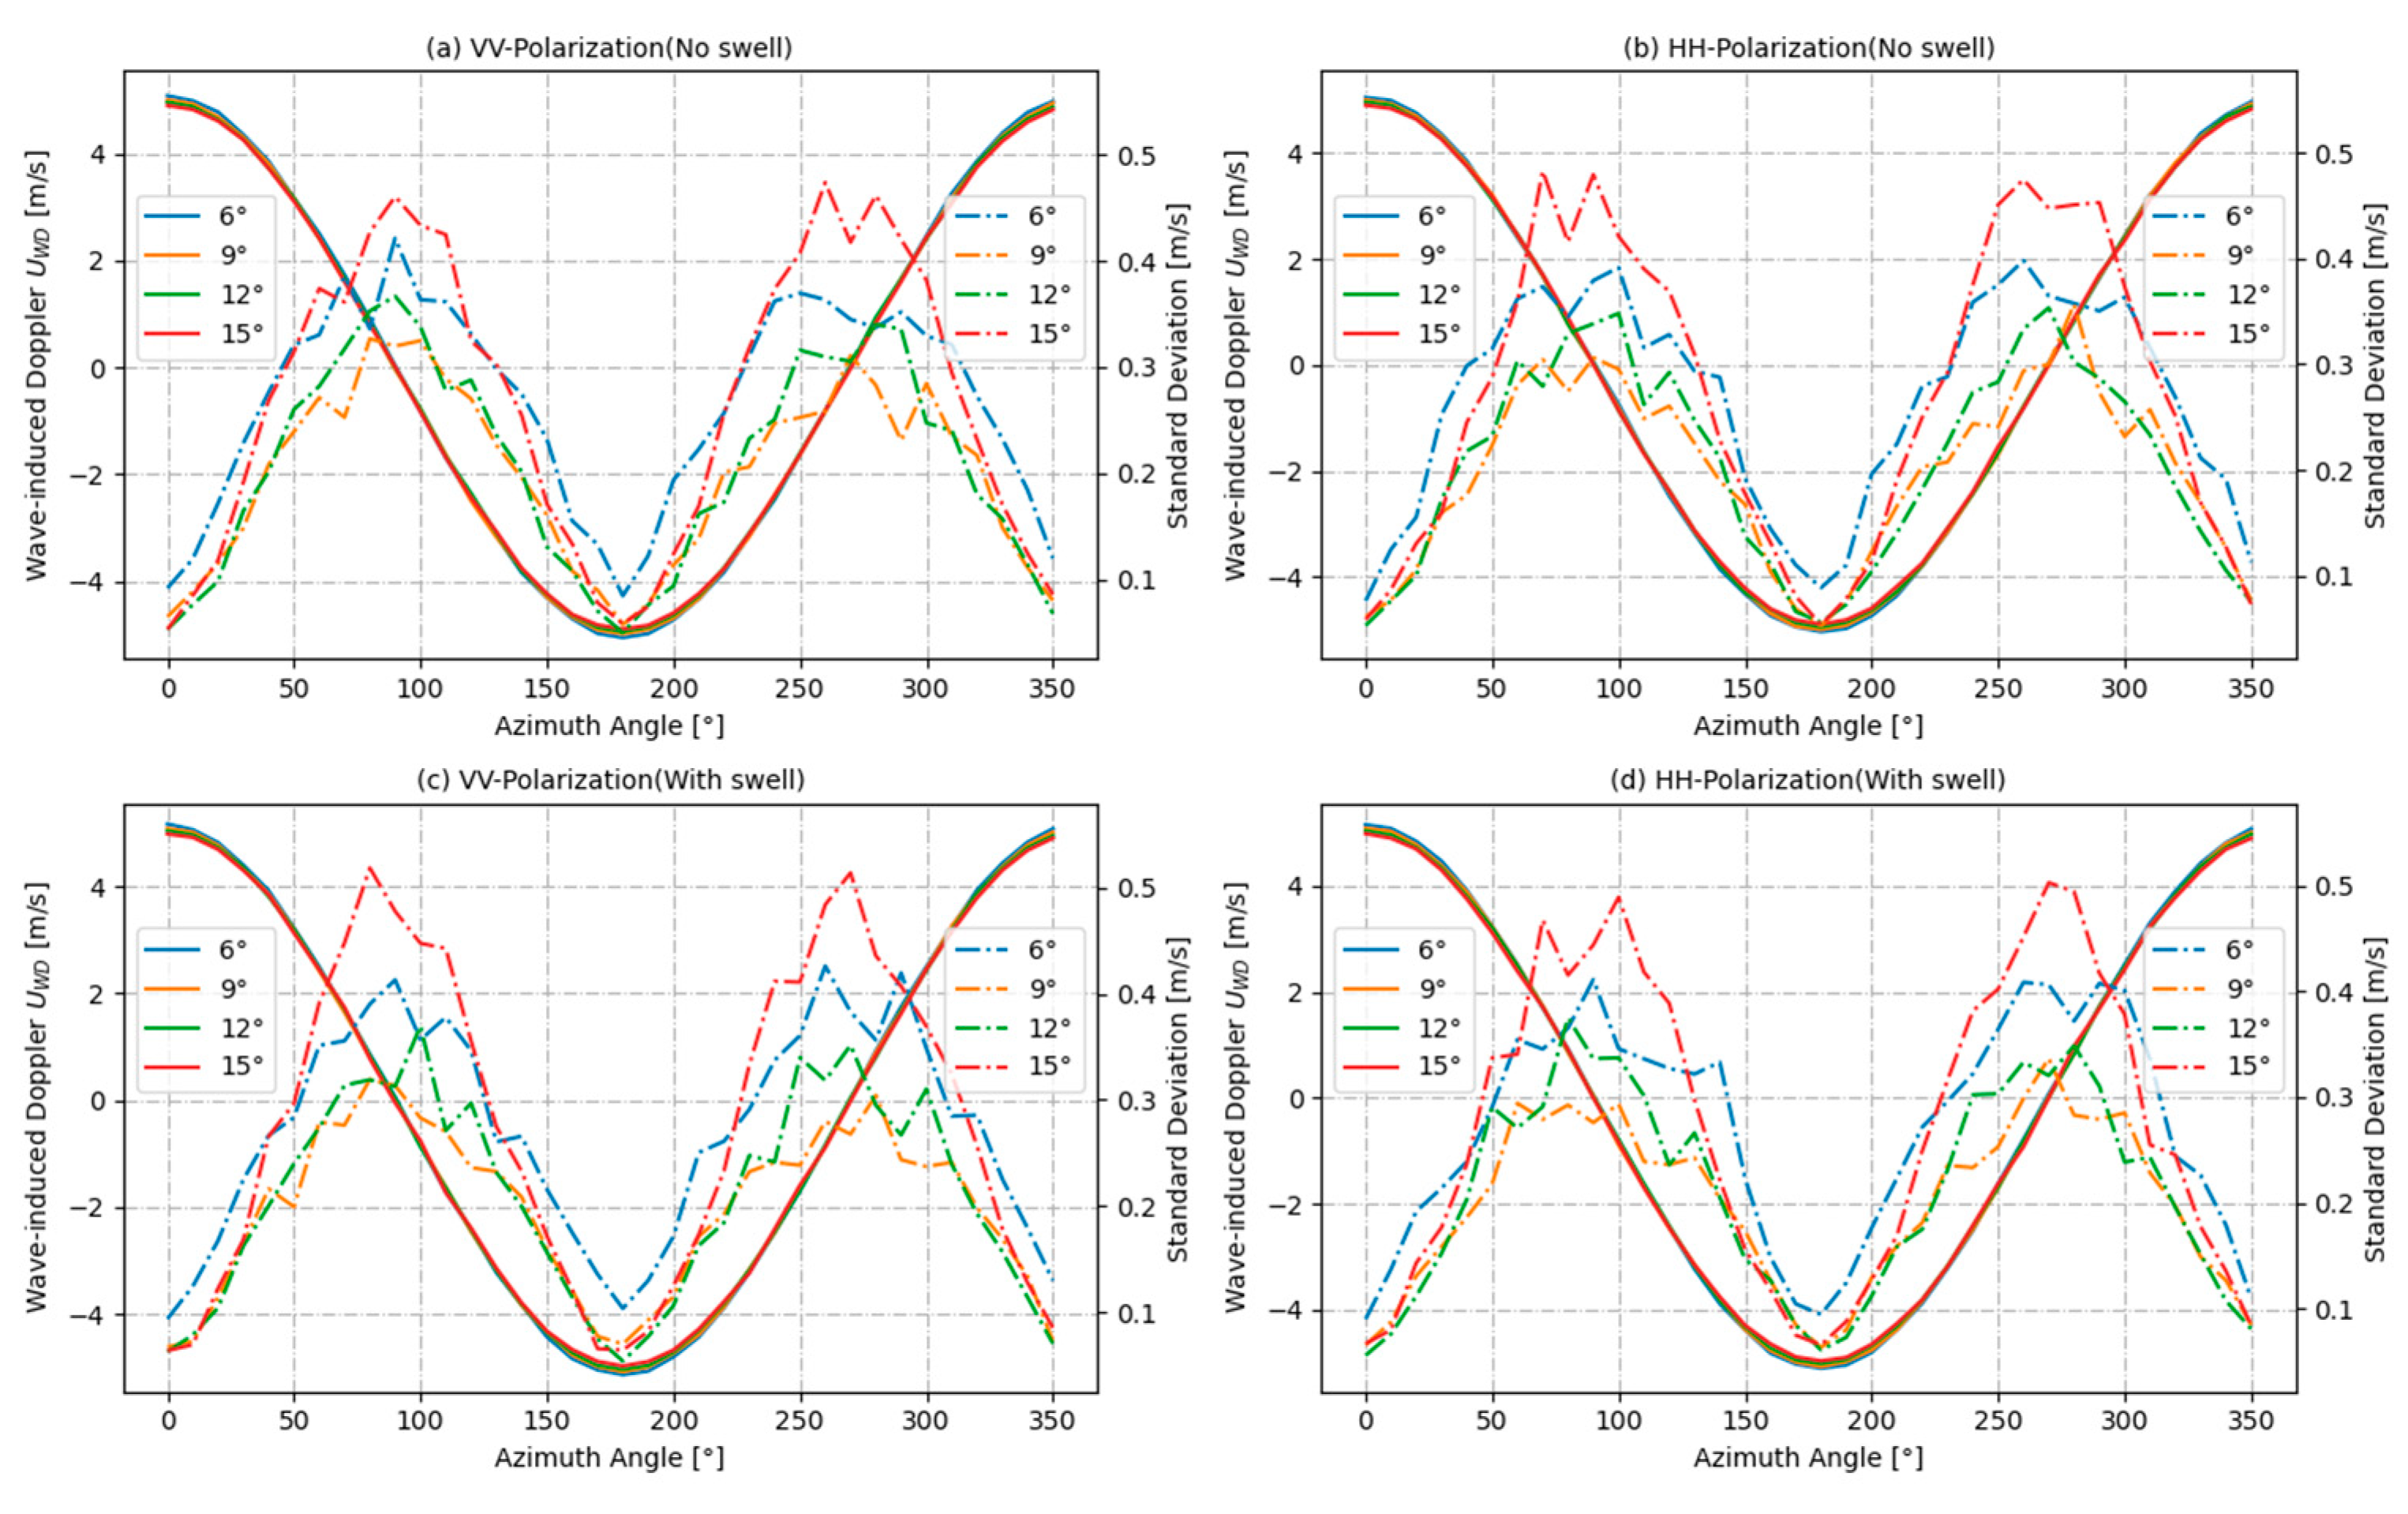
Figure 9 shows the variation in UWD and standard deviation with radar azimuth for radar incidence angles of 6°, 9°, 12°, and 15°. (a,b) indicate that the wind direction is 0°, the wind speed is 10 m/s, and there is no swell. There is little difference between the UWD at different incidence angles; there are only slight differences between the UWD values in the downwind and upwind directions. Values of UWD vary sinusoidally with azimuth and peak at azimuth angles of 0° (downwind) and 180° (upwind). The magnitudes of UWD in the downwind and upwind directions are the same and are about 5 m/s. The UWD in the crosswind direction is equal to 0. This indicates that UWD is not affected by the crosswind but is strongly influenced by the downwind and upwind. There is little difference between the UWD of VV polarization and that of HH polarization. The standard deviation of UWD varies with azimuth angles. At azimuth angles of 0° and 180°, that is, at squint angle (the angle between antenna direction and satellite flight path) of 0°, the value is the minimum; UWD standard deviation increases with squint angle. At azimuth angles of 90–270° (positive side-view), the highest value of the standard deviation at different incidence angles is 0.47 m/s, 0.42 m/s, 0.37 m/s, and 0.33 m/s, which correspond to incident angles of 15°, 6°, 12°, and 9°, respectively. The rate of UWD standard deviation change increases with the squint angle because the side-view lowers sea surface coherence and increases the error in the acquired interference phase. Figure 9c,d show the scene with the swell added to Figure 9a,b. The pattern of UWD and standard deviation change is consistent with the trend without swell. The standard deviation increases slightly, and the maximum value increases by 0.52 m/s when the incidence angle is 15°.

4.2.2. Effect of Radar Incidence Angle on Wave-Induced Doppler Velocity

At small incidence angles, backscattering of Ka-band radar signals at the sea surface is dominated by specular scattering, and Bragg scattering is negligible [41,43,51,52]. As the radar incidence angle increases, the contribution of vertical wave motion to UWD decreases, while the contribution of horizontal wave motion in the radar LOS direction increases [21,22]. To optimize instrument performance, the selection of a suitable incidence angle is extremely important. We analyzed the effects of small incidence angles (1–15°) on UWD for the case of specular scattering. Since the Bragg scattering component is gradually enhanced as the incidence angle increases, this paper considers a 15° incidence angle as the angular limit under this condition [53,54].
Figure 10 shows the variation in mean UWD and its standard deviation with radar incidence angles for wind speeds of 5, 10, 15 and 20 m/s and azimuth and wind direction of 0°. (a) and (b) refer to the situation where radar azimuth and wind direction are both 0°, and there is no swell. For all wind speeds, UWD decreases with an increasing incidence angle. The rate of UWD change is large at incidence angles of <4° and is close to 0 for incidence angles of >4°. Figure 10c,d show the scene where swell is added in Figure 10a,b. The changing trend of UWD and the standard deviation is basically consistent with that without swell. Considering the proportion of specular scattering to total backscattering for different incidence angles, UWD values, and standard deviations, we confirm that a radar incidence angle of 6–12° can ensure reasonable instrument performance and current retrieval.
Figure 8, Figure 9 and Figure 10 show that VV polarization and HH polarization have the same effects on UWD. As polarization mainly affects short wave backscatter, the Bragg scattering component can change the co-polarization signature. The peak of the co-polarization signature is also shifted substantially by broken waves [55]. The frequency of the Ka-band is sufficiently high to limit the effect of polarization for specular scattering from rough seas [43,56,57]; as a result, the variation in the Doppler shift is insignificant. As our results of VV polarization are consistent with those of HH polarization, the following discussion mainly focuses on VV polarization.

4.3. Effect of Sea State on Wave-Induced Doppler Velocity

4.3.1. Contribution of Wind Speed to Wave-Induced Doppler Velocity

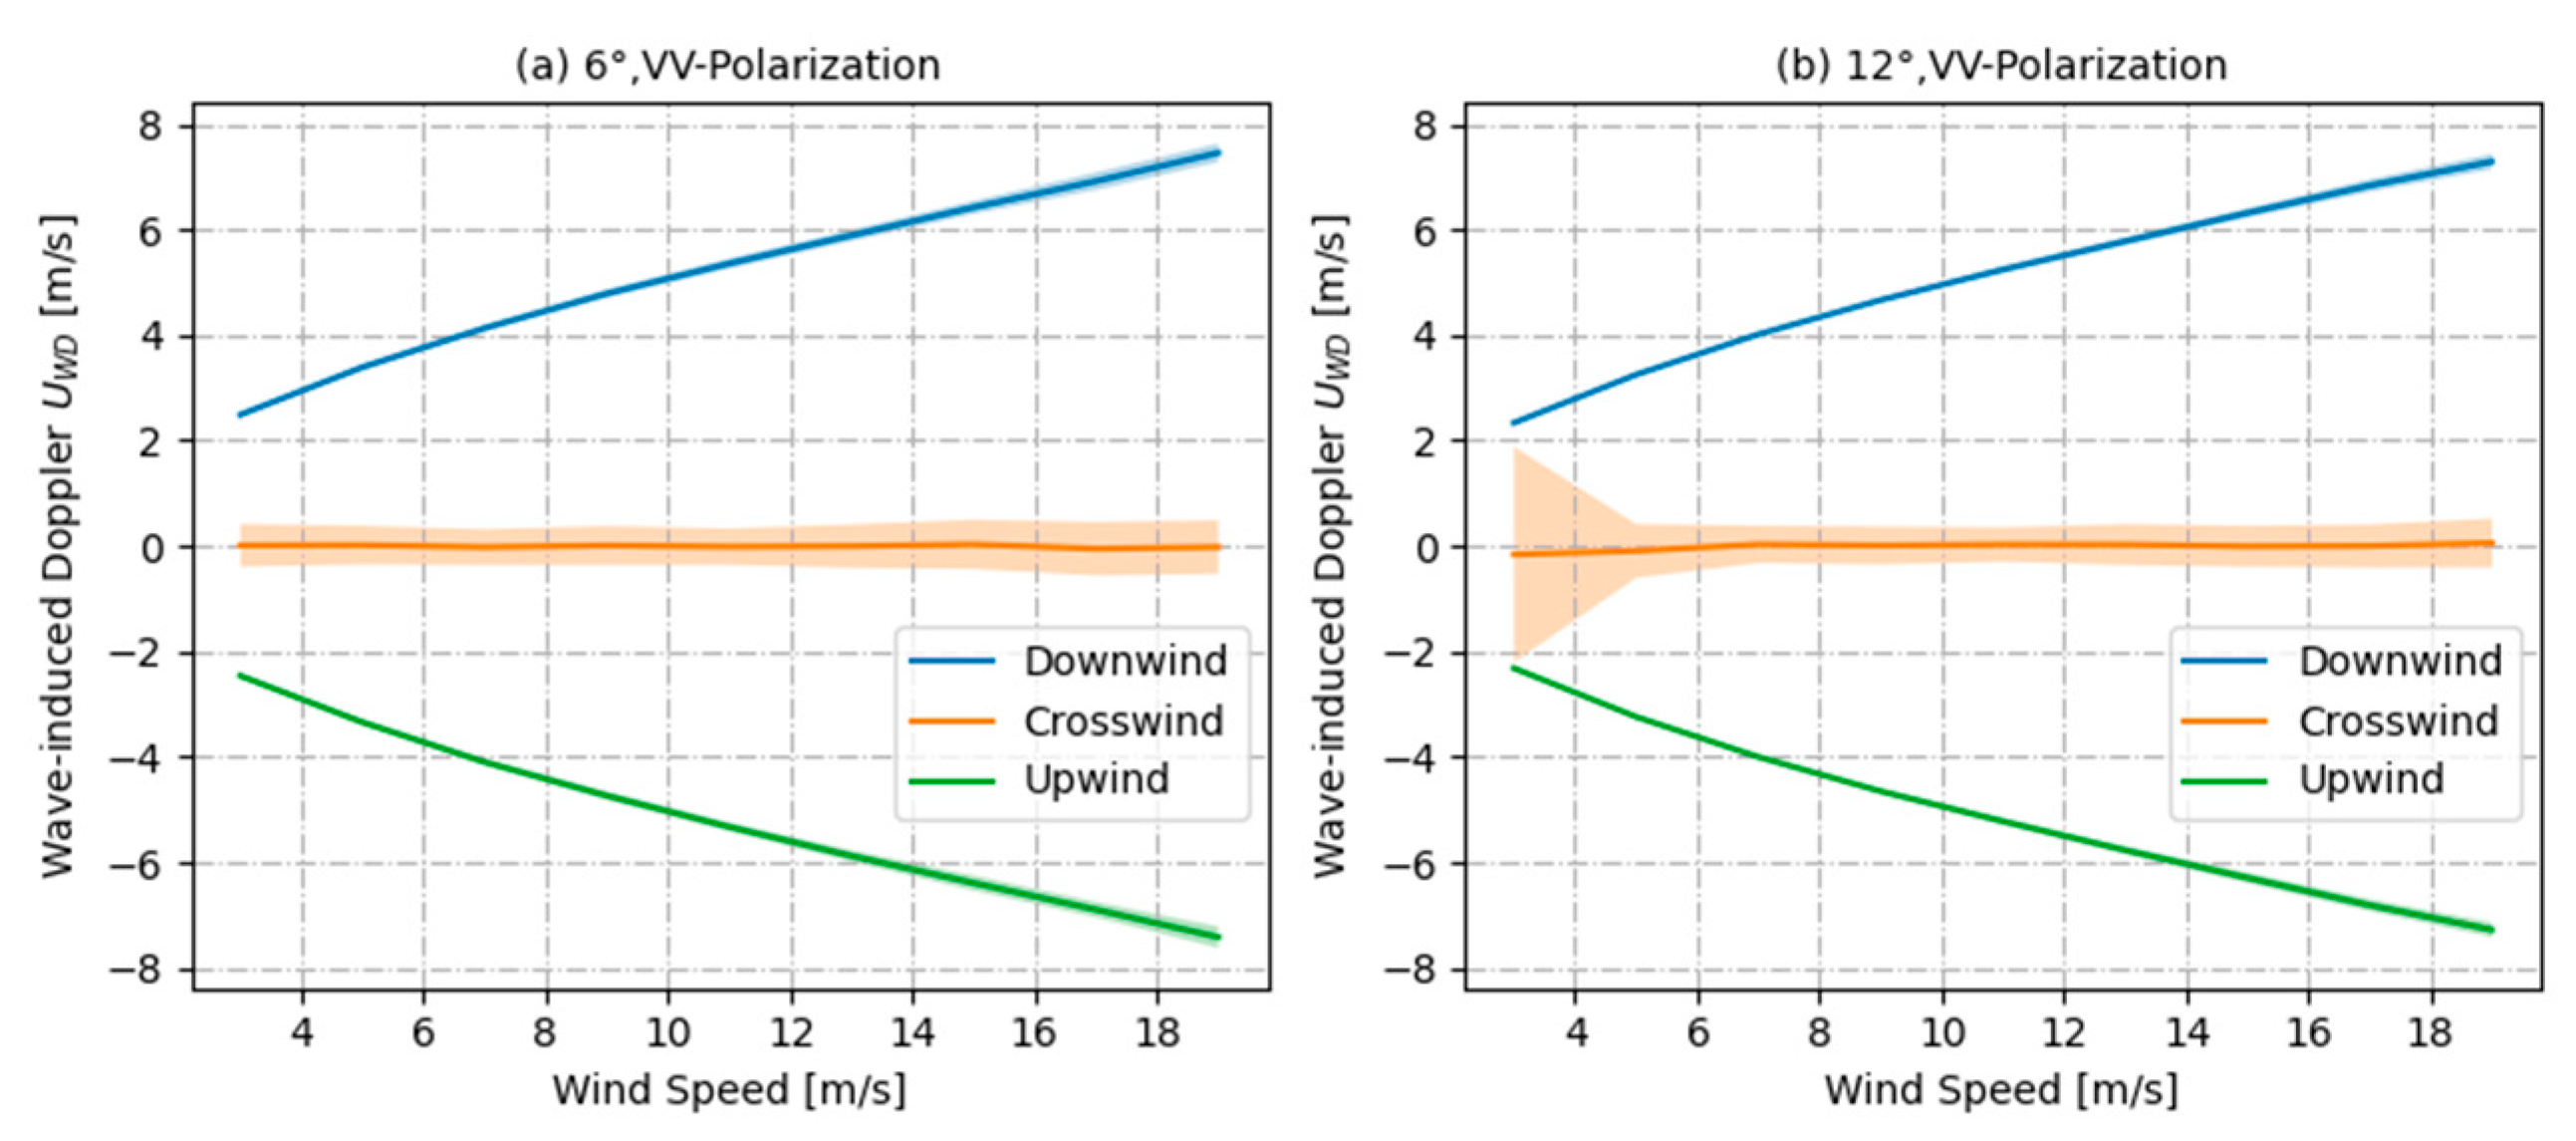
The wind-induced Doppler shift is much larger than the Doppler velocity generated by the current [13]. The orbital velocity of the waves is affected by wind speed and direction and wave age. There is a close correspondence between wind speed and sea surface roughness because wind modulation of the sea surface changes sea surface roughness [12,16]. The wind-induced sea surface drift velocity acts directly on the Doppler shift. Figure 11 shows the variation in UWD and its standard deviation with wind speed in the downwind, crosswind, and upwind directions at incidence angles of 6° and 12°. The dependence of UWD on wind speed is strong. There is symmetry in the UWD–wind speed curve, which is insensitive to the variation in the incidence angle. The magnitude of UWD increases with wind speed in both the downwind and upwind directions. For every 1 m/s increase in wind speed, UWD increases by approximately 0.3 m/s. At moderate wind speed (10 m/s), UWD is around 5 m/s and accounts for 50% of the total wind speed; UWD in the crosswind direction is close to 0. The standard deviation of UWD increases slowly with wind speed in the downwind and upwind directions. At an incidence angle of 12°, standard deviation increases sharply to 2 m/s at low crosswind speed and is close to the UWD in the downwind and upwind directions for the same wind speed. This highlights the high uncertainty in current retrievals at low wind speeds.
The asymmetry of downwind and upwind UWD at medium and high incident angles does not exist at small incident angles [19], which is mostly impacted by hydrodynamic modulation. The wind speed affects the position of the hydrodynamic modulation intensity on the long-modulated wave, and this impact diminishes as the wind speed decreases [18,19]. Since this phenomenon is driven by Bragg scattering, and specular scattering occurs mostly at small incidence angles, UWD exhibits better symmetry downwind and upwind, demonstrating the advantage of small-incidence-angle inversion of the sea surface current field.
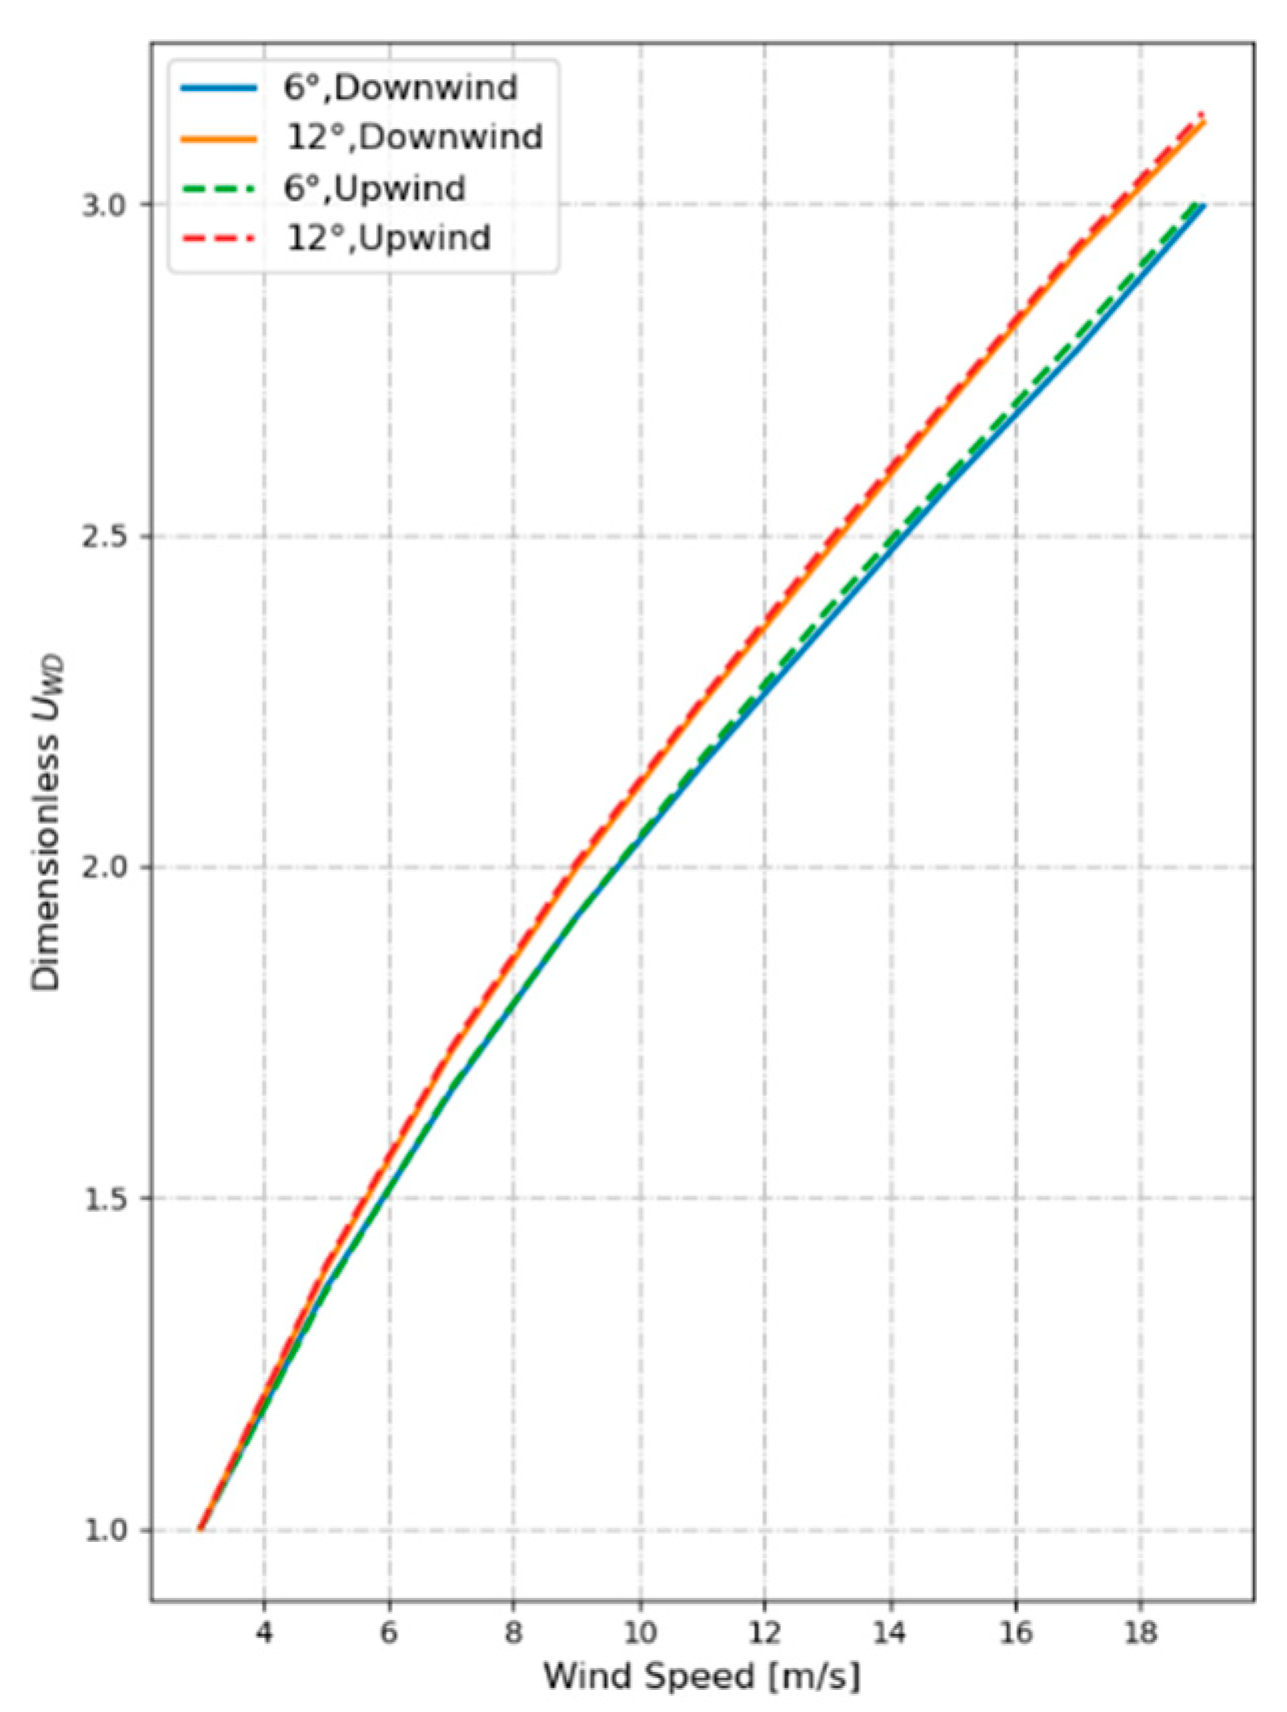
To further quantify the dependence of UWD on wind speed, we calculated a dimensionless UWD by normalizing UWD values with the UWD value at a wind speed of 3 m/s. Figure 12 shows the variation in the dimensionless UWD with wind speed. For both downwind and upwind directions, the rate of change of dimensionless UWD increases as wind speed decreases but increases with an incidence angle. The UWD at a wind speed of 10 m/s is about twice that at 3 m/s; UWD at a wind speed of 18 m/s is about 3 times that at 3 m/s.
To further verify the reliability of the simulation calculation results, the average specular scattering point velocity Csp [18] is calculated based on the average Doppler velocity model of the specular scattering point derived by Longuet Higgings [58].
C s p = c o s φ a S L u p 2 L c k 2 cos ( φ k ) B ( k ) d k + s i n φ a S L c r 2 L c k 2 sin ( φ k ) B ( k ) d k
where φ k is the azimuth of the spectral component associated with the wave vector k with respect to the wind, S L 2 is the MSS of the large-scale surface, S L u p 2 , S L c r 2 corresponds to the windward and sidewind directions, respectively, and is defined as:
[ S L u p 2 , S L c r 2 ] = L [ cos 2 ( φ k ) , sin 2 ( φ k ) ] k 2 B ( k ) d k
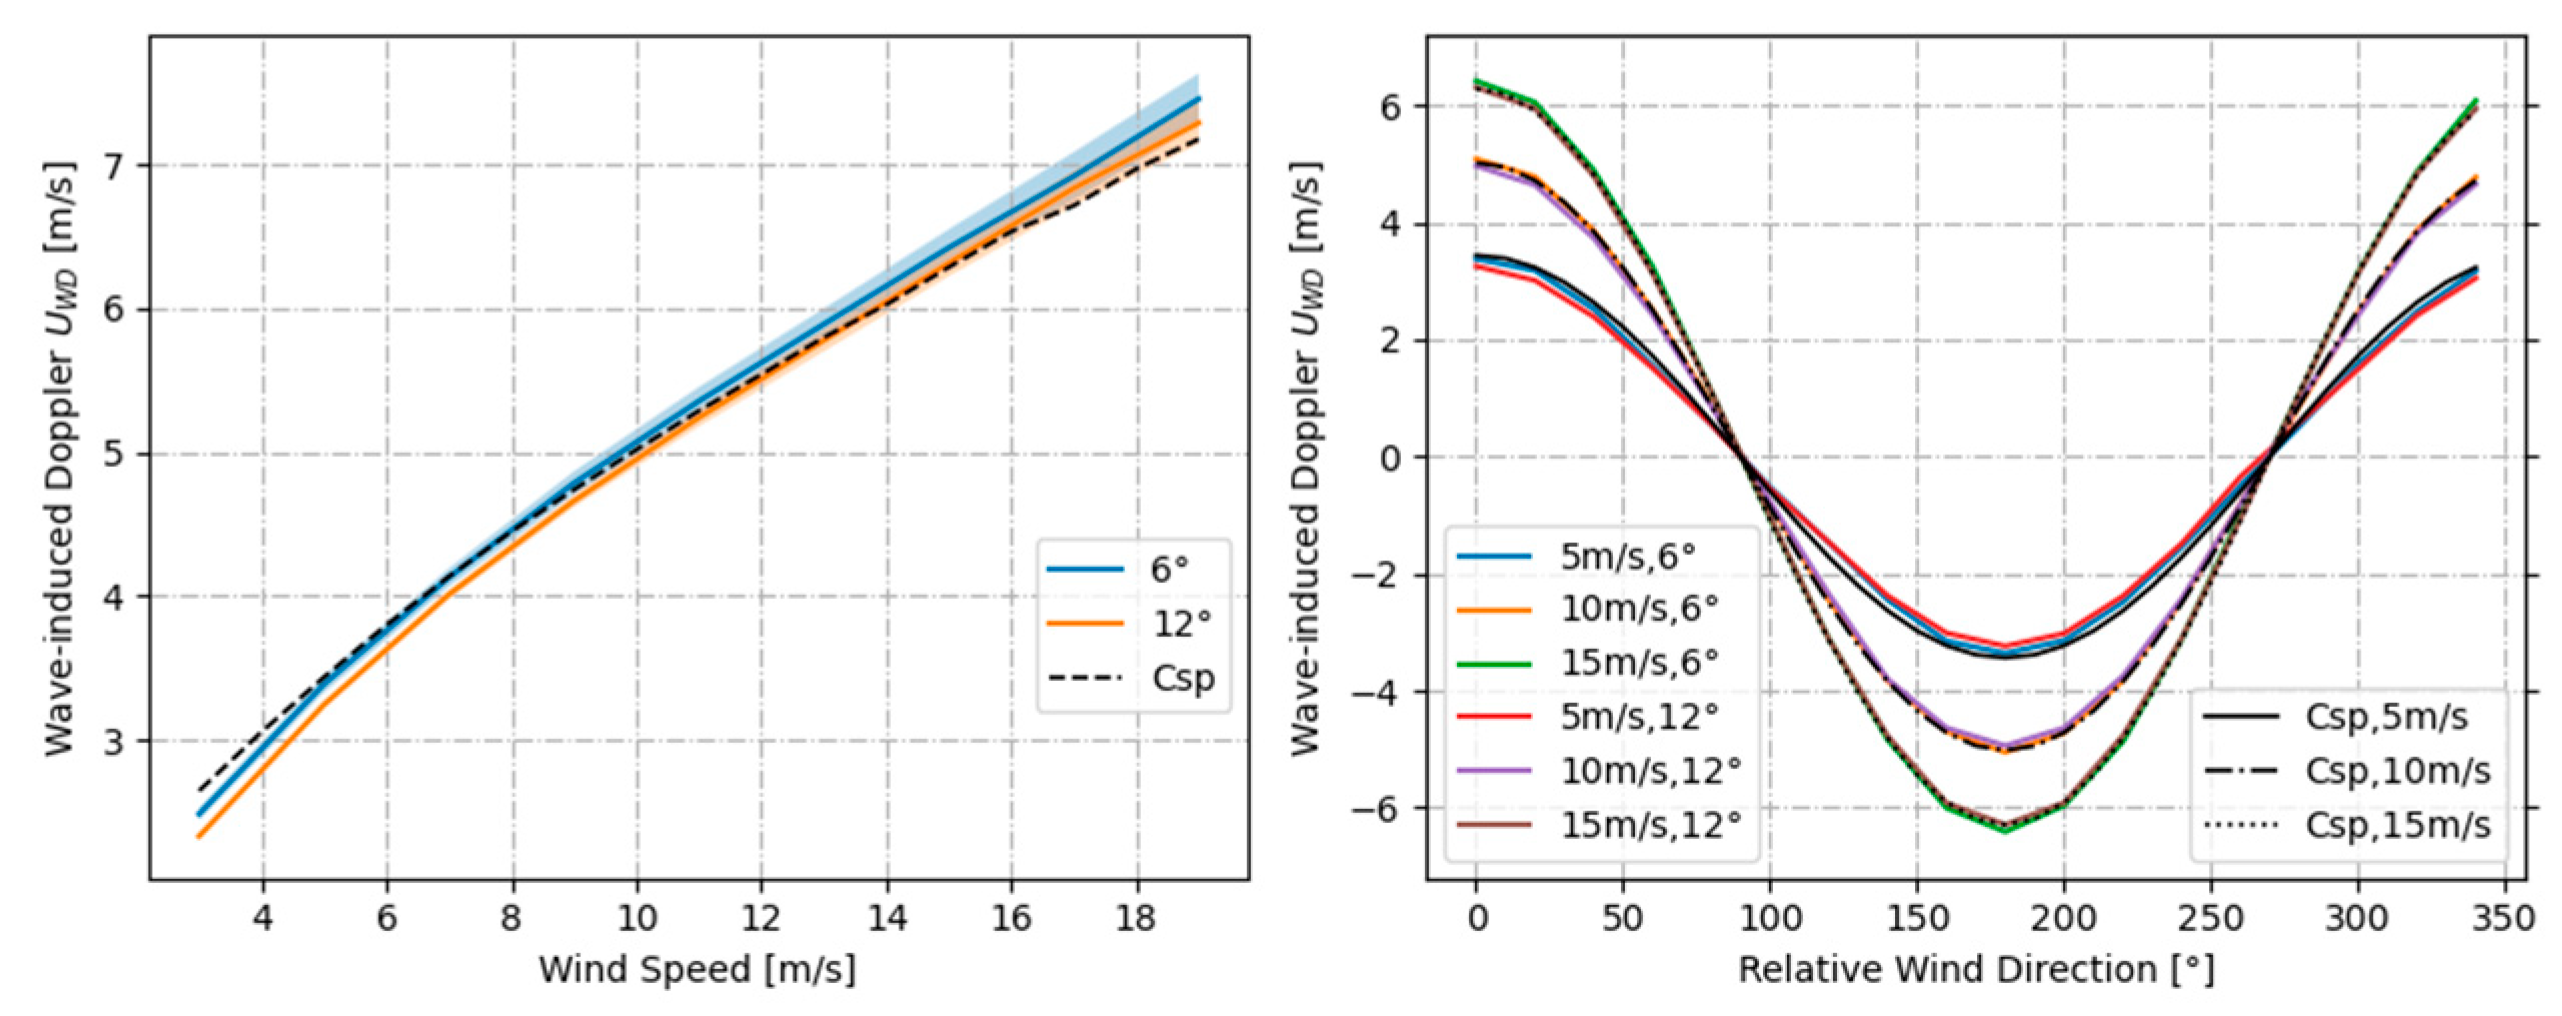
Figure 13 shows a comparison of the computed mean velocity of the specular scattering point with the simulation findings. The analytical solution agrees well with the simulation findings, and the Csp is slightly lower at low wind speed, slightly higher at high wind speed, and closest at medium wind speed.

4.3.2. Contribution of Wind and Wave Development to Wave-Induced Doppler Velocity

Wind fetch is the key factor affecting wind wave development. Wind fetch and wind speed directly determine wave age. Figure 14 distinguishes the development degree of wind waves by the size of the wind fetch and shows the variation in UWD and its standard deviation with radar azimuth for different wind speeds and fetches. Wind wave development contributes considerably to UWD; UWD varies sinusoidally with the azimuth angle. Maximum magnitudes of UWD are found in the downwind and upwind directions. Magnitudes of UWD in the downwind and upwind directions are the same; UWD in the crosswind direction is equal to 0. The dependence of UWD on wind fetch is the highest in the downwind and upwind directions. The UWD generated by a fully developed ocean (fetch of 500 km) at a moderate wind speed (10 m/s) exceeds that generated by young seas (fetch of 50 km) at a high wind speed (15 m/s). Maximum UWD standard deviation is found in the crosswind direction. Minimum UWD standard deviation is found in the downwind and upwind directions. There are larger variations in UWD standard deviation at an incidence angle of 12°. The standard deviation of the crosswind direction at a low wind speed (5 m/s) is greater than 0.5 m/s, and the maximum value of 0.72 m/s occurs when the wind fetch is 50 km.
For the Elfouhaily spectrum, inverse wave age Ω c can be expressed as a function of wind fetch:
Ω c = 0.84 tanh { ( X / X 0 ) 0.4 } 0.75
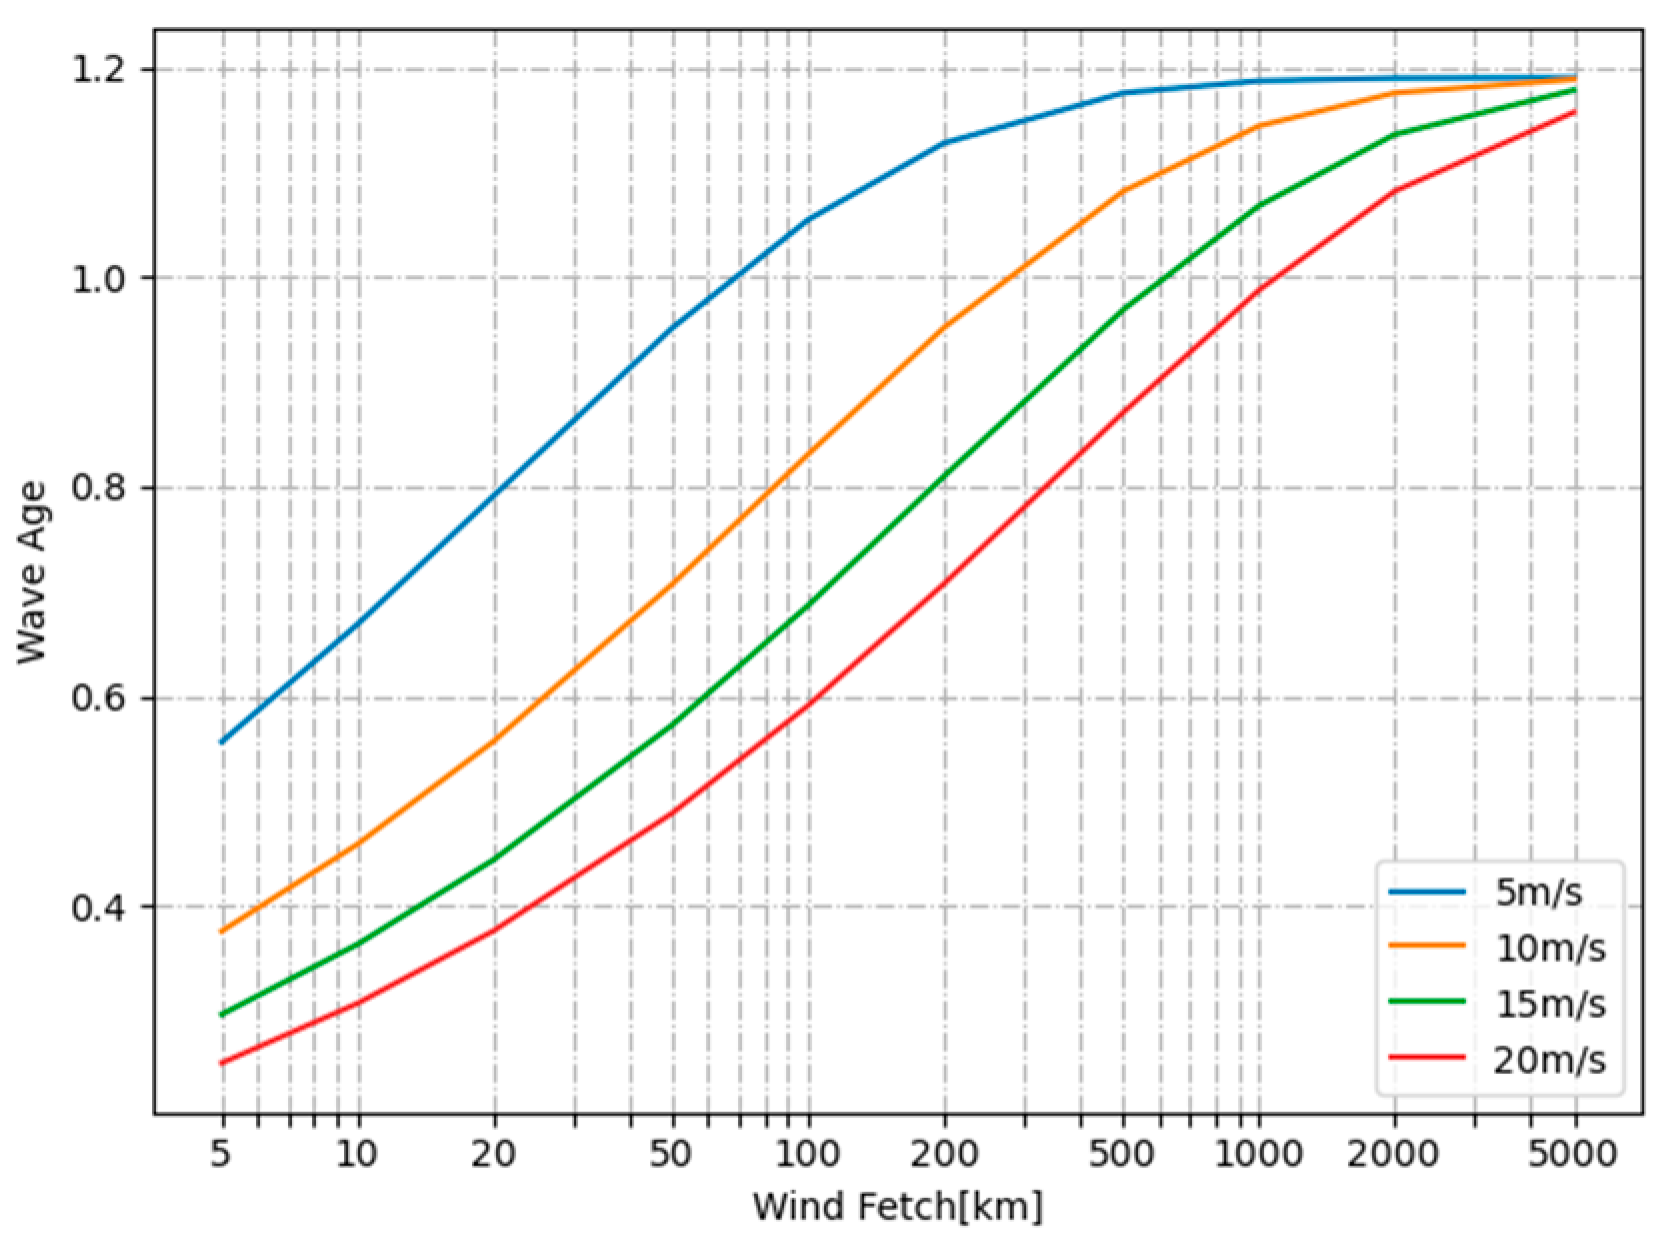
where X 0 = 2.2 × 10 4 , X = k 0 × L f e t c h , k 0 = g / U 10 2 ; g is the gravitational acceleration, U 10 is offshore wind speed at 10 m height, and L f e t c h is wind fetch in m. This wave age relationship is in general agreement with the JONSWAP model according to Hasselmann et al. [35], Kahma [36], Donelan et al. [34], and Dobson et al. [59]. Values of Ω c of 0.84, 1.0, and above 2.0 correspond to fully developed, mature, and young seas, respectively [39]. Figure 15 shows the variation in wave age with wind fetch.
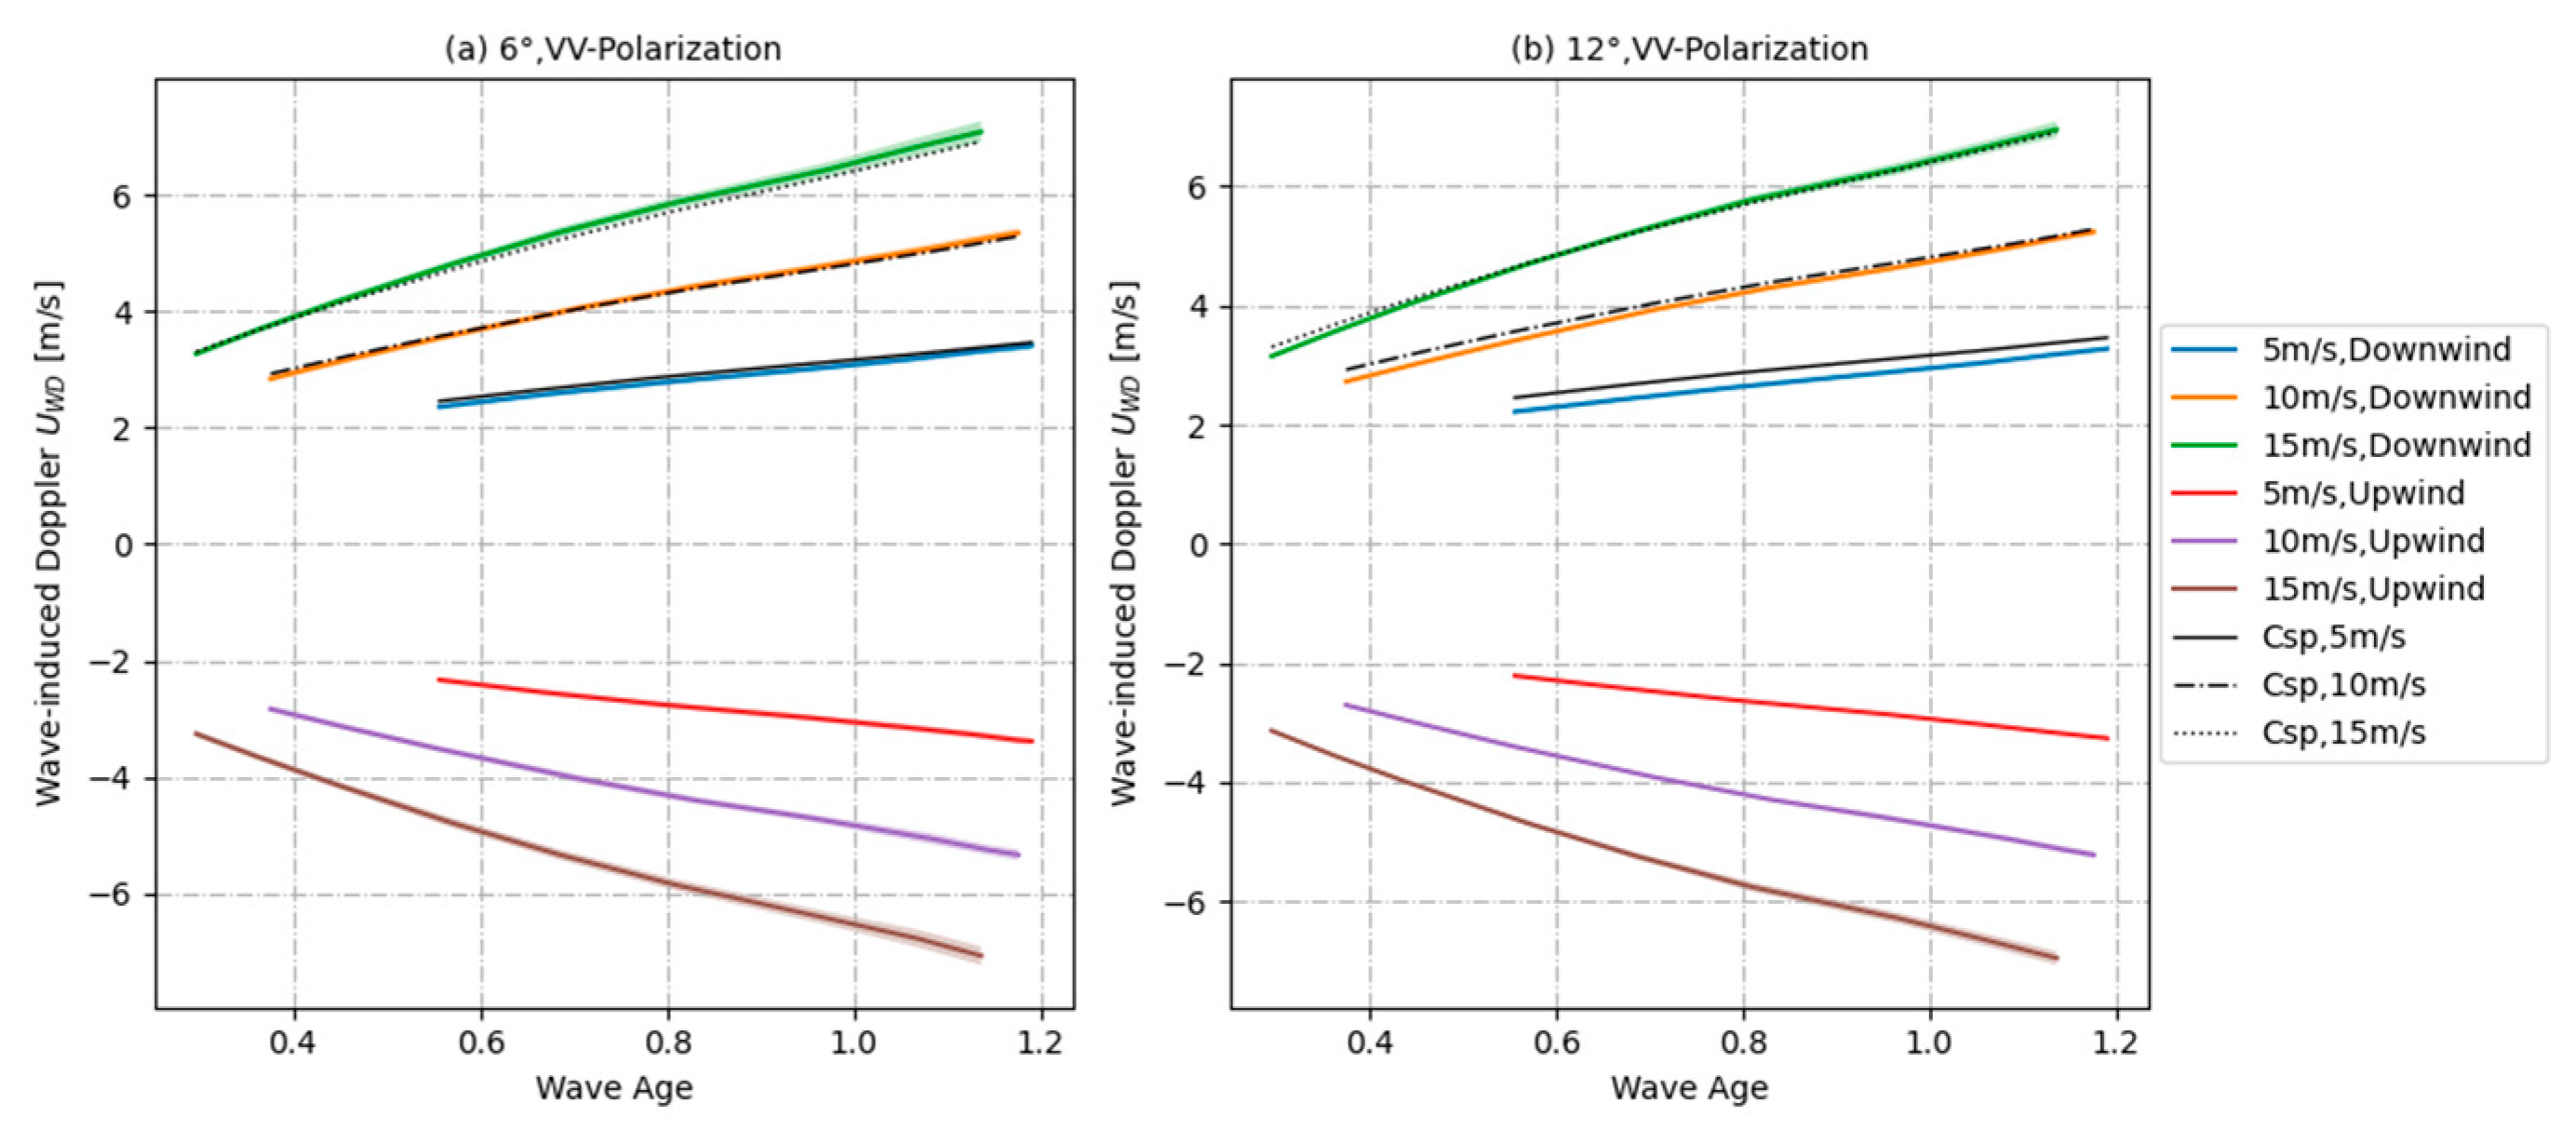
We studied the contribution of wind and wave development to UWD by analyzing wave age. Figure 16 shows the variation in UWD and its standard deviation with wave age. The UWD increases monotonically with wave development when other parameters are kept constant. The greater the wind speed, the more dependent UWD is on wave age. The simulation findings correspond better with the mean specular scattering point velocity Csp, with the biggest variance at 5 m/s wind speed and 12° incidence angle. In comparison to UWD, Csp steadily diminishes when wind waves develop. To further quantify the contribution of wave age to UWD, we calculated a dimensionless UWD by normalizing UWD values with the UWD value at a wave age of 0.6. Figure 17 shows that the dependence of UWD on wave age is greatly affected by wind speed and is less affected by the angle of incidence. The wave age grew from 0.6 to 1.1 at a 6° incidence angle, and the dimensionless UWD generated an increase of around 33% at low wind speeds; the rise at medium wind speeds was significantly lower than the increase at high wind speeds, which was about 40%. The wave age grew from 0.6 to 1.1 at a 12° incidence angle, and the dimensionless UWD caused an increase of around 36% at low wind speeds; the results for medium and high wind speeds were virtually the same, with an increase of about 41%. As wind waves develop, the wave spectrum energy of gravity waves steadily increases while the roughness of short waves decreases. Wave age dependence of UWD is determined by the gravity wave spectrum component, with the dimensionless UWD increasing with wave age [23].

4.3.3. Combined Contribution of Wind and Swell to Wave-Induced Doppler Velocity

The mixing of wind and swell waves in the open ocean increases surface wave complexity [23]. Swell waves are larger than wind waves and affect radar backscatter through tilt modulation and hydrodynamic modulation [60]. We analyzed swells with different frequencies and wave heights (Table 2) to examine the contribution of different swells to UWD.
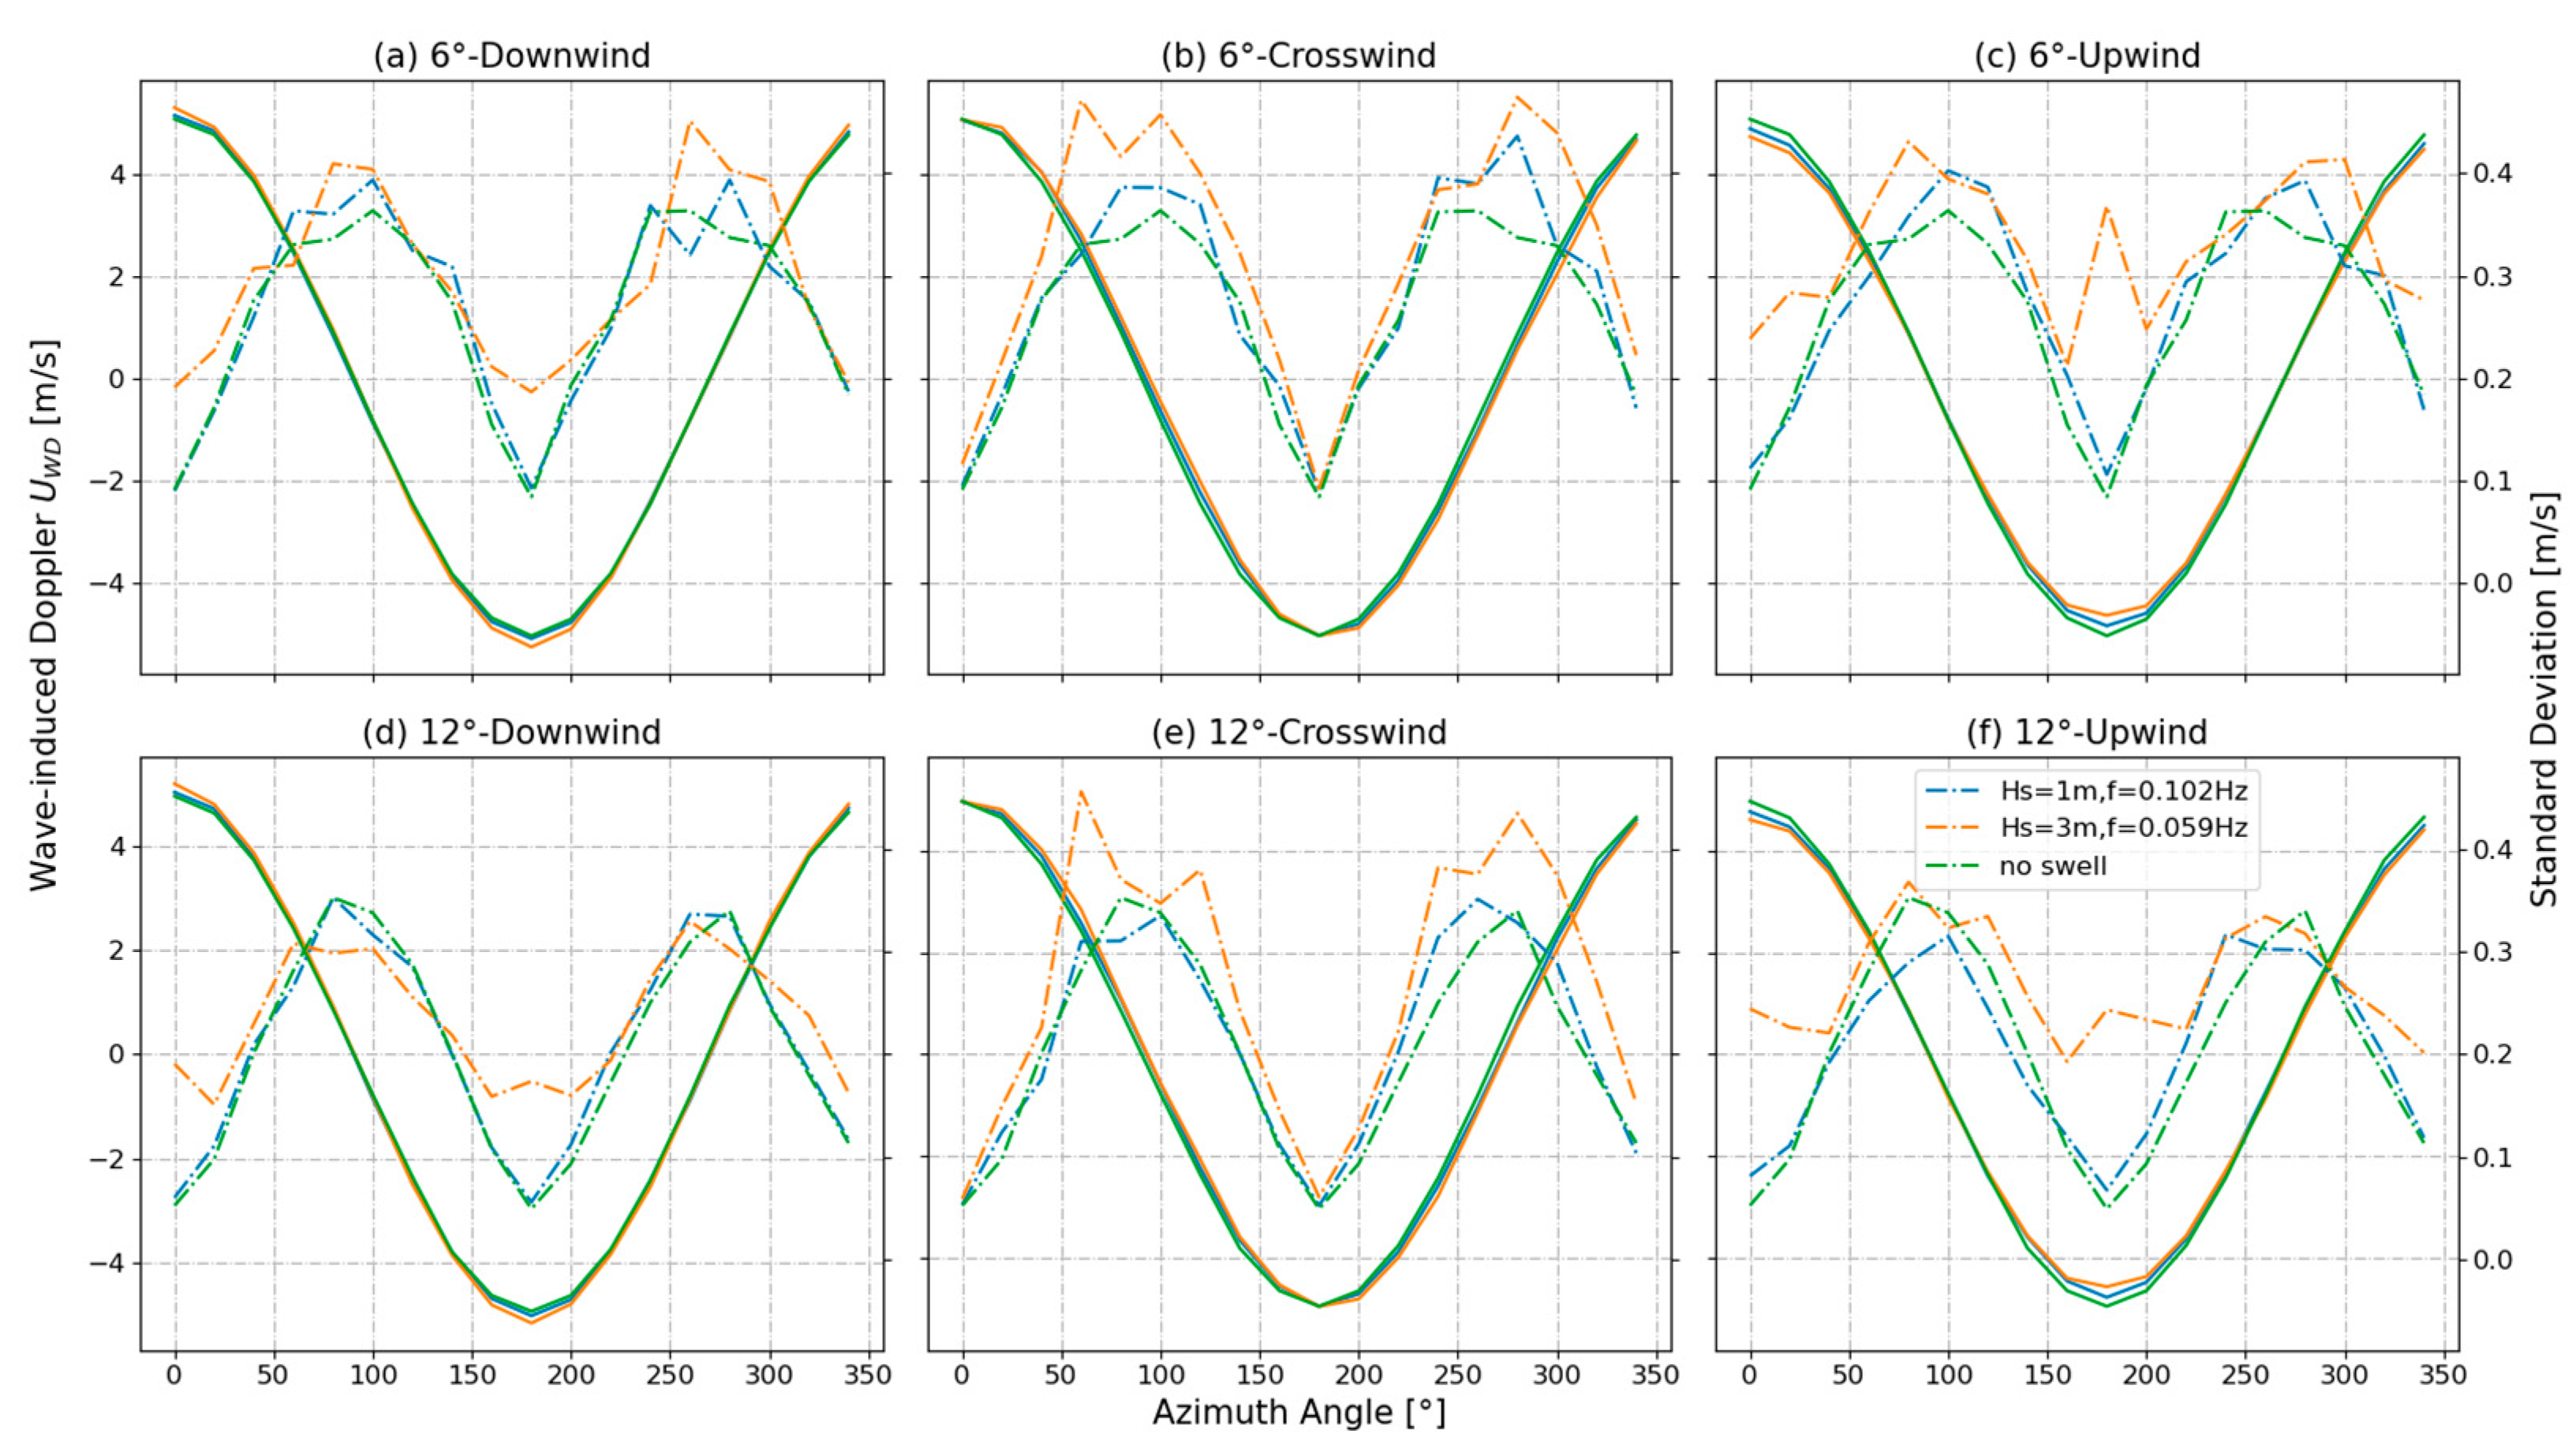
Figure 18 shows the variation in UWD and its standard deviation with azimuth for a wind speed of 10 m/s and B2 and D2 swells (Table 2) in the downwind, crosswind, and upwind directions. The contribution of swell to UWD is insignificant. Relative to wind waves, the contribution of the swell to UWD is small because the orbital speed of a swell contributes less to UWD. A smaller difference between swell direction and radar radial direction is associated with a larger contribution of swell to UWD. The magnitude of a UWD is higher in the presence of swell in the downwind direction and is lower with swell in the upwind direction. The contribution of upwind swell to UWD is slightly larger than that of a downwind swell. The values of UWD shift with swell direction for a swell in the crosswind direction but remain unchanged for azimuth angles of 0° and 180°.
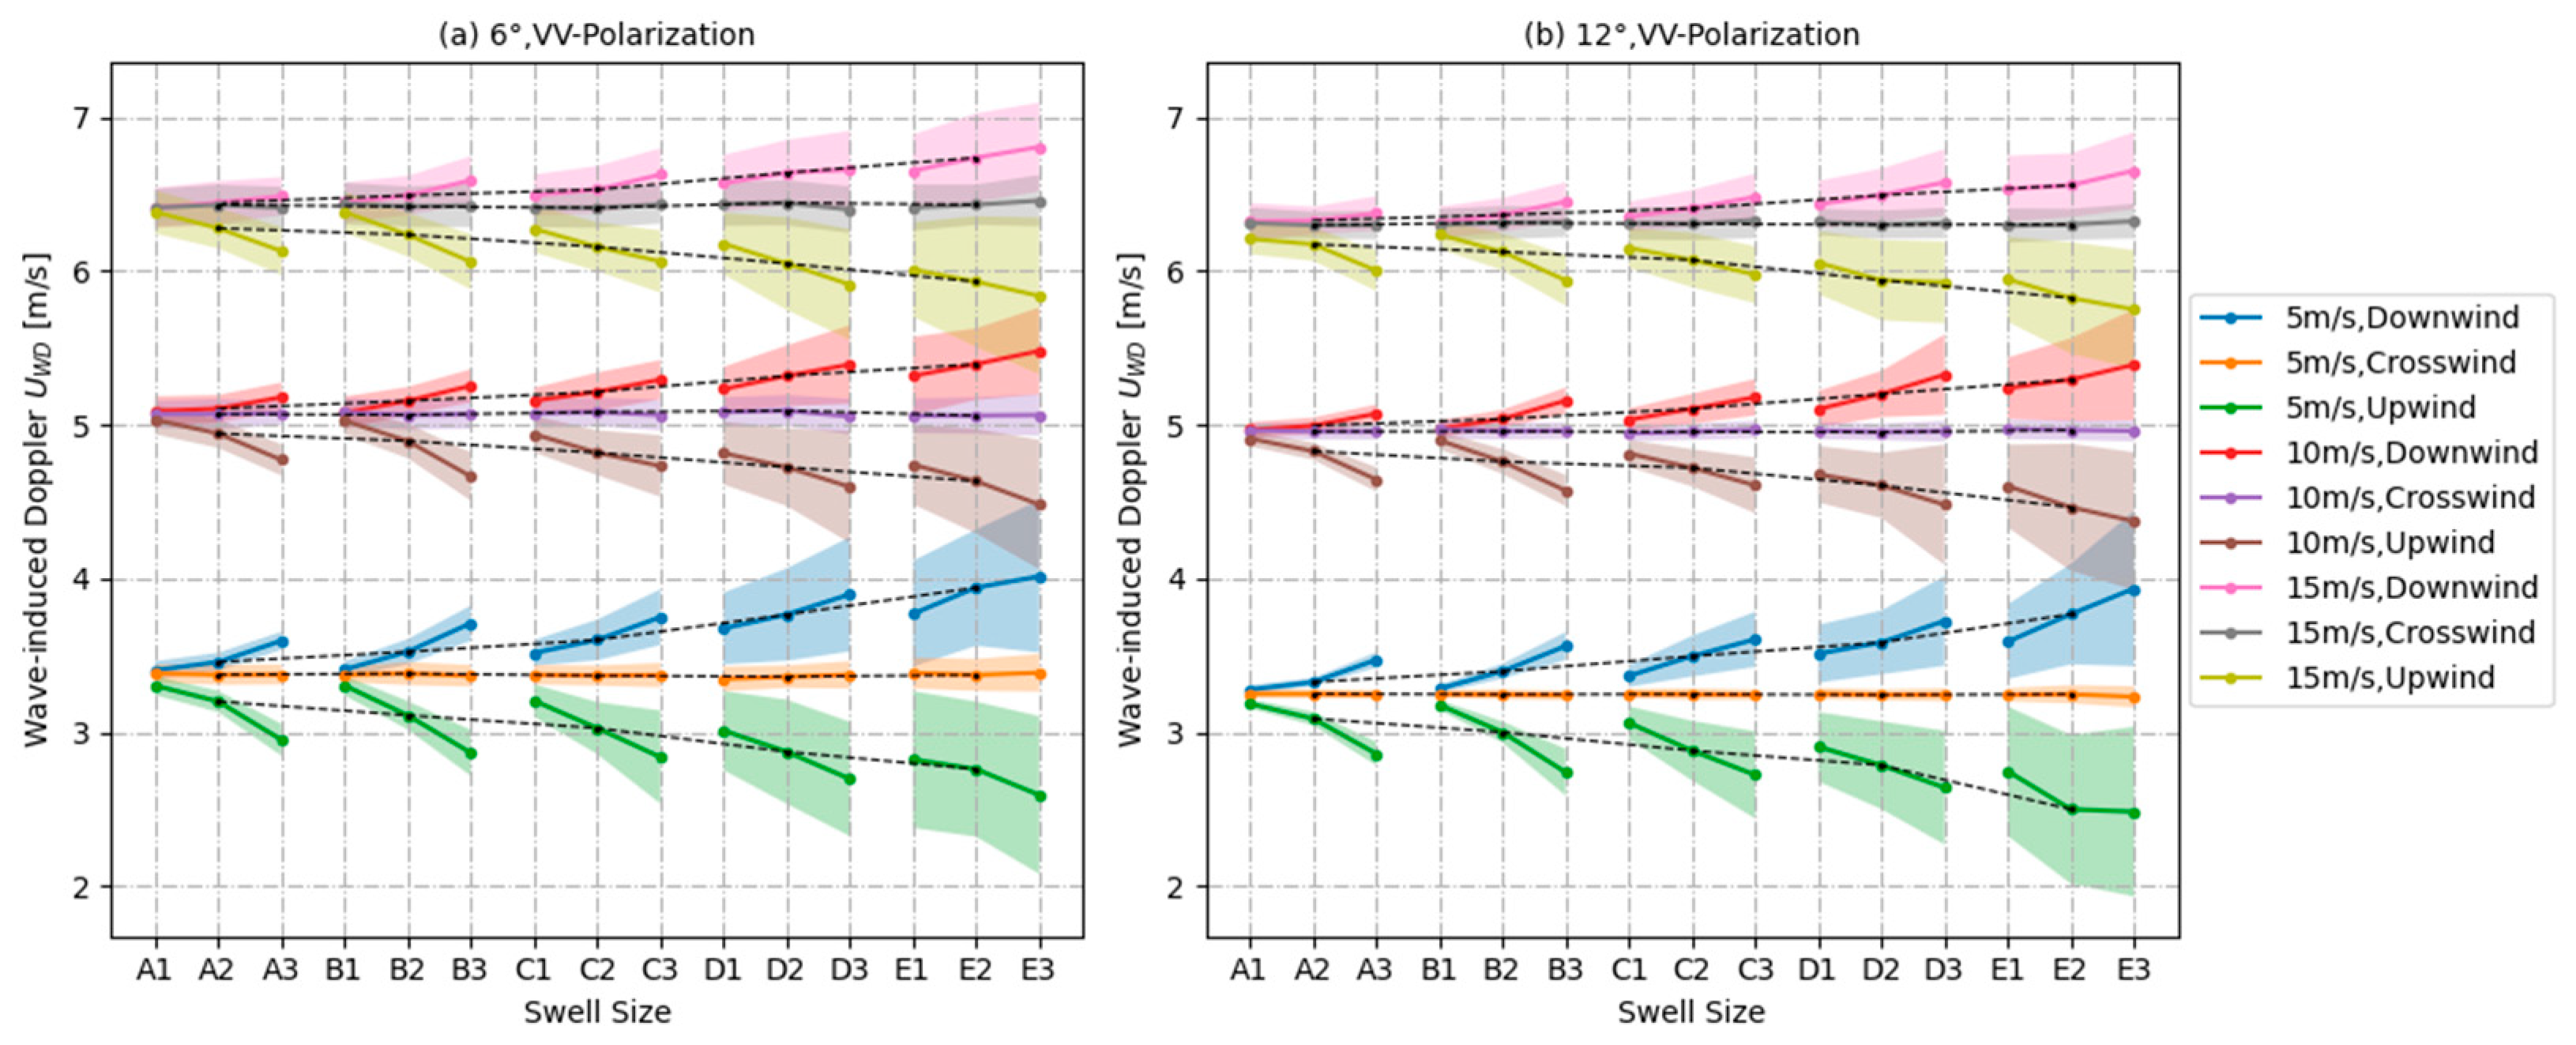
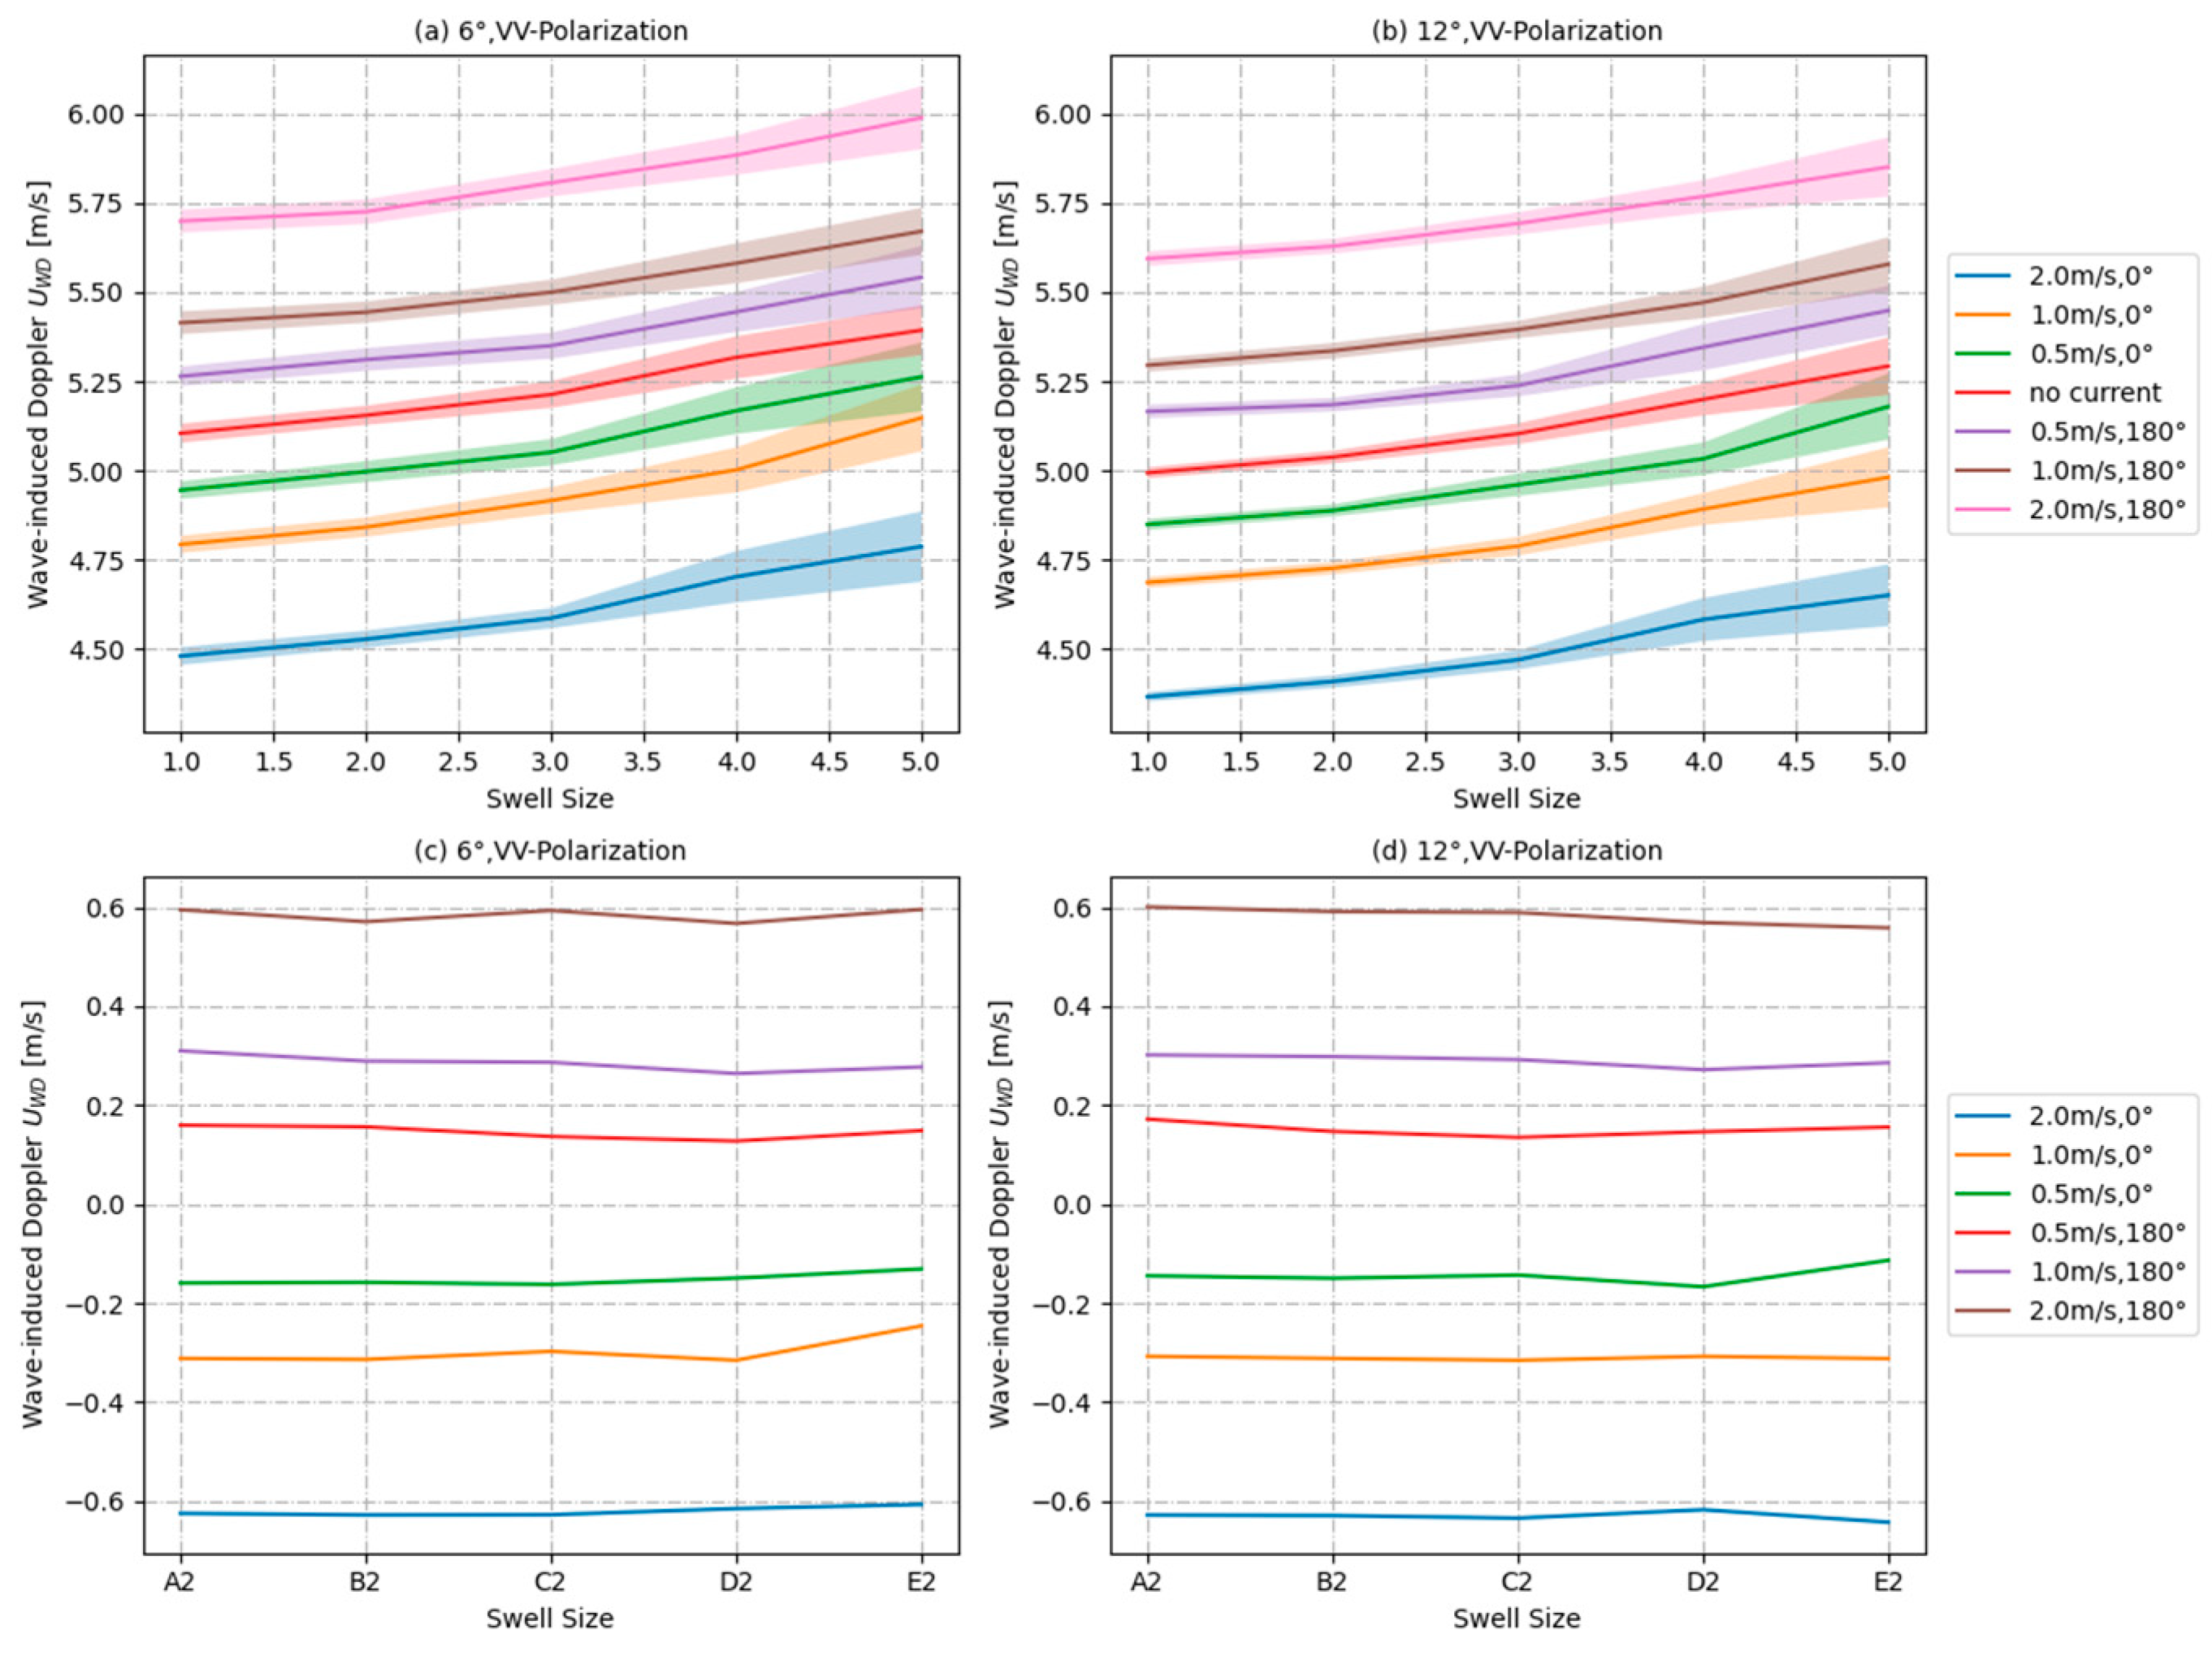
We analyzed the contribution of the combined effect of wind and swell. Figure 19 shows the variation in UWD and its standard deviation with swell scale, which is defined in Table 2. The line segments of different colors show the sensitivity of UWD to swell scale at different wind speeds. In the presence of swell in the downwind and upwind directions, the magnitude of UWD increases considerably with effective height. The contribution of effective wave height is gradually replaced by that of wind waves as wind speed increases. The black dashed line connects the UWD of swell with equal proportion in upwind, downwind, and crosswind directions. The contribution of crosswind swell is negligible. Overall, the variation in effective wave height is the main component of the contribution of swell to UWD. The standard deviation of UWD increases with swell; UWD standard deviation is maximum (0.55 m/s) in the presence of a large swell (E2).
To further quantify the contribution of the swell scale to UWD, UWD values were normalized with the UWD values without swell (horizontal coordinate of 0). Figure 20 shows the variation in UWD with swell scale increases proportionally in the upwind, downwind, and crosswind directions. High wind speed is associated with low swell contribution. The contribution of swell in the upwind is larger than that in the downwind direction. This is because the stronger wind in the upwind direction results in further compression of swell waves and has a bigger influence on sea surface modulation and the long-wave orbital. At an incidence angle of 6° and a moderate wind speed (10 m/s), when the weak swell (A2) is in the downwind direction, the UWD rises by about 1%, falling by about 2% in the upwind direction; when the strong swell (E2) is in the downwind direction, the UWD rises by about 16%, falling by about 18% in the upwind direction (reduced to about 23% at 12° angle of incidence).
Figure 21 depicts the variation in UWD with wind speed when large scale waves (D, E) are present; as wind speed increases, UWD displays a tendency of first decreasing and then increasing; the 6° incidence angle trend is more visible, and the standard deviation is larger. The simulation of the swell wave is defined by monochromatic waves; the horizontal Doppler velocity of the monochromatic wave equals its phase velocity which is very high for swell. With the wind and the emergence of short wave roughness, the swell surface of the mirror rapidly degraded, and UWD declined; as the wind speed increased, UWD reached extreme values and then began to gradually increase. Since the simulators do not apply to wind speeds below 2 m/s, when the wind speed exceeds 2 m/s, the simulation results are consistent with the law, demonstrating the dependability of the simulation results.

5. Discussion

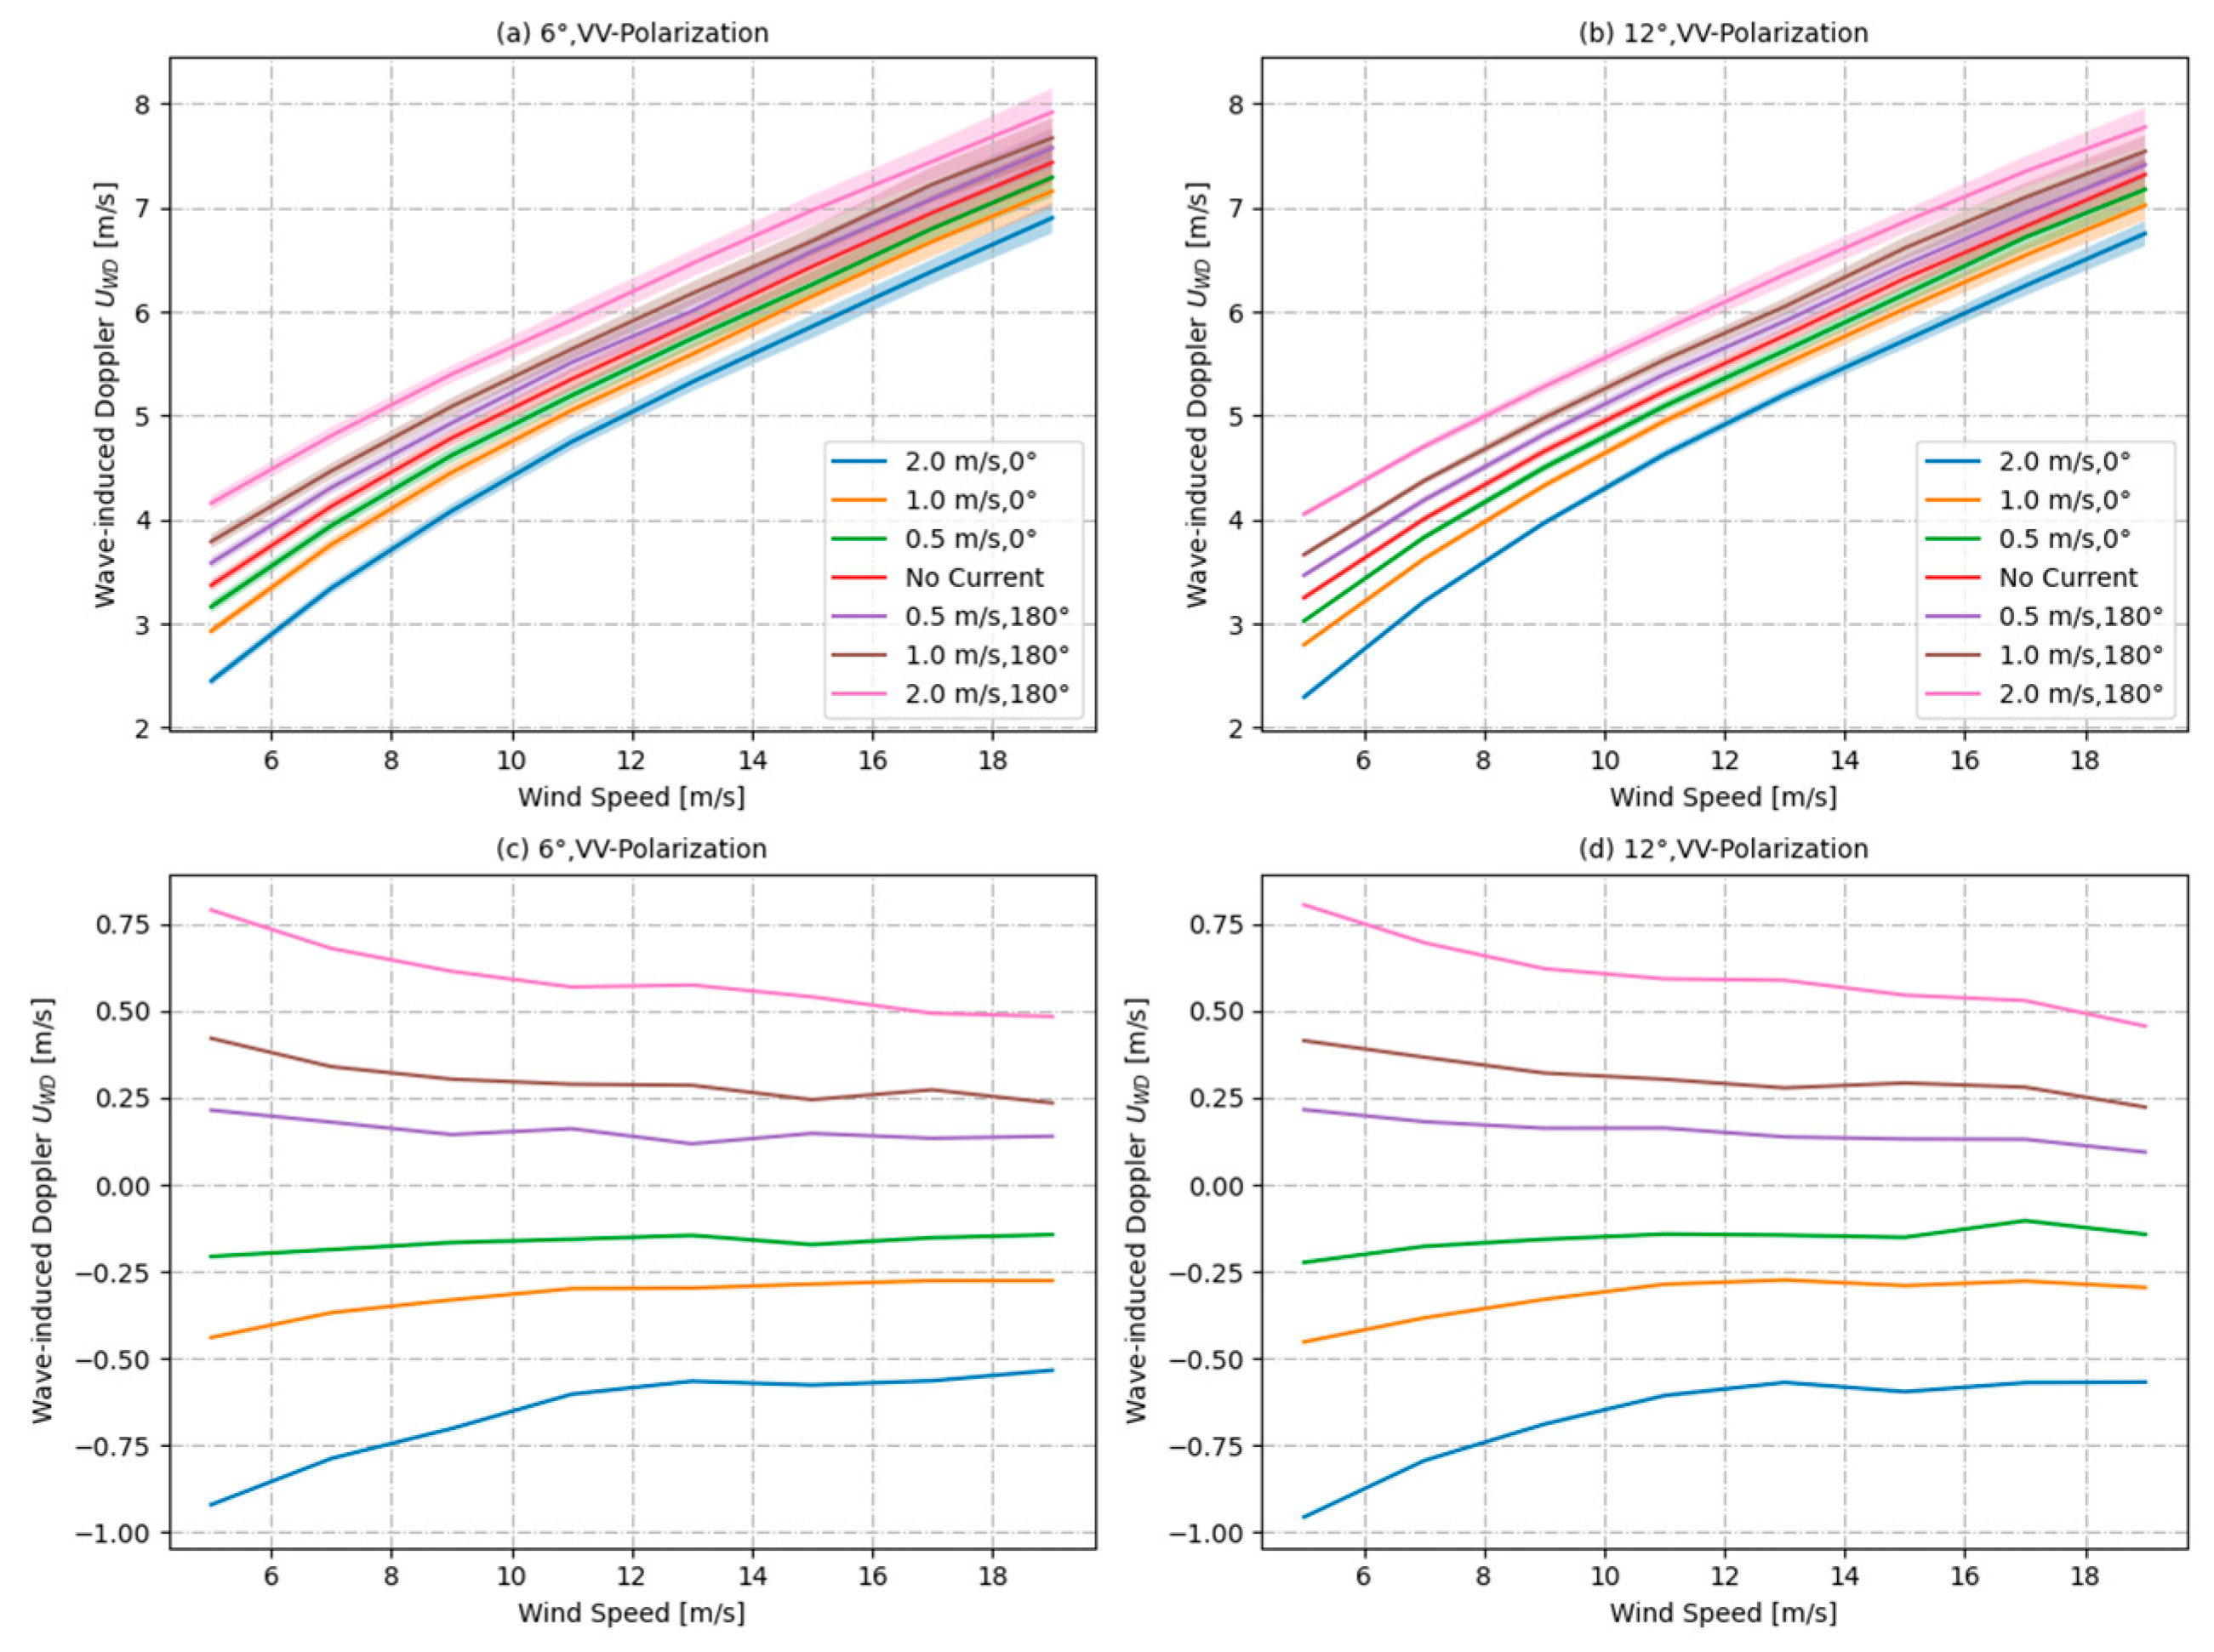
In Section 4, the sensitivity of UWD to different parameters in the presence of wind and waves and the absence of sea surface background current was analyzed. A background current vector is introduced to the simulation scenario to simulate the influence of each parameter on UWD in the presence of currents. Figure 22 shows variation in UWD and its standard deviation with a wind speed for sea surface current velocities of 0, 0.5, 1, and 2 m/s in the upwind and downwind directions, and radar azimuth and wind direction of 0°. There are differences between the UWD with and without current. The difference increases with the current speed. Contributions of the current velocity in the downwind and upwind directions to UWD are negative and positive, respectively. When there is current, UWD falls as wind speed increases. For every 1 m/s decrease in current speed, the UWD change decreases from around 0.42 m/s for an upwind speed of 5 m/s to around 0.23 m/s for an upwind speed of 19 m/s at an incidence angle of 6°, which is almost consistent with the result when the incidence angle is 12°. The dependence of UWD change on the angle between the wind and current is negligible at low current speeds. At high current speeds, UWD change generated by the downwind current is substantially larger than that generated by the upwind current.
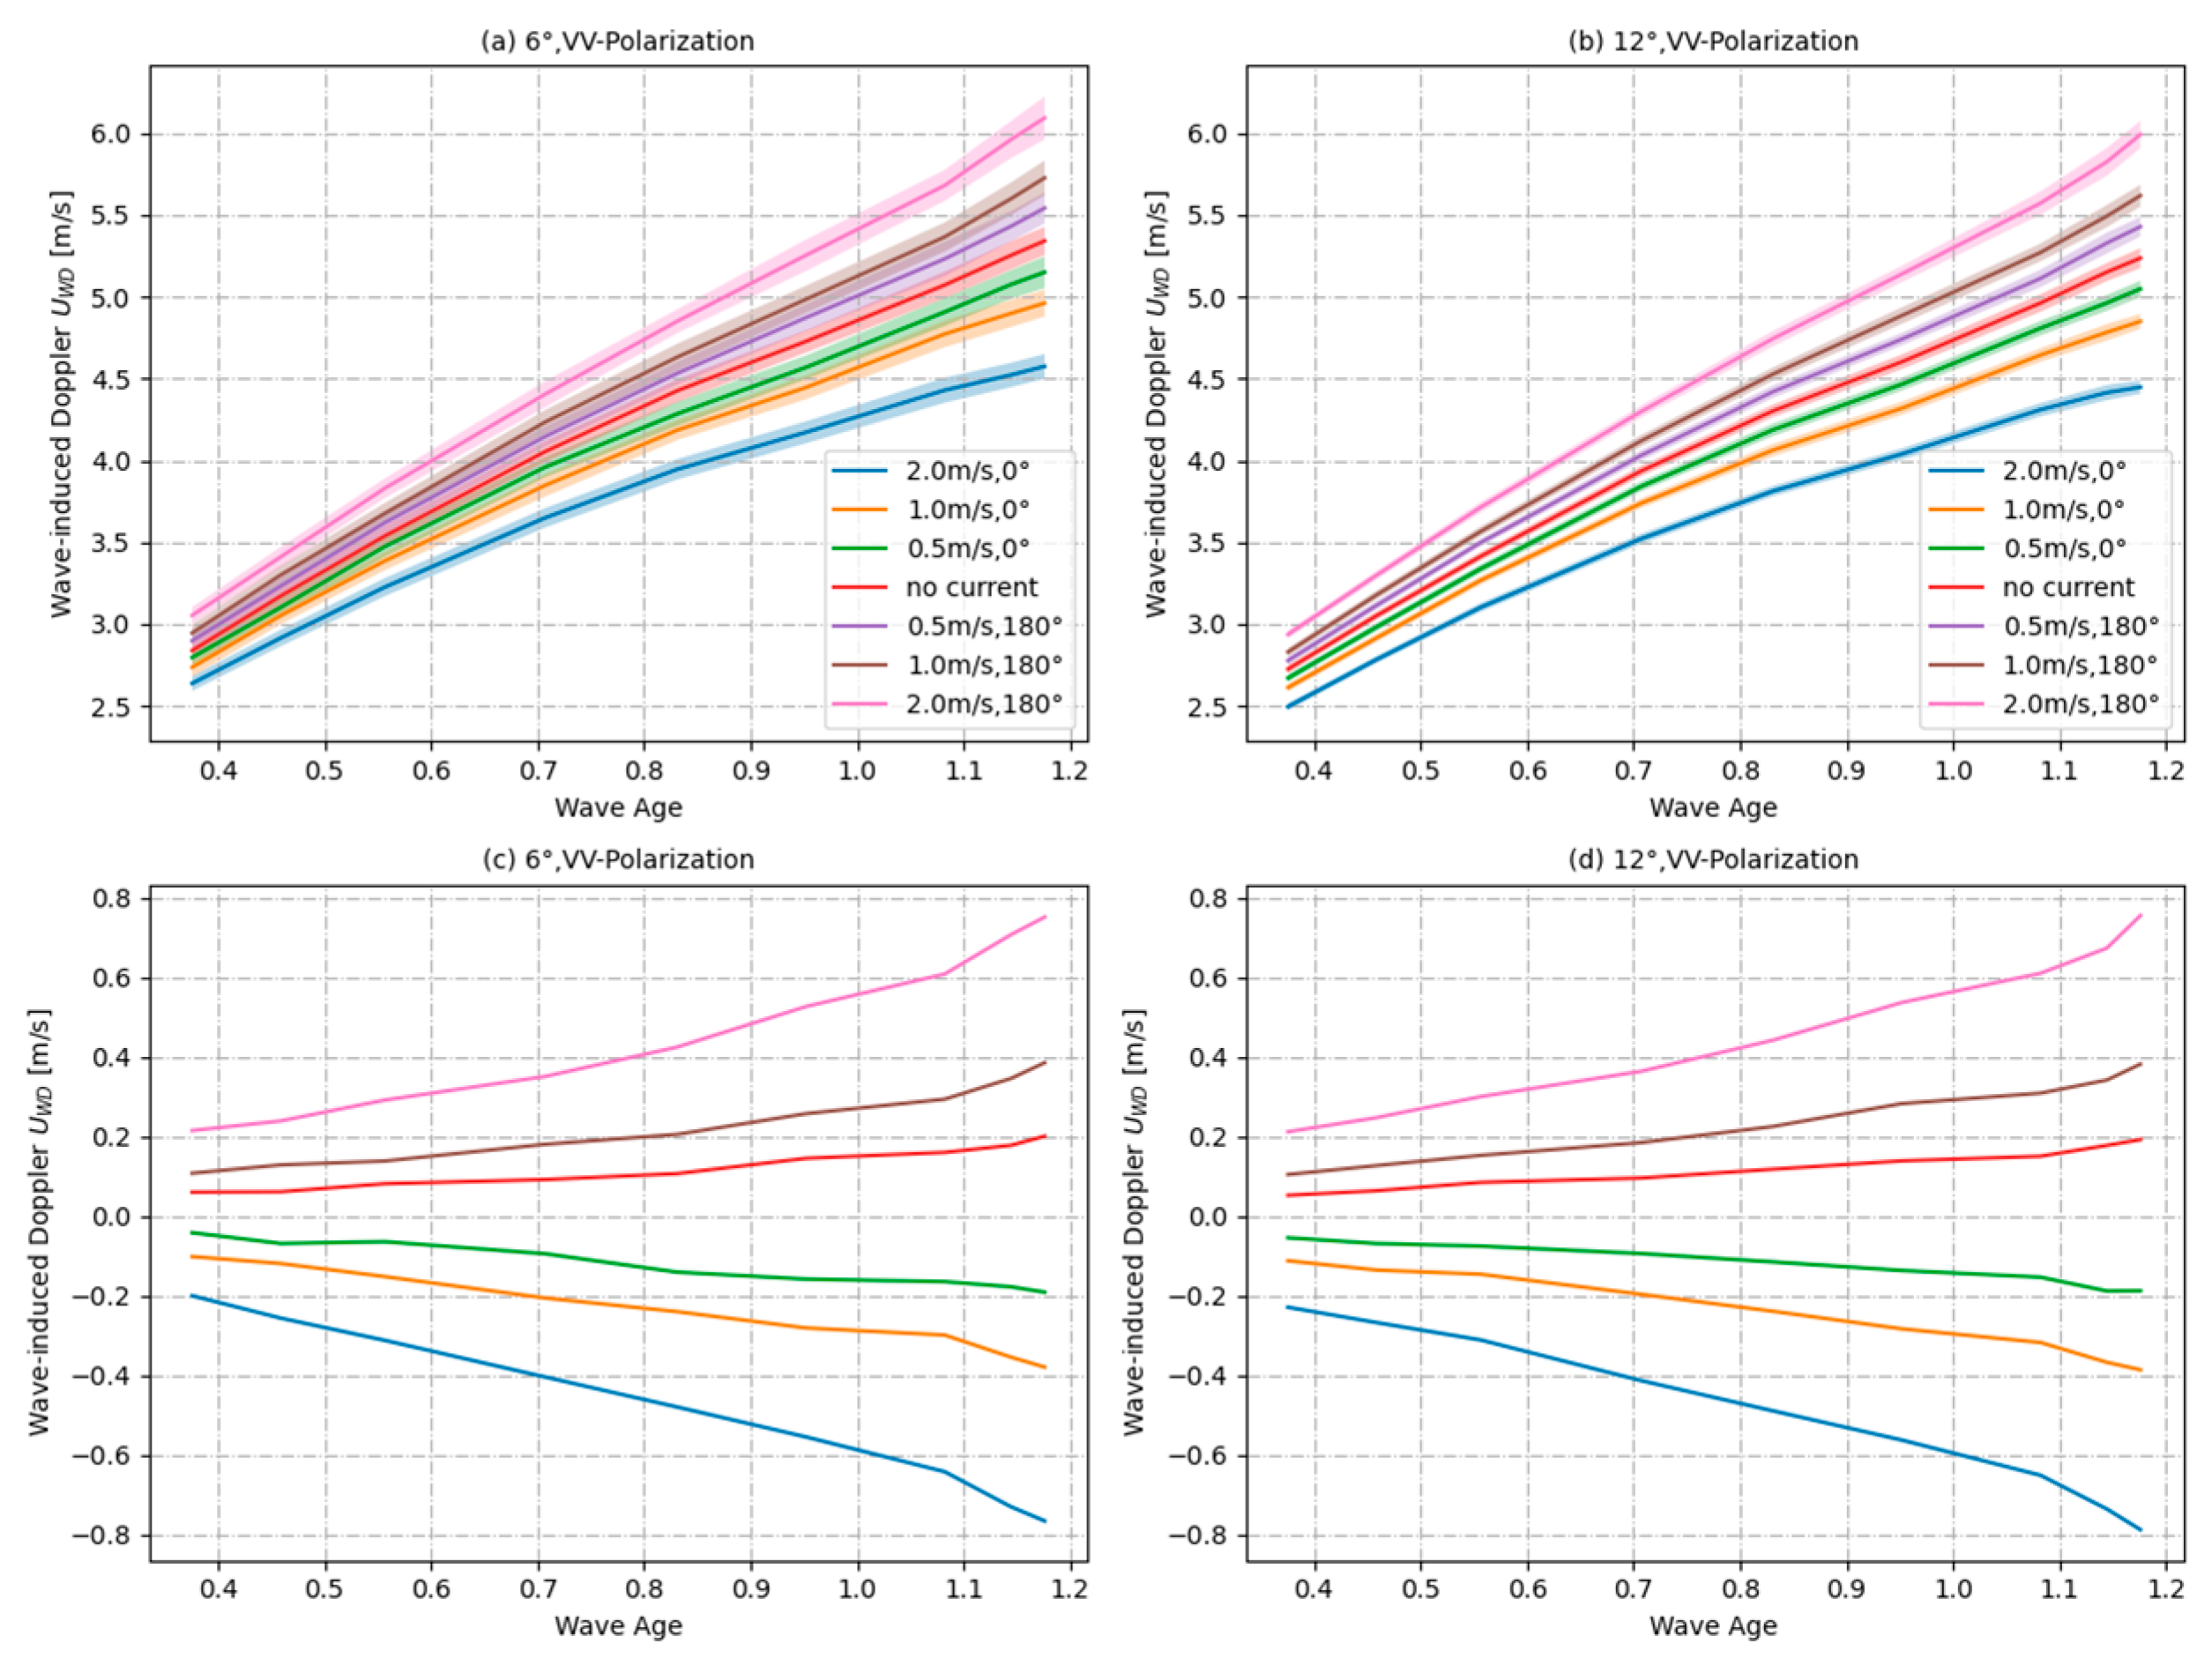
Further investigation was conducted into the role of wind and wave development in UWD in the presence of sea surface currents. Figure 23 shows the dependence of UWD on wave age for downwind and upwind sea surface currents. Wind wave developments contribute more to UWD in the presence of currents, and the larger the wave age, the greater the contribution to UWD. When the radar incidence angle is 6° and 12°, the UWD generated by the fully developed ocean is approximately 0.28 m/s higher than that generated by younger seas at a wind speed of 10 m/s and a current velocity of 1 m/s.
For the contribution of the swell to the UWD when the current is present, Figure 24 shows the variation in UWD and its standard deviation with the swell scale for a wind speed of 10 m/s and sea surface current velocities of 0.5, 1, and 2 m/s. The contribution of the swell scale to the UWD is not greatly affected by current variation. As the presence of current modifies the phase velocity of swell, the contribution of the combined action of swell and current to UWD is mostly driven by the change in swell phase velocity; however, this portion of the impact does not change as the swell scale increases.

6. Conclusions

The wave-induced Doppler frequency affects the retrieval of the sea surface current field. An accurate estimation of UWD is one of the difficulties in obtaining surface currents. Studies focused on retrieving high resolution and high accuracy sea surface current fields on a global scale using Ka-band radar have received much attention. We conducted full process simulations of sea surface Doppler characteristics and examined the coherence coefficients and the effects of key radar and sea-state parameters on the UWD from small-incidence-angle Ka-band radar data.
We conducted simulation experiments and varied the incidence and azimuth angles and polarization mode of the real-aperture radar rotating beam system. Results show that UWD varies sinusoidally with azimuth angle; the maximum magnitude of UWD is found in the downwind and upwind directions; the magnitude in the downwind is the same as that in the upwind direction. The UWD in the crosswind direction is equal to 0. At moderate wind speeds, there is little difference between the UWD at incidence angles of 6°, 9°, 12°, and 15°; there are only minor differences between the UWD in the downwind and upwind directions. The standard deviation of UWD also varies sinusoidally with azimuth angle and is the largest when the radar is in vertical side-view; standard deviations increase with the squint angle. The maximum values of standard deviation at different incidence angles are 0.47 m/s, 0.42 m/s, 0.37 m/s, and 0.33 m/s, corresponding to incidence angles of 15°, 6°, 12°, and 9°, respectively. We varied the incidence angle from 1 to 15° in the downwind direction and found that UWD decreases with increasing incidence angle. The rate of UWD change is large for incidence angles of <4° and is close to zero for incidence angles of >4°. Considering UWD standard deviation and the limitations of the specular scattering model, we conclude that an incidence angle of 6–12° can ensure reasonable instrument performance and current retrieval. There is consistency between the UWD of VV polarization and that of HH polarization at different incidence and azimuth angles and wind speeds. This is because specular scattering dominates at small incidence angles and results in a large co-polarization response.
Wind speed contributes considerably to UWD; UWD increases rapidly with increasing wind speed in both downwind and upwind directions. Both decreasing wind speed and increasing incidence angle increase the dependence of UWD on wind speed. At incidence angles of 6° and 12°, UWD increases by around 0.28 m/s for every 1 m/s increase in wind speed; the UWD increase triples as wind speed increases from 3 to 19 m/s. The magnitude of UWD at a moderate wind speed (10 m/s) is around 5 m/s and accounts for 50% of the total wind speed. The effect of wind and wave development on UWD is non-negligible. Long waves strengthen, short waves weaken, and sea surface roughness decreases as a result of wave development. The tilt modulation of wave-orbital speed on backscattering is enhanced at small incidence angles and results in a UWD increase. The dependence of UWD on wave age is considerable and influenced by wind speed and incidence angle; the influence of wind speed is stronger than that of incidence angle. Wave age increases by 33–41% from 0.6 to 1.1 at different wind speeds. The classical analytical solution Csp for the mean velocity of the specular scattering point is calculated and compared with the simulation results in this paper, and the two results agree well. As wind speed and wind wave development increase, Csp decreases gradually, relative to the UWD obtained from the simulation. The contribution of swell to UWD is relatively small. Large waves of 600 m wavelength and 4 m wave height increase the UWD maximum by only about 23% relative to no waves. This is because the swell’s orbital velocity is insufficient to have a significant effect on the UWD. The presence of the swell will decrease and then grow as the wind speed increases since the contribution provided by the phase velocity of the swell will be concealed by the wind waves. The presence of the current has an effect on the contribution of wind waves and swell to the UWD; For the UWD generated by wind waves when there is no current, contributions of downwind and upwind currents are negative and positive, respectively. Moreover, the sensitivity reduces as wind speed increases and enhance as wind waves develop. For upwind speeds of 5–19 m/s, UWD change is 0.22–0.44 m/s for every 1 m/s change in current speed. The presence of the current has little influence on the contribution of the swell to UWD.
The wave-induced Doppler velocity is the main error in sea surface current field retrievals from remote sensing data. Although small-incidence-angle Ka-band real-aperture radar systems can be powerful tools for measuring ocean currents, no satellite systems are currently operational. In this study, we used simulation experiments to evaluate the effect of key radar and sea-state parameters on UWD in sea surface current fields retrieved from small incidence Ka-band real-aperture radar data. Our study provides a reference for instrument design and sea current retrievals. In future studies, current retrievals can be validated using airborne or satellite data, and the effect of breaking waves on UWD needs to be investigated. This research did not take into account nonlinear sea surface characteristics, such as the impact of wave slope asymmetry and wave breaking, among other things. Nonlinear effects on UWD can be included in future experiments.

Author Contributions

J.M. and C.F. provided Conceptualization, discussed the methodology, and revised the manuscript. X.M. developed the methodology, simulated the experiment, analyzed the results, and wrote the manuscript. P.C. revised the manuscript. All authors have read and agreed to the published version of the manuscript.

Funding

Project supported by the Joint Funds of the National Natural Science Foundation of China (Grant No. U2006207).

Conflicts of Interest

The authors declare no conflict of interest.

References

  1. Martz, H.E., Jr.; McNeil, B.J.; Amundson, S.A.; Aspnes, D.E.; Barnett, A.; Borak, T.B.; Braby, L.A.; Heimdahl, M.P.; Hyland, S.L.; Jacobson, S.H.; et al. National Academies of Sciences, Engineering, and Medicine. In Thriving on Our Changing Planet: A Decadal Strategy for Earth Observation from Space; The National Academies Press: Washington, DC, USA, 2018; Volume 700. [Google Scholar] [CrossRef]
  2. Rodríguez, E.; Wineteer, A.; Perkovic-Martin, D.; Gál, T.; Anderson, S.; Zuckerman, S.; Stear, J.; Yang, X. Ka-band Doppler scatterometry over a loop current Eddy. Remote Sens. 2020, 12, 2388. [Google Scholar] [CrossRef]
  3. Dong, C.; McWilliams, J.C.; Liu, Y.; Chen, D. Global heat and salt transports by Eddy Movement. Nat. Commun. 2014, 5, 3294. [Google Scholar] [CrossRef] [PubMed] [Green Version]
  4. Romeiser, R. Ocean applications of Interferometric SAR. In Encyclopedia of Earth Sciences Series; Springer: Amsterdam, The Netherlands, 2014; pp. 426–428. [Google Scholar] [CrossRef]
  5. Ardhuin, F.; Aksenov, Y.; Benetazzo, A.; Bertino, L.; Brandt, P.; Caubet, E.; Chapron, B.; Collard, F.; Cravatte, S.; Delouis, J.-M.; et al. Measuring currents, ice drift, and waves from space: The sea surface kinematics multiscale monitoring (skim) concept. Ocean Sci. 2018, 14, 337–354. [Google Scholar] [CrossRef] [Green Version]
  6. Nouguier, F.; Chapron, B.; Collard, F.; Mouche, A.A.; Rascle, N.; Ardhuin, F.; Wu, X. Sea surface kinematics from near-nadir radar measurements. IEEE Trans. Geosci. Remote Sens. 2018, 56, 6169–6179. [Google Scholar] [CrossRef]
  7. Marié, L.; Collard, F.; Nouguier, F.; Pineau-Guillou, L.; Hauser, D.; Boy, F.; Méric, S.; Sutherland, P.; Peureux, C.; Monnier, G.; et al. Measuring ocean total surface current velocity with the Kuros and Karadoc Airborne near-nadir doppler radars: A multi-scale analysis in preparation for the skim mission. Ocean Sci. 2020, 16, 1399–1429. [Google Scholar] [CrossRef]
  8. Ardhuin, F.; Brandt, P.; Gaultier, L.; Donlon, C.; Battaglia, A.; Boy, F.; Casal, T.; Chapron, B.; Collard, F.; Cravatte, S.; et al. Skim, a candidate satellite mission exploring global ocean currents and waves. Front. Mar. Sci. 2019, 6, 209. [Google Scholar] [CrossRef] [Green Version]
  9. Rodríguez, E.; Bourassa, M.; Chelton, D.; Farrar, J.T.; Long, D.; Perkovic-Martin, D.; Samelson, R. The winds and currents mission concept. Front. Mar. Sci. 2019, 6, 438. [Google Scholar] [CrossRef]
  10. Du, Y.; Dong, X.; Jiang, X.; Zhang, Y.; Zhu, D.; Sun, Q.; Wang, Z.; Niu, X.; Chen, W.; Zhu, C.; et al. Ocean Surface Current Multiscale Observation Mission (OSCOM): Simultaneous measurement of ocean surface current, vector wind, and temperature. Prog. Oceanogr. 2021, 193, 102531. [Google Scholar] [CrossRef]
  11. Rodríguez, E.; Wineteer, A.; Perkovic-Martin, D.; Gál, T.; Stiles, B.; Niamsuwan, N.; Monje, R. Estimating ocean vector winds and currents using a Ka-band pencil-beam Doppler scatterometer. Remote Sens. 2018, 10, 576. [Google Scholar] [CrossRef] [Green Version]
  12. Chapron, B. Direct measurements of ocean surface velocity from space: Interpretation and validation. J. Geophys. Res. 2005, 110, C07008. [Google Scholar] [CrossRef]
  13. Fois, F.; Hoogeboom, P.; Le Chevalier, F.; Stoffelen, A. An analytical model for the description of the full-polarimetric sea surface Doppler signature. J. Geophys. Res. Oceans 2015, 120, 988–1015. [Google Scholar] [CrossRef] [Green Version]
  14. Johannessen, J.A.; Chapron, B.; Collard, F.; Kudryavtsev, V.; Mouche, A.; Akimov, D.; Dagestad, K.-F. Direct ocean surface velocity measurements from space: Improved quantitative interpretation of Envisat Asar Observations. Geophys. Res. Lett. 2008, 35, L22608. [Google Scholar] [CrossRef] [Green Version]
  15. Romeiser, R.; Thompson, D.R. Numerical Study on the along-track interferometric radar imaging mechanism of oceanic surface currents. IEEE Trans. Geosci. Remote Sens. 2000, 38, 446–458. [Google Scholar] [CrossRef] [Green Version]
  16. Johannessen, J.A.; Kudryavtsev, V.; Chapron, B. Backscatter and Doppler Signals of Surface Current in SAR Images: A Step Towards Inverse Modelling. In Proceedings of the OceanSAR 2006-Third Workshop on Coastal and Marine Applications of SAR, St. John’s, NL, Canada, 23–25 October 2006. [Google Scholar]
  17. Hansen, M.W.; Kudryavtsev, V.; Chapron, B.; Johannessen, J.A.; Collard, F.; Dagestad, K.-F.; Mouche, A.A. Simulation of radar backscatter and Doppler shifts of wave–current interaction in the presence of strong tidal current. Remote Sens. Environ. 2012, 120, 113–122. [Google Scholar] [CrossRef] [Green Version]
  18. Yurovsky, Y.; Kudryavtsev, V.; Grodsky, S.; Chapron, B. Sea surface ka-band Doppler measurements: Analysis and model development. Remote Sens. 2019, 11, 839. [Google Scholar] [CrossRef]
  19. Martin, A.C.; Gommenginger, C.; Marquez, J.; Doody, S.; Navarro, V.; Buck, C. Wind-wave-induced velocity in ATI SAR ocean surface currents: First experimental evidence from an airborne campaign. J. Geophys. Res. Oceans 2016, 121, 1640–1653. [Google Scholar] [CrossRef] [Green Version]
  20. Collard, F.; Mouche, A.; Chapron, B.; Danilo, C.; Johannessen, J. Routine high resolution observation of selected major surface currents from space. In Proceedings of the SEASAR 2008, SP-656, ESA, ESA-ESRIN, Frascati, Italy, 21–25 January 2008. [Google Scholar]
  21. Krug, M.; Mouche, A.; Collard, F.; Johannessen, J.A.; Chapron, B. Mapping the agulhas current from space: An assessment of asar surface current velocities. J. Geophys. Res. Oceans 2010, 115, 10026. [Google Scholar] [CrossRef] [Green Version]
  22. Mouche, A.A.; Collard, F.; Chapron, B.; Dagestad, K.-F.; Guitton, G.; Johannessen, J.A.; Kerbaol, V.; Hansen, M.W. On the use of Doppler shift for sea surface wind retrieval from SAR. IEEE Trans. Geosci. Remote Sens. 2012, 50, 2901–2909. [Google Scholar] [CrossRef]
  23. Li, S.; Liu, B.; Shen, H.; Hou, Y.; Perrie, W. Wind wave effects on remote sensing of sea surface currents from SAR. J. Geophys. Res. Oceans 2020, 125. [Google Scholar] [CrossRef]
  24. Yurovsky, Y.Y.; Kudryavtsev, V.N.; Grodsky, S.A.; Chapron, B. Ka-band Doppler scatterometry: A strong wind case study. Remote Sens. 2022, 14, 1348. [Google Scholar] [CrossRef]
  25. Miao, Y.; Dong, X.; Bourassa, M.A.; Zhu, D. Effects of ocean wave directional spectra on Doppler retrievals of Ocean Surface Current. IEEE Trans. Geosci. Remote Sens. 2022, 60, 4204812. [Google Scholar] [CrossRef]
  26. Bao, Q.; Lin, M.; Zhang, Y.; Dong, X.; Lang, S.; Gong, P. Ocean surface current inversion method for a Doppler scatterometer. IEEE Trans. Geosci. Remote Sens. 2017, 55, 6505–6516. [Google Scholar] [CrossRef]
  27. Bourassa, M.A.; Rodriguez, E.; Chelton, D. Winds and currents mission: Ability to observe mesoscale AIR/SEA coupling. In Proceedings of the International Geoscience and Remote Sensing Symposium—IGARSS, Beijing, China, 10–15 July 2016; pp. 7392–7395. [Google Scholar] [CrossRef]
  28. Yan, Q.; Zhang, J.; Fan, C.; Meng, J. Analysis of ku- and ka-band sea surface backscattering characteristics at low-incidence angles based on the GPM dual-frequency precipitation radar measurements. Remote Sens. 2019, 11, 754. [Google Scholar] [CrossRef] [Green Version]
  29. Stuhlmeier, R. Gerstner’s Water Wave and Mass Transport. J. Math. Fluid Mech. 2015, 17, 761–767. [Google Scholar] [CrossRef]
  30. Nouguier, F.; Guérin, C.-A.; Chapron, B. “choppy wave” model for nonlinear gravity waves. J. Geophys. Res. 2009, 114, C09012. [Google Scholar] [CrossRef] [Green Version]
  31. Fournier, A.; Reeves, W.T. A simple model of ocean waves. ACM SIGGRAPH Comput. Graph. 1986, 20, 75–84. [Google Scholar] [CrossRef]
  32. Massel, S.R. On the geometry of Ocean Surface Waves. Oceanologia 2011, 53, 521–548. [Google Scholar] [CrossRef] [Green Version]
  33. Shahrezaei, I.H.; Kim, H.-C. A novel sar fractal roughness modeling of complex random polar media and textural synthesis based on a numerical scattering distribution function processing. IEEE J. Sel. Top. Appl. Earth Obs. Remote Sens. 2021, 14, 7386–7409. [Google Scholar] [CrossRef]
  34. Donelan, A.M.; Hamilton, J.; Hui, H.W. Directional spectra of wind-generated ocean waves. Philos. Trans. R. Soc. Lond. Ser. A Math. Phys. Sci. 1985, 315, 509–562. [Google Scholar] [CrossRef]
  35. Hasselmann, K.; Barnett, T.; Bouws, E.; Carlson, H.; Cartwright, D.; Enke, K.; Ewing, J.; Gienapp, H.; Hasselmann, D.; Kruseman, P.; et al. Measurements of wind-wave growth and swell decay during the Joint North Sea Wave Project (JONSWAP). Deut. Hydrogr. Z. 1973, 8, 1–95. Available online: https://pure.mpg.de/pubman/item/item_3262854_4/component/file_3282032/1973_Jonswap-Hasselmann1973.pdf (accessed on 12 February 2023).
  36. Kahma, K.K. A study of the growth of the wave spectrum with fetch. J. Phys. Oceanogr. 1981, 11, 1503–1515. [Google Scholar] [CrossRef]
  37. Kitaigordskii, S.A.; Krasitskii, V.P.; Zaslavskii, M.M. On Phillips’ theory of equilibrium range in the spectra of wind-generated gravity waves. J. Phys. Oceanogr. 1975, 5, 410–420. [Google Scholar] [CrossRef]
  38. Phillips, O.M. Spectral and statistical properties of the equilibrium range in wind-generated gravity waves. J. Fluid Mech. 1985, 156, 505–531. [Google Scholar] [CrossRef]
  39. Elfouhaily, T.; Chapron, B.; Katsaros, K.; Vandemark, D. A unified directional spectrum for long and short wind-driven waves. J. Geophys. Res. Oceans 1997, 102, 15781–15796. [Google Scholar] [CrossRef] [Green Version]
  40. Ulaby, F.T.; Moore, R.K.; Fung, A.K. Introduction to Random Surface Scattering and Emission. In Microwave Remote Sensing: Active and Passive, Vol.II: Radar Remote Sensing and Surface Scattering and Emission Theory; Addision-Wesbey Publishing: London, UK, 1982; pp. 922–1033. [Google Scholar]
  41. Mouche, A.A.; Chapron, B.; Reul, N.; Collard, F. Predicted doppler shifts induced by ocean surface wave displacements using asymptotic electromagnetic wave scattering theories. Wave Random Complex Media 2008, 18, 185–196. [Google Scholar] [CrossRef]
  42. McDaniel, S.T. Small-slope predictions of microwave backscatter from the Sea Surface. Wave Random Complex Media 2001, 11, 343–360. [Google Scholar] [CrossRef]
  43. Nouguier, F.; Mouche, A.; Rascle, N.; Chapron, B.; Vandemark, D. Analysis of dual-frequency ocean backscatter measurements at ku- and ka-bands using near-nadir incidence GPM radar data. IEEE Geosci. Remote Sens. Lett. 2016, 13, 1310–1314. [Google Scholar] [CrossRef] [Green Version]
  44. Boisot, O.; Pioch, S.; Fatras, C.; Caulliez, G.; Bringer, A.; Borderies, P.; Lalaurie, J.-C.; Guérin, C.-A. Ka-band backscattering from water surface at small incidence: A wind-wave tank study. J. Geophys. Res. Oceans 2015, 120, 3261–3285. [Google Scholar] [CrossRef]
  45. Kodis, R. A note on the theory of scattering from an irregular surface. IEEE T. Antenn. Propag. 1966, 14, 77–82. [Google Scholar] [CrossRef]
  46. Graber, H.C.; Thompson, D.R.; Carande, R.E. Ocean surface features and currents measured with synthetic aperture radar interferometry and HF radar. J. Geophys. Res. Oceans 1996, 101, 25813–25832. [Google Scholar] [CrossRef]
  47. Wineteer, A.; Perkovic-Martin, D.; Monje, R.; Rodríguez, E.; Gál, T.; Niamsuwan, N.; Nicaise, F.; Srinivasan, K.; Baldi, C.; Majurec, N.; et al. Measuring winds and currents with Ka-band Doppler scatterometry: An airborne implementation and progress towards a spaceborne mission. Remote Sens. 2020, 12, 1021. [Google Scholar] [CrossRef] [Green Version]
  48. Cox, C.; Munk, W. Measurement of the roughness of the sea surface from photographs of the sun’s glitter. J. Opt. Soc. Am. 1954, 44, 838. [Google Scholar] [CrossRef]
  49. Lee, J.-S.; Jansen, R.W.; Schuler, D.L.; Ainsworth, T.L.; Marmorino, G.O.; Chubb, S.R. Polarimetric analysis and modeling of multifrequency SAR signatures from Gulf Stream fronts. IEEE J. Ocean. Eng. 1998, 23, 322–333. [Google Scholar] [CrossRef]
  50. Bao, Q.; Dong, X.; Zhu, D.; Lang, S.; Xu, X. The feasibility of ocean surface current measurement using pencil-beam rotating scatterometer. IEEE J. Sel. Top. Appl. Earth Obs. Remote Sens. 2015, 8, 3441–3451. [Google Scholar] [CrossRef]
  51. Valenzuela, G.R. Theories for the interaction of electromagnetic and Oceanic Waves—A Review. Bound-Lay. Meteorol. 1978, 13, 61–85. [Google Scholar] [CrossRef]
  52. Kudryavtsev, V. A semiempirical model of the normalized radar cross-section of the sea surface 1. background model. J. Geophys. Res. 2003, 108, FET 2-1–FET 2-24. [Google Scholar] [CrossRef] [Green Version]
  53. Kudryavtsev, V. On radar imaging of current features: 1. model and comparison with observations. J. Geophys. Res. Oceans 2005, 110, 07016. [Google Scholar] [CrossRef] [Green Version]
  54. Hossan, A.; Jones, W.L. Ku- and ka-band Ocean Surface Radar backscatter model functions at low-incidence angles using full-swath GPM DPR Data. Remote Sens. 2021, 13, 1569. [Google Scholar] [CrossRef]
  55. Yurovsky, Y.Y.; Kudryavtsev, V.N.; Chapron, B.; Grodsky, S.A. Modulation of ka-band Doppler radar signals backscattered from the Sea Surface. IEEE Trans. Geosc. Remote Sens. 2018, 56, 2931–2948. [Google Scholar] [CrossRef] [Green Version]
  56. Mouche, A.A.; Hauser, D.; Daloze, J.-F.; Guerin, C. Dual-polarization measurements at C-band over the ocean: Results from airborne radar observations and comparison with Envisat Asar Data. IEEE Trans. Geosc. Remote Sens. 2005, 43, 753–769. [Google Scholar] [CrossRef]
  57. Bao, L.; Zhang, X.; Cao, C.; Wang, X.; Jia, Y.; Gao, G.; Zhang, Y.; Wan, Y.; Zhang, J. Impact of polarization basis on wind and wave parameters estimation using the azimuth cutoff from GF-3 Sar Imagery. IEEE Trans. Geosc. Remote Sens. 2022, 60, 5234716. [Google Scholar] [CrossRef]
  58. Longuet-Higgins, M.S. The Statistical Analysis of a Random, Moving Surface. Philos. Trans. R. Soc. A 1957, 249, 321–387. [Google Scholar] [CrossRef]
  59. Dobson, F.; Perrie, W.; Toulany, B. On the deep-water fetch laws for wind-generated surface gravity waves. Atmos. Ocean 1989, 27, 210–236. [Google Scholar] [CrossRef]
  60. Hwang, P.A. Observations of swell influence on Ocean Surface Roughness. J. Geophys. Res. Oceans 2008, 113, C12024. [Google Scholar] [CrossRef]
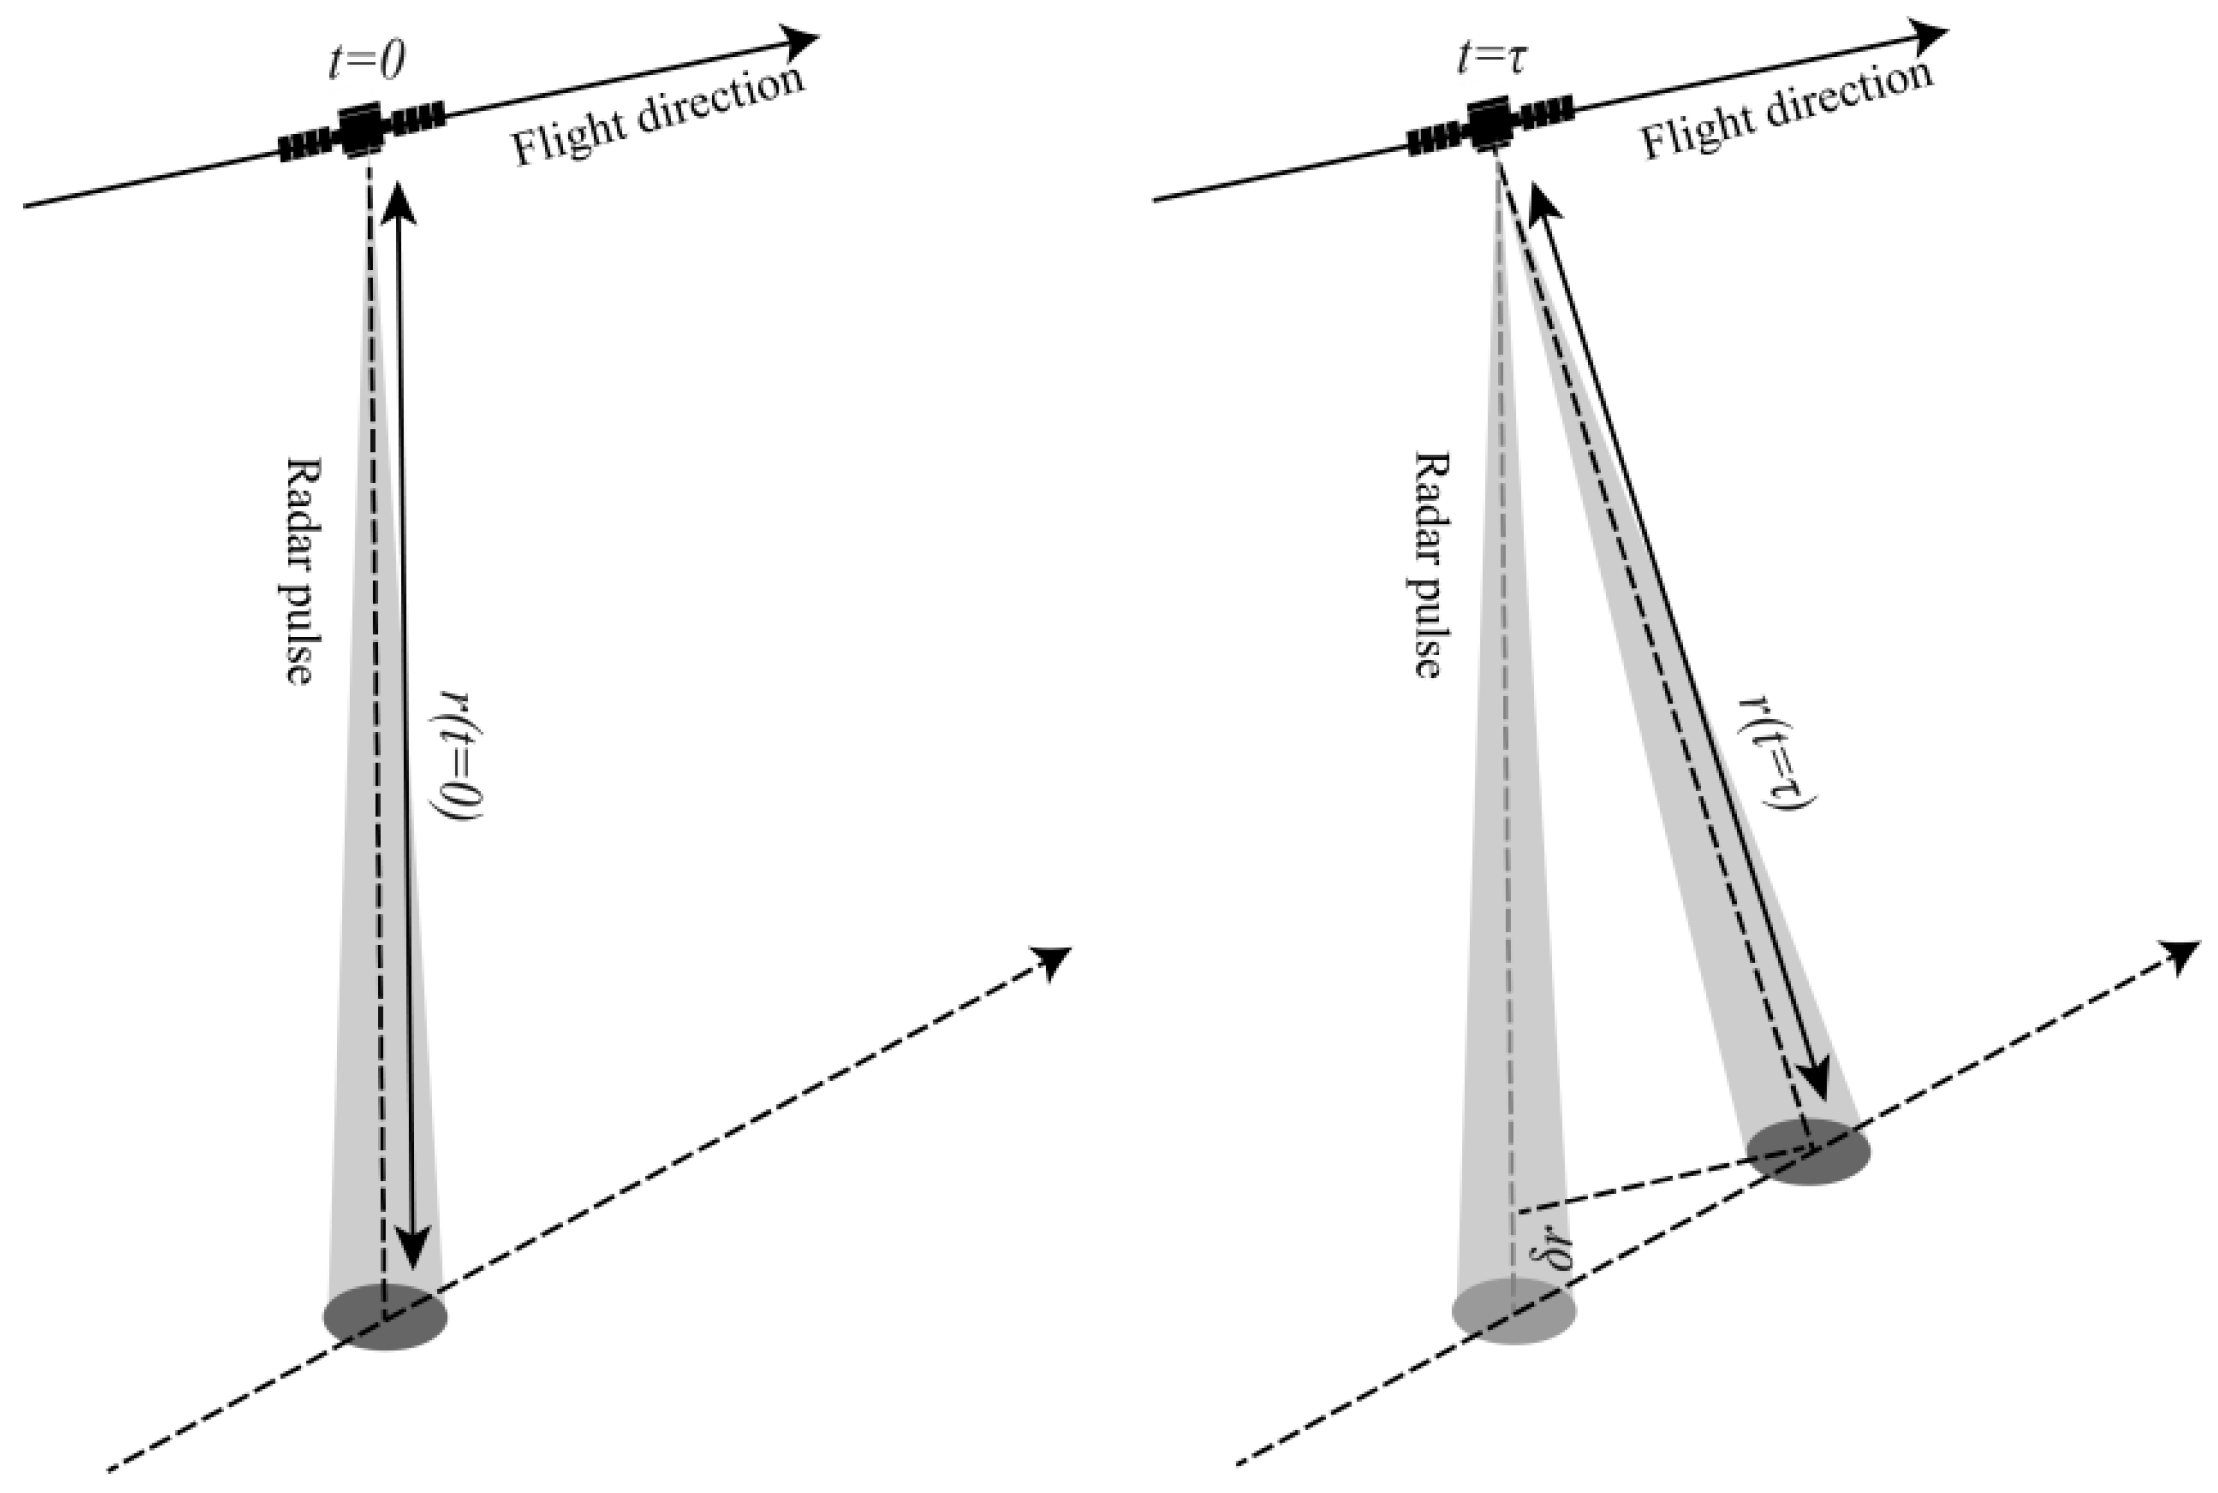
Figure 1. The schematic diagram of real-aperture radar interferometry.
Remotesensing 15 01127 g001
Figure 2. Schematic diagram of the measurement of sea surface currents using a rotating beam radar system.
Remotesensing 15 01127 g002
Figure 3. Flowchart of UWD numerical simulation in Ka-band real-aperture radar with small incidence angle.
Remotesensing 15 01127 g003
Figure 4. Field of sea surface heights under various sea conditions. (ac) represent the sea surface without swell at low wind speed (U = 5 m/s), medium wind speed (U = 10 m/s), and high wind speed (U = 15 m/s), respectively. (d) is a scene with swell on the sea surface and a medium wind speed, with a swell wavelength of about 300 m and an effective wave height of 2 m. (e) is transverse one-dimensional profile of (ad). (f) is longitudinal one-dimensional profile of (ad). The line I is the profile line at the trough of the swell, and the line II is the profile line at the crest of the swell.
Remotesensing 15 01127 g004
Figure 5. Sea surface backscattering coefficients obtained by different incidence angles and polarization methods, with sea surface parameters of 10 m/s wind speed, swell wavelength of about 300 m, and effective wave height of 4 m.
Remotesensing 15 01127 g005
Figure 6. Sea surface scattering echo intensity image with wind speed of 10 m/s, swell wavelength of 150 m, wave height of 1 m, wind and swell directions of 0°, radar incidence angles of 6° and 12°, and azimuth angle of 0°. The horizontal axis represents range sampling points, and the vertical axis represents the number of pulses in the azimuth direction.
Remotesensing 15 01127 g006
Figure 7. (a) incidence angle 6°, 9°, 12°, and 15°, 10 m/s wind speed, swell wavelength 150 m, wave height 1 m, wind direction and swell direction are 0°, and the pulse pair coherence coefficient with azimuth angle, (b) 5, 10, 15, and 20 m/s wind speed, radar azimuth, wind direction, swell direction are 0°, and different radar incidence angle of the pulse pair coherence.
Remotesensing 15 01127 g007
Figure 8. At 0°, 90°, and 180° azimuth angles, the coherence coefficient of pulse pairs varies with the wind speed (3~19 m/s); the wind direction is 0°, and there is no swell.
Remotesensing 15 01127 g008
Figure 9. Variation in UWD values and standard deviations with azimuth for incidence angles of 6°, 9°, 12°, and 15°, wind direction of 0°, and wind speed of 10 m/s. There is no swell in (a,b), and there is a swell in (c,d) with a wavelength of 150 m, a wave height of 1 m, and a direction of 0°. The y-axis on the left refers to UWD values, which are shown in colored solid lines. The y-axis on the right refers to UWD standard deviations, which are shown in colored dashed lines.
Remotesensing 15 01127 g009
Figure 10. Variation in UWD and standard deviation with radar incidence angle for 5, 10, 15, and 20 m/s wind speeds, with radar azimuth of 0°, wind direction of 0°, there is no swell in (a,b), and there is a swell in (c,d) with a wavelength of 150 m, a wave height of 1 m, and a direction of 0°. The colored solid lines indicate UWD, and the corresponding colored shading is the standard deviation.
Remotesensing 15 01127 g010
Figure 11. Variation in UWD and standard deviation with wind speed for radar incidence angles of 6° and 12°, azimuth angles of 0°, and 0°, 90°, and 180° wind directions without swell. The colored solid line indicates UWD, and the corresponding colored shading is the standard deviation.
Remotesensing 15 01127 g011
Figure 12. Variation in dimensionless UWD with wind speed for relative wind directions of 0° and 180° and incidence angles of 6° and 12°.
Remotesensing 15 01127 g012
Figure 13. A comparison of the average specular scattering point velocity Csp with simulation results at various wind speeds and relative wind directions.
Remotesensing 15 01127 g013
Figure 14. Variation in UWD and standard deviation with radar azimuth for 5, 10, and 15 m/s wind speeds corresponding to different wind fetches (50 km, 100 km, and 500 km), with radar incidence angles of 6° and 12°, wind direction of 0°, and no swell. The y-axis on the left refers to UWD values, which are shown in colored solid lines. The y-axis on the right refers to UWD standard deviations, which are shown in colored dashed lines.
Remotesensing 15 01127 g014
Figure 15. Relationship between wave age and wind fetch in Elfouhaily spectrum.
Remotesensing 15 01127 g015
Figure 16. Contribution of wave age to UWD at 5, 10, and 15 m/s wind speeds with radar incidence angles of 6° and 12°, radar azimuth of 0°, wind directions of 0° and 180°, and no swell. The colored solid lines indicate UWD, the black lines indicate Csp, and the corresponding colored shading is the standard deviation.
Remotesensing 15 01127 g016
Figure 17. Variation in dimensionless UWD with wave age for different wind speeds, radar incidence angles of 6° and 12°, radar azimuth of 0°, wind direction of 0°, and no waves; solid line indicates downwind and dashed line indicates upwind.
Remotesensing 15 01127 g017
Figure 18. Variation in UWD values and standard deviations with azimuth angle, swell scale (B2 and D2 according to Table 2), and radar incidence angle (6° and 12°) with medium wind speed (10 m/s) and swell in the downwind, crosswind, and upwind directions. The y-axis on the left refers to UWD values, which are shown in colored solid lines. The y-axis on the right refers to UWD standard deviations, which are shown in colored dashed lines.
Remotesensing 15 01127 g018
Figure 19. Wind speeds of 5, 10, and 15 m/s. Different swell scale in different wind directions when the contribution to the UWD; the horizontal coordinate swell scale corresponds to the swell scale defined in Table 1; colored solid line segment plotted the same wavelength; the effective wave height increases the contribution to the UWD, corresponding to the color shading for the standard deviation of the data; black dashed line is connected to the approximate equal scaling of the swell.
Remotesensing 15 01127 g019
Figure 20. Variation in dimensionless Doppler shift with swell scale for wind speeds of 5, 10, and 15 m/s and radar azimuth of 0°.
Remotesensing 15 01127 g020
Figure 21. The variation in UWD and its standard deviation with wind speed when the swell scale is D1, D2, D3, E1, E2, and E3, where the colorful shading represents the data standard deviation.
Remotesensing 15 01127 g021
Figure 22. (a,b) represent the variation in UWD with wind speed for radar incidence angles of 6° and 12°, wind speed of 10 m/s, and sea surface currents of 0.5, 1, and 2 m/s when they are in downwind and upwind directions, respectively. The colored solid lines indicate the UWD, and the corresponding colored shading is the standard deviation. (c,d) correspond to (a,b) and indicate the difference in UWD between the presence and absence of current.
Remotesensing 15 01127 g022
Figure 23. (a,b) represent the variation in UWD with wave age for radar incidence angles of 6° and 12°, wind speed of 10 m/s, and sea surface currents of 0.5, 1, and 2 m/s when they are in downwind and upwind directions, respectively. The colored solid lines indicate the UWD, and the corresponding colored shading is the standard deviation. (c,d) correspond to (a,b) and indicate the difference in UWD between the presence and absence of current.
Remotesensing 15 01127 g023
Figure 24. (a,b) show the variation in UWD with the scale of the swell when there is 10 m/s wind speed and swell in the same direction as the wind, with 0.5, 1, and 2 m/s surface currents in the downwind and upwind directions, respectively, with radar incidence angles of 6° and 12°. The colored solid lines indicate UWD, and the corresponding colored shading is 0.3 times the standard deviation. (c,d) correspond to (a,b), indicating the difference between the UWD of the presence and absence of current.
Remotesensing 15 01127 g024
Table 1. Basic simulation parameters.
Radar ParametersSea-State Parameters
Radar frequency35 GHzWind speed3~19 m/s
PolarizationVV/HHWind direction0~360°
PRF32,000 HzWind fetch5~2000 km
Number of pulses1024Swell frequency0.051~0.140 Hz
Azimuth angle0~360°Swell wave height0.3~4.5 m
Incidence angle1~15°Swell direction0~360°
Platform altitude690 kmCurrent velocity0.5, 1, 2 m/s
Bandwidth200 MHzCurrent direction0~360°
Table 2. Swell scale.
No.Frequency (Hz)Wavelength (m)Effective Wave Height (m)Swell Scale
10.140~800.3A1
20.5A2
30.8A3
40.102~1500.5B1
51B2
61.5B3
70.072~3001.5C1
82C2
92.5C3
100.059~4502.5D1
113D2
123.5D3
130.051~6003.5E1
144E2
154.5E3
A, B, C, D and E refer to swells with the same wavelength. The rise in the number after the letter represents an increase in the significant wave height. The relationship between frequency f r and wavelength is λ = g / 2 π f r 2 .
Disclaimer/Publisher’s Note: The statements, opinions and data contained in all publications are solely those of the individual author(s) and contributor(s) and not of MDPI and/or the editor(s). MDPI and/or the editor(s) disclaim responsibility for any injury to people or property resulting from any ideas, methods, instructions or products referred to in the content.