Article

Mapping of Flood-Prone Areas Utilizing GIS Techniques and Remote Sensing: A Case Study of Duhok, Kurdistan Region of Iraq

by
Aumed Rahman M Amen
1,
Andam Mustafa
2,*,
Dalshad Ahmed Kareem
3,
Hasan Mohammed Hameed
4,
Ayub Anwar Mirza
5,
Michał Szydłowski
2 and
Bala Kawa M. Saleem
6
1
Department of Civil Engineering, Faculty of Engineering, Soran University, Soran 44008, Iraq
2
Faculty of Civil and Environmental Engineering, Gdańsk University of Technology, Narutowicza 11/12, 80-233 Gdańsk, Poland
3
Erbil Technology College, Erbil Polytechnic University, Erbil 44001, Iraq
4
Geomatics (Surveying) Engineering, College of Engineering, Salahaddin University-Erbil, Erbil 44001, Iraq
5
Center of languages, University of Duhok, Duhok 42001, Iraq
6
General Directorate of Water and Sewage, Ministry of Municipalities and Tourism, Erbil 44001, Iraq
*
Author to whom correspondence should be addressed.
Remote Sens. 2023, 15(4), 1102; https://doi.org/10.3390/rs15041102
Submission received: 24 December 2022 / Revised: 13 February 2023 / Accepted: 15 February 2023 / Published: 17 February 2023

Abstract

:
One of the most common types of natural disaster, floods can happen anywhere on Earth, except in the polar regions. The severity of the damage caused by flooding can be reduced by putting proper management and protocols into place. Using remote sensing and a geospatial methodology, this study attempts to identify flood-vulnerable areas of the central district of Duhok, Iraq. The analytical hierarchy process (AHP) technique was used to give relative weights to 12 contributing parameters, including elevation, slope, distance from the river, rainfall, land use land cover, soil, lithology, topographic roughness index, topographic wetness index, aspect, the sediment transport index, and the stream power index in order to calculate the Flood Hazard Index (FHI). The relative importance of each criterion was revealed by a sensitivity analysis of the parameter values. This research developed a final flood susceptibility map and identified high-susceptible zones. This was classified anywhere from very low to very high classifications for its potential flood hazard. The generated map indicates that 44.72 km2 of the total land area of the study area in Duhok city has a very high susceptibility to flooding, and that these areas require significant attention from government authorities in order to reduce flood vulnerability.

1. Introduction

Flooding is a regular natural disaster that causes significant damage to people and property [1]. Droughts and floods have historically been the most deadly natural disasters [2]. For instance, drought has been a challenge on both the Indian Peninsula and in California [3,4], and floods have also affected countries in southern and southeast Asia, especially Pakistan and Thailand. According to Kron [5], floods are produced by severe rainfall and the melting of snow, which causes rivers to overflow and become temporarily stagnant. This in turn causes damage to the communities that are located along the river. Flooding can occur as a result of a river overflowing, as well as other factors like abrupt cloudbursts in semi-arid locations, resulting in flash floods [6]. The incidence of floods can be considerably influenced not only by climatic factors, but also by human interventions such as reservoir storage and operations [7]. Because flooding is such a complex natural event, it has long attracted researchers from all over the world who seek to better understand and analyze the factors that can lead to improved management and avoidance of flooding. There are a number of causes to blame, both natural and man-made, and each of these factors has the ability to bring about a disastrous flood. Recent instances of catastrophic flooding have been significantly exacerbated by the effects of climate change [8,9,10,11]. Hirabayashi et al. [12] conducted research on the risk of global flooding caused by climate change. According to Charlton, et al. [13], the impact of land use change on increasing flood risk and the encroachment of urban expansion onto floodplains should be included in all aspects of planning as they will intensify climate-induced changes. Aside from changes in the climate, other factors may also play a role in the occurrence of flooding [14,15]. These factors include the altitude features of a location, its proximity to the main channel, slope, topographic curvature, and lithological variation, among many others [16].
In the past few decades, remote sensing and GIS have grown as instruments for hazard management and geospatial mapping, using multi-criteria decision models [17,18,19,20]. This trend is expected to continue. The Geographic Information System (GIS) by Correia et al. [21] has been recognized as a powerful means to integrate and analyze data from different sources, and it provides flood risk mapping for different scenarios of urban growth, simulating the consequences of alternative cases. Over the last two decades, various methods for studying flood risk have been developed, including the analytical hierarchy process [22], fuzzy logic, and genetic algorithms [23,24]; variable fuzzy theory [25], decision tree models, multivariate statistics [6], the hydrological forecasting system [26,27,28]. Flood risk zones can be predicted with the least amount of effort using the AHP model and geospatial methodologies. Both of these methods involve carefully analyzing a number of relevant factors. Incorrect weighting can result in an arbitrary spatial distribution of possible flood hazards. In Duhok province, researchers have tried to assess land degradation using GIS and AHP techniques [29]. In the same province, but in the district of Akre, researchers have also used the same method to identify flood-prone locations [30].
After the coalition invasion of Iraq in April 2003, the city of Duhok in the Kurdistan Region saw a significant revival. It is considered the second most developed city in the region after the capital Erbil. It is currently the main export and import point in the Kurdistan Region and Iraq because it connects Turkey and Iraq through the Ibrahim Khalil border crossing. Hameed, et al. [31] conducted an investigation in the Duhok Sub-basin using GIS and remote sensing to study the effects of land cover change on surface runoff. Mustafa and Szydłowski [32] demonstrated that rapid urbanization is associated with a significant increase in surface runoff. An essential issue that affects urban surface flooding is the loss of, or damage to, green open spaces as a result of rapid urbanization, and poor management and planning of landcover/use. In Duhok city, the runoff in green open spaces increased from approximately 3.5 million cubic meters to approximately 14 million cubic meters as a result of land cover changes. The runoff in built-up areas increased from approximately 4 million cubic meters in 1990 to approximately 14 million cubic meters in 2016, and is expected to have increased by 2020 [33]. Numerous urban disaster concerns, such as urban floods, have emerged as a result of Duhok city’s rapid development and changes in land cover [34]. Land degradation evaluation in Duhok city, Kurdistan Region, Iraq was studied by Mzuri, Mustafa, and Omar [29], who employed AHP and GIS-based modeling in their research. In order to locate the flood-prone area in the Akre district, which is located in the Duhok Province of northern Iraq, Fatah and Mustafa [30] applied geospatial techniques and the AHP model. They concluded that the AHP model is a potent tool for susceptibility mapping to lessen the devastating effects of flooding and help in future master planning for local authorities and policymakers. Previous attempts made by the authors of this work to develop Intensity-Duration-Frequency (IDF) curves for Kurdistan cities were made with the hope that doing so would help local authorities. Engineers and governmental entities will be able to rely on this publication as a reputable scientific source [35,36].
In every region that is rapidly developing, the risk of flooding poses a significant danger to human life and life quality. Moreover, geospatial planning is not widely used in developing countries such as Iraq. Flooding of a severe nature has occurred in the past in Duhok city, which is situated in the northern region of Iraq. Mustafa, et al. [37] investigated the role that extreme rainfall played in the occurrence of urban flash floods in Erbil. The purpose of this work is to make use of remote sensing and geospatial analysis in order to investigate a variety of contributing factors that are accountable for the occurrence of floods in the city of Duhok in Iraq. Another aim of this study was to identify flood-prone areas in order to develop solutions for the assessment and management of floods, as well as to establish which area merits the most involvement in the development of risk reduction measures or mitigation procedures. Particularly in Duhok, no one has ever attempted a study for the purpose of conducting an analysis of flood susceptibility by comparing historic flood areas.

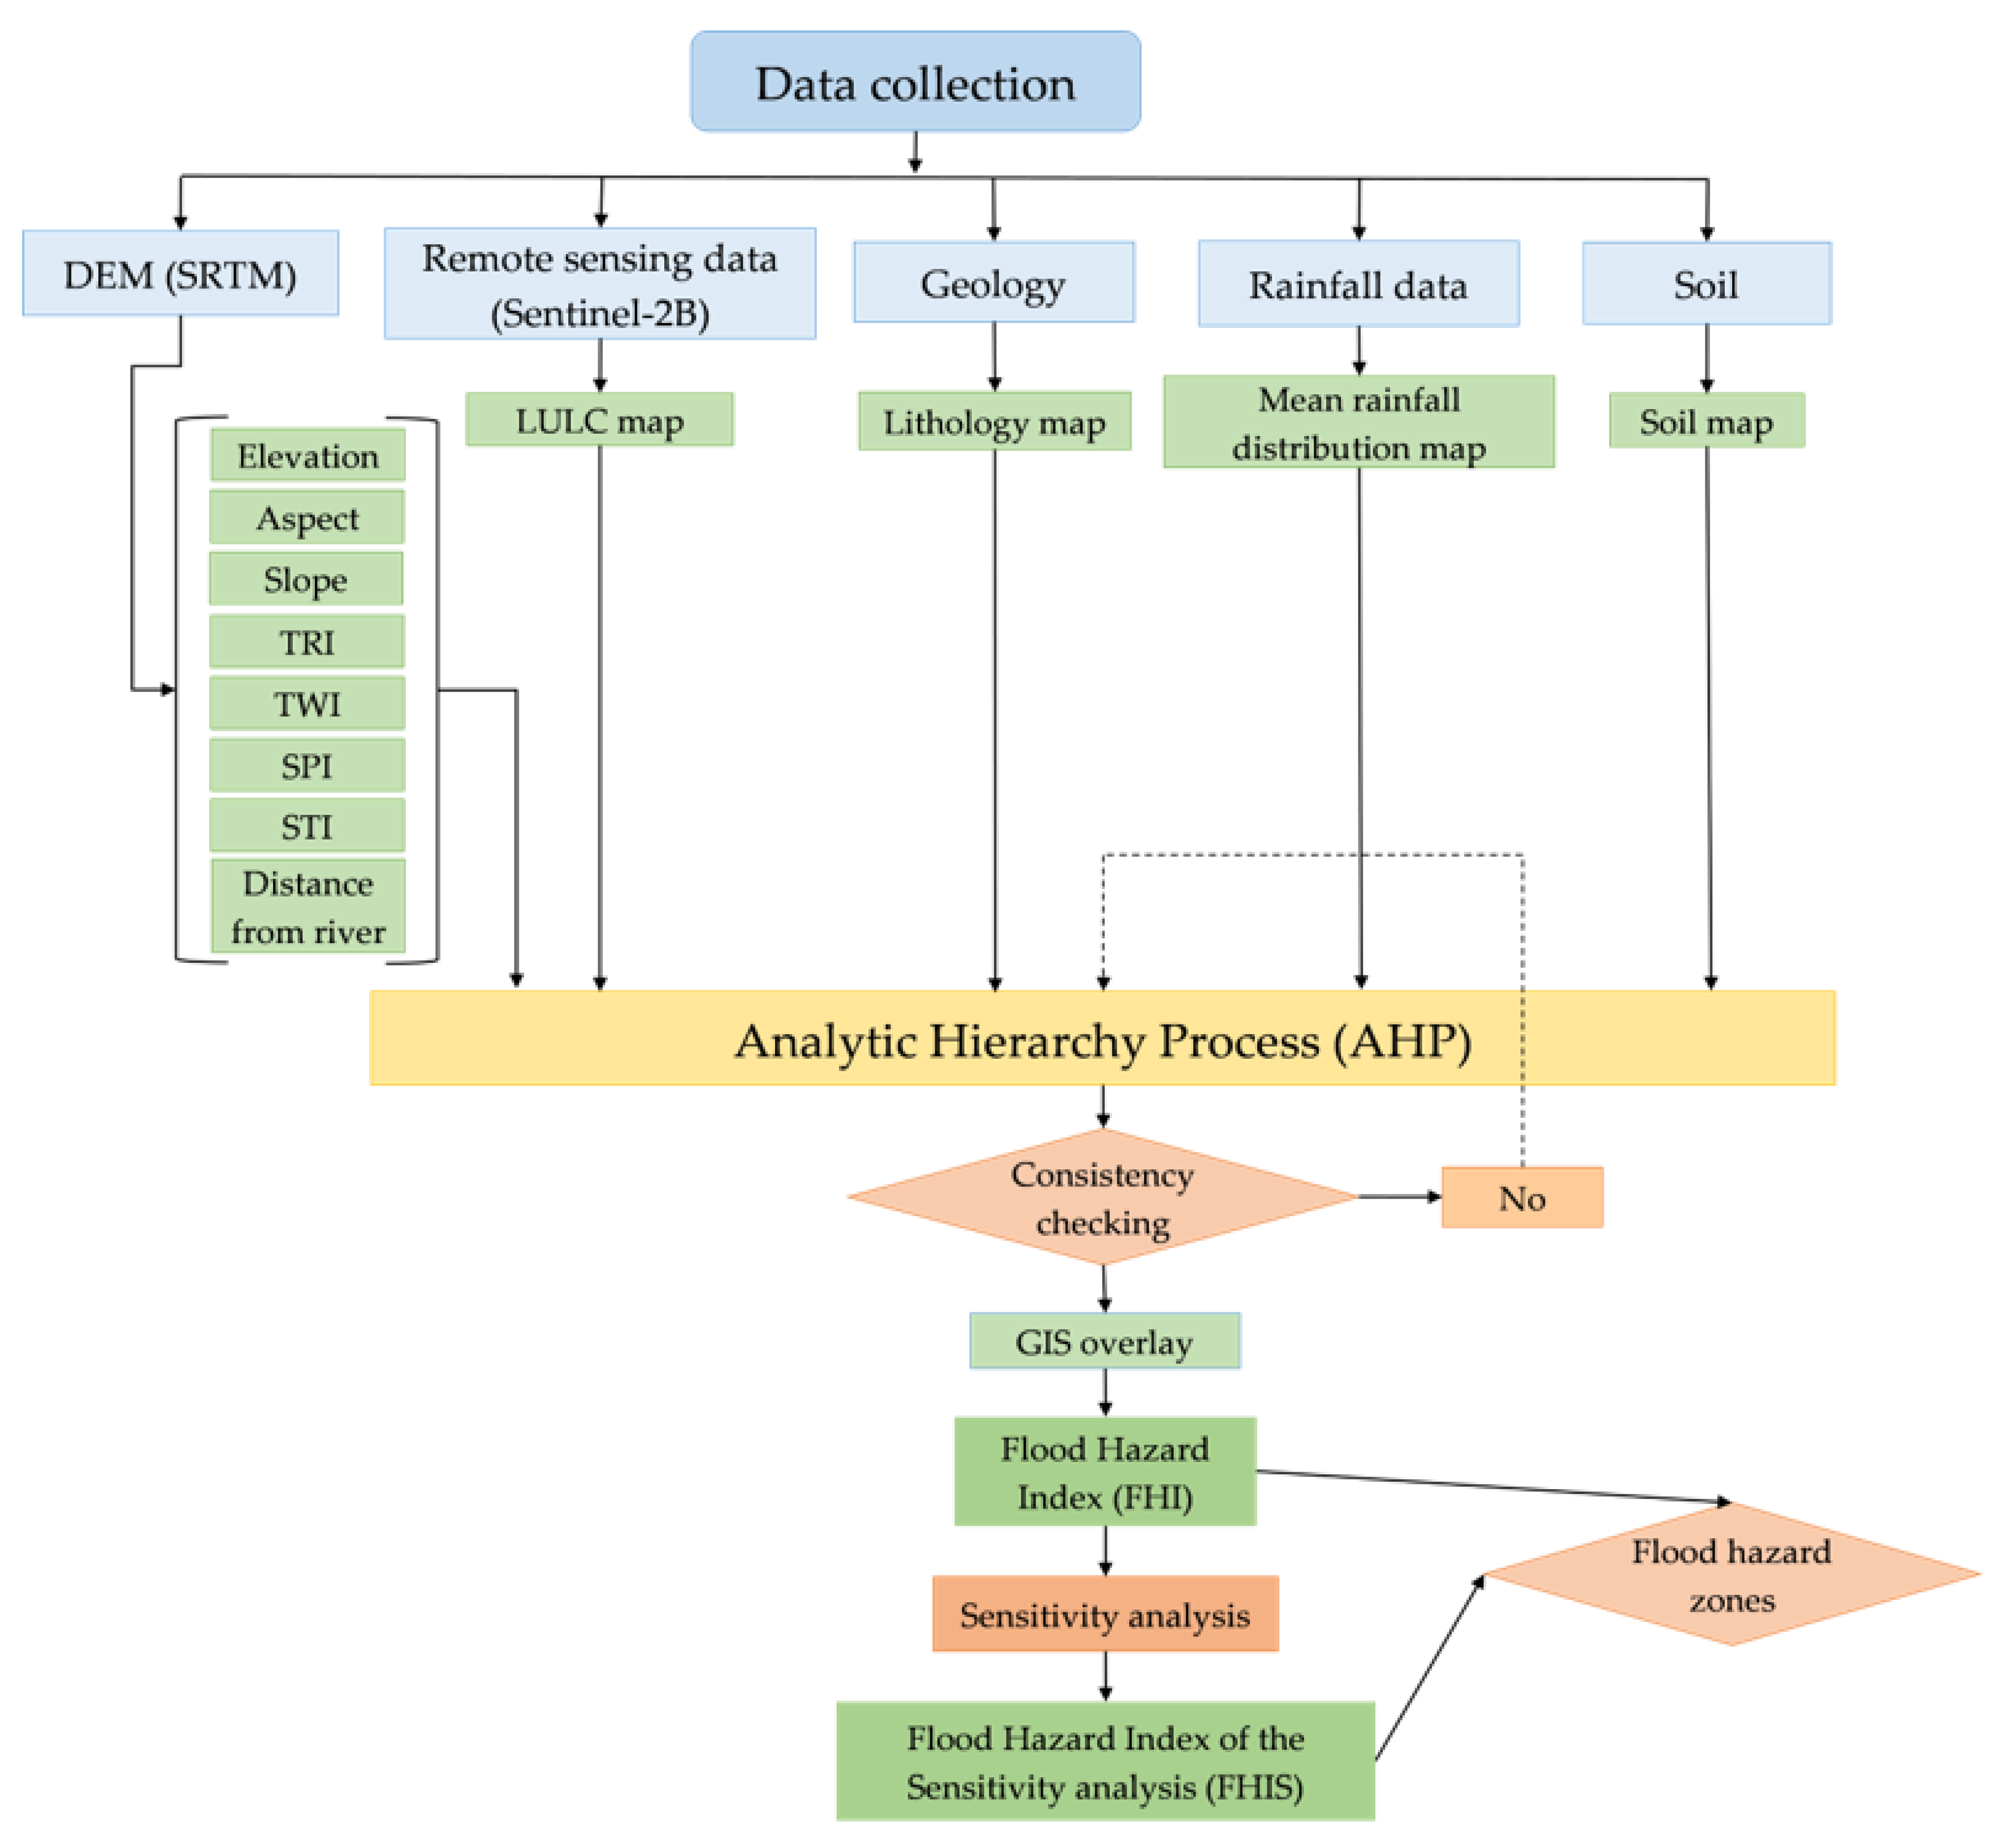
2. Materials and Methods
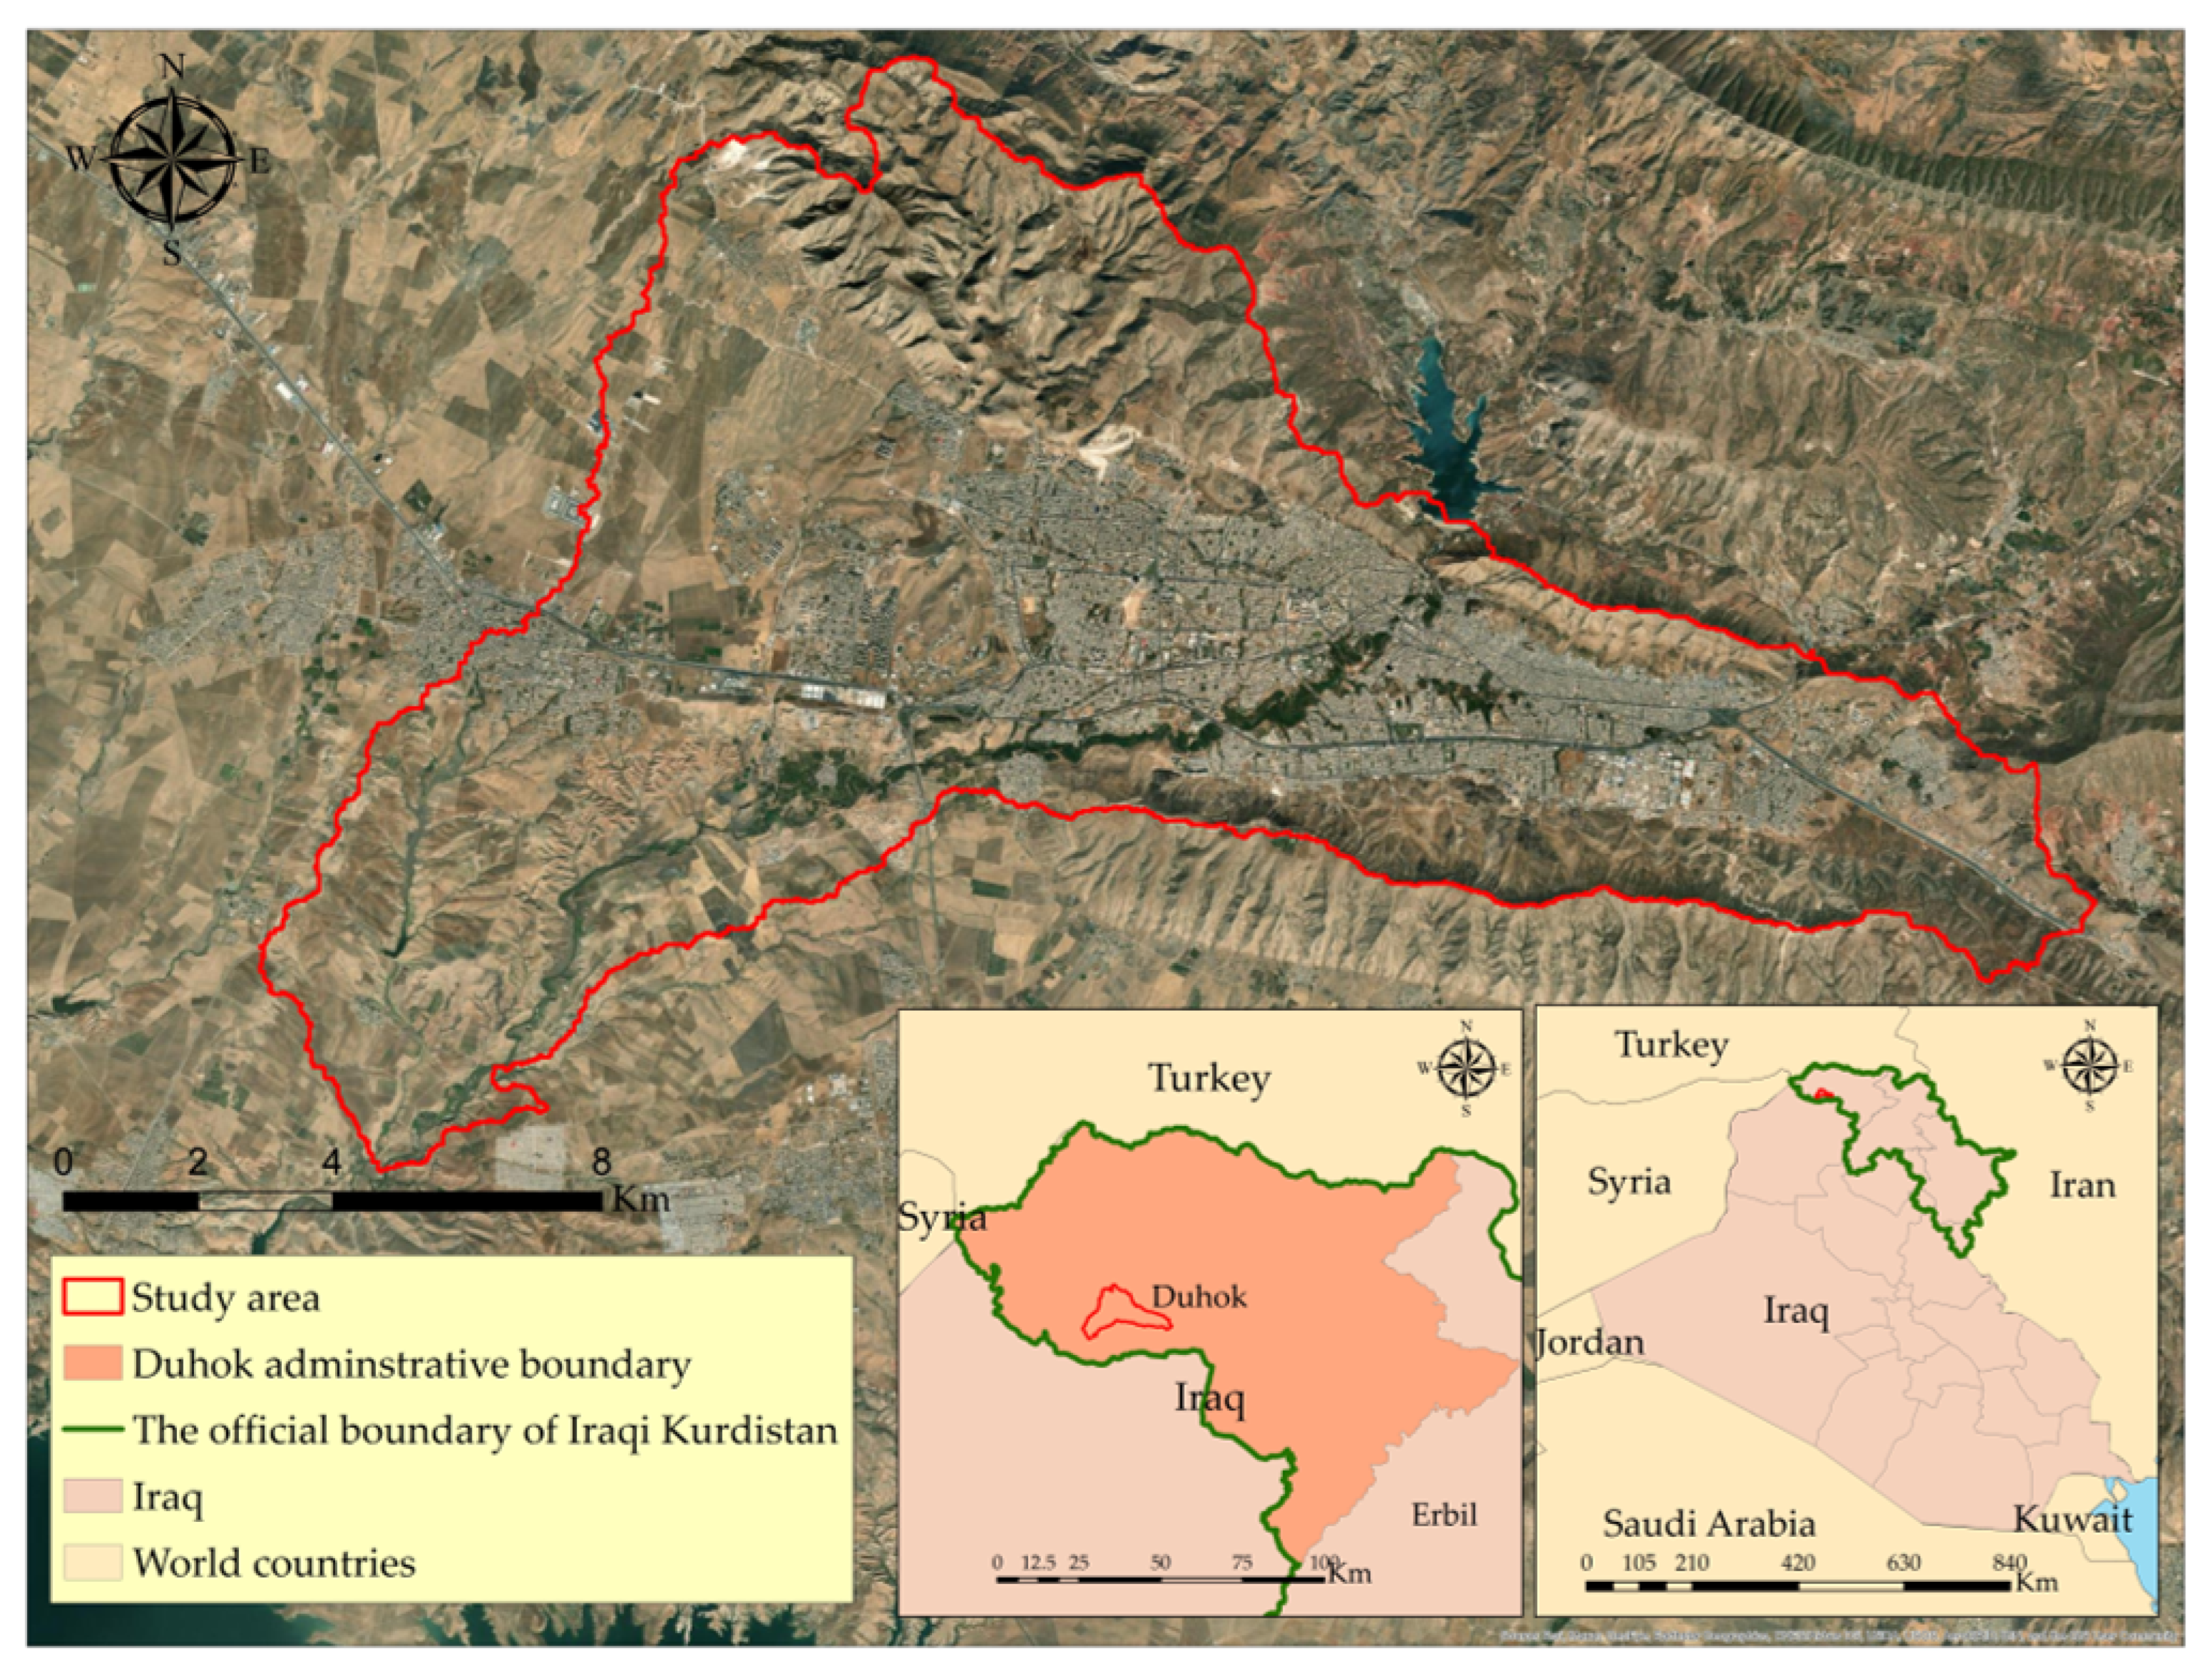
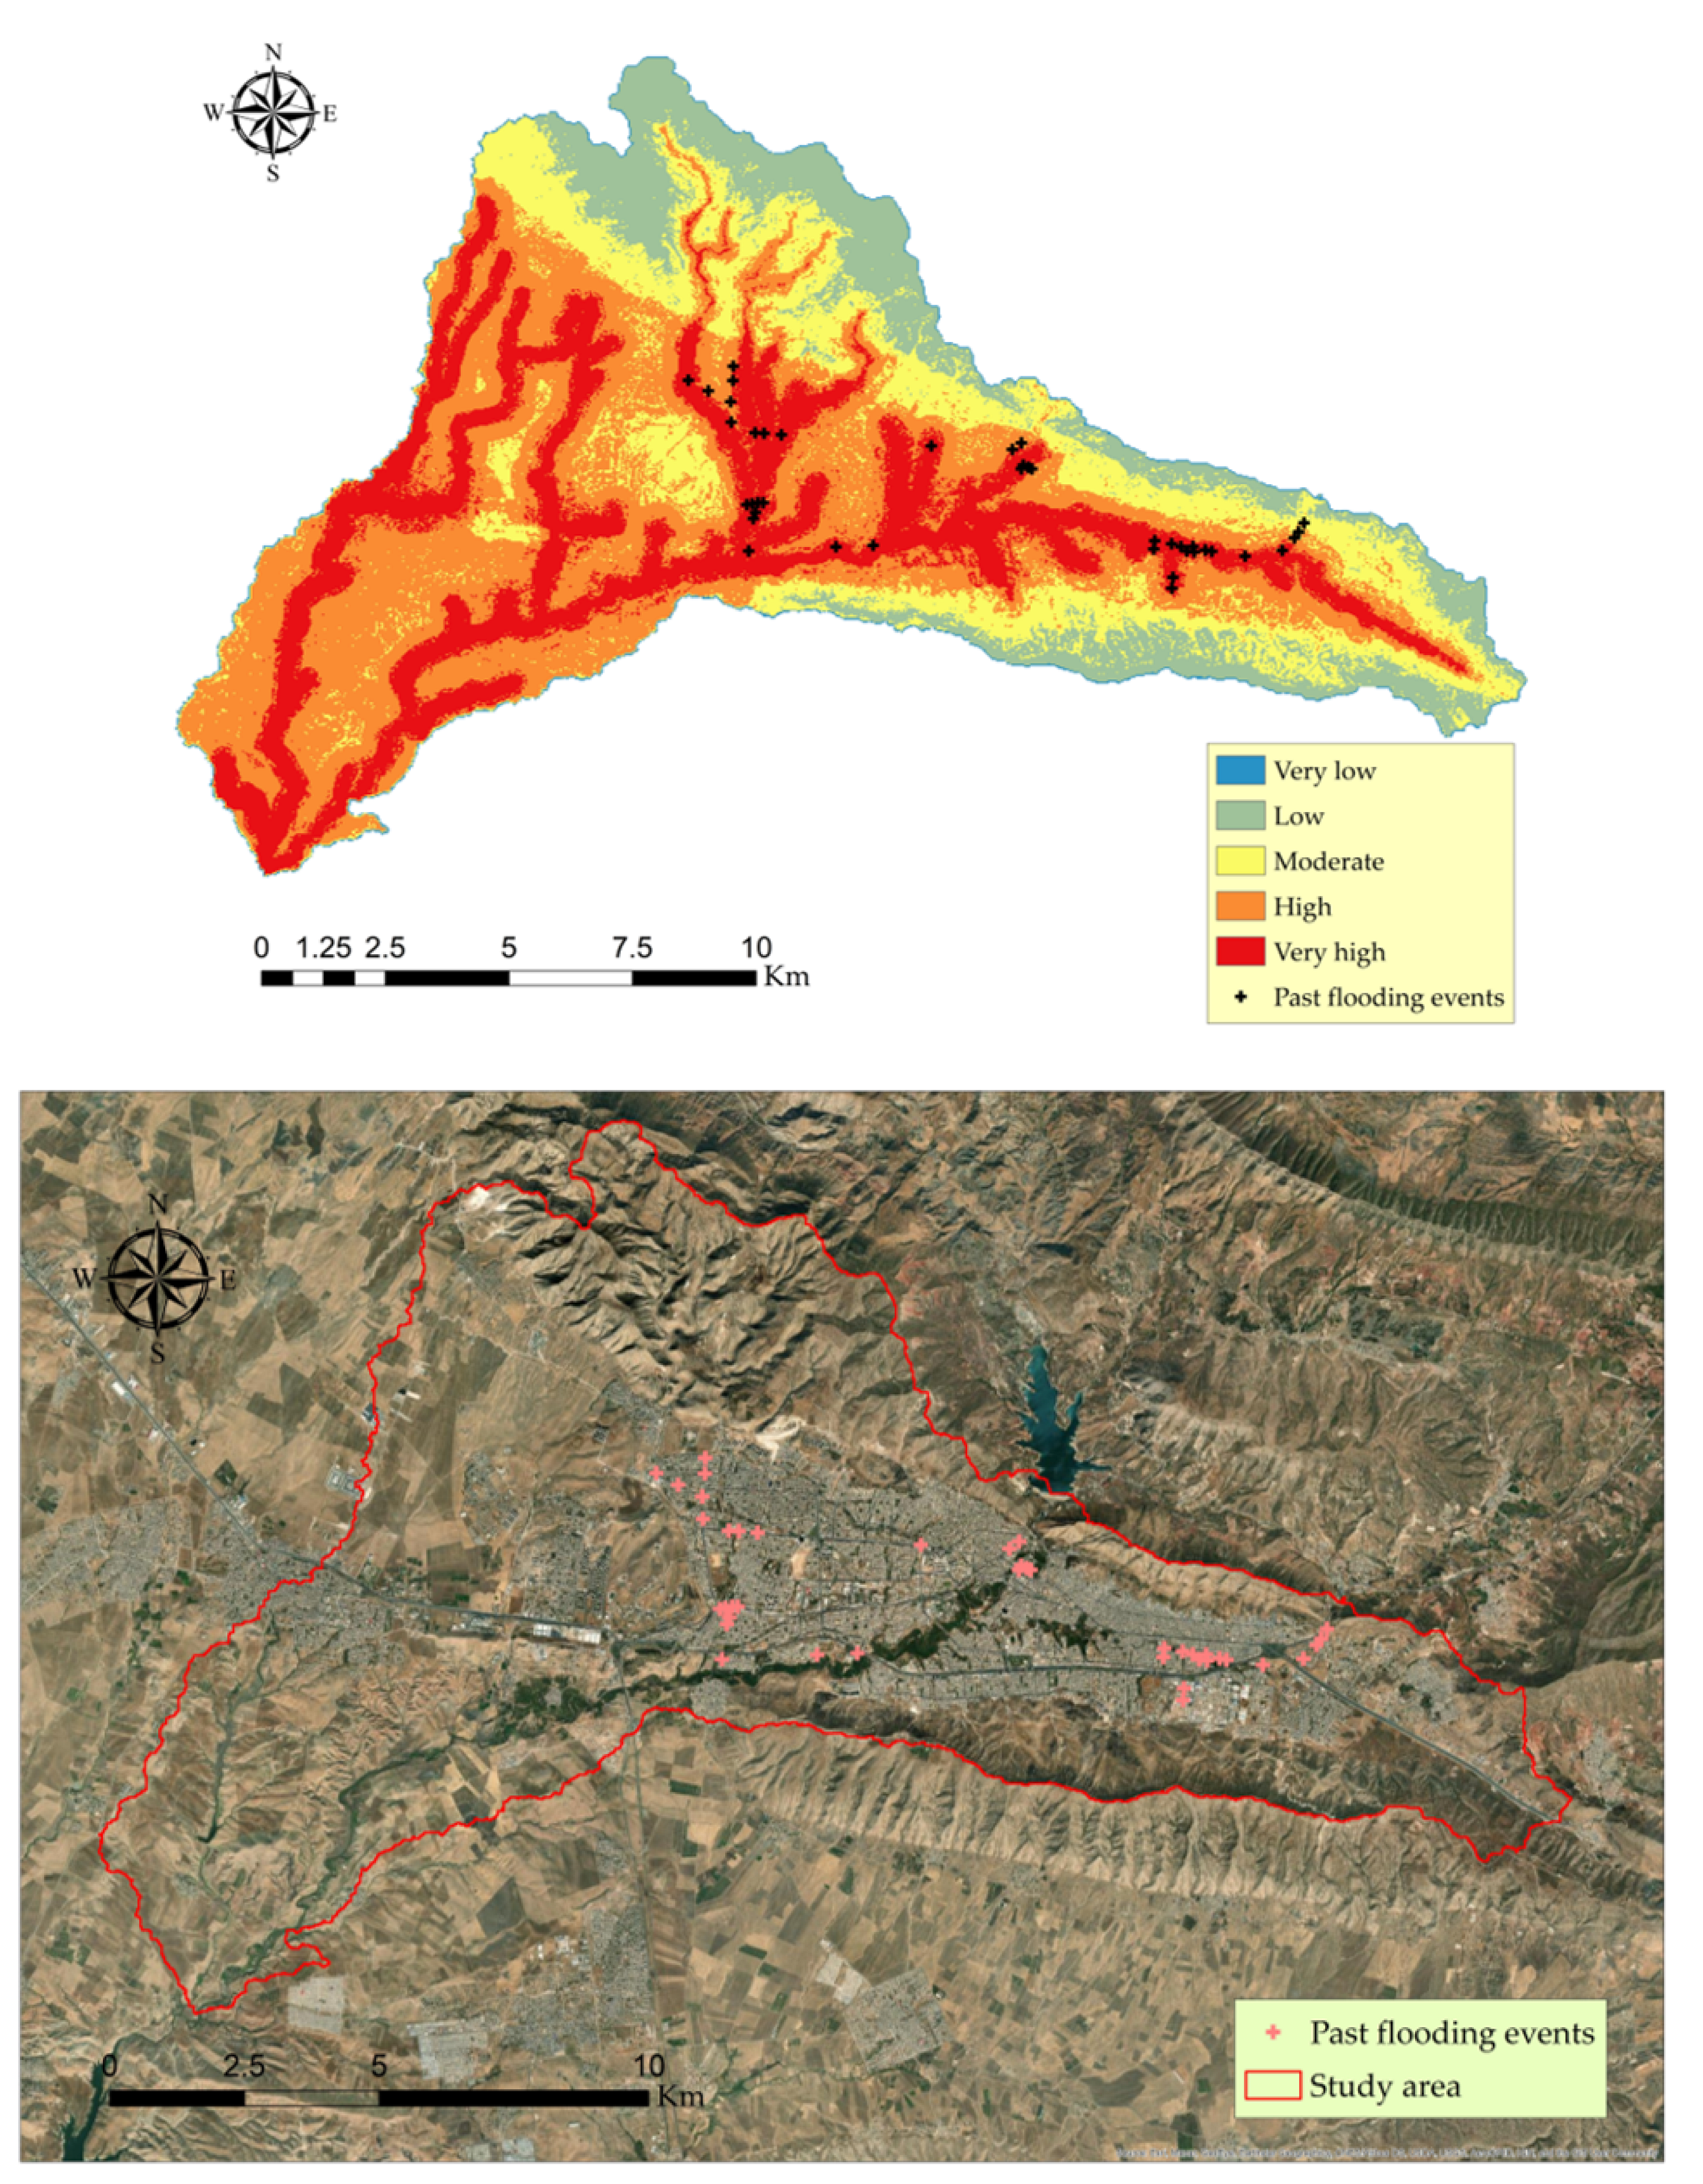
2.1. Study Area

The city of Duhok is located in the Kurdistan Region of Iraq. In terms of population, it is one of the least populous cities in the region. Duhok is the region’s economic hub. The study area covers an area of 180.9 km2 and is located between 36°46′N and 36°56′N latitudes and 42°48′E and 43°08′E longitudes (Figure 1). The district of Duhok is situated in a low-lying terrain that is sandwiched between the mountain ranges of Bekhair to the north and northeast and Zawa to the southeast [38]. The climate in Duhok is influenced by that of the Mediterranean; therefore, the summers are typically dry and hot, while the winters are cold and wet [39]. There are four distinct seasons in Duhok, each with its own climate, which range from generally cold in the winter (December–February), to hot in the summer (June–August), to moderate in the fall (September–November) and spring (March–May) [40]. The average annual rainfall is 700 mm and the temperature varies between 21 to 29 °C. The elevation of Duhok district varies from 334 to 1212 m above sea level. The research area is frequently flooded near the river due to strong orographic rainfall during the spring and winter. Many tiny communities are located in such areas, and they are severely impacted both physically and economically.

2.2. Data Sources

For the purpose of flood susceptibility mapping, open-source spatial data for the research area, as well as secondary information from a variety of sources including local authorities, were collected (Table 1).

2.3. Methods for Preparing Flood Thematic Layers
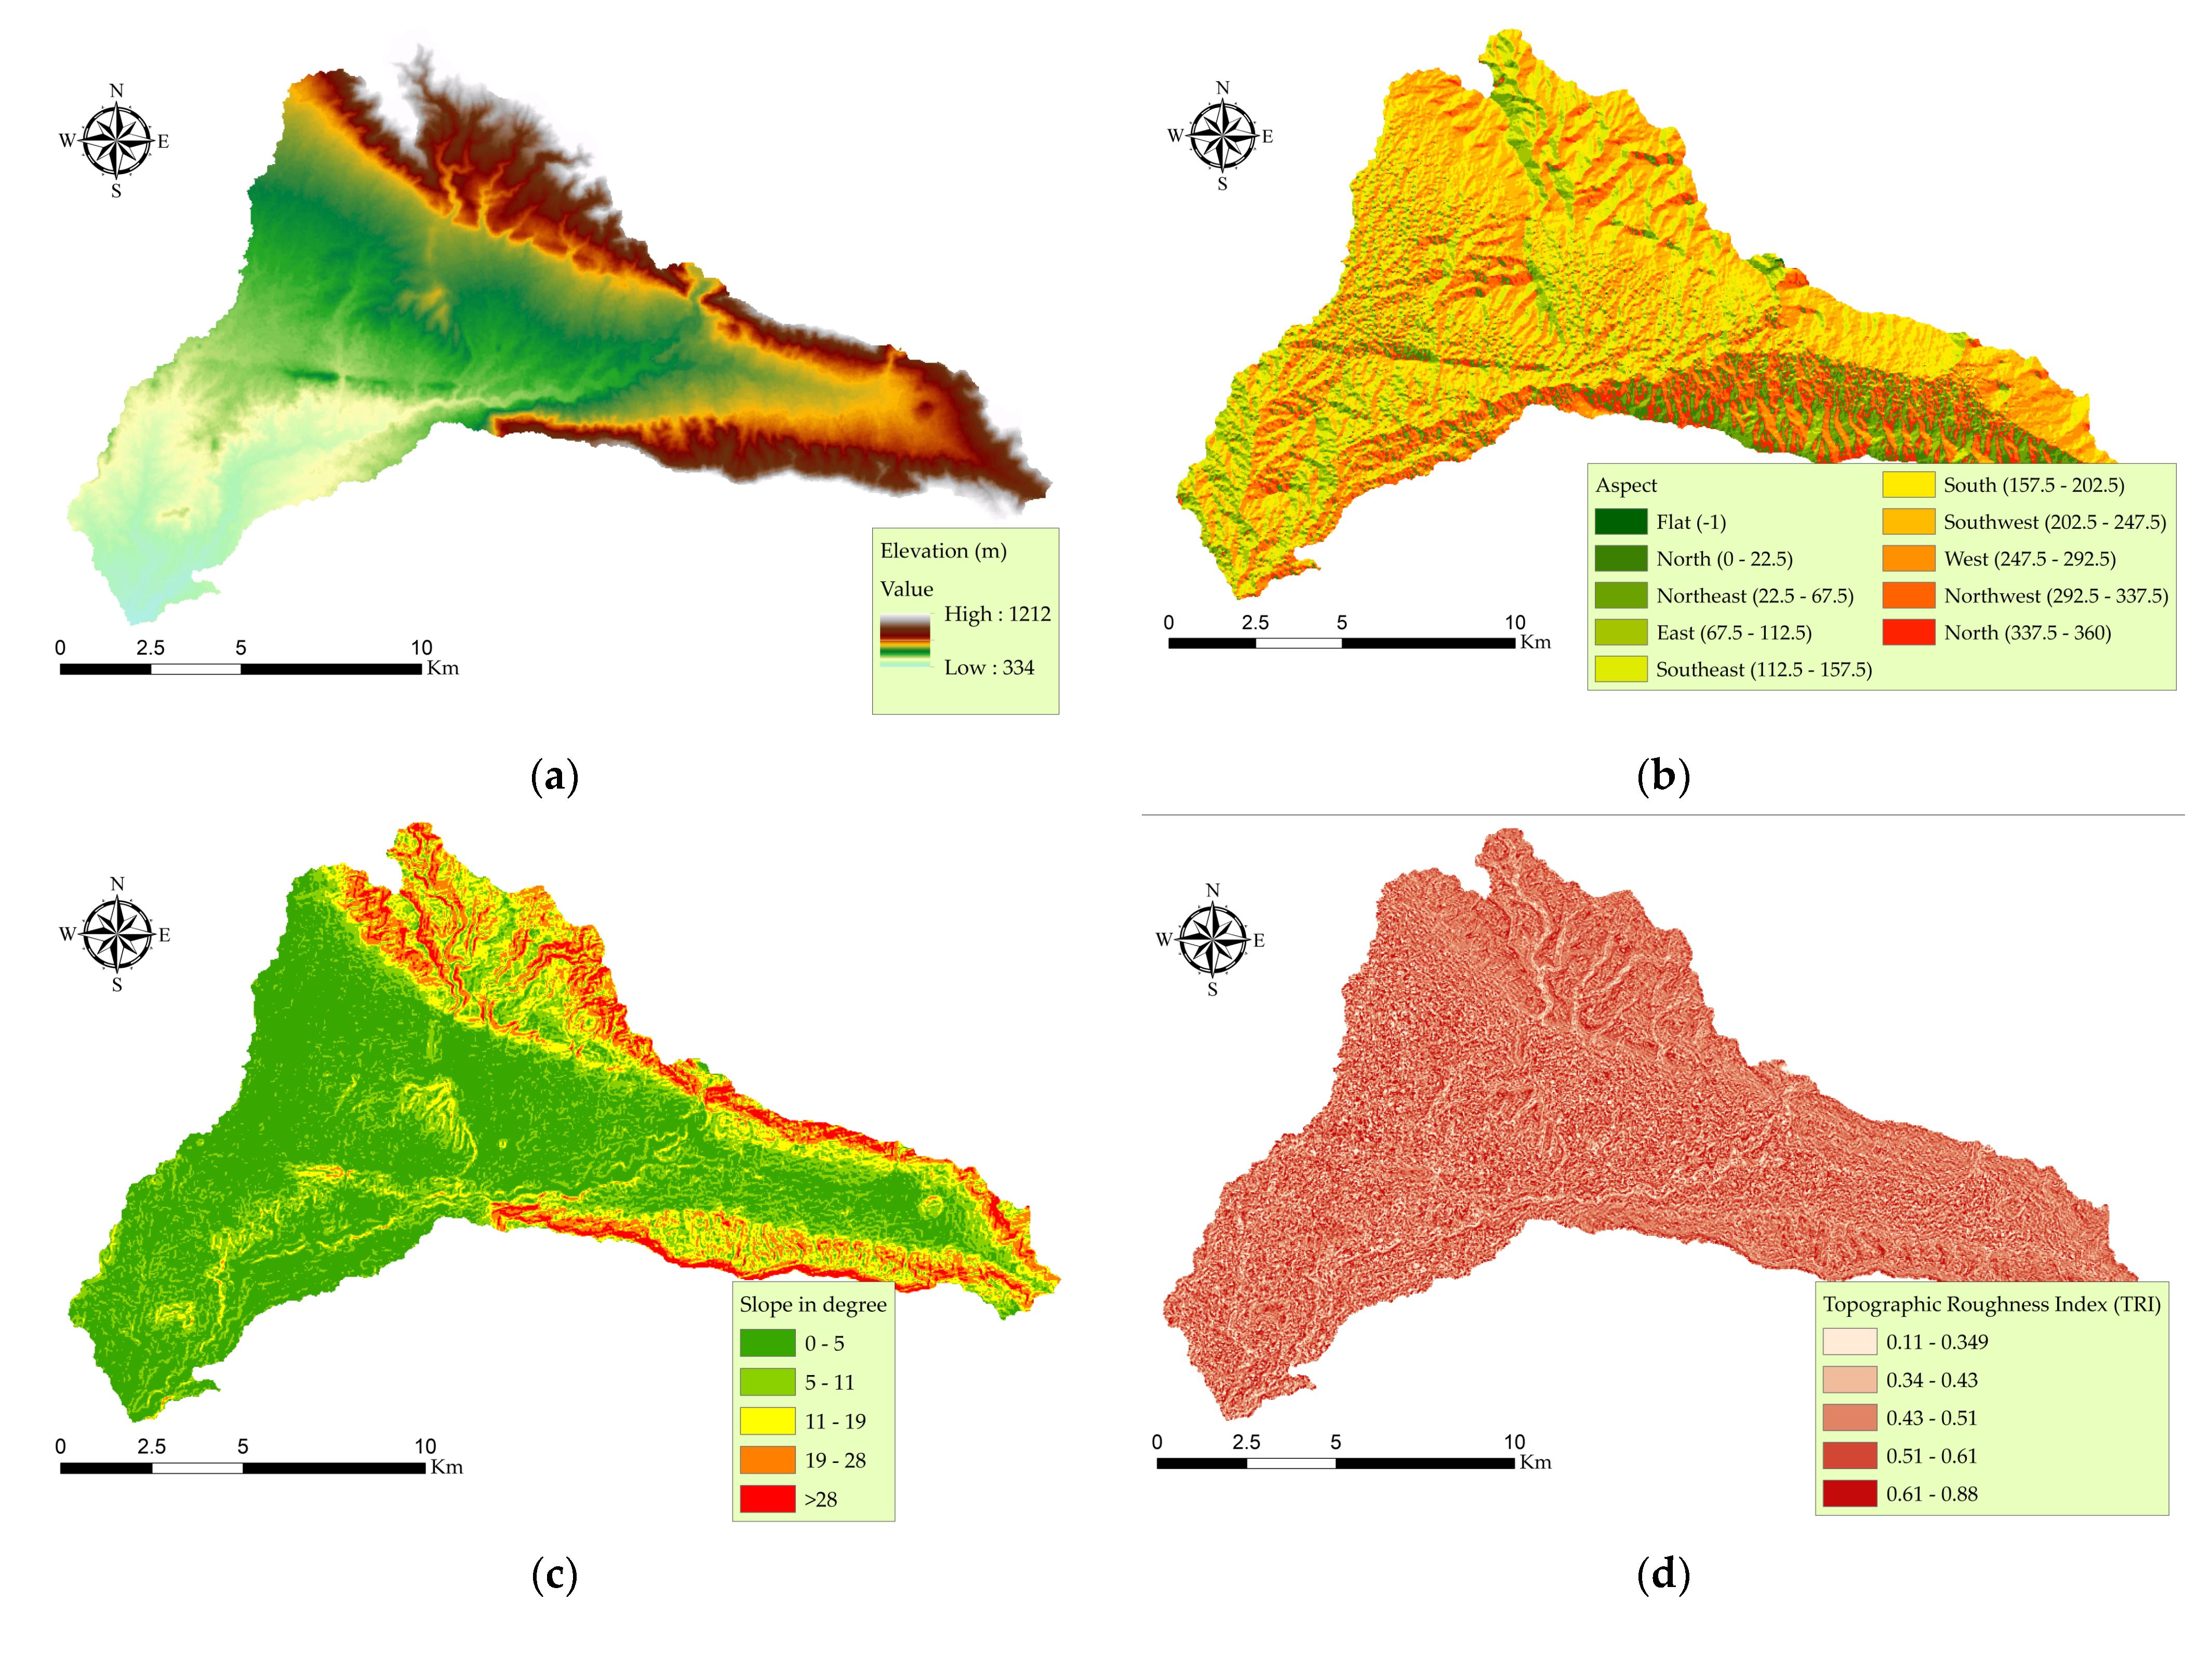
The creation of the vulnerable spatial flood model, which is highly intricate and detailed, necessitates a large amount of topographical and hydrological data. The flood susceptibility maps are verified with the help of measurements that have been established through scientific research. As a result, one of the most important tasks is to identify the variables that cause flooding. The twelve flood-inducing parameters in the current study area were chosen based on the available flood susceptibility literature, including elevation, slope, distance from the river, rainfall, Land Use Land Cover (LULC), soil, lithology, Topographic Roughness Index (TRI), Topographic Wetness Index (TWI), aspect, the Sediment Transport Index (STI), and the Stream Power Index (SPI) [42,43,44]. All of the variables that had an effect on the outcome were put through a rasterization process, and the resulting raster had a spatial resolution of 30 m.
For flood modeling, topographic parameters are critical because they influence the hydrological properties of the studied region both directly and indirectly [45,46]. In the first phase, a Digital Elevation Model (DEM) for the research area was used in the ArcGIS 10.7 environment using the SRTM with a 30 m spatial resolution. We used DEM to compute slope, aspect, curvature, TWI, STI, SPI, and TRI.

2.3.1. Elevation

When it comes to flood modeling, elevation is the most important factor [27]. Flooding is inversely proportional to height. Flooding is less likely to occur at higher elevations, and vice versa [47]. As a direct consequence of this, floods are more likely to occur in locations that are either completely flat or have lower elevations. The elevation map of the research area is displayed in Figure 2a below.

2.3.2. Aspect

Another factor that influences the direction of flooded areas is aspect. Water flows, which helps to keep the soil moist [48]. As a result, the aspect has an indirect impact on floods. For example, the section of a shady slope where soil humidity is quite high and with a lot of runoff. Figure 2b shows the aspect of the study area.

2.3.3. Slope

Another important factor that has a significant impact on a flood is the slope, which determines how quickly the water will move when it floods [49]. When the rate of infiltration is low, there is less risk that water will become stagnant. On the other hand, when the flow velocity is great, the higher the slope angle. As a result, lower and flat areas are more prone to floods. Figure 2c illustrates the slope of the study area.

2.3.4. Topographic Roughness Index (TRI)

One of the key contributing variables for flood episodes is TRI. It is determined by the study basin’s local topography. The lower the TRI number, the more likely it is that a flood will occur. The TRI map was preserved in stretch format in this investigation, with values ranging from 0.11–0.88 (Figure 2d).

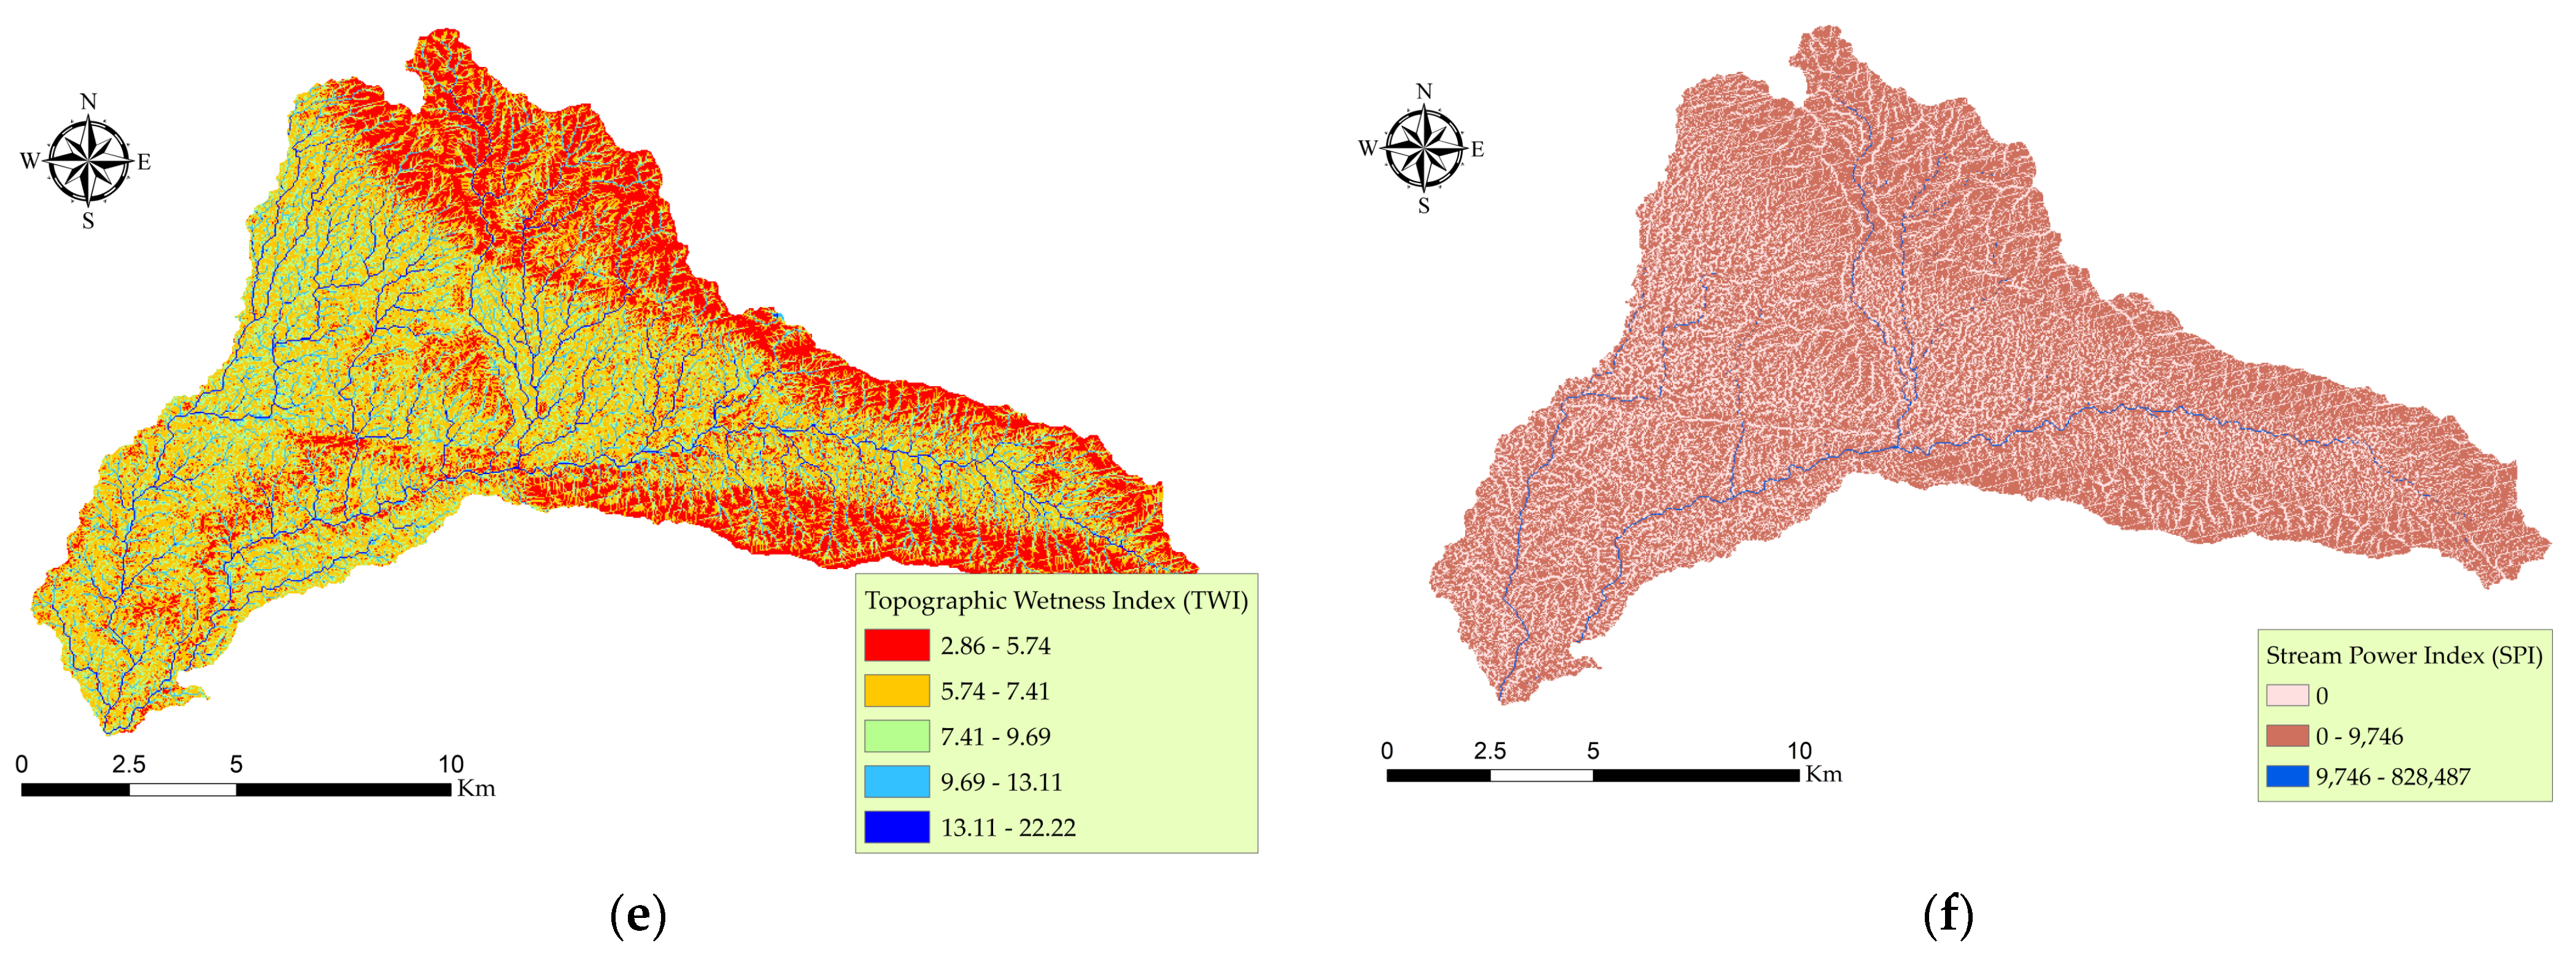
2.3.5. Topographic Wetness Index (TWI)

There is a strong relationship between TWI and the occurrence of floods [50], due to the fact that it makes it possible to spatially visualize the differences in a basin’s level of wetness [51]. This index depicts the quantity of water present in each pixel of the area, and it is calculated using the following equation.
T W I = I n ( A s ) t a n β
A s and β denote the catchment area (m2m−1) and slope gradient (in degrees) for the particular catchment area (m2m−1), respectively. Floods and high TWI levels are inextricably related. In the study area, the TWI value ranges from 2.86 to 22.22 (Figure 2e).

2.3.6. Stream Power Index (SPI)

The SPI has a significant influence on the fluvial system. The SPI is calculated using the equation below.
S P I = A s   t a n β
The exact catchment area is represented by A s   and the slope gradient is denoted by β (radians) [52]. The stream power index map is shown in Figure 2f.

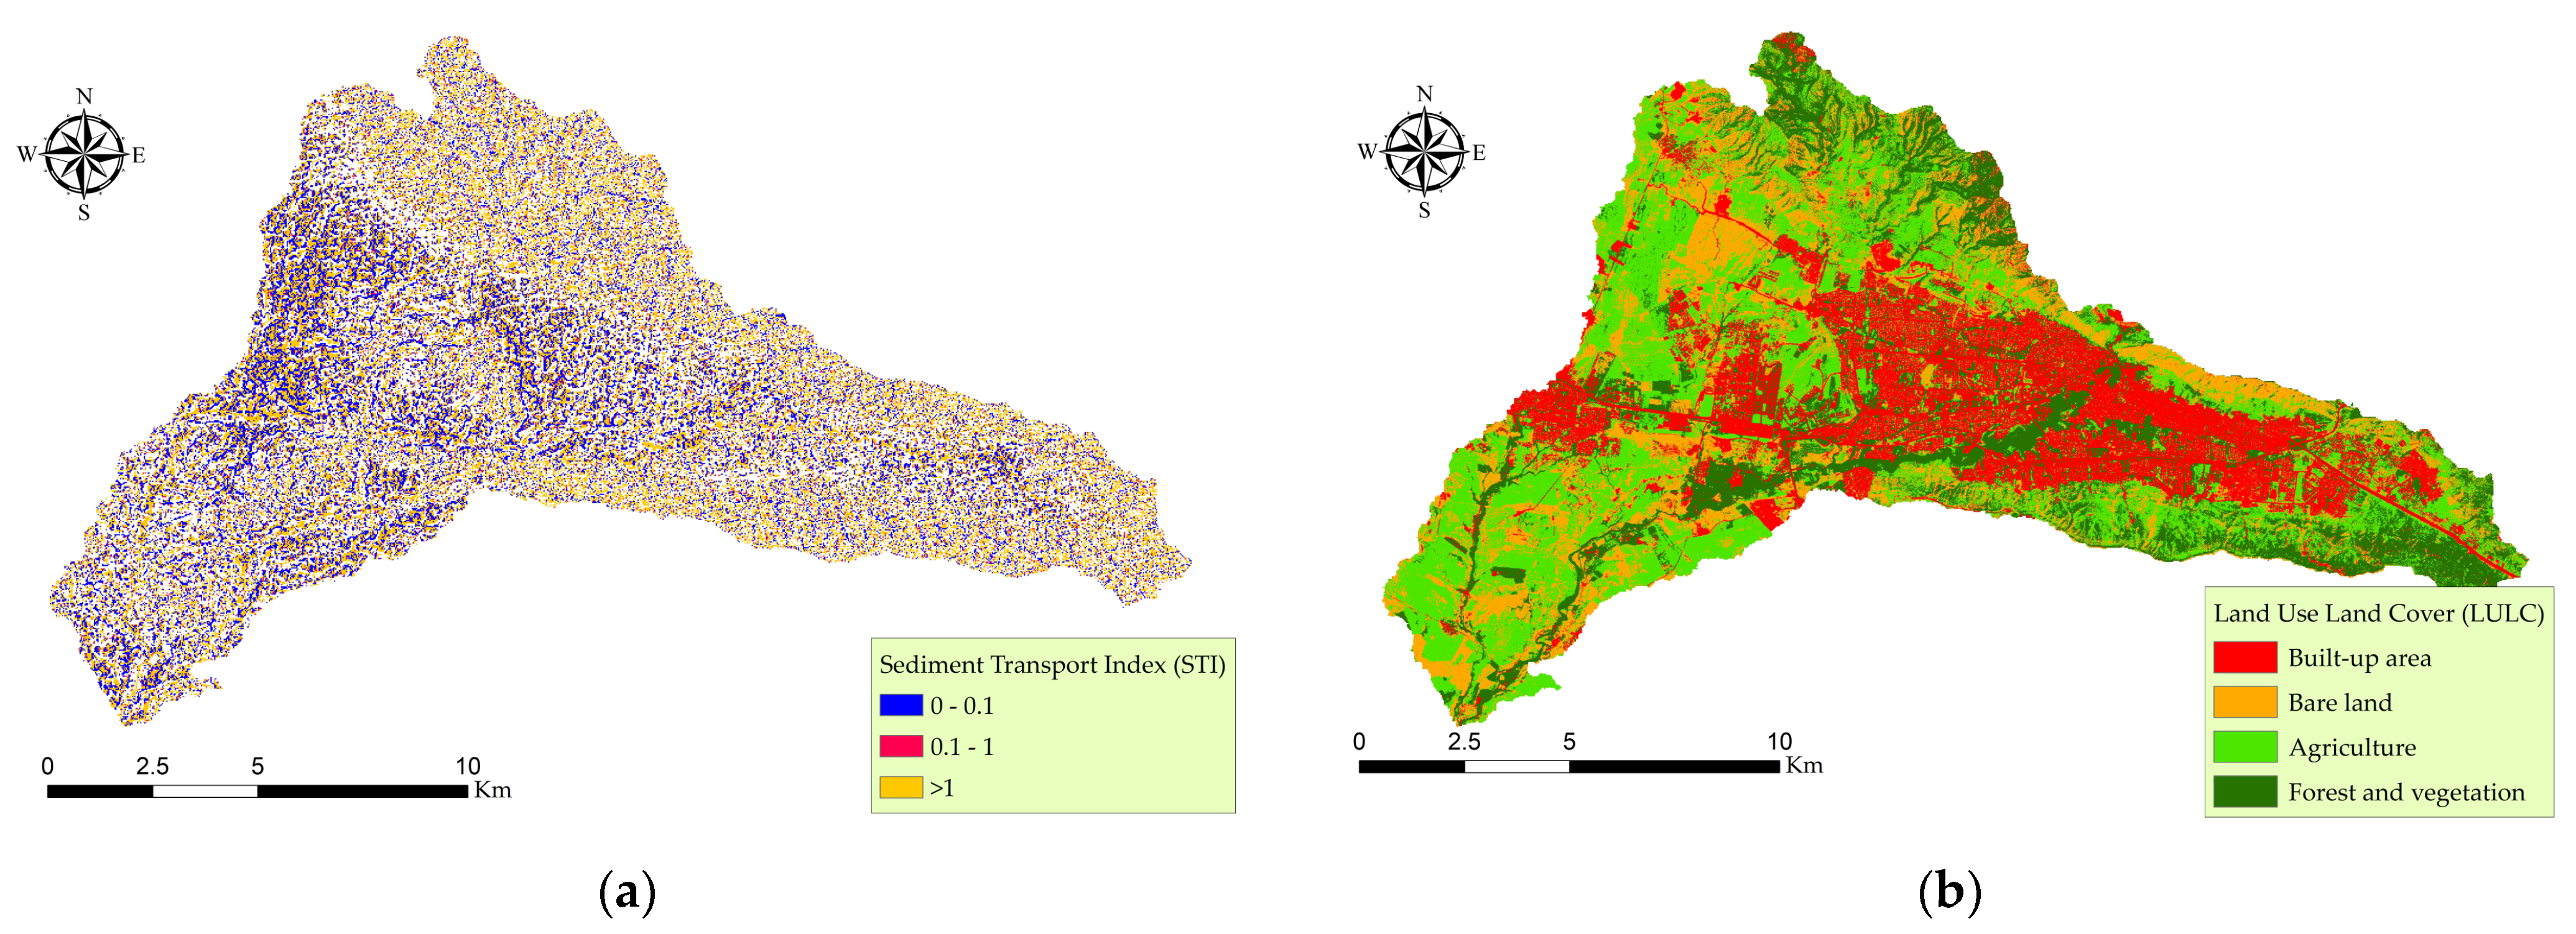
2.3.7. Sediment Transport Index (STI)

Another component that causes flooding is the STI, which can upturn the frequency of floods, resulting in foundation damage. The STI is derived from DEM using the following equation [53].
S T I = ( A s 22.13 ) 0.6 ( S i n β 0.0896 ) 1.3
where each pixel of the slope is denoted by β , and the upstream region is denoted by A s . The STI value ranges from 0 to >1 (Figure 3a).

2.3.8. Land Use Land Cover (LULC)

Land use land cover has an effect on surface runoff as well as the transport of sediment, which in turn has a direct effect on the number of floods that occur [54] because land use has a direct impact on surface runoff generation and infiltration. Because metropolitan areas do not allow water to enter and generate surface water, flooding is more prevalent. The LULC map was produced using remote sensing data. When cloud cover was less than 5%, a satellite image from Sentinel-2A (2017–present) was downloaded from the European Space Agency’s Copernicus open access hub platform (https://scihub.copernicus.eu/) (accessed on 22 September 2022). The image was captured by a satellite on 18 July 2022. In this work, we used the Arc GIS image classification approach to create a land use map from the Sentinel-2 satellite imageries. Extensive preprocessing was performed, including georeferencing, layer stacking, extraction, and image improvement. The land use map was divided into four categories: agriculture land, forest and vegetation, built-up area, and bare land. Using ArcMap tools, supervised classification was performed. The user of the software creates spectral signatures of known classes, such as urban, water, and agricultural, and then the software assigns each pixel to the cover type to which its signature is most similar (Figure 3b).

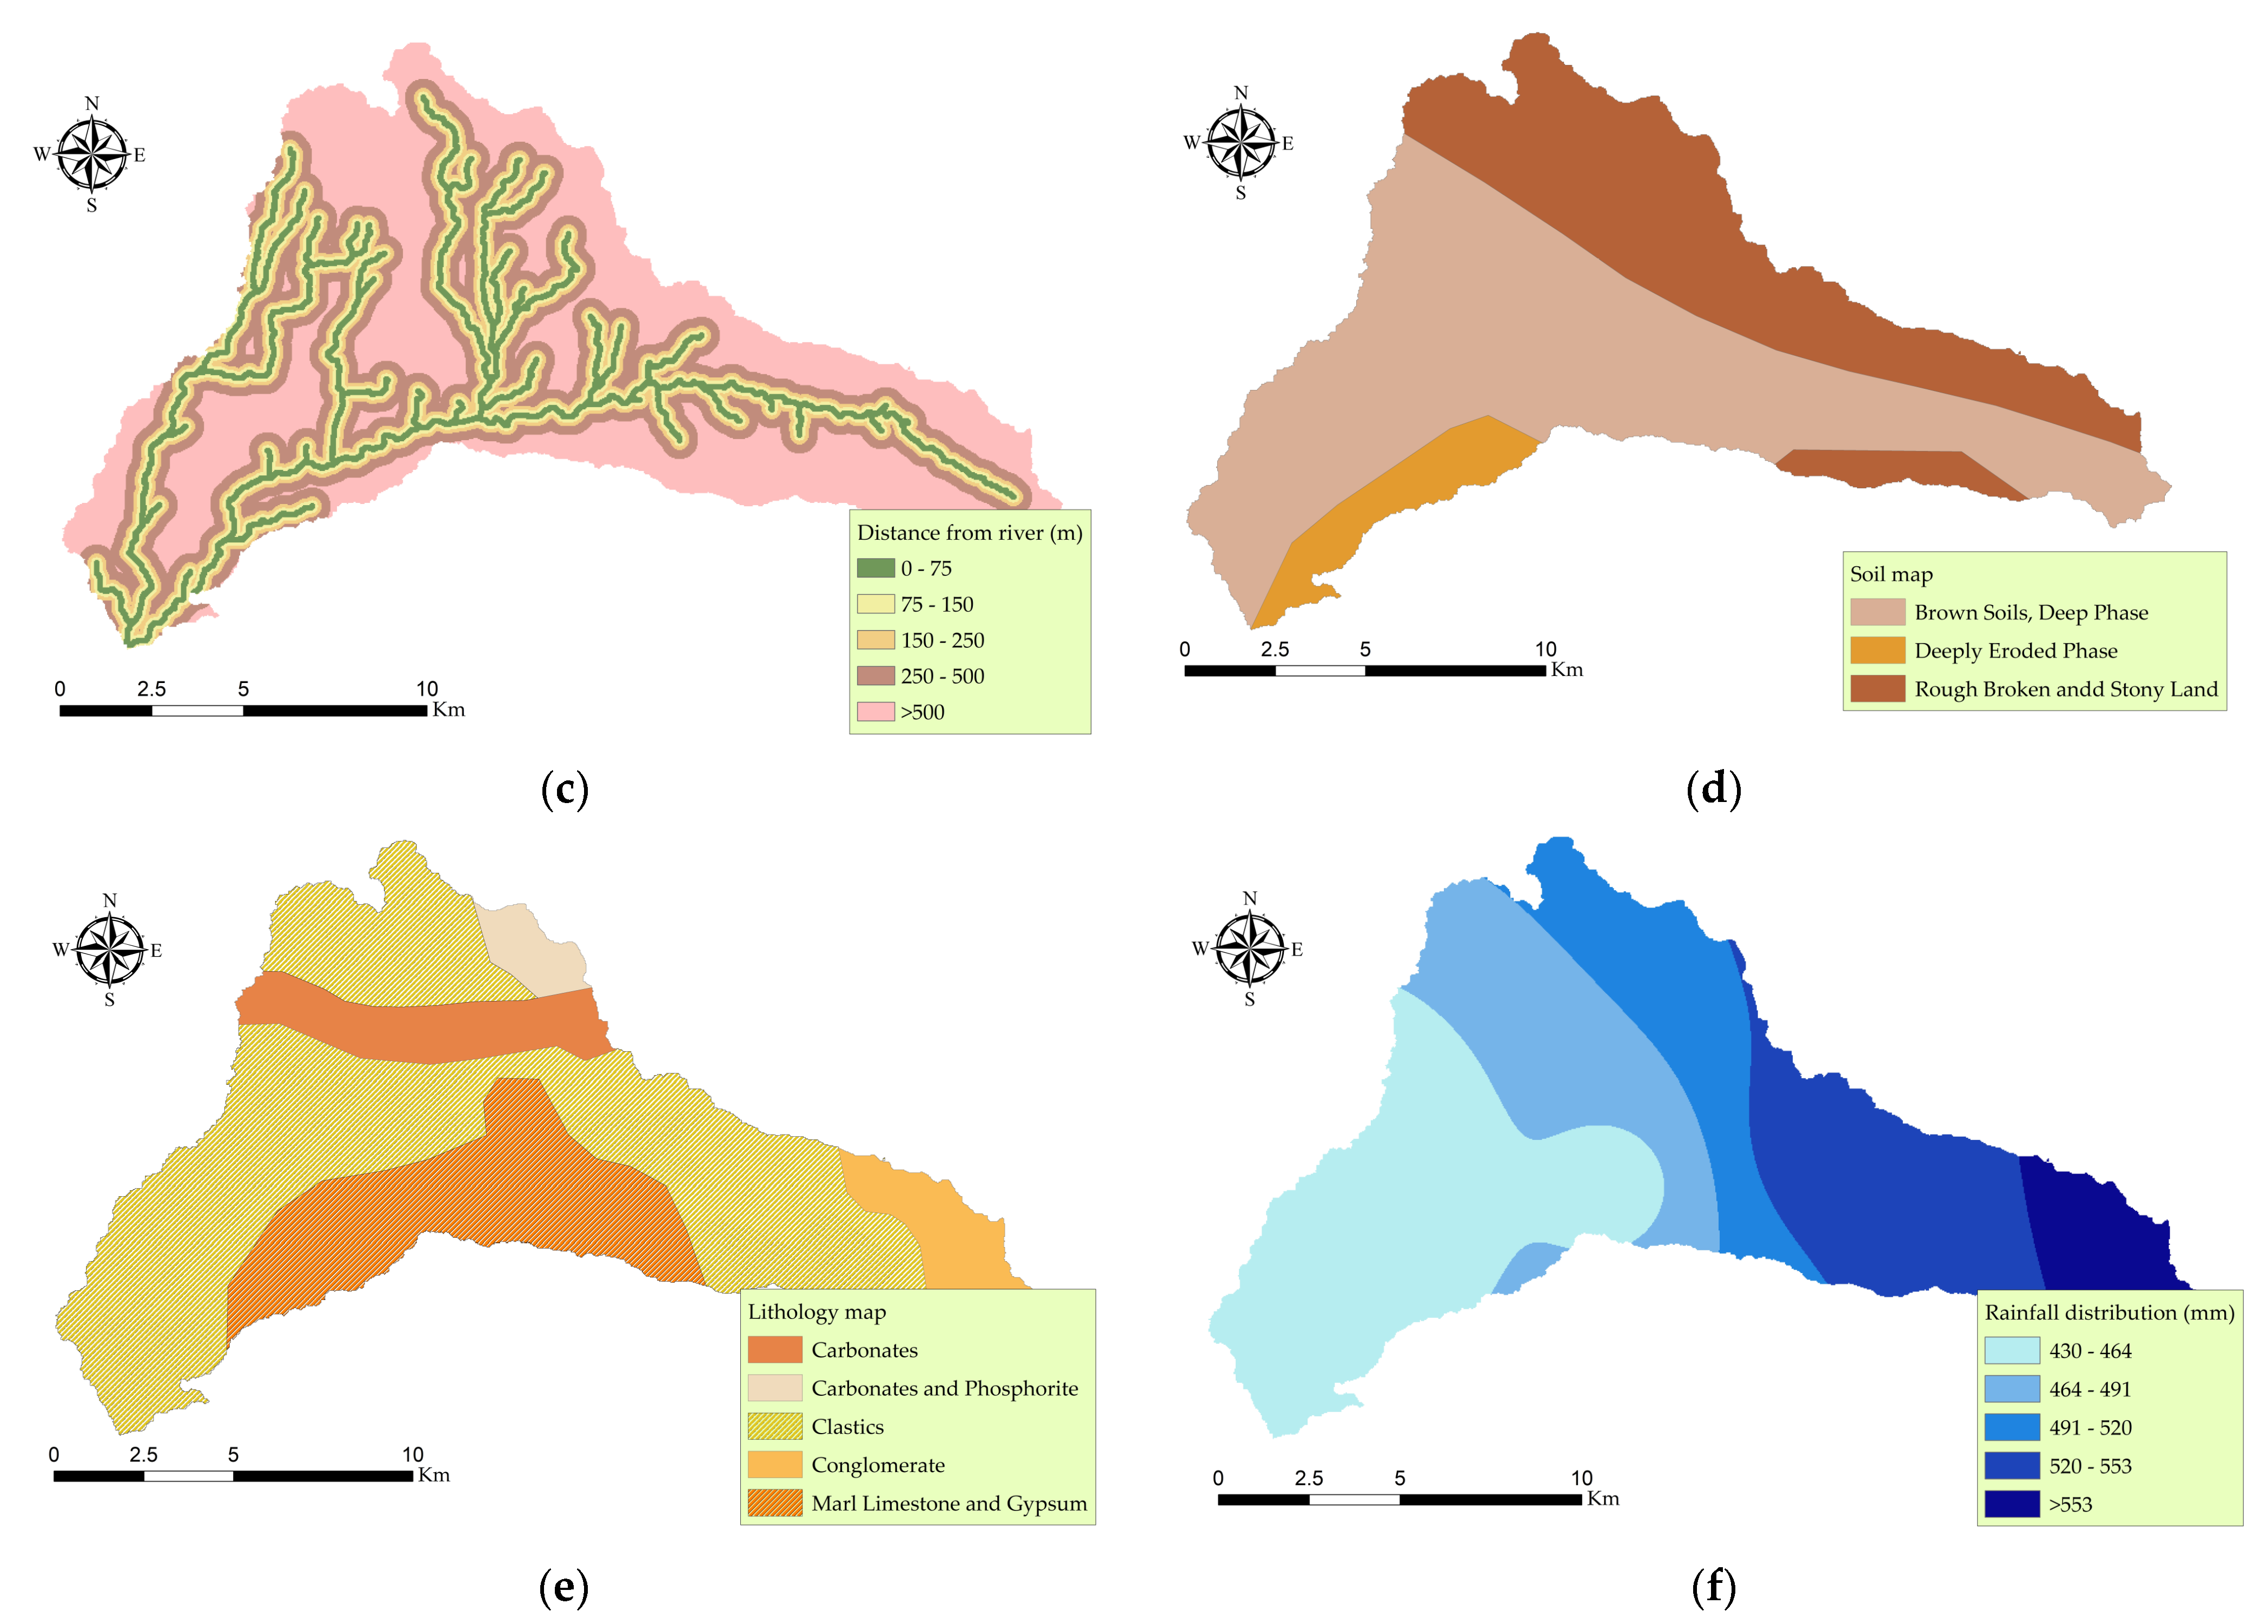
2.3.9. Distance from the River

The majority of communities that are impacted by floods are typically situated close to the river’s edge. Distance from the river is a critical conditioning feature for defining the areas of a basin that are prone to flooding, because it governs the incidence of flooding and the river flow to river factor. The more away from the river a location is, the less probable it is that it will be flooded. In this work, we determined the distance to the river by delineation of the watershed in the studied area, using the hydrology toolbox in ArcMap. The distance from the river (m) chart is depicted in Figure 3c.

2.3.10. Soil

In the process of rainfall and runoff, the different types of soil are one of the most important influencing factors. However, the qualities of the soil directly limit water infiltration, which in turn determines the generation of rainfall-runoff. Other factors, such as the local meteorological conditions and erosion, also play a role in regulating rainfall-runoff production. In the current investigation, the soil map of the studied area was extracted using a basin boundary from the prepared digital soil map of Iraq by the Food and Agriculture Organization (FAO). Figure 3d shows the soil map of the study area.

2.3.11. Lithology

The lithological properties of a region influence porosity and permeability. Such factors/properties of rock can impact flood intensity. In the present study, the geology map was prepared using Geological map of Iraq data (1:1,000,000 scale). Most of the study area is covered by Clastic rock, followed by marl limestone and gypsum, carbonates, etc. [41] (Figure 3e).

2.3.12. Rainfall

It has been determined that rainfall is one of the most important factors in influencing the occurrence of floods, as a large amount of rain in a short period of time might produce floods. The Ministry of Agriculture and Water Resources of the Kurdistan Regional Government was the source of the collected rainfall data. The rainfall data of the study area were extracted from five meteorological stations; three stations are within the study area and two of them are around the study area (Semel, Malta Nasara, Duhok, Qarqarava, and Zawita stations). Spatial points distribution of rainfall stations (monthly rainfall totals are available for every year) were used to interpolate the whole rainfall of the study area. Semel station recorded minimum average rainfall (430 mm), while Zawita station recorded maximum average rainfall (747 mm) in the same period. The average annual rainfall in the area of study is 588 mm. For this study, the average yearly rainfall values were derived from the average monthly rainfall. To compute the spatial distribution of average rainfall for the whole study area, the Inverse Distance Weighted (IDW) method was used within the ArcGIS environment. The raster layer of rainfall spatial distribution was created at 30-m resolution. The amount of rainfall in the study area increased from southwest to northeast, as shown in the figure (Figure 3f).

2.4. Analytical Hierarchy Process (AHP) Model

After completing all of the thematic layers, the analytical hierarchy process model was utilized to assign different weights to each of the parameters investigated. The analytical hierarchy method is a versatile and well-structured technique for interpreting complex decision scenarios involving several factors [55]. AHP is a well-established approach for solving complex decision-making problems. The advantage of using this method lies in the allotment of user-specified weights to a hierarchical structure of criteria and sub criteria. Therefore, AHP assists the user to evaluate the different components that are more important according to the requirements, and comprehend the problem with deeper understanding. In various problems such as flood susceptible mapping, landslide mapping, and groundwater potential zones assessment, AHP has been found to be a powerful and a beneficial tool with high accuracy [29,56,57,58,59,60,61].
The AHP methodology is divided into three steps. The first step of AHP is the preparation of a pairwise comparison matrix of all of the parameters affecting a system (Table 2). This judgement is purely based on the knowledge or the expertise of the user. The second step deals with the evaluation of different factors or parameters. The third and final step is the evaluation of the consistency of the AHP model to ascertain whether all the concerned parameters are consistent with each other or not. A well-established workflow for AHP model is shown in Figure 4.
The AHP model’s widespread appeal can be attributed to the fact that it is able to manage both quantitative and qualitative data in the process of evaluating natural disasters, such as floods. Generally, for flood-related studies, research scholars generally utilizes eight to nine factors [17,62,63]; however, the present study considered as many as twelve flood conditioning factors. For investigation problems regarding flood modeling or susceptibility studies, the AHP model is used to estimate the weights and rankings of various factors.
This paper’s analytical hierarchy approach is divided into two sections. The first component is the primary categorization system for all of the parameters, in which values are assigned to each parameter based on its relevance, and weights are calculated. The second portion is built by breaking down all of the criteria into subcategories (Table 3). In this case study, each of the twelve parameters utilized for hazard area mapping are individually evaluated. In addition, we divided each factor into a number of classes and gave a weight to every class. The maximum and minimum weights for every parameter class ranged between 1 and 5. The class weights utilized were proportional to the impact of each class on the hazard of flooding. All factors used the same classification, although their contributions to amplitudes varied [64]. The normalized weightage was multiplied with the rank of all individual parameter sub classes to obtain the overall weightage of all thematic layers. Finally, all of the weightage values were attributed in an Arc GIS file to obtain the final flood susceptibility map.
The consistency of the following method is carried out by the following equation [55]:
C R = C I R I
C I = λ m a x n n 1
where, C R denotes the consistency ratio, C I is the consistency index, R I denotes the random index, λ m a x denotes the matrix’s principal eigenvalue, and n denotes the number of components or factors. In Saaty [55], a significant number of components were used to obtain R I values. It has been discovered that R I is influenced by a variety of circumstances. According to Saaty [55], the comparable value of R I was 1.45 when there were nine components. The consistency ratio ( C R ) is acceptable in this study if it is less than 0.10, and suggests a fair level for the pairwise comparison matrix. Eventually, the calculated consistency ratio was 0.091677, which was lower than the threshold 0.10; the weights’ consistency was affirmed in the present study.

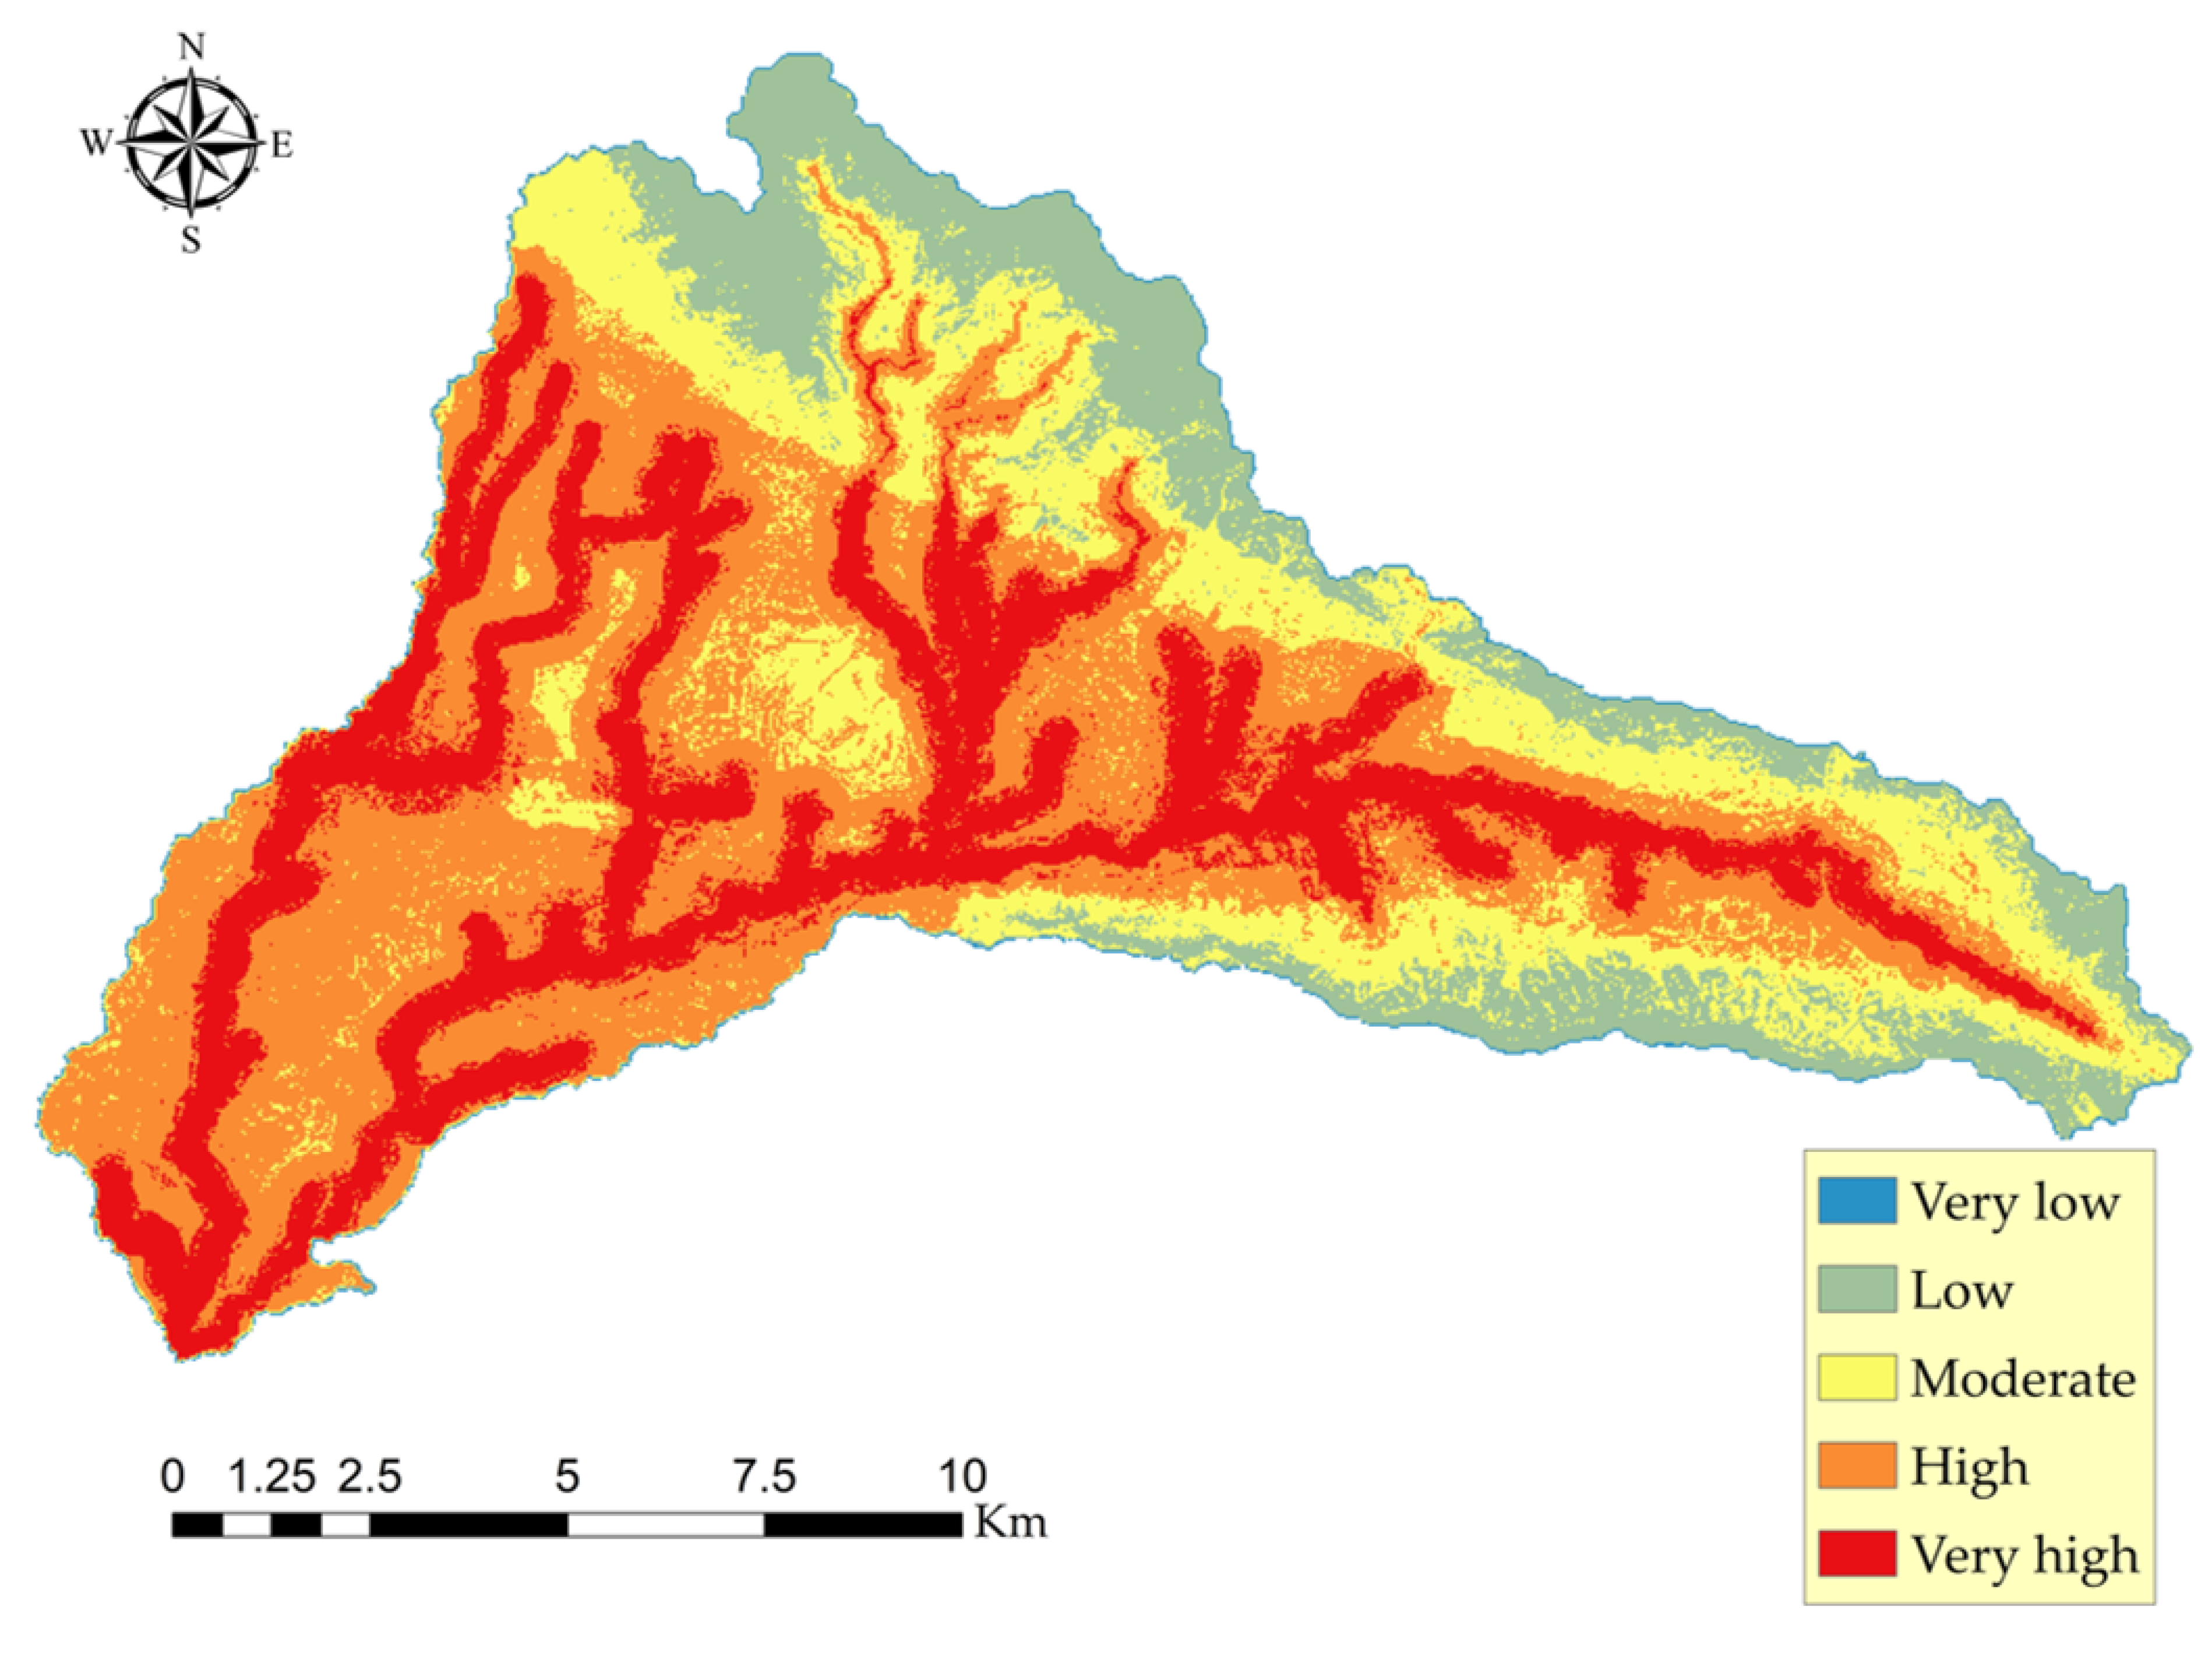
2.5. Flood Hazard Index (FHI)

The model that was implemented is capable of conducting a multi-criteria analysis, and incorporates the FHI. The FHI aims to be of assistance in the localization of high-risk areas for flooding. In the beginning, the GIS is used to process the information that has been collected from a variety of data sources. To proceed with the evaluation of the flooding probability rate, the FHI is computed using the following equation [65]:
F H I = i = 1 n W i R i
where W i is the weight of each parameter, R i is the rating of the factors, and n corresponds to the number of parameters.
Therefore, Equation (2) is written in the next form:
F H I = W E l e × R E l e + W S l × R S l + W D f R × R D f R + W R F × R R F + W L U L C × R L U L C + W S o × R S o + W L i t h × R L i t h + W T R I × R T R I + W T W I × R T W I + W A s × R A s + W S T I × R S T I + W S P I × R S P I
In order to assess the effect of each parameter on the vulnerability index, a final single parameter sensitivity analysis is performed. This test of sensitivity is carried out as a result of the arbitrary nature of the numerical values that are assigned to these parameters [66]. The arbitrary weights that were used in the beginning by AHP have been replaced with effective weights [64,65], and the results are derived using Equation (8).
W = [ ( P r × P w V ] × 100
where P r and P w stand for the ratings and weights of the parameter P, respectively, and V is the vulnerability index that was generated using Equation (7). After that, the effective weights, which can be found in Table 4, are utilized in the process of calculating the revised Flood Hazard Index that comes from the sensitivity analysis (FHIS). The FHI index and the FHIS index both conduct research on the same factors and class rating, but the FHIS index uses a different weighting system (the average effective weight of the sensitivity analysis is transformed in the scale of 5).

3. Results

In the GIS framework, the twelve maps that were created after the AHP and weighting approach were integrated and superposed with each other. The AHP weightage for all the thematic layers, namely elevation, slope, distance from the river, rainfall, LULC, soil, lithology, TRI, TWI, aspect, STI, and SPI, were 0.207, 0.174, 0.174, 0.134, 0.085, 0.085, 0.0378, 0.037, 0.0229, 0.0174, 0.0116, and 0.0116 respectively. These weightage values were multiplied with all parameter factors and the FHI was prepared.
After constructing the final map of the flood-prone area, we divided it into five primary classes, ranging from very low to very high in terms of the vulnerability of flooding occurring there. The final FHIS classes ranged from 0.951 to 38.06, and they were classified into five classes, namely very low, low, moderate, high, and very high. These classes occupied the areas of 2.10, 27.72, 38.97, 69.40, and 44.72, respectively. The majority of the area was covered by high and very high flood susceptibility zones (Figure 5). Clearly, the majority of investigated areas are susceptible to flooding. According to the categorization, out of the total area of 180 km2, approximately 114.12 km2 was classified as having a high or a very high flooding hazard. This represents approximately 63.4% of the investigated total area. The high and very high flood susceptibility zones were derived from low-lying areas (<1000 m), flat areas with a slope less than 10°, a distance from the river less than 500 m, the highest stream power and sediment transport index region, and finally, hard rock terrain and a low permeability soil type region. Furthermore, areas in the high and very high flood susceptibility zones were located in built-up areas. This tells us that the lives and properties of residents are at danger in any heavy rainfall event since built-up areas are more likely to experience flooding. Urban surface flooding is defined by the Federal Emergency Management Agency (FEMA) of the United States as the inundation of assets or any property in a developed environment, particularly in areas where the population is denser and an impervious surface dominates with poor drainage or sewer systems. Urban surface flooding can also include water that enters houses through sewer pipes [67]. The total area of the zones that had a very low possibility of flooding was only 2.10 km2, which was equivalent to the 1.20% area under consideration. Very low flood hazard areas are generally found in areas that are both extremely elevated (at the top of mountains) and extremely steep and rocky. The terrain between mountains and high hills, as well as hills in the northern and southwest parts of the research area, contained the majority of the moderately susceptible areas. Only 20% of the total research area was included in the zone of moderate susceptibility, which was 38.97 km2 in area.
The very high and high flood susceptibility zones in the research area are generally distributed throughout the geography of the area and are not limited to a specific locality. This could result in more severe flooding in places that are already at a moderate level. It is more probable for flash floods to occur in regions that have a dry climate and impervious terrain. This is because a lack of pervious surface or vegetation enables heavy rains to flow overland rather than seeping into the earth, which increases the risk of flooding. The results further display that most of Duhok city or the nearby area comes under very high flood-susceptible zones, and substantial damage could occur in the future in these areas. In addition, the majority of the neighborhoods or streets that are located close to the Hishakru and Duhok rivers have a high to very high flood susceptibility. This demonstrates the presence of a river that transports a significant volume of water during the wet season and occasionally floods areas that are located nearby; this will be discussed more in the validation section. Flood susceptibility maps make it abundantly clear that certain areas in the northwest and southwest directions contain high and very high flood-prone areas; however, due to the fact that these areas primarily consist of agricultural and bare land, it is expected that the impact of the flood will be less severe in these areas compared to those that contain built-up areas. As a result of the heavy rains and flooding that occurred in March 2020 in the province of Duhok, more than 400 houses, 61 vehicles, and hundreds of shops sustained damage (Figure 6) [68]. These locations can be found inside the map of areas that are highly susceptible to flooding. Post-rain flooding is a recurrent problem across the country, largely due to chronically inadequate infrastructure, such as ineffective or poorly maintained urban rainwater management and sewage systems.

4. Sensitivity Analysis and Validation

Sensitivity analysis and validation are two phases that are crucial aspects of flood susceptibility modeling. Overall, the reliability of the suggested approach for the assessment of the flood hazardous areas was greatly improved as a result of the validation of the weights of the FHI index. Table 4 shows the effective weight that was determined by the sensitivity analysis.
To validate the flood susceptibility mapping, a success rate was required. Using 41 training flood areas, the success rate was computed. The historic flood areas were compiled using information from news reports, reports from the directorate of water and sewage in Duhok, and before and after satellite pictures (https://earthexplorer.usgs.gov/) (accessed on 25 October 2022). There are several areas in Duhok city that are prone to flooding, as can be observed, and this is because of the previously described variables that lead to the generation of surface floods. These causes include terrain, poor drainage systems, and changes in land cover. As a result of this, it has been determined that the neighborhoods of Baroshke, Mahabad, Diyari, Serhildan, Zirka, KRO, Bntika, and Malta are the most vulnerable places inside the city of Duhok. The upcoming flood event might occur in high and extremely high vulnerability zones [69,70]. In addition, basic statistical methods were applied in order to check and confirm the results of the susceptibility maps. These maps demonstrate the degree to which the model accurately predicts the extent of flooding compared to historical flood locations. The validation of flood susceptibility mapping shows thirty-six, four, and one flood location in the area of very high, high, and moderate flood susceptibility zones (Figure 7). According to the findings of the validation, 97.5% of the places that have been flooded in the past are areas that are classified as having a high or very high vulnerability in this study.

5. Discussion

The methodology that has been presented for the estimate of flood hazard zones has the potential to be an effective strategy for the mitigation of the devastation that is caused by floods. In addition, the validation method that was used, which also considered floods that occurred in the past, led to the computation of the modified FHIS index, which is able to provide support for the study. Within the scope of this investigation, the FHIS index has shed light on the fact that distance from rivers and elevation are both significant factors in determining the extent of flooding, indicating that the consideration of these factors is essential for developing effective flood prevention strategies.
Particularly, the modified index (FHIS) reveals that lowland areas close to rivers are even more susceptible to flooding. The sensitivity analysis specifically considers the vicinity of rivers in the category of very highly prone locations. The FHIS findings are supported by historical flood records, which also show that settlements near rivers are frequently flooded. Additionally, Figure 7 shows how FHIS analysis categorizes locations with a lot of recorded flood episodes as highly susceptible areas, another sign of its accuracy.
According to the effective weights that were utilized in the sensitivity analysis (Table 4), the FHI assumption inaccurately underestimated elevation, distance from the river, LULC, and soil. Simultaneously, the FHI assumption overestimated slope, rainfall, and TWI. Initially, FHI considered that elevation was the most important factor to consider. However, the results of the sensitivity analysis showed that the factors with the greatest impact on the investigated area were distance from the river, followed by elevation, soil, and slope. This perspective was supported as well in [71].
Obviously, there is a correlation between the zones with the highest vulnerability to flooding and urban areas. Consequently, this index gained a greater weight. However, this effect is particularly crucial to flooding and has a substantial impact on the resulting flood susceptibility map. It is also important to note that four factors, distance from river, elevation, soil type, and slope, were given considerable weights, as shown. The comparison of the FHI and FHIS indices highlighted the influence and weight of each parameter in flood hazard assessment.

6. Conclusions

The AHP and geospatial techniques were utilized to demarcate flood-prone regions in Iraq’s Duhok district, resulting in a time-consuming and cost-effective methodology. Elevation, slope, distance from the river, topographic wetness index, rainfall, the topographic roughness index, the stream power index, the sediment transport index, land use, geology, aspect, and soil map were all included in the ArcGIS platform. As a consequence, a flood susceptibility map was developed, revealing that about 48.16 km2 of the research region was extremely vulnerable to floods. These regions are mainly found in the middle section of the Duhok district, where the slope grade rapidly changes and numerous minor streams join the main river. The validation of the data further reveals that 97.5% of the historic flood locations fall into high and very high flood susceptible zones. The approach utilized in this study has the potential to be used to provide flood control recommendations in the study area. The availability of temporal datasets for these factors will determine future temporal analysis. Furthermore, the current study’s future scope includes vulnerability and damage assessments of various subdivisions based on demographic criteria by assessing the vulnerability index. These models may be enhanced further by conducting sensitivity analysis on many key factors. Flood prevention techniques have recently received more attention, particularly in Duhok, where flash floods occur on an annual basis. Other basins and sites, on the other hand, have yet to undergo flood control testing. As a consequence, the current study was conducted in the Duhok district, employing AHP to obtain relevant information on ways that may be utilized to aid local governments and other parties in the implementation of successful flash flood mitigation measures and land-use policy planning.

Author Contributions

Conceptualization, A.M., A.R.M.A. and D.A.K.; methodology, A.M., A.R.M.A. and D.A.K.; software, A.M., H.M.H. and A.R.M.A.; validation, A.A.M. and B.K.M.S.; formal analysis, A.M. and A.R.M.A.; investigation, A.M., A.R.M.A. and D.A.K.; resources, A.M., B.K.M.S. and H.M.H.; writing—original draft preparation, A.M., A.R.M.A. and D.A.K.; writing—review and editing, A.M., M.S. and H.M.H.; supervision, M.S. All authors have read and agreed to the published version of the manuscript.

Funding

This research received no external funding.

Conflicts of Interest

The authors declare no conflict of interest.

References

  1. Jha, A.K.; Bloch, R.; Lamond, J. Cities and Flooding: A Guide to Integrated Urban Flood Risk Management for the 21st Century; World Bank Publications: Washington, DC, USA, 2012. [Google Scholar]
  2. Ritchie, H.; Roser, M. Natural disasters. In Our World in Data. 2014. Available online: https://ourworldindata.org/natural-disasters?fbclid=IwAR2C1uQR2N1_jegLjxUHjMuLP_ClFJMz5CHdLuSf5ce9L46yQxe9Ls0H1OE (accessed on 13 November 2022).
  3. Abhishek; Kinouchi, T. Multidecadal Land Water and Groundwater Drought Evaluation in Peninsular India. Remote Sens 2022, 14, 1486. [Google Scholar]
  4. Mann, M.E.; Gleick, P.H. Climate change and California drought in the 21st century. Proc. Natl. Acad. Sci. USA 2015, 112, 3858–3859. [Google Scholar] [CrossRef] [Green Version]
  5. Kron, W. Keynote lecture: Flood risk= hazard× exposure× vulnerability. Flood Def. 2002, pp. 82–97. Available online: http://www.civil.ist.utl.pt/~joana/DFA-riscos-net/2007-08/kron%20-%20flod%20risk%20=%20hazard.pdf (accessed on 13 November 2022).
  6. Tehrany, M.S.; Pradhan, B.; Jebur, M.N. Spatial prediction of flood susceptible areas using rule based decision tree (DT) and a novel ensemble bivariate and multivariate statistical models in GIS. J. Hydrol. 2013, 504, 69–79. [Google Scholar] [CrossRef]
  7. Abhishek; Kinouchi, T.; Sayama, T. A comprehensive assessment of water storage dynamics and hydroclimatic extremes in the Chao Phraya River Basin during 2002–2020. J. Hydrol. 2021, 603, 126868. [Google Scholar] [CrossRef]
  8. Sampson, C.C.; Smith, A.M.; Bates, P.D.; Neal, J.C.; Alfieri, L.; Freer, J.E. A high-resolution global flood hazard model. Water Resour. Res. 2015, 51, 7358–7381. [Google Scholar] [CrossRef] [Green Version]
  9. Swain, D.; Wing, O.E.; Bates, P.D.; Done, J.; Johnson, K.; Cameron, D. Increased flood exposure due to climate change and population growth in the United States. Earth’s Future 2020, 8, e2020EF001778. [Google Scholar] [CrossRef]
  10. Marsooli, R.; Lin, N. Impacts of climate change on hurricane flood hazards in Jamaica Bay, New York. Clim. Chang. 2020, 163, 2153–2171. [Google Scholar] [CrossRef]
  11. Khan, I.; Lei, H.; Shah, A.A.; Khan, I.; Muhammad, I. Climate change impact assessment, flood management, and mitigation strategies in Pakistan for sustainable future. Environ. Sci. Pollut. Res. 2021, 28, 29720–29731. [Google Scholar] [CrossRef]
  12. Hirabayashi, Y.; Mahendran, R.; Koirala, S.; Konoshima, L.; Yamazaki, D.; Watanabe, S.; Kim, H.; Kanae, S. Global flood risk under climate change. Nat. Clim. Chang. 2013, 3, 816–821. [Google Scholar] [CrossRef]
  13. Charlton, R.; Fealy, R.; Moore, S.; Sweeney, J.; Murphy, C. Assessing the impact of climate change on water supply and flood hazard in Ireland using statistical downscaling and hydrological modelling techniques. Clim. Chang. 2006, 74, 475–491. [Google Scholar] [CrossRef]
  14. Chan, N.W. Increasing flood risk in Malaysia: Causes and solutions. Disaster Prev. Manag. Int. J. 1997, 6, 72–86. [Google Scholar] [CrossRef]
  15. Wang, Y.; Li, C.; Liu, M.; Cui, Q.; Wang, H.; Jianshu, L.; Li, B.; Xiong, Z.; Hu, Y. Spatial characteristics and driving factors of urban flooding in Chinese megacities. J. Hydrol. 2022, 613, 128464. [Google Scholar] [CrossRef]
  16. Lim, J.; Lee, K.-S. Investigating flood susceptible areas in inaccessible regions using remote sensing and geographic information systems. Environ. Monit. Assess. 2017, 189, 1–13. [Google Scholar] [CrossRef]
  17. Das, S. Geographic information system and AHP-based flood hazard zonation of Vaitarna basin, Maharashtra, India. Arab. J. Geosci. 2018, 11, 1–13. [Google Scholar] [CrossRef]
  18. Abdelkarim, A.; Gaber, A.F.D.; Youssef, A.M.; Pradhan, B. Flood Hazard Assessment of the Urban Area of Tabuk City, Kingdom of Saudi Arabia by Integrating Spatial-Based Hydrologic and Hydrodynamic Modeling. Sensors 2019, 19, 1024. [Google Scholar] [CrossRef] [Green Version]
  19. Cabrera, J.S.; Lee, H.S. Flood risk assessment for Davao Oriental in the Philippines using geographic information system-based multi-criteria analysis and the maximum entropy model. J. Flood Risk Manag. 2020, 13, e12607. [Google Scholar] [CrossRef] [Green Version]
  20. Gigović, L.; Pamučar, D.; Bajić, Z.; Drobnjak, S. Application of GIS-interval rough AHP methodology for flood hazard mapping in urban areas. Water 2017, 9, 360. [Google Scholar] [CrossRef] [Green Version]
  21. Correia, F.N.; Da graça saraiva, M.; Da Silva, F.N.; Ramos, I. Floodplain management in urban developing areas. Part I. Urban growth scenarios and land-use controls. Water Resour. Manag. 1999, 13, 1–21. [Google Scholar] [CrossRef]
  22. Dou, X.; Song, J.; Wang, L.; Tang, B.; Xu, S.; Kong, F.; Jiang, X. Flood risk assessment and mapping based on a modified multi-parameter flood hazard index model in the Guanzhong Urban Area, China. Stoch. Environ. Res. Risk Assess. 2018, 32, 1131–1146. [Google Scholar] [CrossRef]
  23. Hong, H.; Panahi, M.; Shirzadi, A.; Ma, T.; Liu, J.; Zhu, A.-X.; Chen, W.; Kougias, I.; Kazakis, N. Flood susceptibility assessment in Hengfeng area coupling adaptive neuro-fuzzy inference system with genetic algorithm and differential evolution. Sci. Total Environ. 2018, 621, 1124–1141. [Google Scholar] [CrossRef]
  24. Nourani, V.; Tahershamsi, A.; Abbaszadeh, P.; Shahrabi, J.; Hadavandi, E. A new hybrid algorithm for rainfall–runoff process modeling based on the wavelet transform and genetic fuzzy system. J. Hydroinformatics 2014, 16, 1004–1024. [Google Scholar] [CrossRef] [Green Version]
  25. Guo, E.; Zhang, J.; Ren, X.; Zhang, Q.; Sun, Z. Integrated risk assessment of flood disaster based on improved set pair analysis and the variable fuzzy set theory in central Liaoning Province, China. Nat. Hazards 2014, 74, 947–965. [Google Scholar] [CrossRef]
  26. Abbaszadeh, P. Improving hydrological process modeling using optimized threshold-based wavelet de-noising technique. Water Resour. Manag. 2016, 30, 1701–1721. [Google Scholar] [CrossRef]
  27. Dodangeh, E.; Choubin, B.; Eigdir, A.N.; Nabipour, N.; Panahi, M.; Shamshirband, S.; Mosavi, A. Integrated machine learning methods with resampling algorithms for flood susceptibility prediction. Sci. Total Environ. 2020, 705, 135983. [Google Scholar] [CrossRef]
  28. Mojaddadi, H.; Pradhan, B.; Nampak, H.; Ahmad, N.; Ghazali, A.H.b. Ensemble machine-learning-based geospatial approach for flood risk assessment using multi-sensor remote-sensing data and GIS. Geomat. Nat. Hazards Risk 2017, 8, 1080–1102. [Google Scholar] [CrossRef] [Green Version]
  29. Mzuri, R.T.; Mustafa, Y.T.; Omar, A.A. Land degradation assessment using AHP and GIS-based modelling in Duhok District, Kurdistan Region, Iraq. Geocarto Int. 2021, 1–19. [Google Scholar] [CrossRef]
  30. Fatah, K.K.; Mustafa, Y.T. Flood Susceptibility Mapping Using an Analytic Hierarchy Process Model Based on Remote Sensing and GIS Approaches in Akre District, Kurdistan Region, Iraq. Iraqi Geol. J. 2022, 55, 123–151. [Google Scholar] [CrossRef]
  31. Hameed, H.M.; Faqe, G.R.; Rasul, A. Effects of land cover change on surface runoff using GIS and remote sensing: A case study Duhok sub-basin. In Environmental Remote Sensing and GIS in Iraq; Springer: Berlin/Heidelberg, Germany, 2020; pp. 205–223. [Google Scholar]
  32. Mustafa, A.; Szydłowski, M. The Impact of Spatiotemporal Changes in Land Development (1984–2019) on the Increase in the Runoff Coefficient in Erbil, Kurdistan Region of Iraq. Remote Sens. 2020, 12, 1302. [Google Scholar] [CrossRef] [Green Version]
  33. Al-Quraishi, A.M.F.; Negm, A.M. Environmental Remote Sensing and GIS in Iraq; Springer: Berlin/Heidelberg, Germany, 2019. [Google Scholar]
  34. Rajab, R.; Nabi, J. The Impact of Urban Green Open Spaces on generating Urban Floods; Case of Duhok City. 2020. Available online: https://www.researchgate.net/profile/Ravand-Rasol-2/publication/355436294_The_Impact_of_Urban_Green_Open_Spaces_on_generating_Urban_Floods_Case_of_Duhok_City/links/61701dedc10b387664c24f78/The-Impact-of-Urban-Green-Open-Spaces-on-generating-Urban-Floods-Case-of-Duhok-City.pdf (accessed on 14 November 2022).
  35. Amen, A.R.M.; Kareem, D.A.; Mirza, A.A.; Salih, A.M. Development of Intensity-Duration-Frequency Curves “IDF” for Dohuk City in Kurdistan Region of Iraq. J. Duhok Univ. 2022, 25, 366–379. [Google Scholar] [CrossRef]
  36. Kareem, D.A.; M Amen, A.R.; Mustafa, A.; Yüce, M.I.; Szydłowski, M. Comparative Analysis of Developed Rainfall Intensity–Duration–Frequency Curves for Erbil with Other Iraqi Urban Areas. Water 2022, 14, 419. [Google Scholar] [CrossRef]
  37. Mustafa, A.M.; Muhammed, H.H.; Szydlowski, M. Extreme rainfalls as a cause of urban flash floods; a case study of the erbil-kurdistan region of iraq. Acta Sci. Pol. Form. Circumiectus 2019, 18, 113–132. [Google Scholar] [CrossRef]
  38. Mustafa, Y.T.; Ali, R.T.; Saleh, R.M. Monitoring and evaluating land cover change in the Duhok city, Kurdistan region-Iraq, by using remote sensing and GIS. Int. J. Eng. Invent. 2012, 1, 28–33. [Google Scholar]
  39. Mzuri, R.T.; Omar, A.A.; Mustafa, Y.T. Spatiotemporal analysis of vegetation cover and its response to terrain and climate factors in Duhok Governorate, Kurdistan Region, Iraq. Iraqi Geol. J. 2021, 54, 110–126. [Google Scholar] [CrossRef]
  40. Hajani, E.; Klari, Z. Trends analysis in rainfall data series in Duhok city, Kurdistan region, Iraq. Model. Earth Syst. Environ. 2022, 8, 4177–4190. [Google Scholar] [CrossRef]
  41. Sissakian, V.; Fouad, S. Geological Map of Iraq, Scale 1: 1,000,000, 4th ed.; GEOSURV: Baghdad, Iraq, 2012. [Google Scholar]
  42. Davoudi Moghaddam, D.; Pourghasemi, H.R.; Rahmati, O. Assessment of the contribution of geo-environmental factors to flood inundation in a semi-arid region of SW Iran: Comparison of different advanced modeling approaches. In Natural Hazards GIS-Based Spatial Modeling Using Data Mining Techniques; Springer: Berlin/Heidelberg, Germany, 2019; pp. 59–78. [Google Scholar]
  43. Paul, G.C.; Saha, S.; Hembram, T.K. Application of the GIS-based probabilistic models for mapping the flood susceptibility in Bansloi sub-basin of Ganga-Bhagirathi river and their comparison. Remote Sens. Earth Syst. Sci. 2019, 2, 120–146. [Google Scholar] [CrossRef]
  44. Sturzenegger, M.; Holm, K.; Lau, C.-A.; Jakob, M. Semi-automated regional scale debris-flow and debris-flood susceptibility mapping based on digital elevation model metrics and Flow-R software. In Association of Environmental and Engineering Geologists; Special Publication 28. 2019. Available online: https://repository.mines.edu/handle/11124/173134 (accessed on 13 November 2022).
  45. Arabameri, A.; Saha, S.; Chen, W.; Roy, J.; Pradhan, B.; Bui, D.T. Flash flood susceptibility modelling using functional tree and hybrid ensemble techniques. J. Hydrol. 2020, 587, 125007. [Google Scholar] [CrossRef]
  46. Lei, X.; Chen, W.; Avand, M.; Janizadeh, S.; Kariminejad, N.; Shahabi, H.; Costache, R.; Shahabi, H.; Shirzadi, A.; Mosavi, A. GIS-based machine learning algorithms for gully erosion susceptibility mapping in a semi-arid region of Iran. Remote Sens. 2020, 12, 2478. [Google Scholar] [CrossRef]
  47. Chen, J.; Li, Q.; Wang, H.; Deng, M. A machine learning ensemble approach based on random forest and radial basis function neural network for risk evaluation of regional flood disaster: A case study of the Yangtze River Delta, China. Int. J. Environ. Res. Public Health 2020, 17, 49. [Google Scholar] [CrossRef] [Green Version]
  48. Chu, H.; Wu, W.; Wang, Q.J.; Nathan, R.; Wei, J. An ANN-based emulation modelling framework for flood inundation modelling: Application, challenges and future directions. Environ. Model. Softw. 2020, 124, 104587. [Google Scholar] [CrossRef]
  49. Stevaux, J.C.; de Azevedo Macedo, H.; Assine, M.L.; Silva, A. Changing fluvial styles and backwater flooding along the Upper Paraguay River plains in the Brazilian Pantanal wetland. Geomorphology 2020, 350, 106906. [Google Scholar] [CrossRef]
  50. Abdel Hamid, H.; Wenlong, W.; Qiaomin, L. Environmental sensitivity of flash flood hazard using geospatial techniques. Glob. J. Environ. Sci. Manag. 2020, 6, 31–46. [Google Scholar]
  51. Meles, M.B.; Younger, S.E.; Jackson, C.R.; Du, E.; Drover, D. Wetness index based on landscape position and topography (WILT): Modifying TWI to reflect landscape position. J. Environ. Manag. 2020, 255, 109863. [Google Scholar] [CrossRef] [PubMed]
  52. Wu, L.; He, Y.; Ma, X. Can soil conservation practices reshape the relationship between sediment yield and slope gradient? Ecol. Eng. 2020, 142, 105630. [Google Scholar] [CrossRef]
  53. Moore, I.D.; Gessler, P.E.; Nielsen, G.; Peterson, G. Soil attribute prediction using terrain analysis. Soil Sci. Soc. Am. J. 1993, 57, 443–452. [Google Scholar] [CrossRef]
  54. Benito, G.; Rico, M.; Sánchez-Moya, Y.; Sopeña, A.; Thorndycraft, V.; Barriendos, M. The impact of late Holocene climatic variability and land use change on the flood hydrology of the Guadalentín River, southeast Spain. Glob. Planet. Chang. 2010, 70, 53–63. [Google Scholar] [CrossRef] [Green Version]
  55. Saaty, T. The Analytic Hierarchy Process: Planning, Priority Setting, Resources Allocation; Mcgraw-Hill: New York, NY, USA, 1980. [Google Scholar]
  56. Kittipongvises, S.; Phetrak, A.; Rattanapun, P.; Brundiers, K.; Buizer, J.L.; Melnick, R. AHP-GIS analysis for flood hazard assessment of the communities nearby the world heritage site on Ayutthaya Island, Thailand. Int. J. Disaster Risk Reduct. 2020, 48, 101612. [Google Scholar] [CrossRef]
  57. Mahmoud, S.H.; Gan, T.Y. Multi-criteria approach to develop flood susceptibility maps in arid regions of Middle East. J. Clean. Prod. 2018, 196, 216–229. [Google Scholar] [CrossRef]
  58. Surwase, T.; Manjusree, P.; Nagamani, P.; Jaisankar, G. Novel technique for developing flood hazard map by using AHP: A study on part of Mahanadi River in Odisha. SN Appl. Sci. 2019, 1, 1196. [Google Scholar] [CrossRef] [Green Version]
  59. Malka, A. GIS-Based Landslide Susceptibility Modelling in Urbanized Areas: A Case Study of the Tri-City Area of Poland. GeoHazards 2022, 3, 508–528. [Google Scholar] [CrossRef]
  60. Danumah, J.H.; Odai, S.N.; Saley, B.M.; Szarzynski, J.; Thiel, M.; Kwaku, A.; Kouame, F.K.; Akpa, L.Y. Flood risk assessment and mapping in Abidjan district using multi-criteria analysis (AHP) model and geoinformation techniques,(cote d’ivoire). Geoenvironmental Disasters 2016, 3, 10. [Google Scholar] [CrossRef] [Green Version]
  61. El Jazouli, A.; Barakat, A.; Khellouk, R. GIS-multicriteria evaluation using AHP for landslide susceptibility mapping in Oum Er Rbia high basin (Morocco). Geoenvironmental Disasters 2019, 6, 3. [Google Scholar] [CrossRef]
  62. Mandal, B.; Mandal, S. Analytical hierarchy process (AHP) based landslide susceptibility mapping of Lish river basin of eastern Darjeeling Himalaya, India. Adv. Space Res. 2018, 62, 3114–3132. [Google Scholar] [CrossRef]
  63. Saha, A.K.; Agrawal, S. Mapping and assessment of flood risk in Prayagraj district, India: A GIS and remote sensing study. Nanotechnol. Environ. Eng. 2020, 5, 11. [Google Scholar] [CrossRef]
  64. Stefanidis, S.; Stathis, D. Assessment of flood hazard based on natural and anthropogenic factors using analytic hierarchy process (AHP). Nat. Hazards 2013, 68, 569–585. [Google Scholar] [CrossRef]
  65. Napolitano, P.; Fabbri, A. Single-parameter sensitivity analysis for aquifer vulnerability assessment using DRASTIC and SINTACS. IAHS Publ.-Ser. Proc. Rep.-Intern Assoc Hydrol. Sci. 1996, 235, 559–566. [Google Scholar]
  66. Zghibi, A.; Merzougui, A.; Chenini, I.; Ergaieg, K.; Zouhri, L.; Tarhouni, J. Groundwater vulnerability analysis of Tunisian coastal aquifer: An application of DRASTIC index method in GIS environment. Groundw. Sustain. Dev. 2016, 2, 169–181. [Google Scholar] [CrossRef]
  67. Rainey, J.L.; Brody, S.D.; Galloway, G.E.; Highfield, W.E. Assessment of the growing threat of urban flooding: A case study of a national survey. Urban Water J. 2021, 18, 375–381. [Google Scholar] [CrossRef]
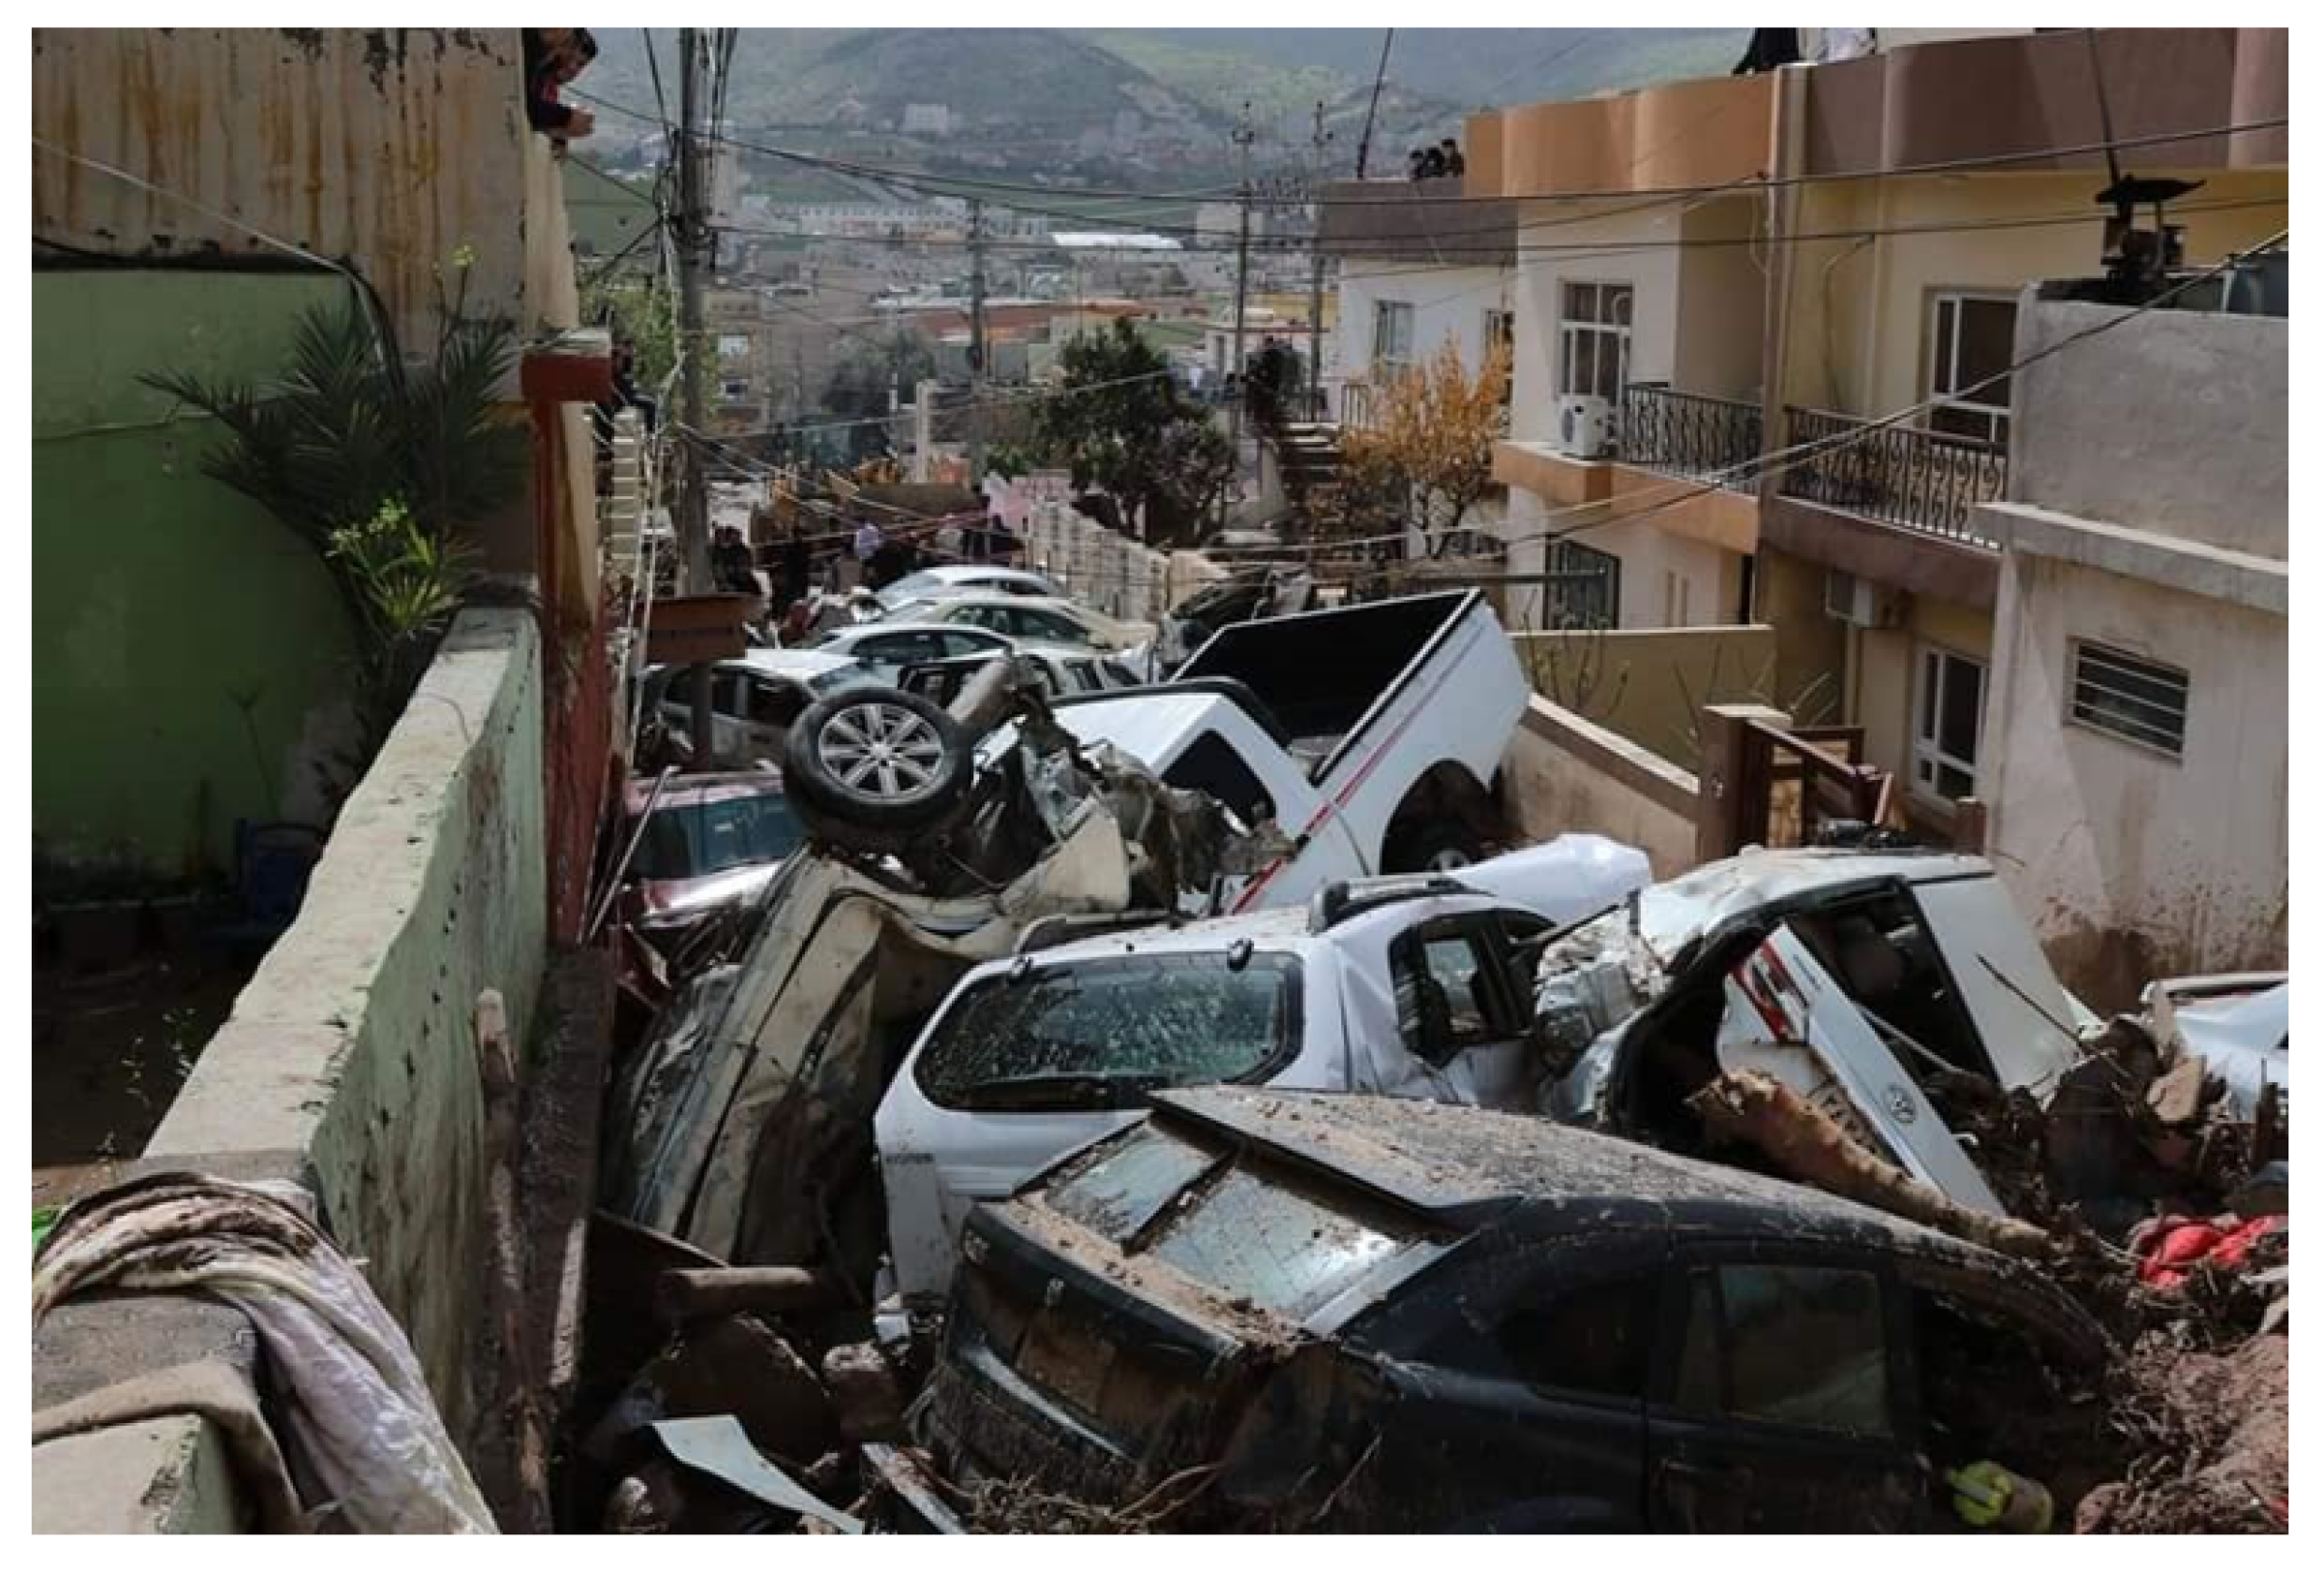
  68. Basnews. Duhok: Flash Flood Damages Hundreds of Homes, Shops, Cars. Available online: https://www.basnews.com/en/babat/590220 (accessed on 9 December 2022).
  69. Natarajan, L.; Usha, T.; Gowrappan, M.; Palpanabhan Kasthuri, B.; Moorthy, P.; Chokkalingam, L. Flood susceptibility analysis in chennai corporation using frequency ratio model. J. Indian Soc. Remote Sens. 2021, 49, 1533–1543. [Google Scholar] [CrossRef]
  70. Samanta, S.; Pal, D.K.; Palsamanta, B. Flood susceptibility analysis through remote sensing, GIS and frequency ratio model. Appl. Water Sci. 2018, 8, 66. [Google Scholar] [CrossRef] [Green Version]
  71. Kazakis, N.; Voudouris, K.S. Groundwater vulnerability and pollution risk assessment of porous aquifers to nitrate: Modifying the DRASTIC method using quantitative parameters. J. Hydrol. 2015, 525, 13–25. [Google Scholar] [CrossRef]
Figure 1. Study area. (Base imagery sources: Esri, DigitalGlobe, GeoEye, i-cubed, USDA FSA, USGS, AEX, Getmapping, Aerogrid, IGN, IGP, swisstopo, and the GIS User Community).
Remotesensing 15 01102 g001
Figure 2. Thematic layers: (a) Elevation, (b) Aspect, (c) Slope, (d) Topographic Roughness Index, (e) Topographic Wetness Index, (f) Stream Power Index.
Remotesensing 15 01102 g002aRemotesensing 15 01102 g002b
Figure 3. Thematic layers: (a) Sediment Transport Index, (b) Land use land cover, (c) Distance from river, (d) Soil, (e) Lithology [41], (f) Rainfall.
Remotesensing 15 01102 g003aRemotesensing 15 01102 g003b
Figure 4. Workflow of AHP methodology to prepare flood susceptibility map for part of Duhok district.
Remotesensing 15 01102 g004
Figure 5. Final flood susceptibility map (FHIS).
Remotesensing 15 01102 g005
Figure 6. Consequences of the flood on Duhok city [68].
Remotesensing 15 01102 g006
Figure 7. Flood Susceptibility Map with historic flood location. (Base imagery sources: Esri, DigitalGlobe, GeoEye, i-cubed, USDA FSA, USGS, AEX, Getmapping, Aerogrid, IGN, IGP, swisstopo, and the GIS User Community).
Remotesensing 15 01102 g007
Table 1. Data descriptions.
Data TypeDescriptionSource
DEMShuttle Radar Topography Mission (SRTM) (30 m)http://dwtkns.com/srtm30m/ (accessed on 17 September 2022)
Satellite imagerySentinel-2A MSIL2A-20220718T075621-N0400-R035-T38SLF (10, 20, and 60 m)https://scihub.copernicus.eu/ (accessed on 22 September 2022)
Soil dataSoil map of IraqFood and Agriculture Organization of the United Nations (FAO)
Lithology dataGeology map of Iraq[41]
Rainfall dataThe average annual rainfallMinistry of Agriculture and Water Resources of the Kurdistan Regional Government
Historical flooded areasHistorical flood records are needed for results validation.Duhok Sewerage Directorate
Table 2. Each parameter’s comparison matrix and relative score.
ParametersElevationSlopeDistance from RiverRainfallLULCSoilLithologyTRITWIAspectSTISPI
Elevation1.0002.0002.0003.0004.0004.0005.0005.0006.0007.0008.0008.000
Slope0.5001.0001.0003.0004.0004.0005.0005.0006.0007.0008.0008.000
Distance from River0.5001.0001.0003.0004.0004.0005.0005.0006.0007.0008.0008.000
Rainfall0.3330.3330.3331.0004.0004.0005.0005.0006.0007.0008.0008.000
LULC0.2500.2500.2500.2501.0001.0005.0005.0006.0007.0008.0008.000
Soil0.2500.2500.2500.2501.0001.0005.0005.0006.0007.0008.0008.000
Lithology0.2000.2000.2000.2000.2000.2001.0001.0002.0002.0008.0008.000
TRI0.2000.2000.2000.2000.2000.2001.0001.0002.0002.0007.0008.000
TWI0.1670.1670.1670.1670.1670.1670.5000.5001.0002.0003.0003.000
Aspect0.1430.1430.1430.1430.1430.1430.5000.5000.5001.0002.0002.000
STI0.1250.1250.1250.1250.1250.1250.1250.1430.3330.5001.0001.000
SPI0.1250.1250.1250.1250.1250.1250.1250.1250.3330.5001.0001.000
Table 3. Sub criteria of each parameter and their weights.
Flood Causative CriterionUnitClassSusceptibility Class Ranges and RatingsSusceptibility Class RatingsWeight (%)Overall
Elevationm334–478Very High520.75103.75
478–594High483
594–727Moderate362.25
727–885Low241.50
885–1212Very low120.75
Slope%0–11.04Very High517.4187.05
11.04–25.78High469.64
25.78–43.45Moderate352.23
43.45–67.02Low234.82
67.02–187.82Very low117.41
Distance from Riverm0–75Very High517.4187.05
75–150High469.64
150–250 Moderate352.23
250–500Low234.82
> 500Very low117.41
Rainfallmm/year430–464Very low113.4613.56
464–491Low226.92
491–520Moderate340.38
520–553High453.84
553–604Very High567.30
LULCclassBuilt-up areaVery High58.5742.85
Bare landHigh434.28
AgricultureModerate325.71
Forest and VegetationLow217.14
SoilclassBrown soils, deep phaseVery High58.5742.85
Rough broken and Stoney landHigh434.28
Deeply eroded phaseHigh434.28
LithologyclassConglomerateLow23.787.56
Carbonates and PhosphoriteLow27.56
CarbonatesModerate311.34
ClasticsHigh415.12
Marl limestone and gypsumVery High518.90
TRIlevel0.11–0.44Very High53.7018.5
0.44–0.52High414.80
0.52–0.89Moderate311.10
TWIlevel2.86–5.74Very low12.292.29
5.74–7.24Low24.58
7.24–9.36Moderate36.87
9.36–12.76High49.16
12.76–22.23Very High511.45
AspectdirectionFlatVery low11.741.74
NorthVery low11.74
NortheastLow23.48
EastLow23.48
SoutheastModerate35.22
SouthModerate35.22
SouthwestHigh46.96
WestHigh46.96
NorthwestVery High58.70
NorthVery High58.70
STI 0–0.1High41.164.64
0.1–1Moderate33.48
> 1Low22.32
SPI 9746–828487Very High51.165.80
0–9746High44.64
0Moderate33.48
Table 4. Effective weights-sensitivity analysis statistics.
ParametersMinMax Mean   ( μ ) SD   ( σ )
Elevation6.3837.4221.405.96
Slope 4.6036.4211.325.85
Distance from River5.4636.4122.103.92
Rainfall3.0432.549.515.60
LULC3.9721.969.002.79
Soil7.6522.1512.151.85
Lithology1.719.974.601.11
TRI2.4710.464.811.26
TWI0.514.431.400.58
Aspect0.394.981.840.67
STI02.2660.550.58
SPI0.782.811.320.31
Disclaimer/Publisher’s Note: The statements, opinions and data contained in all publications are solely those of the individual author(s) and contributor(s) and not of MDPI and/or the editor(s). MDPI and/or the editor(s) disclaim responsibility for any injury to people or property resulting from any ideas, methods, instructions or products referred to in the content.

