Abstract
In recent decades, in the Pre-Carpathian region of Ukraine during the summer period, floods and flood events became more frequent. They were accompanied by significant economic and environmental loss. Especially powerful were the floods of 2008 and 2020, but the floods in 2014 and 2016 also had destructive consequences. Therefore, the study of river channel processes, river stability and assessment of flooded land areas due to floods is an urgent problem. The aim of the study is to propose a methodology for hydrological modeling of sections of riverbeds with complex morphometric and hydrological characteristics. The construction of a digital elevation model (DEM) and the selection of the distance between the cross-sections, as well as the determination of the Manning coefficients, have the greatest impact on the accuracy of the modeling, so these factors should be given maximum weight when calibrating the model. The object of the study was the section of the Dniester River in Ukraine in the place of transition from the foothill part of the channel to the hilly–marshy part with complex meandering and significant shifts of the river. The methodology of hydrological modeling includes three principal components: construction of the DEM, determination of the type of underlying surface and determination of the level of water rise in the riverbed. The research was carried out on the basis of imaging from unmanned aerial vehicles (UAVs). In 2017, the imaging of a section of the Dniester riverbed was carried out in the summer during a period of significant vegetation growth, which affected the accuracy of determining the heights of the model points. According to the results of this imaging, the residual mean square (RMS) for determining the heights of the points exceeded the permissible value of the RMS (0.25–0.3 m) by two times. In 2021, imaging was performed in the autumn period when there was no leaf cover. The RMS of the DEM for 2021 imaging was 0.26 m. According to the results of the survey in 2017 and 2021, orthophotoplans were created, which were used to determine the planned displacements of the river bed and clarify the Manning coefficients, which characterize the roughness of the underlying surface. The value of the water level rise was obtained on the basis of the graph on the date of the maximum rise of the water level on 24 June 2020 according to the hydrometeorological station located near the selected area. The result of the research is hydrological modeling using the HEC-RAS module for a site with complex hydrological and morphometric characteristics on the date of the maximum water rise. It was established that in order to achieve the required accuracy of the DEM, imaging should be carried out in the leafless period of the year, since the accuracy of constructing the DEM decreases by half during the growing season. On the basis of the obtained orthophoto plans, a methodology for determining refined Manning coefficients was developed, which allows taking into account changes in the underlying surface of the channel area. The area of the flooded area was calculated based on the level of water rise during the 2020 flood.
1. Introduction
Due to the insufficient study of channel processes, in particular due to the lack of data on the morphodynamic characteristics of river channels and their geological and hydrological features, there have been cases of destruction of hydraulic engineering facilities, accidents of various structures and communications related to river crossings, and losses due to flooded and submerged agricultural land and settlements. This study relates to the consideration of methods of determining the areas of flooded lands due to floods, which in the Carpathian region of Ukraine occur quite often. In recent decades, powerful flooding occurred in 2008 and 2020 as well as 2014 and 2016, when it was a little smaller. In Ukraine, in modern terms, when it comes to the question of the additional research of rivers, taking into account hydrological and morphological analysis and assessment of the intensity of channel reformation, the modeling of flooded and waterlogged lands that will help in anticipating and reducing risks and significant economic losses, as well as informing the population about events related to emergencies, is especially important.
Determining changes in river channels and their monitoring, flood management and the study of threats and economic and environmental loss in order to minimize them are relevant problems. Not only do the above examples support this, but this is also evident from the number of government and administrative directives and recommendations adopted in different countries, as well as numerous research papers [1,2,3].
In 2000, the EU Water Framework Directive was adopted, which defines the main principles of water resource management and ways to achieve good water quality and safe status of rivers and reservoirs. One of the main principles set out in the EU Water Framework Directive is the integrated water resource management model that implies the joint action of all riparian states. Directive No. 2007/60/EC [4] of the European Parliament, the Council on Risk Assessment and Management and the Flood Risk Assessment and Management Action Plan aims to reduce the negative impact of floods on human health, the environment, cultural heritage and economic activity [5].
The plan for flood protection of the Danube River is being developed by the expert group on flood protection of the International Commission for the Protection of the Danube River. In Poland, the ISOK project “Program system of protection of the country from extreme threats” [6] was developed, aimed at creating a system that will improve the protection of the economy, the environment and society from extreme threats, in particular floods and flooding.
Such observations are based on the use of remote sensing and GIS technologies, which make it possible to regularly monitor the state of territories, as well as provide an overview, repeatability through standardized procedures and high efficiency in obtaining and processing information. Additionally, the use of satellite data and GIS technologies opens up new opportunities for obtaining operational forecasts of possible flooding zones, preliminary evaluation of flooding scales, modeling of geographical objects, determination of the most optimal places for location of protective structures and control of riparian territories [7,8,9].
However, for sites with complex hydrological and morphometric riverbed characteristics, a more detailed approach is needed. Methods are necessary for organizing the monitoring of river channel shifts and the study of the processes of meandering, which is associated with changes in water protection zones, as well as the delineation of flooded lands. In the last decades, geoinformation systems became more powerful in hydrological analysis, and more recently, UAVs opened up new possibilities for monitoring. Consequently, this study is motivated by the need to (i) examine and adapt these special modules in GIS for their use in hydrological modeling, (ii) establish the proper application of UAV data to clarify Manning coefficients, and iii) design procedures for DEM derivation for hydrological analysis.
Specifically, the aim of the study is to:
- Propose a methodology of hydrological modeling of sections of riverbeds with complex morphometric and hydrological characteristics,
- Perform a UAV survey of the selected area and determine the accuracy of the digital elevation model for different survey periods, e.g., related to different states of vegetation;
- Fit the HEC RAS module of ArcGIS with calibrated model parameters for hydrological modeling of flooded areas for channels with complex hydrologic and morphometric characteristics;
- Determine the values of channel displacements over a long period of time;
- Propose an expression for determining the refined Manning coefficients on the basis of the determined horizontal displacements of the river and type of bedding surface;
- Evaluate areas of flooded lands for different levels of water rise.
The overall motivation for this work is that the study of channel processes guides the application of measures that prevent catastrophic situations and avoid significant economic loss.
In complex river channel sections and free meandering, which leads to channel shifts, first of all, it is necessary to determine all deformations of the river. The study of channel processes is of great importance for solving the problems put forward by numerous requests of practice, in particular in the field of hydraulic engineering, providing protection of channel lands and reduction of losses from the action of natural cataclysms [10].
Hydrological modeling of flooded areas is complicated by the action of the hydromorphological process as a determining factor that affects the horizontal displacement of the alluvial river channel within the floodplain. The special literature [1,11,12,13] is based on the generalization of channel forms and formations and the determination of their movement rates in order to develop predictions related to channel processes. It is noted that the hydromorphological process significantly depends on changes in the general morphometry of the relief and changes in its character.
As noted in [14,15], channel processes depend on natural and anthropogenic factors, as well as physical conditions and the environment, which characterizes the watershed landscape. It is emphasized that the study of channel processes stimulates the use of measures that prevent catastrophic damage and avoid significant economic losses.
Attention is drawn to natural meandering rivers, which are located in large fertile valleys, the most valuable areas for agriculture and human settlements, which are often subject to demographic and economic pressures [16,17].
An important area of application of the theory of channel processes is related to agriculture, since the richest grasslands are located on river floodplains; river activities need to be considered when designing reclamation projects. The design of works on the regulation of channels, various construction on the banks and in river channels should be justified by forecasts of channel shifts, relying on knowledge of conditions and regularities of formation of river channels. Permanent changes in the configuration of channels most often occur with rapidly eroding soils on complex morphometric landforms.
The last decades in Ukraine were marked by a sharp increase in catastrophic floods and related social and economic losses. The caused damage was to a certain extent a consequence of natural phenomena, as well as the imbalance of the territorial natural resource system of the regions. While the state-of-the-art summary demonstrates that meandering rivers pose special challenges, none of these works provide a comprehensive methodology for handling their variability through time and providing results for flood land determination.
In order to model land flooding, which requires the use of heterogeneous geospatial data and high-precision devices, data from unmanned aerial vehicles (UAVs) have been used in recent years in addition to satellite images. The accuracy of determining the coordinates of points and features of the UAV data acquisition is considered in [18,19].
Villanueva et al. [20] and Ruiz et al. [2] indicate that when using UAVs, it is necessary to consider significant changes in the photo heights and tilt angles of the images. Therefore, it is necessary to acquire imagery with significant longitudinal and lateral overlap. The peculiarities of using UAVs for constructing high-precision DEM in urban built-up areas are considered in [21].
UAV imagery is an alternative to laser scanning, which is a standard method for obtaining flood plain elevations. Laser scanning is carried out from much higher altitudes using laser imaging systems, most often installed on aircraft, or special laser systems installed on powerful UAVs. A comparison between laser scanning and photogrammetric imaging for the generation of terrain models in given in [22]. Determination of the ground surface under vegetation is more accurate with laser scanning than with images.
The authors [23] investigated the hypothesis that by integrating remote sensing data, field studies and software such as HEC-RAS, flooding area and allowable construction limits can be determined, as well as criteria for flood zoning and flood insurance. In [24], it is indicated that the inappropriate setting of the distance between the transverse profiles that characterize the DEM gives an error in determining the areas of flooded land up to 5%, and the inaccurate setting of the Manning coefficients gives an error up to 2.6–2.7%
In paper [25], methods are elaborated for stabilizing simulated portions of a regulated river system during low flows. They are assembled into logical flowcharts that can provide general assistance to modelers in stabilizing simulations using HEC-RAS for regulated river systems. A study [26] found the mapping of the degree of flooding in the Rio Doscedros urban area using the HEC-RAS hydrodynamic–mathematical model supported by GIS. This study demonstrates the potential of using HEC-RAS GIS with very sparse data for mapping flood-prone areas.
The issues of the use of geospatial data for areas with complicated hydrological characteristics and the accuracy of the construction of the DEM, as well as changes in the channel areas for the clarification of the Manning coefficients, remain unexplored. This is the task of this article. For areas with complicated meandering, it is necessary to build DEMs with higher accuracy and determine changes in the subsoil surface of the near-channel area. Such data are fundamental in hydrological modeling.
2. Materials and Methods
2.1. Area of Study
Dniester is the second largest river in Ukraine. Its length is 1362 km; within Ukraine, it is 912 km (67%). The catchment area of the basin is 72,900 km2, of which 73% is within Ukraine. The river flows into the Dniester estuary. The Dniester basin is located in three countries: Poland, Ukraine and Moldova, but most of it is in Ukraine. A small part of the basin is located on the northwestern edge of Poland. In Moldova, the Dniester basin occupies more than half of the country’s territory, covering its eastern and northeastern regions [5].
The basin occupies the southwestern part of Ukraine. The catchment area is 9% of the total territory of Ukraine. The average slope is 56 cm/km. The length of the Dniester basin is about 700 km and the average width is about 100 km. From the west, the Dniester is bounded by the Carpathians, from the northwest—the Sano-Dniester watershed, from the north—Roztochchi, from the southeast—the Dniester-Buzka, and from the west—the Dniester-Prut and Dniester-Black Sea watersheds. The Dniester basin is dominated by small rivers up to 10 km long, with a total number of over 14,000. According to the feeding conditions, water regime and physical and geographical features, the Dniester River is usually divided into three parts—the mountainous Carpathian, the middle Podil and the flat Black Sea. This division takes into account only the generalized characteristics of the river. In each of the parts, there are sections.
Below the mouth of the Bystrytsia River, the right tributary of the Dniester, begins a very interesting and picturesque part of the river—the Dniester Canyon. Here, the banks are very high, steep and sometimes precipitous. The river meanders a lot; some of its bends stretch even for 10 km. On the section between the cities of Halych and Khotyn, the river flows into the Dniester Canyon, which is one of the most picturesque natural wonders of Ukraine. It was formed more than 1000 years ago due to the movement of tectonic plates. The Dniester Canyon is included in the list of objects protected by the Emerald Network of Europe in accordance with the Berne Convention. In places, high rocky shores resemble mountain ranges. Layers of limestone, shale and sandstone come to the surface. Numerous rocks and outcrops are natural monuments. Further on, dense limestones and sandstones come to the surface in a deep, narrow valley, and in the area of the city of Kam’ yanets-Podilskyi, crystalline rocks are observed, in particular granites, forming steep slopes. The Dniester is fed by rain and meltwater and has a characteristic flood regime. In terms of water content, the average flow of the Dniester per year is 8.4 billion m3 (consumption 274 m3/s). The main part of the formation of the Dniester flow is the upper part of the basin (20.4 thousand km2, 28% of the entire catchment area), whose watercourses are characterized by a flood regime throughout the year.
The right-bank tributaries of the Dniester, which predominate in the formation of the water level of the river, belong to rivers of mixed nutrition with a predominance of rain. Significant fluctuations in winter and summer precipitation cause a kind of unstable hydrological regime. The average annual water consumption is 330 m3/s, and the hydrological regime is unstable. The spring flood begins on the Dniester in February and ends in June. On average, the water level in the river rises by 3–4 m. The flow rate reaches significant values: 10–15 L/s per 1 km2 in the tributary of the highlands, in mid-mountain areas on average 5 L/s per 1 km2, and it varies from 2.7–6.5 L/s with 1 km2 on the left bank to 10.0–35.5 L/s with 1 km2 on the right bank.
The ecological problems of this densely populated part of Ukraine are related to the irreversible withdrawal of water for the life of the region, water supply of settlements, industry and agricultural production. Additionally, on the other hand, are the catastrophic regional floods that occur in the Carpathian and Pre-Carpathian regions every 2–3 years that lead to significant material losses and social tension. Deforestation on the slopes of the Carpathians is a significant problem affecting the water level in the channel [27].
2.2. Hydrological Modeling
The methodology of hydrological modeling of flooded lands requires beforehand three technologically connected parts: creation of a high-precision DEM, determination of the type of underlying surface and Manning coefficients, and determination of water discharge. These data serve as the basis for hydrological modeling. The first element of the actual hydrological modeling is the model selection [15,28]. In the one-dimensional model, the morphometric characteristics of the flow are averaged over width and depth and considered along the X-axis. Given the insignificant width of the Dniester River channel (up to 20 m), a one-dimensional model of steady-state water flow using Manning’s equations, which are solved by numerical methods in the HEC-RAS module, was used. The main calibration parameter of the model is the roughness coefficient of the channel and channel bed area. Manning’s equations indicate the dependence of flow velocity on the shape and size of the cross section and the roughness of the channel walls. The structural scheme of the processes is shown in Figure 1.
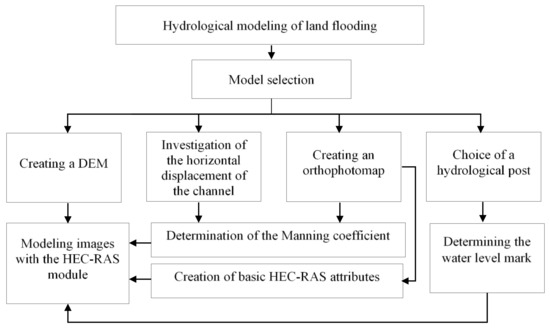
Figure 1.
The structural scheme of hydrological modeling.
From a procedural point of view, hydrological modeling requires the following steps to be executed first:
- Preparation work, including selection of the study site, a priori calculation of accuracy of determining the coordinates of points, calculation of parameters of flight and survey work;
- Field work, including determination of coordinates of ground control points and test points, measurements of riverbed depths and marking of points if necessary;
- UAV survey carried out in accordance with the calculated parameters;
- Photogrammetric work on the creation of orthophoto maps, the creation of a DEM and the determination of the elevation of water in the river channel.
In sequence, the hydrological modeling itself consists of:
- Determination of horizontal displacements of the river. This is based on the processing of cartometric materials and satellite images. This processing is executed in the geoinformation system ArcGIS;
- Determination of roughness as the Manning coefficient to account for the influence of bedrock rusticity on the flooding process. This is based on the distribution of soil and land cover in the river cross sections;
- Determination of water level changes based on the graph derived from observations at hydrometeorological stations;
- Final modeling to determine the flood land area. In our approach, this is performed using the special module HEC RAS.
Monitoring of river channel processes and, most importantly, determination of the horizontal and vertical displacements of the river should be carried out after catastrophic floods, since they can change the type of channel and be accompanied by significant erosion and deformation processes of both the river itself and the territory of its basin.
In specific areas, monitoring of the river bed should be performed every year, independent of large floods. This applies to areas with anthropogenic changes, e.g., next to urbanized areas, because building material (stones, gravel and sand) is constantly extracted.
2.3. A Priori Estimation of the Accuracy of UAV Point Accuracy
The error of determining the planned coordinates , of the terrain points was calculated according to the Formula (1) [29]:
where are the pixel size for discrete imaging systems, is the principal distance and H is the photographing height. An object height can be estimated (under the assumption of an exact stereo configuration) using the following equation:
with base length as the distance between projection centers and Δp as the difference of longitudinal parallaxes,
where p is the longitudinal parallax
xl is the coordinate of the point in the left image and xr is the coordinate of the point in the right image.
The RMS of parallax is determined by the following Equation (5):
where is the RMS of the definition of the plan coordinates. The RMS of the parallax difference is calculated by Formula (6)
The basis is calculated according to Formula (7):
Here, o is the overlap in percent. This finally allows us to compute the accuracy in elevation by using Equation (2) and inserting the RMS of the parallax difference, thus leading to Equation (8), the classic Brokk formula for determining excesses:
2.4. Surface Parameterization and Manning’s M
The Manning coefficient describes resistance to the flow of water. It is very sensitive to changes in the underlying surface. Often the dominant surface type for a profile is taken as representative for the cross section and the corresponding coefficient is applied. In most works, Manning’s Equation (9) is used to model indirect steady uniform flow [30]:
where μ is the conversion factor in units of measurement (1.49 in English units and 1.0 in CI units), V is the flow velocity, n is the Manning roughness coefficient, R is the hydraulic radius, and Se is the energy slope of the channel.
Figure 2 shows profile lines with different underlying surface types, which are not actually taken into account in this form of modeling. In a scientific publication [31], it is indicated that the inaccurate setting of Manning’s coefficients in hydrological modeling can reduce the accuracy of the modeling by 2.6–2.8 percent in relation to the determination of the flooded area. Therefore, it is proposed to calculate refined Manning coefficients for riverbed sections with complex hydrologic and morphometric characteristics, considering changes in the substratum along the profile (for example, sand, grass, bushes). Today, Manning’s coefficients are considered integrally, choosing from the table of coefficients one value for the type of surface that dominates the profile line: minimum, maximum or average (and, for example, sand) depending on the size of individual elements, their density and other indicators. We developed a method of refined consideration of Manning coefficients depending on the type of subsoil surface along the profile line.
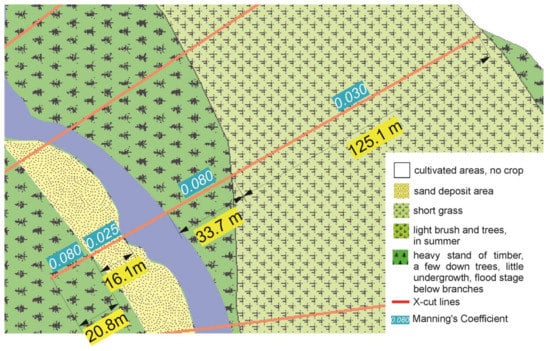
Figure 2.
Distribution of the underlying surface type along the profile.
To calculate the Manning coefficients, the author Halochkin proposes the following formula:
where M is the refined Manning coefficient, m is the Manning coefficient for part of the underlying surface [], and l is the length of the underlying surface along part of the profile line.
2.5. Case Study Site
The study of channel processes of the Dniester River presented in [10] indicates the complex nature of the modeling object. The monitoring of horizontal displacements of the Dniester River channel within the study area was conducted over a 77-year period. The following materials were used for this purpose:
- -
- Space images from the following satellites: Landsat 5 (1992), Landsat 7 (2003), Landsat 8 (2014) [https://earthexplorer.usgs.gov, accessed on 15 January 2015]; topographic maps of scales of 1:100,000 (1937, 1989) [http://freemap.com.ua/karty-ukrainy, accessed on 20 January 2015]; special maps: geological maps of scale 1:200,000 (1963); soil maps of scale 1: 200,000 (1967).
The structural scheme of river channel process monitoring research included the creation of composite images, application of pan-sharpening techniques, map linking, vectorization of river channels on images from different years, and measurement of river channel displacements. It is discussed in detail in [10].
Two sites with maximum horizontal displacements of the channel are selected in Figure 3 and presented in Table 1. The displacement of the riverbed was studied in order to show the instability of the riverbed.
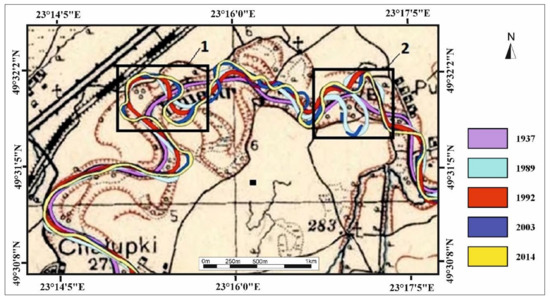
Figure 3.
Digitized beds of the Dniester River for different years (from 1937 to 2014), [10].

Table 1.
Maximum horizontal displacement of the Dniester River channel over a 77-year period.
While the analysis of displacements of the Dniester River from 1937 to 2014 was carried out on the section of the river channel at a length of 100 km, the main attention was paid to the section with the most tortuous channel, and thus the most significant displacements. The maximum displacements on sites 1 and 2 are: on the first site from 1937 to 1989—230 m; on the second site from 1989 to 1992—420 m.
This area is characterized by a branched system of ravines and gullies. General morphometric characteristics of the Dniester River section are presented in Table 2.
Table 2.
General morphometric characteristics of the Dniester River section.
The character of the channel banks at the study site is presented in Figure 4. In this location the river has rather steep banks; the left bank is especially steep, with the difference of marks between the bottom and the bank being up to 7 m.
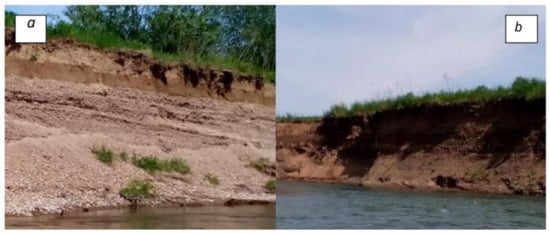
Figure 4.
General view of the banks of the Dniester River near Sambir: (a) left bank, (b) right bank.
The main causes of channel behavior are climatic, physiographic and anthropogenic factors, such as frequent flooding, weakly resistant rocks and soils, deforestation, and the removal of gravel and sand materials from river channels.
Economic activity in the Dniester basins in recent decades has significantly increased the influence of these natural factors, which has increased the severity of floods and the scale of the damage caused. The formation of such high floods, which occur in the Carpathian region, in addition to purely morphometric and meteorological factors, is also affected by a number of anthropogenic factors, in particular the damming of river channels, which changes the conditions of water flow and the state of economic activity on the slopes of river valleys. One of the main reasons for the intensification of natural disasters in the Carpathian region is uncontrolled deforestation, particularly during the second half of the 20th and early 21st centuries, when more than 100,000 hectares of forest were destroyed.
It is noted that site 1 is an area for which yearly displacement of the river bed is suggested, because stone, gravel and sand are constantly extracted from the river to carry out construction.
For hydrological modeling to determine the area inundated as a result of the flood in June 2020, a site was selected on the right bank of the river along a channel with a length of about 7 km (measurement along the channel) from the village of Khalupki to the end of the first section of the river. UAV surveying was performed in this area (Figure 5). The area of UAV surveying covered about 3 square kilometers. The hydrometeorological station, which was used to determine the water level, was located in the city of Sambir at a distance of 3 km from the village of Khalupki.
3. Results
The technological scheme included field work, UAV survey, creation of orthophotos to determine the shifts of the river bed and the creation of a DEM to determine the zones of flooded land. Among the main input data for hydrological modeling were data of DEM representation in the form of cross-sections; data on the bedding of the channel and coastal territory in the form of Manning coefficients; and data on water level rise due to heavy precipitation for a certain time, which was obtained from the hydrograph.
3.1. UAV Image Acquisition and Aerial Triangulation
The acquisition of UAV images started from a formulation of the requirements. Here, it was necessary to formulate the accuracy of determining the heights of terrain points. According to the requirements [19] for forecasting flood zones for rivers 50–200 m wide, topographic plans were drawn at a scale of 1:2000–1:5000 with a contour line interval of 0.5–1.0 m. For these scales, the mean square errors of height marks should be within 1/3 of the relief section, that is, the mean square error of determining the marks for predicting flooded areas should be within 0.16–0.30 m.
The results of a posteriori accuracy of determining the terrain elevations are expressed as function of the height (see Section 2.3). The typical flying height for such surveys is from 100 m to 300 m and the accuracy in the range 0.10–0.30 m depending on the type of terrain.
In order to verify experimentally the possibility of applying the technology based on the UAV survey for land flooding forecasting, a study was conducted based on the survey of a 3 km2 area of the Dniester. To construct the DEM, the photogrammetric method of determining the plan and altitude coordinates of points was used.
In 2017, the aerial surveys were carried out using the Trimble UX5 UAV with a Sony NEX-5R camera, and in 2021, the UAV Abris Dg Arrow with a Sony QX1 camera. Technical characteristics of the UAV, digital cameras, and the basic parameters of the survey are presented in Table 3.
Table 3.
Trimble UX5 (Sony NEX-5R camera) and Abris DG arrow (Sony QX1 camera) specifications.
The accuracy in height was derived using Equation (8) with the difference-in-parallax accuracy of Equation (6). For this, an overlap of 80% (60%) was used in Equation (7) to compute the basis in the image, which was b1 = 3.18 mm, b2 = 9.56 mm. The overrun error determination at different values of the basis was thus mh1 = 0.31 m, mh2 = 0.21 m.
The accuracy of determining the planar coordinates of the model points according to the data of 2021 was calculated by the Equation (11):
Thus, depending on the survey baseline a priori accuracy of determining the coordinates, the elevation points were 0.31–0.21 m, and the accuracy of determining the planar coordinates was 4 cm for 2021 and 6 cm for 2017. This leads to the conclusion that the height of the survey of territories for the prediction of flooding should not exceed 200–300 m when using UAVs.
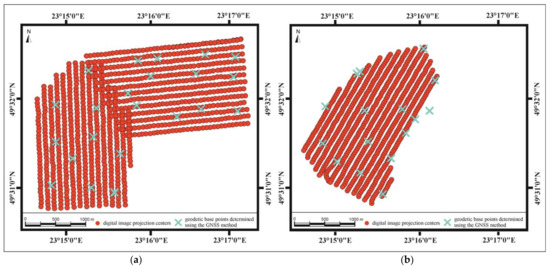
The coordinates of the ground geodetic base were determined using a Trimble R7 dual-frequency GNSS receiver via the RTK method using differential corrections from the “Geoterrace” network of active GNSS stations of National University “Lviv Polytechnic”. The nearest permanent GNSS station SAMB was in Sambir at a distance of 3 km from the object near the village of Khalupki. Accuracy of determination of the horizontal coordinates of the geodetic base was within 2–3 cm and the height component within 5 cm. A bundle block adjustment of the network was carried out in the program Pix4D [32]. The coordinates of the ground geodetic base were introduced as ground control points in the bundle adjustment for georeferencing.
Figure 5 shows the centers of projections and geodetic ground control points for the surveys for 2017 and 2021.
3.2. DTM and OP Generation
The digital terrain model with images of 2017 was processed with Terra Modeler and Terra Scan modules in order to eliminate errors of high vegetation (tall grass, bushes). However, the model correction due to high grass and dense bush vegetation was not completely possible, so the mean square error in the locations with such vegetation, determined using 44 test points, was 0.64 m [33].
Based on the results of digital image processing, the orthophotomaps of the site and DEM were built images reflecting the complex relief of the territory and the meandering character of the channel banks at the study site as well as the shape of basin area both for 2017 and 2021 (Figure 6). Figure 7 shows the digital elevation model created in 2021 with test points (blue circles) that were used for estimation accuracy of the created DEM. Coordinates of the referenced points are indicated in [33].
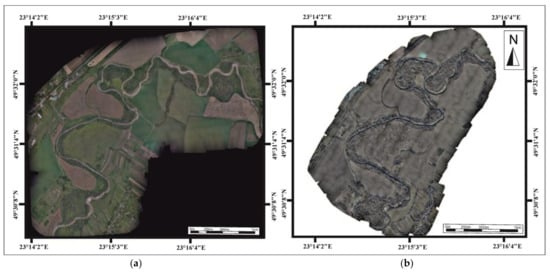
Figure 6.
Orthophotomaps of the Dniester section. Dniester River basin area acquired via UAV: (a) 2017; (b) 2021.
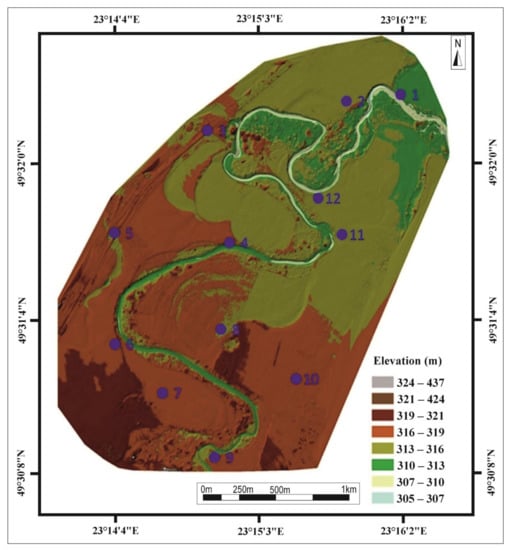
Figure 7.
Digital elevation model with test points (blue circles) created for the 2021 survey.
Orthophotoplans are used to determine the refined Manning coefficients, which characterize the influence of the subsoil surface of near-channel territories. According to the orthophotoplans, the displacement of the Dniester River bed for the period of 2017–2021 was established and the type of subsoil surface was determined. The complex character of displacements shows their variability within different locations, e.g., in 2021 the bigger displacements were observed in points 1–5, 6–7 and 9. In 2017, the sites 8, 10 and 11 had bigger displacements then those in 2021 (Figure 8). The displacements were significantly affected by soil texture, land cover types and anthropogenic influences.
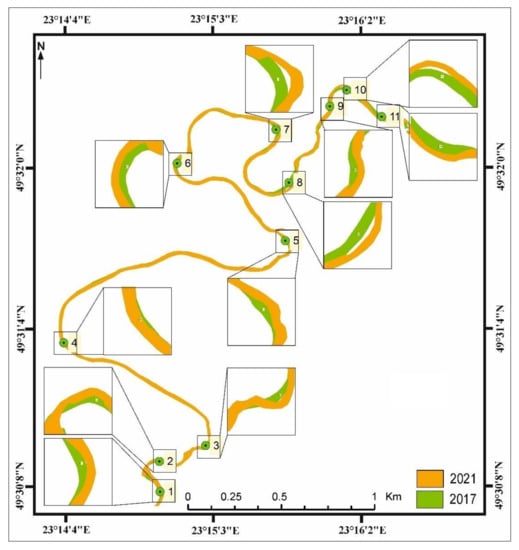
Figure 8.
Displacement of the Dniester section channels for 2017–2021.
As for the accuracy of determining the height of points, the experiments show that the accuracy of DEM construction depends on the underlying surface. For high grassy vegetation, the accuracy is compatible with the classic Brokk formula (above Equation (8), repeated here):
which holds with mΔp = 2Δ as the RMS for determining longitudinal parallax differences. If the test points are on the Earth’s surface (sand, stones, etc.), then to determine the accuracy of the excesses, we can use the value mΔp = Δ. The experiment conducted at the points with determining the RMS by geodetic coordinates confirms these conclusions.
The mean squared error was calculated according to expression (13):
where Δh is the difference of height marks and n is the number of test points.
The mean square error in determining the marks from the DEM compared to GNSS data for data (2017) for 44 sample test points with significant foliage cover was 0,64 m, and according to the data determined from the sample of 28 test points for the underlying surface of sand and low grass, it was 0.31 m. For 12 test points, located on clear contours, calculated based on a comparison of the corresponding elevations of test points obtained from GNSS observations and data from measurements of the constructed DEM (2021), RMS was 0.26 m [33]. These results indicate that the use of UAVs for predicting the flooding of territories is reliable for 1:5000 and 1:2000 scale maps with a relief section of 1 m. For a relief section of 0.5 m, it is obviously necessary to perform UAV imaging with selected cameras from a lower height.
3.3. Channel Displacement and Manning’s M
The orthophoto referencing and channel vectorization allowed us to determine channel displacement over the last 4 years, which, in turn, allowed us to more thoroughly assess the type of underlying surface (sand, grass, shrub vegetation, etc.), on which the Manning coefficients depend, as a fundamental element of modeling. Figure 8 shows a fragment of the bed with horizontal displacements and their shapes over a 4-year period with enlarged fragments at the points of maximum displacements.
The points for determining horizontal displacements were chosen in the places of twists in the riverbeds. The migration of the river affects the type of bedding surface, and the twists and turns of the riverbeds are characterized by the largest displacements.
Based on these data, an image of the underlying surface was created (Figure 9), where the maximum changes were noticed.
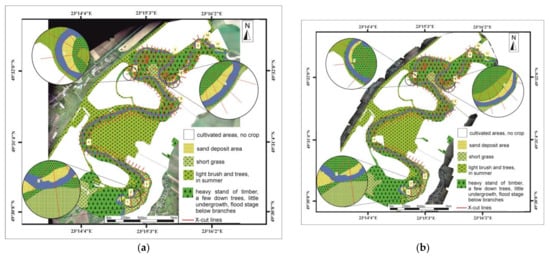
Figure 9.
Changes in the underlying surface by: (a) 2017, (b) 2021.
For example, at point 6, a decrease in the sandy surface was noted in the highlighted fragments. Similar changes were recorded at other points. Manning coefficients are very sensitive to changes in the underlying surface.
Table 4 shows the refined property coefficients, considering changes in the type of underlying surface on the corresponding profile lines (Equation (9)). Points with significant changes in Manning coefficients are highlighted bold.
Table 4.
Refined Manning coefficients.
3.4. Model Outputs
Hydrological modeling was carried out on the basis of a DEM, which was modelled in the form of transverse profile lines. To construct the DEM, we used the UAV imagery of the year 2021, conducted in the leafless period of the year in the month of November (Figure 9). Taking into account the complex morphometric characteristics of the channel, the distance between the profile lines representing the DEM for modeling, chosen on the basis of experimental studies, was 50 m.
For hydrological modeling, we used a one-dimensional model that considered the basic elements: the type of channel (the central line of the channel, bank lines, flow direction lines), terrain and channel (cross-section lines and measurements of river depths), and the hydrological regime of the channel (graph of water elevations, depending on meteorological conditions in a given calendar period).
The graph of the water level (daily estimates) which was directly obtained from the hydrometeorological station near Sambir, is shown in Figure 10.
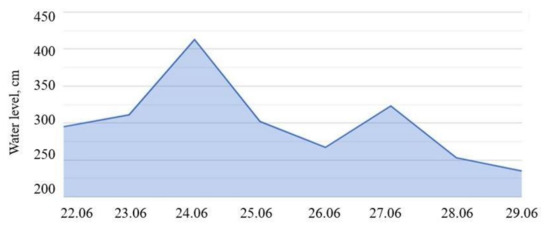
Figure 10.
Water level graph during the June 2020 flood.
The maximum mark of water elevation was about 4 m.
The simulation was carried out using a high-precision DEM obtained after processing images from the UAV. Compared with the presented modeling results in the special literature, significant attention was paid to the determination of the refined Manning coefficients. Figure 11 shows the simulation of flooded land for the water mark values of 2 and 4 m.
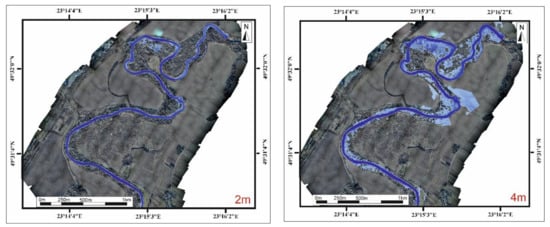
Figure 11.
Result of modeling flooded land according to different values of water level elevations.
The results of the simulation are shown in Table 5.
Table 5.
Results of hydrological modeling.
The area of flooded lands during the flood was 52.01 ha. As for the results of hydrological modeling, it can be stated that the definition of the flooded area is correct: firstly, the DEM was built with an accuracy of 0.26 m, which meets the requirements for this type of work; secondly, the refined Manning coefficients were determined based on the type of the bedding surface on each transverse profile, the distance between the transverse 50 m; thirdly, the mark of water rise at the time of the peak of the flood was 4 m on the date of 24 June 2020, and marks of up to 2 m are typical for smaller floods. Lastly, the depths on the middle line of the channel from the water surface to the bottom were determined as a result of field measurements on each transverse profile.
In the state regulatory documents, the territories with the risk of flooding should be considered when selecting water protection zones and river channels, and the size of such zones should be selected not only by type of the river, but also the type of underlying surface should be considered, as well as the hydrological and morphometric characteristics of the territory.
4. Conclusions
It is feasible to use the HEC-RAS automated module of the ArcGIS system to model the complex hydrological and morphometric characteristics of the Dniester River channel to determine the flooding zones of the riverbed area.
The complex nature of meandering and instability of this part of the channel is evidenced by the results of the study of horizontal displacements on various space and topographic materials on a 77-year period, which reach up to 370–420 m.
Considering the insignificant width of the river (20–25 m) in the study area, the one-dimensional model was chosen for modeling, on the theoretical basis of which the automated module HEC-RAS was created. The UAV survey was carried out in May 2017 during significant vegetation of janic grasses, as well as shrub and tree-like vegetation and in November 2021 during leafless cover of the terrain. According to the results of a posteriori assessment of the accuracy of the DEM, it was established that software methods using the Terra Modeler and Terra Scan modules cannot eliminate the influence of vegetation, as the mean square error was 0,64 m with a tolerance of 0.25–0.30 m.
Modeling was performed based on a DEM obtained from a UAV survey in November 2021 during leafless terrain cover. The mean square error of the model, calculated in the leafless period according to the results of 12 test point measurements, was 0.26 m.
We propose an elaborate method for determining the refined Manning coefficients considering changes in the underlying surfaces along the profile, which are calculated on the basis of orthophotomaps.
In summary, hydrological modeling was performed for the average water level, which according to the meteorological post was 2 m, and according to the count on the date of the flood peak on 24 June 2020 was 4 m.
Research perspectives. Because of the lack of study of the problem of flooding of lands near levees, selected narrow zones of protected land, plowing of floodplains leads to the washout of soils and the transformation of meadows into unproductive areas. These problems arise not only in Ukraine, but also in many European countries, such as the Netherlands, Italy and France [4,34]. Individual municipalities have planned settlements without coordinating these activities with the activity of the river channel, which has created significant future costs for flood control measures and emphasized the need and importance of considering the stability of the channel in the long term, as discussed in [5]. Further floodplain development leads to even higher flood levels. Therefore, a priority of the new land use policy is to establish maximum protection boundaries considering the future meandering of rivers.
Further improvements in hydrologic modeling are associated with a fuller consideration of the factors that affect it, the definition of flooding areas and allowable building boundaries, and criteria for flood zoning and flood insurance. The results of this and other studies indicate that by using heterogeneous geospatial data and modeling, flood zoning maps, periods of flood events and the effects of flooding on land use in floodplains can be determined.
Author Contributions
Conceptualization, K.B. and M.H.; Software, I.Z. and M.H.; Validation, I.Z. and M.H.; Formal analysis, K.B. and M.H.; Investigation, M.H.; Resources, K.B. and M.H.; Data curation, K.B., S.K., N.P. and M.H.; Writing—original draft, I.Z. and M.H.; Writing—review & editing, S.K. and Norbert Pfeifer; Visualization, S.K. and N.P.; Supervision, K.B. All authors have read and agreed to the published version of the manuscript.
Funding
This research received no external funding. Publication of this study is funded by TU Wien Bibliothek (TU Vienna Library) through its Open Access Funding Programme.
Data Availability Statement
Data is unavailable due to privacy and ethical restrictions.
Conflicts of Interest
The authors declare no conflict of interest.
References
- Hooke, J.M. Hydromorphological adjustment in meandering river systems and the role of flood events. In Proceedings of the Sediment Dynamics and the Hydromorphology of Fluvial Systems, a Symposium, Dundee, UK, 2–7 July 2006; IAHS Publication 306. pp. 127–135. [Google Scholar]
- Ruiz, J.J.; Diaz-Mas, L.; Perez, F.; Viguria, A. Evaluating the Accuracy of DEM Generation Algorithms from UAV. In Proceedings of the International Archives of the Photogrammetry, Remote Sensing and Spatial Information Sciences, Volume XL-1/W2, 2013UAV-g2013, Rostock, Germany, 4–6 September 2013. Available online: https://www.researchgate.net/publication/276020538_Evaluating_the_accuracy_of_DEM_generation_algorithms_from_UAV_imagery (accessed on 4 November 2022).
- Shevchuk, V.; Burshtynska, K.; Korolik, I.; Halochkin, M. Monitoring of horizontal displacements and changes of the riverine area of the Dniester River. J. Water Land Dev. 2021, 49, 1–15. [Google Scholar] [CrossRef]
- Directive 2000/60/EC of the European Parliament and of the Council Establishing a Framework for Community Action in the Field of Water Policy. Available online: https://eur-lex.europa.eu/legal-content/EN/TXT/HTML/?uri=CELEX:02000L0060-20141120&from=EN (accessed on 25 December 2022).
- Project OSCE/UNECE: Transboundary Cooperation and Sustainable Management of the Dniester River Basin, November 2015. Available online: https://www.osce.org/files/f/documents/d/6/104060.pdf (accessed on 25 December 2022).
- ISOK (Informatyczny System Osłony Kraju Przed Nadzwyczajnymi Zagrożeniami). Electronic Resource. Available online: https://www.gugik.gov.pl/projekty/isok (accessed on 25 December 2022).
- Kokhan, S.; Vostokov, A. Application of nanosatellites PlanetScope data to monitor crop growth. E3S Web Conf. 2020, 171, 02014. [Google Scholar] [CrossRef]
- Kokhan, S.; Dorozhynskyy, O.; Burshtynska, K.; Vostokov, A.; Drozdivskyi, O. Improved Approach to the Development of the Crop Monitoring System Based on the Use of Multi-Source Spatial Data. J. Ecol. Eng. 2020, 21, 108–114. [Google Scholar] [CrossRef]
- Stancalie, G.; Craciunescu, V.; Irimescu, A. Development of a downstream emergency response service for flood andrelated risks in Romania based on satellite data. In Proceedings of the E3S Web of Conferences 2016: 3rd European Conference on Flood Risk Management (FLOODrisk 2016), Lyon, France, 17–21 October 2016. [Google Scholar]
- Burshtynska, K.; Shevchuk, V.; Tretyak, S.; Vekliuk, V. Monitoring of the riverbeds of rivers Dniester and Tisza of the Carpathian region. In Proceedings of the XXIII ISPRS Congress, Commission VII, Prague, Czech Republic, 12–19 July 2016; Volume XLIB7, pp. 177–182. [Google Scholar] [CrossRef]
- Andreadakis, E.; Diakakis, M.; Vassilakis, E.; Deligiannakis, G.; Antoniadis, A.; Andriopoulos, P.; Spyrou, N.I.; Nikolopoulos, E.I. Unmanned Aerial Systems-Aided Post-Flood Peak Discharge Estimation in Ephemeral Streams. Remote Sens. 2020, 12, 4183. [Google Scholar] [CrossRef]
- Zambory, C.L.; Ellis, H.; Pierce, C.L.; Roe, K.J.; Weber, M.J.; Schilling, K.E.; Young, N.C. The Development of a GIS Methodology to Identify Oxbows and Former Stream Meanders from LiDAR-Derived Digital Elevation Models. Remote Sens. 2019, 11, 12. [Google Scholar] [CrossRef]
- Li, D.; Wu, B.; Chen, B.; Qin, C.; Wang, Y.; Zhang, Y.; Xue, Y. Open-Surface River Extraction Based on Sentinel-2 MSI Imagery and DEM Data: Case Study of the Upper Yellow River. Remote Sens. 2020, 12, 2737. [Google Scholar] [CrossRef]
- Korpak, J.; Krzemień, K.; Radecki-Pawlik, A. Wplyw czynników antropogenicznych na zmiany koryt cieków karpackich. In Infrastruktura i Ekologia Terenów Wiejskich, Monografia 4; PAN: Kraków, Poland, 2008; pp. 1–88. [Google Scholar]
- Zolezzi, G.; Luchi, R.; Tubino, M. Modelling morphodynamic processes in meandering rivers with spatial width variations. Rev. Geophys. 2012, 50, RG4005. [Google Scholar] [CrossRef]
- Rudko, H.I.; Petryshyn, V.I. Characteristics of boulder-gravel-sand deposits in Lviv region and their impact on the ecological state of the environment. Miner. Resour. Ukr. 2014, 1, 39–47. [Google Scholar]
- Samoilenko, L.I.; Kolos, M.; Pidhorodetska, L.V. Information technology of flood monitoring using remote sensing data. Space Sci. Technol. 2009, 15, 50–55. [Google Scholar]
- Sanz-Ablanedo, E.; Chandler, J.H.; Rodríguez-Pérez, J.R.; Ordóñez, C. Accuracy of Unmanned Aerial Vehicle (UAV) and SfM Photogrammetry Survey as a Function of the Number and Location of Ground Control Points Used. Remote Sens. 2018, 10, 1606. [Google Scholar] [CrossRef]
- Vovk, A.; Hlotov, V.; Hunina, A.; Malitskyi, A.; Tretyak, K.; Tserklevych, A. Analysis of the Results for the Creation of Orthophotoplans and Digital Relief Models Using TRIMBLE UX-5 UAV. In Geod. Cartogr. Aer. Photogr.; 2015; pp. 90–103. Available online: http://nbuv.gov.ua/UJRN/Geodez_2015_81_11 (accessed on 25 December 2022).
- Villanueva, J.; Blanco, A. Optimization of ground control point (GCP) configuration for unmanned aerial vehicle (UAV) survey using structure from motion (SFM). ISPRS—Int. Arch. Photogramm. Remote Sens. Spat. Inf. Sci. 2019, XLII-4/W12, 167–174. [Google Scholar] [CrossRef]
- Tokarczyk, P.; Leitao, J.; Rieckermann, J.; Schindler, K.; Blumensaat, F. High-quality observation of surface imperviousness for urban runoff modelling using UAV imagery, Hydrol. Earth Syst. Sci. 2015, 19, 4215–4228. [Google Scholar] [CrossRef]
- Ressl, C.; Brockmann, H.; Mandlburger, G.; Pfeifer, N. Dense Image Matching vs. Airborne Laser Scanning—Comparison of two methods for deriving terrain models. Photogramm. Fernerkund.-Geoinf. 2016, 57–73. [Google Scholar] [CrossRef]
- Khaleghi, S.; Mahmoodi, M.; Karimzadeh, S. Integrated application of HEC-RAS and GIS and RS for flood risk assessment in Lighvan Chai River. Int. J. Eng. Sci. Invent. 2015, 4, 38–45. Available online: https://www.researchgate.net/publication/308368287_Integrated_application_of_HEC-RAS_and_GIS_and_RS_for_flood_risk_assessment_in_Lighvan_Chai_River (accessed on 4 November 2022).
- Timbadiya, P.; Patel, P.; Porey, P. Calibration of HEC-RAS Model on Prediction of Flood for Lower Tapi River, India. J. Water Resour. Prot. 2011, 3, 805–811. [Google Scholar] [CrossRef]
- Sharkey, J.K. Investigating Instabilities with HEC-RAS Unsteady Flow Modeling for Regulated Rivers at Low Flow Stages. 2014. Available online: https://trace.tennessee.edu/cgi/viewcontent.cgi?referer=&httpsredir=1&article=4199&context=utk_gradthes (accessed on 25 December 2022).
- Silva, F.V.; Bonumá, N.B.; Uda, P.K. Flood mapping in urban area using HEC-RAS model supported by GIS. In Proceedings of the 6th International Conference on Flood Management (ICFM6’14), São Paulo, Brazil, 16–18 September 2014. [Google Scholar]
- Kovalchuk, I.P. Hydrological and geomorphological processes in the Carpathian region of Ukraine. Proc. Shevchenko Sci. Soc. Med. Sci. 2003, 12, 101–125. [Google Scholar]
- Burshtynska, K.; Babushka, A.; Halochkin, M. Hydrological processes modelling using GIS ARCGIS and module HEC-RAS. Geod. Cartogr. Aer. Photogr. 2020, 91, 28–40. [Google Scholar] [CrossRef]
- Dorozhynskyy, O.; Tukai, R. Photogrammetry: Manual 2008; National Technical University of Lviv “Lviv Polytechnic Institute”: Lviv, Ukraine, 2008; 332p. [Google Scholar]
- Chow, V. Open-Channel Hydraulics; McGraw-Hill: New York, NY, USA, 1959. [Google Scholar]
- Nikiforov, D.A. Calibration of hydraulic models of rivers and reservoirs. Influence of Adjusting Program Model Parameters on Accuracy hydraulic calculations. In Proceedings of the International Scientific and Practical Conferences: Modern Problems of Reservoirs and Their Watersheds, Water Resources Management, Hydro- and Geodynamic Processes; PREMIER Publishing: Prague, Czech Republic, 2013; Volume I Permian, pp. 253–260. [Google Scholar]
- Pix4D. Hands Free Solutions for Mapping and 3D Modeling. 2013. Available online: http://pix4d.com/ (accessed on 20 September 2022).
- Tretyak, S.K. Monitoring of Hydrographic Objects by Means of Remote Sensing of the Earth and Geo-Information Technologies: Dis. for the Degree of a Candidate of Technical Sciences: 05.24.01—Geodesy, Photogrammetry and Cartography; Ministry of Education and Science of Ukraine, Lviv Polytechnic National University: Lviv, Ukraine, 2019; 213p. [Google Scholar]
- National Water Plan 2016–2021, Government of Netherlands. Available online: https://www.government.nl/documents/policy-notes/2015/12/14/national-water-plan-2016-2021 (accessed on 25 December 2022).


Disclaimer/Publisher’s Note: The statements, opinions and data contained in all publications are solely those of the individual author(s) and contributor(s) and not of MDPI and/or the editor(s). MDPI and/or the editor(s) disclaim responsibility for any injury to people or property resulting from any ideas, methods, instructions or products referred to in the content. |
© 2023 by the authors. Licensee MDPI, Basel, Switzerland. This article is an open access article distributed under the terms and conditions of the Creative Commons Attribution (CC BY) license (https://creativecommons.org/licenses/by/4.0/).