Article

Investigating the Stability of the Hill of the Acropolis of Athens, Greece, Using Fuzzy Logic and Remote Sensing Techniques

by
Constantinos Loupasakis
1,
Paraskevas Tsangaratos
1,*,
Theodoros Gatsios
2,
Vasiliki Eleftheriou
3,
Issaak Parcharidis
2 and
Panteleimon Soupios
4
1
Laboratory of Engineering Geology and Hydrogeology, Department of Geological Sciences, School of Mining and Metallurgical Engineering, National Technical University of Athens, Zographou Campus, 15773 Athens, Greece
2
Department of Geography, School of Environment, Geography and Applied Economics, Harokopio University of Athens, 17671 Athens, Greece
3
Acropolis Restoration Service, Ministry of Culture and Sports, 10555 Athens, Greece
4
Geosciences Department, College of Petroleum Engineering and Geosciences, King Fahd University of Petroleum and Minerals, P.O. Box 5070, Dhahran 31261, Saudi Arabia
*
Author to whom correspondence should be addressed.
Remote Sens. 2023, 15(4), 1067; https://doi.org/10.3390/rs15041067
Submission received: 27 January 2023 / Revised: 10 February 2023 / Accepted: 12 February 2023 / Published: 15 February 2023
(This article belongs to the Section Remote Sensing in Geology, Geomorphology and Hydrology)

Abstract

:
The main objective of this study was to investigate the stability of the Acropolis Hill, Greece, by developing a Rock Instability Model (RIM) based on fuzzy logic and remote sensing techniques. RIM aimed to identify locations on the rock formations of the Acropolis Hill that will potentially have instability issues due to the action of geomorphological factors, weathering and erosive processes. Six factors including lithology, slope angle, density of discontinuities, density of faults, density of surface runoff elements, and the orientation of the stratigraphy of the geological formations in relation to the orientation of the slope were considered as the most appropriate for implementing the proposed novel approach, with each variable classified and weighted by a fuzzy simple additive weighting method. Lithology and slope angle were considered the most significant variables that contributed to the overall stability of the Acropolis Hill. The outcomes of the RIM model were verified by remote sensing data and field observation, showing an agreement and high accuracy. From the satellite data analysis, it was concluded that for the entire Acropolis Hill, minor displacement rates were recorded, probably because of the extensive mitigation measures and consolidation works established in the recent past. Overall, the study highlighted the ability of the proposed methodology to be used as an alternative investigation tool in rock instability-related assessments valuable to land use planning and development, helping reduce the anticipated losses in highly susceptible zones.

1. Introduction

According to the World Heritage Convention, the Acropolis of Athens is considered as the most striking and complete ancient Greek monumental complex still existing in our times (UNESCO World Heritage Centre—World Heritage List), an impressive and recognizable monument of exceptional archaeological, historical and touristic value [1]. Over the long history of Acropolis monuments and its hill, there have been many efforts to monitor and evaluate the response of the structures and monuments along with the surrounding rock formations to natural and manmade hazards [2,3,4,5,6]. Specifically, the Circuit Wall of the Acropolis of Athens has encountered, during the past years, several structural problems associated with the distortions of the load-bearing structure (complete or partial section failure, displacement, bending of the structure and extensive cracking), and the defects of the structural materials (cracking, fractures, weathering/erosion, matter decline, and mortar corrosion). In addition, the aging of the building materials has had a significant effect on the overall stability of the Circuit Wall since the 5th century BC, and the erosion phenomena, influenced by temperature changes, surface humidity, and pollutants, causes the progressive decrease in the mechanical strength of building materials [4,7]. The Acropolis Hill has encountered mainly erosion and rockfall phenomena. Several researchers have reported the action of limestone karstification that has created cavities that facilitate the water flow and accelerate erosion phenomena [4,8,9]. Rockfalls have also been described as a frequent phenomenon that occur due to the combination of several factors, including topographic features (slope angle), rock mass conditions, pore pressure increase, mainly related to rainfall infiltration and/or freeze–thaw cycles, and other climatic variables, seismic activity, and vegetation conditions [4,10]. Combinations of the above have created highly unstable areas and cause concern for their capacity to safely react to occasional loads, such as seismic events and heavy rainfall. In response to the described situation, during the last few years, systematic documentation of the monument and determination of required intervention occured, and several monitoring and maintenance systems have been installed. State-of-the-art technologies have already been implemented, concerning mainly the Circuit Wall and underlying rock formations, such as [11,12] the following: 3D scanning and photogrammetry for the geometric documentation of the monument and underlying rock [13,14], high-precision topographic measurements to monitor displacements, instrumentation with optical fibber sensors to monitor deformations from mechanical and thermal causes [15], installation of seismic accelerometer network to accurately determine the seismic motion and dynamic response of the entire monument, and finally the development of a digital platform for entering all restoration information into a unified database that can also handle spatial information.
Despite the existence of a well-documented hypothesis about the phenomena related to the rock instability issues concerning the Acropolis Hill, the knowledge about the exact mechanism that is responsible for the occurrence and the evolution of the phenomena is still not fully understood. In this direction, the use of advanced technologies and main methodologies characterized by their non-invasive nature such as advanced interferometry techniques with synthetic-aperture radar (SAR) satellite data and spatial models that consider geo-environmental factors to identify dangerous areas were further investigated. Under the project SCIENCE (Spaceborne SAR Interferometry as a non-invasive tool to assess the vulnerability over cultural heritage sites), which was funded by the European structural and investment funds and supervised by the General Secretariat for Research and Technology in the context of national action for bilateral cooperation between Greece–China, these two methodologies were tested. Main objectives were to identify and monitor potential ground deformation and areas of potential instability issues affecting the archaeological sites, monuments of great importance, the Acropolis Hill, and surrounding areas. For the first objective, two multitemporal SAR interferometric techniques were used as follows: A Persistent Scatterers Interferometry (PSI) approach based on the GAMMA/Interferometric Point Target Analysis (IPTA) processing scheme customized for monument scale monitoring and a heritage-monitoring-oriented Tomography-based Persistent Scatterers Interferometry (Tomo-PSInSAR), which integrates merits from PSInSAR and SAR tomography [16,17,18]. For the second objective, a fuzzy logic approach was implemented to weight geomorphological parameters that contribute to the instability of rock formations and to produce a Rock Instability Model (RIM) within a Geographic Information System (GIS). The developed RIM estimated a Rock Instability index that could be defined as the indicator that captures the probability of instability problems occurring within an area by assessing only the local conditions, ignoring the time parameter and any activation/triggering factors. The present study is about the second objective, providing the areas which are characterized by high predictive probability of potential rock instability issues, providing details concerning the methodology followed and a discussion concerning the results of the developed RIM. The outcomes of the first objective were used for validation reasons.
Concerning the methods used to assess mass movements and predict potential unstable areas, two major categories can be classified as follows: quantitative/data-driven models and qualitative/expert-driven models [19]. Data-driven methods refer to deterministic, probabilistic, or statistical approaches, which obtain information and knowledge from data on a statistical or probabilistic base, and include bivariate statistical analysis, multivariate methods, and machine learning methods [20,21,22]. Expert-driven models are characterized by the involvement of expert’s judgment on the observed phenomena. In this category, several methods have been used, such as Boolean overlay, empirical rating systems, analytic hierarchy process, fuzzy logic approach, fuzzy membership values assigned by expert and field knowledge, multi-class weighting methods and spatial multi-criteria analysis [23,24,25,26]. Comparing the models of the two categories, the expert-based models appear subjective and often ignore the fuzziness of expert judgment; additionally, the accuracy of the results depends significantly on the experience and time involvement of the expert. On the other hand, data-driven models are influenced by the availability and the quality of data, with data of poor quality producing less accurate predictive models.
In the case of the Acropolis Hill, the number of recorded rock instability and bedrock failures data does not allow the development of reliable and accurate data-driven model. The solution of using expert-driven models seems more appropriate; however, in this case, subjectivity may arise as an issue. Having this in mind, the development of the RIM was based on a fuzzy simple additive weighting (FSAW) technique [27] that captures the knowledge of a group of experts and tackles uncertainty and imprecision by representing experts’ judgment as fuzzy numbers. Six factors including lithology, slope angle, density of discontinuities, density of faults, density of surface runoff elements, and the stratigraphic orientation of geological formations in relation to the orientation of the slope were considered as the most appropriate to describe instability phenomena associated with the Acropolis Hill. The set of variables was selected by the authors based on previous studies which report the main parameters that influence instability issues and rockfalls concerning the specific settings of the research area, though the knowledge gained by the authors from reviewing international experience is also used [2,4,7,19,20,22,26]. Within this framework, the mapping of the relevant dependent variables required the application of specialized algorithms from the domain of photogrammetry and image analysis as well as spatial analysis and hydrological analysis. The density of discontinuities and the density of surface runoff elements, variables that characterize the rock mass and affect the occurrence of failure phenomena, are the two variables where those algorithms were applied for their production. Python, R packages, and ArcGIS 10.5 [28,29] were used for the analysis of the data and the production of the Rock Instability Index maps.

2. Study Area

2.1. General Settings

The Acropolis monument and the surrounding structures are situated on a limestone hill of average height (156 m) and dimensions, approximately 170 m by 350 m, that rises in the basin of Athens (Figure 1). The slopes are almost vertical or very steep with altering heights up to 25 m. Fill materials from old excavations have accumulated at the foot and in areas with gentle sloping. Discontinuities/fractures in the limestone are filled by weathering materials and soil materials that allow vegetation to grow. Both the material which fills the discontinuities and the vegetation developed within the discontinuities cause wedge-like effects resulting in the detachment and fall of rock. In addition, the rock is stressed by the Circuit Wall resting on it and by embankments and other constructions that are founded on the Acropolis plateau.

2.2. Geological-Hydrogeological Settings

The Acropolis Hill is geologically composed of limestone thrusted over the Athens Schist series, which includes a schist–sand–marly phase. Along the thrust surface, a horizon of breccia-conglomerate can be identified, generated from the thrust movements [4]. The schist formation was given its name because it covers a large part of the city of Athens. According to Marinos et al. [30], the Athens schist is a flyshoid phase of a delta-type deposit, which means that what we see today was once the talus of a vast river’s delta. The Athens schist is made up of a variety of low-grade metamorphic and relatively soft rocks. It exhibits exceptional weathering, as well as intense folding, shearing, and extensional faulting, completing the structural “downgrading” of the rock mass. The limestone appears highly fractured and strongly karstified, and is characterized as ranging from thick-bedded to massive, locally crystalline, grey to greyish in colour, with thickness not exceeding 40 m. The overall structural relief of Athens with the numerous limestone hills including the Acropolis can be attributed to the karstic erosion of an extended and thick limestone tectonic nappe, leaving the hills as tectonic klippes [4]. Furthermore, loose deposits, loose limestone fragments, and fine argillaceous material, cover the underlying rock formations on the slopes. Also, artificial earthfill can be identified on the upper surface of the Acropolis Hill, the thickness of which does not exceed a few meters. All geological formations appear folded into an anticline structure with a folding axis floating around the east–west direction, whereas major faults and joints follow two main directions, east–west, and north–south. Significant karstic caves and voids, which in most cases are filled with calcitic material, can also be identified throughout the entire Acropolis Hill [2]. A poor over-hanging aquifer is formed along the contact of the permeable limestone with the underlying impervious schist formations, which is regularly discharged through three very small springs (Klepsydra, north–west slope, Krini, south–east slope, and a small spring in the south slope) [4,31].

2.3. Seismicity-Tectonic Settings

The surrounding area of Acropolis is classified as a zone of low autochthonous seismicity. Hence, the recorded damages of the monuments (i.e., Parthenon, Propylaea, Erechtheion, and Temple of Athena Nike) due to seismic events are relatively weak, and originate mainly from earthquakes of greater epicentral distances [32,33]. Damages can be attributed to the earthquakes of 1705 in Athens (M ≈ 6.2), 1805 in Athens (M < 6), 1837 in Troezen (M ≈ 5.5), 1981 at Halcyon (M ≈ 6.7), and 1999 in Parnitha (M ≈ 5.9) [34,35]. The lithological formations found within the area of interest have good elastic properties, cohesion, homogeneity, and high values of mechanical characteristics and are distinguished by a low rate of the natural period of oscillation. According to Psarropoulos et al. [36], the fact that on the Acropolis Hill limestone, a relatively “hard” formation overlies schist formation, a relatively “soft” formation, leads to no amplification of seismic ground motion and to uniform response in the case of low-frequency far-field seismic events. On the contrary, in the case of high-frequency seismic events, the response may vary from location to location depending on the “very local” conditions (e.g., weathered rock on the ground surface and/or karstification of the formations).

2.4. Applied Mitigation Measures

As mentioned previously, mitigation measures have been taken in various time periods since 1930 concerning the surrounding rock formation, such as the construction of retaining walls, systematic rock bolts, filling of the joints with concrete to reduce infiltration, and the construction of intensive drainage system to minimize the run-off and infiltration [7]. Most of the above measures were installed from 1977 to 1993, mainly at the east and northeast slopes, covering an area of approximately 11,400 m2 that involved anchoring, sealing cracks, and filling rock discontinuities with special mortar grouts. A total of 303 anchors with lengths from 4 to 24 m with a total average of 10.3 m were placed around the Acropolis Hill, mainly at the northern and eastern slopes [37,38,39] (Figure 2). Since the mid-90s, most critical stability issues concerning the rock slopes had been successfully mitigated.

3. Methodology

The proposed and developed methodology consists of the following four phases. 1st phase: selection, weighting, and normalizing the instability-related variables, 2nd phase: applying the fuzzy logic model, 3rd phase: constructing the RIM and Rock Instability Index map, and 4th phase: Vvlidating the RIMs accuracy. Various Python and R packages were used [28], whereas ArcGIS 10.5 [29] was used to access the spatial data and generate the RIM susceptible maps. The overall developed methodology is illustrated in Figure 3, whereas a brief description of each phase follows.

3.1. Selection of Instability-Related Variable, Weighting and Normalizing the Instability-Related Variables
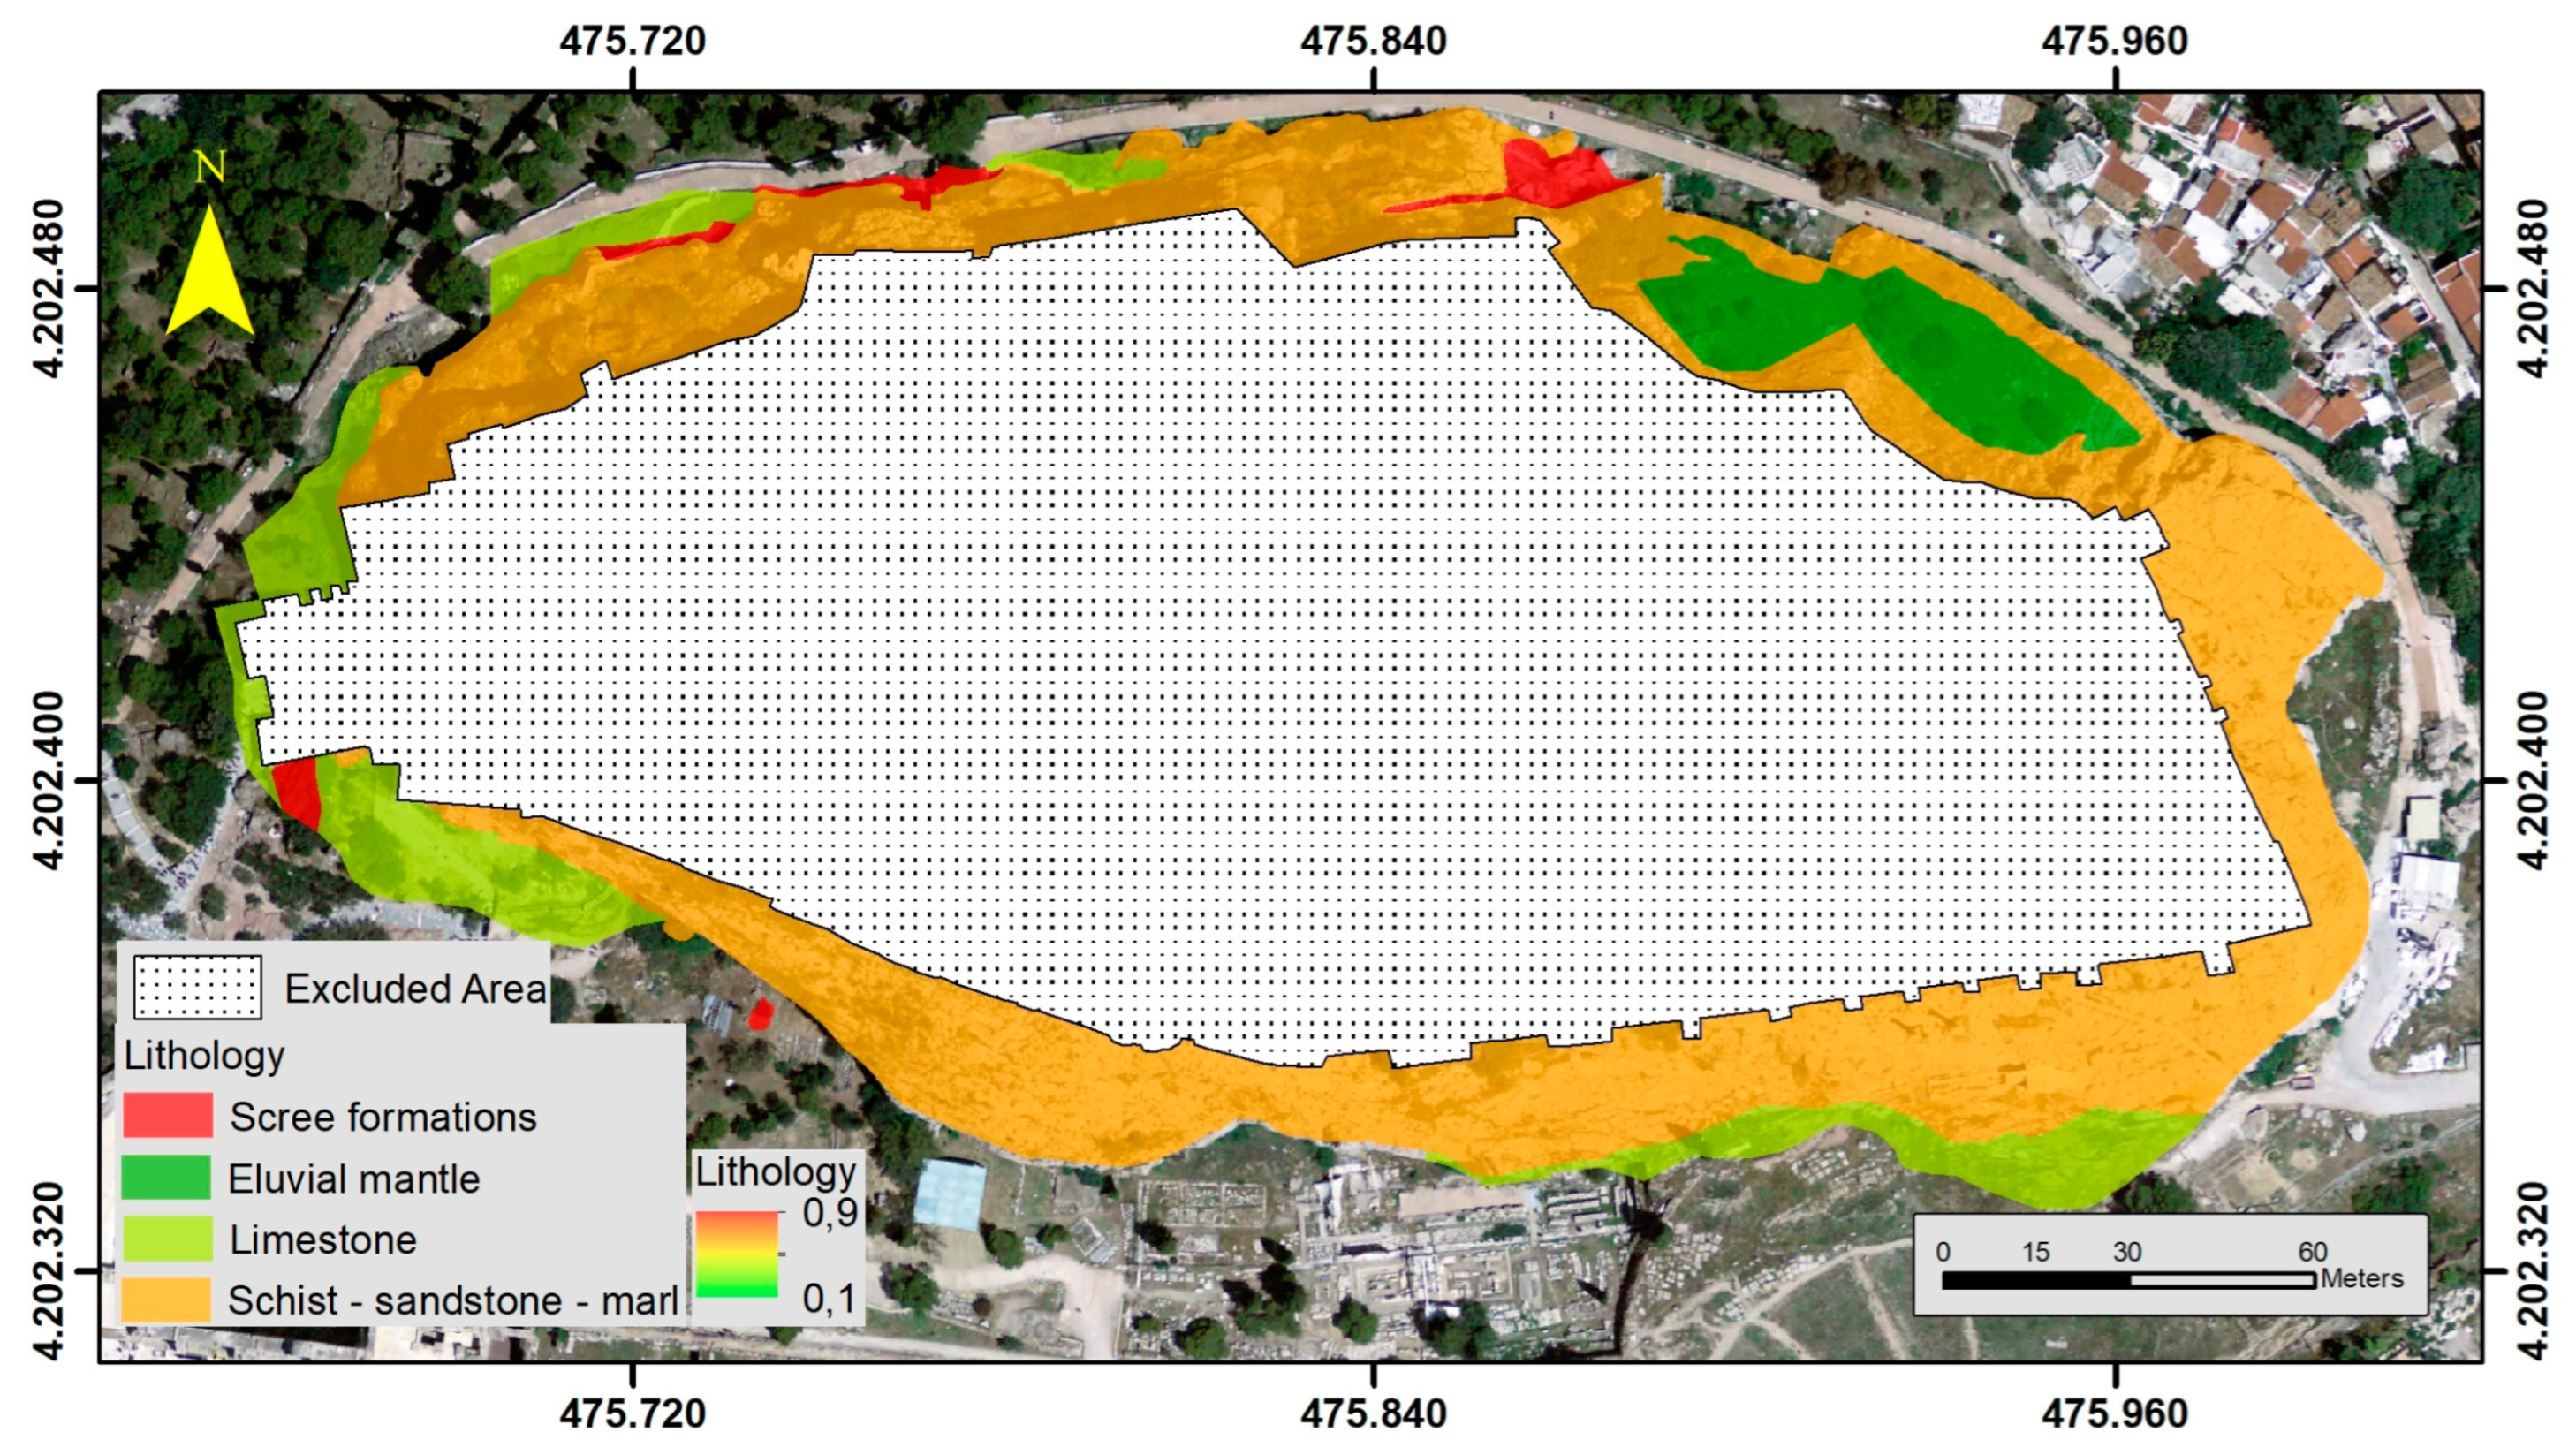
The first phase involved the selection of the instability-related variables. Six variables were selected, namely the following: lithology, slope angle, density of discontinuities, density of faults, density of surface runoff elements, and the orientation of the stratigraphy of the geological formations in relation to the orientation of the slope. Lithology and tectonic features were digitized from the Geological Map of the Acropolis Area, Athens (scale 1:500) by Andronopoulos and Koukis [2]. The geo-morphological parameters, slope angle, and density of surface runoff elements were derived using specific geo-processing tools of the ArcGIS suite from a Digital Elevation Model of 0.2 m resolution. The density of discontinuities was produced by the analysis of a very high-resolution aerial image, (orthophotomosaic of the plan view of the hill at a scale of 1:100, pixel size 10 mm, and accuracy < 3 cm) [13], whereas the orientation of geological formations in relation to the orientation of the slope was weighted by experts based on field surveys. Each parameter was transformed into raster format with a grid size of 0.20 m.

3.1.1. Lithology

In general, one of the most important parameters responsible for failures and instability issues is the lithology since each geological formation has different strength characteristics and failure mechanisms [22,26]. Four geological formations appear within the area of interest: (a) eluvial mantle of schist-sandstone-marl series, (b) scree formations consisting of loose limestone fragments and fine argillaceous material, (c) thick-bedded to massive limestones, locally crystalline, intensively fractured, karstified, clastic in places and frequently brecciated along its base. and (d) schist–sandstone–marl series, which comprises marls, sandstone marls, sandstones, and limestones as well as grey-to-green argillaceous schists [2]. A geological cross-section of the Acropolis Hill describing the geological structure could be obtained from the study of Koukis et al. [4]. However, all the steep slopes are covered by limestone with varying degrees of fracturing and weathering (Figure 4).

3.1.2. Slope Angle

Another critical parameter that has an essential influence on the stability of a rock is the slope angle [26]. Slope angle was classified into four categories, <5°, 6°–15°, 16°–35°, and >36°, and later normalized with values within the range 0.1–0.9. In the present study, a higher slope angle represents areas with higher susceptibility to instability issues, thus having higher normalized values (Figure 5).

3.1.3. Density of Discontinuities

The limestone formations covering the northern and eastern sections of the Acropolis Hill are characterized by a relatively intense fracturing pattern. This is mainly responsible for the loosening of the limestone. The western and southern section of the Acropolis Hill presents a much gentler fracturing scheme. Edge detection techniques were applied to detect the discontinuities from the very high-resolution aerial image (2 cm resolution). Edge detection techniques can detect edges by identifying areas within the image when image intensity changes sharply [40]. Three R packages were used, “pixmap”, “EBImage”, and “magick”, producing two raster format files that illustrate the horizontal and vertical lineaments found in the aerial image. The Sobel algorithm was used for this operation. Sobel operator is a discrete differentiation operator applied to calculate an approximate absolute gradient magnitude at each pixel of an image for edge detection [41]. It uses a pair of 3 × 3 kernels, Gx for horizontal edges and Gy for vertical edges, which are convolved with the original image to calculate approximations of the derivatives [42,43]. Figure 6 illustrates an example concerning a section in the south–east slope of Acropolis Hill and the way the Sobel operator provides the horizontal, vertical, and combined output. By using specific spatial functions, vector files representing the lineaments were extracted. The next step of the process involved removing all the vectors not identified as discontinuities. In more detail, the process involved overlaying the digitized tectonic features in a GIS environment and compared it with the vector files that were generated by the image analysis process. Features that appear to represent the faults were removed. The remaining were converted into a raster file that represented the density of the discontinuities with higher density areas indicating potential unstable areas (Figure 7 and Figure 8). The density of discontinuities was constructed through spatial functions that calculate the magnitude-per-unit area from a polyline feature that falls within a radius around each cell [29].

3.1.4. Density of Faults

Fault zones are zones of significant weakness. Several parameters affect their properties, such as the density of the faults, the thickness of the zones, the filling material, the degree of weathering, and orientation of the faults. The density of faults was constructed through the same spatial function used during the construction of density of discontinuities. The product of this function is normalized. In this study, areas with a higher fault density were considered as areas with higher instability issues and vice versa (Figure 9).

3.1.5. Density of Surface Runoff Elements

The continuous action of weathering and erosion agents is responsible for the deterioration of the rock formations of the Acropolis Hill, with the action of surface water being the most critical. Having this in mind, surface runoff elements were considered as a primary parameter that influences the overall stability of the rock formations. Using a procedure similar to that followed during hydrological studies for the extraction of the river network, by means of the Hydrology toolbox, a surface runoff elements network was produced for the Acropolis’ slopes [29]. In a similar manner with the construction of the density of discontinuities, the density of the surface runoff elements was estimated based on the Density toolset [29]. Figure 10 shows the spatial distribution of the density of the surface runoff elements, with values near 0.9 indicating potential areas of intense weathering and erosion action.

3.1.6. Orientation of the Stratigraphy of the Geological Formations in Relation to the Orientation of the Slope

The orientation of the stratigraphy of the geological formations in relation to the orientation of the slope is a critical parameter in the evaluation of the stability of a slope. Previous studies have conducted micro-tectonic analyses, and the orientation data concerning the rock formations derived from the Geological Map [2] helped in identifying critical zones, using a semi-quantitative approach based on expert input and classifying the output by a three-level scheme (unfavourable, moderate, and favourable) [2,4]. The limited amount of data and the insufficient spatial distribution did not allow the generation of a precise continuous surface which expresses favourable or unfavourable conditions. Therefore, the chosen alternative was using the described semi-quantitative approach taking into account the results of the micro-tectonic analyses and field observations in areas where no data exist. Favourable zones are the zones in which the orientation of the slope goes along with the orientation of the stratigraphy of the geological formations, unfavourable zones are zones in which the orientation of the slope is against the orientation of the geological formations, and moderate zones exist when the orientation could cause moderate instability issues (Figure 11).

3.1.7. Satellite Data

Concerning satellite data, four datasets were used, ERS-1/2, ENVISAT, TerraSAR-X/TanDEM-X, and Sentinel-1, covering a period from May 1992 to February 2011, April 2003 to March 2010, March 2012 to September 2019, and October 2014 to May 2020. ERS-1/2, ENVISAT, and Sentinel-1 satellites are equipped with a C-band radar sensor (5.5 GHz central frequency and 5.6 cm wavelength), while TerraSAR-X and TanDEM-X satellites are equipped with an X-band radar sensor (9.65 GHz central frequency and 3.1 cm wavelength), which makes them ideal for detecting small deformations. TerraSAR-X/TanDEM-X dataset is composed by 34 Single Look Complex (SLC) scenes acquired while the satellites were performing the descending relative orbit 138. Using this dataset, 96 interferograms were generated; afterwards, the stacks of interferograms were used for the Interferometric Point-Target analysis (IPTA). The first step was the calculation of the average intensity image using the co-registered stack of 34 SLC scenes. The selection of candidate persistent scatterers was performed using the average intensity image and applying spectral correlation and temporal variability of the SLC intensity filters. The candidate persistent scatterers (PS) were enriched by distributed scatterers (DS), which were selected using a dense grid over the area of interest. As a reference point was selected a scatterer characterized by strong backscattering intensity and high coherence at Areopagus hill. After the elimination of topographic and atmospheric phases, the deformation phases were converted in deformation rates along Line Of Sight (LOS). LOS is the imaginary line that connects the SAR sensor with the scatterers on ground surface. TOMO/PSI, PSI, and SBAS-type SAR Interferometry techniques were applied also to the other datasets to obtain the surface deformation time series for the test sites. Figure 12 illustrates the spatial distribution and surface deformation rate for the wider area of the Acropolis Hill resulted from TerraSAR-X/TanDEM-X IPTA processing, showing none or minor displacement rate in most cases.

3.2. Normalization

The next step involved the normalization of each of the six variables. The normalized values ranged between 0.1 and 0.9, using the min–max normalization procedure as follows in Equation (1):
v n e w = v min v max v min v u l + l
where vnew is the normalized data matrix, v is the original data matrix, and u and l are the upper and lower normalization boundaries.

3.3. Fuzzy Additive Weighting Model

The weighting procedure utilizes a group of experts, the authors of the study and researchers not belonging to the research group of the SCIENCE project, using a fuzzy simple additive weighting model (FSAW) to weight the main rock instability-related variables [27]. The group of experts specialize in topics related mainly to engineering geology and the stability of rock and soil formations as well as the development of susceptible and hazardous models. The FSAW model has four distinctive phases: (i) establishment of the group of experts, (ii) determining the reliability of each expert (in our case, each expert had the same reliability), (iii) weighting each variable using the linguistic classification scheme and calculating the aggregated fuzzy weights of each variable, and (iv) defuzzification of the weights of each variable. In order to capture the importance of each variable using fuzzy logic, a set of a five-level linguistic variables (very low importance, low importance, moderate importance, high importance, and very high importance) were expressed via the trapezoidal fuzzy numbers [44,45] Equation (2) (Table 1):
W ~ = a , b , c , d
The aggregated fuzzy variable weight for the ith variable is estimated by the following Equations (3)–(8):
W ~ i = a i , b i , c i , d i
where k the number of experts and
a i = e 1 k r e i a e i
b i = e 1 k r e i b e i
c i = e 1 k r e i c e i
d i = e 1 k r e i d e i
The reliability of each expert which is the same for all and is estimated as follows:
r e i = w e i i = 1 k w e i
The next phase involves the defuzzification of the aggregated fuzzy variable weight according to the centroid method Equation (9) [19]:
w c = c 2 + d 2 + c d a 2 b 2 a b 3 × c + d a b

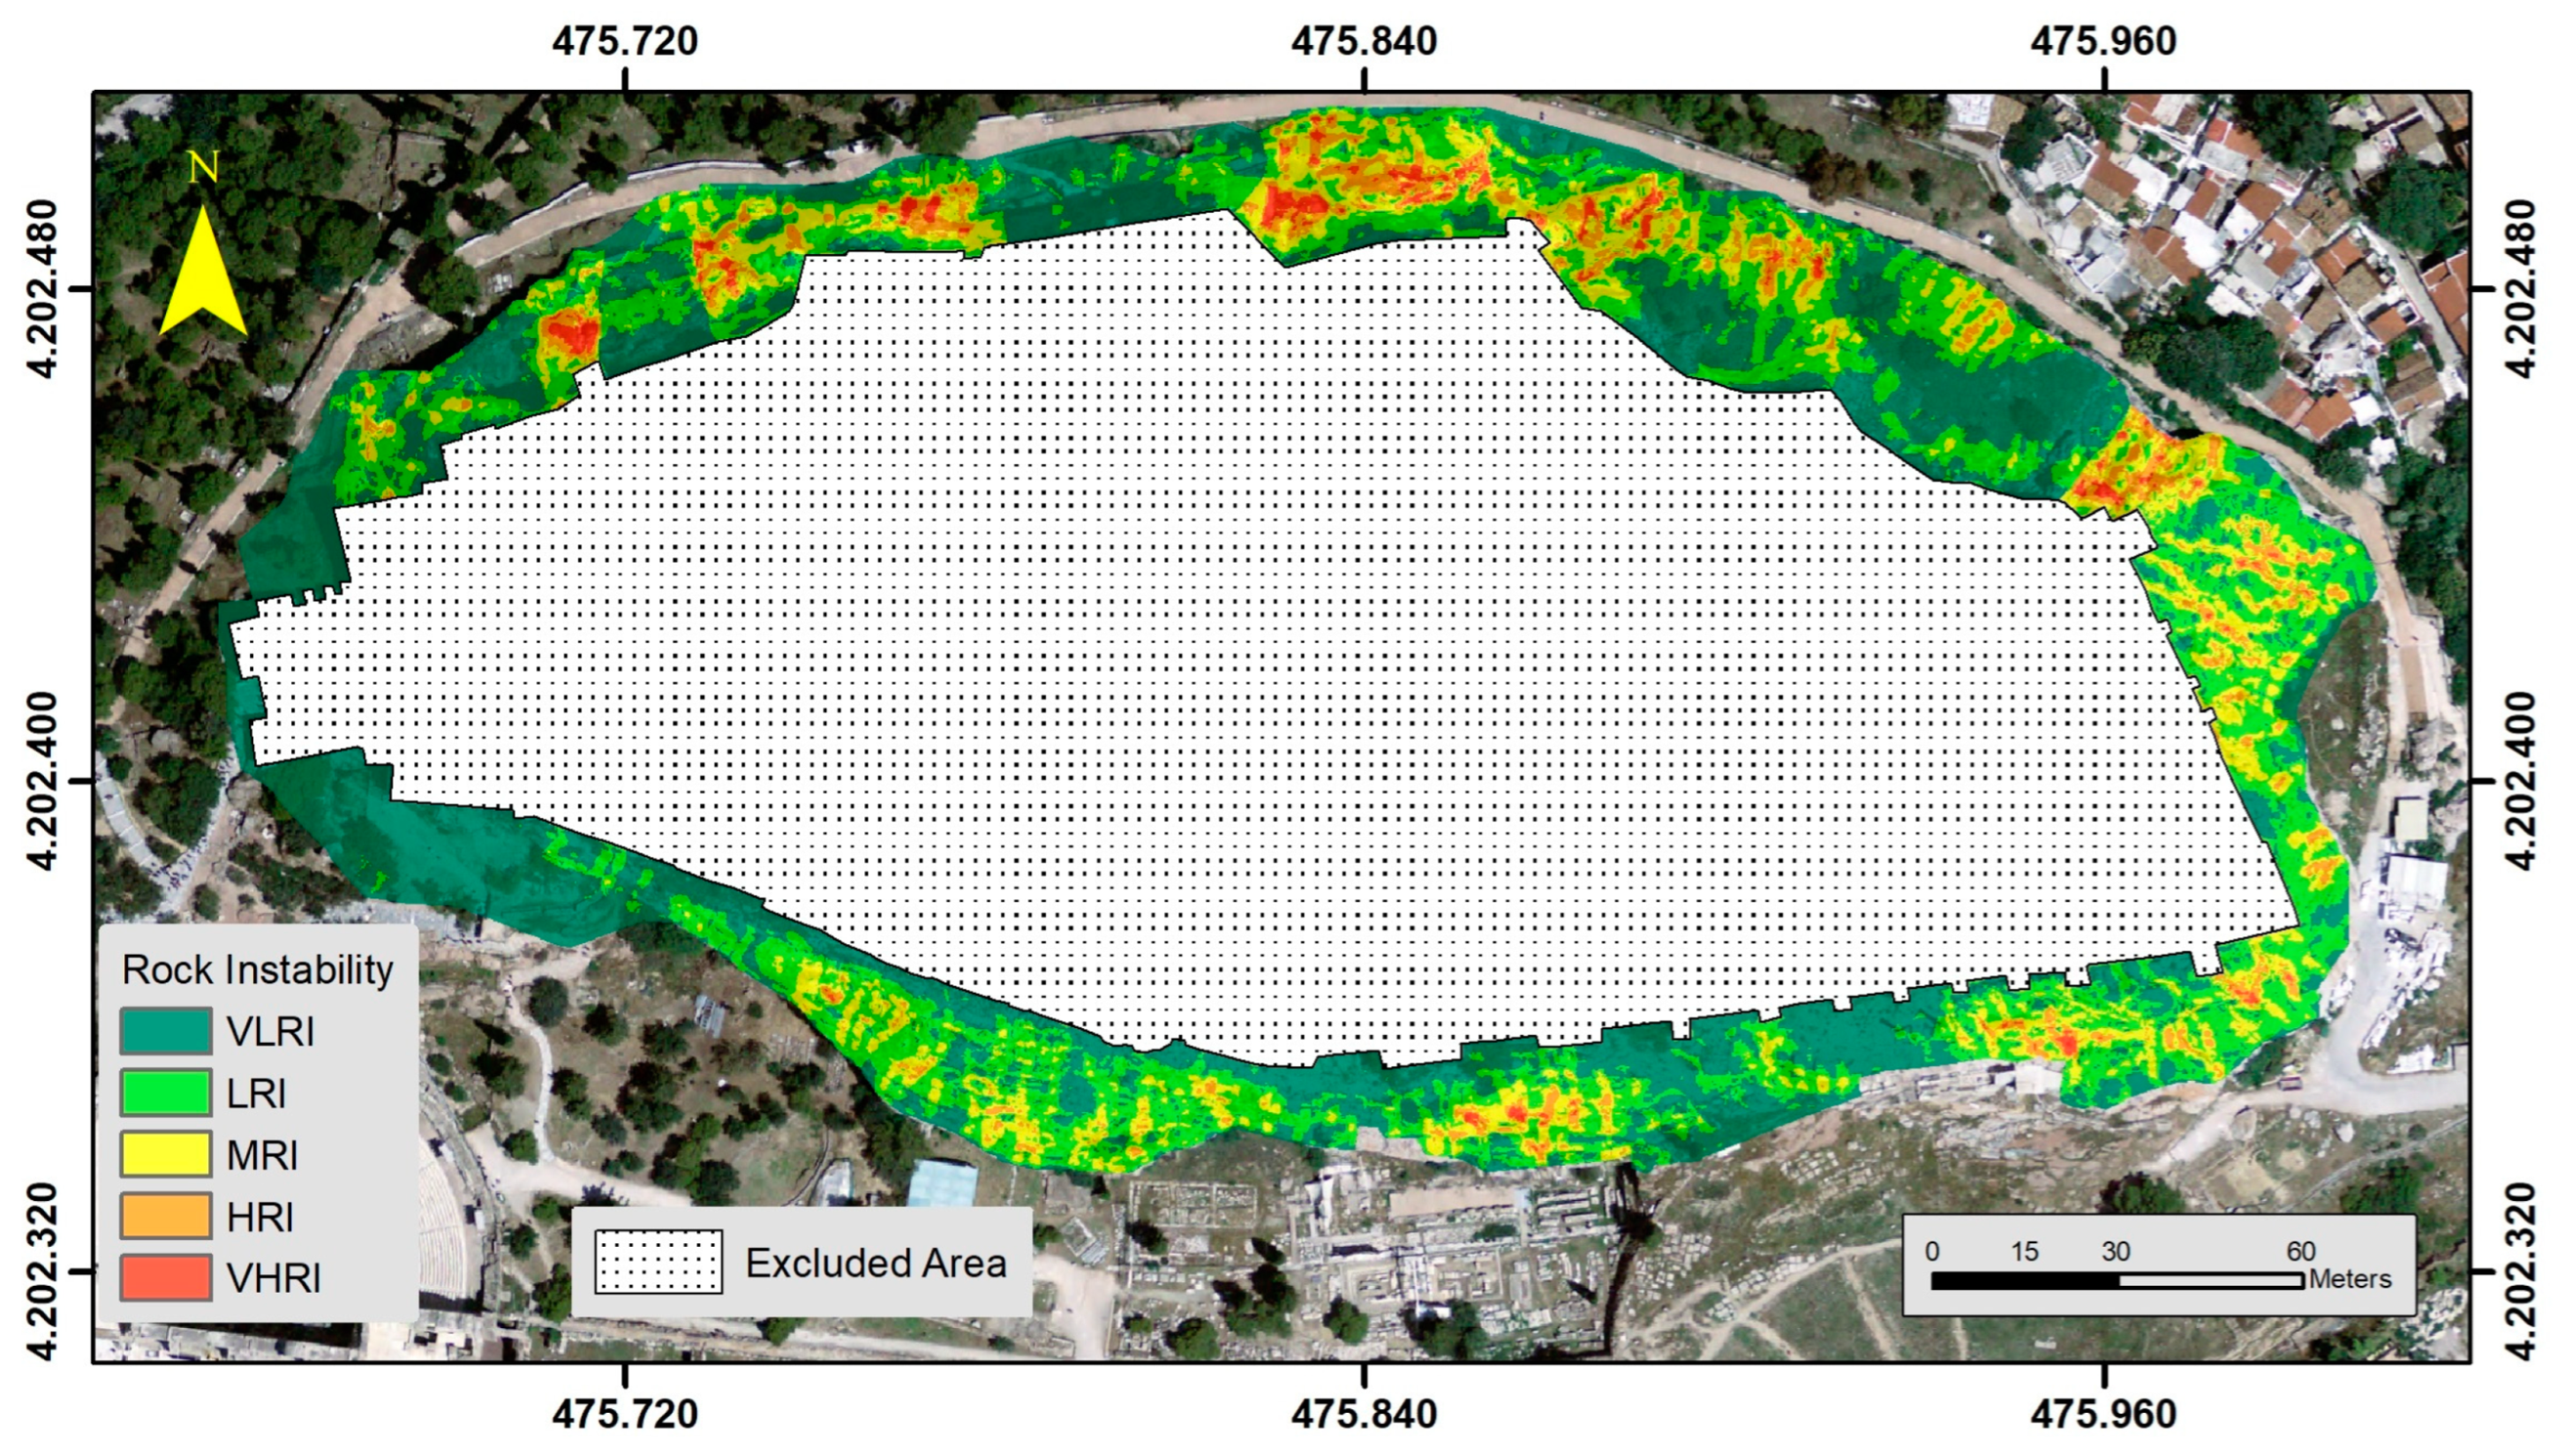
3.4. Construction of the Rock Instability Model
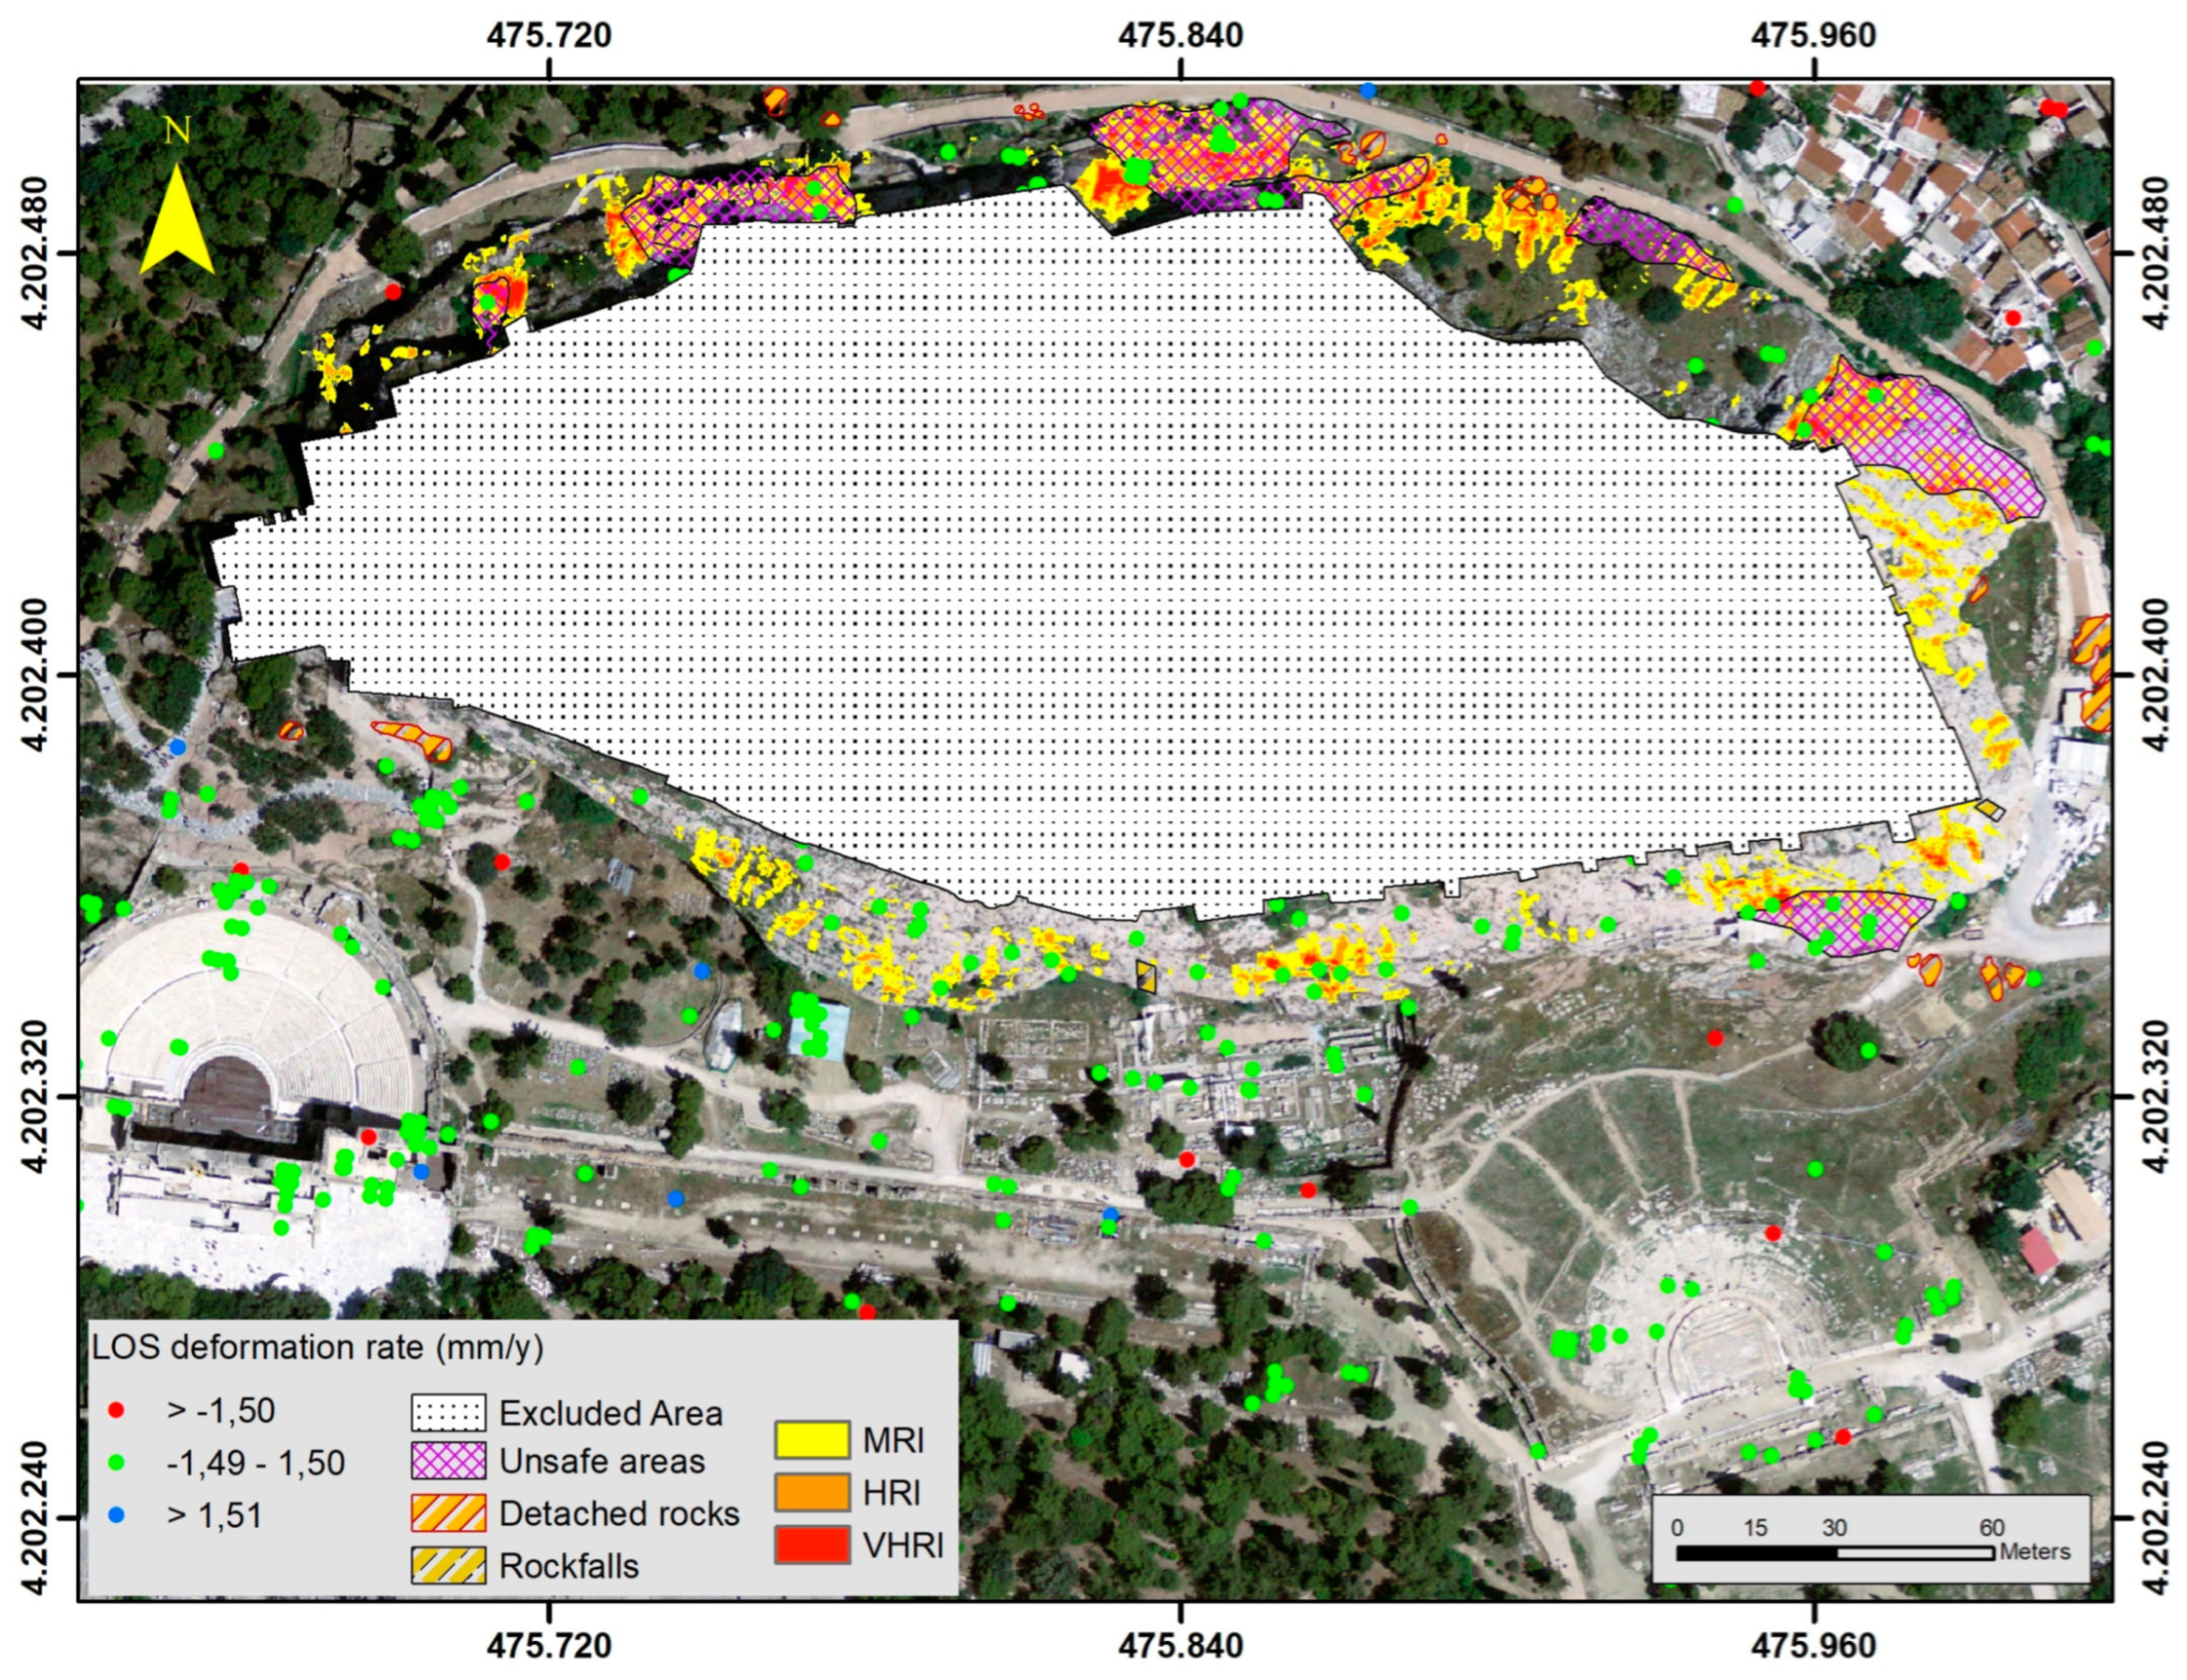
The construction of the RIM and the Rock Instability map was achieved by combining all the weighted parameters according to the following equation and the usage of a geoprocessing tool for performing raster analysis in Equation (10) [29]:
R I i = i = 1 n w i r i v i
where n is the number of the rock-instability-related parameters riv, and wi the overall weight of the ith variable, respectively.
The higher the membership value, the more susceptible is the terrain unit to the occurrence of rock instability issues and vice versa. The final Risk Instability map was classified using a five-level classification scheme, namely the following: Very Low Rock Instability (VLRI), Low Rock Instability (LRI), Moderate Rock Instability (MRI), High Rock Instability (HRI), and Very High Rock Instability (VHRI), using the natural break method for the determination of the class intervals [46].

3.5. Validation

The validation process was performed by comparing the produced Rock Instability Index map with fieldwork, previous studies, and the results of the satellite data processing phase. Extensive fieldwork and previous studies were means for validating the results produced by the RIM, using a three-level descriptive prognostic indicator scheme (low, moderate, high), depending on the comparison of the extent of coverage of the areas characterized by high and very high instability and the extent of observed instabilities. The location of implemented mitigation measures and consolidation works, along with the results of the satellite data analysis, were used to discuss further the results of the RIM outputs.

4. Results

Lithology, slope angle and density of surface runoff elements, and orientation of the stratigraphy of the geological formation in relation to the orientation of slope have been identified by the group of experts as the most significant variables with the FSAW method assigning a defuzzified value equal to 8.722, 7.889, and 6.166, respectively. Density of discontinuities and density of faults followed (5.778) (Table 2).
Figure 13 illustrates the output of the RIM, which expresses the Rock Instability Index. Based on the RIM, the north side of the Acropolis Hill presents the most susceptible section to instability issues. At least four sites were identified with a Very High Rock Instability. The south side seems to have less instability issues that may be attributed to the favourable orientation of geological formations in relation to the orientation of the slope. In contrast, the west side also appears with limited instability issues. To the south=east section, the RIM identified a small-in-extent instability area, which is occupied by fractured un-bedded grey limestone. The area is characterized by a dense network of joints and a significant degree of weathering. Overall, the most susceptible areas are characterized by steep slope angles, dense open cracks, fissures, and discontinuities of significant range, which are mainly zones of loose and fractured limestone. These areas are identified as possible detachment areas and areas with high possibility of instability issues.
The results of the SAR Interferometry techniques, along with the findings of field surveys and past research studies (lined polygons) are illustrated in Figure 14. Several areas identified from the RIM model with high and very high Rock Instability indices are located within the lined polygons that are location-identified in the past as being areas of significant instability issues, whereas detached rocks that are found in those areas confirm the instability issues [2,9]. About 71% of the observed unstable areas and areas that in the past had experienced instability issues and rock detachments are classified by the RIM to the Moderate to Very High Rock Instability zone, indicating a high predictive performance. Furthermore, several areas that were subjected to intensive mitigation measures and consolidation works over the past years seem to have a positive effect, since there were only a few incidences of instability issues during the last 20 years, mainly after heavy rainfall. This is also confirmed by the satellite data processing that shows no or minor movements. Most of the 448 PS points are within the range of −1.50 to 1.50 mm of displacement per year, indicating no movement. Only few PSI points are outside the above range, and all appear outside of our research area. Sixty-eight (68) PS points fall in the research area, with fourteen (14) in areas classified from the RIM in the zone Moderate to Very High Rock Instability. However, these locations were subject to mitigation works in the past that seem to have a positive effect on the overall stability of the Acropolis Hill [37,38,39].

5. Discussion

In the long history of the Acropolis, one finds a constant effort to protect it from the action of both natural processes and human activities. This stems from the need to protect one of the top monuments in world cultural heritage. Instabilities and falls of massive rock blocks from the slope of the Acropolis Hill have been recorded on few occasions, even in the recent past. Rock mass instabilities represent primary geologic hazards with significant negative impacts on property and human life. In most cases, damage resulting from rock failure is unacceptable; however, analytical tools are still imperfect, and instabilities of severe consequences still happen. In the case of a destruction, the effects are not only limited to the destruction of the monument, but also influence the socio-economic level of the entire country. Therefore, the idea of preventive conservation should be a primary focus of cultural preservation worldwide [47].
In this context, the main objective of the present study was to document, using a different approach unlike previous studies, the action of geo-environmental factors, as well as to precisely identify the areas on the Acropolis Hill which may encounter problems of instability and failure. Based on fuzzy logic and specifically a fuzzy simple additive weighting model, the various parameters that were used were weighted according to the opinion of experts, and combining their influence produced a Rock Instability Index map. The adopted fuzzy logic method, which utilized a group of experts as many researchers report, produces more reliable and accurate results, as it is well documented that the averaged “judgment” of a group of experts appears to be more accurate than the individual judgment of each expert [19,48,49,50]. In our case, the use of the FSAW method was meant to deal with the presence of vagueness and imprecision of information and to capture the fuzziness of the experts’ judgment. The accuracy of the developed methodology was confirmed based on field surveys, past studies, and satellite data analysis.
From the conducted study, it was evident that the highest effect on the overall stability of the rock formations was attributed to lithology and steep slope, followed by dense fracturing and the weathering and erosion action. The northern and northeastern section of the Acropolis Hill are the areas with the highest Rock Instability Index and the section with the largest number of instabilities. Concerning the fracturing of the limestone rock mass, limestone which covers the western and southern slopes appears cohesive and compact, while on the northern and eastern slopes, the conditions are more unfavourable and the initially high mechanical properties are reduced, corresponding to the residual strength of the fractured rocks [4]. Previous studies confirmed our findings. Arvanitakis and Monokrousos [51] report that because of the high degree of diaclasis and the unfavourable local settings concerning the discontinuities, joints, and cracks, there are several sections that may encounter stability problems. Andronopoulos and Koukis [7] report that the limestone fracturing and the characteristics of the discontinuities (spacing, orientation, continuity, open fissures) play a significant role in the mechanism of rockmass loosening. In more detail, the authors report that the natural state of the rock and the loosening of the limestone rockmass constituting the hill up to the base of the slopes are controlled by the following: (i) the jointing conditions and mainly the spacing, orientation, and other features of the discontinuities in the limestone rockmass, (ii) the continuous activity of the weathering–erosional factors, and (iii) the groundwater action. According to Kambouroglou [9], on the northern and eastern slopes, a dense network of discontinuities and open cracks and fissures of considerable width are present. The phenomena of weathering and erosion are intense, evidence of which are the formation of large caves (Panos, Apollona) and several karst systems. The steep slopes and the resulting instability, the dense fracturing, and the weathering and erosion actions mainly in the Apollonos and Panos caves as well as other places with strongly and deeply breached limestone rock masses tend to compensate for the naturally high mechanical strengths of the limestone and set in motion fracture mechanisms mainly due to insufficient support. In accordance with the above and our findings, Andronopoulos and Koukis and Koukis et al. [2,4] report the results of a micro-tectonic analysis performed in 23 locations, which identified unfavorable conditions in the northern, eastern, and southern parts of the hill. The unfavorable orientation of the main discontinuity planes, the presence of significant karst depressions, the high density of fractures in various directions and the presence of open, significant in width and length, intersecting joints and discontinuities were the main reasons for the observed instability issues. In the same manner, Monokroussos [37,38,39], who has performed slope stability analysis estimating the safety factor in 22 locations, identified critical zones that have undergone extensive consolidation and mitigation measures.
Another important point that should be mentioned is that from the consolidation works and established mitigation measures, there are no serious problems concerning stability issues at the Acropolis Hill. From the analysis of the satellite data, one can conclude that the effectiveness of the mitigation measures and consolidation works since none or minor displacements rates have been observed. Most PS data are within the zones characterized by the RIM as very low to low Rock Instability Index, and the ones that are in the zones moderate to very high Rock Instability Index, which match with the location in which consolidation works were applied. However, despite the present fair response of the Acropolis Hill, one should not be complacent. On the contrary, the identified critical locations should undergo a systematic periodic inspection. Heavy rainfall and seismic events that may occur in the future along with the ongoing weathering and erosion processes are triggering factors responsible for potential rock instability issues. The analysis confirmed the impressive impact that remote sensing techniques have in enabling ground deformation/displacement monitoring up to a few millimetres and use it as a non-invasive method to monitor important cultural and historical sites. Chen et al. [18] report that multitemporal SAR interferometric techniques could be applied as a diagnostic tool for identification of potential structural instability of monuments and surrounding environments.
Concerning the implementation of image processing functions to detect the discontinuities from very high-resolution aerial image, it proved a reliable approach. The produced horizontal and vertical lineaments from the very high-resolution aerial image concerning the Acropolis Hill provided outputs that captured sharp changes in the images intensity that was attributed to existing discontinuities, fissures, and cracks. Digital image processing is a tool that permits a fast, complete, and accurate acquisition of information; however, as Bordehore et al. [52] report, remote data collection does not substitute manual data collection, but rather complements the latter, providing new data for those slope areas that were not physically assessed. Another parameter that must be considered is the difficulty in several cases to validate the correctness of the image analysis results with field measurements, or the cleaning of high-resolution images from irrelevant objects or the existence of shadows. In our case, there was a validation of the results in places where access was possible mainly to the base of the slope around the perimeter of the hill.
Even if the outcomes of the RIM could be characterized as sufficiently accurate, still improvements could be made concerning mainly the introduction of additional parameters such as seismic activity. Regarding the associated hazard from seismic activity, as many researchers’ reports, it depends on the intensity of the applied acceleration, which may depend on site-specific settings such as topography [53,54,55]. As mentioned by Bouchon et al. [53], many of the characteristic of seismic response could be explained in part by the topographic settings. Bouckovalas and Papadimitriou [54], in the case they have studied, report that a general trend of amplification near the upper parts of slope surface and de-amplification near the toe of the slope seems to hold for the horizontal motion. Numerical analysis based on data from the installed seismic accelerometer network along with data from high precision topographic measurements (optical fibber sensors), would provide significant information concerning the dynamic response of the entire monument [5,13,14,15,36]. In addition, the rainfall intensity could be introduced in the RIM, since most of the reported rock failures occurred after heavy rainfall incidence.
By introducing these two triggering factors, the RIM would be transformed into a Rock Hazard Tool (RHT). The basic idea behind the development of a RHT will be to initially generate a Rock Instability Index based on the outcomes of the RIM model, which identifies areas susceptible to instability issues, and later with the addition of triggering factors to be identified in a similar manner with the RIM model, hazardous areas. Providing different scenarios considering the magnitude, epicentre, and duration of seismic events, but also intensity and duration of rainfall events, a RHT’s output could produce different hazard maps.
As for potential future works, they could involve applying weighting methods based on data-driven, machine learning methods, to differentiate the influence of each variable that has been used in the model to produce a more accurate outcome. Moreover, as vegetation plays a significant role in the presence of favorable conditions for failures, efforts to analyze its effect on the overall stability of rock formations should be addressed. In our case, vegetation on rock formations that cover the Acropolis Hill had a periodic presence over time. Climate conditions, especially during summer, and the cleaning operations that are carried out by personnel of the Acropolis Hill do not allow the development of significant vegetation cover that could affect the stability of the rock formations [7,9]. Thus, modeling vegetation is not included in the RIM model. However, the effect of vegetation and its integration into the RIM model as a predictive variable could be thought of as a future work hypothesis.
Undoubtedly, micro-tectonic analysis and slope stability analysis provide a comprehensive picture of the stability conditions in a rock mass. However, the necessary fieldwork and related analysis required are often not feasible. In our case, the number of analyses and the non-coverage of the entire Acropolis hill with micro-tectonic and slope stability analysis make the use of the proposed model as an alternative research tool in the identification of failure-prone areas important.

6. Conclusions

The main objective of the present study was to develop a Rock Instability Model to locate critical zones that are characterized by significant potential instability issues across the Acropolis Hill of Athens, Greece. The developed Rock Instability Model revealed several highly susceptible areas, with the most susceptible identified at the N-NW face of the hill and some less in number sites at the east of the hill. Lithology, the existence of steep slope angles and the presence of intense ruptures, fissures, joints, and discontinuities, along with the effects of weathering and erosion agents, were the main factors contributing to the occurrence of instability issues. Field surveys, past reports, and the analysis of satellite data using SAR Interferometry techniques were used to verify the accuracy of the developed model’s results and confirm the effectiveness of the consolidation work and mitigation measures implemented in the recent past. However, despite the overall fair response of the Acropolis Hill, the identified critical locations by the RIM should undergo a systematic periodic inspection since the ongoing weathering and erosion processes and future heavy rainfall and seismic events would further cause instability issues. The outcomes of the study could assist as a supplementary tool in the decision-making process for the protection, conservation, restoration, and enhancement of the monuments of the Athenian Acropolis, whereas the Rock Instability Model could serve as an alternative investigation tool for other historical cultural monuments of the country.

Author Contributions

Conceptualization, C.L. and P.T.; methodology, P.T.; validation, C.L., I.P., T.G. and V.E.; writing—original draft preparation, P.T.; writing—review and editing, C.L., P.T., T.G., V.E., I.P. and P.S. All authors have read and agreed to the published version of the manuscript.

Funding

This research was funded by European structural and investment funds, Partnership Agreement 2014–2020, and is supervised by the General Secretariat for Research and Technology in the context of national action for bilateral cooperation between Greece–China. SCIENCE—Interferometry with Radar satellite data as a non-invasive tool for vulnerability assessment in cultural heritage areas (MIS 5050729) with code 68139800 implemented under the Operational Program COMPETITIVENESS, ENTREPRENEURSHIP and INNOVATION.

Data Availability Statement

Not applicable.

Conflicts of Interest

The authors declare no conflict of interest.

References

  1. Drinia, H.; Tripolitsiotou, F.; Cheila, T.; Zafeiropoulos, G. The Geosites of the Sacred Rock of Acropolis (UNESCO World Heritage, Athens, Greece): Cultural and Geological Heritage Integrated. Geosciences 2022, 12, 330. [Google Scholar] [CrossRef]
  2. Andronopoulos, V.; Koukis, G. Engineering Geology Study in the Acropolis Area-Athens; IGME: Madrid, Spain, 1976; p. 66. [Google Scholar]
  3. Egglezos, D.; Ioannidou, M.; Moullou, D.; Kalogeras, I. Geotechnical issues of the Athenian Acropolis. In Geotechnics and Heritage: Case Histories; Bilotta, E., Flora, A., Lirer, S., Viggiani, C., Eds.; Taylor and Francis Group: London, UK, 2013; pp. 13–48. [Google Scholar]
  4. Koukis, G.; Pyrgiotis, L.; Kouki, A. The Acropolis Hill of Athens: Engineering Geological Investigations and Protective Measures for the Preservation of the Site and the Monuments. In Engineering Geology for Society and Territory—Volume 8; Springer: Cham, Switzerland, 2015; pp. 89–93. [Google Scholar]
  5. Sakellariou, M.; Kalogeras, I.; Kapogianni, E.; Psarropoulos, P. Investigation of the Structural Response of the Acropolis Wall Due to Seismic Loading, via Optical Fibre Sensors and Ac-Celerographs, Report to the Acropolis Restoration Service; YSMA: Athens, Greece, 2016; pp. 1–85. (In Greek) [Google Scholar]
  6. Kapogianni, E.; Psarropoulos, P.N.; Kokoris, D.; Kalogeras, I.; Michalopoulou, D.; Eleftheriou, V.; Sakellariou, M.G. Impact of Local Site Conditions on the Seismic Response of the Athenian Acropolis Hill. Geotech. Geol. Eng. 2020, 39, 1817–1830. [Google Scholar] [CrossRef]
  7. Andropoulos, B.; Koukis, G. Engineering geological problems in the Acropolis of Athens. In Proceedings of the International Symposium Organized by the Greek National Group of IAEG, Engineering Geology of Ancient Works, Monuments and Historical Sites, Athens, Greece, 19–23 September 1988; Volume 3, pp. 1819–1831. [Google Scholar]
  8. Higgins, M.D.; Higgins, R.A. Geological Companion to Greece and the Aegean, London; Gerald Duckworth Co.: London, UK, 1996; pp. 26–31. [Google Scholar]
  9. Kambouroglou, E. Report on the Hydrogeological and Engineering Geology of the Klepsydra Spring and the Surrounding Area of Acropolis Hill, YSMA Archive; YSMA: Athens, Greece, 2013. (In Greek) [Google Scholar]
  10. Lan, H.; Martin, C.D.; Zhou, C.; Lim, C.H. Rockfall hazard analysis using LiDAR and spatial modeling. Geomorphology 2010, 118, 213–223. [Google Scholar] [CrossRef]
  11. Egglezos, D. The use of modern technological applications for restoring the circuit Walls of the Acropolis. In Proceedings of the Modern Technologies in the Restoration of the Acropolis, Athens, Greece, 19 March 2010. [Google Scholar]
  12. Ioannidou, M.; Moullou, D.; Egglezos, D. The Restoration of the Acropolis of Athens: A Holistic Approach. In Handbook of Cultural Heritage Analysis; D’Amico, S., Venuti, V., Eds.; Springer: Cham, Switzerland, 2022. [Google Scholar] [CrossRef]
  13. Moullou, D.; Mavrommati, D. Topographic and photogrammetric recording of the Acropolis of Athens. In Proceedings of the XXI CIPA International Symposium, Athens, Greece, 1–6 October 2007. [Google Scholar]
  14. Mavromati, D.; Moullou, D. Application of modern surveying and geometric documentation methods in the Acropolis of Athens. In Proceedings of the 3rd National Conference Mild Interventions for the Protection of Historical Structures; Ianos: Thessaloniki, Greece, 2009; pp. 299–308. [Google Scholar]
  15. Astreinidis, E.; Egglezos, D. Application of fiber optic (Bragg type) sensors for instrumental monitoring of monuments: The case of the Perimeter Wall of the Acropolis. In Proceedings of the 3rd Conference on Earthquake Engineering, Athens, Greece, 5–7 November 2008. [Google Scholar]
  16. Ferretti, A.; Pratti, C.; Rocca, F. Nonlinear subsidence rate estimation using permanent scatterers in differential SAR interferomety. IEEE Trans. Geosci. Remote sens. 2000, 38, 2202–2212. [Google Scholar] [CrossRef] [Green Version]
  17. Werner, C.; Wegmuller, U.; Strozzi, T.; Wiesmann, A. Interferometric point target analysis for deformation mapping. In Proceedings of the IGARSS 2003. 2003 IEEE International Geoscience and Remote Sensing Symposium. Proceedings (IEEE Cat. No.03CH37477), Toulouse, France, 21–25 July 2003. [Google Scholar]
  18. Chen, F.; Wu, Y.; Zhang, Y.; Parcharidis, I.; Ma, P.; Xiao, R.; Xu, J.; Zhou, W.; Tang, P.; Foumelis, M. Surface Motion and Structural Instability Monitoring of Ming Dynasty City Walls by Two-Step Tomo-PSInSAR Approach in Nanjing City, China. Remote Sens. 2017, 9, 371. [Google Scholar] [CrossRef] [Green Version]
  19. Tsangaratos, P.; Loupasakis, C.; Nikolakopoulos, K.; Angelitsa, V.; Ilia, I. Developing a landslide susceptibility map based on remote sensing, fuzzy logic and expert knowledge of the Island of Lefkada, Greece. Environ. Earth Sci. 2018, 77, 363. [Google Scholar] [CrossRef]
  20. Frattini, P.; Crosta, G.; Carrara, A.; Agliardi, F. Assessment of rockfall susceptibility by integrating statistical and physically-based approaches. Geomorphology 2008, 94, 419–437. [Google Scholar] [CrossRef]
  21. Youssef, A.M. Landslide susceptibility delineation in the Ar-Rayth area, Jizan, Kingdom of Saudi Arabia, using analytical hierarchy process, frequency ratio, and logistic regression models. Environ. Earth Sci. 2015, 73, 8499–8518. [Google Scholar] [CrossRef]
  22. Pourghasemi, H.-R.; Teimoori Yansari, Z.; Panagos, P.; Pradhan, B. Analysis and evaluation of landslide susceptibility: A review on articles published during 2005–2016 (periods of 2005–2012 and 2013–2016). Arab. J. Geosci. 2018, 11, 193. [Google Scholar] [CrossRef]
  23. Tangestani, M.H. A comparative study of Dempster–Shafer and fuzzy models for landslide susceptibility mapping using a GIS: An experience from Zagros Mountains, SW Iran. J. Asian Earth Sci. 2009, 35, 66–73. [Google Scholar] [CrossRef]
  24. Alimohammadlou, Y.; Najafi, A.; Gokceoglu, C. Estimation of rainfall-induced landslides using ANN and fuzzy clustering methods: A case study in Saeen Slope, Azerbaijan province, Iran. CATENA 2014, 120, 149–162. [Google Scholar] [CrossRef]
  25. Kouli, M.; Loupasakis, C.; Soupios, P.; Rozos, D.; Vallianatos, F. Landslide susceptibility mapping by comparing the WLC and WofE multi-criteria methods in the West Crete Island, Greece. Environ. Earth Sci. 2014, 72, 5197–5219. [Google Scholar] [CrossRef]
  26. Saroglou, C. GIS-Based Rockfall Susceptibility Zoning in Greece. Geosciences 2019, 9, 163. [Google Scholar] [CrossRef] [Green Version]
  27. Chou, S.-Y.; Chang, Y.-H.; Shen, C.-Y. A fuzzy simple additive weighting system under group decision-making for facility location selection with objective/subjective attributes. Eur. J. Oper. Res. 2008, 189, 132–145. [Google Scholar] [CrossRef]
  28. R Development Core Team. R: A Language and Environment for Statistical Computing; R Foundation for Statistical Computing: Vienna, Austria, 2020. [Google Scholar]
  29. ESRI. ArcGIS Desktop: Release 10.5; Environmental Systems Research Institute: Redlands, CA, USA, 2015. [Google Scholar]
  30. Marinos, G.; Katsikatsos, G.; Georgiadou-Dikeoulia, E.; Mikrou, R. The Athens schist formation, I. Stratigraphy and structure. Ann. Géologiques Pays Helléniques 1971, 22, 183–216. (In Greek) [Google Scholar]
  31. Regueiro, M.; Stamatakis, M.; Laskaridis, K. The geology of the Acropolis (Athens, Greece). Eur. Geol. 2014, 38, 45–52. [Google Scholar]
  32. Ambraseys, N. Material for the investigation of the seismicity of Central Greece. In Historical Investigation of the Seismicity of European Earthquakes; Albinii, P., Moroni, A., Eds.; INGV: Palermo, Italy, 1994; Volume 2, pp. 1–10. [Google Scholar]
  33. Ambraseys, N.N.; Jackson, J.A. Seismicity and strain in the Gulf of Corinth (Greece) since 1694. J. Earthq. Eng. 1997, 1, 433–477. [Google Scholar] [CrossRef]
  34. Zambas, C.; Ambraseys, N.; Boletis, C.; Zampa, I. The Two Choragic Columns of the South Slope of the Acropolis, as Witnesses of the Seismic History of the Centre of Athens, Scientific Project Report; John Latsis Public Benefit Foundation: Athens, Greece, 2011. [Google Scholar]
  35. Ambraseys, N. On the long-term seismicity of the city of Athens. In Proceedings of the Academy of Athens, Athina, Greece, 18 February 2010; Volume A, pp. 81–136. [Google Scholar]
  36. Psarropoulos, P.N.; Kapogianni, E.; Kalogeras, I.; Michalopoulou, D.; Eleftheriou, V.; Dimopoulos, G.; Sakellariou, M. Seismic response of the circuit wall of the Acropolis of Athens: Recordings versus numerical simulations. Soil. Dyn. Earthq. Eng. 2018, 113, 309–316. [Google Scholar] [CrossRef]
  37. Monokroussos, A. “CONSOLIDATION WORK ON THE ROCK OF THE ACROPOLIS, A. The Southern Slope-Eastern Part” Ministry of Culture and Sports, Acropolis Restoration Service, Report; YSMA: Athens, Greece, 1994. (In Greek) [Google Scholar]
  38. Monokroussos, A. “CONSOLIDATION WORK ON THE ROCK OF THE ACROPOLIS, B. The Southern Slope-Western Part” Ministry of Culture and Sports, Acropolis Restoration Service, Report; YSMA: Athens, Greece, 1994. (In Greek) [Google Scholar]
  39. Monokroussos, A. “CONSOLIDATION WORK ON THE ROCK OF THE ACROPOLIS, E. The Eastern Slope” Ministry of Culture and Sports, Acropolis Restoration Service, Report; YSMA: Athens, Greece, 1994. (In Greek) [Google Scholar]
  40. Vasuki, Y.; Holden, E.-J.; Kovesi, P.; Micklethwaite, S. Semi-automatic mapping of geological structures using UAV-based photogrammetric data: An image analysis approach. Comput. Geosci. 2014, 69, 22–32. [Google Scholar] [CrossRef]
  41. Muthukrishman, R.; Radha, M. Edge Detection Techniques for Image Segmentation. Int. J. Comput. Sci. Inf. Technol. (IJCSIT) 2011, 3, 259–267. [Google Scholar]
  42. Liu, J.D.; Fan, X.N.; Ding, P.H.; Zheng, Q.Y. Multi-instrument image edge detection algorithm based on improved Sobel operator. J. Sci. Technol. Eng. 2012, 12, 4691–4696. [Google Scholar]
  43. Han, L.; Tian, Y.; Qi, Q. Research on edge detection algorithm based on improved Sobel operator. MATEC Web Conf. 2020, 309, 03031. [Google Scholar] [CrossRef] [Green Version]
  44. Zadeh, L.A. Fuzzy sets. Inf. Control 1965, 8, 338–353. [Google Scholar] [CrossRef]
  45. Kaufman, A.; Gupta, M.M. Introduction to Fuzzy Arithmetic: Theory and Applications; Van Nostrand Reinhohld: New York, NY, USA, 1991; p. 384. [Google Scholar]
  46. Feizizadeh, B.; Blaschke, T. GIS-multicriteria decision analysis for landslide susceptibility mapping: Comparing three methods for the Urmia lake basin, Iran. Nat. Hazards 2013, 65, 2105–2128. [Google Scholar] [CrossRef]
  47. Agapiou, A.; Lysandrou, V.; Themistocleous, K.; Hadjimitsis, D.G. Risk assessment of cultural heritage sites clusters using satellite imagery and GIS: The case study of Paphos District, Cyprus. Nat. Hazards 2016, 83, S5–S20. [Google Scholar] [CrossRef]
  48. Zhu, A.-X.; Wang, R.; Qiao, J.; Qin, C.-Z.; Chen, Y.; Liu, J.; Du, F.; Lin, Y.; Zhu, T. An expert knowledge-based approach to landslide susceptibility mapping using GIS and fuzzy logic. Geomorphology 2014, 214, 128–138. [Google Scholar] [CrossRef]
  49. Feizizadeh, B.; Roodposhti, M.S.; Jankowski, P.; Blaschke, T. A GIS-based extended fuzzy multi-criteria evaluation for landslide susceptibility mapping. Comput. Geosci. 2014, 73, 208–221. [Google Scholar] [CrossRef] [Green Version]
  50. Chalkias, C.; Polykretis, C.; Ferentinou, M.; Karymbalis, E. Integrating expert knowledge with statistical analysis for landslide susceptibility assessment at regional scale. Geosciences 2016, 6, 14. [Google Scholar] [CrossRef] [Green Version]
  51. Arvanitakis, M.; Monokroussos, D. Consolidation work on the sacred rock of the Acropolis, Athens, 1988. In Proceedings of the International Symposium Organized by the Greek National Group of IAEG, Engineering Geology of Ancient Works, Monuments and Historical Sites, Athens, Greece, 19–23 September 1988; Volume 3, pp. 1833–1837. [Google Scholar]
  52. Bordehore, L.J.; Riquelme, A.; Cano, M.; Tomás, R. Comparing manual and remote sensing field discontinuity collection used in kinematic stability assessment of failed rock slopes. Int. J. Rock Mech. Min. Sci. 2017, 97, 24–32. [Google Scholar] [CrossRef] [Green Version]
  53. Bouchon, M.; Barker, J.S. Seismic response of a hill: The example of Tarzana, California. Bull. Seismol. Soc. Am. 1996, 86, 66–72. [Google Scholar] [CrossRef]
  54. Bouckovalas, G.D.; Papadimitriou, A.G. Numerical evaluation of slope topography effects on seismic ground motion. Soil Dyn. Earthq. Eng. 2005, 25, 547–558. [Google Scholar] [CrossRef]
  55. Stamatopoulos, C.A.; Bassanou, M.; Brennan, A.J.; Madabhushi, G. Mitigation of the seismic motion near the edge of cliff-type topographies. Soil Dyn. Earthq. Eng. 2007, 27, 1082–1100. [Google Scholar] [CrossRef]
Figure 1. The study area and its location in different scales.
Remotesensing 15 01067 g001
Figure 2. Rock bolts installed for the stabilization of the rockmass in the north and east slope of the Acropolis Hill.
Remotesensing 15 01067 g002
Figure 3. The flowchart of the developed methodological approach.
Remotesensing 15 01067 g003
Figure 4. Instability related parameters (normalized): Lithology.
Remotesensing 15 01067 g004
Figure 5. Instability related parameters (normalized): Slope Angle.
Remotesensing 15 01067 g005
Figure 6. Original sample; horizontal lineaments; vertical lineaments; combined lineaments, (clockwise from up left corner).
Remotesensing 15 01067 g006
Figure 7. Instability related parameters (normalized): Density of discontinuities—vertical.
Remotesensing 15 01067 g007
Figure 8. Instability related parameters (normalized): Density of discontinuities—horizontal.
Remotesensing 15 01067 g008
Figure 9. Instability related parameters (normalized): Density of Faults.
Remotesensing 15 01067 g009
Figure 10. Instability related parameters (normalized): Density of surface runoff elements.
Remotesensing 15 01067 g010
Figure 11. Instability-related parameters (normalized): orientation of stratigraphy of the geological formations in relation to the orientation of slopes.
Remotesensing 15 01067 g011
Figure 12. Surface deformation rate.
Remotesensing 15 01067 g012
Figure 13. Rock Instability Index (Very Low Rock Instability (VLRI), Low Rock Instability (LRI), Moderate Rock Instability (MRI), High Rock Instability (HRI), Very High Rock Instability (VHRI)).
Remotesensing 15 01067 g013
Figure 14. Rock Instability Index—Satellite data Analysis.
Remotesensing 15 01067 g014
Table 1. Linguistic variable, crisp and fuzzy numbers for the importance weight.
Linguistic VariableCrisp NumbersFuzzy Number
Very low importance1(0, 0, 0, 3)
Low importance2(0, 3, 3, 5)
Moderate importance3(3, 5, 5, 7)
High importance4(5, 7, 7, 10)
Very High Importance5(7, 10, 10, 10)
Table 2. Instability-related variables and importance weight (crisp values).
Instability Related VariablesExpert AExpert BExpert CExpert DExpert EExpert FDefuzzified Values
Density of surface runoff elements3433446.166
Slope Angle4544547.889
Density of discontinuities 3443335.778
Lithology 5455558.722
Density of faults3334435.778
Orientation of the stratigraphy of the geological formations3434436.166
Disclaimer/Publisher’s Note: The statements, opinions and data contained in all publications are solely those of the individual author(s) and contributor(s) and not of MDPI and/or the editor(s). MDPI and/or the editor(s) disclaim responsibility for any injury to people or property resulting from any ideas, methods, instructions or products referred to in the content.

