Article

Using Nighttime Lights Data to Assess the Resumption of Religious and Socioeconomic Activities Post-COVID-19

1
Earth and Space Science Institute, Future Economies Sector, King Abdulaziz City for Science and Technology (KACST), P.O. Box 6086, Riyadh 11442, Saudi Arabia
2
Geography Department, College of Arts and Social Sciences, Sultan Qaboos University, Al-Khoud, P.O. Box 42, Muscat 123, Oman
3
Department of Geography and GIS, Faculty of Arts, Alexandria University, Al Shatby, P.O. Box 21526, Alexandria 21545, Egypt
4
Business School, Imperial College London, London SW7 2AZ, UK
5
Geography and Environment, University of Southampton, Southampton SO17 1BJ, UK
*
Author to whom correspondence should be addressed.
Remote Sens. 2023, 15(4), 1064; https://doi.org/10.3390/rs15041064
Submission received: 6 December 2022 / Revised: 11 January 2023 / Accepted: 9 February 2023 / Published: 15 February 2023
(This article belongs to the Section Urban Remote Sensing)

Abstract

:
The COVID-19 pandemic greatly impacted socioeconomic life globally. Nighttime-lights (NTLs) data are mainly related to anthropogenic phenomena and thus have the ability to monitor changes in socioeconomic activity. However, the overglow effect is a source of uncertainty and affects the applicability of NTL data for accurately monitoring socioeconomic changes. This research integrates the NTL and fine bare-land-cover data to construct a novel index named the Bare Adjusted NTL Index (BANTLI) to lessen the overglow uncertainty. BANTLI was used to measure the post-pandemic resumption of religious rituals and socioeconomic activity in Makkah and Madinah at different spatial levels. The results demonstrate that BANTLI significantly eliminates the overglow effect. In addition, BANTLI brightness recovered during the post-pandemic periods, but it has remained below the level of the pre-pandemic period. Moreover, not all wards and rings are affected equally: wards and rings that are near the city center experienced the most explicit reduction of BANTLI brightness compared with the suburbs. The Hajj pilgrimage period witnessed a larger decrease in BANTLI brightness than the pandemic period in Makkah. The findings indicate that (i) BANTLI successfully mitigates the overglow effect in the NTL data, and (ii) the cultural context is important to understand the impact of COVID-19.

1. Introduction

The novel coronavirus (COVID-19), which was first announced by the World Health Organization (WHO) at the beginning of 2020, is one of the biggest modern health challenges facing humanity. As a result of the rapid transmission of the virus, it spread all over the world in March 2020 [1]. On 11 March 2020, the WHO officially declared the COVID-19 a pandemic. Different measures were implemented by international and national agencies to control the spread of the virus, such as suspension of flights, city lockdowns, social distancing, curfews, and closures of non-essential markets and shops. These measures had a significant impact on health, environment, economy, travel, religious freedoms, and tourism sectors, as well as social activity. According to the WHO, by 1 March 2022, a total of 437 million cases of COVID-19 and nearly 6 million deaths had been reported worldwide. Moreover, statistical estimates indicate that there was a 3.4% contraction in the global economy in 2020, followed by a growth of 5.5% in 2021 [2]. The impact of the COVID-19 pandemic saw a decrease of international tourists by 74% in 2020 compared to 2019, with an estimated loss of $1.3 trillion in tourism expenditure [3].
The biological characteristics of the COVID-19 virus make the performance of religious rituals at worship places one of the risk factors for the spread of the virus among large groups of people. This is because worship places are visited by people from different places, of different nationalities, ages, and health statuses. Thus, governments temporarily closed worship places and cancelled the most prominent religious events, such as Hajj and Umrah [4]. Hajj takes place in the Dhu al-Hijjah month of the Islamic calendar and for six specific and consecutive days. Muslims perform their religious rituals by moving between four places, namely Mina, Arafat, Muzdalifah and the Holy Mosque, and the distance between these places ranges between 7 and 17 km. Umrah takes place at any time of the year; takes one to three hours to finish it depending on the crowding, and it is performed only in the Holy Mosque [5].
Hajj is the world’s largest annually recurring mass gathering of Muslims who come from different countries [6]. Thus, to prevent COVID-19 transmission from abroad, the Saudi government substantially scaled down the number of pilgrims for the Hajj pilgrimage in 2020 and 2021 to 10,000 and 60,000, respectively, compared with 2.5 million in 2019 [7]. In addition, Umrah was suspended for international pilgrims on 26 February 2020 and internally on 4 March 2020, gradually resuming on 4 October 2020 and 1 November 2020 nationally and internationally, respectively. The decision to resume religious rituals is a major step to return socioeconomic activities to pre-COVID-19 pandemic levels, and this may take a long time. Therefore, a spatiotemporal analysis of the resumption of religious rituals has the potential to provide decision-makers with critical information about socioeconomic recovery in the post-pandemic period.
Various studies have considered the resumption of economic, social and environmental conditions after the COVID-19 pandemic, using data sources other than remote sensing. For example, Li et al. [8] analyzed the influence on workers’ incomes of returning after the COVID-19 pandemic using population mobility data for 366 Chinese cities. Zhang et al. [9] developed a statistical model to predict tourist return after the devastating pandemic in Hong Kong. Xu et al. [10] analyzed traffic volume during and after the pandemic in Shanghai, China. Earth observation satellite data are an important source that can help in understanding, assessing and developing solutions to natural, human-made and health disasters [11]. This research focused on the use of nighttime remote-sensing technologies. Nighttime lights (NTLs) data, a substantial proxy for anthropogenic phenomena, provide a unique perspective for mapping urban areas [12] with the ability to measure socioeconomic activity levels [13]. Thus, NTL data have been widely utilized to monitor electricity consumption [14,15,16] and GDP [17,18,19], map urban areas [12,20,21], estimate populations [22,23,24], measure pollution [25,26,27,28] and track natural disasters [28,29].
In the absence of timely, accurate and detailed information, NTL data can provide valuable spatial information to quantify and analyze the influence of unexpected events (war, earthquake, tsunami, pandemic, etc.) on socioeconomic activity due to their large area coverage and near-real-time acquisition. Studies using NTL data have reported substantial decreases in NTL brightness during the pandemic period in countries such as China [30], India [31] and Saudi Arabia [32]. Xu et al. [33] compared the influence of the COVID-19 pandemic in 20 global megacities, using NTL imagery, and found an overall reduction in NTL brightness among the cities of differing magnitudes.
A range of studies evaluated aspects of life during the post-pandemic period [11,34,35,36]. Beyer et al. [34] used daily electricity consumption, NTL and gross value added (GVA) data to analyze the influence of COVID-19 in India at the country, state, city and district levels. The COVID-19 pandemic dimmed India from March 2020 to June 2020, with an NTL decline of −8%, followed by recovery to −1.5% in July 2020 and −3% in August 2020 [34]. Straka et al. [36] investigated the impact of COVID-19 on the economy and environment in three United States cities (Washington, D.C.; Chicago; and Los Angeles) and found a decline in the economic sector resulting from increased levels of poverty and unemployment; however, an improvement in air quality was observed. A study conducted in China reports similar findings [37]. Roberts [38] tracked the impact of the pandemic on economic activity (GDP) in Morocco at the national and regional levels and in some cities. The findings indicated a large percentage decline in NTL intensity particularly in March 2020 at all levels compared with the pre-pandemic period. NTL intensity slightly increased during the post-pandemic period, but it is still lower than pre-pandemic [38].
Different containment measures were implemented in response to the COVID-19 pandemic. One of the most effective of these was the closure of workplaces and remote working. Shao et al. [1] utilized NTL data to analyze work resumption in Wuhan, China, from January 2020 to August 2020 and concluded that although there was an increase in the NTL brightness after the end of lockdown, the recovery had not reached the pre-pandemic level. Tian et al. [39] investigated levels of work resumption in some provinces and cities in China by using different datasets to develop a work-resumption index. They found an increase of 70% in the work-resumption index in most cities [39].
We suggest that some dimensions have not been fully taken into account in the previous studies. First, the application of NTL data in studying COVID-19 consequences has mostly been undertaken in developed countries and China. The influence of COVID-19 varies from place to place and depends on the economic, social, environmental, religious and urban context [32,40]. Arabian, Middle Eastern and Gulf countries have received little attention in these studies. This research addresses this gap through the selection of a study area with different socioeconomic characteristics compared to previous research. Second, it is clear that Visible and Infrared Imaging Suite Day–Night Band (VIIRS-DNB) data are less affected by light saturation, as adjacent NTL pixels have similar brightness particularly in central populated areas, unlike the Defense Meteorological Program Operational Line-Scan System (DSMP-OLS) data [41]. However, it is still subject to the overglow effect due to sky brightness resulted from the built-up areas [42], and this uncertainty leads to various statistical and spatial challenges. Thus, inaccurate results and conclusions could be drawn from analysis of NTL data if the overglow effect is not addressed. This research will mitigate the overglow effect in the NTL data by using fine ancillary land-use/cover data. In other words, we propose an improved NTL index in response to overglow uncertainty.
This paper aims to (1) propose a new index that integrates NTL and fine bare-land-cover data, to be called Bare Adjusted NTL Index (BANTLI); and (2) use BANTLI to quantify spatiotemporal changes associated with resumption of religious rituals and socioeconomic activity during the post-pandemic period in Makkah and Madinah cities. Millions of pilgrims from different countries visit Makkah city for Hajj and Umrah rituals and Madinah city for Ziarah (Hajj and Umrah pilgrims who visit the Prophet’s City and Mosque). According to Saudi Arabia’s General Authority of Statistics (GAS), the numbers of Hajj and Umrah pilgrims in 2019 were 2.5 and 19 million, respectively [7,43]. As mentioned earlier, a key factor to prevent the spread of COVID-19 is social distancing, which aims to reduce physical contact between people. For these reasons, the Saudi government suspended these religious rituals for nearly 240 days, causing multiple indirect difficulties for Muslim countries and direct difficulties in Saudi Arabia, with particular economic impacts in Makkah and Madinah. These two cities thus serve as a particularly important study area.

2. Materials and Methods

2.1. Study Area

The Kingdom of Saudi Arabia has a leading role among the Islamic countries because Islam originated from this land, as well as having a major economic position as the largest oil producer in the world. Saudi Arabia consists of 13 provinces. Makkah and Madinah cities are located in the western part of the Kingdom (Figure 1), and their province administrative boundaries are called by their names. The latitude and longitude of Makkah are 21°25′52.979″ N and 39°48′29.573″ E, and they are 24°27′35.751″ N and 39°36′53.543″ E for Madinah. Both are religious cities and receive a special status from the Saudi government for many considerations. Makkah includes the first house of worship (Kaaba), the Holy Mosque, and is the birthplace of Prophet Mohammed. Makkah covers an area of 1400 km2 and has a population of 1.7 million, according to the 2010 census. Madinah includes the first mosque in Islam (Quba Mosque) and the Prophet’s Mosque and Tomb. Madinah has an area of 2600 km2 with a total population of 1.2 million, based on the 2010 census. The religious characteristics of these cities make them the principal destinations for Muslims across the world, especially during the festivals of Ramadan and Dhul Hijjah.

2.2. Data

2.2.1. Nighttime Satellite Data

This study used the VNP46A2 dataset (https://ladsweb.modaps.eosdis.nasa.gov/search/, (accessed on 2 December 2021)), obtained from the Visible Infrared Imaging Radiometer Suite (VIIRS) suite on board the Suomi National Polar-Orbiting Partnership (Suomi-NPP) satellite platform that crossed the equator at about 1:30 am, the second of the two VNP46 products released using the Black Marble Algorithm. The precursor to VNP46A2, known as VNP46A1, contains top-of-atmosphere (TOA) radiance values and requires extensive processing to reduce noise due to extraneous artifacts. By contrast, VNP46A2 applies the novel “Turn off the moon” methodology to remove such artifacts. Specifically, the use of the Bidirectional Reflectance Distribution Function (BRDF), a radiometry-based lunar irradiance model, and a linearized radiative transfer model [44], among other techniques, has led to a significant improvement, especially in images affected by noise. The dataset is available as hierarchical data format files and contains seven layers, known as Science Data Sets, with 15 arc-second and 16-bit geospatial and radiometric resolutions, respectively. The wavelength of the day/night band (DNB) starts from 500 nm to 900 nm, making it sensitive to detect low light. In this study, we used the BRDF-corrected and Mandatory_Quality_Flag layers.

2.2.2. Land-Use/Cover Data

Information on land use/cover data is essential for various spatial applications such as desertification, drought, land surface temperature, tsunami, land degradation, population mapping, etc. As a result of the huge development in satellite and computer technologies, remotely sensed satellite-sensor data have become one of the most important and effective sources of producing land-use/cover data [45]. Freely available satellite data encourage global organizations and research centers to produce global land-use/cover data at no cost to end users. Since the 1990s, global land cover (GLC) data have been introduced at different spatial and temporal resolutions [46], such as Moderate Resolution Imaging Spectroradiometer (MODIS) land cover provided by the National Aeronautics and Space Administration (NASA), GlobeLand30 provided by the National Geomatics Center of China and recently ESRI Land Cover 2020 provided by the Environmental Systems Research Institute (ESRI) and ESA WorldCover 2020 provided by the European Space Agency (ESA).
The ESA WorldCover 2020 product (https://worldcover2020.esa.int/downloader), accessed on 25 September 2021, has recently been utilized in studies such as those by Ekim et al. [45]; Salama et al. [47] and Tavus et al. [48]. The product was based on Sentinel-1 and Sentinel-2 satellite data acquired in 2020 and derived 11 generic land-cover classes at a 10 m spatial resolution, with an overall accuracy of 74% at the global level and 81% at the Asia level [49]. The bare/sparse vegetation land cover has producer’s and user’s accuracies of 91% and 89%, respectively, at the Asia level [49].
Impervious surface area (ISA) refers to man-made features such as buildings, roads and parking lots that block surface water from infiltrating into the ground [50]. The ISA and NTL data have the common characteristic that they are both closely related to anthropogenic activities and socioeconomic development [51], and thus they are positively correlated to each other [52]. Moreover, NTL data have been widely utilized as a proxy to estimate ISA [53,54]. A global ISA product called “GISD30” (https://zenodo.org/record/5220816#.YkrYONtByUk (accessed on 4 March 2022)) [50], from 1985 to 2020, with an interval of 5 years, was produced by Zhang et al. [50]. They reported that ISA was produced at a 30 m spatial resolution, using time-series Landsat data, and the overall accuracy and Kappa statistic were 92% and 0.87, respectively [50]. The 2020 data were downloaded and used here for validation.

2.2.3. Socioeconomic Data and Administrative Boundaries

Socioeconomic data for Saudi Arabia were provided by the General Authority for Statistics (GAS), including censuses, field surveys and collections of statistical data from other Saudi agencies. Statistical information and reports for Hajj (https://www.stats.gov.sa/ar/28 (accessed on 5 February 2022)) and Umrah (https://www.stats.gov.sa/ar/862 (accessed on 5 February 2022)) pilgrims were downloaded from the GAS website (https://www.stats.gov.sa/ (accessed on 5 February 2022)) from 2016 to 2021. The monthly averaged traffic data at the entrance points for Makkah and Madinah cities were requested from the Ministry of Transport and Logistic Services (MOT). Monthly averaged flight data in King Abdulaziz International Airport (KAIA), the nearest airport to Makkah city, and Prince Mohammed Bin Abdulaziz International Airport (PMBAIA), located in Madinah city, were obtained from the General Authority of Civil Aviation (GACA). All socioeconomic data were downloaded or obtained in Excel format. City-level and ward-level administrative boundaries of Makkah and Madinah cities were obtained as GIS layers from Makkah and Madinah Municipalities.

2.3. Bare Adjusted NTL Index (BANTLI)

The raw NTL (VIIRS-BNB) data effectively overcome the saturation uncertainty compared with the DMSP-OLS and are able to detect the spatial heterogeneity of socioeconomic development. However, the overglow uncertainty is still an issue. The majority of studies [11,32,33] has shown the effectiveness of NTL imagery in evaluating the socioeconomic effects caused by the COVID-19 pandemic. However, no one has highlighted the overglow uncertainty of the NTL data within urban areas prior to studying the impact of the COVID-19 virus. The overglow phenomenon comprises unpopulated lit areas that are located both outside and within the built-up area. The former has been addressed by using a threshold-based approach [1,30,37], whereas the latter has been addressed by utilizing different approaches including point of interest (POI) and land surface temperature (LST) [55], Normalized Difference Vegetation Index (NDVI) [56], Normalized Difference Water Index (NDWI) and Normalized Difference Built-up Index (NDBI) [57]. The widely utilized POI dataset is collected by volunteers and can lead to uncertainties regarding data quality and distribution. Moreover, the NDVI and NDWI are most applicable in areas with abundant vegetation and water covers.
Lights generally reflect socioeconomic development, with a large proportion of urban, built-up and impervious surface and a small proportion of bare land, vegetation and water covers. In this research, a novel Bare Adjusted NTL Index (BANTLI), clarified in Section 2.5, was constructed based on a fine bare-land-cover class to mitigate the overglow impact in the NTL data. The rationale behind BANTLI is dependent on the intuitive fact that bare land and nighttime lights are inversely correlated. In most arid or semi-arid regions, Gulf countries and some developing countries, the process of urban development, as well as the weak follow-up of urban development policies, results in the existence of bare land within urban areas [24]. In the context of NTL data, bare land within the urban areas (city boundary) leads to (i) a decrease in mean NTL brightness, (ii) an increase in the total summation of NTL brightness and (iii) an exaggeration of the extent of the illuminated urban areas when reported for any administrative boundaries. This, in turn, may influence the results and conclusions.
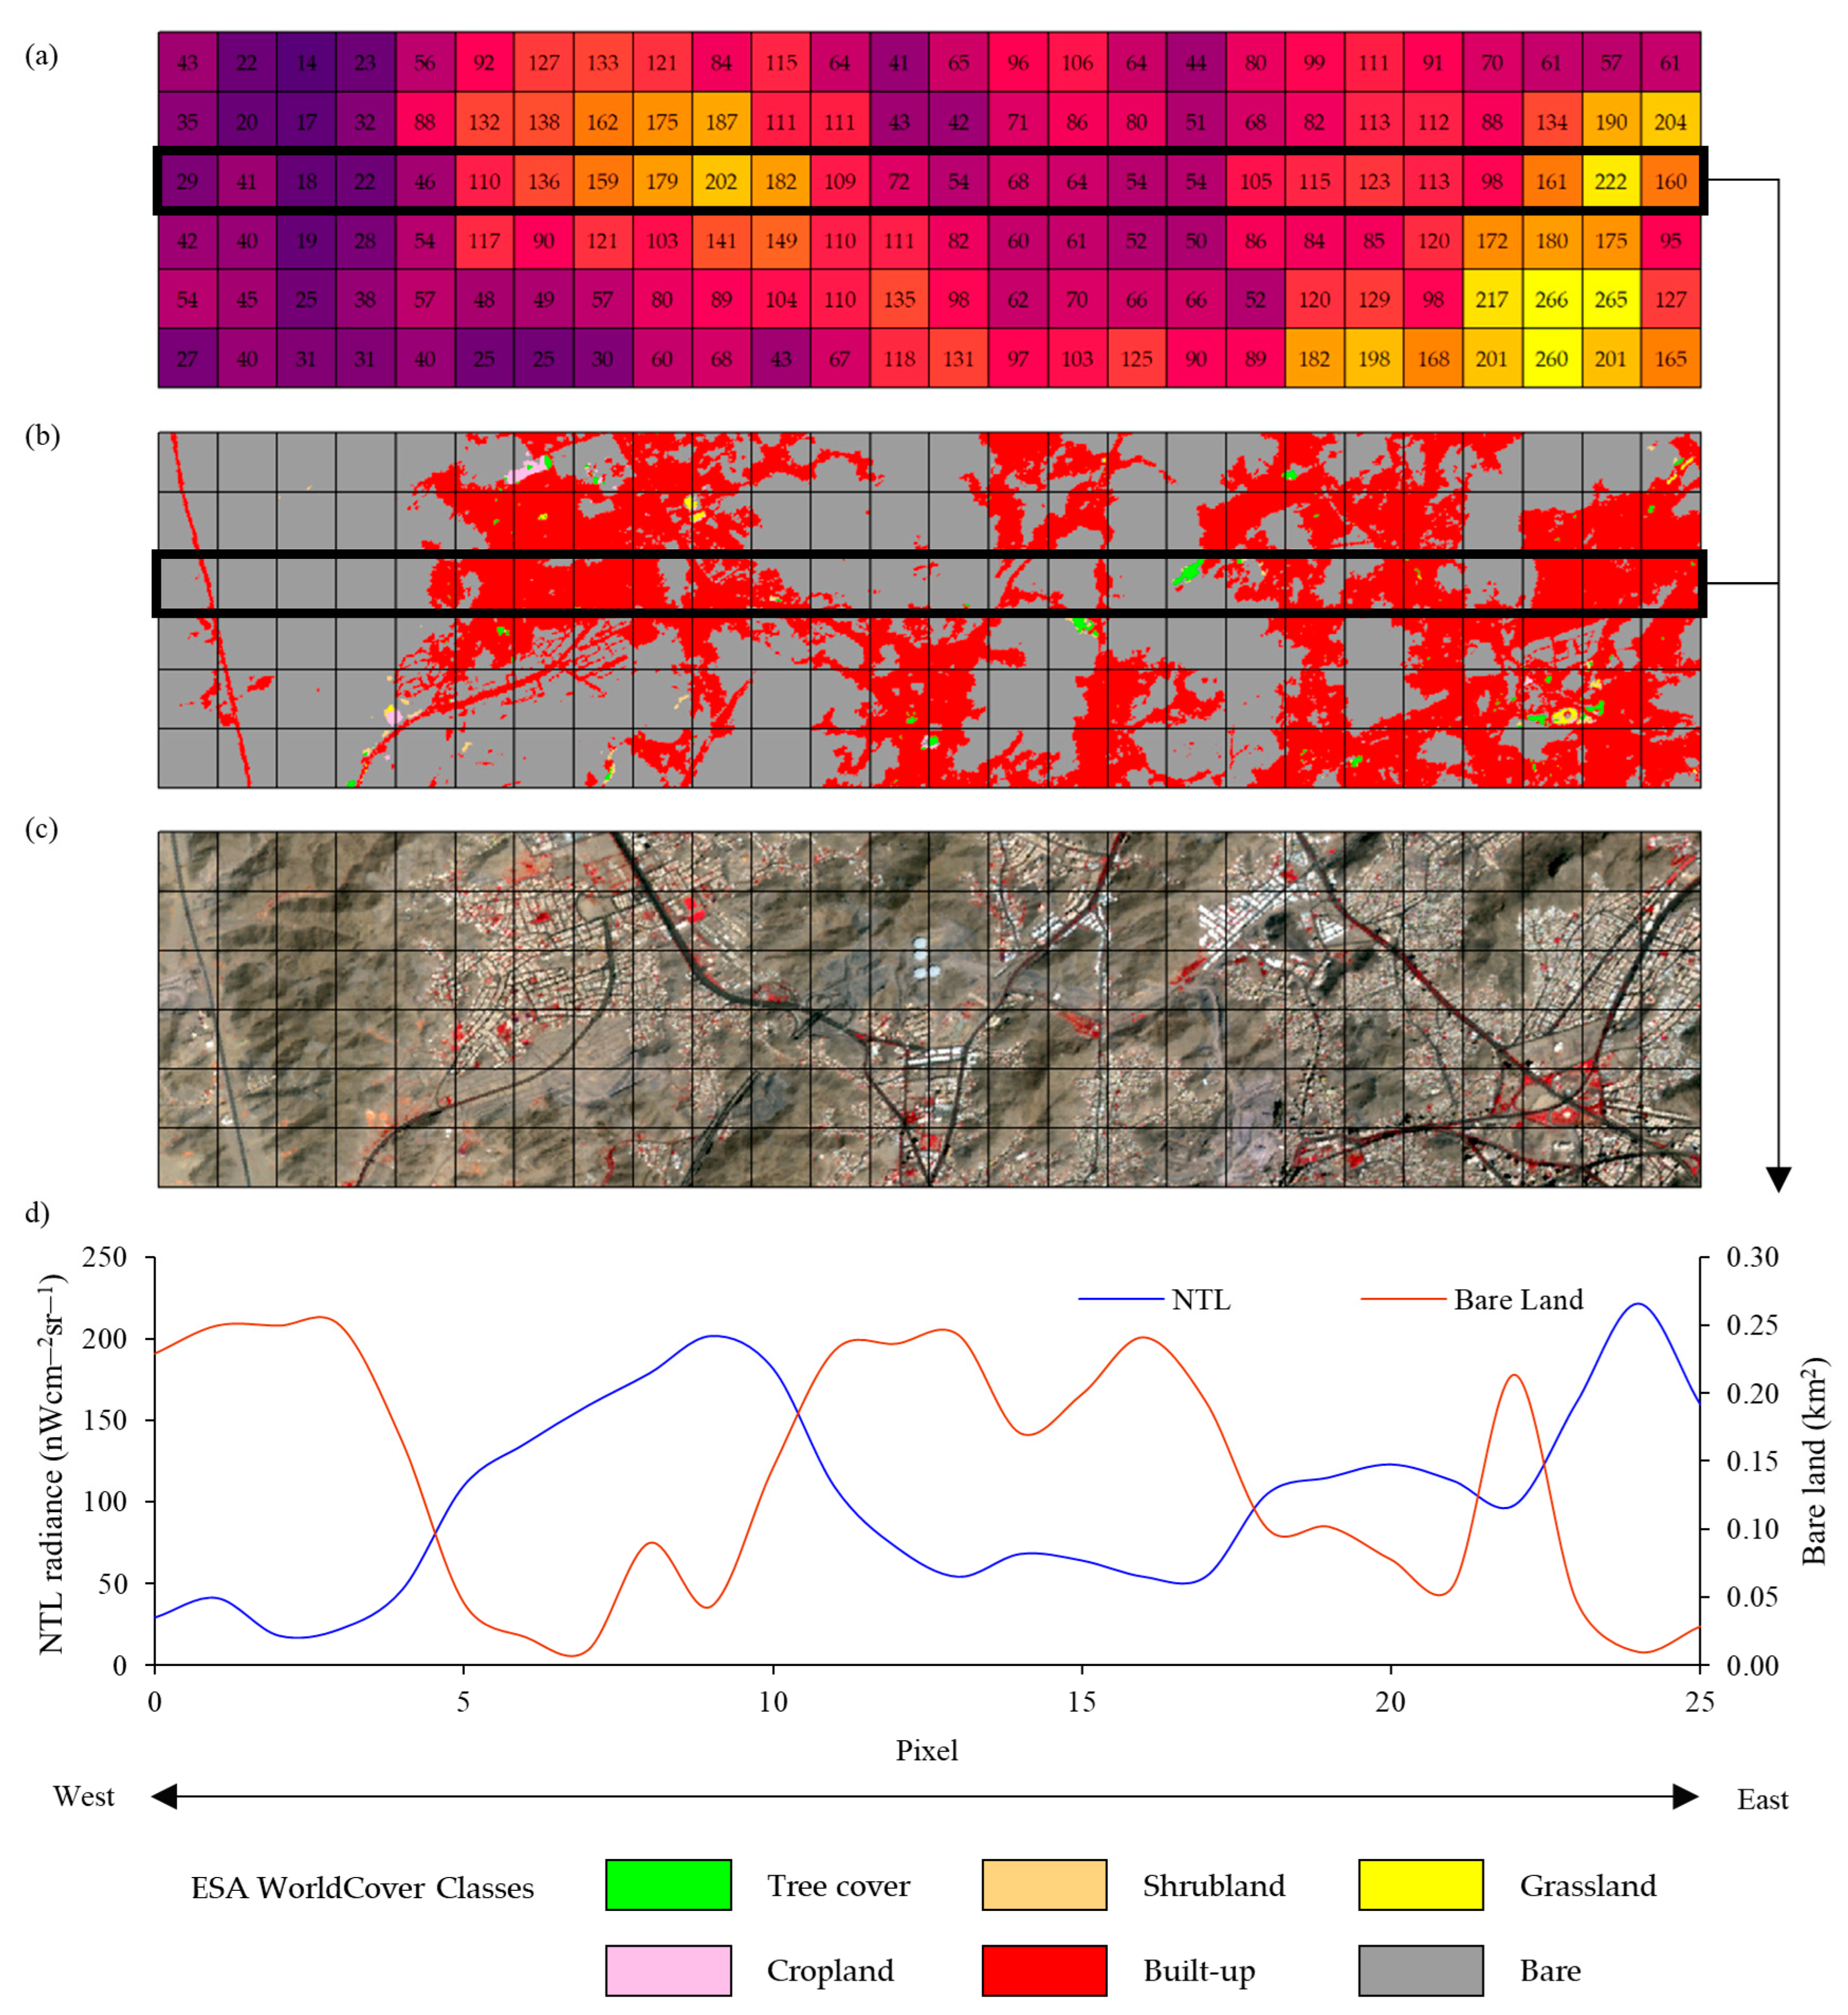
Figure 2 shows the spatial distribution of the NTL data (Figure 2a), ESA WorldCover 2020 (Figure 2b), Sentinel-2 image (Figure 2c) and a latitudinal transect of the bare-land areas and NTL intensity (Figure 2d). The figure covers a rectangular area (13,000 m × 500 m) in the north part of Makkah, outlined by the bold black line. Figure 2d shows evidence of the inverse relationship between NTL brightness and bare-land areas. For example, in locations (6 to 10) and (23 to 25), urban areas are dominant, and bare land is sparse. The NTL brightness in location 9 is 202 nWcm−2sr−1 associated with bare-land areas of 0.04 km2.

2.4. Procedures of Hajj and Umrah Resumption

The Saudi government suspended Umrah rituals for nearly 8 months and significantly restricted the number of Hajj pilgrims in 2021. An approval was issued before the end of 2020 for the gradual resumption of religious rituals according to certain conditions. For example, booking an appointment to perform the religious rituals required use of the “Eatmarna Application”, a mobile application that allows pilgrims to obtain permission for Umrah and Ziarah at a specific day and time, complying with the health instructions and requirements, including receiving vaccination, wearing a mask, maintaining a safe distance and not touching other people. Table 1 shows the arrangements and stages of the gradual return of the religious rituals over various time periods. For example, D0 and D0-2 in Table 1 refer to target and reference dates, respectively; moreover, the “0” subscript indicates the period number (0 to 13), and the “−2” subscript indicates an interval of two years prior. The 2-year period was used to span the pandemic and post-pandemic periods. The choice of specific period start and end dates reflects the start and end dates of the Islamic months in order to achieve the goal of the study, to assess the impacts of resumption of religious festivals. This explains the apparent mismatch between Gregorian calendar target and reference dates. Moreover, we did not use a single reference date like other studies have [1,30,32]; instead, different reference dates were utilized to be able to compare pilgrimage months with pilgrimage months.

2.5. Data Processing

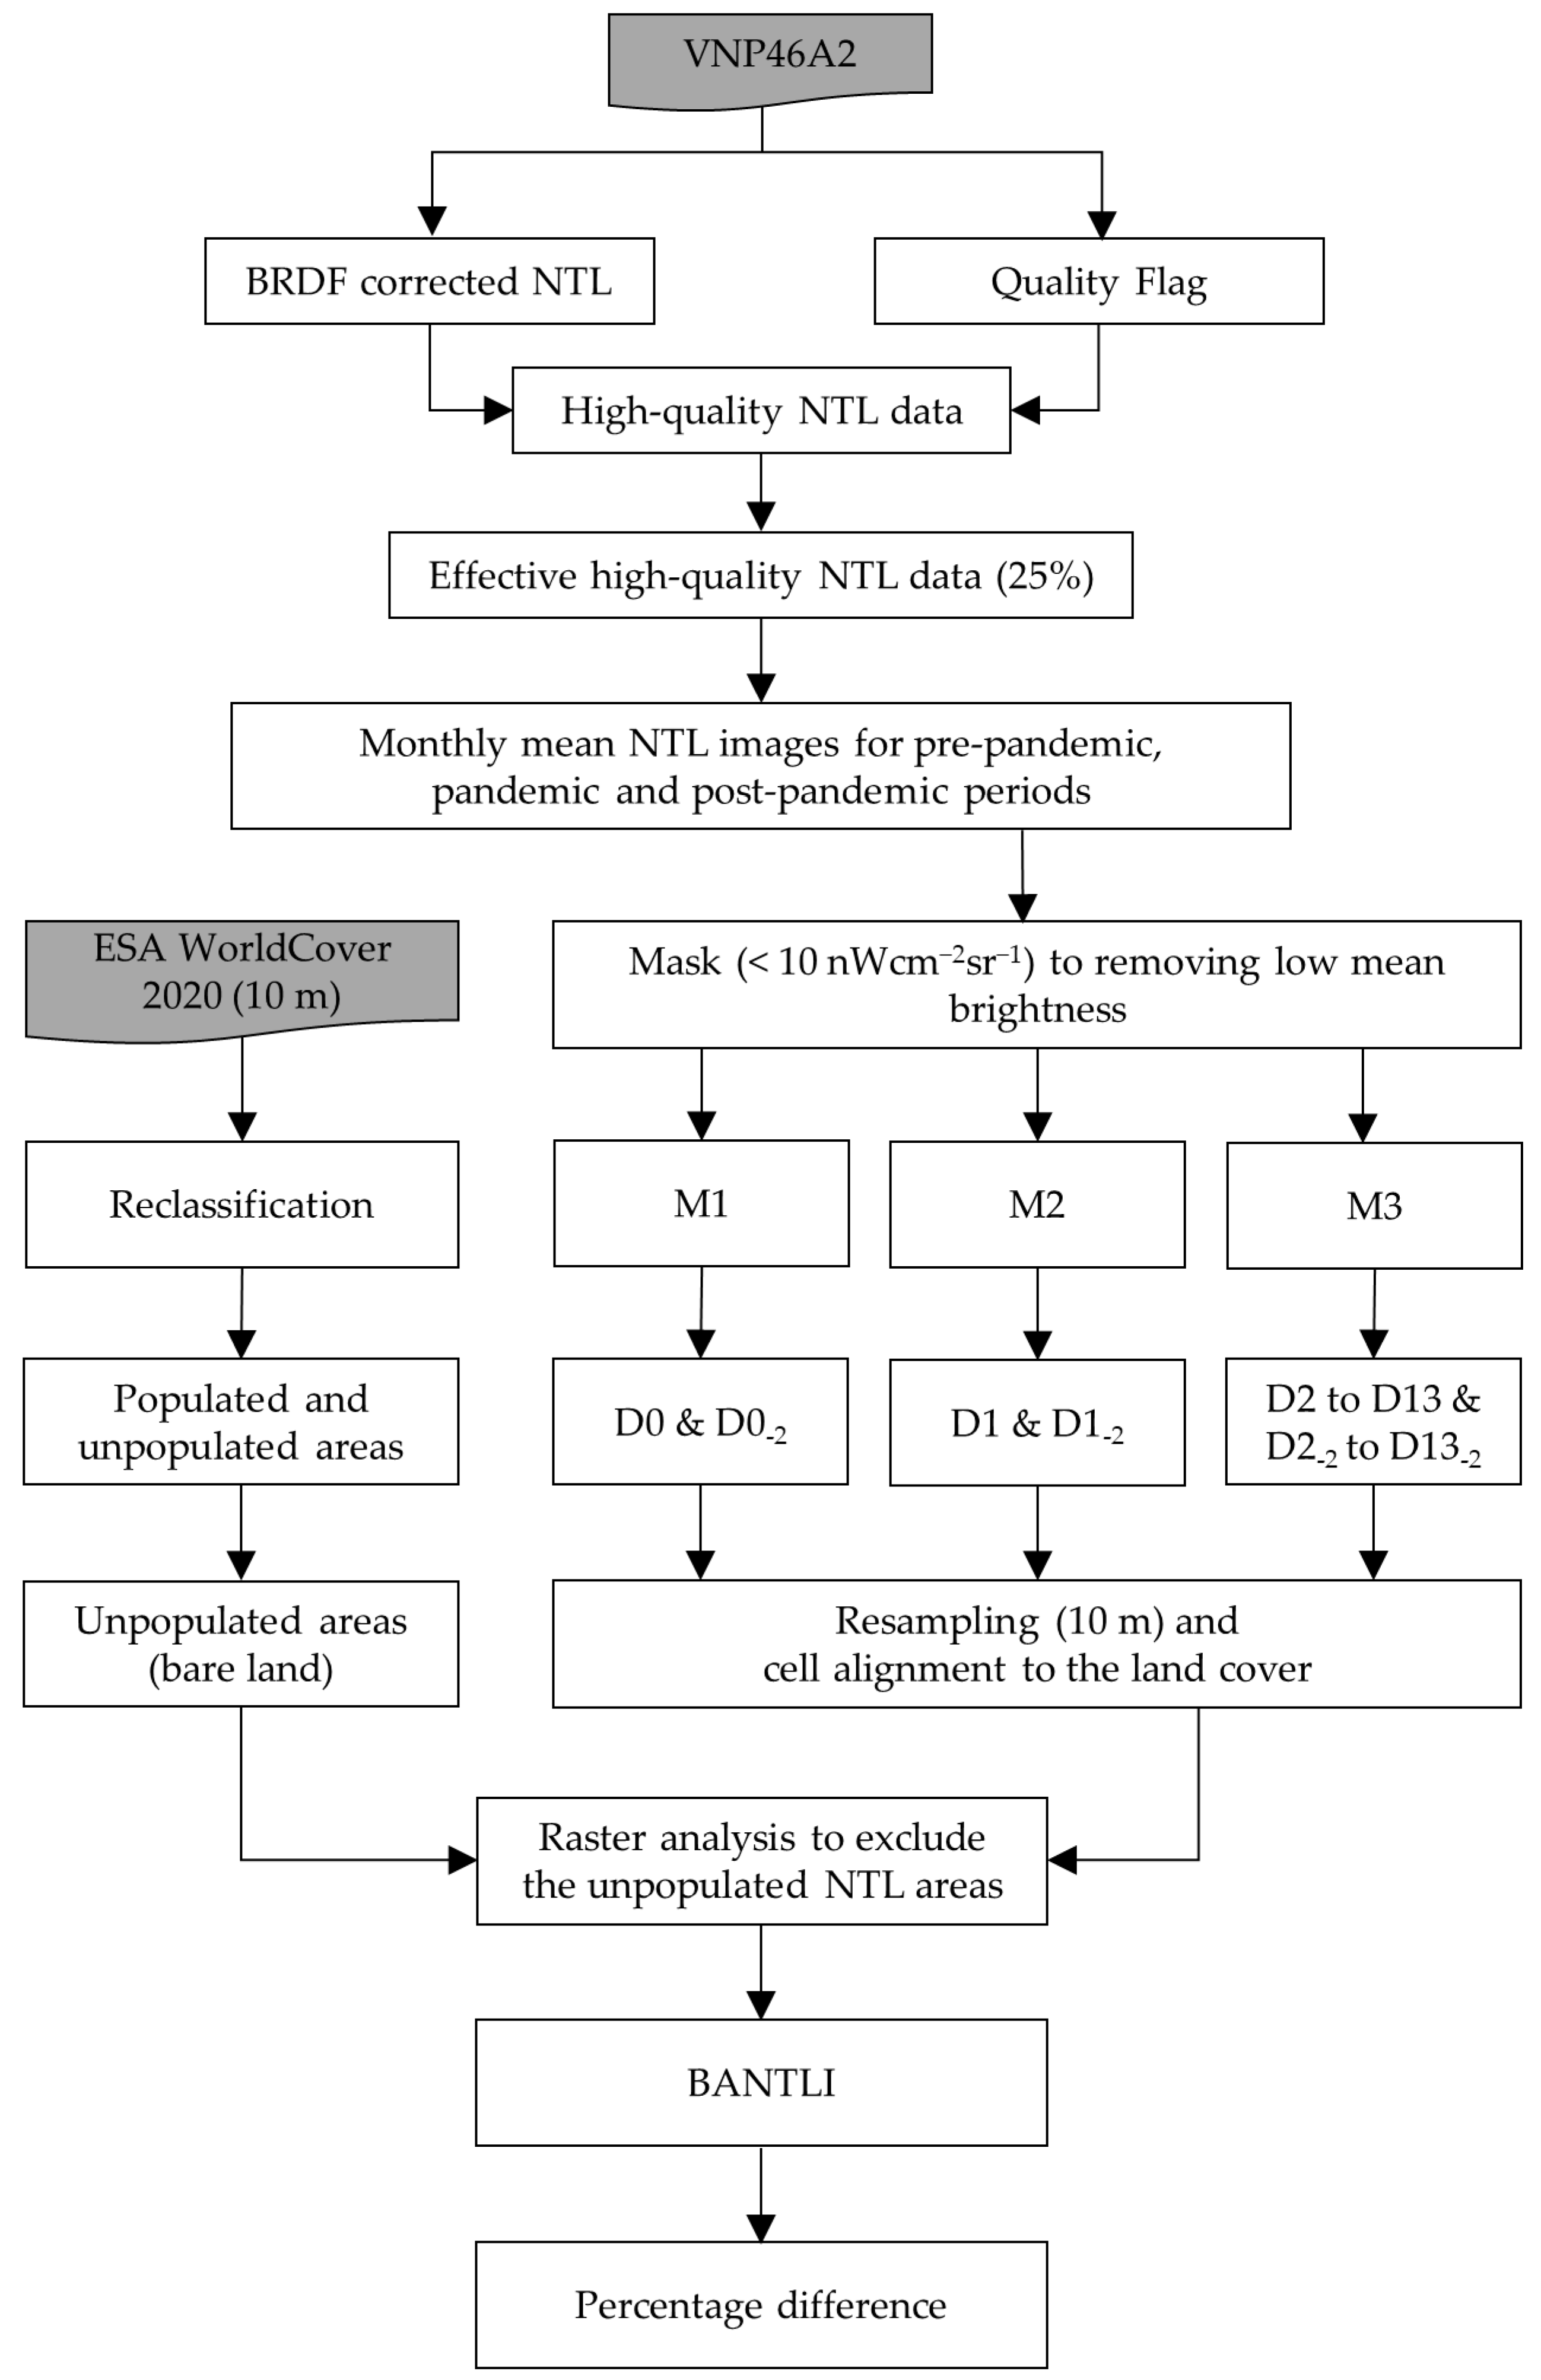
(1) High-quality nighttime pixels: Various factors such as clouds, moonlight, stray light and other ephemeral lights impact the actual amount of artificial light that is reflected from the earth’s surface [44], causing the light to increase, decrease, disappear or blur [58]. Thus, the raw NTL data need to be processed prior to the analysis. These challenges were addressed by using the BNB_BRDF-Corrected_NTL layer included in the VNP46A2 product and enhanced using the Mandatory_Quality_Flag (MQF) layer to retrieve only high-quality nighttime pixels (coded as 00). Then high-quality NTL pixels that covered more than or equal to 25% of the periods in Table 1 were extracted and referred to as effective high-quality NTL pixels [33]. The mean was then calculated for each month (Figure 3).
(2) Low mean brightness: The unpopulated areas located outside urban areas are mainly represented by vegetation cover (e.g., in Europe countries) and bare land cover (e.g., in Gulf countries). Logically, these areas should not reflect any light. However, this is not the case because low-mean brightness values are reflected from these areas. Although the mean brightness values are low, when they are summed up over extensive administrative zones, statistical calculations such as sum, mean or standard deviation give inaccurate results. Thus, unpopulated areas located outside urban areas are a source of uncertainty. A threshold approach [31,37] has been shown to be efficient in tackling this uncertainty. Therefore, different thresholds were examined, and a threshold value of <10 nWcm−2sr−1 was chosen as most appropriate to exclude the NTL pixels with low-mean brightness values. Three binary on–off masks (M1, M2 and M3; see Table 2) were created based on the assumption that (i) unpopulated NTL pixels at a later period (i.e., October 2018) would not have been populated at an earlier period (i.e., October 2016) prior to the pandemic and during the post-pandemic periods and (ii) unpopulated NTL pixels immediately prior to the pandemic would not alter much during the pandemic. M1 was produced based on D0 to eliminate all unpopulated NTL pixels in D0 and D0-2 NTL imagery, whereas M2 was created based on a month just before the COVID-19 pandemic and used to remove all unpopulated NTL pixels in D1 and D1-2. M3 was produced dependent on D13 to exclude all unpopulated NTL pixels in D2 to D13 and D2-2 to D13-2.
(3) Implementing BANTLI: As a result of the rapid development in satellite technologies, satellite data are available with different spatial, temporal, spectral and radiometric features, each with certain advantages and disadvantages. Using only one type of satellite data may not be sufficient to achieve a specific goal; thus, remote-sensing data fusion (RSDF) may be helpful. RSDF is a powerful technique that aims to maximize the advantages of various satellite data in order to derive a new product (fused data) that provides more useful detailed information than the individual input data sources [59]. In this research, NTL and ESA WorldCover 2020 satellite data were utilized, having different spatial resolutions. To facilitate the integration of these data, the 500 m NTL data spatial resolution was resampled, using the nearest neighbor algorithm, and aligned to the 10 m spatial resolution of ESA WorldCover 2020. The ESA WorldCover 2020 was then reclassified into unpopulated areas (bare-land class) and populated areas (the remaining classes). The reclassified ESA WorldCover 2020, unpopulated and populated areas (coded as 0 and 1 respectively), was overlaid with the NTL data to derive a new product named Bare Adjusted NTL Index (BANTLI). BANTLI solves the overglow uncertainty of the NTL data inside the urban areas through (i) excluding the unpopulated lit areas that are completely covered by the bare-land class and (ii) reducing the size (number of NTL pixels) of the unpopulated lit areas that are partly covered by the bare-land class. On the other hand, the BANTLI does not address the overglow effect within one NTL pixel (500 m).
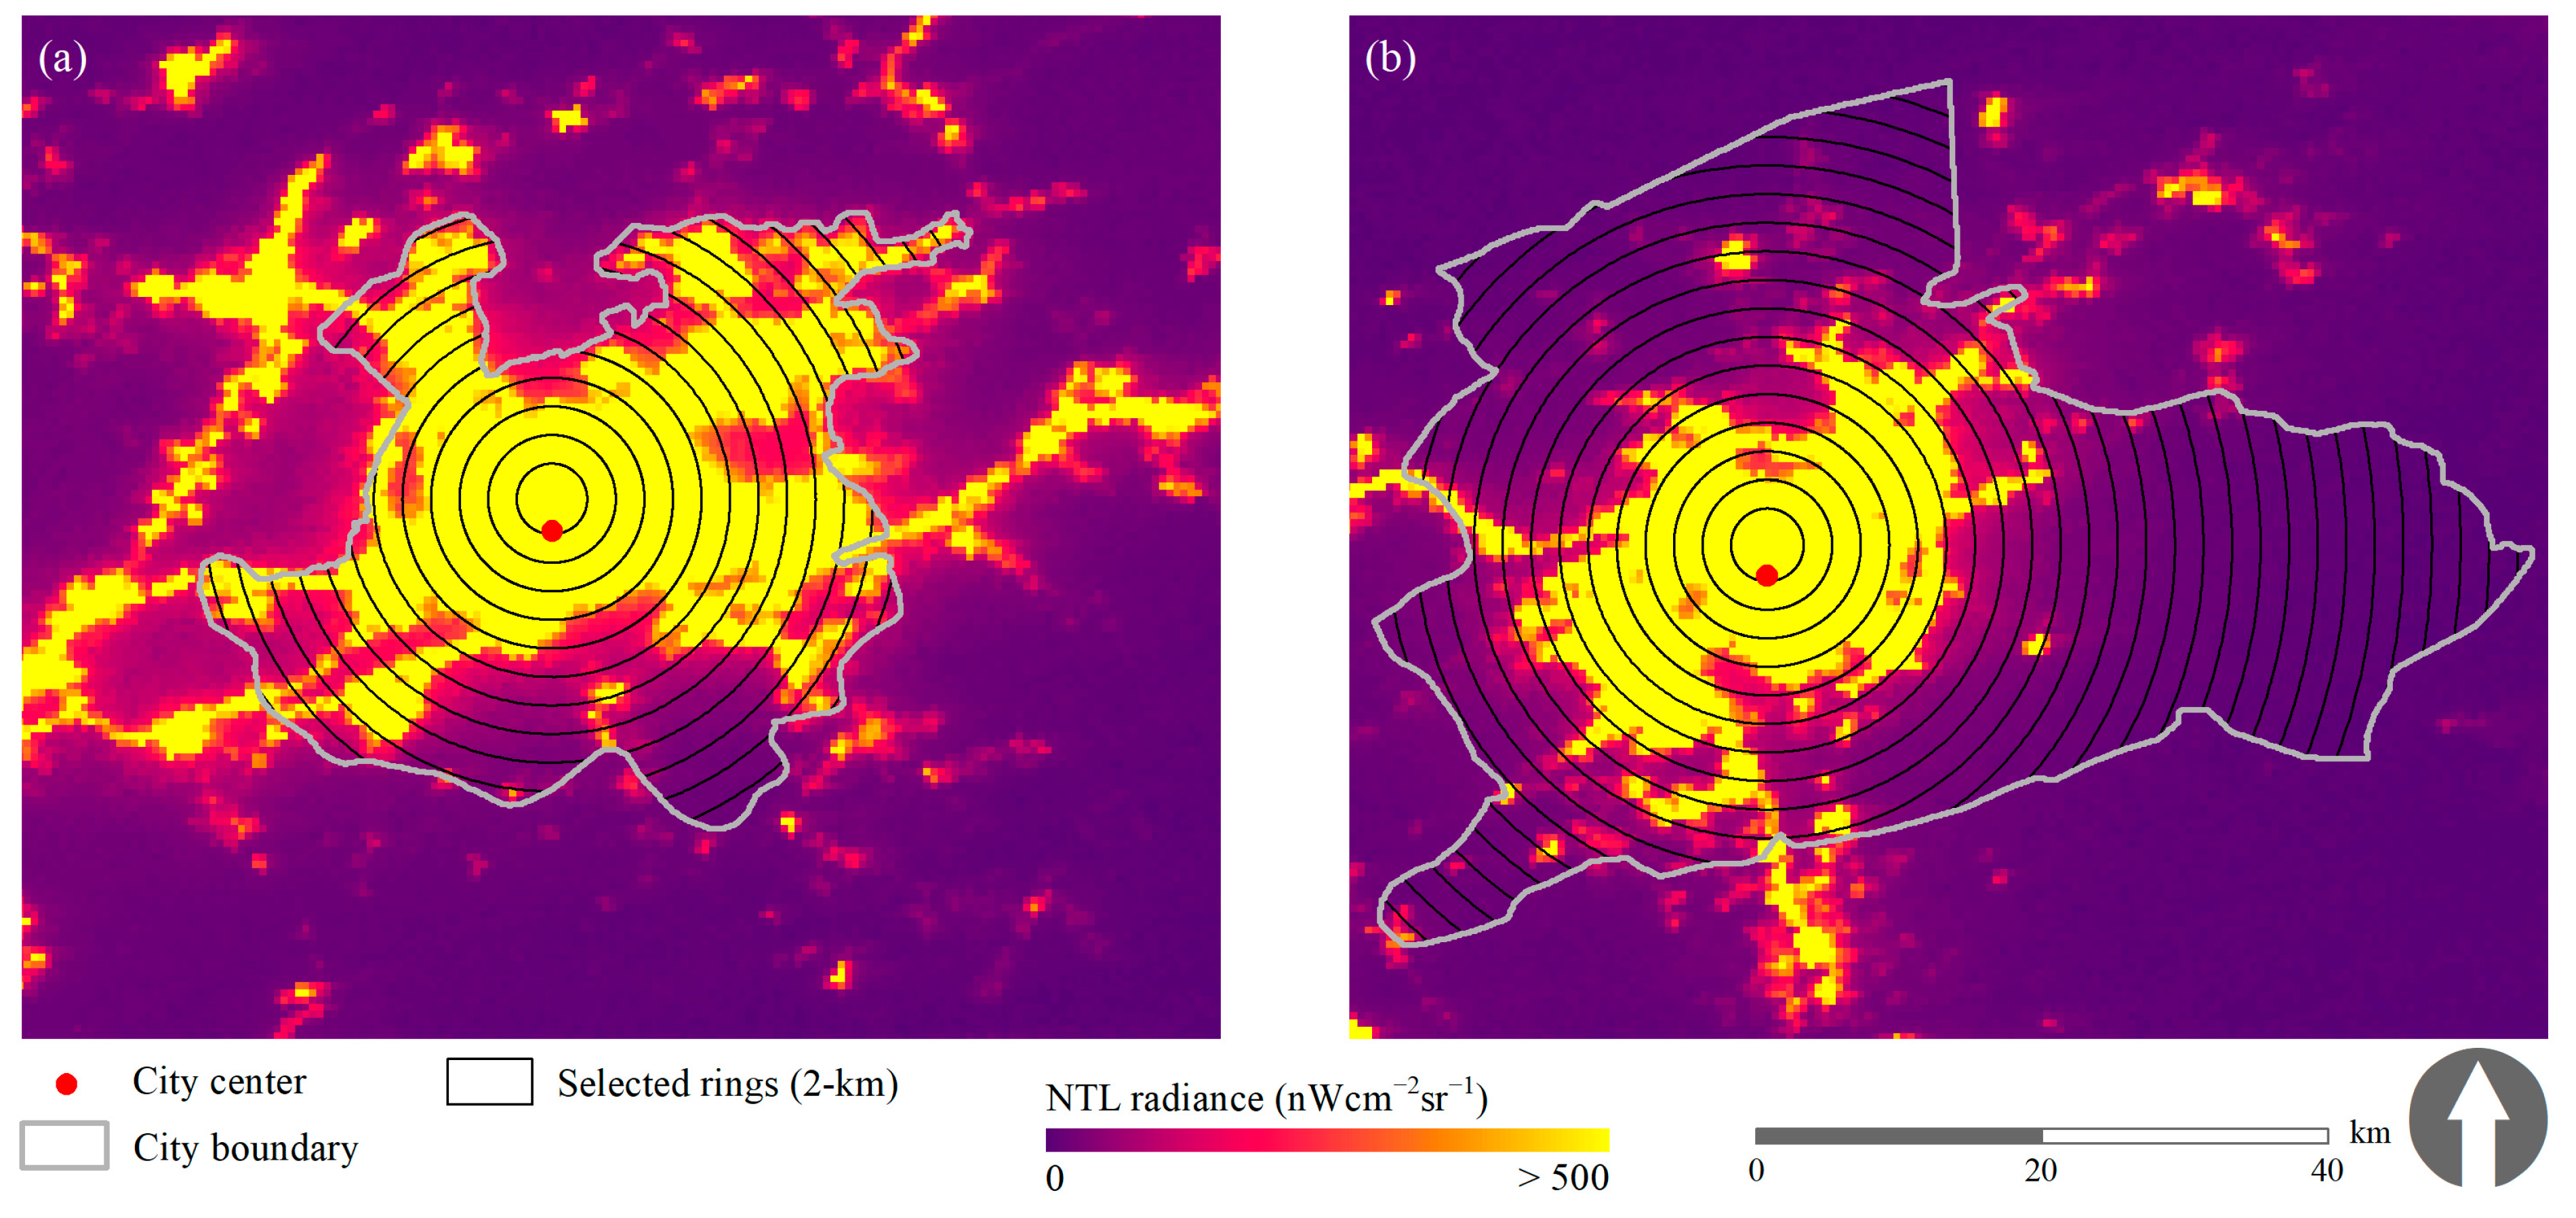
(4) Spatial analysis: In this research, city and ward administrative boundaries are used as the units of spatial analysis. Most socioeconomic activities and inhabitants are concentrated in city centers and decrease as we move away from the center [60]. Therefore, it is useful to investigate the socioeconomic variations in relation to the center of the city. Thus, in addition to analyzing the BANTLI data at the city and ward levels, concentric-ring analysis, which aims to partition the study area into multiple rings with increasing distance from the city center, was also used [61]. In Makkah and Madinah, the Holy Mosque and the Prophet Mosque were selected as the city-center points, respectively. Concentric rings were created from these points with an incrementing radius of 2 km until the whole city boundaries were covered. This results in 17 rings in each city. Figure 4 shows the 2 km concentric rings in Makkah and Madinah.
(5) Statistical calculation: Different statistical calculations were implemented. The total mean values of BANTLI were computed at the city-level and ward-level administrative boundaries before, during and after the COVID-19 pandemic. The percentage difference of the BANTLI radiance was calculated as follows:
P i = ( BANTLI target BANTLI reference BANTLI reference ) × 100
where P i denotes the percentage difference of the BANTLI radiance at the different administrative boundaries; BANTLI target and BANTLI reference refer to the sum mean values of BANTLI during or after (target) and before (reference) the COVID-19 pandemic, respectively; and i th represents the different zones. The smaller (negative) the value of P, the higher the deterioration in the socioeconomic activities during the COVID-19 pandemic or the higher the challenge of recovery during the COVID-19 post-pandemic.
Furthermore, the mean ( D ¯ ) and standard deviation ( σ ) of the BANTLI brightness differences were computed at the concentric rings in order to construct the error bar as follows:
D m = BANTLI target BANTLI reference
D ¯ = 1 n m = 1 n D m
σ = m = 1 n ( D m D ¯ ) 2 n
where D m is the BANTLI brightness difference of pixel m, and n denotes the number of pixels in each ring.

3. Results

3.1. BANTLI vs. NTL

The ISA is used to evaluate BANTLI in two different ways. First, the NTL and BANTLI products are visually compared with the Landsat OLI and the ISA data in Makkah and Madinah (Figure 5). The NTL data indicate the general boundaries of the cities (Figure 5b,f); however, unpopulated areas exist within the built-up areas, and some of these are indicated as black dots (samples) in Figure 5a (1 to 4 samples) and Figure 5e (5 to 8 samples). These unpopulated areas appear to be lit in the NTL product when they should not be. On the other hand, these areas are eliminated in the BANTLI product (Figure 5c,g) in both cities, and, hence, true city structures and street networks are discernible. In addition, it is observable that the spatial extent of the ISA (Figure 5d,h) is more similar to BANTLI than NTL.
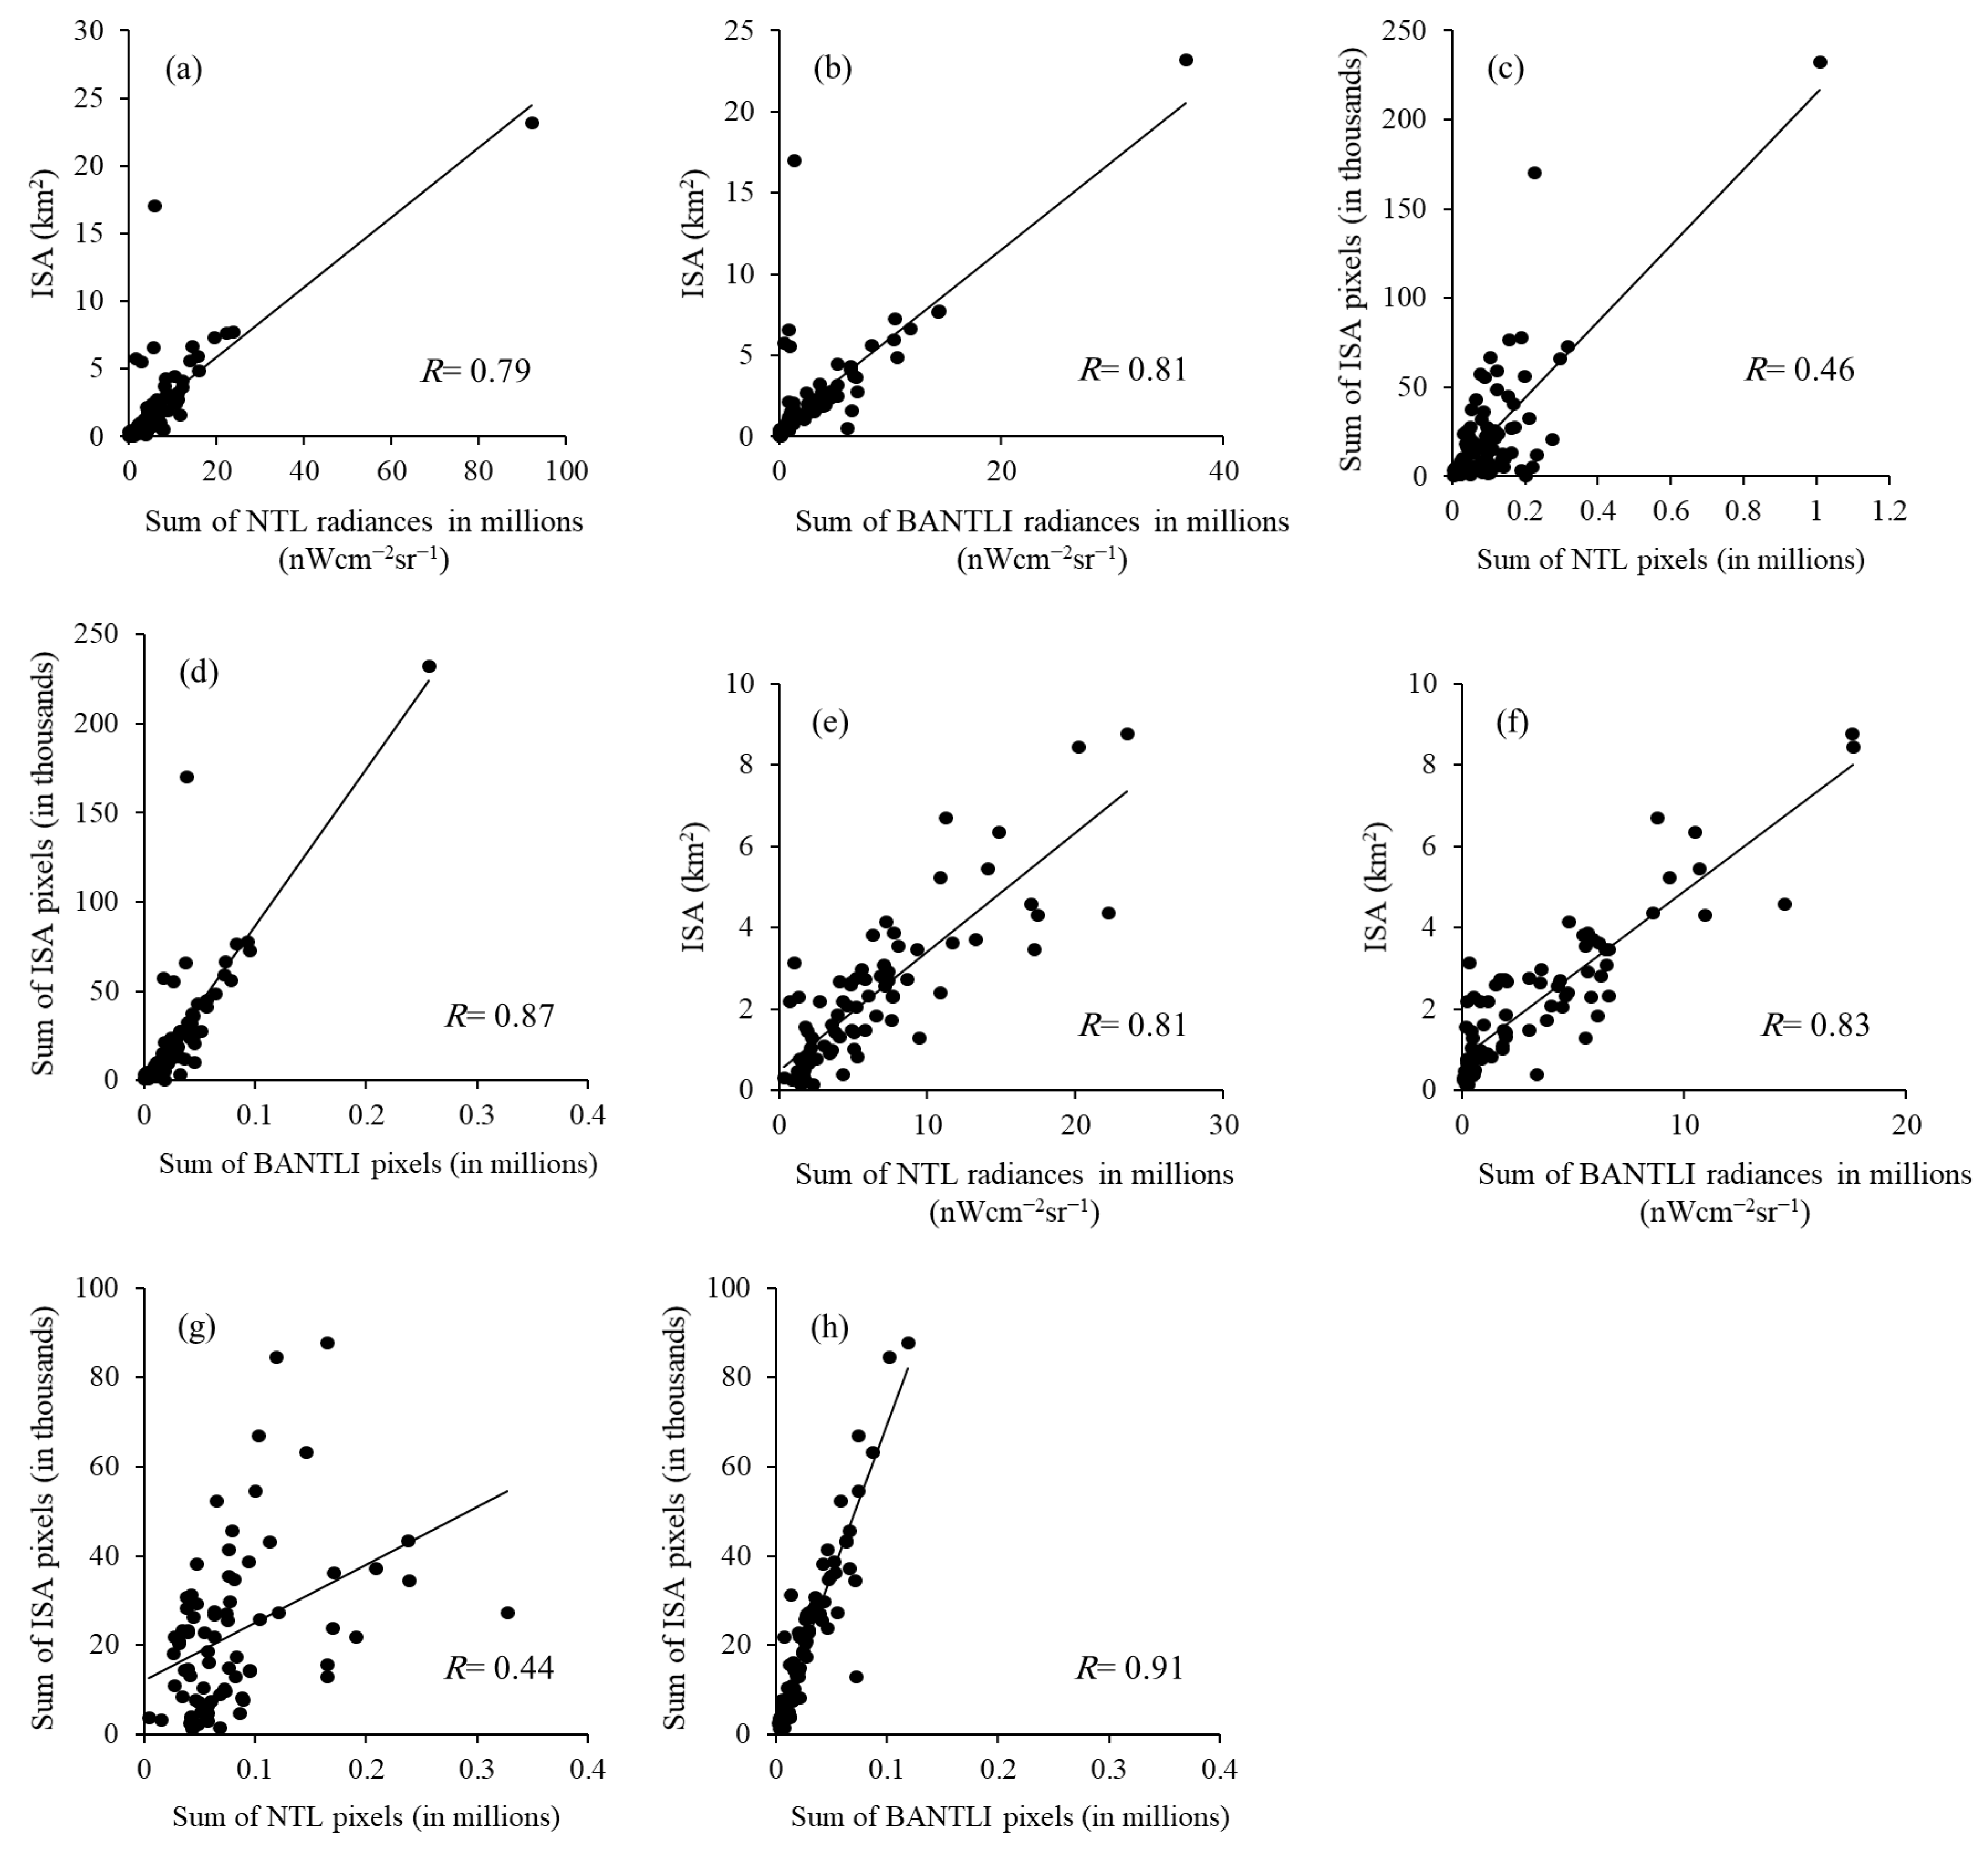
Second, further quantitative comparisons are conducted using Spearman’s correlation (R), as the data are not normally distributed between (i) the ISA area, sum of NTL and BANTLI radiances and (ii) sum of ISA, NTL and BANTLI pixels in Makkah (Figure 6a–d) and Madinah (Figure 6e–h) at the ward level. Figure 6a,b show that the sums of NTL and BANTLI radiances are correlated with the ISA area. with R values of 0.79 and 0.81, respectively, with a slightly higher correlation for BANTLI in Makkah. Similarly, the relationship between the ISA area and BANTLI in Madinah (R = 0.83) is slightly higher than the NTL (R = 0.81). This indicates that excluding the unpopulated lit areas slightly improves the relationship between ISA and BANTLI compared with the NTL. Moreover, there is a larger linear correlation between the sum of ISA pixels and sum of BANTLI pixels in Makkah and Madinah (Figure 6d,h), with R estimates of 0.87 and 0.92, respectively, compared with R estimates of 0.47 and 0.44 (Figure 6c,g), respectively, for the sum of NTL pixels.

3.2. Change of BANTLI Radiances at the City Level

The COVID-19 pandemic not only posed a threat to human life and a challenge to the health sector, but it greatly affected socioeconomic and religious activity globally. For example, the rituals of Hajj, Umrah and Ziarah were suspended for nearly 7 months. On 4 October 2020, the Saudi government lifted these suspensions and allowed a gradual return, subject to certain conditions. The impact of the resumption of religious rituals on socioeconomic recovery was measured by computing the percent change of BANTLI between pairs of images (e.g., D9 and D9-2, as explained in Table 1) during pre-pandemic (P0), pandemic (P1) and post-pandemic (P2 to P13) periods. Change in BANTLI is thus used as a proxy for change in levels of socioeconomic activity.
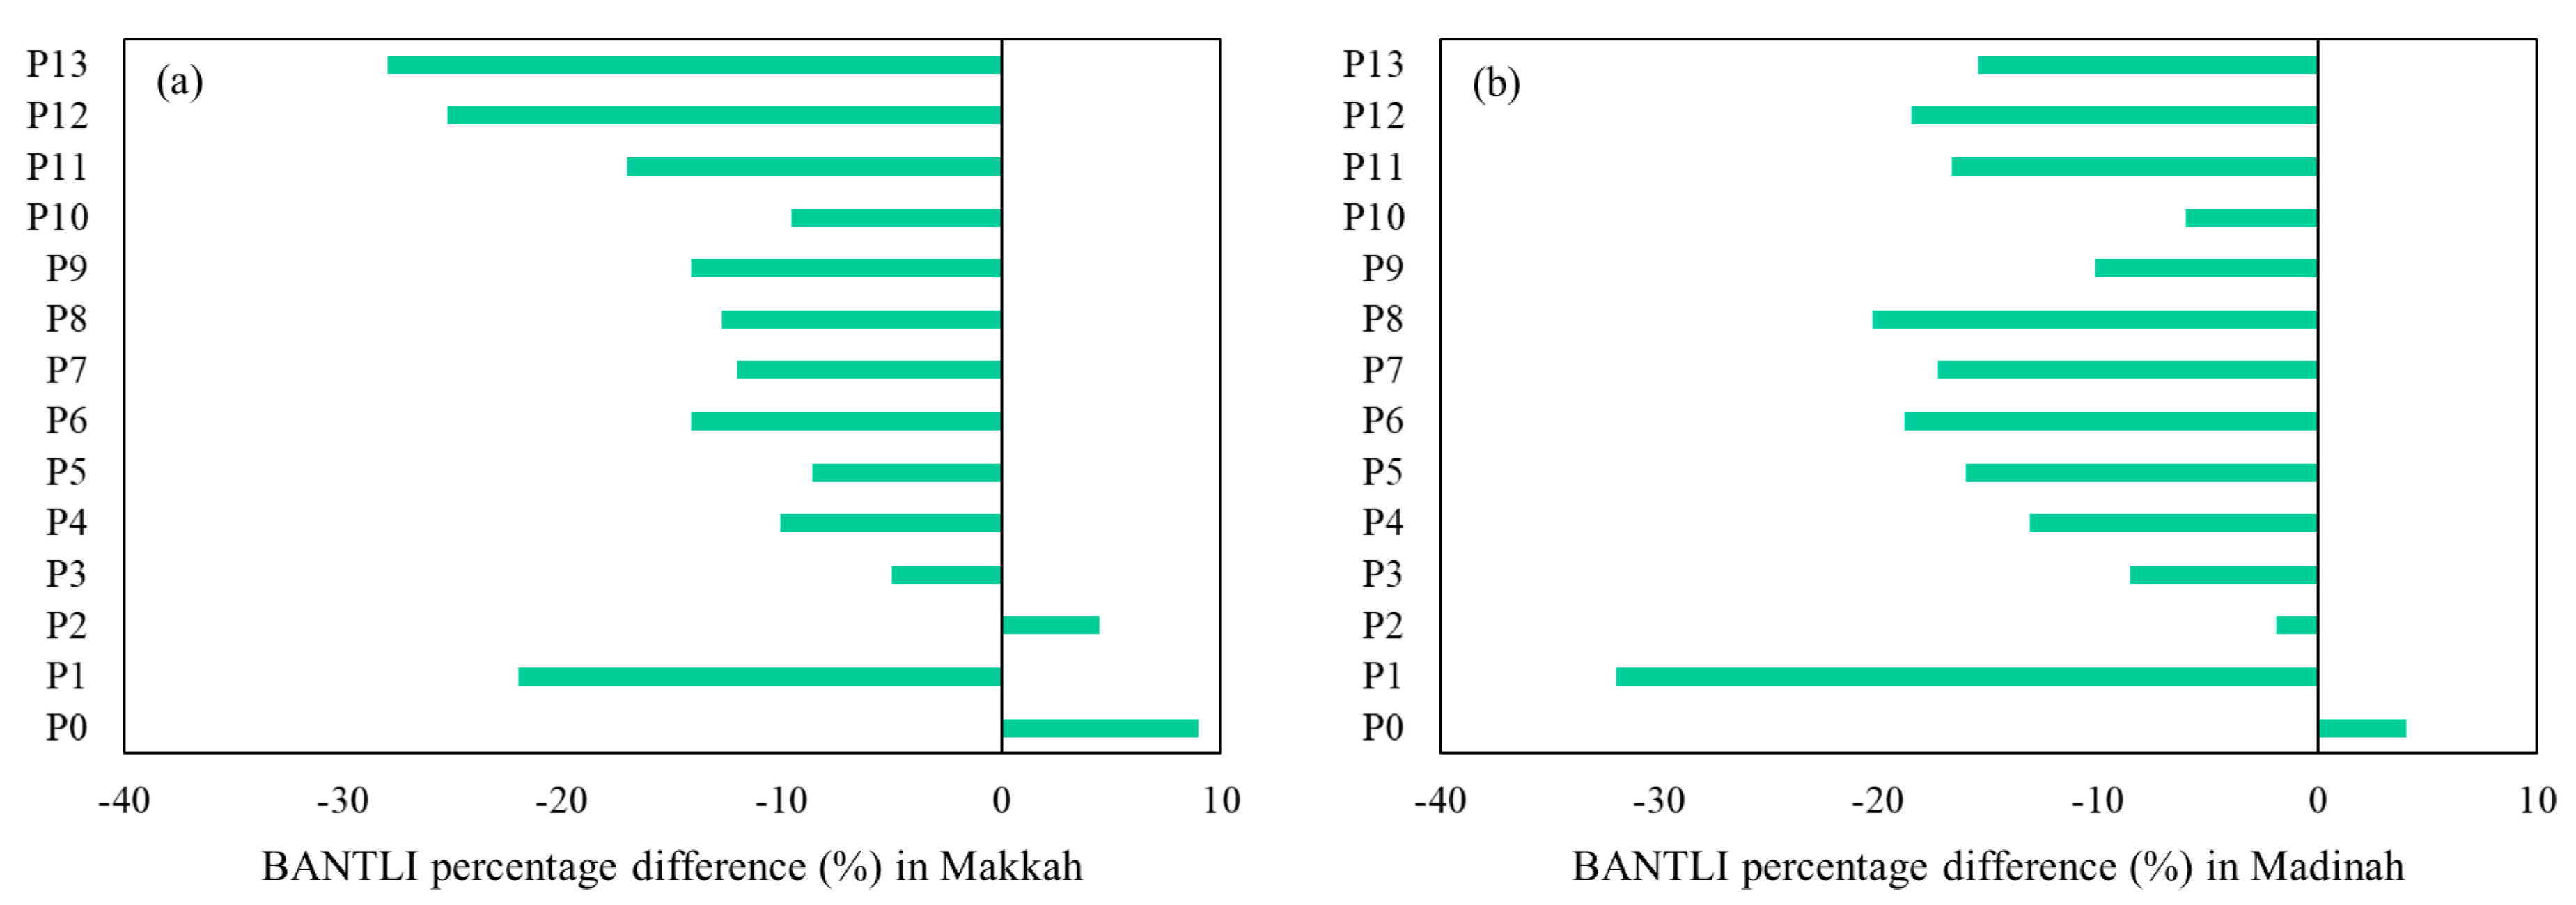
Figure 7 shows the percentage change of BANTLI brightness in Makkah (Figure 7a) and Madinah (Figure 7b) over the different periods. For example, the value at P8 indicates the percentage difference of the BANTLI radiance between D8 (mean target image) and D8-2 (mean reference image), using equation [1], and similarly for the other periods. Generally, it is clear that the preventative measures (P1) caused a drastic increase in the BANTLI percentage difference, reaching −22% and −32% in Makkah (Figure 7a) and Madinah (Figure 7b), respectively. Moreover, the BANTLI percentage difference during the post-pandemic periods (P2 to P13) fluctuated in both cities, and most periods were lower than the pre-pandemic period (P0). For instance, the BANTLI percentage differences during the post-pandemic periods ranged from 9% to −28% (Figure 7a) and from 4% to −32% (Figure 7b) in Makkah and Madinah, respectively. P2 in both cities showed the greatest recovery of all the post-pandemic periods. The BANTLI percentage differences in P12 and P13 (−25% and −28%) in Makkah (Figure 7a) were greater than during the pandemic period (−22%).
Numerous studies have found significant impacts of socioeconomic activity on the transportation system [62,63]. Vehicle and flight information can be used to validate the BANTLI results at the city level. Figure 8 illustrates the percentage differences of some transport indicators among the different periods in Makkah and Madinah. As expected, the implementation of the curfew, city lockdowns and suspension of religious rituals (P1) had a drastic impact on the percentage change in vehicles entering the cities, with a reduction of nearly −80% in both (Figure 8a,b). However, when the suspension of religious rituals was eased in October 2020, the percentage change in vehicles showed a recovery in both cities, but still to below the pre-pandemic level. For instance, the percentage-difference value of cars in Makkah during P0 (pre-pandemic) was 40%, changing to −80% in P1 (pandemic) and −21% in P2 (Figure 8a). A noticeable decrease in the percentage difference of cars compared with the pandemic period occurred in P13 (Makkah, Figure 8a) and P6, P7, P8, P12 and P13 (Madinah, Figure 8b), while P8 is the only period that significantly recovered (22%) almost to the pre-pandemic level (25%).
The percentage differences of flights at King Abdulaziz International Airport (KAIA), close to Makkah (Figure 8c), and Prince Mohammed Bin Abdulaziz International Airport (PMBAIA), in Madinah (Figure 8d), show decrease in flight numbers, ranging between −47% and −58% at KAIA and between −66% and −79% at PMBAIA for the post-pandemic periods compared with −100% in the pandemic period, although we would expect pandemic-induced variations in load factors to have impacted on passenger numbers [64].
These government-collected mobility data provide valuable corroborative evidence of pandemic effects, but they are only available for a small number of point locations and regular temporal divisions. By contrast, NTL data can be selected and aggregated to key pandemic and religious festival dates, to the ward boundaries of most interest to city administrators and to concentric zones which help understand the spatial structure of the cities.
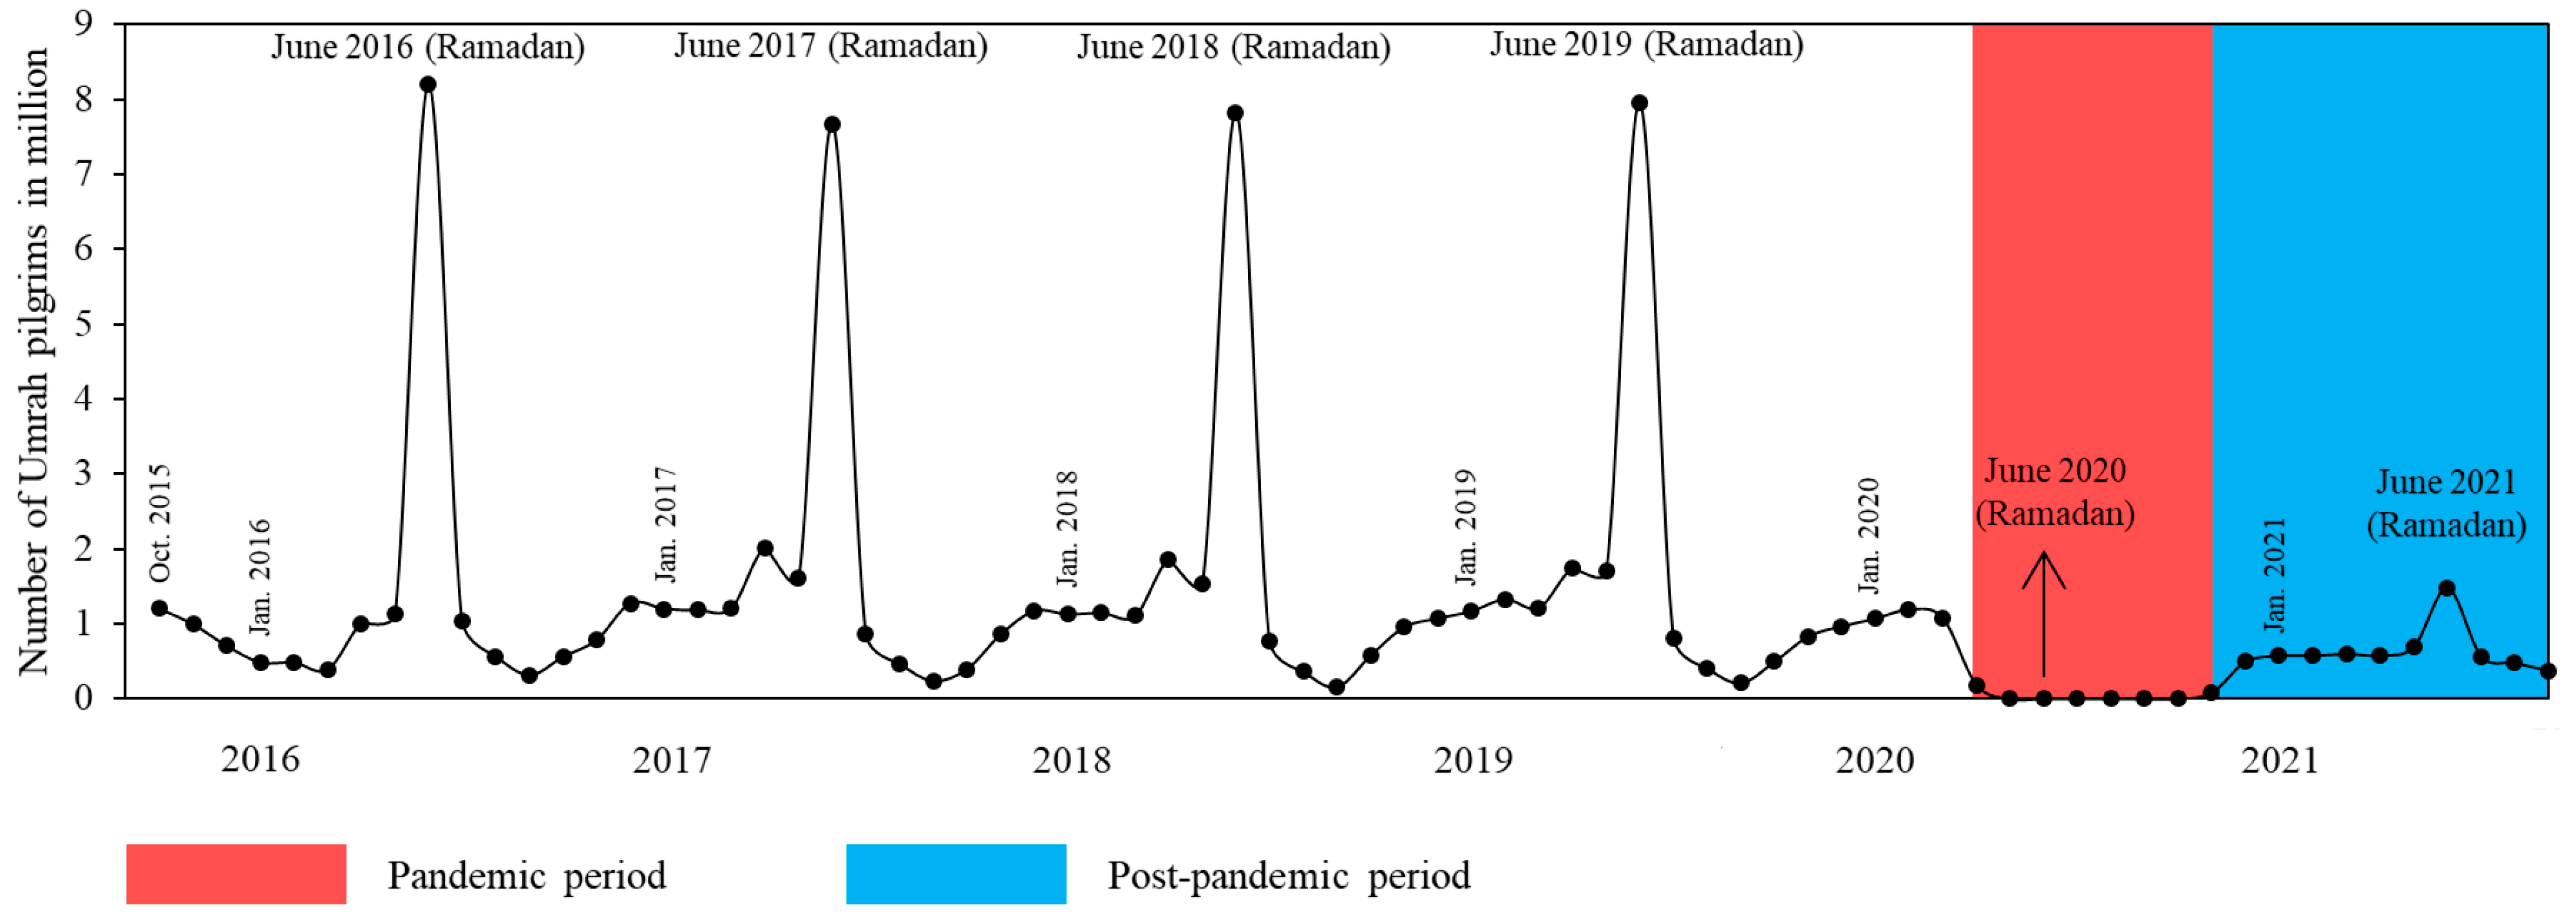
Hajj and Umrah pilgrims and Ziarah are the main source of socioeconomic activity in Makkah and Madinah, as millions of Muslims travel to these cities for religious purposes [65]. Figure 9 shows the monthly temporal profile of Umrah pilgrims, and it is evident that Ramadan is the peak month. The number of Umrah pilgrims exceeded 7 million in Ramadan from 2016 to 2019, compared to less than 2.5 million in other months. Unfortunately, due to the suspension of Umrah rituals, the number of Umrah pilgrims was zero from May 2020 to October 2020. There was an increase in the number of Umrah pilgrims during the post-pandemic periods, but it was still below the pre-pandemic level. Figure 10 shows the annual (sum) temporal profile of Hajj pilgrims, with growth in the number of Hajj pilgrims from 2016 to 2019. This growth significantly decreased in 2020 and 2021 as a result of the COVID-19 pandemic, when the number of Hajj pilgrims was controlled to be 10,000 and 60,000, respectively.

3.3. Change of BANTLI Radiances at the Ward Level

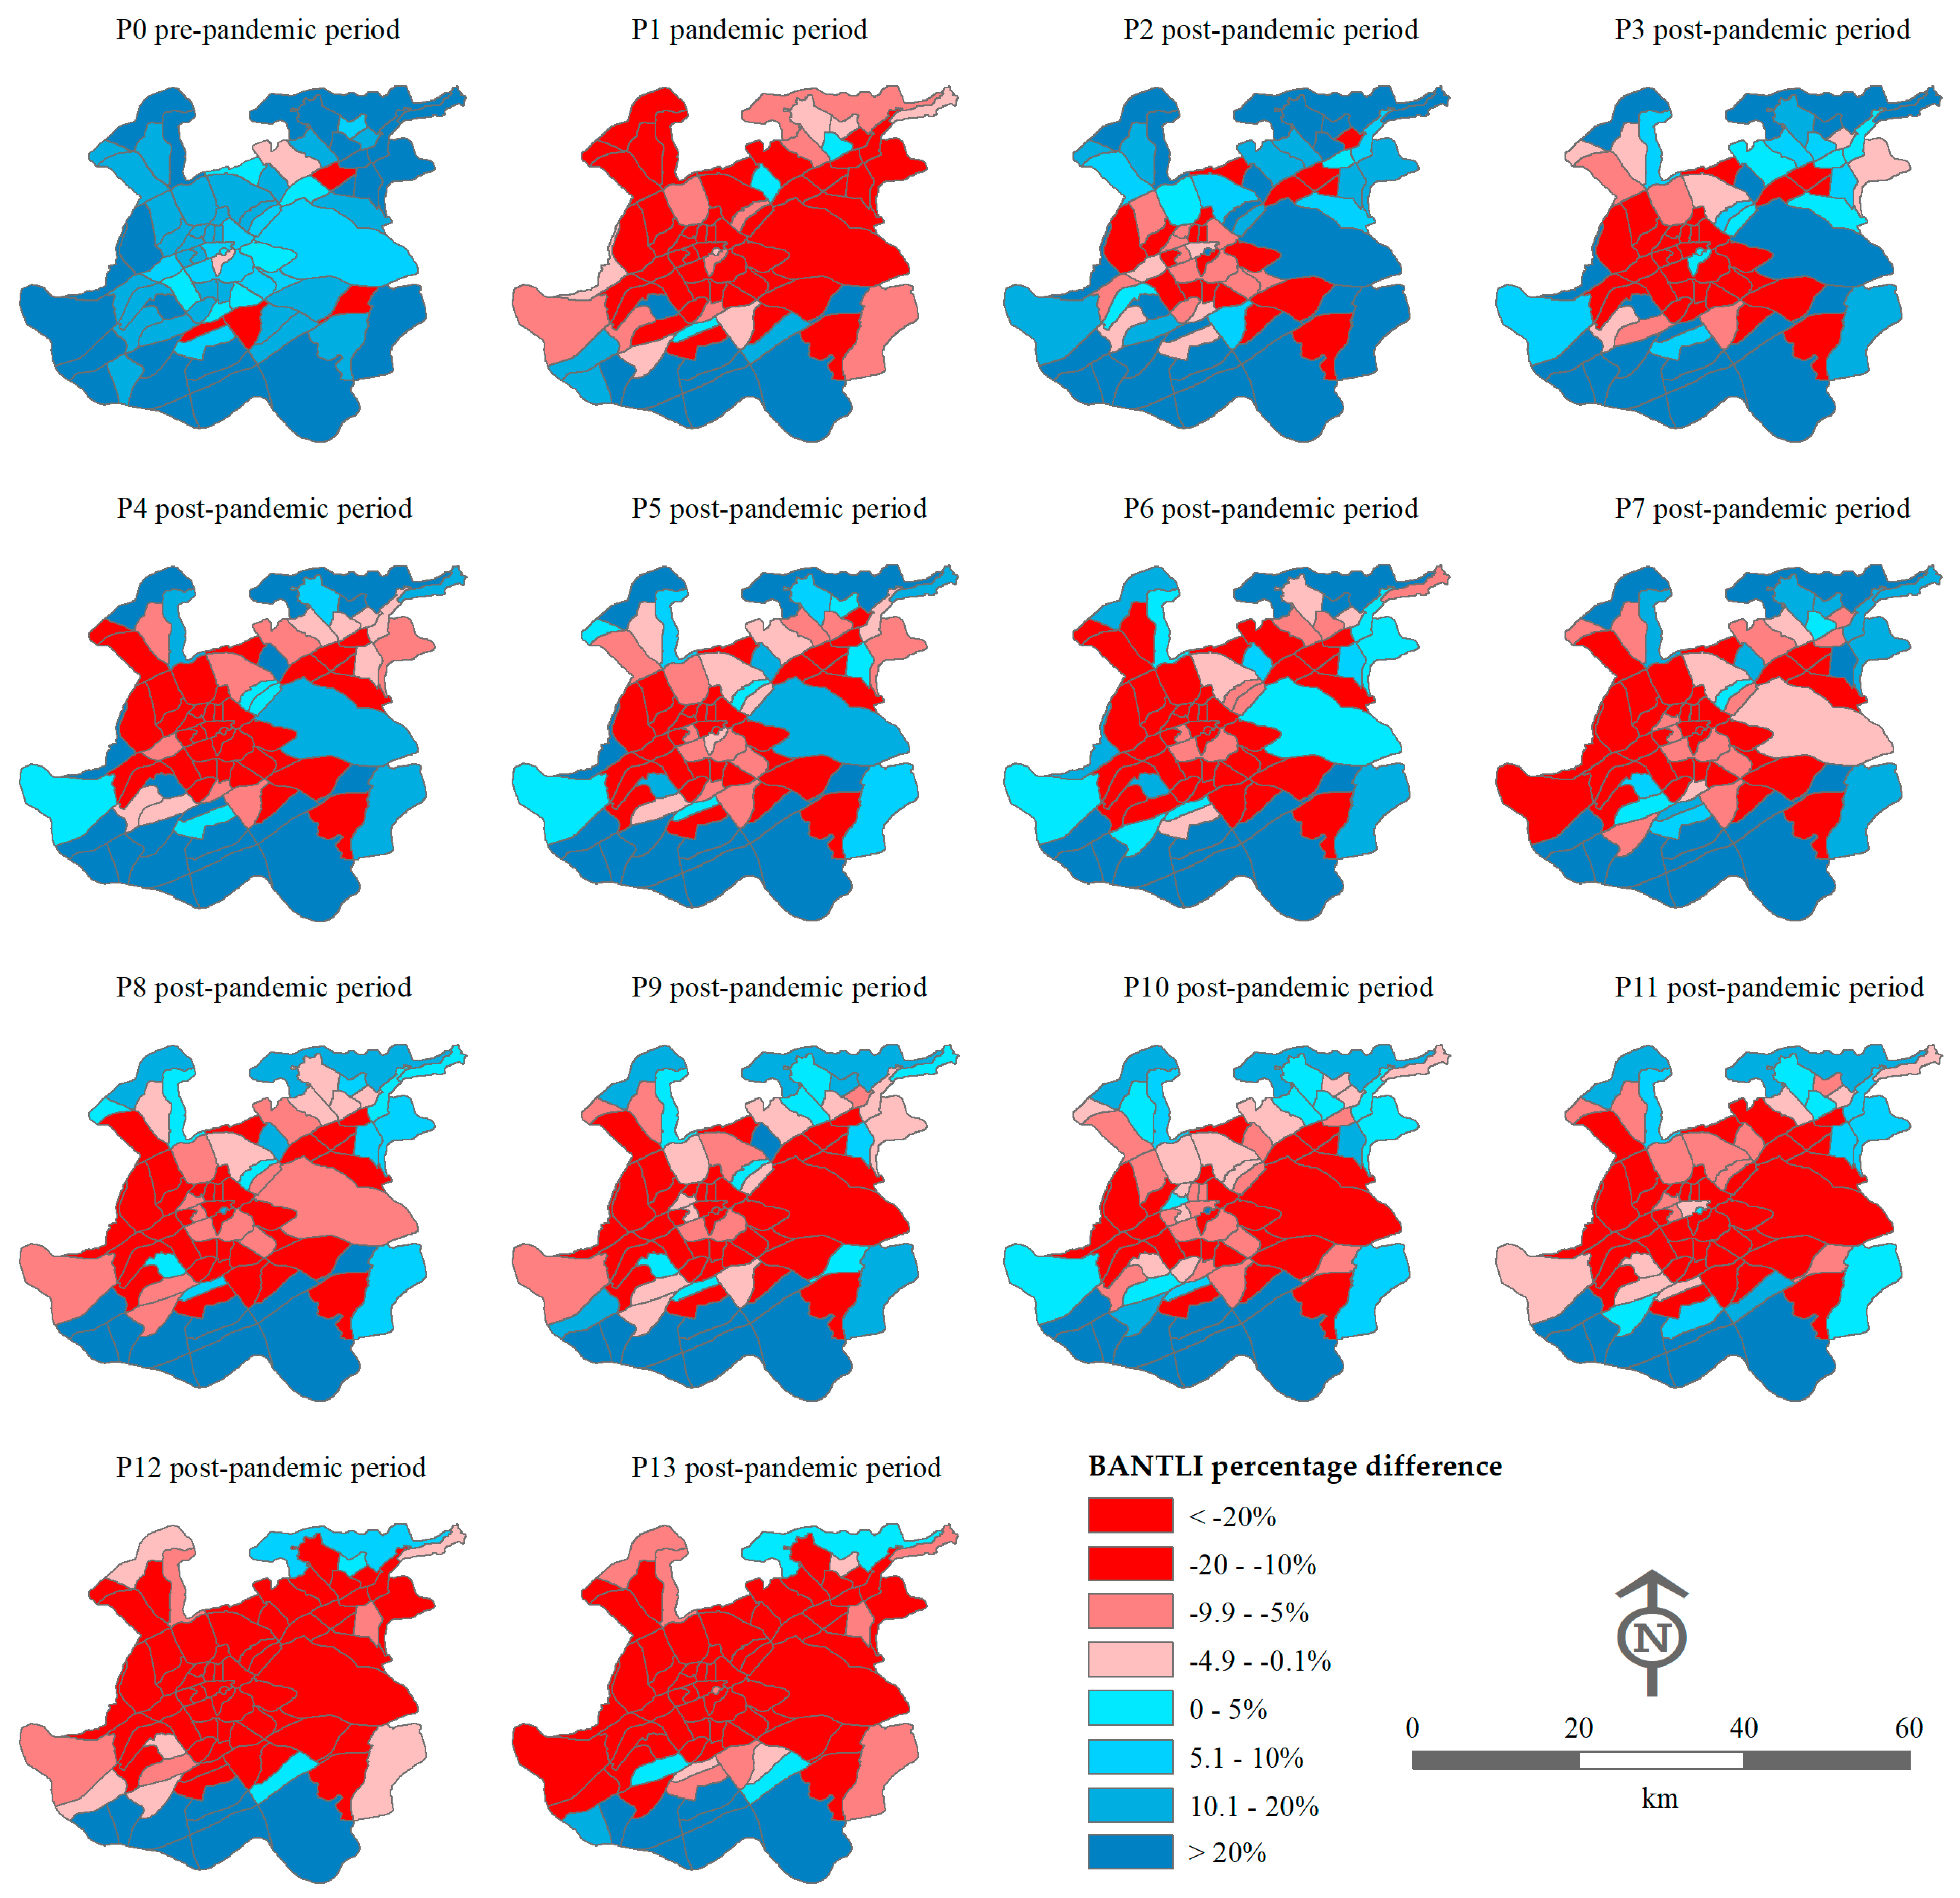
Figure 11 shows the spatial distribution of the BANTLI percentage changes during the different periods in Makkah, categorized into eight classes. Positive values are color-coded by a blue gradient, suggesting stability or an increase in socioeconomic activities, whereas negative values are color-coded by a red gradient, indicating a decrease in the socioeconomic activities. In the discussion section, we consider the relevance of natural variation in mean brightness and the relevance of other moments of brightness in addition to the mean value.
In general, the percentage differences in BANTLI brightness are not uniform across wards over all periods in Makkah (Figure 11). In the pre-pandemic period (P0), most wards had positive BANTLI values, indicating normal socioeconomic development. In contrast, the COVID-19 pandemic greatly reduced socioeconomic activity in most wards located in the north, east, west and middle of the city. The majority (27) of these wards showed a percentage difference of BANTLI brightness values below −20% (Figure 11, P1). However, 80% (22 out of 27) of the most affected wards in P1 recovered in the first post-pandemic period (P2), mostly located in the east, are shown by a transfer from dark red (decrease) to red, bright red and blue colors.
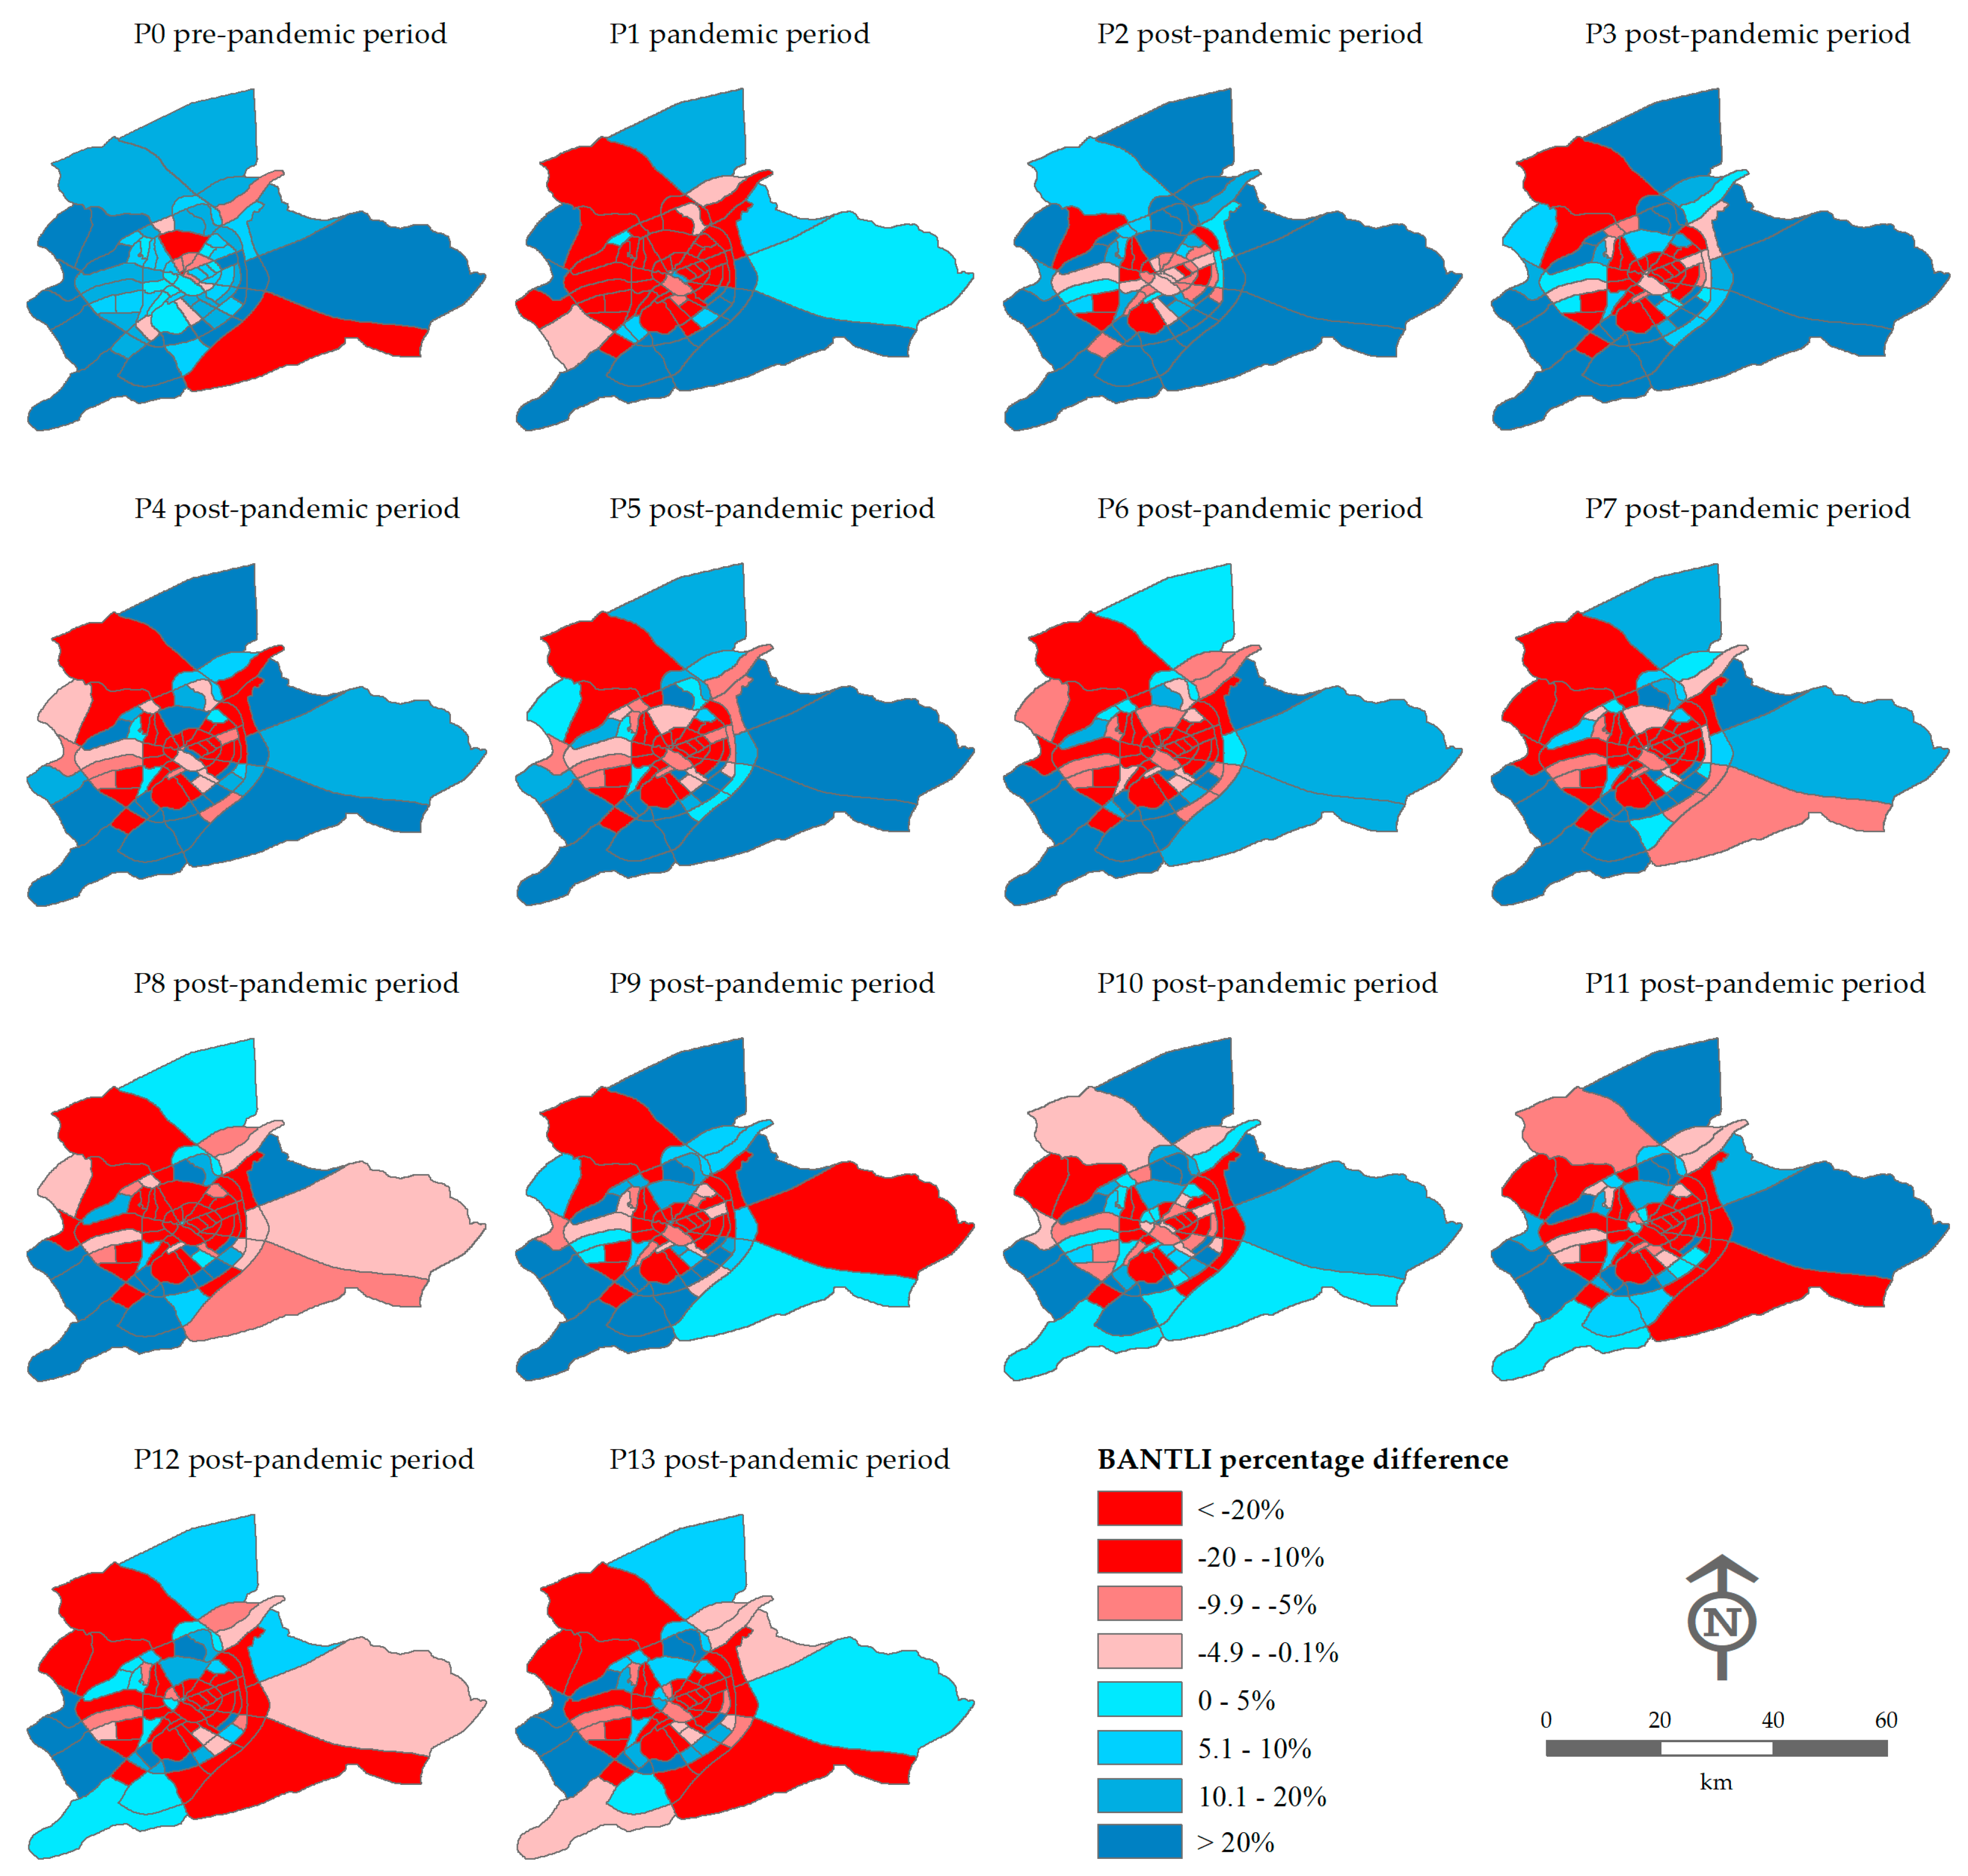
Unfortunately, instead of continuing to recover, socioeconomic conditions gradually weakened in P3 to P11 in comparison with P2, as indicated by the spread of the red areas in the ward map. The poorest performance is seen in P12 and P13 when BANTLI radiance had fallen to pandemic levels and lower. The impact of COVID-19 on socioeconomic activity in Madinah (Figure 12) is similar to Makkah. For example, the recovery in the post-pandemic periods (P2 to P13) had not reached the pre-pandemic level (P0), and P2 showed the strongest recovery compared with the other post-pandemic periods. Moreover, during P12 and P13, some wards in the south and east were more affected than during the pandemic period (P1).

3.4. Change of BANTLI Radiances at the Concentric-Ring Level

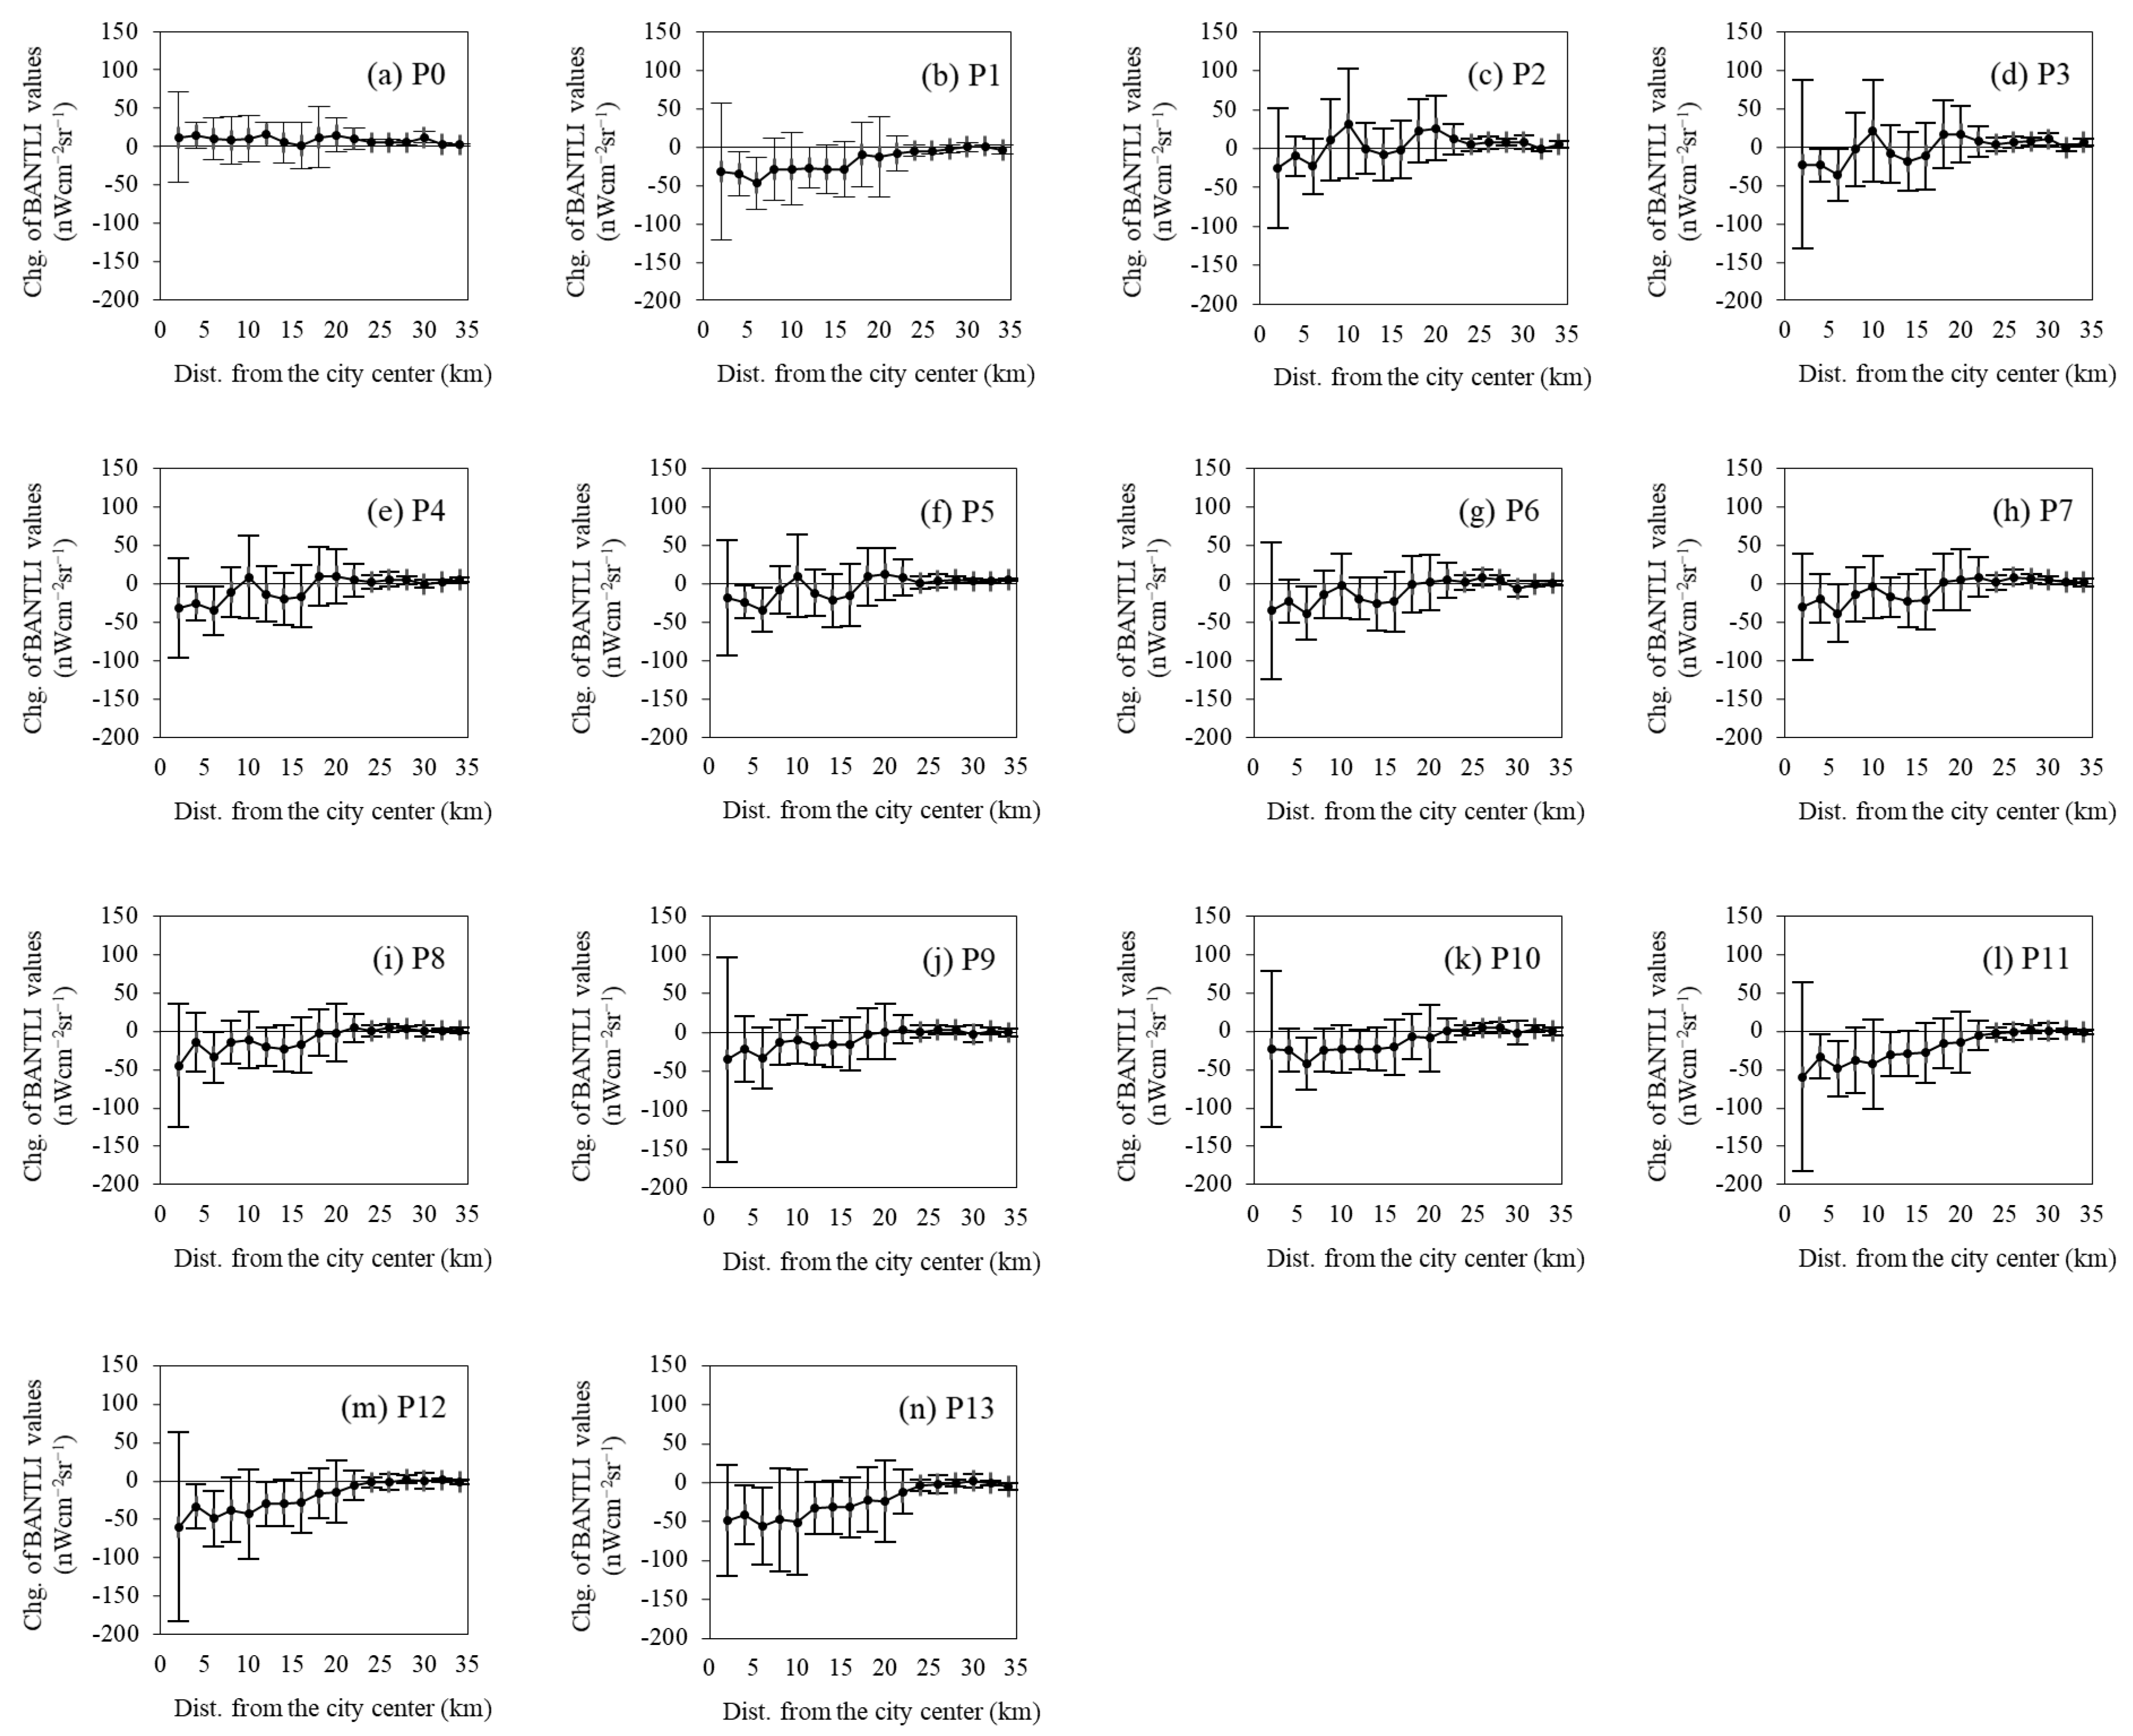
The BANTLI difference, (i.e., D9–D9-2, Equation (2)), was also investigated using the concentric rings, clarifying the influence of COVID-19 at a finer scale compared with the city and ward boundaries. Figure 13 shows the mean BANTLI brightness difference (black line) and standard deviation (error bar) for each ring in Makkah during each period.
In general, it is clearly seen that the mean of BANTLI intensity differences fluctuated most in the rings less than 22 km from the city center during the different periods, whereas peripheral rings at distances of 22 km and greater exhibited relative stability. In addition, the majority of rings less than 22 km did not fully recover during the post-pandemic periods. For example, the means of the BANTLI radiance change were 12 and 5 nWcm−2sr−1 at the 2 km and 28 km rings in the pre-pandemic period (P0), respectively. These values declined during the pandemic period (P1) to −32 and −3 nWcm−2sr−1 and then recovered to −23 and 7 nWcm−2sr−1 during the post-pandemic period (P3) for the same zones.
Similar to the city and ward level, the first post-pandemic period (P2) revealed the highest level of recovery compared with the other post-pandemic periods at the ring level. More importantly, P12 and P13 were the only periods for which the mean BANTLI brightness change was greater than in the pandemic period, particularly in rings at less than 20 km. The large error bar indicates that the impact of COVID-19 on a ring is more varied between the BANTLI pixels, and the reverse is true.
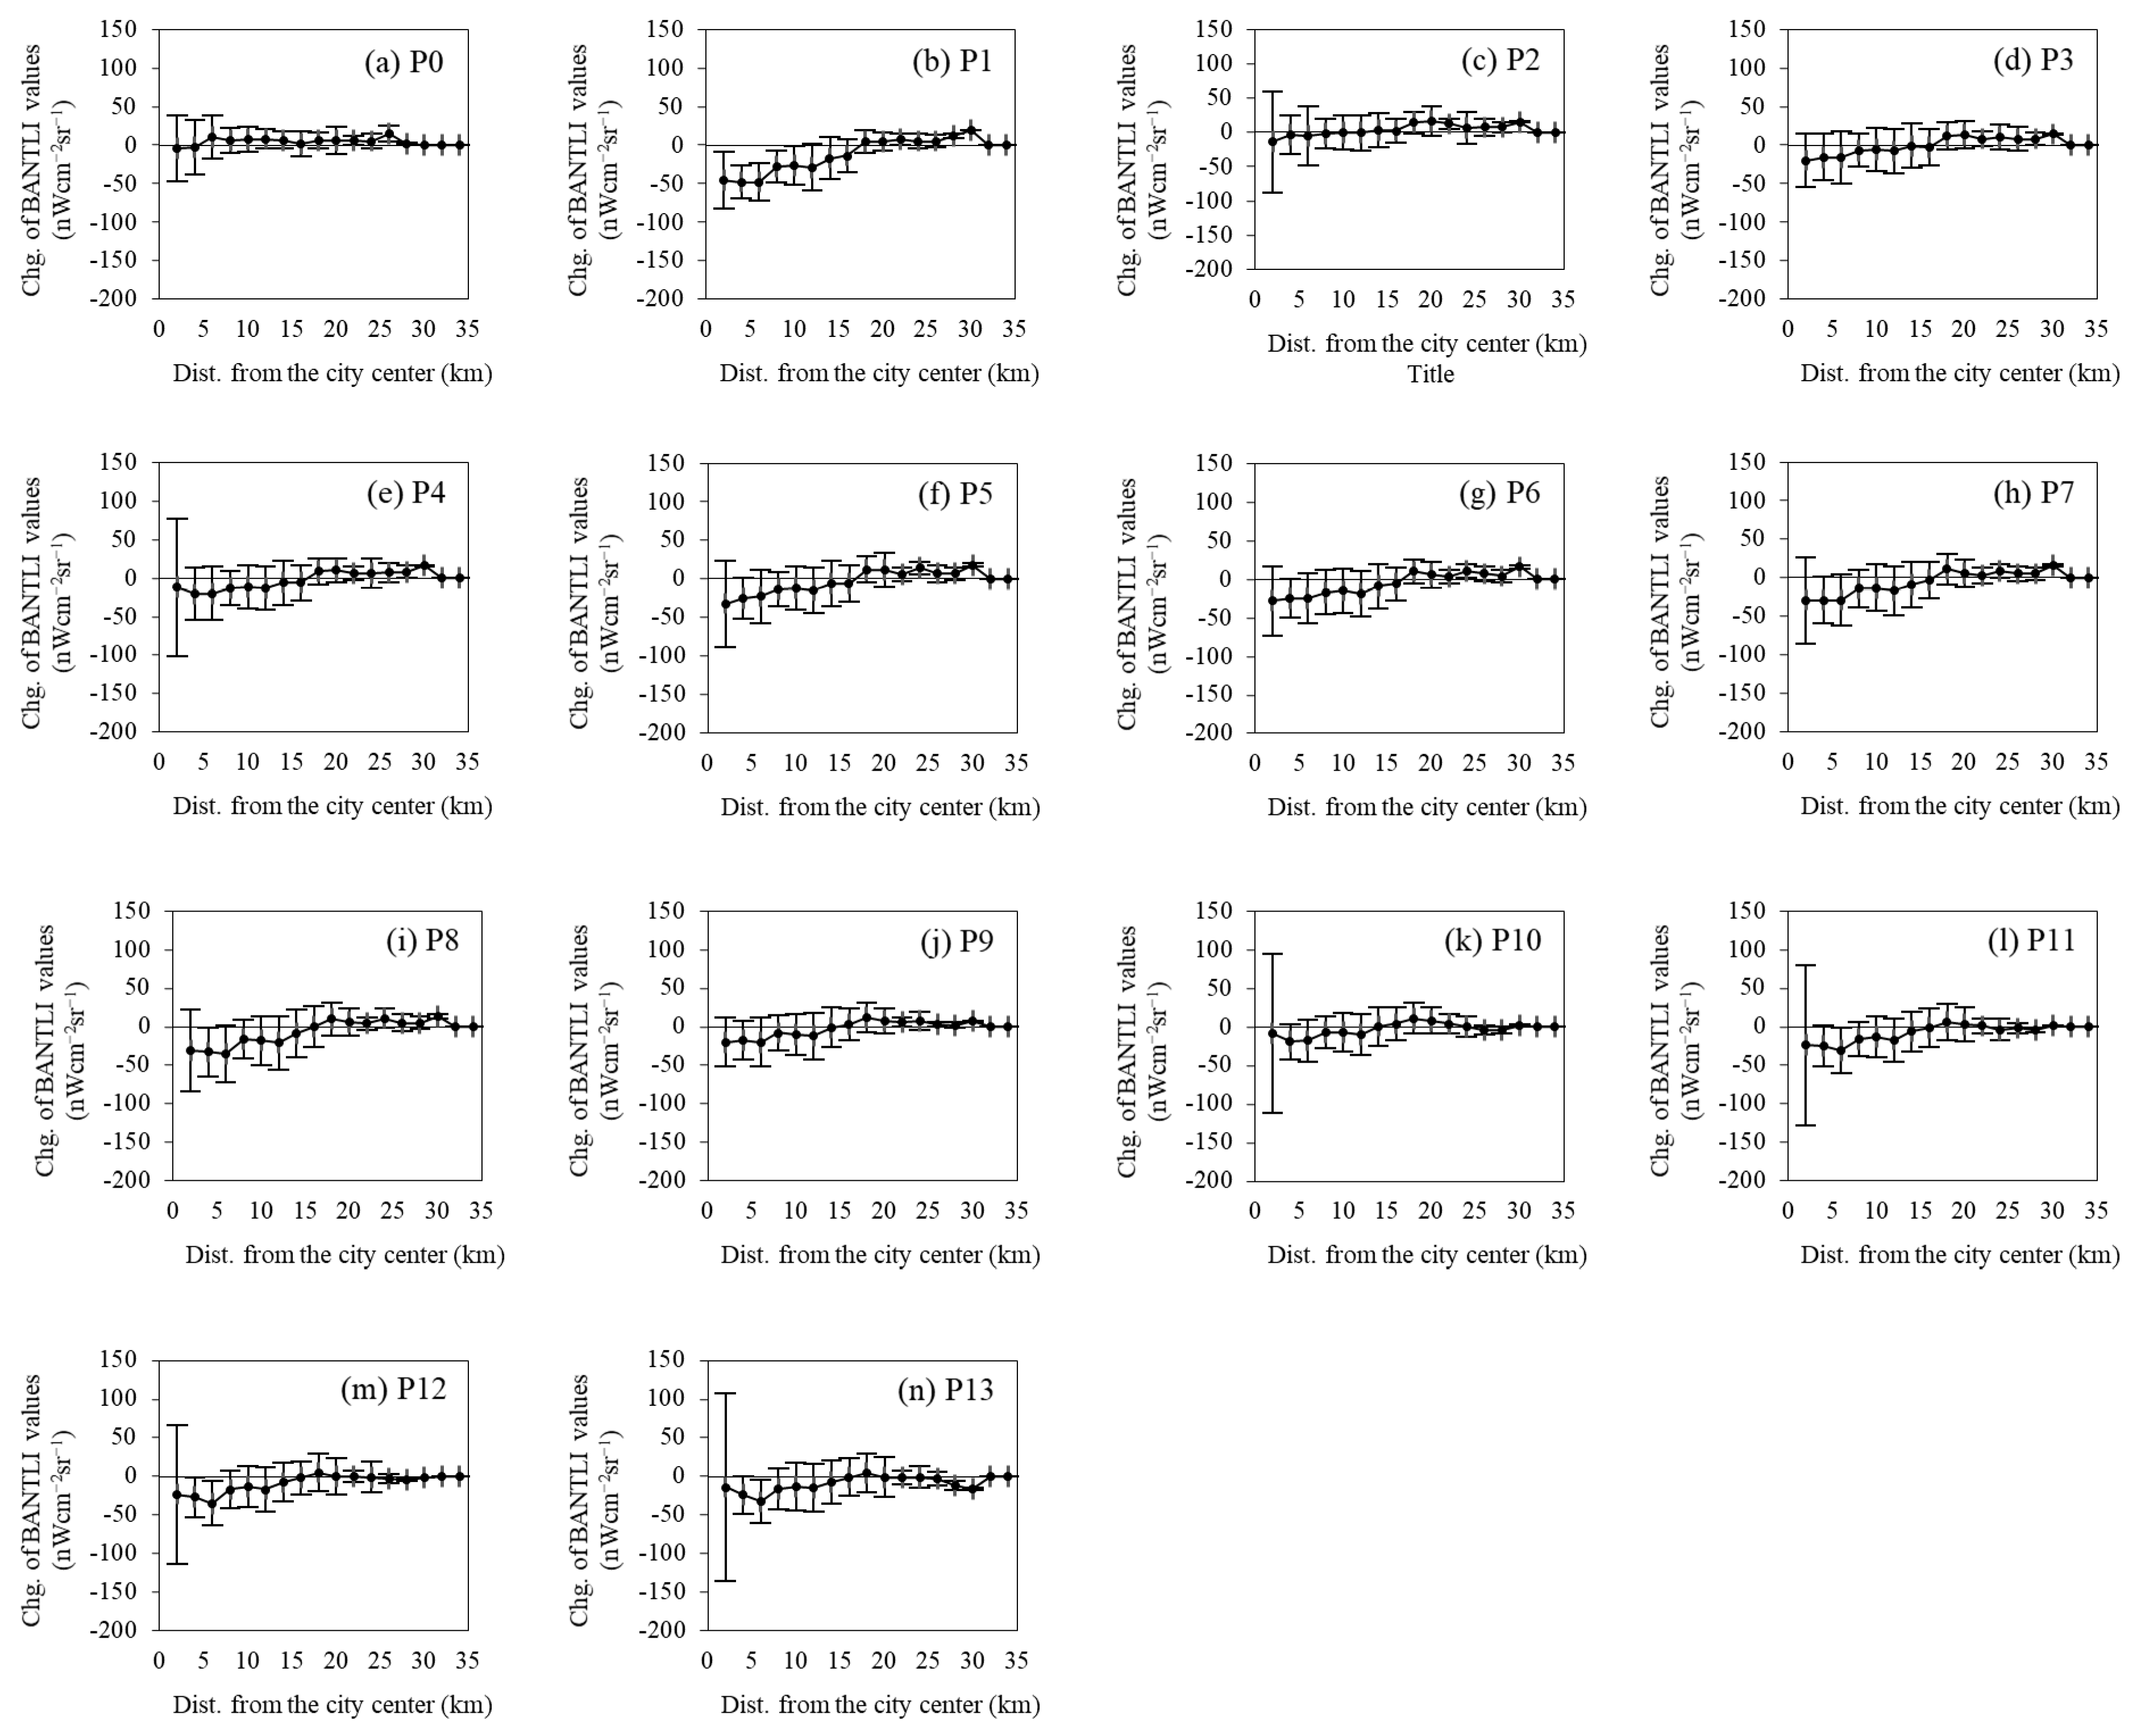
Figure 14 presents the same information for each ring in Madinah. Similar to Makkah, all rings less than 20 km from the center were more affected by the COVID-19 pandemic than rings more than 20 km from the center. Interestingly, during P2, the mean BANTLI brightness difference in rings less than 18 km from the center did not reach the level of P0, whereas zones further than 18 km did so. Unlike Makkah, there is a clear recovery in Ramadan (P10) compared with the other post-pandemic periods. Moreover, the recovery level in zones less than 20 km during P12 and P13 was obvious compared with P1.

3.5. Change of BANTLI Radiances at the Pixel Level

The BANTLI brightness changes were mapped at the pixel level for six periods and they were selected for the following reasons: P0 and P1 were selected as the benchmark in the pre-pandemic and pandemic periods. P2 represents the largest increase in the BANTLI values compared with P1. Ramadan (P10) and Dhu al-Hijjah (the month of Hajj, P13) were selected as socioeconomic activity increased in these months (and the pattern of P11 and P12 is similar to P10). Lastly, P6 represents the middle period between P2 and P10.
Figure 15 shows the spatial distribution of BANTLI differences, with negative values coded red, and positive values coded blue. It is clear that most of the BANTLI pixels in Makkah (Figure 15a) and Madinah (Figure 15b) are blue, indicating brightened areas during the pre-pandemic period (P0). On the other hand, the COVID-19 pandemic (P1) dimmed the lights in most parts of both cities. With the beginning of the easing of Umrah and Ziarah restrictions, an increase was noticed in BANTLI in the first post-pandemic period (P2) of both cities. After, that the BANTLI brightness differences gradually decreased in post-pandemic periods such as P6 and P10 compared with P2. It is evident that the BANTLI brightness was significantly decreased in the month of Hajj (P13), particularly in Makkah (Figure 15a), as the decline in the light exceeds the pandemic period (P1).

4. Discussion

Different studies showed the capability of the Soumi-NPP in monitoring the anthropogenic activities during the pandemic period [30,31,32,33,34], despite the overpass time (01:30 a.m.), a period when many socioeconomic activities are reduced. However, Makkah and Madinah are religious, dynamic and special cities due to the presence of the Holy Mosque and Prophet Mosque, respectively. The Holy Mosque is open 24 h a day for pilgrims and worshipers, and most of the commercial activities, such as hotels, restaurants, stores and transportation are working 24 h a day in Makkah. However, this is not the case in Madinah, as the Prophet Mosque is closes at 00:30, but Quba Mosque is open 24 h a day, and the restaurants and coffee shops close at around 02:00. This indicates that Makkah is not affected by the Soumi-NPP overpass time, whereas Madinah is relatively it. Moreover, the peak hours of the socioeconomic activities during Ramadan in both cities are from 20:00 to 03:00.
NTL data do not reflect the exact distribution of socioeconomic activity due to the overglow uncertainty, whereas BANTLI provides a more precise measure, being based on the logical absence of NTL from genuinely bare land. This was confirmed by validation of BANTLI with a finer, more accurate external source (ISA) that has a strong positive relationship with socioeconomic activity. Spatially, the BANTLI product substantially mitigates the overglow effect by excluding most of the unpopulated lit areas and thus represents the real city structure better than NTL data. Higher correlations were obtained between the ISA and BANTLI than with NTL in Makkah and Madinah. For example, the R values were 0.83 and 0.92 (Figure 6f,h) for the BANTLI compared with 0.81 and 0.44 (Figure 6e,g) for the NTL radiances in Madinah.
The impact of the resumption of religious rituals on socioeconomic activity as indicated by BANTLI was quantified by computing the percentage difference between multiple BANTLI composites before, during and after the COVID-19 pandemic. In general, the BANTLI percentage changes at the different spatial levels were varied and decreased during the post-pandemic periods in Makkah (P2 to P11) and Madinah (P2 to P13) compared with the pandemic period (P0) but still did not fully recover. For example, decreases during P1 of −22% and −32% in Makkah and Madinah, respectively, at the city level, indicate that socioeconomic activity was significantly affected. However, the decision to gradually resume religious rituals led to a recovery in transportation, retail trade, hotels, restaurants, shopping sectors, etc. This is reflected in the BANTLI percentage change during the post-pandemic periods. The large recovery in P2 in Makkah and Madinah at the different scales compared with the other post-pandemic periods may be attributed to the arrival of many pilgrims and worshipers to the Holy Mosque and Prophet’s Mosque without permission, after hearing the news of the gradual return of religious rituals. In response, the Saudi government took strict measures during the other post-pandemic periods. The patterns of BANTLI percentage change at the city level were in line with the numbers of cars entering the cities and the numbers of flights in KAIA and PMBAIA (Figure 8). The percentage changes of cars and flights recovered during the post-pandemic periods compared with the pandemic period but still did not reach pre-pandemic levels. P13 (Figure 8) is the Hajj month, when there is an official holiday in Saudi Arabia of 10 days. Employees, originally from Makkah and Madinah and working outside these cities, usually visit their families during this time. This could explain the marked change in the percentage difference of the number of cars during P13 in Makkah and Madinah compared with the preceding periods.
Ramadan month (P10) is one of the post-pandemic periods that saw a decrease in BANTLI percentage change compared with the pandemic and some of the post-pandemic periods at all spatial scales examined (Figure 11, Figure 12, Figure 14 and Figure 15). This can be explained by (1) the celebration of this month through increased lighting inside and outside people’s homes and (2) the increased number of Umrah pilgrims in Ramadan compared to other months, whether before or after the COVID-19 pandemic. Unlike all the post-pandemic periods, particularly in Makkah, BANTLI percentage changes in P12 and P13 were greater than during the pandemic period (Figure 7a, Figure 11 and Figure 13). These findings were expected because P12 is “Dhu Alqadah” month, when some Hajj pilgrims arrive, and the government prepares for the Hajj ritual. In addition, P13 is “Dhu Alhijjah” month, when the Hajj ritual is performed. In 2021, the Saudi government allowed only 60,000 Muslims to perform the Hajj ritual compared with 2.5 million in 2019. Findings at the ward and concentric-ring levels in Makkah and Madinah indicate that not all wards and rings were affected equally during the pandemic and post-pandemic periods. This emphasizes the spatial heterogeneity of the impact of COVID-19 on socioeconomic activity. Most wards located in or near to the city center were significantly affected by the COVID-19 pandemic and slowly recovered during the post-pandemic periods compared with the peripheral wards. All rings that are within 22 km from the center were more affected than distant zones in Makkah and Madinah. This is mainly due to the relative concentration of population, hotels, shops, restaurants, etc., in these areas (both wards and rings). The consequence of the limited number of Hajj pilgrims (P13) in 2021 was the main reason for the dimming of the lights across most pixels in Makkah and Madinah (Figure 15).
A further important consideration is the extent of natural variation in brightness that could serve to obscure the strong pandemic impacts observed here. Elvidge et al. [66,67,68] argued that there is additional information to be gained by examining all four moments of mean, variance, skewness and kurtosis in NTL brightness. Their analysis is based on annual and multiyear reprocessing of Earth Observation Group (EOG) VIIRS nighttime lights, and they found particular utility in the variance vs. mean relationship, proposing the reprocessing of the annual global VIIRS data series to add the additional moments. They identified five distinct zones in the variance vs. mean scatter graph, demonstrating, for example, areas with similar means but quite different levels of variance due to differing ground illumination conditions. It is not feasible to reprocess the entire workflow within the context of the present study based on the Black Marble product, but we undertook an initial exploration of all four moments for selected sample areas (not included here) of Makkah and Madinah for the pre- (4 April 2018 to 22 August 2019) and post-pandemic (4 October 2020 to 8 August 2021) periods. Broad patterns are observable which are consistent with those seen in Elvidge et al. [68]; however, it appears that a different zonation of the variance-mean scatterplot would need to be developed. A reanalysis which takes into account all four moments would be an important direction for further studies which seek to interpret pandemic changes or other long-term changes in NTL.
BANTLI was developed using freely accessible VIIRS/DNB and ESA WorldCover 2020 data, and it therefore can be applied in other regions. However, the BANTLI product had some limitations. Firstly, BANTLI was constructed using a bare-land-cover class to reduce the overglow uncertainty within the populated areas in the NTL product; thus, it will not perform well in regions that are mainly covered by vegetation, with little bare-land surface within the populated areas. Secondly, the effective number of high-quality NTL pixels is uneven for each composite, and this may be a source of uncertainty when computing the sum for any administrative boundary. Thirdly, regions that are usually cloudy and rainy will face challenges in obtaining effective high-quality NTL pixels. Fourthly, the VIIRS DNB is unable to detect light less than 500 nm (LED lights). This is known as “blue blindness”, and it will underestimate the NTL brightness [69,70]. Fifthly, the time of the Suomi-NPP overpass (01:30 a.m.) could be a source of uncertainty in most cities, as many of the socioeconomic activities are reduced at this time. Lastly, the overall accuracy, as well as commission and omission errors of the ESA WorldCover 2020 and GISD30, may be an additional source of uncertainty when other land-cover classes are misclassified. In spite of these challenges, this research exemplifies the usefulness of the new BANTLI product to quantify change in socioeconomic activity through the various stages of the pandemic, here reflecting resumption of religious rituals. Thus, the findings of this research could be compared with other areas associated with different socioeconomic characteristics.

5. Conclusions

VIIRS-DNB nighttime satellite data have been widely used to monitor various aspects of the impact of natural, man-made or public health crises. However, most applications were implemented in developed countries and China. Moreover, the overglow uncertainty within the populated areas was not addressed. In this research, the overgrow uncertainty of the NTL product was minimized by deriving an index called the Bare Adjusted NTL Index, BANTLI, through fusing the VIIRS-DNB nighttime and fine bare-land-cover (10 m) data. The BANTLI product substantially diminished most of the unpopulated lit pixels. Thus, BANTLI more accurately demarcates city structure compared with the original NTL. Moreover, BANTLI is more strongly correlated with ISA than NTL. BANTLI was used to spatially and temporally evaluate the impact of the resumption of religious rituals on socioeconomic activity during the post-pandemic periods at different spatial scales in Makkah and Madinah.
The research outputs demonstrate that BANTLI is an efficient proxy for spatiotemporal changes in socioeconomic activity in Makkah and Madinah. The large decline in the BANTLI radiances at the different spatial scales gives us a clear indication of the disruption and damage to socioeconomic life during the COVID-19 pandemic. Overall, the percentage differences of the BANTLI brightness decreased with varying percentages during the post-pandemic periods compared with the pandemic period, but they were still below pre-pandemic levels, suggesting that socioeconomic activities had not fully recovered in Makkah and Madinah. This is consistent with the analysis of vehicle and flight numbers. The socioeconomic situation recovered at the beginning of the return of religious rituals (P2) and then began to recover slowly during the other post-pandemic periods and this may be explained the arrival of pilgrims and worshipers, after a suspension of 7 months, whether with or without permission during P2. This research also demonstrates heterogeneity in terms of (i) time, as BANTLI brightness change during Hajj (P13) was extremely increased than other periods; and (ii) location, as the central wards and the rings less than 20 km from the center were much more affected than peripheral wards and rings.
In the absence of detailed data about individual-level socioeconomic activity, this kind of research provides valuable insights to policymakers for evaluation of plans and policies that aim to mitigate the consequences of COVID-19 and future pandemic scenarios. Future work may make use of additional information such as electricity consumption, water consumption, social media and traffic with the daily nighttime data and should include the exploration of all four statistical moments of NTL brightness. This may lead to further precision in understanding the impact of the COVID-19 pandemic on socioeconomic life and contribute to the assessment of the corrective steps implemented by the government.

Author Contributions

Conceptualization, methodology, validation, formal analysis, investigation, data curation and writing—original draft, M.A.; investigation, methodology and writing—original draft, S.M.; investigation, data curation and writing—review and editing, N.D.; investigation, methodology and writing—review and editing, D.J.M. All authors have read and agreed to the published version of the manuscript.

Funding

This research received no external funding.

Data Availability Statement

The data that support the findings of this research are available from “LAADS DAAC-NASA” at https://ladsweb.modaps.eosdis.nasa.gov/search/ (accessed on 2 December 2021), “The European Space Agency” at https://worldcover2020.esa.int/downloader (accessed on 25 September 2021) and “Zenodo” at https://zenodo.org/record/5220816#.Y-jlGXZByUl (accessed on 4 March 2022).

Acknowledgments

The authors acknowledge support from the King Abdulaziz City for Science and Technology (KACST). The authors thank Waleed Aldurgham from the Ministry of Transport and Ahmad Alneami from the National Center for Vegetation Cover Development & Combating Desertification for their help in obtaining information.

Conflicts of Interest

The authors declare no conflict of interest.

References

  1. Shao, Z.; Tang, Y.; Huang, X.; Li, D. Monitoring work resumption of Wuhan in the COVID-19 epidemic using daily nighttime light. Photogramm. Eng. Remote Sens. 2021, 87, 195–204. [Google Scholar] [CrossRef]
  2. World Bank. Global Economic Prospects, January 2022; World Bank: Washington, DC, USA, 2022. [Google Scholar]
  3. CCSA. How COVID-19 Is Changing the World: A Statistical Perspective; CCSA: Ottawa, ON, Canada, 2021; Volume III. [Google Scholar]
  4. Papazoglou, A.S.; Moysidis, D.V.; Tsagkaris, C.; Dorosh, M.; Karagiannidis, E.; Mazin, R. Spiritual health and the COVID-19 pandemic: Impacts on Orthodox Christianity devotion practices, rituals, and religious pilgrimages. J. Relig. Health 2021, 60, 3217–3229. [Google Scholar] [CrossRef]
  5. Mamdouh, M.N. Hajj & Umrah from A to Z; Dar Eshbelia: Riyadh, Saudi Arabia, 1996. [Google Scholar]
  6. Alaska, Y.A.; Aldawas, A.D.; Aljerian, N.A.; Memish, Z.A.; Suner, S. The impact of crowd control measures on the occurrence of stampedes during Mass Gatherings: The Hajj experience. Travel Med. Infect. Dis. 2017, 15, 67–70. [Google Scholar] [CrossRef]
  7. GAS. Hajj Statistics in 2020 and 2021. 2022. Available online: https://www.stats.gov.sa/ar/28 (accessed on 5 February 2022).
  8. Li, J.; Chu, B.; Chai, N.; Wu, B.; Shi, B.; Ou, F. Work Resumption Rate and Migrant Workers’ Income during the COVID-19 Pandemic. Front. Public Health 2021, 9, 678934. [Google Scholar] [CrossRef]
  9. Zhang, H.; Song, H.; Wen, L.; Liu, C. Forecasting tourism recovery amid COVID-19. Ann. Tour. Res. 2021, 87, 103149. [Google Scholar] [CrossRef]
  10. Xu, P.; Li, W.; Hu, X.; Wu, H.; Li, J. Spatiotemporal analysis of urban road congestion during and post COVID-19 pandemic in Shanghai, China. Transp. Res. Interdiscip. Perspect. 2022, 13, 100555. [Google Scholar] [CrossRef]
  11. Lan, T.; Shao, G.; Tang, L.; Xu, Z.; Zhu, W.; Liu, L. Quantifying spatiotemporal changes in human activities induced by COVID-19 pandemic using daily nighttime light data. IEEE J. Sel. Top. Appl. Earth Obs. Remote Sens. 2021, 14, 2740–2753. [Google Scholar] [CrossRef]
  12. Alahmadi, M.; Atkinson, P.M. Three-fold urban expansion in Saudi Arabia from 1992 to 2013 observed using calibrated DMSP-OLS night-time lights imagery. Remote Sens. 2019, 11, 2266. [Google Scholar] [CrossRef] [Green Version]
  13. Huang, Q.; Yang, X.; Gao, B.; Yang, Y.; Zhao, Y. Application of DMSP/OLS nighttime light images: A meta-analysis and a systematic literature review. Remote Sens. 2014, 6, 6844–6866. [Google Scholar] [CrossRef] [Green Version]
  14. Xiao, H.; Ma, Z.; Mi, Z.; Kelsey, J.; Zheng, J.; Yin, W.; Yan, M. Spatio-temporal simulation of energy consumption in China’s provinces based on satellite night-time light data. Appl. Energy 2018, 231, 1070–1078. [Google Scholar] [CrossRef]
  15. Yue, Y.; Tian, L.; Yue, Q.; Wang, Z. Spatiotemporal variations in energy consumption and their influencing factors in China based on the integration of the DMSP-OLS and NPP-VIIRS nighttime light datasets. Remote Sens. 2020, 12, 1151. [Google Scholar] [CrossRef] [Green Version]
  16. Wang, J.; Lu, F. Modeling the electricity consumption by combining land use types and landscape patterns with nighttime light imagery. Energy 2021, 234, 121305. [Google Scholar] [CrossRef]
  17. Dai, Z.; Hu, Y.; Zhao, G. The Suitability of Different Nighttime Light Data for GDP Estimation at Different Spatial Scales and Regional Levels. Sustainability 2017, 9, 305. [Google Scholar] [CrossRef] [Green Version]
  18. Chen, X.; Nordhaus, W.D. VIIRS Nighttime Lights in the Estimation of Cross-Sectional and Time-Series GDP. Remote Sens. 2019, 11, 1057. [Google Scholar] [CrossRef] [Green Version]
  19. Xiao, Q.-L.; Wang, Y.; Zhou, W.-X. Regional economic convergence in China: A comparative study of nighttime light and GDP. Front. Phys. 2021, 9, 89. [Google Scholar] [CrossRef]
  20. Su, Y.; Chen, X.; Wang, C.; Zhang, H.; Liao, J.; Ye, Y.; Wang, C. A new method for extracting built-up urban areas using DMSP-OLS nighttime stable lights: A case study in the Pearl River Delta, southern China. GISci. Remote Sens. 2015, 52, 218–238. [Google Scholar] [CrossRef]
  21. Hu, X.; Qian, Y.; Pickett, S.T.; Zhou, W. Urban mapping needs up-to-date approaches to provide diverse perspectives of current urbanization: A novel attempt to map urban areas with nighttime light data. Landsc. Urban Plan. 2020, 195, 103709. [Google Scholar] [CrossRef]
  22. Sun, W.; Zhang, X.; Wang, N.; Cen, Y. Estimating population density using DMSP-OLS night-time imagery and land cover data. IEEE J. Sel. Top. Appl. Earth Obs. Remote Sens. 2017, 10, 2674–2684. [Google Scholar] [CrossRef]
  23. Li, X.; Zhou, W. Dasymetric mapping of urban population in China based on radiance corrected DMSP-OLS nighttime light and land cover data. Sci. Total Environ. 2018, 643, 1248–1256. [Google Scholar] [CrossRef]
  24. Alahmadi, M.; Mansour, S.; Martin, D.; Atkinson, P. An improved index for urban population distribution mapping based on nighttime lights (DMSP-OLS) data: An experiment in Riyadh Province, Saudi Arabia. Remote Sens. 2021, 13, 1171. [Google Scholar] [CrossRef]
  25. Jiang, W.; He, G.; Long, T.; Wang, C.; Ni, Y.; Ma, R. Assessing Light Pollution in China Based on Nighttime Light Imagery. Remote Sens. 2017, 9, 135. [Google Scholar] [CrossRef] [Green Version]
  26. Liu, X.; Ou, J.; Wang, S.; Li, X.; Yan, Y.; Jiao, L.; Liu, Y. Estimating spatiotemporal variations of city-level energy-related CO2 emissions: An improved disaggregating model based on vegetation adjusted nighttime light data. J. Clean. Prod. 2018, 177, 101–114. [Google Scholar] [CrossRef]
  27. Zhao, J.; Ji, G.; Yue, Y.; Lai, Z.; Chen, Y.; Yang, D.; Yang, X.; Wang, Z. Spatio-temporal dynamics of urban residential CO2 emissions and their driving forces in China using the integrated two nighttime light datasets. Appl. Energy 2019, 235, 612–624. [Google Scholar] [CrossRef]
  28. Qiang, Y.; Huang, Q.; Xu, J. Observing community resilience from space: Using nighttime lights to model economic disturbance and recovery pattern in natural disaster. Sustain. Cities Soc. 2020, 57, 102115. [Google Scholar] [CrossRef]
  29. Liu, Z.; Zhang, J.; Li, X.; Chen, X. Long-Term Resilience Curve Analysis of Wenchuan Earthquake-Affected Counties Using DMSP-OLS Nighttime Light Images. IEEE J. Sel. Top. Appl. Earth Obs. Remote Sens. 2021, 14, 10854–10874. [Google Scholar] [CrossRef]
  30. Elvidge, C.D.; Ghosh, T.; Hsu, F.-C.; Zhizhin, M.; Bazilian, M. The dimming of lights in China during the COVID-19 pandemic. Remote Sens. 2020, 12, 2851. [Google Scholar] [CrossRef]
  31. Ghosh, T.; Elvidge, C.D.; Hsu, F.-C.; Zhizhin, M.; Bazilian, M. The dimming of lights in India during the COVID-19 pandemic. Remote Sens. 2020, 12, 3289. [Google Scholar] [CrossRef]
  32. Alahmadi, M.; Mansour, S.; Dasgupta, N.; Abulibdeh, A.; Atkinson, P.M.; Martin, D.J. Using Daily Nighttime Lights to Monitor Spatiotemporal Patterns of Human Lifestyle under COVID-19: The Case of Saudi Arabia. Remote Sens. 2021, 13, 4633. [Google Scholar] [CrossRef]
  33. Xu, G.; Xiu, T.; Li, X.; Liang, X.; Jiao, L. Lockdown induced night-time light dynamics during the COVID-19 epidemic in global megacities. Int. J. Appl. Earth Obs. Geoinf. 2021, 102, 102421. [Google Scholar] [CrossRef] [PubMed]
  34. Beyer, R.C.; Franco-Bedoya, S.; Galdo, V. Examining the economic impact of COVID-19 in India through daily electricity consumption and nighttime light intensity. World Dev. 2021, 140, 105287. [Google Scholar] [CrossRef] [PubMed]
  35. Yin, R.; He, G.; Jiang, W.; Peng, Y.; Zhang, Z.; Li, M.; Gong, C. Night-Time Light Imagery Reveals China’s City Activity during the COVID-19 Pandemic Period in Early 2020. IEEE J. Sel. Top. Appl. Earth Obs. Remote Sens. 2021, 14, 5111–5122. [Google Scholar] [CrossRef]
  36. Straka, W.; Kondragunta, S.; Wei, Z.; Zhang, H.; Miller, S.D.; Watts, A. Examining the Economic and Environmental Impacts of COVID-19 Using Earth Observation Data. Remote Sens. 2021, 13, 5. [Google Scholar] [CrossRef]
  37. Liu, Q.; Sha, D.; Liu, W.; Houser, P.; Zhang, L.; Hou, R.; Lan, H.; Flynn, C.; Lu, M.; Hu, T. Spatiotemporal patterns of COVID-19 impact on human activities and environment in mainland China using nighttime light and air quality data. Remote Sens. 2020, 12, 1576. [Google Scholar] [CrossRef]
  38. Roberts, M. Tracking economic activity in response to the COVID-19 crisis using nighttime lights–The case of Morocco. Dev. Eng. 2021, 6, 100067. [Google Scholar] [CrossRef] [PubMed]
  39. Tian, S.; Feng, R.; Zhao, J.; Wang, L. An Analysis of the Work Resumption in China under the COVID-19 Epidemic Based on Night Time Lights Data. ISPRS Int. J. Geo-Inf. 2021, 10, 614. [Google Scholar] [CrossRef]
  40. Wu, M.; Ye, H.; Niu, Z.; Huang, W.; Hao, P.; Li, W.; Yu, B. Operation Status Comparison Monitoring of China’s Southeast Asian Industrial Parks before and after COVID-19 Using Nighttime Lights Data. ISPRS Int. J. Geo-Inf. 2022, 11, 122. [Google Scholar] [CrossRef]
  41. Zhuo, L.; Zheng, J.; Zhang, X.; Li, J.; Liu, L. An improved method of night-time light saturation reduction based on EVI. Int. J. Remote Sens. 2015, 36, 4114–4130. [Google Scholar] [CrossRef]
  42. Sanchez de Miguel, A.; Kyba, C.; Zamorano, J.; Gallego, J.; Gaston, K.J. The nature of the diffuse light near cities detected in nighttime satellite imagery. Sci. Rep. 2020, 10, 7829. [Google Scholar] [CrossRef]
  43. GAS. Umrah Statistics in 2016 to 2021. 2022. Available online: https://www.stats.gov.sa/ar/862 (accessed on 5 February 2022).
  44. Román, M.O.; Wang, Z.; Sun, Q.; Kalb, V.; Miller, S.D.; Molthan, A.; Schultz, L.; Bell, J.; Stokes, E.C.; Pandey, B. NASA’s Black Marble nighttime lights product suite. Remote Sens. Environ. 2018, 210, 113–143. [Google Scholar] [CrossRef]
  45. Ekim, B.; Dong, Z.; Rashkovetsky, D.; Schmitt, M. The naturalness index for the identification of natural areas on regional scale. Int. J. Appl. Earth Obs. Geoinf. 2021, 105, 102622. [Google Scholar] [CrossRef]
  46. Liang, D.; Zuo, Y.; Huang, L.; Zhao, J.; Teng, L.; Yang, F. Evaluation of the consistency of MODIS Land Cover Product (MCD12Q1) based on Chinese 30 m GlobeLand30 datasets: A case study in Anhui Province, China. ISPRS Int. J. Geo-Inf. 2015, 4, 2519–2541. [Google Scholar] [CrossRef] [Green Version]
  47. Salama, D.S.; Yousif, M.; Gedamy, Y.; Ahmed, H.M.; Ali, M.E.; Shoukry, E.M. Satellite observations for monitoring atmospheric NO2 in correlation with the existing pollution sources under arid environment. Model. Earth Syst. Environ. 2022, 8, 4103–4121. [Google Scholar] [CrossRef]
  48. Tavus, B.; Kocaman, S.; Gokceoglu, C. Flood damage assessment with Sentinel-1 and Sentinel-2 data after Sardoba dam break with GLCM features and Random Forest method. Sci. Total Environ. 2022, 816, 151585. [Google Scholar] [CrossRef] [PubMed]
  49. ESA. WorldCover: Product User Manual (V1.1); ESA: Paris, France, 2021. [Google Scholar]
  50. Zhang, X.; Liu, L.; Zhao, T.; Gao, Y.; Chen, X.; Mi, J. GISD30: Global 30-m impervious surface dynamic dataset from 1985 to 2020 using time-series Landsat imagery on the Google Earth Engine platform. Earth Syst. Sci. Data Discuss. 2021, 14, 1831–1856. [Google Scholar] [CrossRef]
  51. Li, F.; Li, E.; Zhang, C.; Samat, A.; Liu, W.; Li, C.; Atkinson, P.M. Estimating artificial impervious surface percentage in Asia by fusing multi-temporal MODIS and VIIRS nighttime light data. Remote Sens. 2021, 13, 212. [Google Scholar] [CrossRef]
  52. Zhang, Q.; Schaaf, C.; Seto, K.C. The vegetation adjusted NTL urban index: A new approach to reduce saturation and increase variation in nighttime luminosity. Remote Sens. Environ. 2013, 129, 32–41. [Google Scholar] [CrossRef]
  53. Chen, X.; Jia, X.; Pickering, M. A nighttime lights adjusted impervious surface index (NAISI) with integration of Landsat imagery and nighttime lights data from International Space Station. Int. J. Appl. Earth Obs. Geoinf. 2019, 83, 101889. [Google Scholar] [CrossRef]
  54. Li, F.; Yan, Q.; Bian, Z.; Liu, B.; Wu, Z. A POI and LST adjusted NTL urban index for urban built-up area extraction. Sensors 2020, 20, 2918. [Google Scholar] [CrossRef]
  55. Li, G.; Li, L.; Lu, D.; Guo, W.; Kuang, W. Mapping impervious surface distribution in China using multi-source remotely sensed data. GISci. Remote Sens. 2020, 57, 543–552. [Google Scholar] [CrossRef]
  56. Liu, C.; Yang, K.; Bennett, M.M.; Guo, Z.; Cheng, L.; Li, M. Automated extraction of built-up areas by fusing VIIRS nighttime lights and Landsat-8 data. Remote Sens. 2019, 11, 1571. [Google Scholar] [CrossRef] [Green Version]
  57. Zheng, Y.; Tang, L.; Wang, H. An improved approach for monitoring urban built-up areas by combining NPP-VIIRS nighttime light, NDVI, NDWI, and NDBI. J. Clean. Prod. 2021, 328, 129488. [Google Scholar] [CrossRef]
  58. Baugh, K.; Hsu, F.-C.; Elvidge, C.D.; Zhizhin, M. Nighttime lights compositing using the VIIRS day-night band: Preliminary results. Proc. Asia-Pac. Adv. Netw. 2013, 35, 70–86. [Google Scholar] [CrossRef] [Green Version]
  59. Zhang, J. Multi-source remote sensing data fusion: Status and trends. Int. J. Image Data Fusion 2010, 1, 5–24. [Google Scholar] [CrossRef] [Green Version]
  60. Guérois, M.; Pumain, D. Built-up encroachment and the urban field: A comparison of forty European cities. Environ. Plan. A 2008, 40, 2186–2203. [Google Scholar] [CrossRef]
  61. Wu, S.; Sumari, N.S.; Dong, T.; Xu, G.; Liu, Y. Characterizing urban expansion combining concentric-ring and grid-based analysis for Latin American Cities. Land 2021, 10, 444. [Google Scholar] [CrossRef]
  62. Pradhan, R.P.; Bagchi, T.P. Effect of transportation infrastructure on economic growth in India: The VECM approach. Res. Transp. Econ. 2013, 38, 139–148. [Google Scholar] [CrossRef]
  63. Cigu, E.; Agheorghiesei, D.T.; Gavriluță, A.F.; Toader, E. Transport infrastructure development, public performance and long-run economic growth: A case study for the Eu-28 countries. Sustainability 2018, 11, 67. [Google Scholar] [CrossRef] [Green Version]
  64. Czerny, A.I.; Fu, X.; Lei, Z.; Oum, T.H. Post pandemic aviation market recovery: Experience and lessons from China. J. Air Transp. Manag. 2021, 90, 101971. [Google Scholar] [CrossRef]
  65. Qinawy, E. Analysis of the economic effects of religious tourism (Hajj and Umrah) on the Saudi economy during the period (1990–2017). J. Politics Econ. 2019, 3, 143–178. [Google Scholar]
  66. Elvidge, C.D.; Hsu, F.-C.; Zhizhin, M.; Ghosh, T.; Taneja, J.; Bazilian, M. Indicators of electric power instability from satellite observed nighttime lights. Remote Sens. 2020, 12, 3194. [Google Scholar] [CrossRef]
  67. Elvidge, C.D.; Zhizhin, M.; Keith, D.; Miller, S.D.; Hsu, F.C.; Ghosh, T.; Anderson, S.J.; Monrad, C.K.; Bazilian, M.; Taneja, J. The VIIRS Day/Night Band: A Flicker Meter in Space? Remote Sens. 2022, 14, 1316. [Google Scholar] [CrossRef]
  68. Elvidge, C.D.; Hsu, F.C.; Zhizhin, M.; Ghosh, T.; Sparks, T. Statistical moments of VIIRS night-time lights. Int. J. Remote Sens. 2023, 1–25. [Google Scholar] [CrossRef]
  69. Kyba, C.C.; Kuester, T.; Sánchez de Miguel, A.; Baugh, K.; Jechow, A.; Hölker, F.; Bennie, J.; Elvidge, C.D.; Gaston, K.J.; Guanter, L. Artificially lit surface of Earth at night increasing in radiance and extent. Sci. Adv. 2017, 3, e1701528. [Google Scholar] [CrossRef] [PubMed] [Green Version]
  70. Hung, L.-W.; Anderson, S.J.; Pipkin, A.; Fristrup, K. Changes in night sky brightness after a countywide LED retrofit. J. Environ. Manag. 2021, 292, 112776. [Google Scholar] [CrossRef] [PubMed]
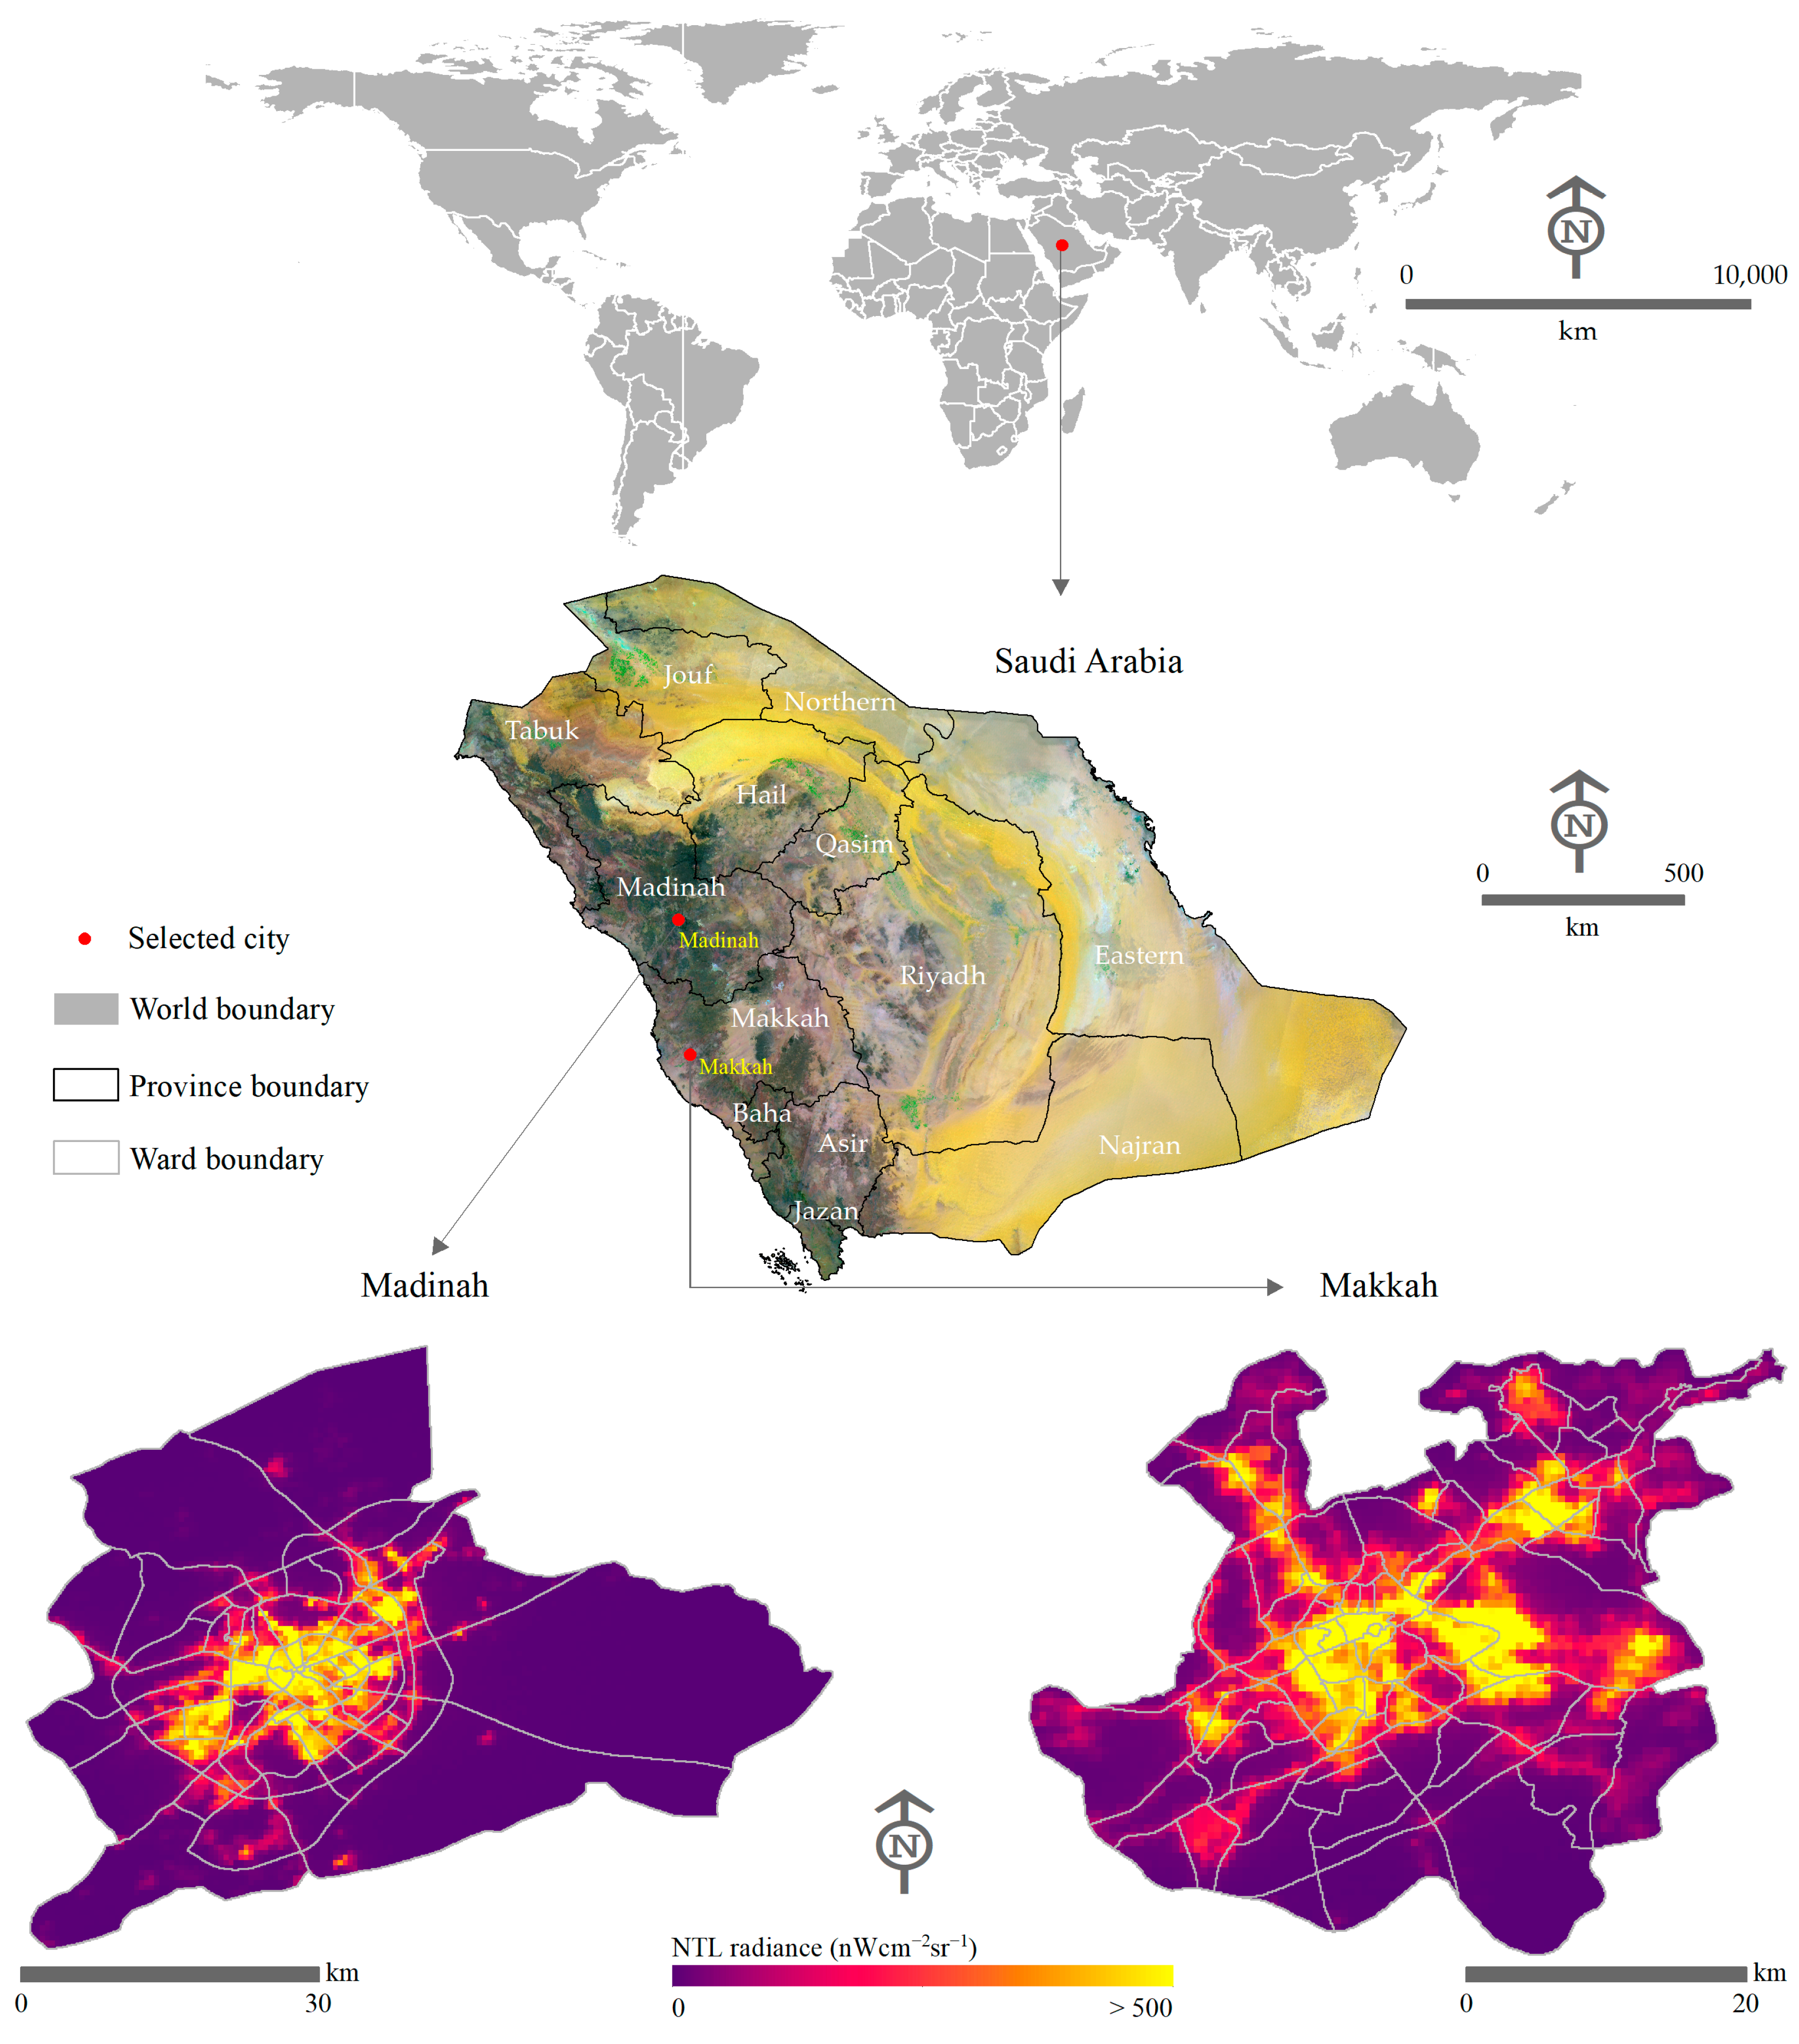
Figure 1. Site location of Makkah and Madinah cities.
Remotesensing 15 01064 g001
Figure 2. North part of Makkah from west to east over (a) NTL (nWcm−2sr−1), (b) ESA WorldCover 2020, (c) Sentinel-2 imagery and (d) a longitudinal transect of NTL and bare land.
Remotesensing 15 01064 g002
Figure 3. Workflow for construction of Bare Adjusted NTL Index (BANTLI).
Remotesensing 15 01064 g003
Figure 4. Concentric rings (2 km) in (a) Makkah and (b) Madinah.
Remotesensing 15 01064 g004
Figure 5. Spatial pattern comparisons of Landsat OLI, NTL (nWcm−2sr−1), BANTLI (nWcm−2sr−1) and ISA in Makkah (ad) and Madinah (eh).
Remotesensing 15 01064 g005
Figure 6. Relationship between ISA areas and sum of NTL and BANTLI radiances in Makkah (a,b) and Madinah (e,f), respectively, and between sum of ISA, NTL and BANTLI pixels in Makkah (c,d) and Madinah (g,h), respectively.
Remotesensing 15 01064 g006
Figure 7. BANTLI percentage differences in (a) Makkah and (b) Madinah for the pre-pandemic (P0), pandemic (P1) and post-pandemic (P2 to P13) periods at the city level.
Remotesensing 15 01064 g007
Figure 8. Percentage changes of cars entering (a) Makkah; (b) Madinah and flights at (c) KAIA; (d) PMBAIA.
Remotesensing 15 01064 g008
Figure 9. Monthly temporal profile of Umrah pilgrims from October 2015 to September 2021 (source: [43]).
Remotesensing 15 01064 g009
Figure 10. Annual (sum) temporal profile of Hajj pilgrims from 2016 to 2021 (source: [7]).
Remotesensing 15 01064 g010
Figure 11. Maps of percentage difference in BANTLI radiance for the pre-pandemic (P0), pandemic (P1) and post-pandemic (P2 to P13) periods in Makkah at the ward level.
Remotesensing 15 01064 g011
Figure 12. Maps of percentage difference in BANTLI radiance for the pre-pandemic (P0), pandemic (P1) and post-pandemic (P2 to P13) periods in Madinah at the ward level.
Remotesensing 15 01064 g012
Figure 13. The mean (black line) and STD (error bar) of BANTLI brightness differences for the periods in concentric rings from Makkah center.
Remotesensing 15 01064 g013
Figure 14. The mean (black line) and STD (error bar) of BANTLI brightness differences for the periods in concentric rings from Madinah center.
Remotesensing 15 01064 g014
Figure 15. Spatial changes of the BANTLI brightness in (a) Makkah and (b) Madinah at the pixel level during selected periods.
Remotesensing 15 01064 g015
Table 1. Arrangements of the gradual resumption of the religious rituals and the different periods.
PeriodTarget DatesReference DatesRestrictions
P0 pre-pandemic period10/10/2018 to 08/11/2018 (D0)01/11/2016 to 29/11/2016 (D0-2)P0, a pre-pandemic period with no restrictions, was incorporated in the analysis for comparison with the pandemic and post-pandemic periods.
P1 pandemic period25/03/2020 to 23/04/2020 (D1)17/04/2018 to 15/05/2018 (D1-2)This period was chosen to represent the pandemic period because the curfew and city lockdowns started at the beginning of this period. In addition, religious rituals were suspended throughout this period and continued till 3 October 2020.
P2 post-pandemic period04/10/2020 to 17/10/2020 (D2)26/10/2018 to 08/11/2018 (D2-2)Permission to perform Umrah for citizens and residents inside Saudi Arabia, starting from 4 October 2020, at a rate of 30% of capacity (6000 pilgrims/day), subject to health protection measures at the Holy Mosque, and 40% (starting from 30 May 2020) of the total capacity subject to health protection measures at the Prophet’s Mosque.
P3 post-pandemic period18/10/2020 to 31/10/2020 (D3)09/11/2018 to 22/11/2018 (D3-2)Permission to perform Umrah, Ziarah and prayers for citizens and residents inside Saudi Arabia, starting from 18 October 2020, at 75% of capacity (15,000 pilgrims/day and 40,000 worshipers/day), subject to health protection measures at the Holy Mosque, and 75% of the total capacity subject to health protection measures at the Prophet’s Mosque and Rawdah (garden inside the Prophet’s Mosque that is often crowded with worshipers).
P4 post-pandemic period01/11/2020 to 15/11/2020 (D4)23/11/2018 to 07/12/218 (D4-2)Permission to perform Umrah, Ziarah and prayers for citizens and residents from inside and outside Saudi Arabia, from 1 November 2020, until the official announcement of the end of the COVID-19 pandemic, at 100% of capacity (20,000 pilgrims/day and 60,000 worshipers/day) subject to health protection measures. IRn addition, 100% of capacity (45,000 worshipers/day) subject to the health protection measures at the Prophet’s Mosque. The Saudi government reported that the arrival of pilgrims and visitors from the outside of Saudi Arabia would be gradual, and from countries where there are no health risks related to the COVID-19 virus.
P5 post-pandemic period16/11/2020 to 15/12/2020 (D5)08/12/2018 to 06/01/2019 (D5-2)As P4 period.
P6 post-pandemic period16/12/2020 to 13/01/2021 (D6)07/01/2019 to 05/02/2019 (D6-2)As P4 period.
P7 post-pandemic period14/01/2021 to 12/02/2021 (D7)06/02/2019 to 07/03/2019 (D7-2)As P4 period.
P8 post-pandemic period13/02/2021 to 13/03/2021 (D8)08/03/2019 to 05/04/2019 (D8-2)As P4 period.
P9 post-pandemic period14/03/2021 to 12/04/2021 (D9)06/04/2019 to 05/05/2019 (D9-2)As P4 period.
P10 post-pandemic period13/04/2021 to 12/05/2021 (D10)06/05/2019 to 03/06/2019 (D10-2)Increasing the capacity of the Holy Mosque to 50,000 pilgrims, and 100,000 daily.
P11 post-pandemic period13/05/2021 to 10/06/2021 (D11)04/06/2019 to 03/07/2019 (D11-2)As P10 period.
P12 post-pandemic period11/06/2021 to 10/07/2021 (D12)04/07/2019 to 01/08/2019 (D12-2)As P10 period.
P13 post-pandemic period11/07/2021 to 08/08/2021 (D13)02/08/2019 to 22/08/2019 (D13-2)Restriction of the number pilgrims in Hajj ritual to 60,000 pilgrims.
Table 2. The date ranges of the masks and the corrected dates.
MaskDatesCorrected Dates (Month)
M110/10/2018 to 08/11/2018D0 and D0-2.
M226/01/2020 to 24/02/2020D1 and D1-2.
M311/07/2021 to 08/08/2021D2 to D13 and D2-2 to D13-2.
Disclaimer/Publisher’s Note: The statements, opinions and data contained in all publications are solely those of the individual author(s) and contributor(s) and not of MDPI and/or the editor(s). MDPI and/or the editor(s) disclaim responsibility for any injury to people or property resulting from any ideas, methods, instructions or products referred to in the content.