Article

Non-Local Means De-Speckling Based on Multi-Directional Local Plane Inclination Angle

The School of Geography, Geomatics and Planning, Jiangsu Normal University, Xuzhou 221116, China
*
Author to whom correspondence should be addressed.
Remote Sens. 2023, 15(4), 1029; https://doi.org/10.3390/rs15041029
Submission received: 6 January 2023 / Revised: 10 February 2023 / Accepted: 10 February 2023 / Published: 13 February 2023
(This article belongs to the Section Remote Sensing Image Processing)

Abstract

:
The unavoidable speckle in SAR images seriously interferes with image quality and has a negative effect on subsequent image interpretation. The existing filters still need to be strengthened in terms of both noise suppression and edge preservation. Based on this, a novel non-local means filter by multi-directional local plane inclination angle (MDLPIA) is proposed. The proposed filter uses the MDLPIA to reconstruct a new weight function for non-local means filtering. One instance of simulation data and four real SAR images are used for filtering experiments. In the experiment, seven other filters with excellent performance are selected for comparison, and six quantitative indicators are selected for algorithm performance evaluation. The experimental results show that the proposed filter achieves good visual and index evaluation results, and the equivalent number of looks (ENL) is at least 22.13 times higher than the unfiltered image. The effectiveness and superiority of the proposed algorithm are thus verified.

Graphical Abstract

1. Introduction

SAR is a coherent imaging system that inevitably produces speckle on its image [1,2,3]. The existence of speckle interferes with the accurate expression of real object information in SAR images, damages the fine structure of the scene, seriously deteriorates image quality, and increases the difficulty of image interpretation [4,5,6,7]. Therefore, it is urgent to suppress speckle.
The early adoption of multi-looks filtering [8] reduces SAR image resolution, which no longer meets the current application requirements. Subsequently, a series of filtering methods have been proposed, which can be classified into the following five categories: spatial domain filtering [9,10,11,12], transform domain filtering [13,14,15], anisotropic diffusion filtering [1,16,17,18,19], non-local means (NL-means) filtering [20,21,22,23,24], and deep learning filtering [25,26,27,28,29,30,31,32].
The spatial domain filtering is simple in complexity and can effectively smooth the speckle noise. However, it is difficult to manage effectively with edge filtering at strong points [1]. The transform domain filter can also effectively suppress speckle, but it usually requires image reconstruction between different domains, and is prone to generating the pseudo-Gibbs effect [33]. Anisotropic diffusion filtering can theoretically realize speckle suppression at different scales at each pixel point by constructing different diffusion coefficients [34]. However, this method requires multiple iterations, and the number of iterations is mostly set manually. In recent years, a filter based on deep learning has attracted much attention in scientific and technological works. Most recent self-supervised methods can effectively learn to de-speckle without clean SAR images, achieving relatively good de-speckling effect [8,26,27].
Non-local means filtering is one of the commonly used filtering models, which has been used since it was proposed in 2005 [20]. The core idea of NL-means filtering is to define filtering as weighted-average processing in a certain range. This idea also reveals the essence of most filtering algorithms to some extent. The original NL-means filtering uses a similarity function to describe the similarity relationship between the pixel window and reference window in a local neighborhood and then weights all neighborhood values with different degrees of correlation to achieve filtering. The key to NL-means filtering is to build an accurate weight function. Improved versions based on the NL-means filter mostly focus on this aspect. The probabilistic patch-based (PPB) filter [35], an extension of the non-local means filter, uses both the similarity between noisy patches and the similarity of patches extracted from the previous estimate to iteratively refine weights. The PPB filter has achieved a remarkable filtering effect, which further verifies the effectiveness of the NL-means filtering strategy. The discontinuity-adaptive NL-means filter (DA-NLMF) [36] incorporates discontinuity adaptive weights to replace Gaussian weights for patch similarity. The SAR-oriented version of block-matching 3D (SAR-BM3-D) [37] uses the probabilistic noise distribution in speckle and the wavelet shrinkage in the 3D domain to update the similarity measure of the NL-means filter. Fast adaptive non-local SAR filter (FANS) [38] uses a variable-size search area and a probabilistic early termination approach to further speed up block-matching. A multi-scale fusion-based steerable kernel function [39] replaces the fixed Gaussian kernel used for computing the weight. The sub-region non-local mean filter [40] uses a probability image to divide homogeneous and heterogeneous regions and builds different weight functions for the homogeneous and heterogeneous regions. These enhancements based on the weight function have improved the filtering performance to a certain extent. However, for complex SAR speckle noise, the weight function still has room for further improvement.
In this paper, a novel NL-means filter base on multi-directional local plane inclination angle (MDLPIA), called MDLPIA-NLM, is proposed. The proposed MDLPIA-NLM filter can better obtain weight by using a multi-directional local plane inclination angle, which provides a better filtering effect. Experimental results have been obtained using simulation images and four real SAR images. The experimental results verify the feasibility and effectiveness of the proposed MDLPIA-NLM method.

2. Materials and Methods

2.1. Speckle Noise

Speckle is not real noise in a strict sense, which is an expression of ground object backscattering under a coherent multiplicative system. However, the existence of speckle has a serious negative impact on image quality. The probability density function (PDF) of speckle N can be modeled in intensity and amplitude images, respectively, as follows:
F I ( N ) = L L Γ ( L ) N L 1 exp ( L N )
F A ( N ) = 2 L L Γ ( L ) N 2 L 1 exp ( L N 2 )
where I and A represent SAR intensity and amplitude images, respectively; L denotes the number of looks; and Γ ( x ) is the gamma function.
The above PDF shows the statistical characteristics of the speckle. However, how the noise affects the real signal needs to be illustrated further. The multiplicative noise model is currently the most widely accepted by scientific researchers. Different from the additive noise model, the multiplicative noise model describes that the real SAR image is composed of noise and a real signal by multiplication. The specific model is as follows:
I R = I T N
where I R and I T are real and noise-free SAR images, respectively, and N denotes the speckle.

2.2. Non-Local Means Filter

The core of the NL-means filter is based on a wide class consensus that de-noising is achieved by averaging. For a discrete SAR image, the NL-means filter constructs a local weighted average filter model as follows:
I NL F ( s ) = t I R w ( s , t ) I t R
where I R and I F denote real and filtered images, respectively, NL denotes the NL-means filter, s and t denote the pixel position, and w ( s , t ) denotes the weight function based on the similarity between pixels s and t .
It must be pointed out that the key to this filtering strategy is to accurately construct the weight function. In the NL-means filter, the weight function w ( s , t ) is modeled as follows:
w ( s , t ) = 1 Z ( s ) e I R ( N s ) I R ( N t ) 2 2 , a h 2
where N k denotes a square neighborhood of fixed size and centered at a pixel k , I R ( N s ) and I R ( N t ) are the values of the neighborhood pixels values at pixels s and t , h acts as a degree of filtering, I R ( N s ) I R ( N t ) 2 2 , a denotes a decreasing function of the weighted Euclidean distance (more details can be seen in [20]), and Z ( s ) is the normalizing constant, modeled as follows:
Z ( s ) = t e I R ( N s ) I R ( N t ) 2 2 , a h 2
where the definitions of all symbols in Equation (6) are the same as for Equation (5).
Obviously, a better weight function can obtain better filtering results. Therefore, in the field of NL-means filtering, the reconstruction of the weight function has always been one of the important innovations. Among many improved NL-means filters, the PPB filter provides a better weight function w ( s , t ) ( i t . PPB ) with a good filtering effect, which can be constructed as follows:
w ( s , t ) ( i t . PPB ) = exp [ k ( 2 L 1 h log ( A s , k A t , k + A t , k A s , k ) + L T | R ^ s , k i 1 R ^ t , k i 1 | 2 R ^ s , k i 1 R ^ t , k i 1 ) ]
where the definition of each symbol in Equation (7) can be seen in [35]. Note that T is the parameter used to balance the noise reduction and the fidelity of the estimate. However, it should be noted that parameter T in the PPB filter is not adaptive and needs to be manually selected, which, to some extent, affects the filtering effect. There is still room for further optimization of the weight function.

2.3. Proposed Weight Function

2.3.1. Local Plane Inclination Angle

An excellent filter is often expected to improve both noise removal and edge preservation. In fact, noise filtering is not difficult, and simple average processing can be completed. However, to retain the edge information better, it is more important to find the image edge accurately and weaken the smoothing scale.
The pixel difference is often the most direct information to express the SAR image edge. However, due to speckle noise, the method of directly calculating pixel difference is not optimal. To solve this problem, the local plane inclination angle (LPIA) is proposed to simulate the pixel difference. The LPIA is obtained from the angle between the local plane normal vector and the vertical vector [0,0,1], as shown in Figure 1.
As we all know, every pixel in a SAR image contains important information in three dimensions, namely, two-dimensional plane position and pixel value. Therefore, a three-dimensional space of o-xyz is defined in Figure 1. The o-xy plane is used for denoting the two-dimensional plane position of SAR image, and the value of z direction is used for denoting the pixel value. The origin of o-xyz is the starting position of the image row and column with the z direction of 0. P1 and P2 in Figure 1 are the planes composed of three points. P1xy and P2xy are, respectively, the projections of P1 and P2 on the o-xy plane. When the three points constituting the plane P have the same value in the z direction (for example, zA1 = zB1 = zC1 in Figure 1), then plane P is parallel to the projection plane on the o-xy plane (P1 is parallel to P1xy in Figure 1); otherwise (for example, the values of zA2, zB2, and zC2 in Figure 1 are not completely equal), plane P is not parallel to the projection plane (P2 is not parallel to P2xy in Figure 1). Here, the V described in Figure 1 is the vertical vector [0,0,1], and L1 and L2 described in Figure 1 denote the normal vector perpendicular to the plane P1 and P2. When P1 is parallel to P1xy, the normal vector of plane P1 is parallel to the z direction—that is, parallel to the direction of the vertical vector V—and at this time, the angle between the plane’s normal direction and the vertical vector V is 0. In other cases, the plane’s normal direction and vertical vector V produce an angle other than 0, and its size is related to the plane’s inclination—the higher the tilt, the greater the angle, and the higher the plane’s inclination, the greater the angle.
The above LPIA can be extended to SAR images. When the three pixels constituting the plane have the same pixel value, the normal vector of the constructed plane is parallel to the vertical vector V of the image, and the LPIA is 0; on the contrary, when the three pixels are not equal, an inclined plane is generated, and the LPIA is not 0; furthermore, the greater the pixel difference, the larger the LPIA value. Therefore, the LPIA can reflect the local pixel difference value well. The LPIA can be modeled as follows:
LPIA = arccos ( L V | L | | V | )
where L and V are, respectively, the normal vector of the constructed plane and the vertical vector [0,0,1]. The unit of LPIA is expressed in radians.

2.3.2. Multi-Directional LPIA

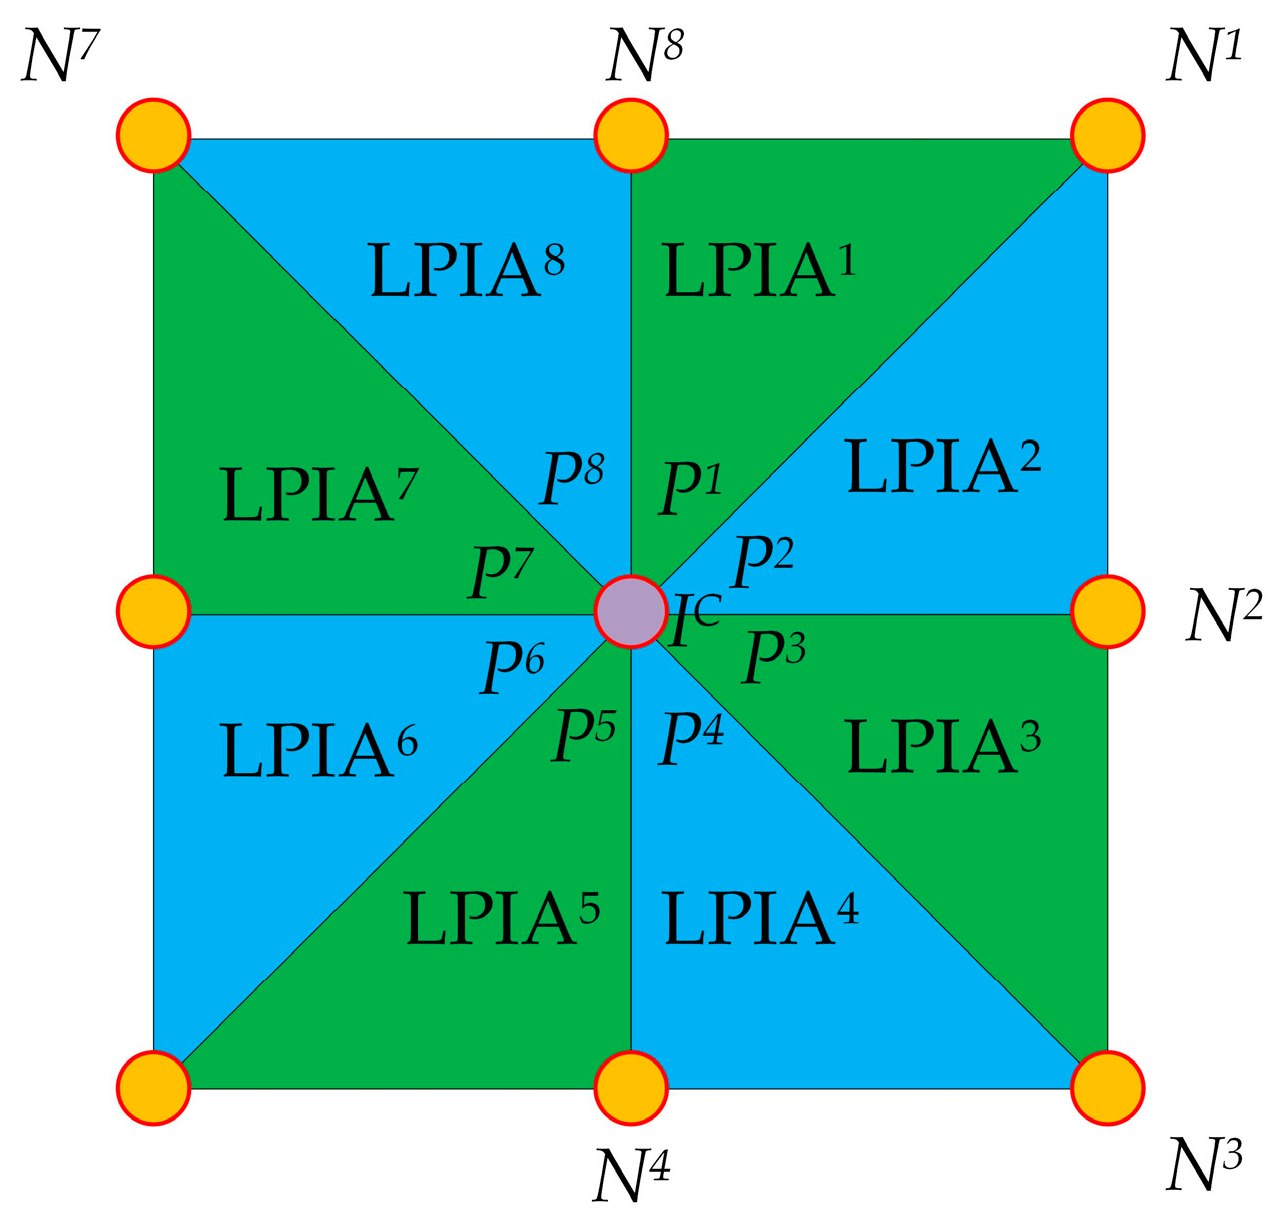
The LPIA can reflect the different values of each pixel in the same plane well, but the plane construction only contains three pixels, which does not describe the different relationships between a point and other neighborhood points well. Therefore, a multi-directional LPIA is further proposed, as shown in Figure 2.
In Figure 2, eight local planes Pi (i = 1, 2, 3, …, 8) in different directions are constructed with eight pixels Ni (i = 1, 2, 3, …, 8) in the neighborhood based on the center pixel I C , and the corresponding LPIAi (i = 1, 2, 3, …, 8) can be obtained based on Equation (8) to form the following multi-directional LPIA matrix:
MDLPIA = [ LPIA 7 LPIA 8 LPIA 1 LPIA 6 0 LPIA 2 LPIA 5 LPIA 4 LPIA 3 ]
where MDLPIA denotes the multi-directional LPIA matrix.

2.3.3. Weight Function Using MDLPIA

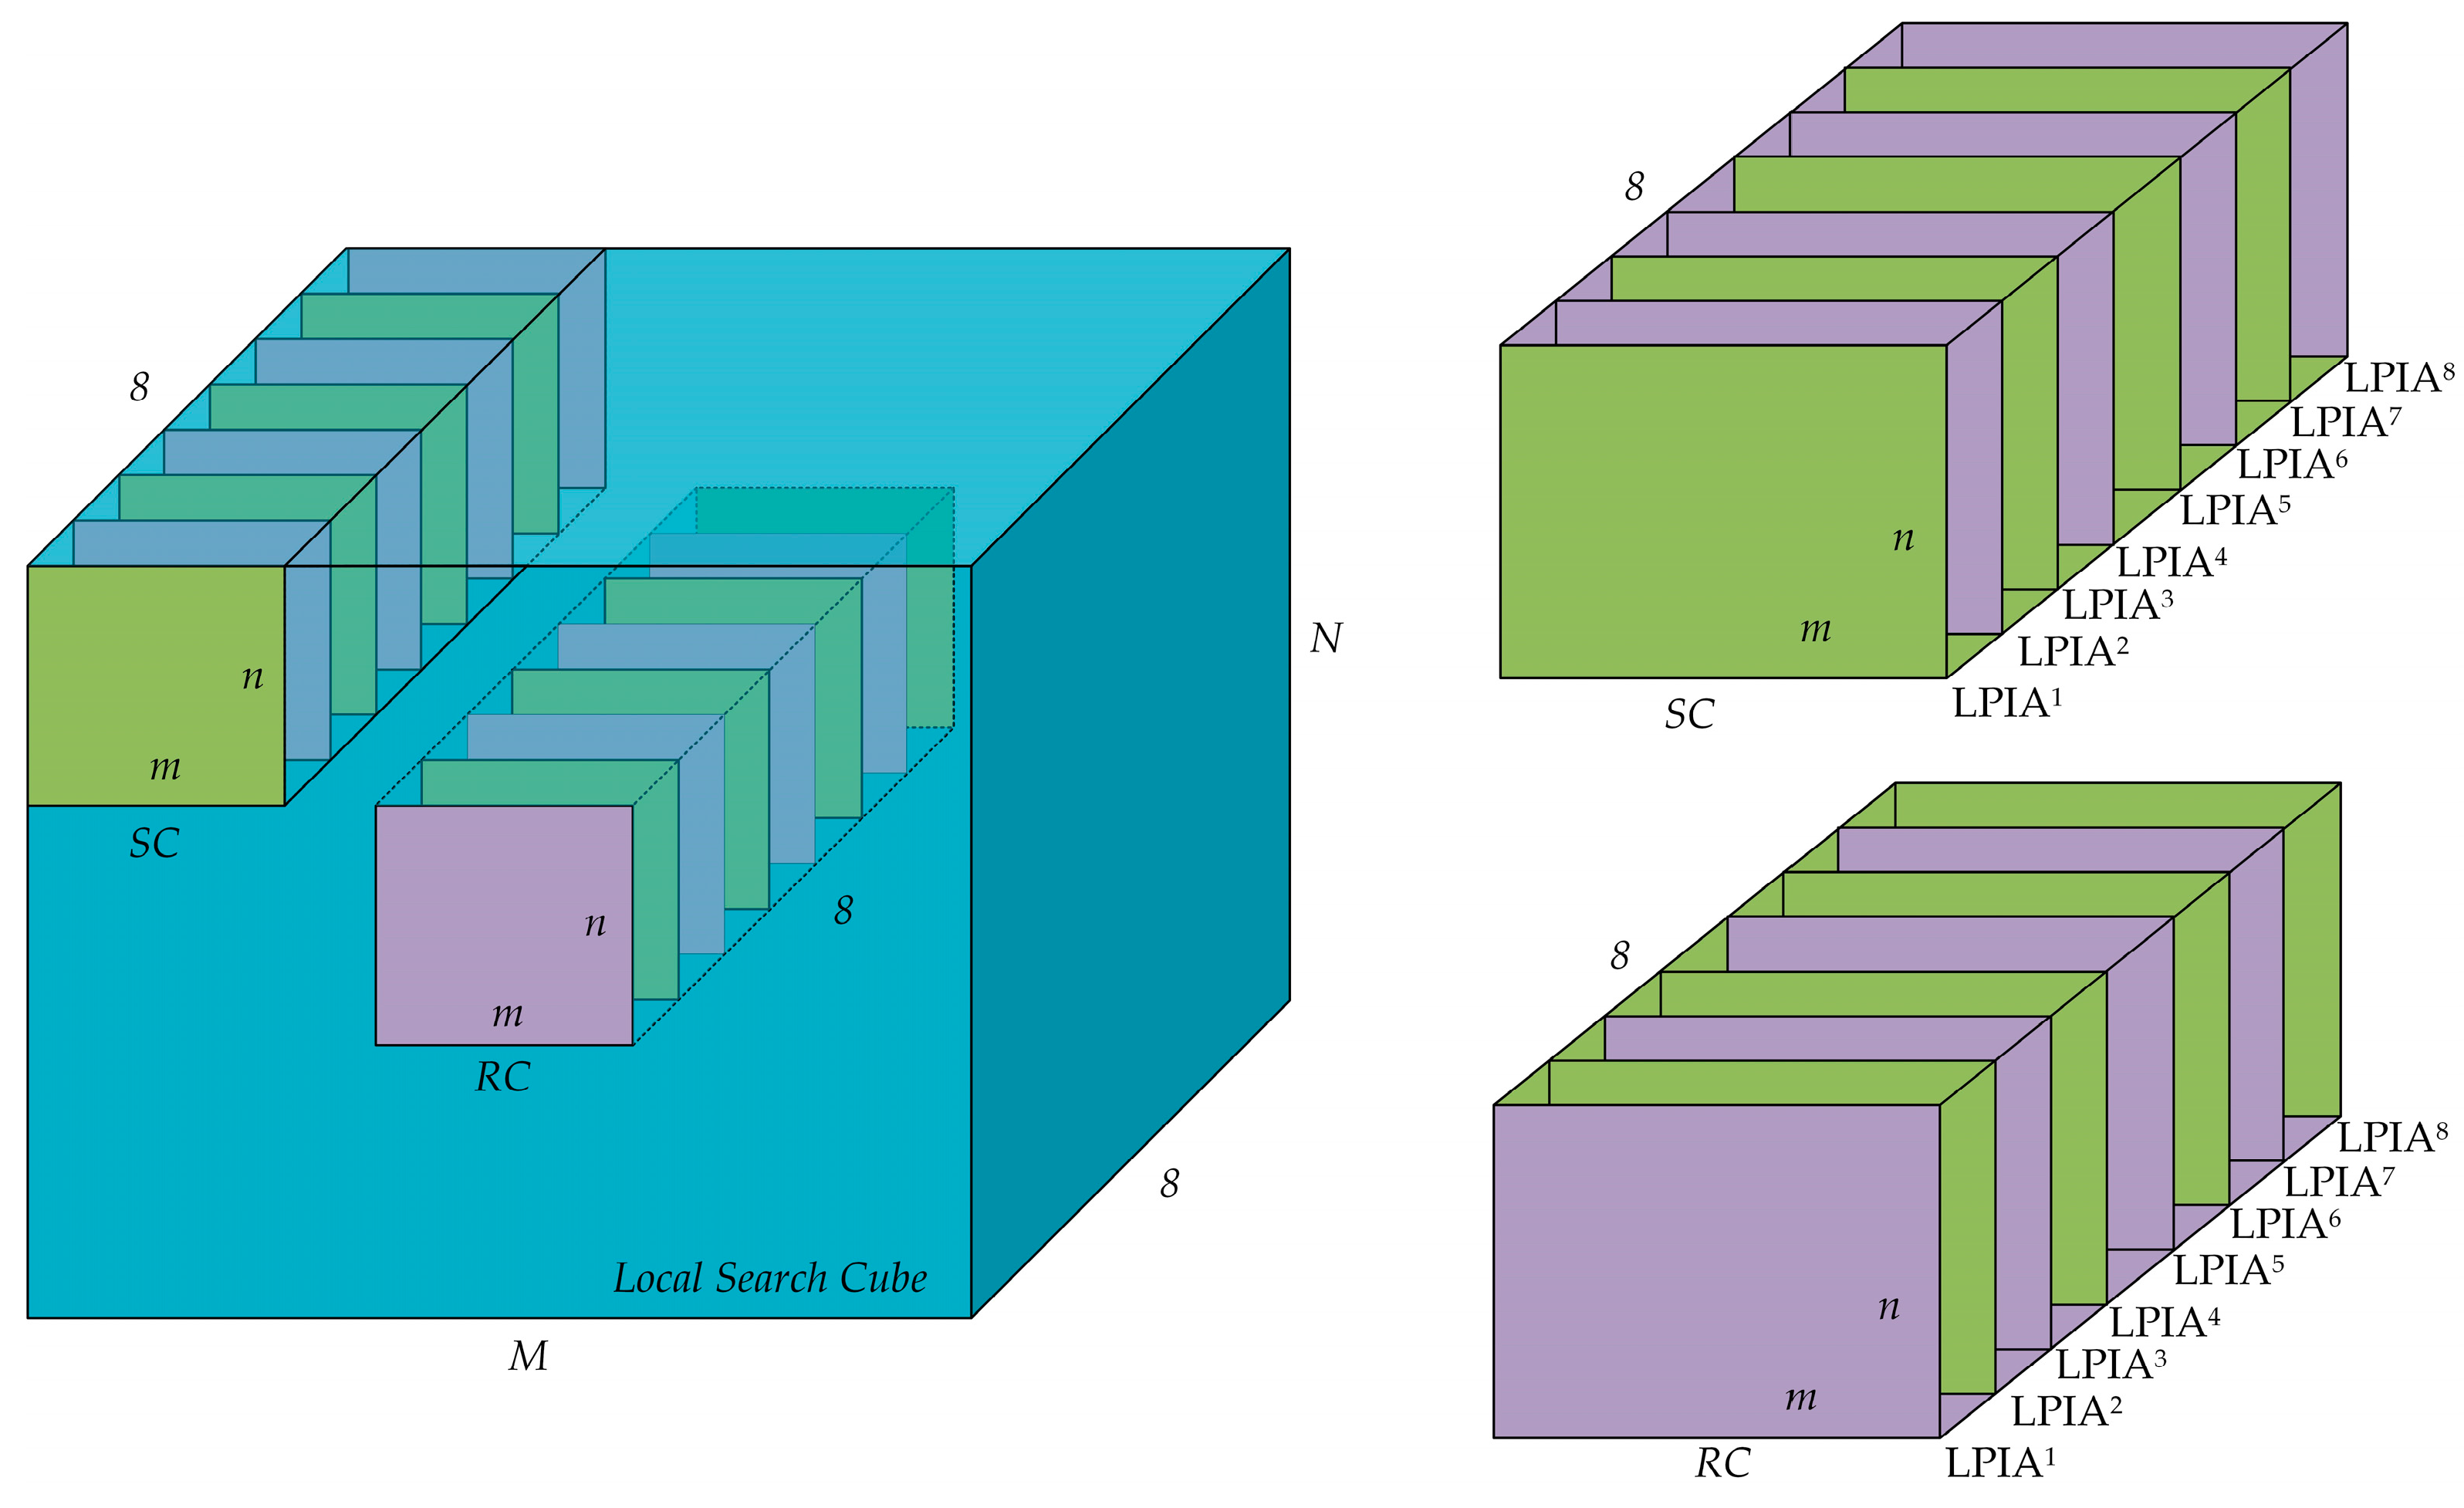
The constructed MDLPIA matrix can effectively reflect the neighborhood differences in local regions, which can be used for constructing a new non-local means weight function. The novel weight function is based on the cube similarity of MDLPIA. First, the MDLPIA matrix of the global image is built using Equation (9). At this time, each pixel contains LPIA values in 8 directions. The LPIA values at the corresponding positions of all pixels are formed into a plane, respectively, which can form a total of 8 planes. The 8 planes can be stacked in parallel to form a cube, which is similar to SC and RC in Figure 3. In Figure 3, SC and RC are, respectively, the search cubes and referenced cubes with the same size of m × n × 8, and the size of local search cube is M × N × 8. The cube similarity can be obtained based on SC and RC, and the calculation model is as follows:
W MDLPIA ( s , t ) = 1 N o r ( s ) e i , j , l Ω k i , j , h ( S C i , j , l s R C i , j , l t ) 2 h 2
where W MDLPIA ( s , t ) denotes the weight function using MDLPIA between pixels s and t ; i , j , l denote the pixel position in search cubes S C and referenced cubes R C ; Ω donates a square pixel neighborhood of SC and RC; k is Gaussian weight; h acts as a degree of filtering; and N o r ( s ) is the normalizing constant, modeled as follows:
N o r ( s ) = t e i , j , l Ω k i , j , h ( S C i , j , l s R C i , j , l t ) 2 h 2
where the definitions of all symbols in Equation (11) are the same as for Equation (10).
It can be seen that the similarity of two cubes can be obtained when Equations (10) and (11) are used. When sliding cube SC moves in the local search cube, the similarity between different cubes and the reference cube in the region can be obtained.

2.4. Proposed Filter

Based on the above theory, a novel filter using cube-similarity-based non-local means is proposed. The proposed novel filter is an improved version of the NL-means filter, mainly based on optimizing the weight function. Based on the optimized weight function, the filtering model can be further updated as follows:
I MDLPIA NLM F ( s ) = t I R W MDLPIA ( s , t ) I t R
where I R and I F denote real and filtered images, respectively; MDLPIA-NLM denotes the MDLPIA-NLM filter; s and t denote the pixel position; and W MDLPIA ( s , t ) denotes the weight function using MDLPIA between pixels s and t .
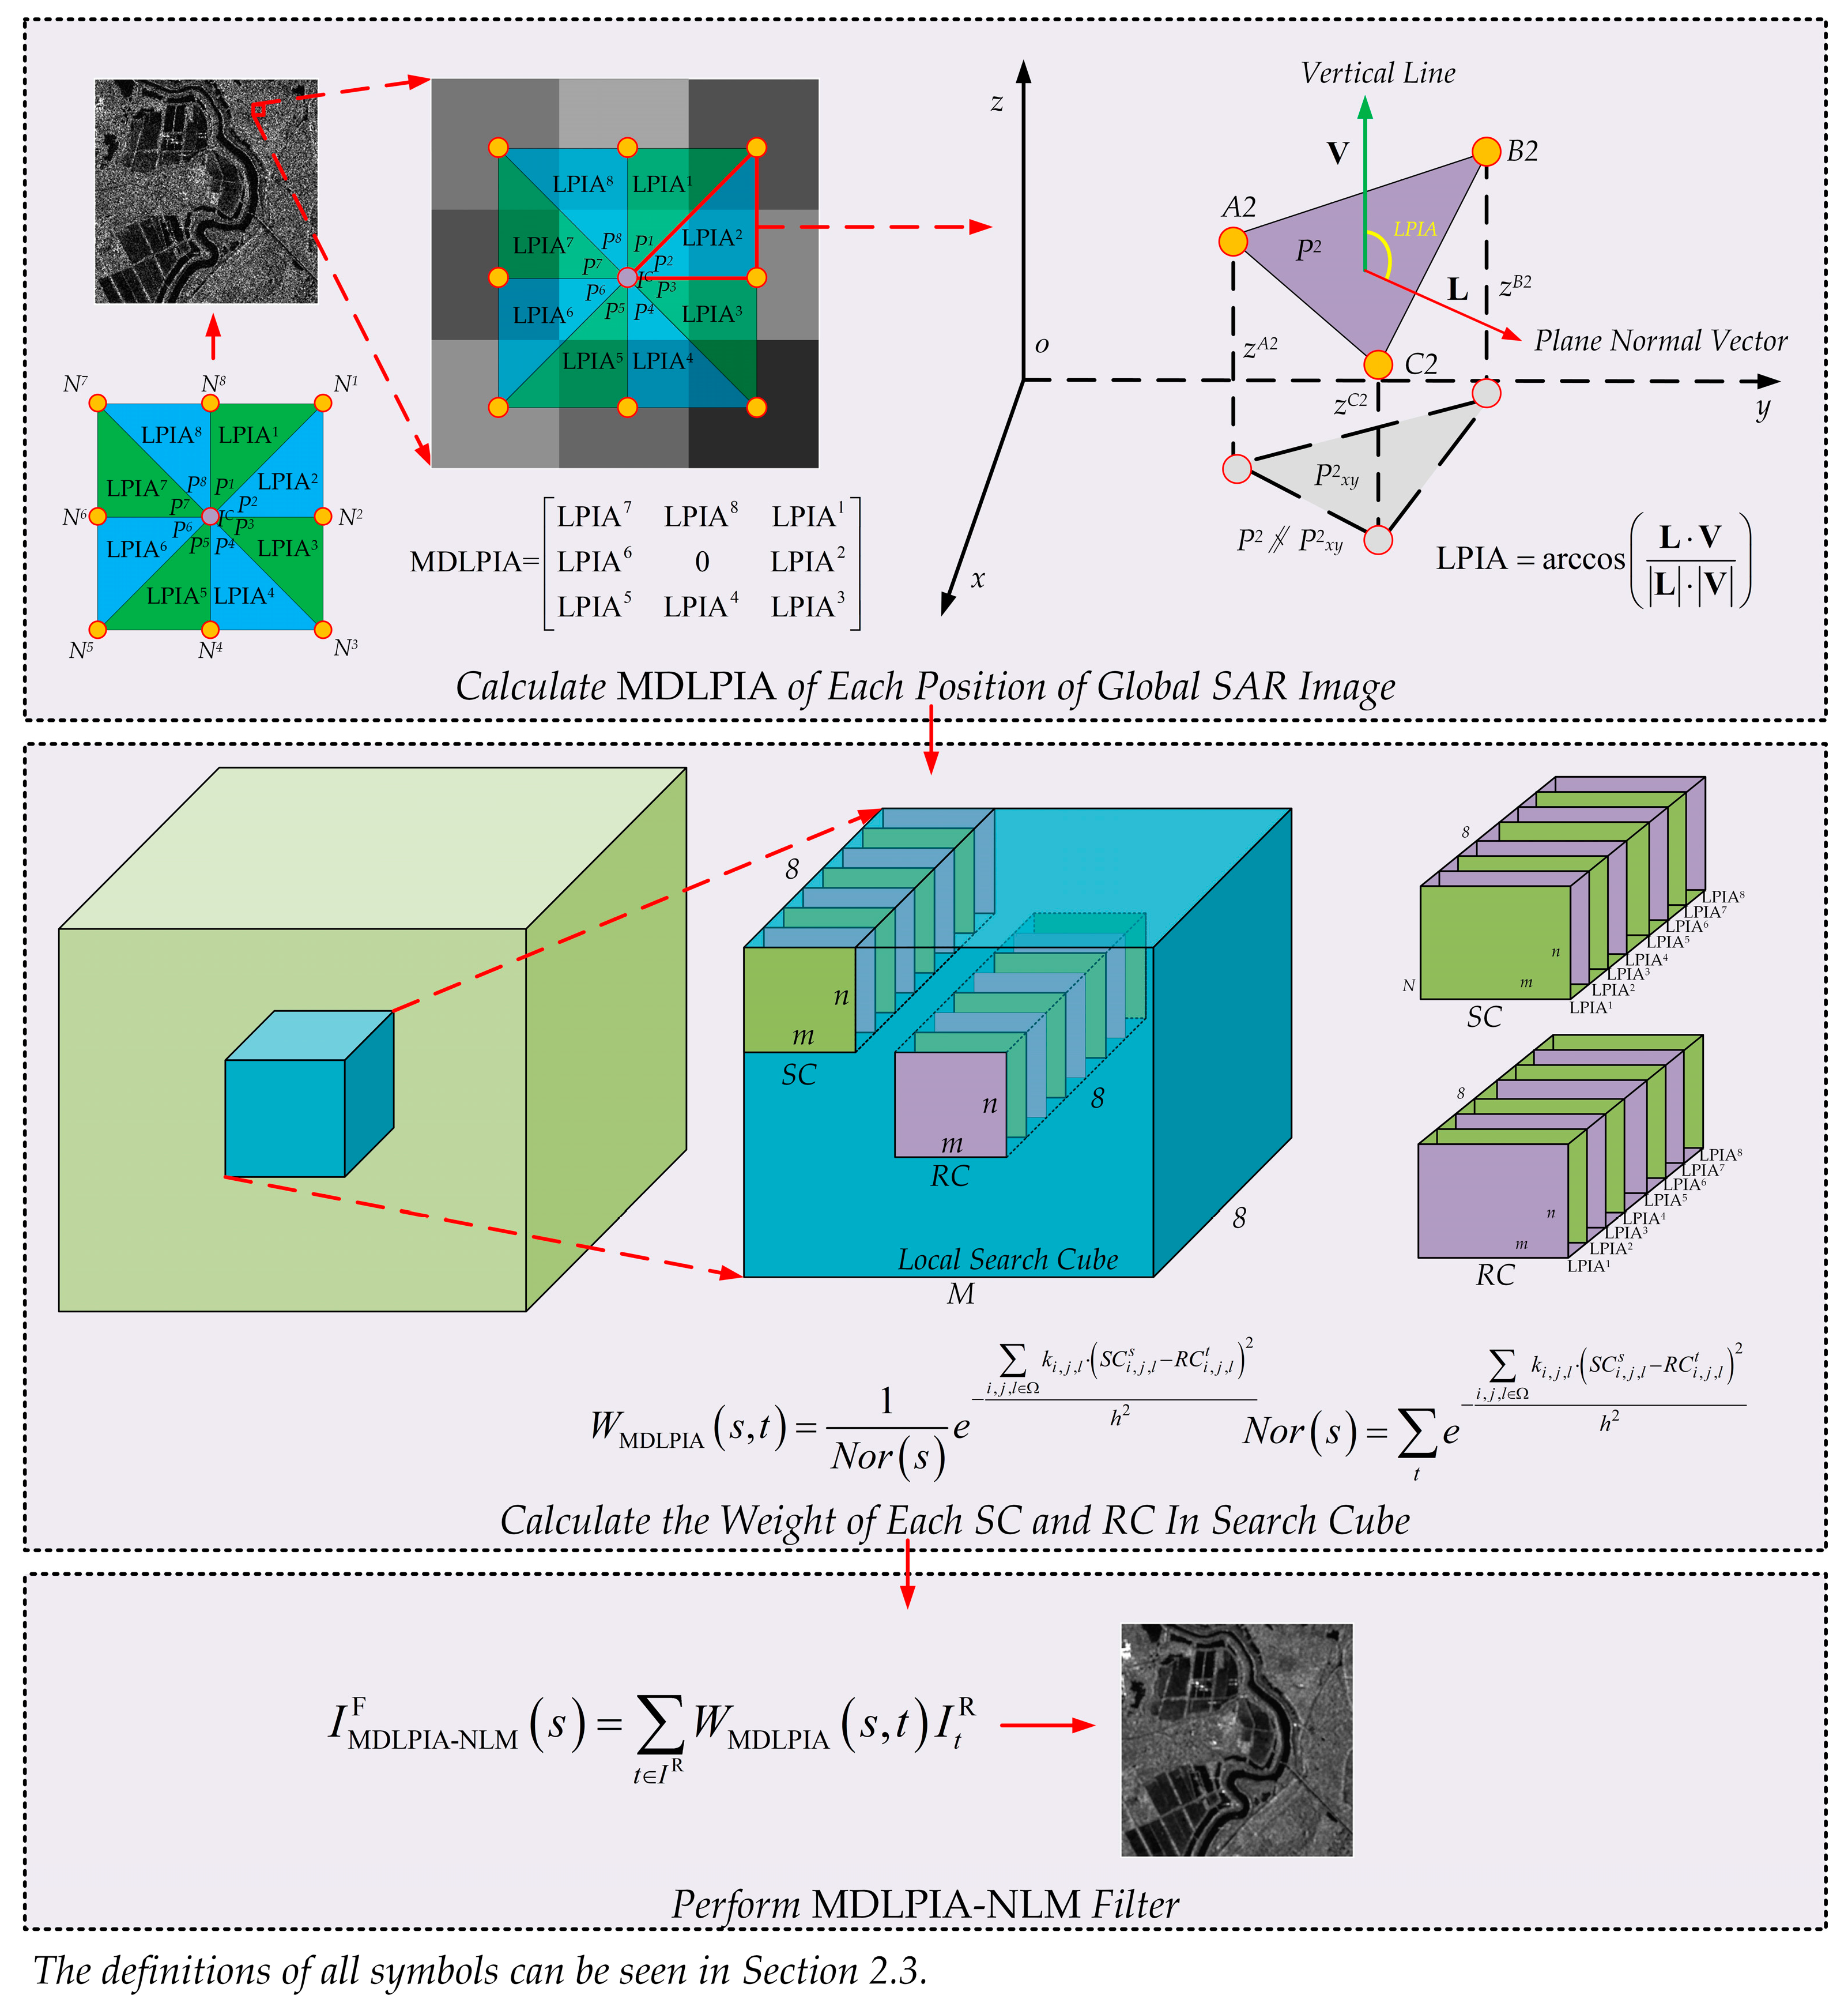
The specific flow chart of the MDLPIA-NLM filter is shown in Figure 4, and the steps are as follows:
  • Calculate the MDLPIA of each position of the global SAR image using Equations (8) and (9);
  • Calculate the weight of each SC and RC in the search cube using Equations (10) and (11);
  • Perform the MDLPIA-NLM filter in Equation (12).

3. Results

3.1. Experimental Data

One simulation image and four single-look SAR images were adopted for the experiment, as shown in Figure 5. In terms of constructing simulation data, a clean image was first made by MATLAB R2019a, and then multiplicative noise with a mean value of 1 and a variance of 0.1 was added to the clean image, as shown in Figure 5a. The real SAR images come from different sensors with different bands, resolutions, and polarization. The specific parameters are shown in Table 1.

3.2. Experimental Methods

In the experiment, the proposed MDLPIA-NLM filter and seven other excellent methods (DPAD filter [19], EnLee filter [9], SAR-BM3-D filter [37], FANS filter [38], PPB filter [35], DnCNN filter [25], and NL-means filter [20]) were selected. The parameters of each algorithm were established by referring to the original literature, and the codes were obtained online.

3.3. Evaluation Methods

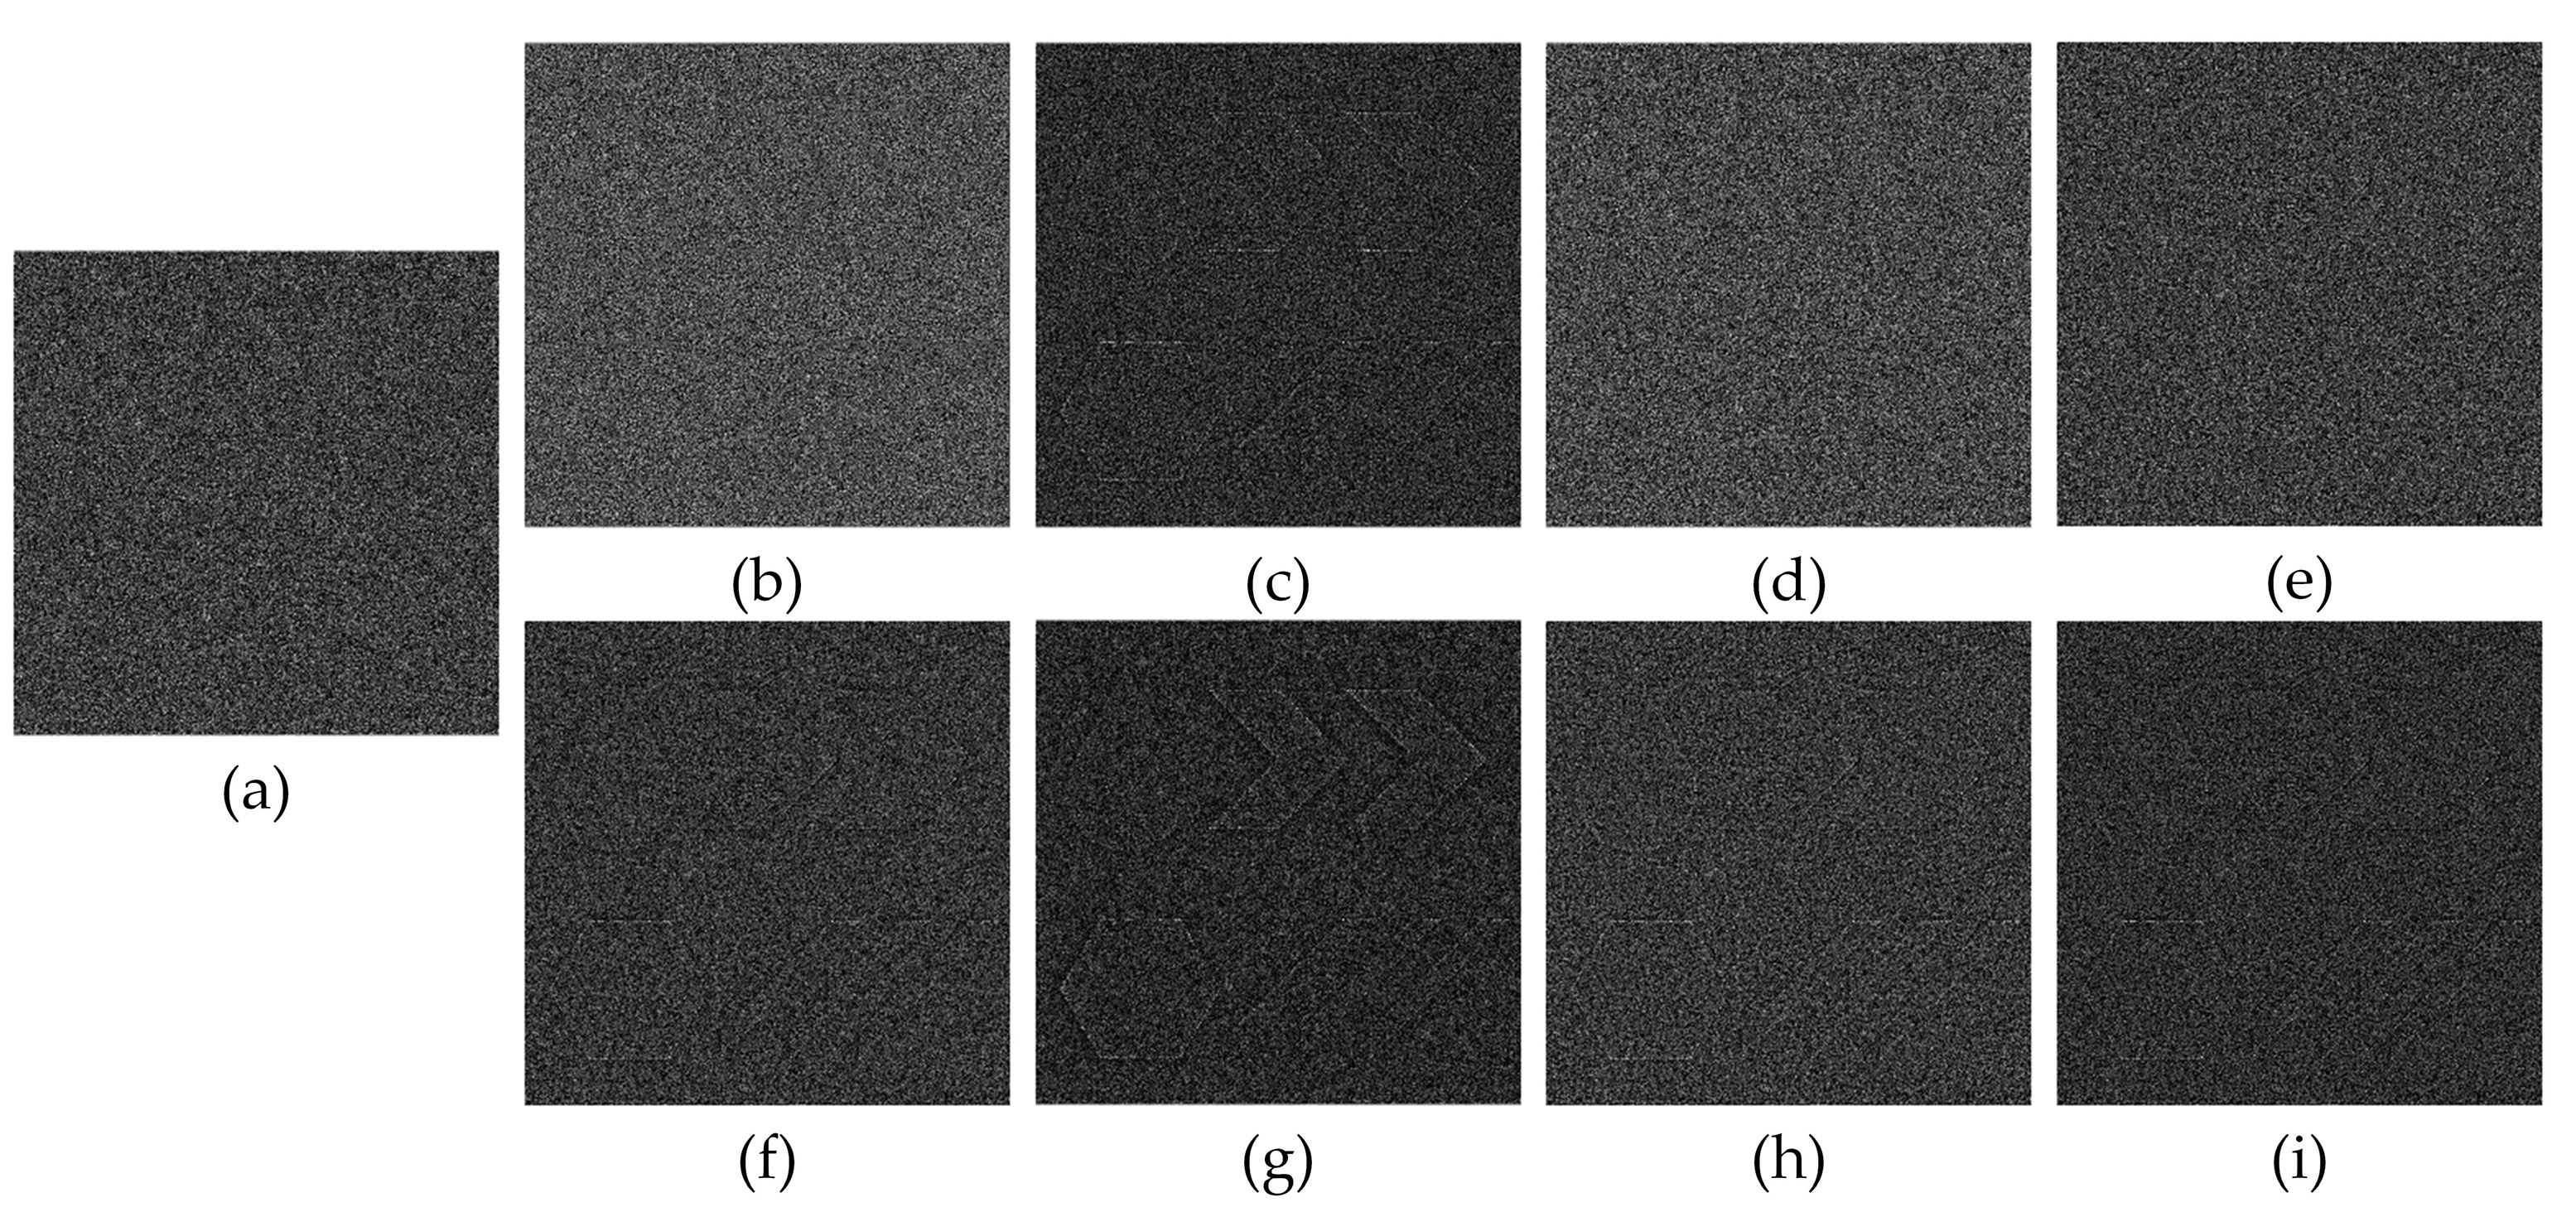
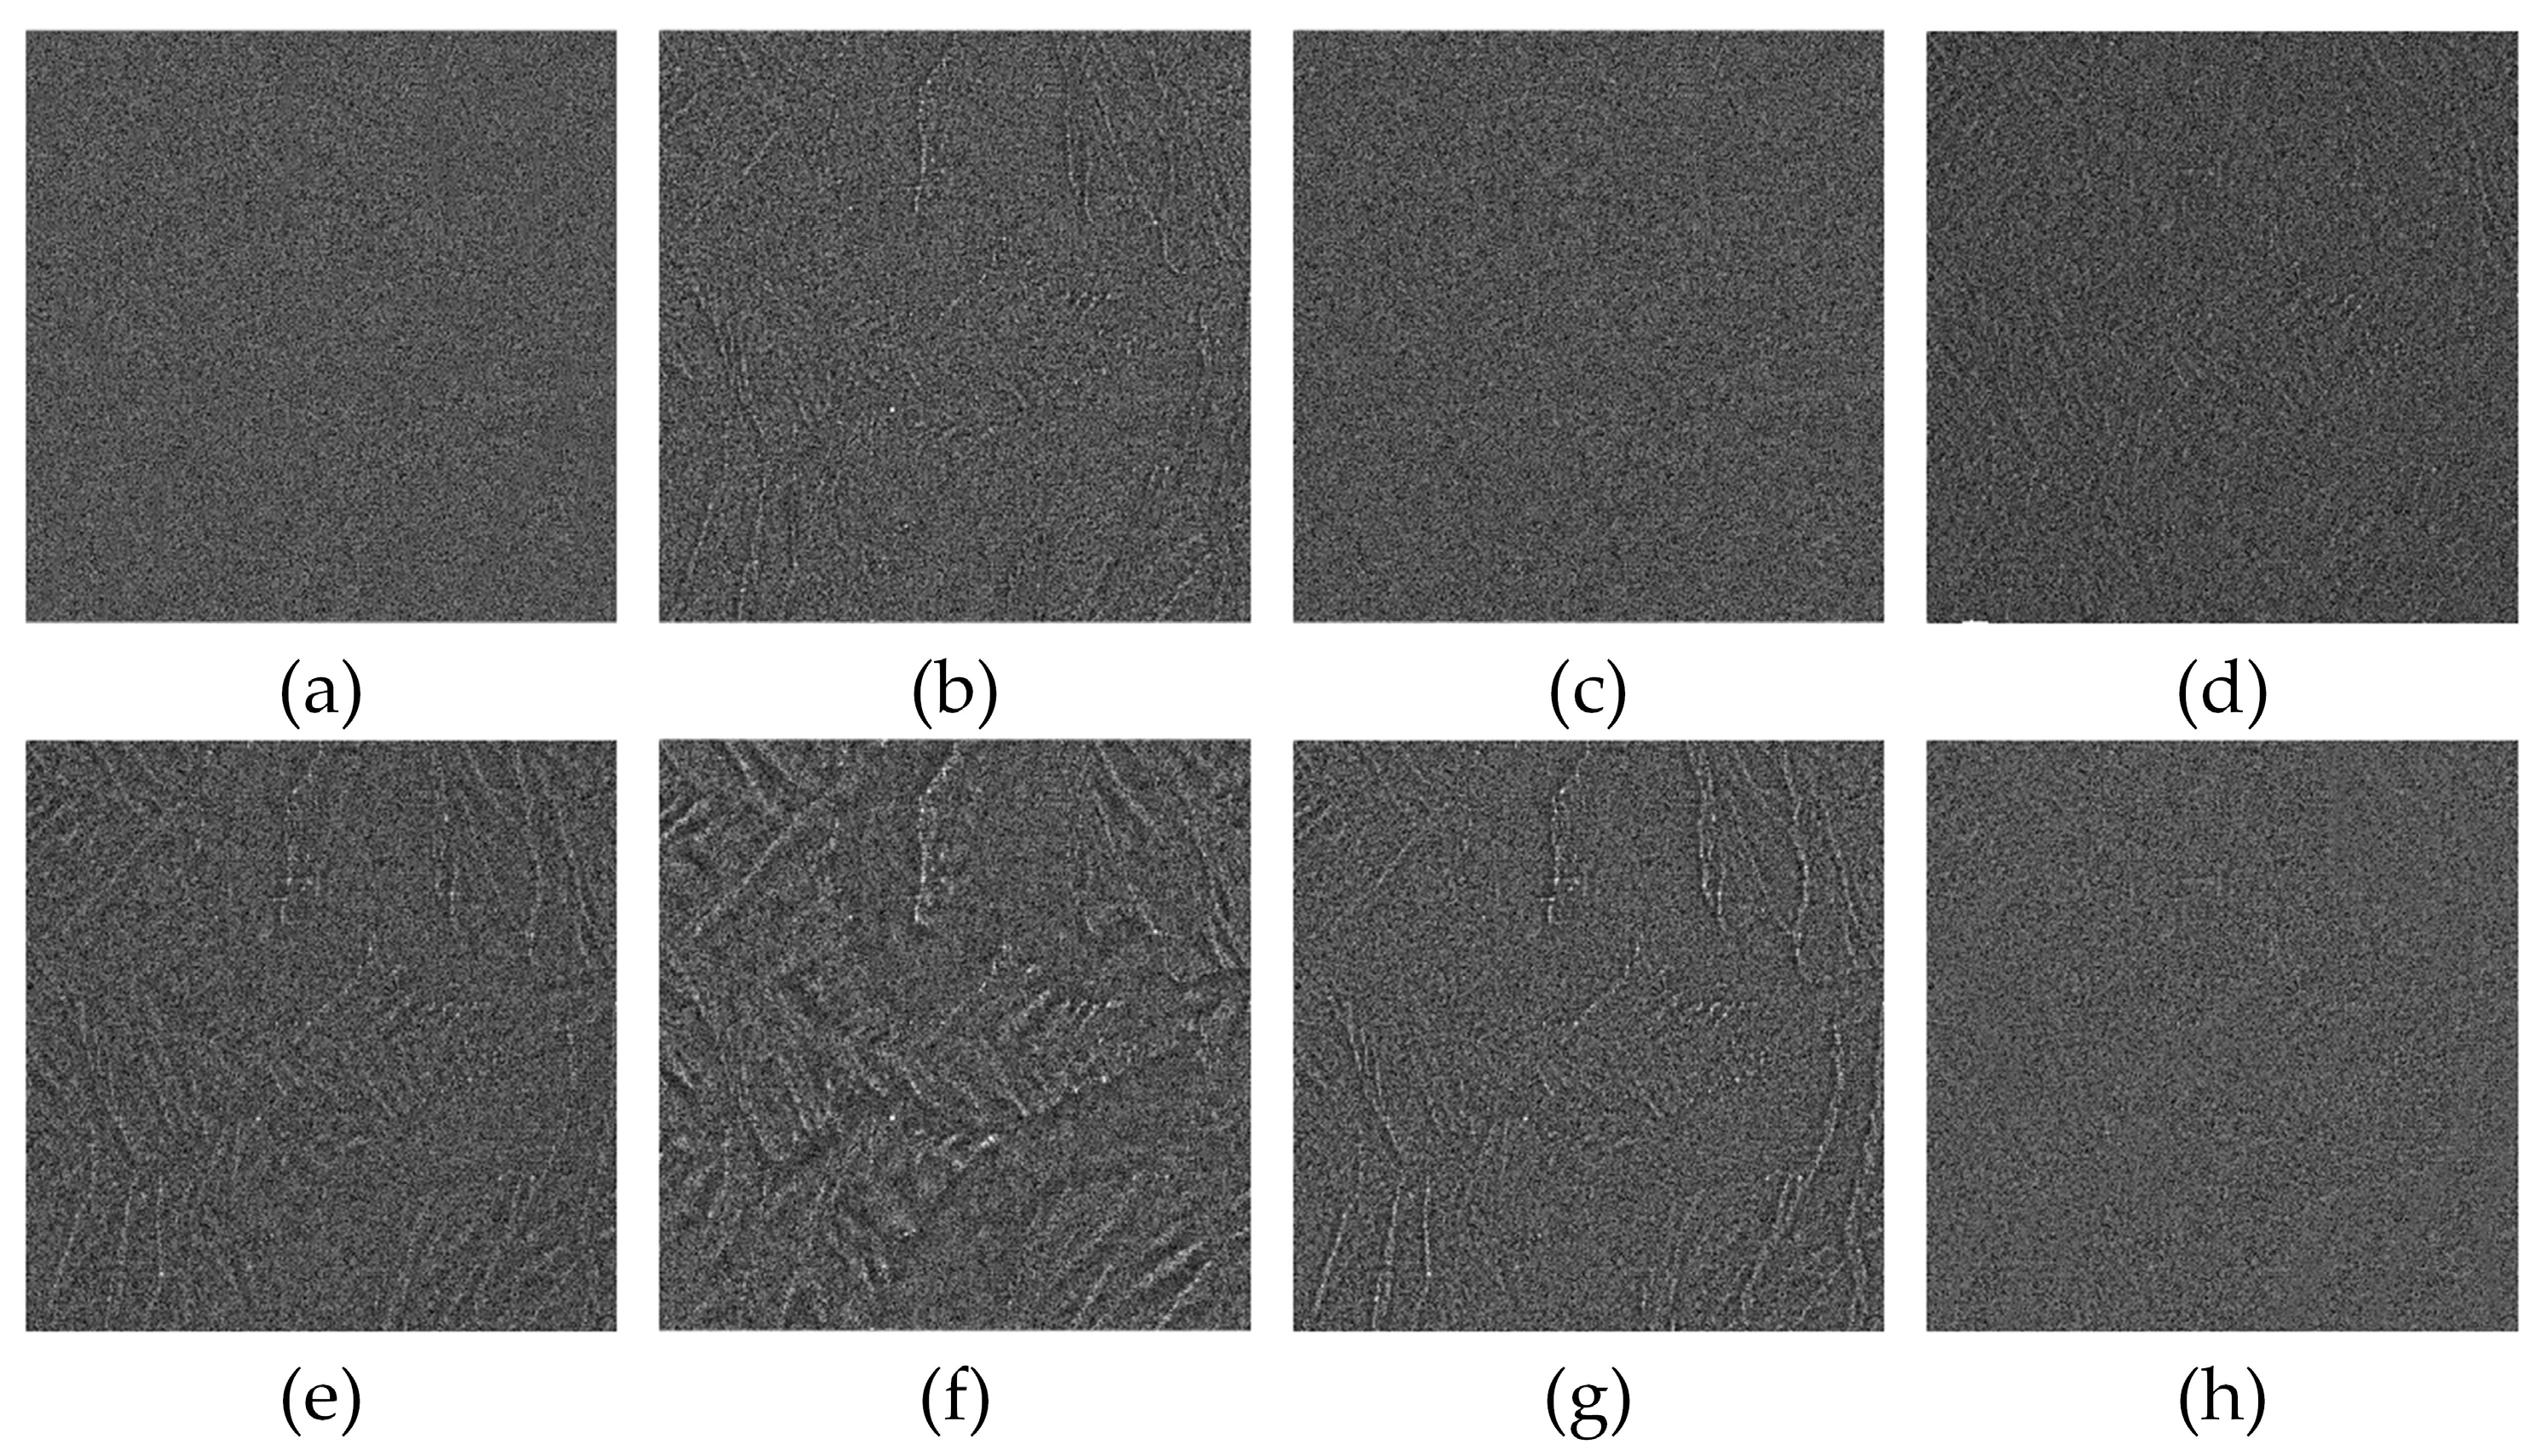
The experiment combined quantitative and qualitative methods to evaluate the algorithm’s performance. In terms of qualitative evaluation, the strategy of a visual evaluation was adopted. The visual evaluation mainly evaluated the noise filtering of the filtered image and the residual edge information in the ratio image. The ratio image here is obtained by dividing the noisy image by the filtered image. If perfect filtering is performed, the ratio image will contain only noise and no other details. In terms of quantitative evaluation, six evaluation indicators were adopted. The evaluation index focuses on the speckle-reduction effect and edge preservation of the filtered image. The specific evaluation indicators are as follows:

3.3.1. Equivalent Number of Looks

The equivalent number of looks (ENL) was used to evaluate the speckle-reduction effect of the filtered image, which can be modeled as follows:
ENL = u H 2 V H
where u H and V H are the mean and variance of homogeneous region H , respectively. A higher ENL value indicates a better noise-removal effect.

3.3.2. Speckle-Suppression Index

The speckle-suppression index (SSI) [41] was also used to evaluate the effect of speckle reduction, which can be modeled as follows:
SSI = V F u F u R V R
where u F and V F are the mean and variance of filtered image, respectively; u R and V R are the mean and variance of the original image, respectively. A lower SSI value indicates a better noise-removal effect.

3.3.3. Edge-Saving Index

The edge-saving index (ESI) [42] was mainly used to evaluate the effect of edge preservation, which can be modeled as follows:
ESI = i = 1 M 1 j = 1 N 1 ( u F ( i , j ) u F ( i + 1 , j ) ) 2 + ( u F ( i , j ) u F ( i , j + 1 ) ) 2 i = 1 M 1 j = 1 N 1 ( u R ( i , j ) u R ( i + 1 , j ) ) 2 + ( u R ( i , j ) u R ( i , j + 1 ) ) 2
where u R and u F denote the mean of real and filtered SAR images, respectively; M , N denotes the image size used in calculation; and i , j denote the pixel position. A higher ESI value indicates a better edge-preservation effect.

3.3.4. Structural Similarity

Structural similarity (SSIM) [43] was also used to evaluate the effect of edge preservation, which can be modeled as follows:
SSIM = ( 2 u R u F + C 1 ) ( 2 V RF + C 2 ) ( u R 2 + u F 2 + C 1 ) ( V R + V F + C 2 )
where u R and u F denote the mean of real and filtered SAR images, respectively; V R and V F are the variance of real and filtered SAR images, respectively; V RF denotes the covariance of real and filtered SAR images; and C 1 and C 2 are the constants used to avoid a denominator of 0. A higher SSIM value indicates a better edge-preservation effect.

3.3.5. M-Index

The M-Index [44] was used to evaluate both the speckle reduction and edge preservation, which can be modeled as follows:
M = r E ^ N L , u ^ + δ h
where r E ^ N L , u ^ and δ h are used for speckle reduction and edge preservation, respectively. More details can be seen in [44]. A lower M-Index value indicates better noise removal and edge-preservation effects.

3.3.6. Kullback–Leibler Divergence

The Kullback–Leibler divergence (KLD) can be used for comparing the probability distribution in the filtered image and noiseless image, which can be modeled as follows:
KLD = i , j Ω P P i , j I F log [ P i , j I F P i , j I T ]
where P denotes the probability distribution; i , j denote the pixel position; Ω P denotes the pixel region calculated by KLD; and I T and I F denote the noise-free and filtered SAR image. The ideal value of KLD is zero.
It should be pointed out that the KLD needs a true noiseless image, but it is difficult to obtain this from a real SAR image. Therefore, it is only used to evaluate the filtering experiment of the simulated image.

3.4. Filtering Experiment

3.4.1. Simulated Data

The simulation data were first filtered. The experimental results are shown in Figure 6, the ratio images are shown in Figure 7, and the index evaluation results are shown in Table 2.
Figure 6 shows the filtered images and their local magnified images for the eight filtering algorithms. It can be seen from Figure 6 that the eight filters removed the noise, which directly shows the effectiveness of various filtering algorithms used in this paper. However, through more careful observation, it is found that the effects of various filters are different. Images filtered using the DPAD method have many pixel regions that are not smooth locally, as shown in Figure 6(b2). Some independently high pixels appear in the EnLee-filtered image, as shown in Figure 6(c1). Images filtered using the SAR-BM3-D and PPB methods have good visual effect overall, but there are also small pseudotextures in local areas, as shown in Figure 6(d2,f2). The local over-smoothing phenomenon appeared in the NL-means and DnCNN filtered images, as shown in Figure 6(g2,h2). Images filtered using the FANS and proposed MDLPIA-NLM filters do not have this phenomenon, and the overall visual effect is good. Figure 7 shows the residual edge details in ratio images using eight filters. It can be seen in Figure 7 that the residual edge details of the eight filters are not obvious, and the residual edge details of the DnCNN, EnLee, and NL-means filters are slightly more than those of other methods.
Table 2 shows the results of the index evaluation. In ENL, the ENL obtained by all eight filters was significantly improved compared with the noisy image, with a maximum increase of 283.87 times. Although the proposed MDLPIA-NLM does not perform best among the eight filters, it is still 166.89 times higher than the noisy image, thus showing good noise-removal effect. In terms of SSI, ESI, M-Index, and KLD, the proposed MDLPIA-NLM performs best among the eight filters. In SSIM, the DPAD filter performs best. MDLPIA-NLM has the same SSIM as the PPB filter and is second only to the DPAD filter. In general, based on visual or index evaluation, the effectiveness of the proposed method in filtering simulation data is verified.

3.4.2. Real SAR Data

1.
GF-3 SAR Data
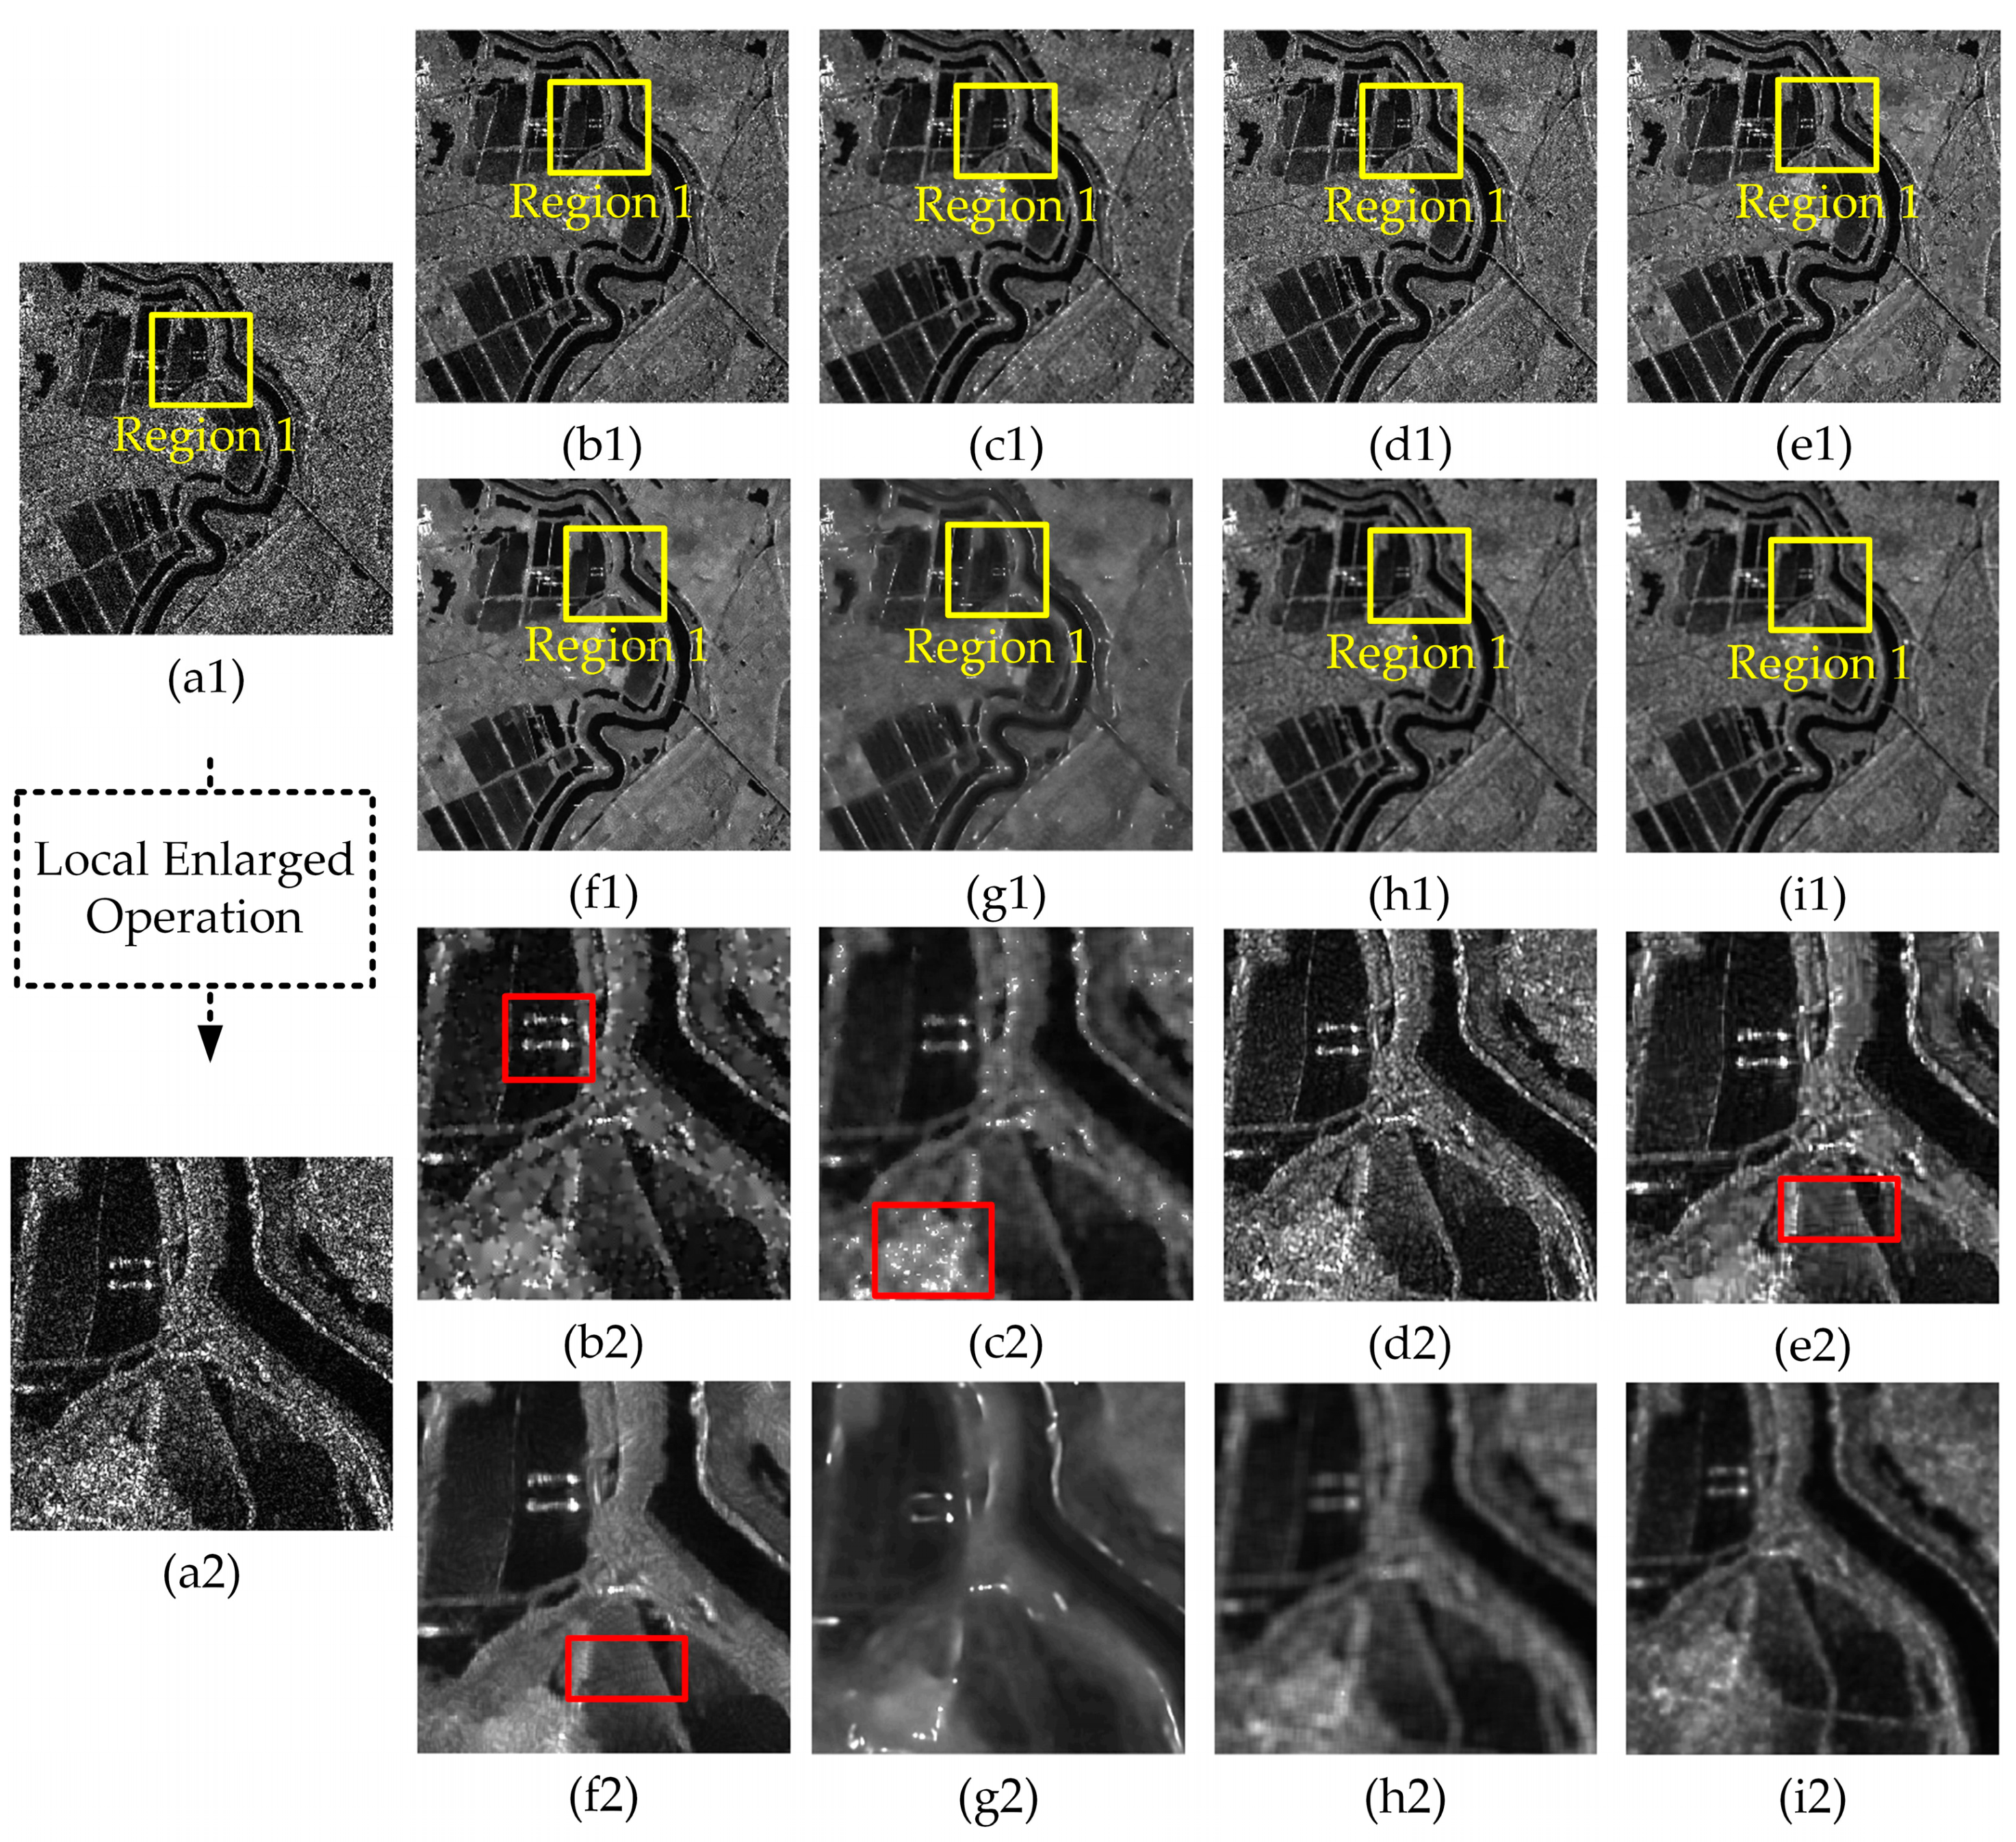
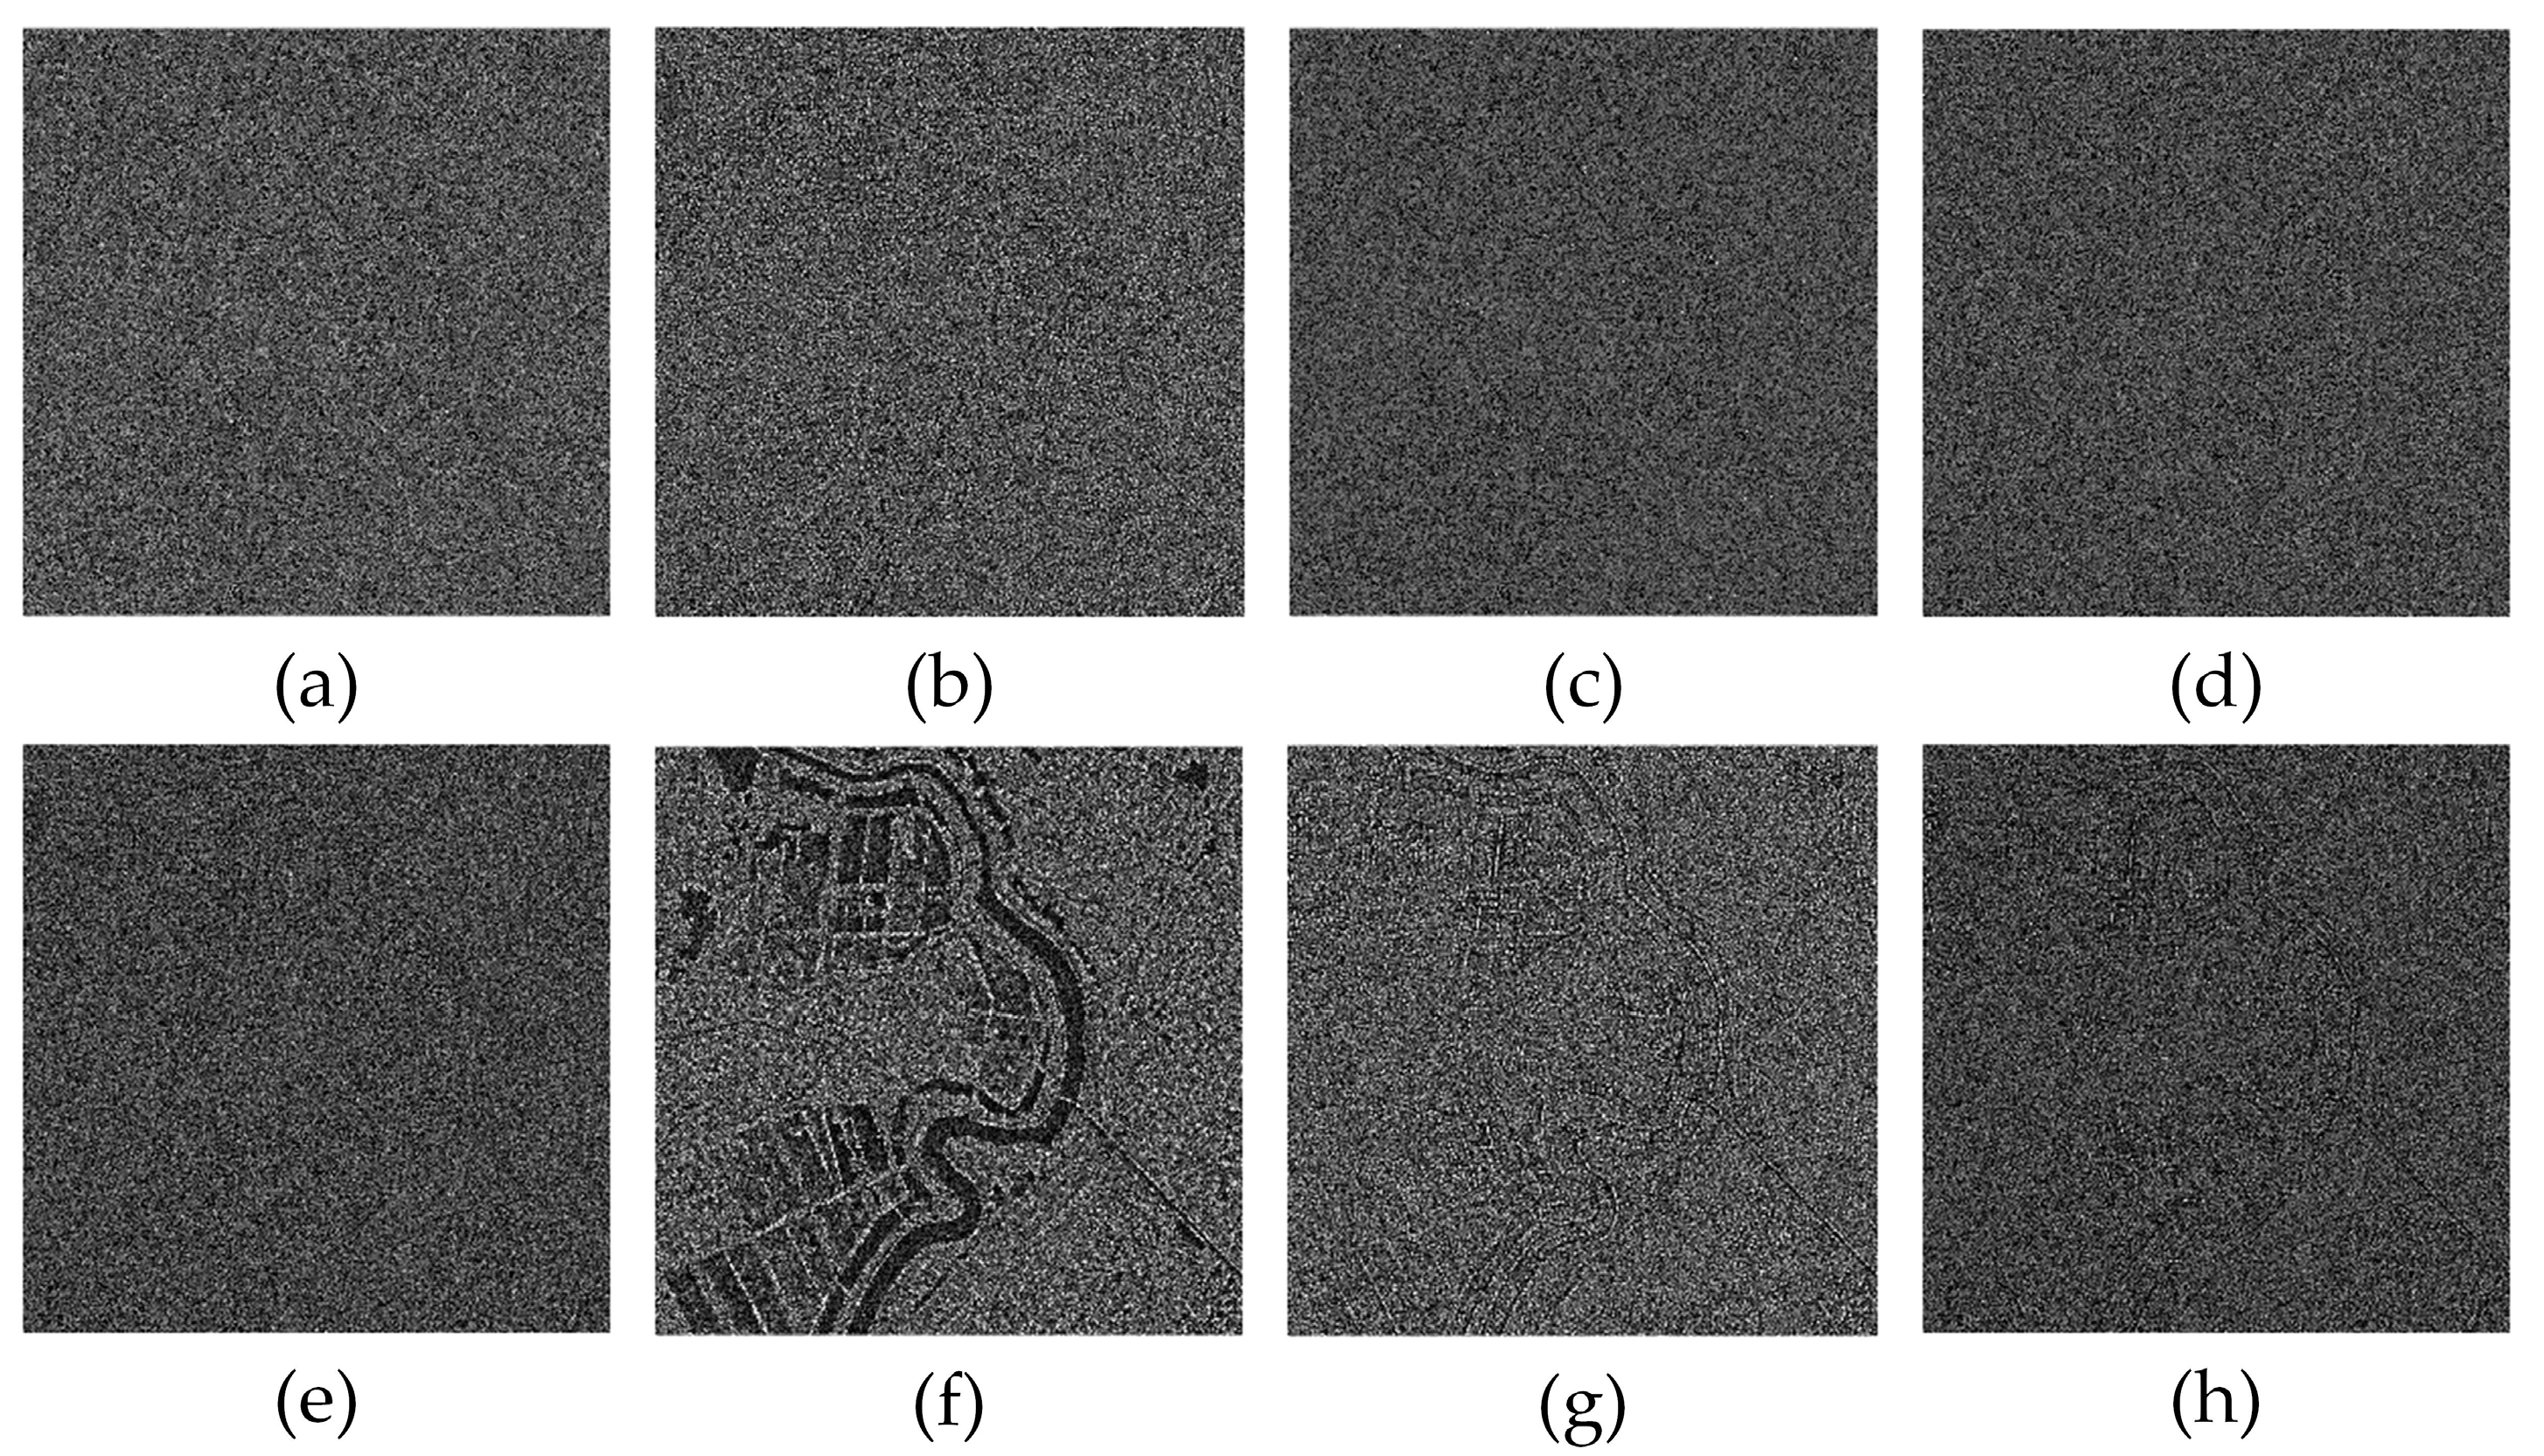
The GF-3 SAR image was the next to be filtered. The experimental results are shown in Figure 8, the ratio images are shown in Figure 9, and the index evaluation results are shown in Table 3.
Figure 8 shows that for the real GF-3 SAR image, the eight filters used in the experiment can effectively remove the speckle. The smoothing degree of DnCNN and NL-means filters are the highest, while over-smoothing appears in the NL-means filtered image, as shown in Figure 8(h2). The phenomena of locally unsmoothing and independently high pixel values still appear in the DPAD and EnLee filtered images, as shown in Figure 8(b2,c2), respectively. The same pseudotextures appear in the FANS and PPB-filtered images, as shown in Figure 8(e2,f2). Figure 8(d2) shows that the SAR-BM3-D filter does not sufficiently suppress speckle. The MDLPIA-NLM filters perform well visually. Figure 9 shows the residual edge details of the eight filters in ratio images. The residual edge details of the DnCNN filter are more significant than other seven filters. In terms of indicators, the proposed MDLPIA-NLM filter performs best in SSI, ESI, and M-Index. In ENL, DnCNN performs best, follow by the MDLPIA-NLM filter. In SSIM, SAR-BM3-D performs best, followed by the DPAD and FANS filters. The SSIM of MDLPIA-NLM is slightly lower than the DPAD and FANS filters and higher than the PPB, DnCNN, EnLee, and NL-means filters. In general, based on visual or index evaluation, the effectiveness of the proposed method in filtering the GF-3 real SAR image is verified.
2.
TerraSAR-X SAR Data
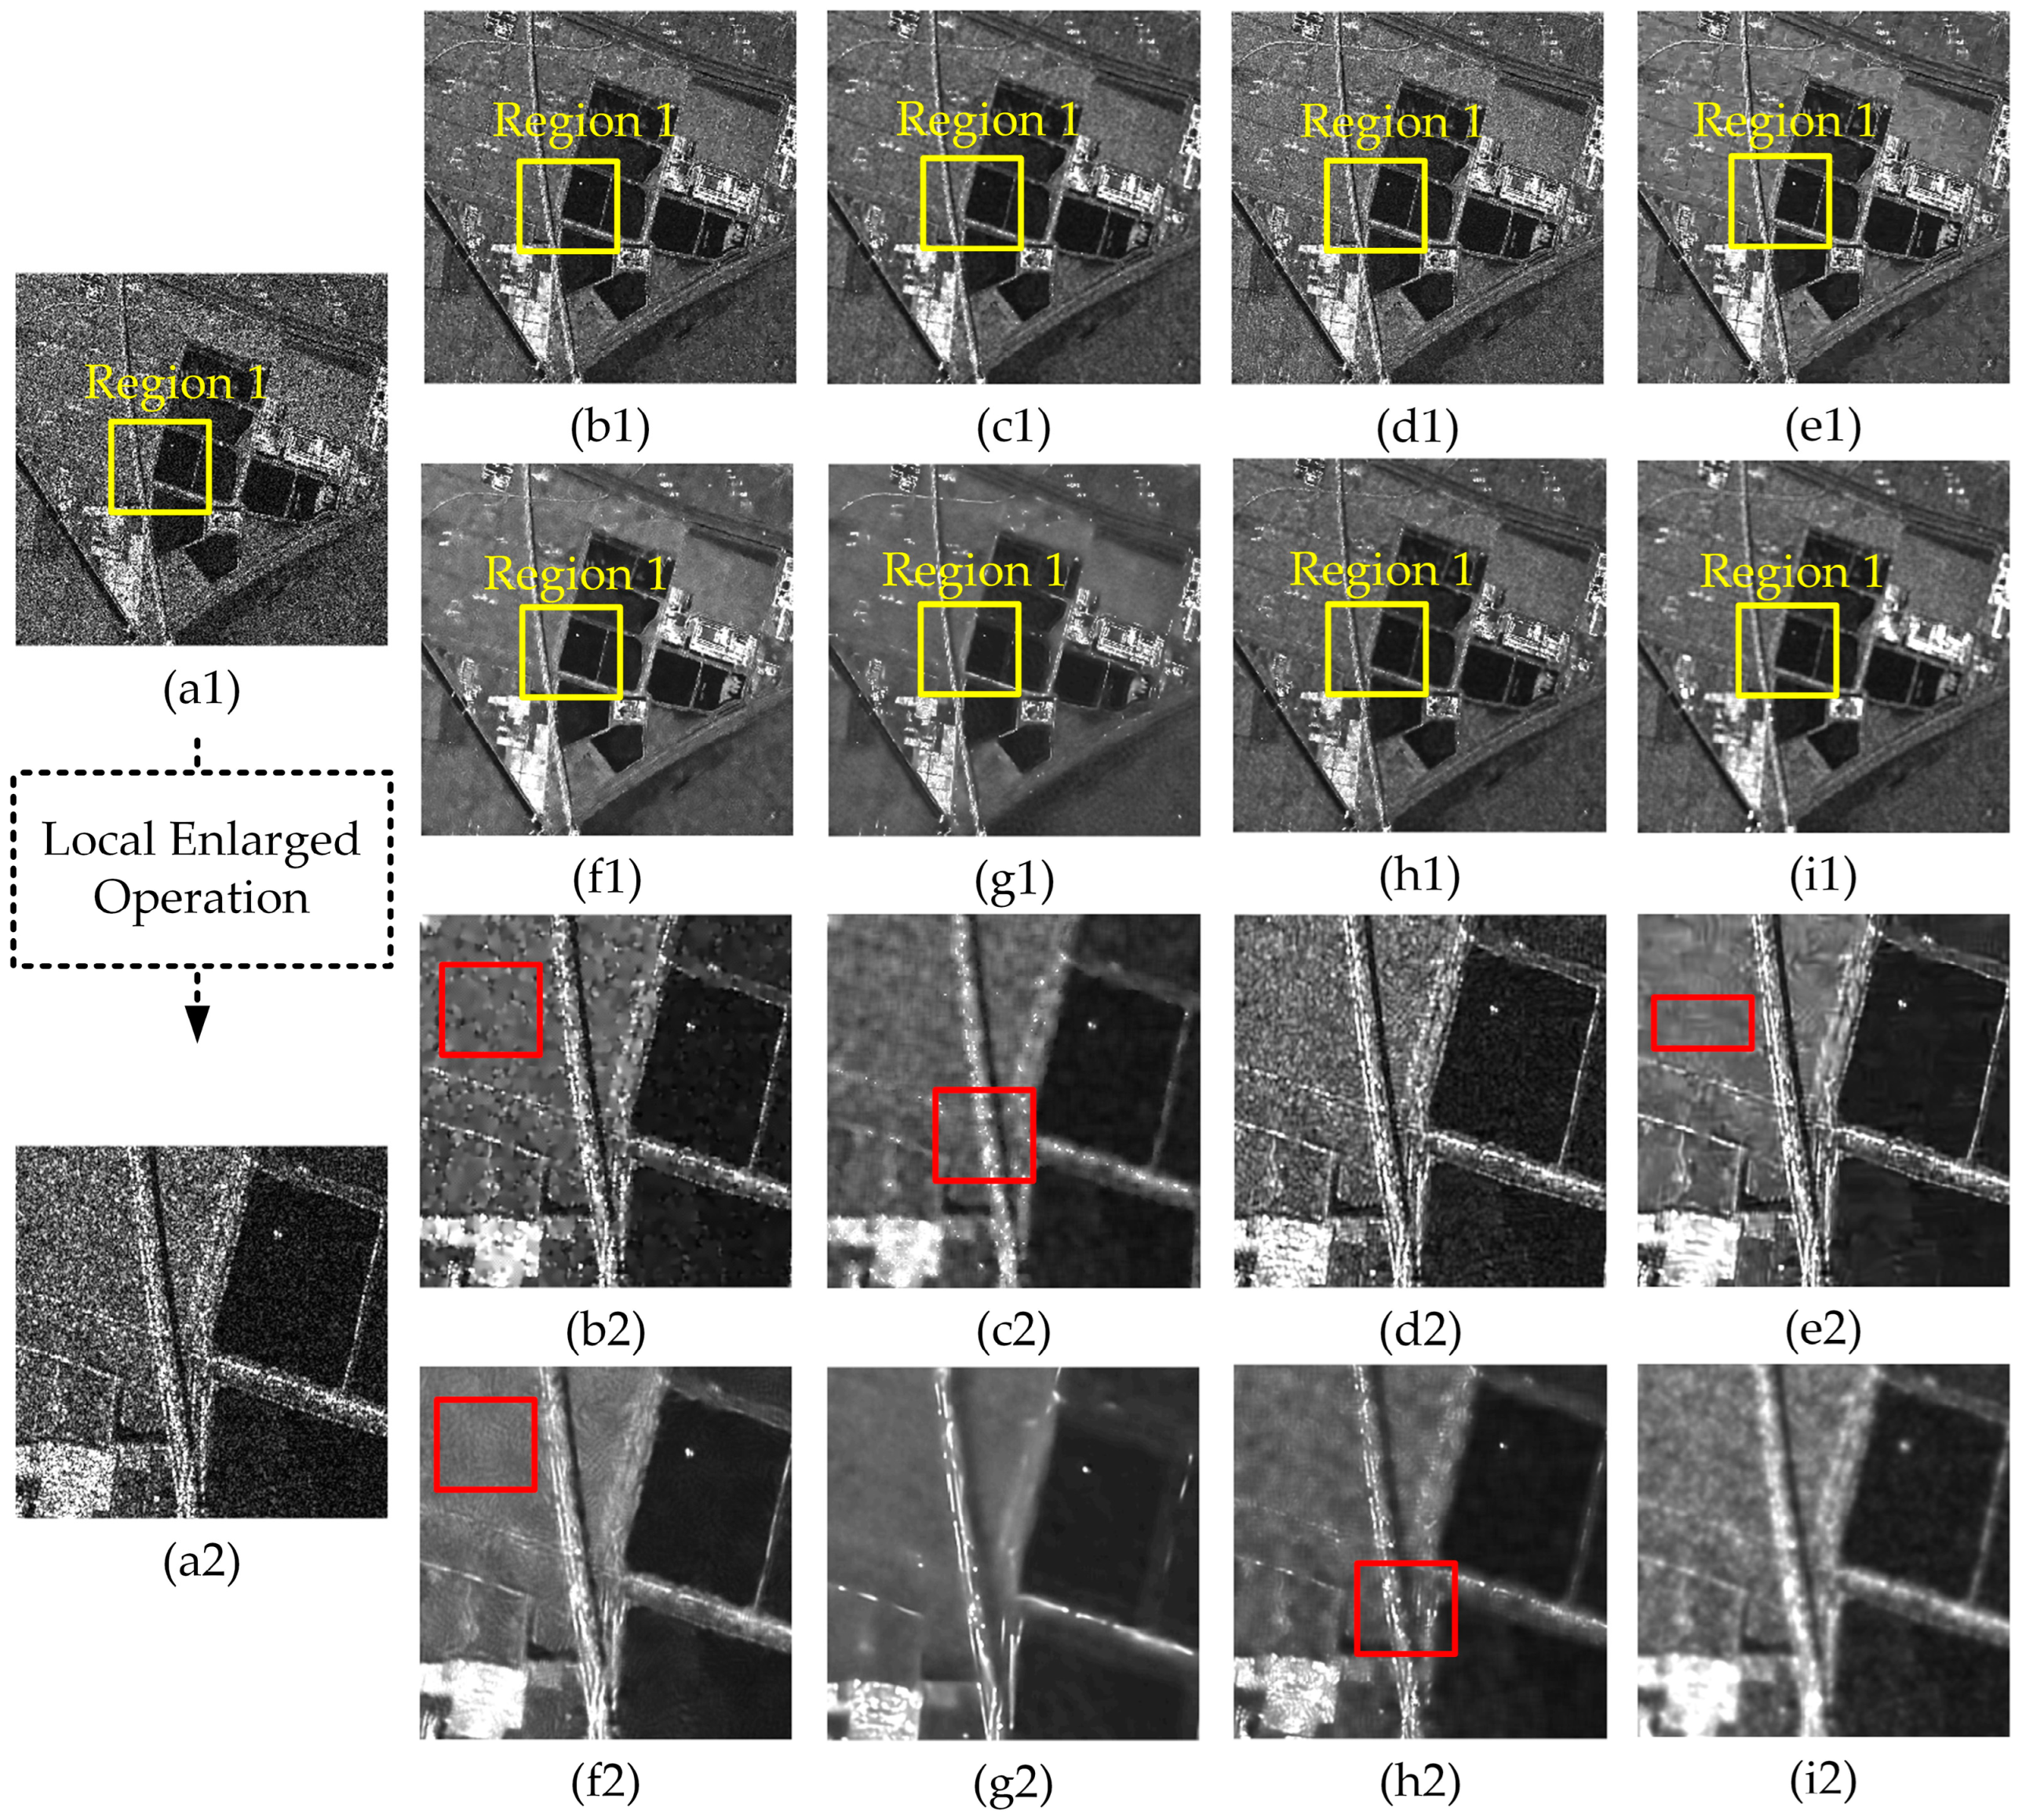
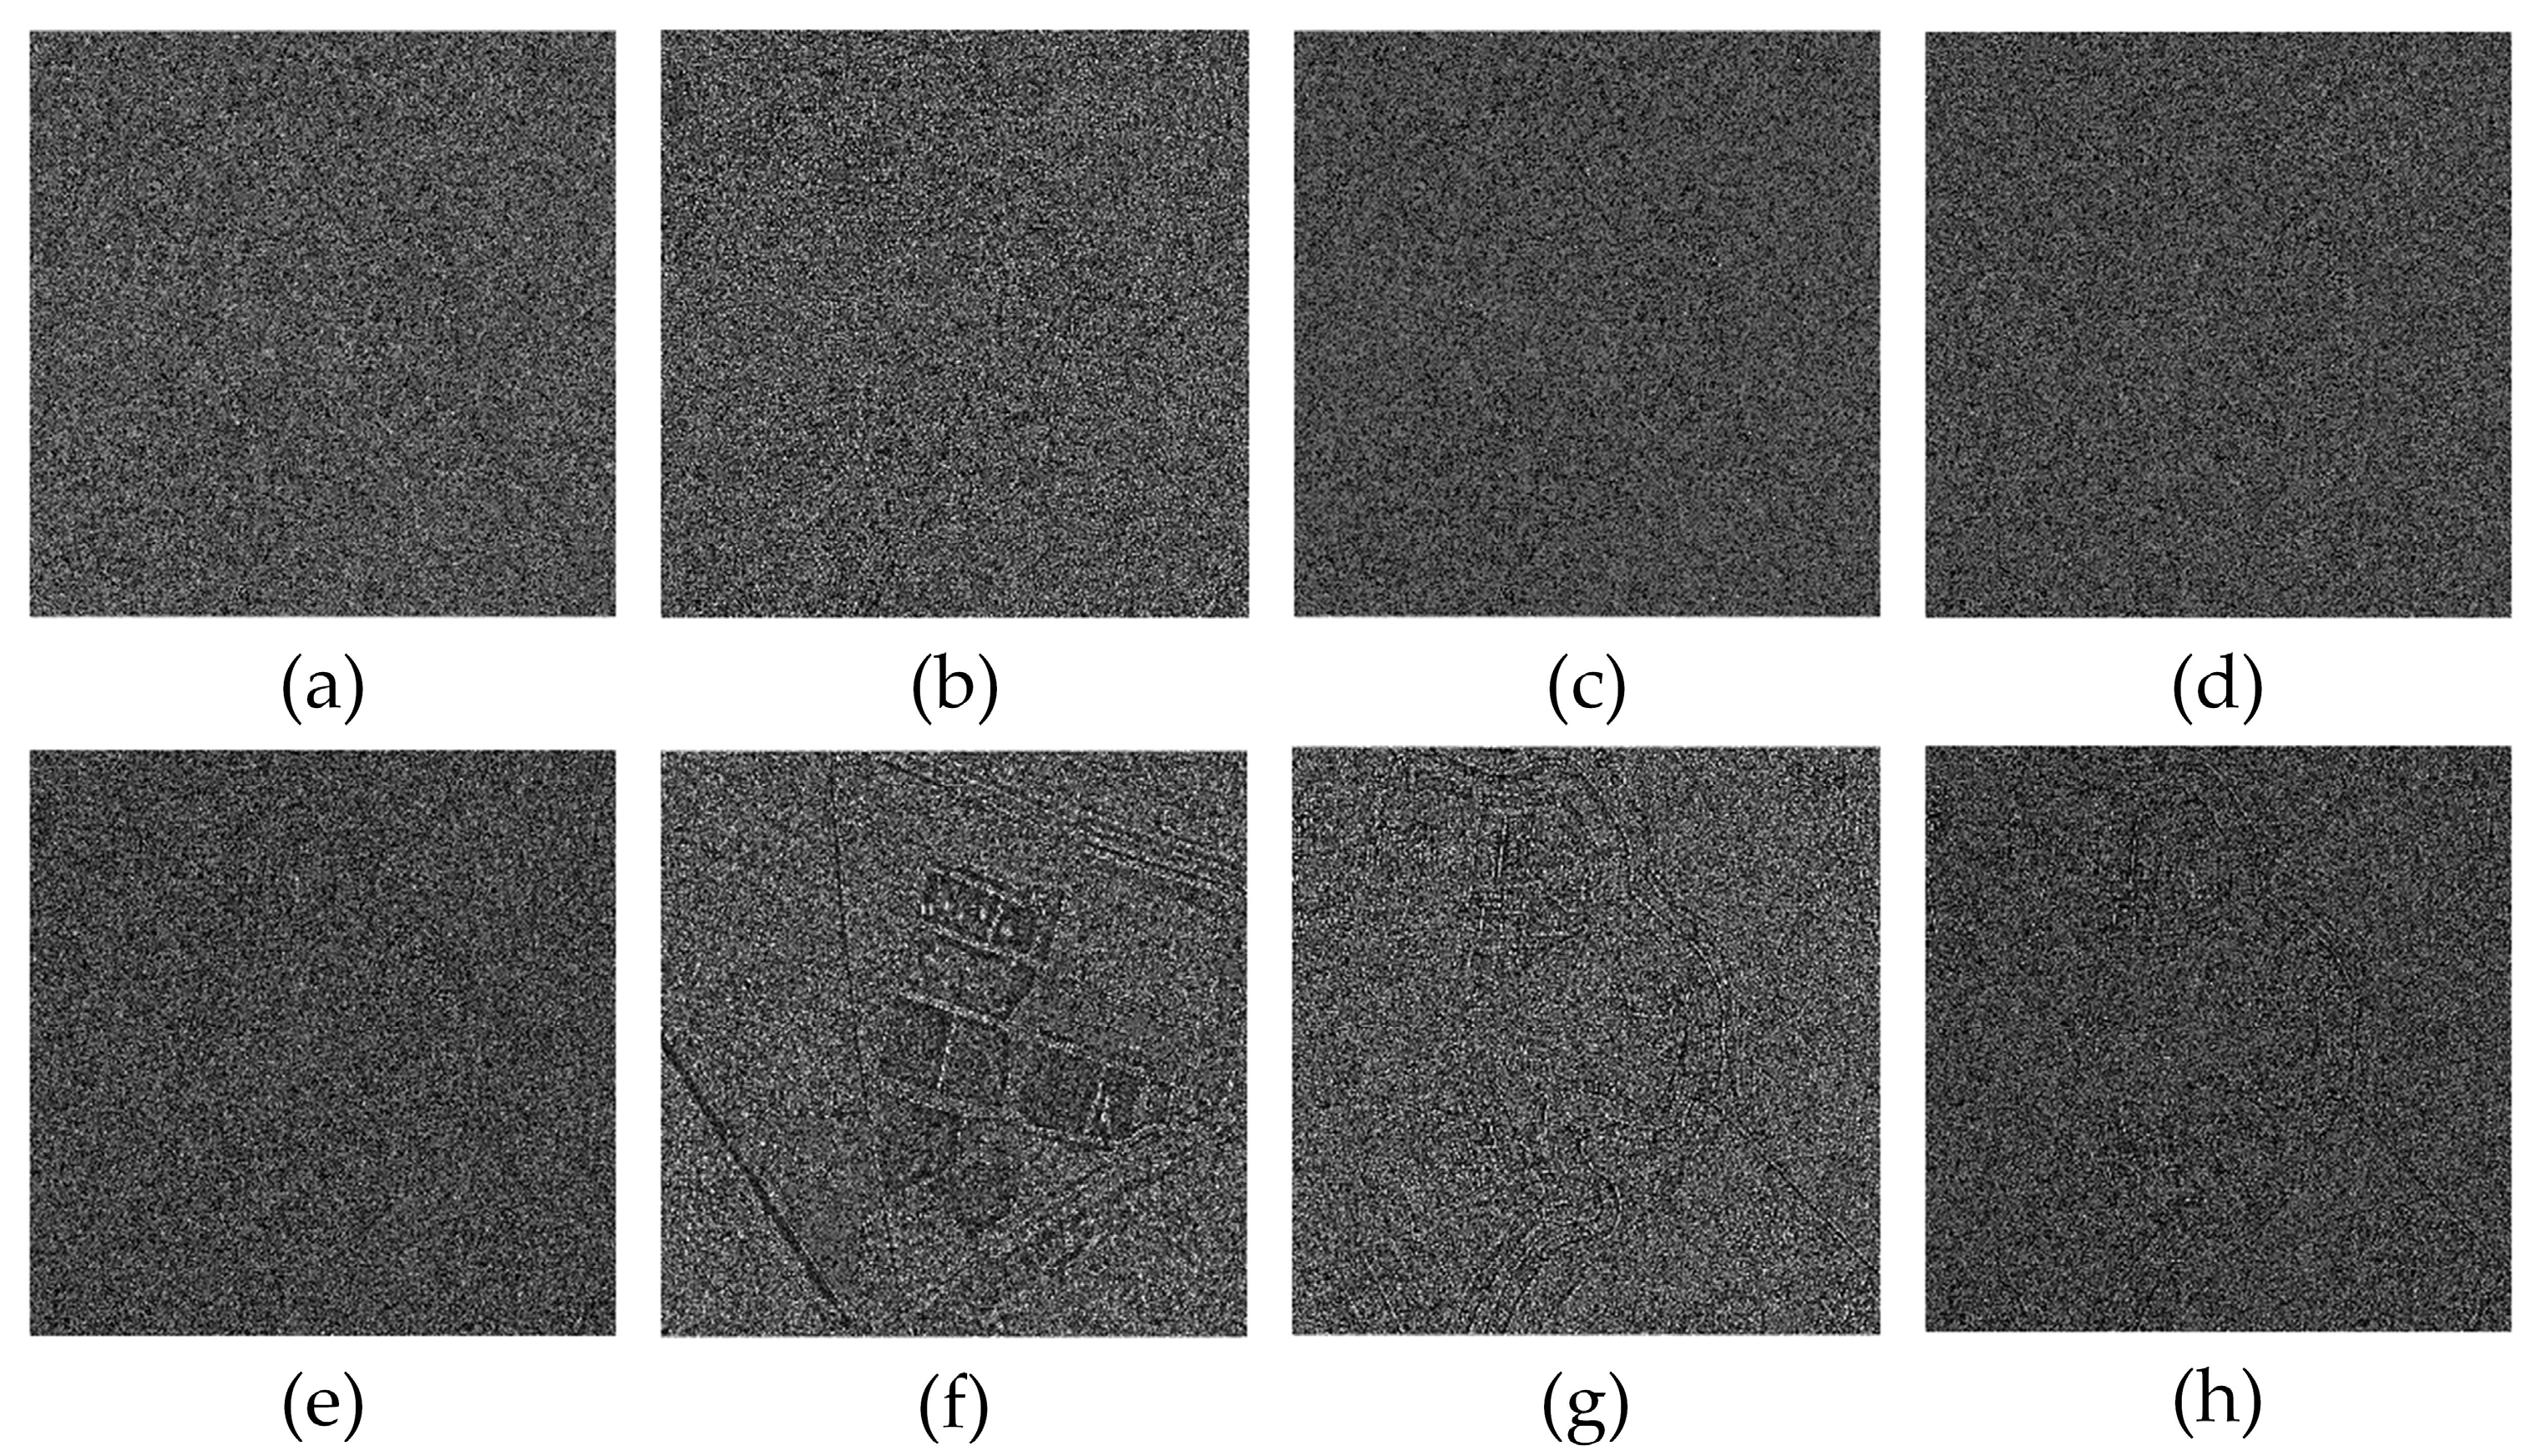
The TerraSAR-X SAR image is then filtered. The experimental results are shown in Figure 10, the ratio images are shown in Figure 11, and the index evaluation results are shown in Table 4.
As shown in Figure 10, for the TerraSAR-X SAR image, the selected eight filters can still effectively remove speckle. The DPAD-filtered image still has local unevenness, as shown in Figure 10(b2). The independently high pixel values appear in the EnLee and NL-means filters, as shown in Figure 10(c2,h2). Both the FANS and PPB-filtered images have tiny pseudotexture information, as shown in Figure 10(e2,f2). The SAR-BM3-D filter does not still sufficiently suppress speckle, as shown in Figure 10(d2). The visual effect of the MDLPIA-NLM and DnCNN filters is relatively good. As seen in the ratio images in Figure 11, the DnCNN filter can still see relatively obvious texture details, the NL-means filter can see slight texture details, while the residual texture details of the ratio images obtained by other filters can hardly be observed. In terms of indicators, MDLPIA-NLM performs best in SSI and M-Index. In ENL and ESI, the DnCNN filter performs best, followed by the MDLPIA-NLM filter. In SSIM, SAR-BM3-D performs best, followed by the DPAD and MDLPIA-NLM filters. In general, based on visual or index evaluation, the effectiveness of the proposed method in filtering the TerraSAR-X real SAR image is verified.
3.
RadarSAT-2 SAR Data
The RadarSAT-2 SAR image was filtered afterward. The experimental results are shown in Figure 12, the ratio images are shown in Figure 13, and the index evaluation results are shown in Table 5.
For the RadarSAT-2 image, the eight filters all remove speckle noise to a certain extent, and the images filtered by the DPAD, EnLee, FANS, and PPB filters show similar phenomena as before, as shown in Figure 12(b2,c2,e2,f2), respectively. The noise filtering of the SAR-BM3-D and NL-means filtered images is insufficient, as shown in Figure 12(d2,h2). The pseudoshadow appears in the DnCNN-filtered image, as shown in Figure 12(g2). The visual effect of MDLPIA-NLM is generally good, as shown in Figure 12(i2). In comparing ratio images, the ratio images obtained by the DnCNN and NL-means filters can see obvious texture details, the ratio images obtained by the DPAD and PPB filters can see slight texture details, and the ratio images obtained by the other filters can hardly see texture details. In terms of index evaluation, the MDLPIA-NLM filter performs best in SSI and M-Index, and second best in ESI and SSIM. In terms of ENL, MDLPIA-NLM is 70.39 times higher than the unfiltered image. In general, based on visual or index evaluation, the effectiveness of the proposed method in filtering the RadarSAT-2 real SAR image is verified.
4.
ALOS-2 SAR Data
The ALOS-2 SAR image was filtered last. The experimental results are shown in Figure 14, the ratio images are shown in Figure 15, and the index evaluation results are shown in Table 6.
For the ALOS-2 SAR image, the eight filters also play an effective role in speckle removal. After DPAD filtering, there are still many locally uneven pixels in the image, as shown in Figure 14(b2). Independently high pixel strong points in the EnLee-filtered images were significantly reduced but still exist, as shown in Figure 14(c2). The image after FANS filtering had more false textures than before, as shown in Figure 14(e2). The edge-preserving effect in the PPB-filtered and DnCNN-filtered images were weaker than in the previous image processing, as shown in Figure 14(f2,g2). In the NL-means filtered image, a small amount of local pixel nonuniformity also appeared. The SAR-BM3-D and MDLPIA-NLM filters have good visual effects. In terms of the ratio images, the DnCNN filter can significantly observe edge details, followed by the NL-means, PPB and EnLee filters. The ratio images obtained by the other filters can hardly observe edge details. In terms of index evaluation, the MDLPIA-NLM filter performs best in SSI and ESI, and second best in SSIM and M-Index. In terms of ENL, the performance of the MDLPIA-NLM filter was in the middle, but it was 50.30 times higher than that of the unfiltered image. In general, based on visual or index evaluation, the effectiveness of the proposed method in filtering the ALOS-2 real SAR image is verified.

4. Discussion

The experimental results show that the proposed algorithm is effective in both edge preservation and noise suppression, which benefits from the following two aspects. First, it is based on the idea of non-local means filtering. Each pixel of the SAR image is not an individual but interacts with surrounding pixels to form ground-feature information. The non-local means can effectively use the pixel information in the surrounding neighborhood for weighted fusion filtering, making the filtering results more reliable.
Second, the excellent filtering result depends on the optimization of the weight function. The weight function is the most critical description of the scale at which neighborhood pixels participate in filtering, and it is also the core of non-local means filtering. The proposed weight function can not only fully describe the similarity with neighboring pixels, but also fully express the difference between pixels and their neighbors due to the use of MDLPIA, reflecting the edge information of pixels and thus ensuring the preservation of edge information.
The experimental results show that the proposed filter shows many similarities in different filtered images, which also reflects the robustness of the algorithm. In terms of indicators, the MDLPIA-NLM filter, like other filters, does not perform best in all indicators. In fact, different indicator–evaluation models are based on specific knowledge, and a single-model evaluation often has some deviations. However, in general, the index evaluation for the MDLPIA-NLM filter is excellent, which verifies the algorithm’s reliability.
It should be pointed out that the proposed algorithm needs to build a global MDLPIA and repeat the traversal image when building the weight function, increasing the algorithm’s time consumption to a certain extent. This also can be optimized through higher configuration and parallel processing. In terms of data simulation, the made-clean image consists of simple geometry, and more abundant information including texture features, prolonged, and point-like objects will be used to simulate the real SAR image for a future filtering experiment. In addition, the selected de-speckling filters and evaluation indicators in the experiment are commonly used and classic algorithms. Additional advanced excellent filters and visual quality metrics will be further used for comparison and evaluation in the future.

5. Conclusions

In this article, a novel non-local means filtering based on multi-directional local plane inclination angle is proposed. The proposed MDLPIA-NLM filter is the improved version of NL-means filtering, which optimizes the weight function using MDLPIA and has a good speckle-filtering effect. To verify the effectiveness of the algorithm, experiments were carried out on simulated images and real SAR images. The real SAR images selected in the experiment were from four sensors (GF-3, TerraSAR-X, RasarSAT-2, and ALOS-2), three bands (C, X, and L bands), three resolutions (3, 6, and 8 m), and three polarization modes (VV, HH, and HV). Seven filters (DPAD, EnLee, SAR-BM3-D, FANS, PPB, DnCNN, and NL-means filters) with excellent performance were selected for comparative experiments. Six indexes (ENL, SSI, ESI, SSIM, M-Index, and KLD) were selected to evaluate objectively the filtering results. The experimental results show that the proposed filter can effectively suppress speckle noise and has good edge-preservation characteristics.

Author Contributions

Conceptualization, F.G. and W.L.; methodology, F.G.; software, F.G.; validation, F.G. and H.T.; formal analysis, F.G.; investigation, F.G.; resources, F.G.; data curation, W.L.; writing—original draft preparation, F.G.; writing—review and editing, F.G.; visualization, F.G.; supervision, F.G.; project administration, F.G.; funding acquisition, F.G. and W.L. All authors have read and agreed to the published version of the manuscript.

Funding

This research was funded by the National Natural Science Foundation of China, grant numbers 62101219 and 62201232; the Natural Science Foundation of Jiangsu Province, grant numbers BK20210921 and BK20201026; and the Science Foundation of Jiangsu Normal University, grant number 20XSRS008.

Data Availability Statement

All the data generated or analyzed during this study are included in this article.

Conflicts of Interest

The authors declare no conflict of interest.

References

  1. Guo, F.C.; Zhuo, C.C.; Liu, W.S.; Liu, Z.H. Pixel Difference Function and Local Entropy-Based Speckle Reducing Anisotropic Diffusion. IEEE Trans. Geosci. Remote Sens. 2022, 60, 5229516. [Google Scholar] [CrossRef]
  2. Yuan, Y.; Guan, J.; Feng, P.M.; Wu, Y.X. A Practical Solution for SAR Despeckling With Adversarial Learning Generated Speckled-to-Speckled Images. IEEE Geosci. Remote Sens. Let. 2022, 19, 4004705. [Google Scholar] [CrossRef]
  3. Sun, Y.L.; Lei, L.; Guan, D.D.; Li, X.; Kuang, G.Y. SAR Image Speckle Reduction Based on Nonconvex Hybrid Total Variation Model. IEEE Trans. Geosci. Remote Sens. 2021, 59, 1231–1249. [Google Scholar] [CrossRef]
  4. Lin, H.X.; Zhuang, Y.H.; Huang, Y.; Ding, X.H. Unpaired Speckle Extraction for SAR Despeckling. IEEE Trans. Geosci. Remote Sens. 2023, 61, 5201014. [Google Scholar] [CrossRef]
  5. Chen, S.W.; Cui, X.C.; Wang, X.S.; Xiao, S.P. Speckle-Free SAR Image Ship Detection. IEEE Trans. Image Process. 2021, 30, 5969–5983. [Google Scholar] [CrossRef]
  6. Ma, X.S.; Xu, J.G.; Wu, P.H.; Kong, P. Oil Spill Detection Based on Deep Convolutional Neural Networks Using Polarimetric Scattering Information from Sentinel-1 SAR Images. IEEE Trans. Geosci. Remote Sens. 2022, 60, 4204713. [Google Scholar] [CrossRef]
  7. Liu, S.Q.; Lei, Y.; Zhang, L.Y.; Li, B.; Hu, W.M.; Zhang, Y.D. MRDDANet: A Multiscale Residual Dense Dual Attention Network for SAR Image Denoising. IEEE Trans. Geosci. Remote Sens. 2022, 60, 5214213. [Google Scholar] [CrossRef]
  8. Fracastoro, G.; Magli, E.; Poggi, G.; Scarpa, G.; Valsesia, D.; Verdoliva, L. Deep Learning Methods for Synthetic Aperture Radar Image Despeckling: An overview of trends and perspectives. IEEE Geosci. Remote Sens. Mag. 2021, 9, 29–51. [Google Scholar] [CrossRef]
  9. Lee, J.S.; Wen, J.H.; Ainsworth, T.L.; Chen, K.S.; Chen, A.J. Improved Sigma Filter for Speckle Filtering of SAR Imagery. IEEE Trans. Geosci. Remote Sens. 2009, 47, 202–213. [Google Scholar]
  10. Fatnassi, S.; Yahia, M.; Ali, T.; Mortula, M.M. SAR Speckle Filtering Using Hybrid NonLocal Sigma Filter. In Proceedings of the 2021 18th International Multi-Conference on Systems, Signals & Devices (SSD), Monastir, Tunisia, 22–25 March 2021. [Google Scholar]
  11. Kuan, D.T.; Sawchuk, A.A.; Strand, T.C.; Chavel, P. Adaptive Noise Smoothing Filter for Images with Signal-Dependent Noise. IEEE Trans. Pattern Anal. 1985, 2, 165–177. [Google Scholar] [CrossRef]
  12. Lee, J.S. Digital Image Enhancement and Noise Filtering by Use of Local Statistics. IEEE Trans. Pattern Anal. 1980, 2, 165–168. [Google Scholar] [CrossRef] [Green Version]
  13. Nisha, S.S.; Raja, S.P. Multiscale Transform and Shrinkage Thresholding Techniques for Medical Image Denosing-Performance Evaluation. Cybern. Inf. Technol. 2020, 20, 130–146. [Google Scholar]
  14. Seixasleal, A.; Paiva, H.M. A New Wavelet Family for Speckle Noise Reduction in Medical Ultrasound Images. Measurement 2019, 140, 572–581. [Google Scholar]
  15. Liu, S.; Hu, Q.; Li, P.; Zhao, J.; Liu, M.; Zhu, Z. Speckle Suppression based on Weighted Nuclear Norm Minimization and Grey Theory. IEEE Trans. Geosci. Remote Sens. 2019, 57, 2700–2708. [Google Scholar] [CrossRef]
  16. Zhang, G.; Guo, F.C.; Zhang, Q.J.; Xu, K.; Jia, P.; Hao, X.Y. Speckle Reduction by Directional Coherent Anisotropic Diffusion. Remote Sens. 2019, 11, 2768. [Google Scholar] [CrossRef]
  17. Guo, F.C.; Zhang, G.; Zhang, Q.J.; Zhao, R.S.; Deng, M.J.; Xu, K. Speckle Suppression by Weighted Euclidean Distance Anisotropic Diffusion. Remote Sens. 2018, 10, 722. [Google Scholar] [CrossRef]
  18. Guo, F.C.; Zhang, G.; Zhang, Q.J.; Zhao, R.S.; Deng, M.J.; Xu, K.; Jia, P.; Hao, X.Y. Fusion Despeckling based on Surface Variation Anisotropic Diffusion Filter and Ratio Image Filter. IEEE Trans. Geosci. Remote Sens. 2020, 58, 2398–2411. [Google Scholar] [CrossRef]
  19. Aja-Fernandez, S.; Alberola-Lopez, C. On the Estimation of the Coefficient of Variation for Anisotropic Diffusion Speckle Filtering. IEEE Trans. Image Process. 2006, 15, 2694–2701. [Google Scholar] [CrossRef] [PubMed]
  20. Buades, A.; Coll, B.; Morel, J.-M. A Non-Local Algorithm for Image Denoising. In Proceedings of the 2005 IEEE Computer Society Conference on Computer Vision and Pattern Recognition (CVPR’05), San Diego, CA, USA, 20–25 June 2005; Volume 2, pp. 60–65. [Google Scholar]
  21. Deledalle, C.-A.; Denis, L.; Tupin, F.; Reigber, A.; Jager, M. NL-SAR: A Unified Nonlocal Framework for Resolution-Preserving (Pol)(In)SAR Denoising. IEEE Trans. Geosci. Remote Sens. 2015, 53, 2021–2038. [Google Scholar] [CrossRef]
  22. Jia, M.; Wang, L. Novel Class-Relativity Non-Local Means with Principal Component Analysis for Multitemporal SAR Image Change Detection. Int. J. Remote Sens. 2018, 39, 1068–1091. [Google Scholar] [CrossRef]
  23. Penna, P.A.A.; Mascarenhas, N.D.A. (Non-) Homomorphic Approaches to Denoise Intensity SAR Images with Non-Local Means and Stochastic Distances. Comput. Geosci. 2018, 111, 127–138. [Google Scholar] [CrossRef]
  24. Pepe, A. A 3D Space-Time Non-Local Mean Filter (NLMF) for Land Changes Retrieval with Synthetic Aperture Radar Images. Remote Sens. 2022, 14, 5933. [Google Scholar] [CrossRef]
  25. Zhang, K.; Zuo, W.M.; Chen, Y.J.; Meng, D.Y.; Zhang, L. Beyond a Gaussian Denoiser: Residual Learning of Deep CNN for Image Denoising. IEEE Trans. Image Process. 2017, 26, 3142–3155. [Google Scholar] [CrossRef] [PubMed] [Green Version]
  26. Li, H.X.; Zhuang, Y.D.; Huang, Y.; Ding, X.H. Self-Supervised SAR Despeckling Powered by Implicit Deep Denoiser Prior. IEEE Geosci. Remote Sens. Let. 2022, 19, 4514705. [Google Scholar]
  27. Dalsasso, E.; Denis, L.; Tupin, F. As If by Magic: Self-Superivised Training of Deep Despeckling Networks With MERLIN. IEEE Trans. Geosci. Remote Sens. 2022, 60, 4704713. [Google Scholar] [CrossRef]
  28. Mullissa, A.G.; Marcos, D.; Tuia, D.; Herold, M.; Reiche, J. DeSpeckNet: Generalizing Deep Learning-Based SAR Image Despeckling. IEEE Trans. Geosci. Remote Sens. 2022, 60, 5200315. [Google Scholar] [CrossRef]
  29. Ma, X.S.; Wang, C.; Yin, Z.X.; Wu, P.H. SAR Image Despeckling by Noisy Reference-based Deep Learning Method. IEEE Trans. Geosci. Remote Sens. 2020, 58, 8807–8818. [Google Scholar] [CrossRef]
  30. Liu, S.Q.; Gao, L.; Wang, M.H.; Hu, Q.; Ma, Z.L.; Zhang, Y.D. SAR Speckle Removal Using Hybrid Frequency Modulations. IEEE Trans. Geosci. Remote Sens. 2021, 59, 3956–3966. [Google Scholar] [CrossRef]
  31. Liu, S.Q.; Liu, T.; Gao, L.L.; Li, H.L.; Hu, Q.; Zhao, J.; Wang, C. Convolutional Neural Network and Guided Filtering for SAR Image Denoising. Remote Sens. 2019, 11, 702. [Google Scholar] [CrossRef]
  32. Shen, H.F.; Zhou, C.C.; Li, J.; Yuan, Q.Q. SAR Image Despeckling Employing a Recursive Deep CNN Prior. IEEE Trans. Geosci. Remote Sens. 2021, 59, 273–286. [Google Scholar] [CrossRef]
  33. Li, C.S.; Yu, Z.; Chen, J. Overview of Techniques for Improving High-Resolution Spaceborne SAR Imaging and Image Quality. J. Radars 2019, 8, 717–731. [Google Scholar]
  34. Wang, X.; Meng, Z.; Chen, S.; Feng, Z.; Li, X.; Guo, T.; Wang, C.; Zheng, X. A Block-Scale FFT Filter Based on Spatial Autocorrelation Features of Speckle Noise in SAR Image. Remote Sens. 2023, 15, 247. [Google Scholar] [CrossRef]
  35. Deledalle, C.A.; Denis, L.; Tupin, F. Iterative Weighted Maximum Likelihood Denoising with Probabilistic Patch-Based Weights. IEEE Trans. Image Process. 2009, 18, 2661–2672. [Google Scholar] [CrossRef] [PubMed]
  36. Jojy, C.; Nair, M.S.; Subrahmanyam, G.R.K.S.; Riji, R. Discontinuity Adaptive Non-Local Means with Importance Sampling Unscented Kalman Filter for De-Speckling SAR Images. IEEE J. Sel. Top. Appl. Earth Obs. Remote Sens. 2013, 6, 1964–1970. [Google Scholar] [CrossRef]
  37. Parrilli, S.; Poderico, M.; Angelino, C.V.; Verdoliva, L. A Nonlocal SAR Image Denoising Algorithm Based on LLMMSE Wavelet Shrinkage. IEEE Trans. Geosci. Remote Sens. 2012, 50, 606–616. [Google Scholar] [CrossRef]
  38. Cozzolino, D.; Parrilli, S.; Scarpa, G.; Poggi, G.; Verdoliva, L. Fast Adaptive Nonlocal SAR Despeckling. IEEE Geosci. Remote Sens. Lett. 2014, 11, 524–528. [Google Scholar] [CrossRef]
  39. Wu, J.; Liu, F.; Hao, H.; Li, L.; Jiao, L.; Zhang, X. A Nonlocal Means for Speckle Reduction of SAR Image With Multiscale-Fusion Based Steerable Kernel Function. IEEE Geosci. Remote Sens. Lett. 2016, 13, 1646–1650. [Google Scholar] [CrossRef]
  40. Ma, W.; Xin, Z.; Liao, G.; Sun, Y.; Wang, Z.; Xuan, J. Sub-Region Non-Local Mean Denoising Algorithm of Synthetic Aperture Radar Images Based on Statistical Characteristics. IET Image Process. 2022, 16, 2665–2679. [Google Scholar] [CrossRef]
  41. Shamsoddini, A.; Trinder, J.C. Image Texture Preservation in Speckle Noise Suppression. In Proceedings of the International Society for Photogrammetry and Remote Sensing Commission VII Symposium, Vienna, Austria, 5–7 July 2010; pp. 239–244. [Google Scholar]
  42. Zhang, W.G.; Liu, F.; Jiao, L.C. SAR Image Despeckling via Bilateral Filtering. Electron. Lett. 2009, 45, 781–783. [Google Scholar] [CrossRef]
  43. Wang, Z.; Bovik, A.C.; Sheikh, H.R.; Simoncelli, E.P. Image Quality Assessment: From Error Visibility to Structural Similarity. IEEE Trans. Image Process. 2004, 13, 600–612. [Google Scholar] [CrossRef]
  44. Gomez, L.; Ospina, R.; Frery, A. Unassisted Quantitative Evaluation of Despeckling Filters. Remote Sens. 2017, 9, 389. [Google Scholar] [CrossRef] [Green Version]
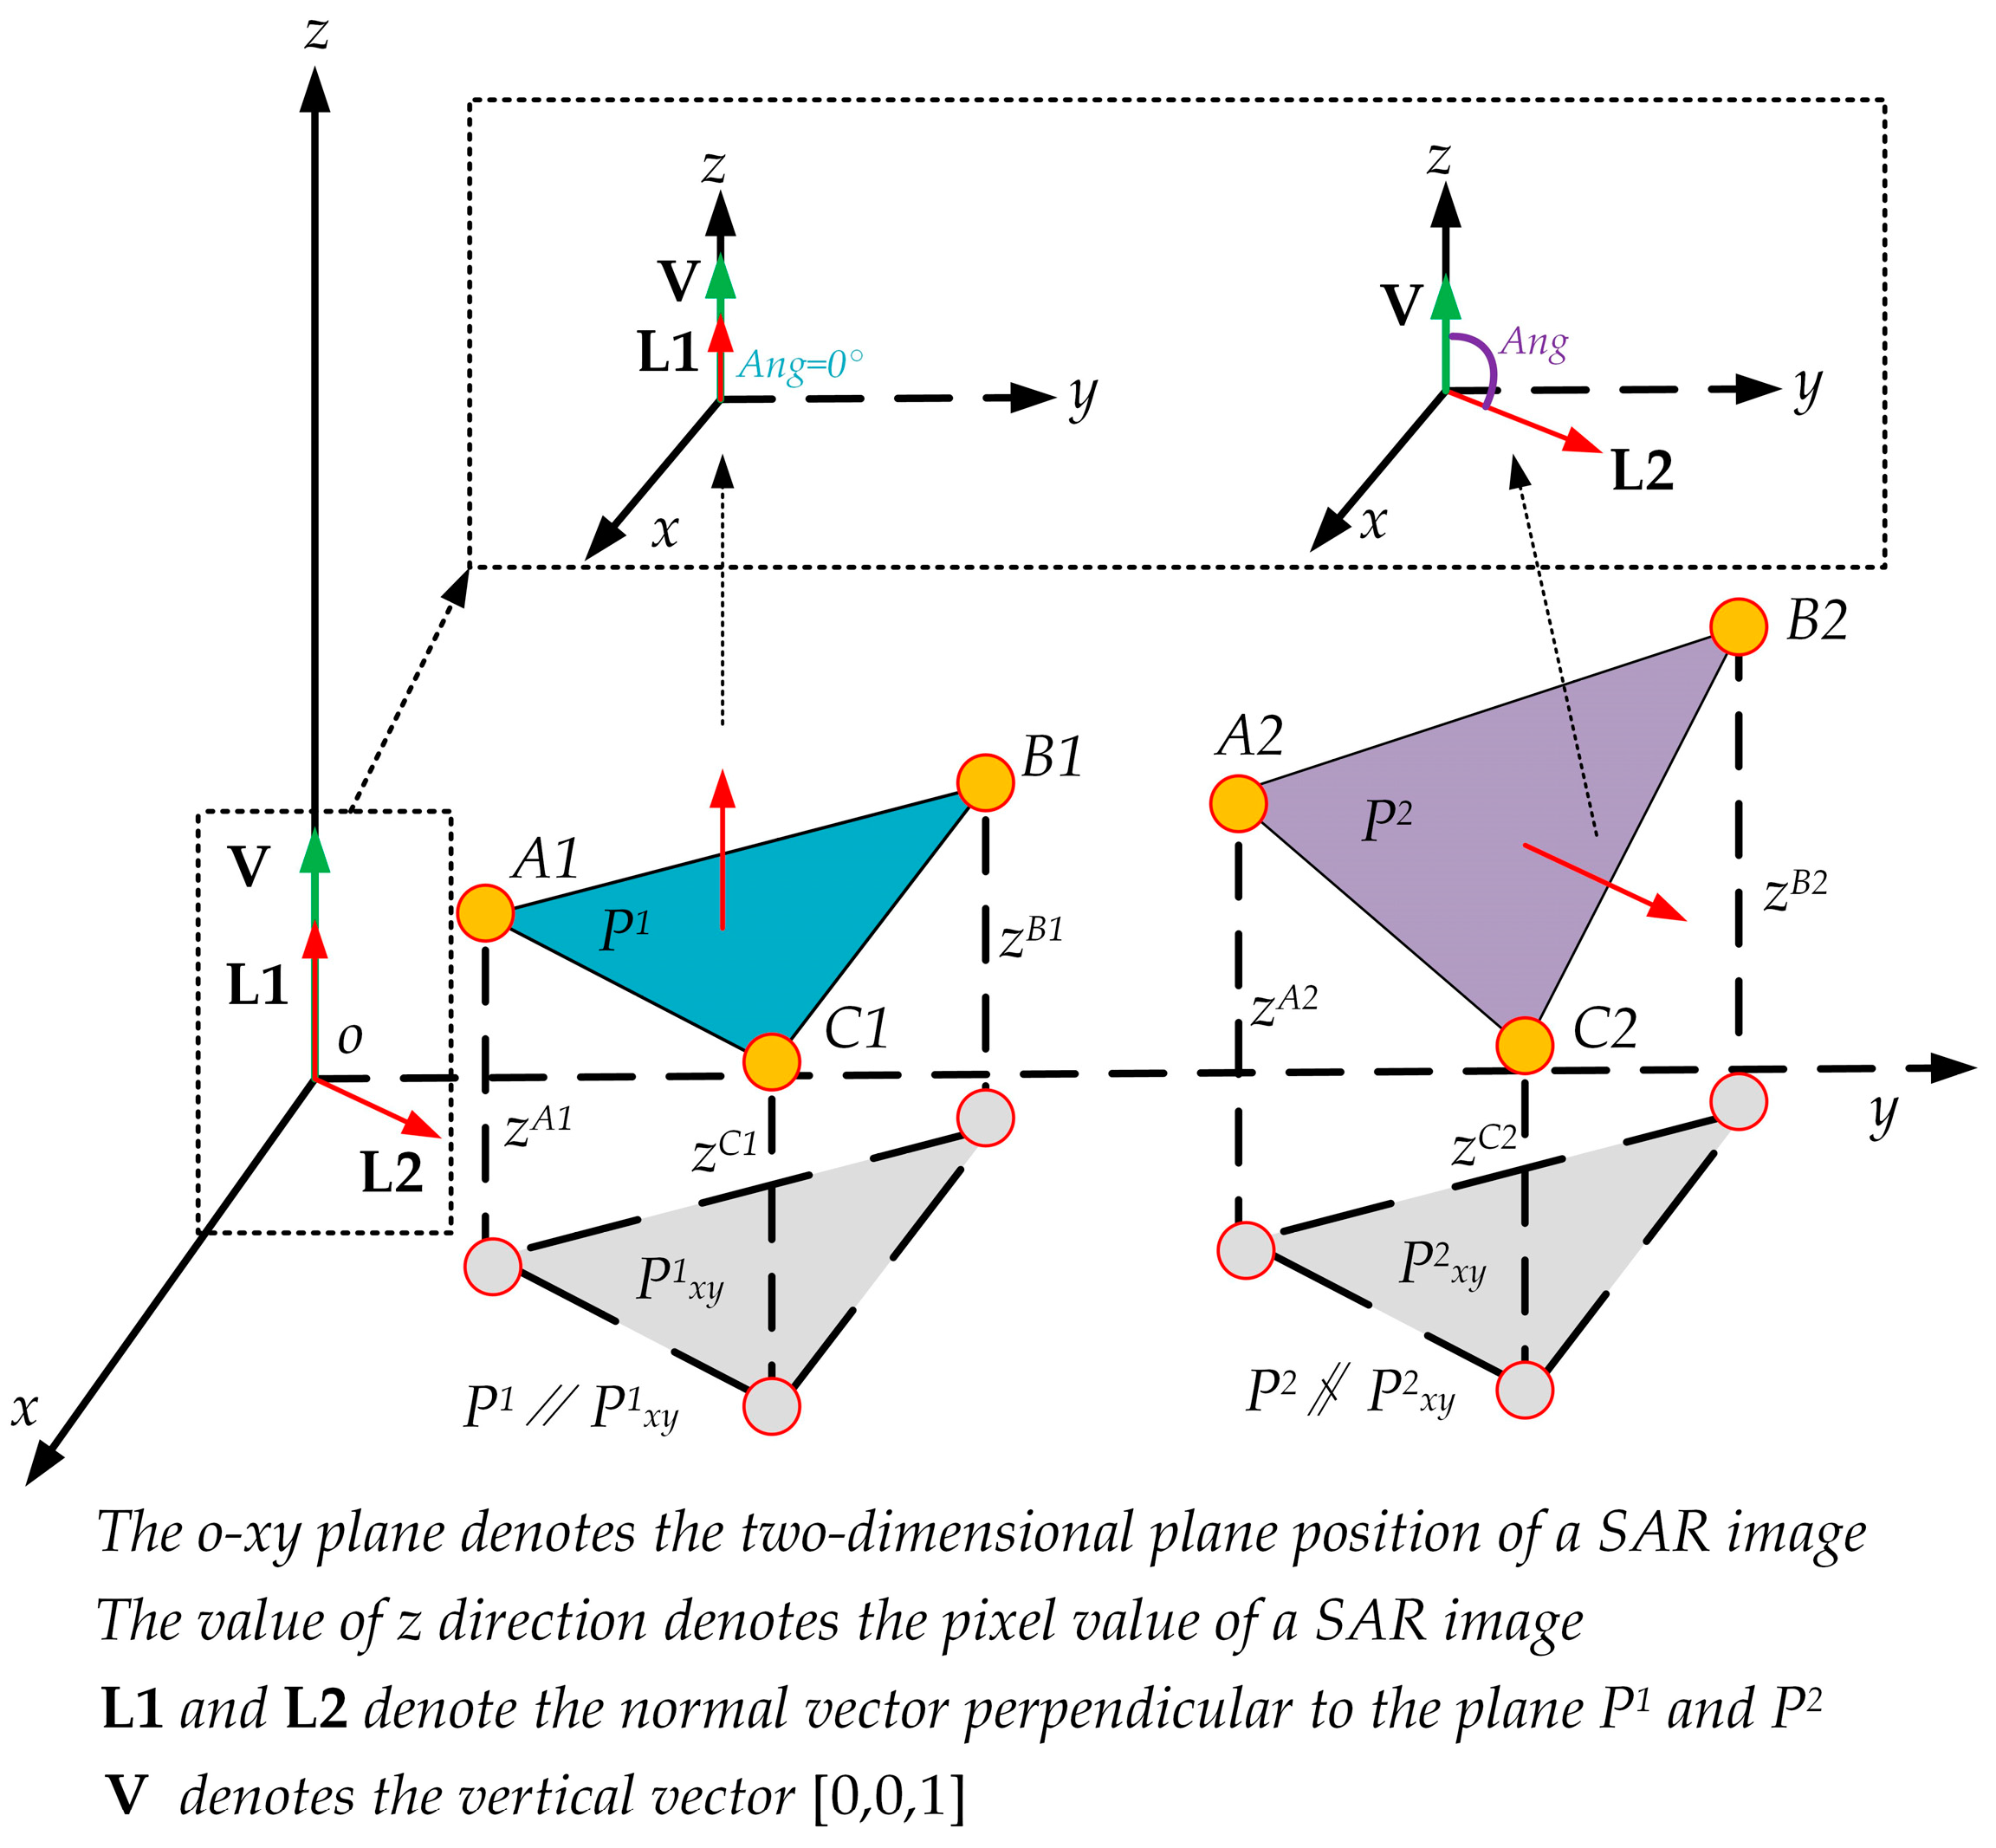
Figure 1. Local plane-inclination diagram.
Remotesensing 15 01029 g001
Figure 2. Multi-directional LPIA diagram.
Remotesensing 15 01029 g002
Figure 3. Schematic diagram of cube similarity based on MDLPIA.
Remotesensing 15 01029 g003
Figure 4. The specific flow chart of proposed filter.
Remotesensing 15 01029 g004
Figure 5. (a) Added single-look speckled image (the mean is 1 and the variance is 0.1), (b) GF-3 SAR image, (c) TerraSAR-X SAR image, (d) RadarSAT-2 SAR image, and (e) ALOS-2 SAR image.
Remotesensing 15 01029 g005
Figure 6. (a1) Added single-look speckle image (the mean is 1 and the variance is 0.1). Images were filtered using (b1) DPAD, (c1) EnLee, (d1) SAR-BM3-D, (e1) FANS, (f1) PPB, (g1) DnCNN, (h1) NL-means, and (i1) MDLPIA-NLM filters. (a2i2) Locally enlarged images of region 1 of (a1i1), respectively. The red box and circle are areas for further observation.
Remotesensing 15 01029 g006
Figure 7. (a) Simulated true speckle noise. Ratio images between noisy and filtered images using (b) DPAD, (c) EnLee, (d) SAR-BM3-D, (e) FANS, (f) PPB, (g) DnCNN, (h) NL-means, and (i) MDLPIA-NLM filters.
Remotesensing 15 01029 g007
Figure 8. (a1) GF-3 original image. Images were filtered using (b1) DPAD, (c1) EnLee, (d1) SAR-BM3-D, (e1) FANS, (f1) PPB, (g1) DnCNN, (h1) NL-means, and (i1) MDLPIA-NLM filters. (a2i2) Locally enlarged images of region 1 of (a1i1), respectively. The red box and circle are areas for further observation.
Remotesensing 15 01029 g008
Figure 9. Ratio images between noisy and filtered GF-3 SAR images using (a) DPAD, (b) EnLee, (c) SAR-BM3-D, (d) FANS, (e) PPB, (f) DnCNN, (g) NL-means, and (h) MDLPIA-NLM filters.
Remotesensing 15 01029 g009
Figure 10. (a1) TerraSAR-X original image. Images filtered by (b1) DPAD, (c1) EnLee, (d1) SAR-BM3-D, (e1) FANS, (f1) PPB, (g1) DnCNN, (h1) NL-means, and (i1) MDLPIA-NLM filters. (a2i2) Locally enlarged images of region 1 of (a1i1), respectively. The red box and circle are areas for further observation.
Remotesensing 15 01029 g010
Figure 11. Ratio images between noisy and filtered TerraSAR-X SAR images using (a) DPAD, (b) EnLee, (c) SAR-BM3-D, (d) FANS, (e) PPB, (f) DnCNN, (g) NL-means, and (h) MDLPIA-NLM filters.
Remotesensing 15 01029 g011
Figure 12. (a1) RadarSAT-2 original image. Images filtered by (b1) DPAD, (c1) EnLee, (d1) SAR-BM3-D, (e1) FANS, (f1) PPB, (g1) DnCNN, (h1) NL-means, and (i1) MDLPIA-NLM filters. (a2i2) Locally enlarged images of region 1 of (a1i1), respectively. The red box and circle are areas for further observation.
Remotesensing 15 01029 g012
Figure 13. Ratio images between noisy and filtered RadarSAT-2 SAR images using (a) DPAD, (b) EnLee, (c) SAR-BM3-D, (d) FANS, (e) PPB, (f) DnCNN, (g) NL-means, and (h) MDLPIA-NLM filters.
Remotesensing 15 01029 g013
Figure 14. (a1) ALOS-2 original image. Images filtered by (b1) DPAD, (c1) EnLee, (d1) SAR-BM3-D, (e1) FANS, (f1) PPB, (g1) DnCNN, (h1) NL-means, and (i1) MDLPIA-NLM filters. (a2i2) Locally enlarged images of region 1 of (a1i1), respectively. The red box and circle are areas for further observation.
Remotesensing 15 01029 g014
Figure 15. Ratio images between noisy and filtered ALOS-2 SAR images using (a) DPAD, (b) EnLee, (c) SAR-BM3-D, (d) FANS, (e) PPB, (f) DnCNN, (g) NL-means, and (h) MDLPIA-NLM filters.
Remotesensing 15 01029 g015
Table 1. Real SAR image parameters.
SensorsBandsResolutionPolarizationNumber of Looks
GF-3C3VVSingle
TerraSAR-XX3HHSingle
RadarSAT-2C8HVSingle
ALOS-2L6HHSingle
Table 2. Index evaluation for the simulated data.
FiltersENL + Increased 1SSIESISSIMM-IndexKLD
None3.70 + 0.00-----
DPAD74.39 + 19.110.590.140.746.262.62
EnLee273.46 + 72.910.530.120.5110.842.37
SAR-BM3-D1054.02 + 283.870.550.100.5520.862.76
FANS1051.14 + 283.090.550.060.5119.062.66
PPB539.38 + 144.780.530.270.5624.412.15
DnCNN544.53 + 146.170.510.080.3797.172.76
NL-means417.20 + 111.760.520.200.507.462.17
MDLPIA-NLM621.20 + 166.890.510.280.566.102.13
1 The multiple of increased ENL compared with the noisy image.
Table 3. Index evaluation on the GF-3 SAR image.
FiltersENL + Increased 1SSIESISSIMM-Index
None2.78 + 0.00----
DPAD14.00 + 4.040.720.320.8113.51
EnLee24.70 + 7.880.710.160.7810.95
SAR-BM3-D10.18 + 2.660.750.350.8432.05
FANS16.30 + 4.860.720.320.8112.42
PPB50.54 + 17.180.590.230.7913.76
DnCNN186.56 + 66.110.510.200.7815.92
NL-means63.83 + 21.960.540.090.719.95
MDLPIA-NLM64.29 + 22.130.510.350.808.57
1 The multiple of increased ENL compared with the noisy image.
Table 4. Index evaluation for the TerraSAR-X SAR image.
FiltersENL + Increased 1SSIESISSIMM-Index
None3.34 + 0.00----
DPAD19.87 + 4.950.840.340.8210.43
EnLee70.2520.030.890.230.6213.96
SAR-BM3-D12.96 + 2.880.830.500.8428.60
FANS54.78 + 15.400.850.280.7710.61
PPB114.53 + 33.290.720.270.6717.78
DnCNN228.75 + 67.490.630.680.3821.66
NL-means105.11 + 30.470.770.190.6010.43
MDLPIA-NLM116.17 + 33.780.500.550.829.75
1 The multiple of increased ENL compared with the noisy image.
Table 5. Index evaluation for the RadarSAT-2 SAR image.
FiltersENL + Increased 1SSIESISSIMM-Index
None3.35 + 0.00----
DPAD46.22 + 12.800.740.260.7716.60
EnLee155.60 + 45.450.700.130.5732.53
SAR-BM3-D63.37 + 17.920.730.310.8513.06
FANS102.95 + 29.730.710.200.7113.57
PPB335.17 + 99.050.590.270.6130.99
DnCNN561.05 + 166.480.590.250.3312.54
NL-means50.40 + 14.040.880.600.8937.68
MDLPIA-NLM239.16 + 70.390.520.500.889.18
1 The multiple of increased ENL compared with the noisy image.
Table 6. Index evaluation for the ALOS-2 SAR image.
FiltersENL + Increased 1SSIESISSIMM-Index
None3.60 + 0.00----
DPAD130.71 + 35.310.810.200.7879.85
EnLee142.55 + 38.600.780.120.6037.22
SAR-BM3-D374.77 + 103.100.790.200.6928.41
FANS183.02 + 49.830.760.160.6629.65
PPB319.83 + 87.840.700.160.5533.65
DnCNN172.93 + 47.040.700.130.3426.22
NL-means171.28 + 46.580.790.230.7458.46
MDLPIA-NLM184.68 + 50.300.690.250.7627.41
1 The multiple of increased ENL compared with the noisy image.
Disclaimer/Publisher’s Note: The statements, opinions and data contained in all publications are solely those of the individual author(s) and contributor(s) and not of MDPI and/or the editor(s). MDPI and/or the editor(s) disclaim responsibility for any injury to people or property resulting from any ideas, methods, instructions or products referred to in the content.