Abstract
Accurate knowledge of urban forest patterns contributes to well-managed urbanization, but accurate urban tree canopy mapping is still a challenging task because of the complexity of the urban structure. In this paper, a new method that combines double-branch U-NET with multi-temporal satellite images containing phenological information is introduced to accurately map urban tree canopies. Based on the constructed GF-2 image dataset, we developed a double-branch U-NET based on the feature fusion strategy using multi-temporal images to obtain an accuracy improvement with an IOU (intersection over union) of 2.3% and an F1-Score of 1.3% at the pixel level compared to the U-NET using mono-temporal images which performs best in existing studies for urban tree canopy mapping. We also found that the double-branch U-NET based on the feature fusion strategy has better accuracy than the early fusion strategy and decision fusion strategy in processing multi-temporal images for urban tree canopy mapping. We compared the impact of image combinations of different seasons on the urban tree canopy mapping task and found that the combination of summer and autumn images had the highest accuracy in the study area. Our research not only provides a high-precision urban tree canopy mapping method but also provides a direction to improve the accuracy both from the model structure and data potential when using deep learning for urban tree canopy mapping.
1. Introduction
Increasing urbanization and urban growth cannot be ignored in today’s world [1,2,3,4,5]. Only 30% of the world’s population lived in cities in 1950, while more than half of the world’s human population lived in urban areas in 2018, and the proportion of the urban population will increase to nearly 70% by 2050 [3]. According to the World Bank, the proportion of the world’s urban population gradually increased from 47% in 2020 to 56% in 2021 [6]. It is indisputable that the city is becoming an increasingly important human habitat. Well-managed urbanization has become a critical issue with increasing urbanization and urban growth [7]. As an important part of urban ecosystems, urban forests provide a variety of ecological services [8,9,10], including reducing greenhouse gases by sequestering and storing large amounts of carbon [11], evapotranspiration to reduce urban temperature [12], reducing gaseous pollutants and particulate matter to improve air quality [13], improving urban landscapes to improve human mental health [1,14,15], providing food, wood and medicine to provide economic benefits [16], and providing habitat to maintain urban ecosystem biodiversity [14,17]. More effective planning and management of urban forests to fully utilize their ecological services to achieve well-managed urbanization and improve the quality of urban life has attracted much attention [18].
Timely and accurate knowledge of urban forest patterns is critical for developing appropriate planning and management policies. The urban tree canopy, which is defined as the ground area covered by layers of foliage, branches and trunks, is one of the most widely used metrics to characterize urban forest patterns [19]. The conventional method of urban tree canopy mapping requires ground surveys by the relevant forestry department. Ground surveys are not only expensive in terms of manpower, time and economy but also difficult to provide accurate, time-consistent and real-time observations of urban forest canopies due to the difficulty of covering a large area in a short period of time [20]. With the development of remote sensing technology, remote sensing data that can cover a large area in a short period of time can grasp the urban forest pattern in real time with low time, human and economic costs to support relevant decision-making [21,22,23].
The urban forest is a kind of forest with unusual characteristics [24]. The complexity and spatial heterogeneity of urban structures make it a challenging task to automatically map urban tree canopies using remote sensing data [23,25,26]. Urban canopy mapping requires the use of high-resolution imagery and high-performance machine learning methods, since urban forests are often mixed with other urban features [24,27,28]. Conventional machine learning algorithms that are commonly used in remote sensing image processing include unsupervised machine learning algorithms such as K-MEANS [29], the iterative self-organizing data analysis technique algorithm (ISODATA) [30] and vegetation index methods [31,32]. Supervised machine learning algorithms include the decision tree (DT) [33], random forest (RF) [34], support vector machine (SVM) [35] and maximum likelihood methods [36]. However, the shortcomings of requiring more engineering by hand and difficulty in utilizing deep abstract features limit the performance of shallow conventional machine learning [37,38,39,40].
With the development of high-performance GPU, cloud computing, data processing technology (such as various activation functions) and other related computer technologies, deep learning technology has achieved outstanding performance in many fields [38,41,42,43,44,45,46]. Convolutional neural networks have shown outstanding performance in the field of image processing [47,48,49]. Typical convolutional neural networks such as AlexNet can only judge the probability of the target object appearing in the image block due to the existence of the fully connected layer, which makes it difficult to efficiently perform pixel-level processing [50,51]. Long et al. replaced all the fully connected layers in a typical convolutional neural network with convolutional layers to construct a fully convolutional neural network (FCN) that can efficiently perform pixel-level classification [52]. After that, a series of fully convolutional neural network models were constructed on the basis of FCN [53,54,55,56]. Several studies have applied deep learning methods to urban tree canopy mapping. Martins et al. applied FCN, U-NET, Seg-Net, DeepLabV3+ and a dynamic dilated convolution network to the Campo Grande area for urban tree canopy mapping and obtained IOU ranging from 70.01% to 73.89% [27]. Wanger et al. applied the U-NET model to São Paulo, Brazil, and obtained an overall accuracy of approximately 96% [57]. Existing studies have shown that U-NET is the fully convolutional neural network that currently performs the best for urban tree canopy mapping tasks after comprehensively considering indicators such as accuracy and the number of model parameters [27,58].
Almost all plant life exhibits seasonal changes due to abiotic factors and the characteristics of the plants themselves. This seasonal change in plants is also known as phenology, which is important for distinguishing plant species [59,60]. As special multi-source data, multi-temporal data can compensate for the lack of spectral information by including the phenological information of plants to effectively capture the local details of vegetation [37,61,62,63,64]. It has been shown that the full use of multi-temporal data in vegetation classification tasks can achieve higher accuracy compared to mono-temporal data [65]. Since the methods for classifying and identifying urban forests based on remote sensing data are still in their infancy, there have been few studies on improving the accuracy of urban tree canopy mapping tasks by mining multi-temporal data [18,37,62]. Exploring methods to efficiently mine multi-temporal data to improve the accuracy of urban tree canopy mapping tasks can significantly improve the application effect of remote sensing data in urban forestry.
With the development of deep learning, multi-branch networks that can effectively process multi-source data with different structures have been constructed and have shown excellent performance [66,67,68,69]. Multi-branch convolutional neural networks with different structures were constructed based on different data fusion strategies, including multi-branch neural networks based on a feature fusion strategy and multi-branch networks based on a decision fusion strategy [70,71,72,73,74]. Some studies have shown that multi-branch networks can effectively process multi-source data with different structures, but few studies have tried to combine multi-branch networks with multi-temporal data as special multi-source data to improve the accuracy of vegetation classification tasks.
Multi-temporal data have shown great potential for vegetation remote sensing, and multi-branch networks have demonstrated strong capabilities in processing multi-source data [62,75]. However, no research has combined multi-temporal data with multi-branch neural networks for urban tree canopy mapping [18]. In this paper, we constructed a multi-temporal dataset based on GF2 satellite images, developed a double-branch U-NET based on the feature fusion strategy to process multi-temporal images and obtained significant accuracy improvement for the urban tree canopy mapping task compared to the U-NET using mono-temporal images which performed best in the existing studies.
The contributions of this paper can be summarized in the following three aspects:
(1). This paper demonstrates the effectiveness of using multi-temporal data to improve the accuracy of urban canopy mapping. To the best of our knowledge, this is the first study to combine multi-temporal imagery and double-branch convolutional neural networks to deeply mine multi-temporal data for urban tree canopy mapping tasks.
(2). We developed a double-branch U-NET based on the feature fusion strategy that performs better in processing multi-temporal data for urban tree canopy mapping than multi-temporal images processing methods based on the early fusion strategy and the double-branch U-NET based on the decision fusion strategy.
(3). We analyzed the performance of images with different seasonal combinations in the urban tree canopy mapping task and found that the combination of images in summer and autumn performed the best in Beijing.
2. Materials and Methods
All processing procedures in this paper are shown in Figure 1. All remote sensing image processing processes are carried out in ENVI. Gaofen-2 satellite images (panchromatic band of 1 m spatial resolution, multi-spectral bands of 4 m spatial resolution) were first preprocessed with radiometric calibration (Radiometric Calibration tool), atmospheric correction (QUAC algorithm), orthorectification (RPC algorithm) and pan sharping (Gram-Schmidt Pan sharping tool) to obtain 1 m resolution multi-spectral images. To obtain ground truth, higher resolution satellite images such as Google Earth were used for visual interpretation, and the interpretation results were corrected by a ground survey. The original remote sensing images and ground truth were cropped to 256 × 256 pixel size tiles and divided into a training dataset, a validation dataset and a test dataset. All canopy mapping and data cropping processes are handled in ArcMap. The original images and ground truth in the training dataset were adopted to train the deep learning model, and the model with the best performance on the validation was saved. The test dataset was fed into the trained model to obtain urban tree canopy mapping results. Finally, the accuracy of the results of each model’s semantic segmentation was evaluated, and the effects of various time-phase satellite image combinations on the mapping of urban forest canopy were investigated.
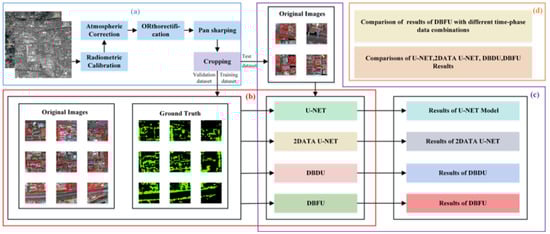
Figure 1.
All processing procedures in this paper: (a) satellite image preprocessing; (b) model training; (c) model prediction; (d) comparison of results from all methods and effects of various time-phase satellite image combinations.
2.1. Study Area
Beijing, the capital of China, has a typical temperate continental climate, which favors the growth of temperate coniferous forests and warm-temperate deciduous broad-leaved woods. The government of Beijing attaches great importance to environmental protection and has invested a great deal of energy in urban greening. According to the data provided by the Beijing Municipal Forestry and Parks Bureau, Beijing has created 400 hectares of urban green space in 2021, reached 49% urban green coverage and 44.6% forest coverage, and planned to create 200 hectares of additional urban green space in 2022 in order to reach 49.1% urban green coverage and 44.8% forest coverage [76].
As the study area, we chose two blocks with a combined area of approximately 65 km2 in Chaoyang, Tongzhou, and Fengtai (Figure 2). There are urban forest parks, residential areas, farmland and other areas in the two blocks, covering urban forests with different distribution characteristics. Therefore, we can fully explore and verify the effect of different methods on urban tree canopy mapping based on the data of the study area.
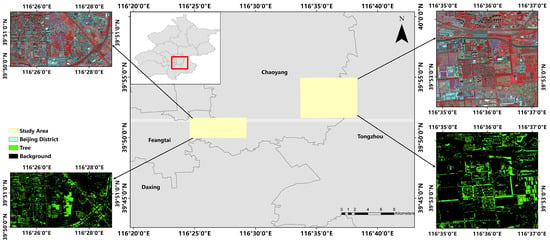
Figure 2.
Diagrammatic representation of study area’s location and the relevant data used. Satellite images (displayed in 4-3-2 band false color) and corresponding ground truth.
2.2. Data Source and Processing
2.2.1. Multi-Temporal Satellite Images
Gaofen-2 satellite images serve as the paper’s primary data. The PMS sensor of the Gaofen-2 satellite has a panchromatic band (0.45 μm–0.90 μm) with a spatial resolution of 1 m and a multi-spectral band (blue band (0.45 μm–0.52 µm), green band (0.52 µm–0.59 µm), red band (0.63 μm–0.69 µm), near infrared band (0.77 μm–0.89 µm)) with a resolution of 4 m. Four Gaofen-2 satellite images collected at three separate periods were obtained from the Natural Resources Satellite Remote Sensing Cloud Service Platform in accordance with the experimental design in this research. The first image was acquired in summer (taken on 28 May 2021). An image providing information about autumn was taken on 23 September 2021. The image representing winter was taken on 30 December 2021, and two images were required to fully cover the study area.
After acquiring the Gaofen-2 satellite images, preprocessing was required to acquire 1 m resolution multi-spectral images, including radiometric calibration, atmospheric correction, orthorectification, image registration and image fusion. First, the radiometric calibration of the panchromatic band and the multi-spectral band was carried out according to the absolute radiometric calibration coefficient of the GaoFen-2 satellite released by the China Center for Resources Satellite Data and Application. Atmospheric correction for the multi-spectral bands was then performed using the QUAC algorithm. As a relative correction model to remove atmospheric noise from remote sensing data, the QUAC algorithm does not require any auxiliary information and is already integrated into ENVI for easy use [77]. DEM data with a 90 m spatial resolution and RPC Orthorectification Workflow in ENVI were employed to ortho-correct multi-spectral and panchromatic bands. Due to the spatial offset between the panchromatic band and the multi-spectral band, the control points were manually selected for image registration. Finally, image fusion of panchromatic and multi-spectral bands was performed using the Gram-Schmidt Pan sharping algorithm to obtain multi-spectral satellite images with 1 m resolution.
2.2.2. Ground Truth
The ground truth is required to effectively complete experimental investigations. We obtained satellite images taken at multiple times from the study area. In the experiment, the satellite images on 28 May 2021 were regarded as the basic images, and the satellite images at other times were regarded as supplementary information sources for providing phenological information. All ground truth data in the experiments were based on satellite images taken on 28 May 2021. To obtain the ground truth, the Gaofen-2 images were displayed in the 4-3-2 band false color, combined with higher resolution satellite images, such as Google Earth, Baidu Map, etc. The urban tree canopy contours were drawn in ArcMap 10.2 using visual interpretation. Finally, the drawing results were corrected based on the ground survey.
2.2.3. Sample Dataset
Due to the limitation of GPU in the hardware environment, the satellite images and ground truth were cropped into tiles of 256 × 256 pixels. A total of 936 tiles were collected, and 10% of the entire dataset was divided into the test dataset. Furthermore, 85% of the remaining data were used as the training dataset, and 15% were used as the validation dataset. There was no overlap among them. The mean and standard deviation of the two-phase data in the training dataset, the validation dataset and the test dataset were calculated separately to standardize the data during the experiment.
2.3. Networdk Structure
Three convolutional neural network models with different structures are presented in this section: typical U-NET, improved double-branch U-NET using the decision fusion strategy based on the typical U-NET (named DBDU), and improved double-branch U-NET using a multi-level feature fusion strategy based on the typical U-NET (named DBFU).
2.3.1. U-NET
Olaf Ronneberger et al. proposed the U-NET convolutional neural network in 2015 for biological tasks [53]. U-NET has been extensively employed in the field of satellite image processing because of its ability to analyze high-resolution images effectively [51].
The structure of the U-NET can be divided into two parts: the contracting path (encoder) and the expansive path (decoder). The contracting path can efficiently extract spatial characteristics and capture context information, whereas the expansive path employs the image features that are extracted by the contracting path to provide the outcomes of image segmentation. The U-NET is typically represented with a symmetrical U-shaped architecture since the contracting path and the contracting path are more or less symmetrical. Figure 3 depicts the U-NET structure employed in this paper.
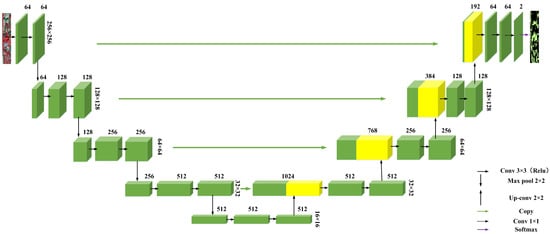
Figure 3.
Architecture of U-NET. Each green box represents a multi-channel feature map, the yellow box represents the feature map after transposed convolution. The number of channels is above the box, the size is on the right side of the box. Different arrows represent different operations.
The max pooling operation and convolution operation are frequently employed in the contracting path. In each basic operation unit, two 3 × 3 kernels are continuously used for the convolution operation. A rectified linear unit (RELU) follows after each convolution operation, and the number of feature channels increases during the convolution operation. After two convolution operations, a max-pooling operation with a size of 2 × 2 and a stride of 2 is performed to reduce the feature map size. The base operation unit is repeated four times, and two additional convolution operations are performed on the result of the last operation of the base operation unit.
The expansive path involves convolution operation, transposed convolutional operation, and concatenation operation. In each basic operation unit, a 2 × 2-sized transposed convolution is first used to expand the size of the feature map, and the result is concatenated with the feature map of the same size in the shrinking path. Then, two 3 × 3-sized kernels are used for the convolution operations, adding a rectified linear unit (RELU) after each convolution operation. The basic operation is performed four times, and a 1 × 1 convolution operation is performed on the result of the last basic operation to obtain the probability map. Finally, SoftMax is used to obtain the semantic segmentation result.
2.3.2. Double-Branch U-NET Based on Decision Fusion Strategy
Most studies on the processing of remote sensing data by the double-branch convolutional neural network have constructed two parallel processing branches and then used the decision fusion strategy to fuse the feature maps of the two branches after processing [70]. In this case, we adopted a similar fusion strategy to construct a double-branch U-NET based on the decision fusion strategy (named DBDU).
Based on the architecture of U-NET, we built the DBDU. The overall structure is shown in Figure 4. Two parallel processing branches are constructed for the GF2 satellite images of two phases. The green blocks and orange blocks in Figure 4 represent the multi-channel feature maps obtained by processing the satellite images captured at two different times. The structure of each processing branch completely adopts the U-NET architecture shown in Figure 3, including the contracting path and expansive path, the basic operation unit in the contraction path and expansion path, the convolution operations, transposed convolution operations, max pooling operation, etc., that form the basic operation unit.
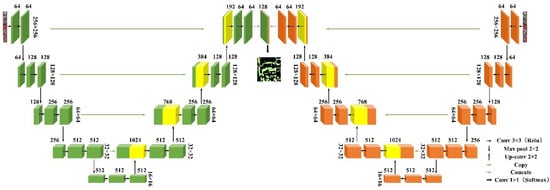
Figure 4.
Architecture of DBDU (double-branch U-NET based on decision fusion strategy). Each green box represents the multi-channel feature map obtained by the first-phase satellite image operation, each orange box represents the multi-channel feature map obtained by the second-phase satellite image operation, the yellow box represents the feature map after transposed convolution. The number of channels is above the box, and the size is on the right side of the box. Different arrows represent different operations.
The satellite images of the two phases were input into two parallel processing branches. After four sets of processing by the basic operation unit of the contracted path and four sets of processing of the basic operation unit of the extended path, two feature maps sized 256 × 256 and with a channel number of 64 were acquired. After concatenating the two feature maps on the channel, an additional 1 × 1 convolution operation was performed to obtain the probability distribution result, and the final result was obtained after processing with SoftMax.
2.3.3. Double-Branch U-NET Based on Feature Fusion Strategy
In the research on using a double-branch convolutional neural network to process satellite images, in addition to most of the double-branch network structures based on the decision fusion strategy, some double-branch convolutional neural network structures using the feature fusion strategy have also been constructed. Existing research has shown that the double-branch convolutional neural network based on the feature fusion strategy has outstanding performance in processing multi-source satellite images [68]. However, no study has combined double-branch convolutional neural networks and multi-temporal satellite imagery as special multi-source data for urban tree canopy mapping. To more effectively process multi-temporal satellite images for urban tree canopy mapping, we established a double-branch convolutional neural network based on the strategy of feature fusion based on the U-NET (named DBFU). The model architecture is shown in Figure 5.
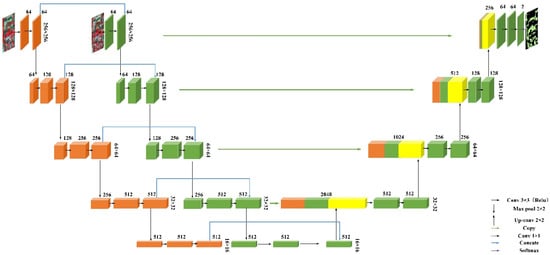
Figure 5.
Architecture of DBFU (double-branch U-NET of feature fusion). Each green box represents the multi-channel feature map obtained by the first-phase satellite image operation, each orange box represents the multi-channel feature map obtained by the second-phase satellite image operation, the yellow box represents the feature map after transposed convolution. The number of channels is above the box, and the size is on the right side of the box. Different arrows represent different operations.
Similar to the U-NET, the DBFU can also be divided into two parts: the contracting path (encoder) and the expansive path (decoder). In the contracting path, we constructed two parallel contracting paths for the satellite images of the two phases. The structures of the two contracting paths are identical and are consistent with the U-NET contracting path shown in Figure 3. The basic operation unit in the two contracting paths consists of two 3 × 3 convolutions followed by the rectified linear unit (RELU), as well as a max pooling operation with a size of 2 × 2 and a stride of 2, and the basic operation unit is repeated four times. After the fourth base operation unit, two further 3 × 3 convolution operations are added.
Unlike the two parallel contracting paths established for the satellite images of the two time-phases separately, there is only one expansive path. To better use the multi-temporal data, we concatenate the feature maps on the channel in the two branches of the contracting path at each size level to obtain multi-temporal feature map. Afterward, the multi-temporal feature map is channel-concatenated with the smaller-size feature map whose size is increased by the transposed convolution operation and then performs two 3 × 3 convolutions. For the feature map of the smallest size, since there is no smaller feature map, we directly concatenate the feature maps of the two phases on the channel. Finally, a 1 × 1 convolution operation is used to obtain the probability distribution, and SoftMax is used to obtain the final segmentation result.
2.3.4. Experimental Details
In this paper, we employed two different strategies using U-NET to process mono-temporal and multi-temporal images. Mono-temporal images were fed directly into the U-NET (the experimental flow is shown in Figure 6), while multi-temporal images were fed into the U-NET after channel concatenation (the experimental flow is shown in Figure 7). For DBFU and DBDU, the images of the two time-phases were input to the corresponding two processing branches (the experimental flow is shown in Figure 8).
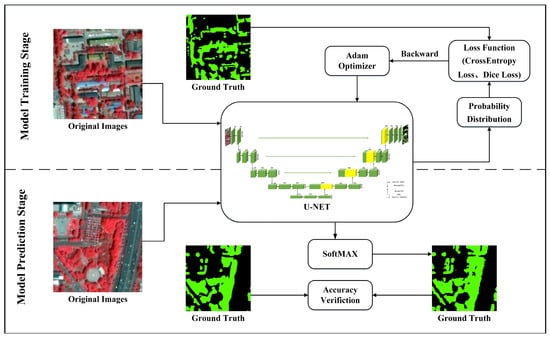
Figure 6.
Experimental flowchart of U-NET processing mono-temporal images.
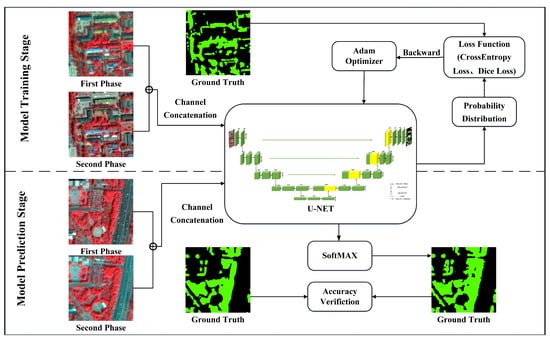
Figure 7.
Experimental flowchart of U-NET processing multi-temporal images.
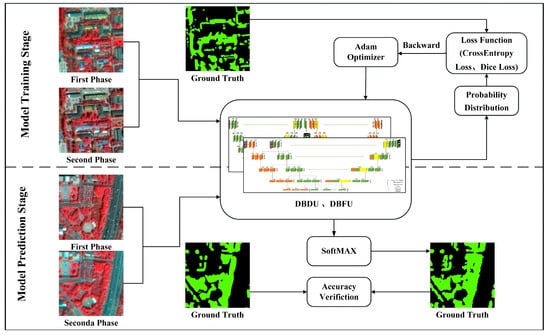
Figure 8.
Experimental flowchart of DBDU and DBFU processing multi-temporal images.
All experiments in this paper consist of two steps: model training and model prediction. In the model training step, all of the convolutional neural networks in this paper used the same scheme, which includes the model weight initialization method, the number of training epochs, the learning rate decay approach, and the model optimizer, among other things. No pretrained weights from other tasks were used during model training, and all models were trained from scratch. We trained for 40 epochs after freezing the encoder (named Freeze Training), the initial learning rate was set at 0.0001 during the Freeze Training step, and the learning rate was adjusted to 0.96 times after each epoch of training. After Freeze Training, we unfroze the encoder and continued training for 60 epochs, the initial learning rate was set to 0.00001; after each epoch of training, the learning rate was updated to 0.96 times. Considering the actual configuration of the computer GPU, the batch size was set to 8. We adopted the ADAM optimizer to reduce the loss, and then the model with the lowest loss on the validation dataset was saved during training [78]. All model hyperparameters are listed in Table 1.

Table 1.
Model hyperparameters for four experiments.
In the model prediction step, we took the model that performed the best on the validation set, fed the test dataset into the model to obtain the prediction result and combined the ground truth with the prediction result of the model to obtain the model performance.
2.4. Loss Function
After each iteration of training, the loss function is used to evaluate the model prediction results, and the evaluation results drive the deep learning model to update parameters in the process of backpropagation to optimize the model. Therefore, choosing an appropriate loss function is very important for deep learning tasks. In the semantic segmentation task, the commonly used loss function is the cross-entropy loss function [79]. The expression of the cross-entropy loss function is shown in Equation (1):
where represents the number of pixels, represents the probability that the ith pixel belongs to a certain category in the ground truth, and represents the corresponding predicted probability.
In addition to the cross-entropy loss function, other loss functions were gradually designed to suit different task requirements, such as the focal loss function [80] and a series of loss functions based on dice coefficients [81,82,83]. Considering the imbalance between the foreground and background in the image, we also considered the Dice loss function. Since our task is a binary classification task, the expression for calculating the Dice loss is:
where represents the number of pixels, and represent the pixel value of the ith pixel in the prediction result and the true value, respectively.
In the actual training process, the loss is given by
2.5. Evaluation Metrics
As a typical semantic segmentation task, we adopted some accuracy metrics that are often used in semantic segmentation tasks, including overall accuracy (OA), Precision, Recall, F1-Score (comprehensive consideration of Precision and Recall), and Intersection over Union (IOU) [84]. All accuracy calculations are based on the following confusion matrix (Table 2).
Table 2.
Confusion matrix for accuracy evaluation.
Overall accuracy means the ratio of the number of correctly predicted samples to the total number of samples in the test sample; Precision calculates the ratio of correctly predicted positive samples to all predicted positive samples; Recall is the ratio of predicted correct positive samples to all positive samples; F1-Score is a comprehensive consideration of Precision and Recall; IOU is the ratio of the intersection and union between the predicted results and the ground truth. Since we pay more attention to the effect of canopy mapping, the IOU calculation formula used in this study is shown in Equation (8).
3. Experiments and Results
In this section, the specific situation of the experiment is introduced, including the entire experimental process, the experimental running software and hardware environment, the hyperparameters of the model, etc., and the specific results of the experiment are compared and analyzed.
3.1. Comparison of Monotemporal Images and Multi-Temporal Images
We conducted two independent experiments to explore the role of multi-temporal satellite images for urban tree canopy mapping tasks. The first experiment input the single-phase GF2 remote sensing image on 28 May 2021, into the U-NET model (named U-NET), and the experimental flow is shown in Figure 6. The second experiment fed two-phase GF-2 satellite images from 28 May 2021 and 23 September 2021 into the U-NET model after concatenation at the channel level (named 2DATA U-NET). The experimental flow is shown in Figure 7.
3.1.1. Comparison of Validation Loss
During the model training process, the loss function evaluates the performance of the model by quantifying the degree of difference between the model prediction and the truth. Compared with the training loss, the validation loss can better demonstrate the performance of the model during the actual application. We captured and visualized the validation loss at each epoch during model training, as shown in Figure 9. In the second half of the training process, the validation loss of the 2DATA U-NET was lower in most epochs, and the minimum validation loss of the 2DATA U-NET during the whole training process was also lower than the minimum validation loss of the U-NET. Thus, for urban tree canopy mapping tasks, multi-temporal images can provide higher accuracy than mono-temporal images with the help of the phenological information contained.
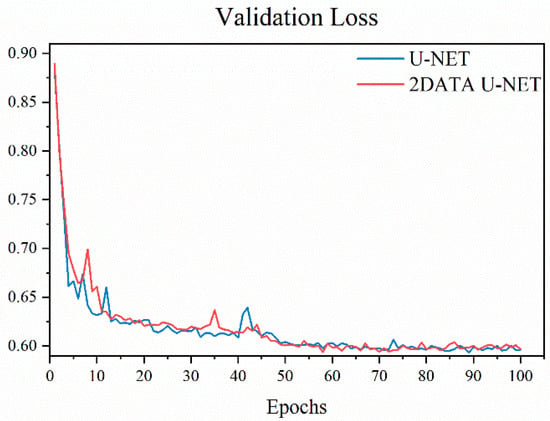
Figure 9.
Comparison of validation loss of mono-temporal images and multi-temporal images (Y-axis: the value of the validation loss in training process).
3.1.2. Comparison of Accuracy Metrics for Classification Results
We calculated evaluation metrics, including OA, Precision, Recall, F1-Score, and IOU to quantitatively evaluate the performance of multi-temporal images and mono-temporal images in the urban tree mapping task and focused more on F1-Score and IOU, which can comprehensively evaluate the classification results. From the experimental results (Table 3), all evaluation metrics of multi-temporal images were higher than those of mono-temporal images. Overall, the classification results obtained using multi-temporal images were better than those of mono-temporal images.
Table 3.
Comparison of the accuracy of mono-temporal images and multi-temporal images.
3.1.3. Visual Analysis of Classification Results
We input the test dataset into the model that performed best during the training process to obtain urban tree canopy mapping results, and the classification results are shown in Figure 10. It can be observed from the areas A, B and C selected with the yellow box in the Figure 10c,d that the results of mono-temporal images suffer from more errors in classifying other features as urban tree canopies. Thus, we can conclude that the phenological information provided by multi-temporal images can effectively reduce the misclassification between the urban tree canopy and other similar features such as grassland.
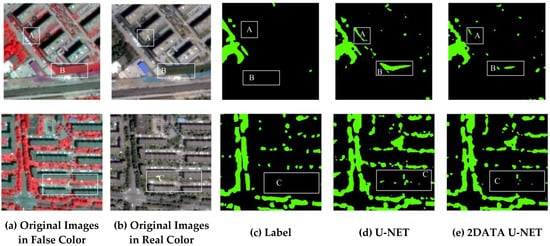
Figure 10.
Comparison of classification results of mono-temporal images and multi-temporal images: (a) original images in false color, (b) original images in real color, (c) ground truth, (d) classification results of U-NET (mono-temporal images), (e) classification results of 2DATA U-NET.
Although there is an improvement in the accuracy of multi-temporal data compared to mono-temporal data in terms of both our calculated accuracy metrics and visualization of classification results, the improvement is not significant. We need a more effective method to explore the phenological information in multi-temporal data.
3.2. Performance of Double-Branch U-NET Based on Feature Fusion Strategy
We input two-phase GF-2 satellite images from 28 May 2021 and 23 September 2021 into DBFU to obtain urban tree canopy mapping results (named DBFU). The experimental flow is shown in Figure 8. We compared the DBFU classification results with the U-NET and 2DATA U-NET in Section 3.2 to explore the performance of DBFU.
3.2.1. Comparison of Validation Loss
We obtained and visualized the validation loss of U-NET, 2DATA U-NET and DBFU in 100 training epochs, and the results are shown in Figure 11. The red line representing the validation loss of DBFU was at the bottom of the three lines in almost all epochs, and, more specifically, DBFU had the smallest validation loss in 95 out of 100 epochs. Not only the validation loss in each epoch but also the minimum validation loss that DBFU can achieve during the whole training process were smaller than that of U-NET and 2DATA U-NET. Thus, from the validation loss that reflects the model performance, we can tentatively conclude that DBFU performs better than 2DATA U-NET and U-NET.
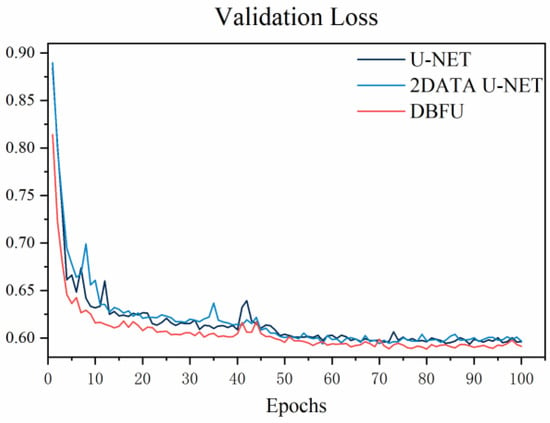
Figure 11.
Comparison of validation loss of U-NET, 2DATA U-NET and DBFU (Y-axis: the value of the validation loss in training process).
3.2.2. Comparison of Accuracy Metrics for Classification Results
After feeding the test dataset into the model with minimal validation loss during training, we obtained the urban tree canopy mapping results. To quantify the accuracy of DBFU, U-NET and 2DATA U-NET for urban tree canopy mapping tasks, we calculated OA, Precision, Recall, F1-Score and IOU (Table 4). From the F1-Score and IOU, which were more comprehensive for evaluating the classification results, the results of the DBFU we developed were the best. The F1-Score was ranked from large to small: DBFU (88.3%) > 2DATA U-NET (87.4) > U-NET (87.0), and the ranking of IOU from large to small was consistent with the F1-Score: DBFU (79.2%) > 2DATA U-NET (77.5%) > U-NET (76.9%).The F1-Score of the DBFU was 88.3%, and the IOU was 79.2%, with accuracy improvements of 0.9% (F1-Score) and 1.7% (IOU) compared to 2DATA U-NET and 1.3% (F1-Score) and 2.3% (IOU) compared to U-NET which had the best overall performance in the current study. For the urban tree canopy mapping task, DBFU was the best classifier approach from a quantitative point of view.
Table 4.
Comparison of the accuracy of U-NET, 2DATA U-NET and DBFU.
3.2.3. Visual Analysis of Classification Results
We visualized the classification results of the three methods and present the results in Figure 12.Overall, DBFU could effectively reduce the error of classifying other green features as tree canopies. In areas A, B and D, U-NET and 2DATA U-NET misclassify large areas of grassland as tree canopy, and the corresponding misclassification area of DBFU is the smallest. DBFU can extract the tree canopy features most effectively, and the canopy gaps in the F region were only successfully identified by DBFU, while the canopy was identified as continuous distribution in both the U-NET and 2DATA U-NET classification results. It could be observed from the classification results in regions E and G that the canopy edges of DBFU were more consistent with the ground truth. We also found that DBFU had better classification results for both fragmented canopies in regions C and H and continuous canopies in regions E and G.
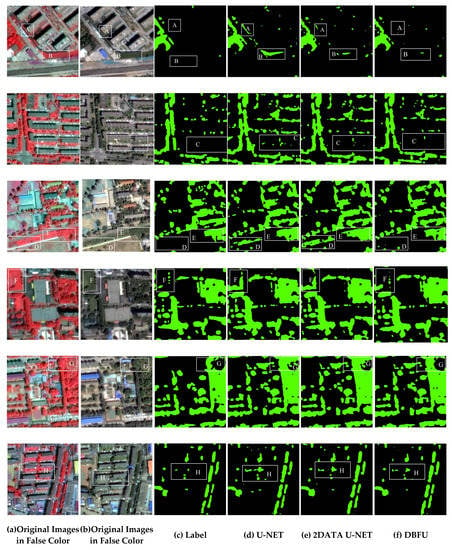
Figure 12.
Comparison of classification results of DBFU, U-NET and 2DATA U-NET: (a) original images in false color, (b) original images in real color, (c) ground truth, (d) classification results of U-NET, (e) classification results of 2DATA U-NET. (f) classification results of DBFU.
Considering the quantitative classification accuracy evaluation metrics and the visualization results of the classification results, we found that the accuracy of DBFU for urban tree canopy mapping was much better than that of U-NET and 2DATA U-NET. We concluded in Section 3.1 that multi-temporal data containing phenological information can improve the accuracy of urban tree canopy mapping tasks. In this section, DBFU performed better than 2DATA U-NET, which shows that DBFU can make full use of the phenological information contained in the multi-temporal data compared to U-NET. We believe that the best performance of the double-branch U-NET based on the feature fusion strategy is due to the fact that the double-branch U-NET based on the feature fusion strategy not only deeply extracts the plant features contained in the single-temporal images but also makes fuller use of the variation patterns of plant features in multiple-temporal images. Thus, the accuracy improvement of DBFU over U-NET was based on the improved model structure and the potential of multi-temporal data. The DBFU not only provides a highly accurate method for urban tree canopy mapping, but it also provides a direction for improvement that takes into account not only the model structure but also the data potential.
4. Discussion
4.1. Comparison of Different Data Fusion Strategies for Processing Multi-Temporal Images
Three independent experiments were designed to explore the effect of different data fusion strategies on the accuracy of urban tree canopy mapping. The first experiment adopts the same experimental design as 2DATA U-NET in Section 3.1 to represent the early fusion strategy. The second experiment fed the GF2 satellite images of the two phases of 28 May 2021 and 23 September 2021 into DBDU to represent the strategy of decision fusion. The experimental flow is shown in Figure 8 (named DBDU). The last experiment was consistent with DBFU in Section 3.2 to represent the feature fusion strategy.
4.1.1. Comparison of Validation Loss
Considering that the validation loss during the training process can reflect the performance of the model, we obtained and visualized the validation loss of 2DATA U-NET, DBDU and DBFU during the training process to preliminarily judge the performance of multi-temporal images with different fusion strategies. We can observe from Figure 13 that the validation loss of DBFU is lower than that of 2DATA U-NET and DBDU in almost all epochs, which indicates that the double-branch U-NET constructed based on the feature fusion strategy can process multi-temporal images more efficiently compared to the decision fusion strategy and early fusion strategy. The validation loss of DBDU is higher than that of DBFU in most epochs but lower than that of 2DATA U-NET, which indicates that the decision fusion strategy outperforms the early fusion strategy in the task of processing multi-temporal images.
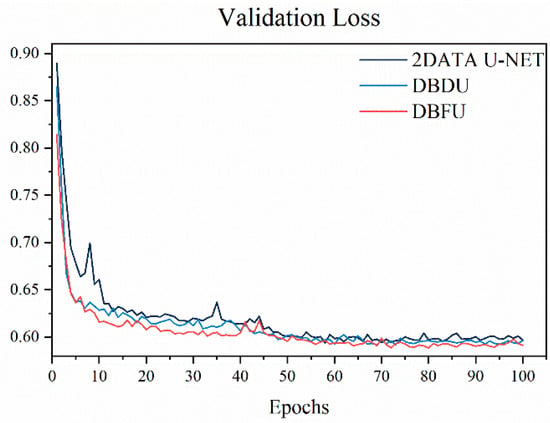
Figure 13.
Comparison of validation loss of 2DATA U-NET, DBDU and DBFU (Y-axis: the value of the validation loss in training process).
4.1.2. Comparison of Accuracy Metrics for Classification Results
To quantitatively compare the accuracy performance of the three strategies for urban tree canopy mapping with multi-temporal data, we calculated the evaluation metrics described in Section 2.5, and the results are shown in Table 5. The IOU was ranked from large to small: 88.3% (DBFU) > 87.5% (DBDU) > 87.4% (2DATA U-NET). For the F1-Score, which integrates Precision and Recall, the order from large to small was consistent with IOU as 79.2% (DBFU) > 77.8%(DBDU) > 77.5% (2DATA U-NET). Overall, the double-branch U-NET conducted based on the feature fusion strategy achieved the best comprehensive performance, while the early fusion strategy obtained the worst results for multi-temporal images. The performance of the decision fusion strategy is between the feature fusion strategy and the early fusion strategy.
Table 5.
Comparison of accuracy of 2DATA U-NET, DBDU and DBFU.
4.1.3. Visual Analysis of Classification Results
The urban tree canopy mapping results were obtained after feeding the test dataset into the model that performed best during the training process and are presented in Figure 14. By comparing the canopy mapping results for areas A, B, C, D, E, F, G and H, DBFU had the least area of misclassification of other features as urban tree canopy, and 2DATA U-NET had the most area of misclassification. By comparing the classification results of the F and H regions, we found that DBFU can maintain the morphological features of the tree canopy most effectively, and the sparse canopies in the F regions were only successfully identified in the classification results of DBFU, while the gaps between the canopies were not identified in the classification results of DBDU and 2DATA U-NET. In summary, the double-branch U-NET based on the feature fusion strategy can most effectively mine the phenological information contained in the multi-temporal images to reduce the error of classifying other ground objects as urban tree canopies, and the tree canopy edges in the classification results are also more detailed and more consistent with the ground truth.
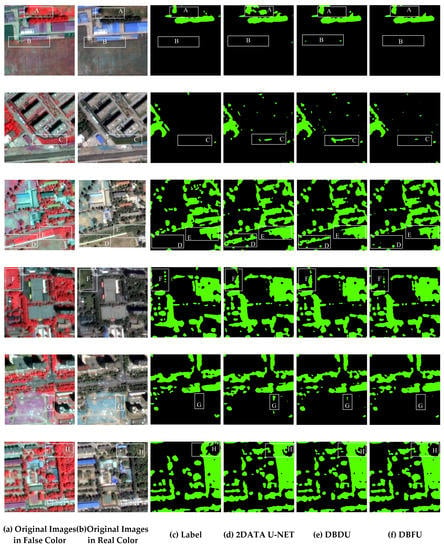
Figure 14.
Comparison of classification results of 2DATA U-NET, DBDU, DBFU: (a) original images in false color, (b) original images in real color, (c) ground truth, (d) classification results of 2DATA U-NET, (e) classification results of DBDU, (f) classification results of DBFU.
Combining the obtained multiple evaluation metrics and the visualized classification results, we concluded that the double-branch U-NET based on the feature fusion strategy can process the multi-temporal data most effectively and obtain the highest accuracy. The double-branch U-NET based on the feature fusion strategy can fully mine and more effectively utilize the phenological information in multi-temporal images and thus greatly improve the accuracy of the urban tree canopy mapping task. The double-branch U-NET based on the decision fusion strategy performed worse than the double-branch U-NET based on the feature fusion strategy, and the multi-temporal data processed using the early fusion strategy performed the worst.
4.2. Comparison of Different Seasonal Combinations of Images
Two independent experiments were designed to investigate the effect of different seasonal combinations of input data on the accuracy of urban tree canopy mapping. Both experiments adopted the DBFU model, and the experimental flow is shown in Figure 8. The first experiment adopted a combination of the GF2 satellite image captured on 28 May 2021, representing summer, and the GF2 satellite image captured on 23 September 2021, representing autumn (named DBFU (Summer and Autumn)). The combination of the GF2 satellite image taken on 28 May 2021, representing summer, and the satellite image taken on 30 December 2021, representing winter, was used in the second experiment (named DBFU (Summer and Winter)).
4.2.1. Comparison of Validation Loss
After feeding the image combination of summer and autumn and the image combination of summer and winter into DBFU separately, we obtained the loss on the validation dataset during the training process of 100 epochs (Figure 15). In 93 out of 100 epochs, the validation loss of DBFU using the combination of summer and autumn images was lower than that of DBFU using the combination of summer and winter images, and the minimum validation loss of DBFU using the combination of summer and autumn images was much lower than that of DBFU using the combination of summer and winter images. Therefore, we could tentatively determine from the validation loss during training that the accuracy of urban tree canopy mapping using the combination of summer and autumn images is much higher than that of the combination of summer and winter images.
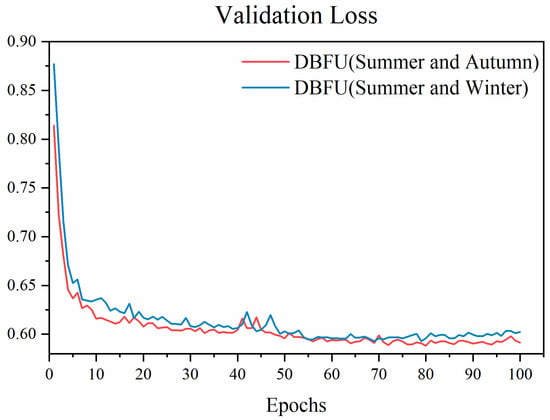
Figure 15.
Comparison of validation loss of different seasonal combinations of images (Y-axis: the value of the validation loss in training process).
4.2.2. Comparison of Accuracy Metrics for Classification Results
After feeding the test dataset into the best-performing model during experimental training, we obtained classification results for two different combinations of seasonal images. We obtained five evaluation indicators, including the IOU and F1-Score, and the results are shown in Table 6. Among them, we were most concerned about the F1-Score and IOU, which can comprehensively evaluate the classification results. We found that the F1-Score obtained by the DBFU using the combination of summer and autumn images reached 88.3%, and the corresponding F1-Score obtained by the DBFU using the combination of summer and winter images was 85.7%, with a difference of 2.6%. The IOU of the two methods were 79.2% and 75.0%, respectively, with a larger gap of 4.2%. Therefore, through these calculated accuracy indicators, we conclude that the performance of using the combination of summer and autumn images is much higher than that of using the combination of summer and winter.
Table 6.
Comparison of accuracy of different seasonal combinations of images.
4.2.3. Visual Analysis of Classification Results
By comparing the classification results in the same area (Figure 16), we found that the combination of summer and autumn images can effectively reduce the error of classifying other features as tree canopies by mining the phenological information, while the combination of summer and winter images into DBFU increases the error of classifying other features as tree canopies. In Region A, DBFU using the combination of summer and winter images classified a large number of other features as urban tree canopies, and the classification errors were not only more than those of DBFU using the combination of summer and autumn images but even more than those of U-NET using mono-temporal images. The combination of images in summer and winter negatively affects the extraction of tree canopy boundaries. In regions B and C, it can be clearly seen that the tree canopy boundaries extracted using the combination of summer and winter images are less consistent with the ground truth than those when using the combination of summer and autumn images.
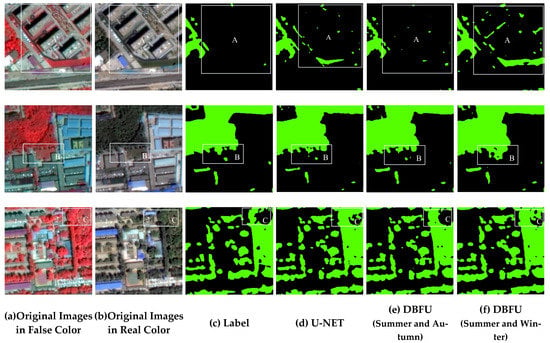
Figure 16.
Comparison of classification results of different seasonal combinations of images: (a) original images in false color, (b) original images in real color, (c) ground truth, (d) classification results of U-NET (Summer Images), (e) classification results of DBFU (Summer and Autumn Images), (f) classification results of DBFU (Summer and Winter Images).
Considering the validation loss during the training process, the visualization of the model results and the computed accuracy evaluation metrics, we conclude that the combination of summer and winter images performs much worse than the combination of summer and autumn images. The reason for this is that our selected study area has a typical temperate continental climate with large areas of warm temperate deciduous broad-leaved woods, and the canopy of deciduous broad-leaved woods undergoes great morphological changes due to leaf drop in winter. Therefore, it is crucial for us to select the right combination of seasonal images according to the actual situation when using multi-temporal data for urban tree canopy mapping tasks.
5. Conclusions
For high-precision urban tree canopy mapping, we established a deep learning classification method based on the double-branch U-NET of feature fusion strategy, which could make full use of multi-temporal images containing phenological information. Our method achieved an IOU of 79.2%, which was significantly higher than that of existing studies. We also found that the double-branch U-NET based on the feature fusion strategy acquired better accuracy in processing multi-temporal images for urban tree canopy mapping than the method based on the early fusion strategy and the double-branch U-NET based on the decision fusion strategy, which shows that double-branch U-NET based on the feature fusion strategy can be more effective in mining phenological information in multi-temporal data. Based on the high-precision method we constructed, we found that the multi-temporal images of different seasonal combinations greatly affect the accuracy of urban tree canopy mapping, and we need to select the appropriate multi-temporal image combinations according to the actual situation.
Our study provides a more accurate method for performing urban canopy mapping tasks and, moreover, provides a direction to improve the accuracy of urban tree canopy mapping tasks, not only from the model structure, but also by considering the potential of data application.
Although we have provided a comprehensive and adequate discussion of combining multi-temporal images and double-branch networks for urban canopy mapping tasks in this paper, there are still some areas that deserve further investigation and improvement. First, although we performed strict image registration on the multi-temporal images, we could not completely guarantee the perfect spatial coincidence of the images taken at multiple times, and it would be worthwhile in future studies to make the images acquired at multiple times more spatially consistent. Considering the different characteristics of the urban tree canopy in images of different seasons, we believe that the channel attention module can be added to the double-branch neural network to set different weights for images of different seasons to obtain phenological information more effectively.
Author Contributions
S.C. wrote the manuscript and designed the comparative experiments; J.W. supervised the study and revised the manuscript; M.C. and W.B. revised the manuscript; and B.Z. and T.M. gave comments and suggestions to the manuscript. All authors have read and agreed to the published version of the manuscript.
Funding
This research was funded by the National Key Research and Development Program of China, grant number 2019YFE0127600.
Institutional Review Board Statement
Not applicable.
Informed Consent Statement
Not applicable.
Data Availability Statement
Not applicable.
Acknowledgments
The authors would like to thank the editors and the reviewers for their valuable suggestions.
Conflicts of Interest
The authors declare no conflict of interest.
References
- Nesbitt, L.; Hotte, N.; Barron, S.; Cowan, J.; Sheppard, S.R.J. The social and economic value of cultural ecosystem services provided by urban forests in North America: A review and suggestions for future research. Urban For. Urban Green. 2017, 25, 103–111. [Google Scholar] [CrossRef]
- Davies, H.J.; Doick, K.J.; Hudson, M.D.; Schaafsma, M.; Schreckenberg, K.; Valatin, G. Business attitudes towards funding ecosystem services provided by urban forests. Ecosyst. Serv. 2018, 32, 159–169. [Google Scholar] [CrossRef]
- United Nations Department for Economic and Social Affairs. World Urbanization Prospects 2018; United Nations Department for Economic and Social Affairs: New York, NY, USA, 2018. [Google Scholar]
- Bao, W.; Gong, A.; Zhao, Y.; Chen, S.; Ba, W.; He, Y. High-Precision Population Spatialization in Metropolises Based on Ensemble Learning: A Case Study of Beijing, China. Remote Sens. 2022, 14, 3654. [Google Scholar] [CrossRef]
- Bao, W.; Gong, A.; Zhang, T.; Zhao, Y.; Li, B.; Chen, S. Mapping Population Distribution with High Spatiotemporal Resolution in Beijing Using Baidu Heat Map Data. Remote Sens. 2023, 15, 458. [Google Scholar] [CrossRef]
- The World Bank. Available online: https://data.worldbank.org/indicator/SP.URB.TOTL.IN.ZS (accessed on 5 January 2023).
- Seto, K.C.; Sanchez-Rodriguez, R.; Fragkias, M. The New Geography of Contemporary Urbanization and the Environment. Annu. Rev. Envron. Resour. 2010, 35, 167–194. [Google Scholar] [CrossRef]
- Piotrowska, N.; Pazdur, A.; Pawełczyk, S.; Rakowski, A.Z.; Sensuła, B.; Tudyka, K. Human Activity recorded in carbon isotopic composition of atmospheric CO2 in Gliwice urban area and surroundings (southern Poland) in the years 2011–2013. Radiocarbon 2020, 62, 141–156. [Google Scholar] [CrossRef]
- Chaparro, L.; Terradas, J. Ecological Services of Urban Forest in Barcelona; Institut Municipal de Parcs i Jardins Ajuntament de Barcelona, Àrea de Medi Ambient: Barcelona, Spain, 2009. [Google Scholar]
- Sensuła, B.; Wilczyński, S.; Piotrowska, N. Bio-monitoring of the most industrialized area in Poland: Trees’ response to climate and anthropogenic environmental changes. In Proceedings of the 19th EGU General Assembly, Vienna, Austria, 23–28 April 2017; p. 2966. [Google Scholar]
- Nowak, D.J.; Greenfield, E.J.; Hoehn, R.E.; Lapoint, E. Carbon storage and sequestration by trees in urban and community areas of the United States. Environ. Pollut. 2013, 178, 229–236. [Google Scholar] [CrossRef]
- Moss, J.L.; Doick, K.J.; Smith, S.; Shahrestani, M. Influence of evaporative cooling by urban forests on cooling demand in cities. Urban For. Urban Green. 2019, 37, 65–73. [Google Scholar] [CrossRef]
- Baró, F.; Chaparro, L.; Gómez-Baggethun, E.; Langemeyer, J.; Nowak, D.J.; Terradas, J. Contribution of Ecosystem Services to Air Quality and Climate Change Mitigation Policies: The Case of Urban Forests in Barcelona, Spain. AMBIO 2014, 43, 466–479. [Google Scholar] [CrossRef]
- Tyrväinen, L.; Pauleit, S.; Seeland, K.; Vries, S.D. Benefits and Uses of Urban Forests and Trees; Springer: Berlin/Heidelberg, Germany, 2005; pp. 81–114. [Google Scholar]
- Groenewegen, P.P.; Van den Berg, A.E.; De Vries, S.; Verheij, R.A. Vitamin G: Effects of green space on health, well-being, and social safety. BMC Public Health 2006, 6, 1–9. [Google Scholar] [CrossRef]
- Hurley, P.T.; Emery, M.R. Locating provisioning ecosystem services in urban forests: Forageable woody species in New York City, USA. Landsc. Urban Plan 2018, 170, 266–275. [Google Scholar] [CrossRef]
- Roeland, S.; Moretti, M.; Amorim, J.H.; Branquinho, C.; Fares, S.; Morelli, F.; Niinemets, Ü.; Paoletti, E.; Pinho, P.; Sgrigna, G. Towards an integrative approach to evaluate the environmental ecosystem services provided by urban forest. J. For. Res. 2019, 30, 1981–1996. [Google Scholar] [CrossRef]
- Li, X.; Chen, W.Y.; Sanesi, G.; Lafortezza, R. Remote Sensing in Urban Forestry: Recent Applications and Future Directions. Remote Sens. 2019, 11, 1144. [Google Scholar] [CrossRef]
- Grove, J.M.; Neil-Dunne, J.O.; Pelletier, K.; Nowak, D.; Walton, J. A Report on New York City’s Present and Possible Urban Tree Canopy; United States Department of Agriculture, Forest Service: South Burlington, VT, USA, 2006. [Google Scholar]
- Myeong, S.; Nowak, D.J.; Duggin, M.J. A temporal analysis of urban forest carbon storage using remote sensing. Remote Sens. Environ. 2006, 101, 277–282. [Google Scholar] [CrossRef]
- Alonzo, M.; McFadden, J.P.; Nowak, D.J.; Roberts, D.A. Mapping urban forest structure and function using hyperspectral imagery and lidar data. Urban For. Urban Green. 2016, 17, 135–147. [Google Scholar] [CrossRef]
- Lafortezza, R.; Giannico, V. Combining high-resolution images and LiDAR data to model ecosystem services perception in compact urban systems. Ecol. Indic. 2019, 96, 87–98. [Google Scholar] [CrossRef]
- Shojanoori, R.; Shafri, H. Review on the Use of Remote Sensing for Urban Forest Monitoring. Arboric. Urban For. 2016, 42, 400–417. [Google Scholar] [CrossRef]
- Jensen, R.R.; Hardin, P.J.; Bekker, M.; Farnes, D.S.; Lulla, V.; Hardin, A. Modeling urban leaf area index with AISA+ hyperspectral data. Appl. Geogr. 2009, 29, 320–332. [Google Scholar] [CrossRef]
- Pickett, S.T.A.; Cadenasso, M.L.; Rosi-Marshall, E.J.; Belt, K.T.; Groffman, P.M.; Grove, J.M.; Irwin, E.G.; Kaushal, S.S.; LaDeau, S.L.; Nilon, C.H.; et al. Dynamic heterogeneity: A framework to promote ecological integration and hypothesis generation in urban systems. Urban Ecosyst. 2017, 20, 1–14. [Google Scholar] [CrossRef]
- Cadenasso, M.L.; Pickett, S.T.; Schwarz, K. Spatial heterogeneity in urban ecosystems: Reconceptualizing land cover and a framework for classification. Front. Ecol. Environ. 2007, 5, 80–88. [Google Scholar] [CrossRef]
- Martins, J.A.C.; Nogueira, K.; Osco, L.P.; Gomes, F.D.G.; Furuya, D.E.G.; Gonçalves, W.N.; Sant Ana, D.A.; Ramos, A.P.M.; Liesenberg, V.; Dos Santos, J.A.; et al. Semantic Segmentation of Tree-Canopy in Urban Environment with Pixel-Wise Deep Learning. Remote Sens. 2021, 13, 3054. [Google Scholar]
- Pu, R.L.; Landry, S. A comparative analysis of high spatial resolution IKONOS and WorldView-2 imagery for mapping urban tree species. Remote Sens. Environ. 2012, 124, 516–533. [Google Scholar] [CrossRef]
- Hamerly, G.; Elkan, C. Learning the k in k-means. In Advances in Neural Information Processing Systems; MIT Press: Cambridge, MA, USA, 2003; p. 16. [Google Scholar]
- Memarsadeghi, N.; Mount, D.M.; Netanyahu, N.S.; Le Moigne, J. A fast implementation of the ISODATA clustering algorithm. Int. J. Comput. Geom. Appl. 2007, 17, 71–103. [Google Scholar]
- Maurya, K.; Mahajan, S.; Chaube, N. Remote sensing techniques: Mapping and monitoring of mangrove ecosystem—A review. Complex Intell. Syst. 2021, 7, 2797–2818. [Google Scholar] [CrossRef]
- Xu, Z.; Zhou, Y.; Wang, S.; Wang, L.; Li, F.; Wang, S.; Wang, Z. A Novel Intelligent Classification Method for Urban Green Space Based on High-Resolution Remote Sensing Images. Remote Sens. 2020, 12, 3845. [Google Scholar]
- Myles, A.J.; Feudale, R.N.; Liu, Y.; Woody, N.A.; Brown, S.D. An introduction to decision tree modeling. J. Chemom. 2004, 18, 275–285. [Google Scholar]
- Biau, G.; Scornet, E. A random forest guided tour. Test 2016, 25, 197–227. [Google Scholar] [CrossRef]
- Noble, W.S. What is a support vector machine? Nat. Biotechnol. 2006, 24, 1565–1567. [Google Scholar] [CrossRef]
- Bruzzone, L.; Prieto, D.F. Unsupervised retraining of a maximum likelihood classifier for the analysis of multitemporal remote sensing images. IEEE Trans. Geosci. Remote 2001, 39, 456–460. [Google Scholar] [CrossRef]
- Kattenborn, T.; Leitloff, J.; Schiefer, F.; Hinz, S. Review on Convolutional Neural Networks (CNN) in vegetation remote sensing. ISPRS J. Photogramm. 2021, 173, 24–49. [Google Scholar] [CrossRef]
- LeCun, Y.; Bengio, Y.; Hinton, G. Deep learning. Nature 2015, 521, 436–444. [Google Scholar] [CrossRef] [PubMed]
- Janiesch, C.; Zschech, P.; Heinrich, K. Machine learning and deep learning. Electron. Mark. 2021, 31, 685–695. [Google Scholar] [CrossRef]
- Shinde, P.P.; Shah, S. A Review of Machine Learning and Deep Learning Applications; IEEE: Washington, DC, USA, 2018; pp. 1–6. [Google Scholar]
- Hinton, G.E.; Salakhutdinov, R.R. Reducing the dimensionality of data with neural networks. Science 2006, 313, 504–507. [Google Scholar] [CrossRef]
- Kamilaris, A.; Prenafeta-Boldú, F.X. Deep learning in agriculture: A survey. Comput. Electron. Agric. 2018, 147, 70–90. [Google Scholar] [CrossRef]
- Li, Y.; Zhang, H.; Xue, X.; Jiang, Y.; Shen, Q. Deep learning for remote sensing image classification: A survey. Wiley Interdiscip. Rev. Data Min. Knowl. Discov. 2018, 8, e1264. [Google Scholar] [CrossRef]
- Zhang, X.; Han, L.; Han, L.; Zhu, L. How Well Do Deep Learning-Based Methods for Land Cover Classification and Object Detection Perform on High Resolution Remote Sensing Imagery? Remote Sens. 2020, 12, 417. [Google Scholar] [CrossRef]
- Pluto-Kossakowska, J. Review on Multitemporal Classification Methods of Satellite Images for Crop and Arable Land Recognition. Agriculture 2021, 11, 999. [Google Scholar] [CrossRef]
- Wang, Z.; Zhou, Y.; Wang, F.; Wang, S.; Xu, Z. SDGH-Net: Ship Detection in Optical Remote Sensing Images Based on Gaussian Heatmap Regression. Remote Sens. 2021, 13, 499. [Google Scholar] [CrossRef]
- O’Shea, K.; Nash, R. An introduction to convolutional neural networks. arXiv 2015, arXiv:1511.08458. [Google Scholar]
- Gu, J.; Wang, Z.; Kuen, J.; Ma, L.; Shahroudy, A.; Shuai, B.; Liu, T.; Wang, X.; Wang, G.; Cai, J. Recent advances in convolutional neural networks. Pattern Recogn. 2018, 77, 354–377. [Google Scholar] [CrossRef]
- Li, Z.; Liu, F.; Yang, W.; Peng, S.; Zhou, J. A survey of convolutional neural networks: Analysis, applications, and prospects. IEEE Trans. Neural Networks Learn. 2021, 33, 6999–7019. [Google Scholar] [CrossRef] [PubMed]
- Krizhevsky, A.; Sutskever, I.; Hinton, G.E. Imagenet classification with deep convolutional neural networks. Adv. Neural Inf. Process. Syst. 2012, 60, 84–90. [Google Scholar] [CrossRef]
- Bragagnolo, L.; Da Silva, R.V.; Grzybowski, J.M.V. Amazon forest cover change mapping based on semantic segmentation by U-Nets. Ecol. Inform. 2021, 62, 101279. [Google Scholar] [CrossRef]
- Long, J.; Shelhamer, E.; Darrell, T. Fully convolutional networks for semantic segmentation. In Proceedings of the IEEE Conference on Computer Vision and Pattern Recognition (CVPR), Boston, MA, USA, 7–12 June 2015; pp. 3431–3440. [Google Scholar]
- Ronneberger, O.; Fischer, P.; Brox, T. U-Net: Convolutional Networks for Biomedical Image Segmentation. In Proceedings of the 18th International Conference on Medical Image Computing and Computer-Assisted Intervention (MICCAI), Munich, Germany, 5–9 October 2015; Volume 9351, pp. 234–241. [Google Scholar]
- Chen, L.; Papandreou, G.; Kokkinos, I.; Murphy, K.; Yuille, A.L. Deeplab: Semantic image segmentation with deep convolutional nets, atrous convolution, and fully connected crfs. IEEE Trans. Pattern Anal. 2017, 40, 834–848. [Google Scholar] [CrossRef] [PubMed]
- Chen, L.; Papandreou, G.; Schroff, F.; Adam, H. Rethinking atrous convolution for semantic image segmentation. arXiv 2017, arXiv:1706.05587. [Google Scholar]
- Chen, L.; Zhu, Y.; Papandreou, G.; Schroff, F.; Adam, H. Encoder-decoder with atrous separable convolution for semantic image segmentation. In Proceedings of the 15th European Conference on Computer Vision, Munich, Germany, 8–14 September 2018; pp. 801–818. [Google Scholar]
- Wagner, F.H.; Hirye, M.C.M. Tree Cover for the Year 2010 of the Metropolitan Region of São Paulo, Brazil. Data 2019, 4, 145. [Google Scholar] [CrossRef]
- Wang, Z.; Fan, C.; Xian, M. Application and Evaluation of a Deep Learning Architecture to Urban Tree Canopy Mapping. Remote Sens. 2021, 13, 1749. [Google Scholar] [CrossRef]
- Piao, S.; Liu, Q.; Chen, A.; Janssens, I.A.; Fu, Y.; Dai, J.; Liu, L.; Lian, X.U.; Shen, M.; Zhu, X. Plant phenology and global climate change: Current progresses and challenges. Glob. Chang. Biol. 2019, 25, 1922–1940. [Google Scholar] [CrossRef] [PubMed]
- Zhang, X.; Friedl, M.A.; Schaaf, C.B.; Strahler, A.H.; Hodges, J.C.; Gao, F.; Reed, B.C.; Huete, A. Monitoring vegetation phenology using MODIS. Remote Sens. Environ. 2003, 84, 471–475. [Google Scholar] [CrossRef]
- Senf, C.; Leitão, P.J.; Pflugmacher, D.; van der Linden, S.; Hostert, P. Mapping land cover in complex Mediterranean landscapes using Landsat: Improved classification accuracies from integrating multi-seasonal and synthetic imagery. Remote Sens. Environ. 2015, 156, 527–536. [Google Scholar] [CrossRef]
- Yan, J.; Zhou, W.; Han, L.; Qian, Y. Mapping vegetation functional types in urban areas with WorldView-2 imagery: Integrating object-based classification with phenology. Urban For. Urban Green. 2018, 31, 230–240. [Google Scholar] [CrossRef]
- Ulsig, L.; Nichol, C.J.; Huemmrich, K.F.; Landis, D.R.; Middleton, E.M.; Lyapustin, A.I.; Mammarella, I.; Levula, J.; Porcar-Castell, A. Detecting inter-annual variations in the phenology of evergreen conifers using long-term MODIS vegetation index time series. Remote Sens. 2017, 9, 49. [Google Scholar] [CrossRef]
- Pu, R. Mapping urban forest tree species using IKONOS imagery: Preliminary results. Environ. Monit. Assess 2011, 172, 199–214. [Google Scholar] [CrossRef]
- Pu, R.; Landry, S.; Yu, Q. Assessing the potential of multi-seasonal high resolution Pléiades satellite imagery for mapping urban tree species. Int. J. Appl. Earth Obs. 2018, 71, 144–158. [Google Scholar]
- Xu, X.; Li, W.; Ran, Q.; Du, Q.; Gao, L.; Zhang, B. Multisource Remote Sensing Data Classification Based on Convolutional Neural Network. IEEE Trans. Geosci. Remote 2018, 56, 937–949. [Google Scholar] [CrossRef]
- Gaetano, R.; Ienco, D.; Ose, K.; Cresson, R. A Two-Branch CNN Architecture for Land Cover Classification of PAN and MS Imagery. Remote Sens. 2018, 10, 1746. [Google Scholar] [CrossRef]
- Guo, Y.; Li, Z.; Chen, E.; Zhang, X.; Zhao, L.; Xu, E.; Hou, Y.; Liu, L. A Deep Fusion uNet for Mapping Forests at Tree Species Levels with Multi-Temporal High Spatial Resolution Satellite Imagery. Remote Sens. 2021, 13, 3613. [Google Scholar] [CrossRef]
- Li, C.; Hang, R.; Rasti, B. EMFNet: Enhanced Multisource Fusion Network for Land Cover Classification. IEEE J. Stars 2021, 14, 4381–4389. [Google Scholar] [CrossRef]
- Zhu, X.X.; Qiu, C.; Hu, J.; Shi, Y.; Wang, Y.; Schmitt, M.; Taubenböck, H. The urban morphology on our planet—Global perspectives from space. Remote Sens. Environ. 2022, 269, 112794. [Google Scholar] [CrossRef]
- Wang, X.; Huang, J.; Feng, Q.; Yin, D. Winter Wheat Yield Prediction at County Level and Uncertainty Analysis in Main Wheat-Producing Regions of China with Deep Learning Approaches. Remote Sens. 2020, 12, 1744. [Google Scholar] [CrossRef]
- Guo, Y.; Li, Z.; Chen, E.; Zhang, X.; Zhao, L.; Xu, E.; Hou, Y.; Sun, R. An End-to-End Deep Fusion Model for Mapping Forests at Tree Species Levels with High Spatial Resolution Satellite Imagery. Remote Sens. 2020, 12, 3324. [Google Scholar] [CrossRef]
- Tan, Y.; Xiong, S.; Li, Y. Automatic Extraction of Built-Up Areas From Panchromatic and Multispectral Remote Sensing Images Using Double-Stream Deep Convolutional Neural Networks. IEEE J. Stars 2018, 11, 3988–4004. [Google Scholar] [CrossRef]
- Ali, A.V.; Comai, S.; Matteucci, M. Deep Learning for Land Use and Land Cover Classification Based on Hyperspectral and Multispectral Earth Observation Data: A Review. Remote Sens. 2020, 12, 2495. [Google Scholar] [CrossRef]
- Yang, Q.; Shi, L.; Han, J.; Zha, Y.; Zhu, P. Deep convolutional neural networks for rice grain yield estimation at the ripening stage using UAV-based remotely sensed images. Field Crop. Res. 2019, 235, 142–153. [Google Scholar] [CrossRef]
- Beijing Municipal Forestry and Parks Bureau. The Report on Work Completion in 2021 of Beijing Municipal Forestry and Parks Bureau. Available online: http://yllhj.beijing.gov.cn/zwgk/sx/202201/t20220106_2584218.shtml (accessed on 13 August 2022).
- Bernstein, L.S.; Jin, X.; Gregor, B.; Adler-Golden, S.M. Quick atmospheric correction code: Algorithm description and recent upgrades. Opt. Eng. 2012, 51, 111719. [Google Scholar] [CrossRef]
- Kingma, D.P.; Ba, J. Adam: A method for stochastic optimization. arXiv 2014, arXiv:1412.6980. [Google Scholar]
- De Boer, P.; Kroese, D.P.; Mannor, S.; Rubinstein, R.Y. A tutorial on the cross-entropy method. Ann. Oper. Res. 2005, 134, 19–67. [Google Scholar] [CrossRef]
- Lin, T.; Goyal, P.; Girshick, R.; He, K.; Dollár, P. Focal loss for dense object detection. In Proceedings of the IEEE International Conference on Computer Vision, Venice, Italy, 22–29 October 2017; pp. 2980–2998. [Google Scholar]
- Milletari, F.; Navab, N.; Ahmadi, S. V-net: Fully Convolutional Neural Networks for Volumetric Medical Image Segmentation; IEEE: Washington, DC, USA, 2016; pp. 565–571. [Google Scholar]
- Sudre, C.H.; Li, W.; Vercauteren, T.; Ourselin, S.; Jorge Cardoso, M. Generalised Dice Overlap as a Deep Learning Loss Function for Highly Unbalanced Segmentations; Springer: Berlin/Heidelberg, Germany, 2017; pp. 240–248. [Google Scholar]
- Drozdzal, M.; Vorontsov, E.; Chartrand, G.; Kadoury, S.; Pal, C. The Importance of Skip Connections in Biomedical Image Segmentation; Springer: Berlin/Heidelberg, Germany, 2016; pp. 179–187. [Google Scholar]
- Chen, M.; Wu, J.; Liu, L.; Zhao, W.; Tian, F.; Shen, Q.; Zhao, B.; Du, R. DR-Net: An Improved Network for Building Extraction from High Resolution Remote Sensing Image. Remote Sens. 2021, 13, 294. [Google Scholar] [CrossRef]
Disclaimer/Publisher’s Note: The statements, opinions and data contained in all publications are solely those of the individual author(s) and contributor(s) and not of MDPI and/or the editor(s). MDPI and/or the editor(s) disclaim responsibility for any injury to people or property resulting from any ideas, methods, instructions or products referred to in the content. |
© 2023 by the authors. Licensee MDPI, Basel, Switzerland. This article is an open access article distributed under the terms and conditions of the Creative Commons Attribution (CC BY) license (https://creativecommons.org/licenses/by/4.0/).