Abstract
The spatial and temporal distributions of dust aerosol and its radiative heating effect over Taklimakan Desert (TD) and Tibetan Plateau (TP) were analyzed using the CALIPSO aerosol products and the SBDART model during 2007–2020. The annual dust aerosol optical depths (DAOD at 532 nm) ranged from 0.266 to 0.318 over TD and 0.086 to 0.108 over TP, with means of 0.286 ± 0.015 and 0.097 ± 0.006, respectively. The regional mean DAODs of TD (TP) from spring to winter were 0.375 ± 0.020 (0.107 ± 0.010), 0.334 ± 0.028 (0.110 ± 0.010), 0.235 ± 0.026 (0.071 ± 0.008), and 0.212 ± 0.045 (0.083 ± 0.011), respectively. The maximal (minimal) seasonal DAOD of TD appeared in spring (winter), while that of TP appeared in summer (autumn). Although neither the annual nor the seasonal DAODs showed a statistically significant trend over both TD and TP, their yearly fluctuations were apparent, showing coefficients of variation of 0.053 and 0.065 over TD and TP, respectively. The profile of dust extinction coefficient (σD) showed the maximum in spring and summer over TD and TP, respectively. It showed a weak increasing trend of σD over both TD and TP in spring, but a decreasing trend in autumn. The dust of TD is concentrated within 1–4 km, where the annual averaged shortwave (SW) dust heating rates (DHRs) were larger than 2 K·day−1 from March to September. Over TP, the dust heating layer with SW DHR > 2 K·day−1 ranged from 3 to 4 km during March to June. The SW DHR was much larger in spring and summer than in the other two seasons over both regions, with the maximum in spring. A relatively strong dust heating layer with top >5 km appeared along the north slope of the TP, indicating an important energy transport channel from TD to TP, especially in spring and summer. It showed an increasing trend of the SW DHR over both TD and TP in spring and winter, but a decreasing trend in summer and autumn. Over TD, the most powerful heating appeared within 2–4 km, but the strength and the area of high-value DHR reduced from spring to winter. The highest SW DHR of TP appeared over the Qaidam Basin, acting as an important transmission channel of dust and its heating. For the columnar mean of lower than 10 km, the annual mean DHRs of TD and TP were 0.93 and 0.48 K⋅day−1, respectively. Although the DAOD and DHR of TP were both lower, its shortwave dust heating efficiency (DHE) was 1.7 times that of TD, which suggested that the same amount of dust imported to TP could generate a stronger heating effect than it did at the source.
1. Introduction
The Tibetan Plateau (TP) has always been known as the “Third Pole” globally. With its unique geographical conditions, TP affects the weather and climate through thermal and dynamic forcing. The TP, also known as the “water tower”, plays an essential role in the water cycle for the Yangtze River, the Yellow River, and the Lantsang River [1,2,3]. The Taklimakan Desert (TD) is the largest desert in China and the most crucial dust area in East Asia. It covers 337,000 km2 and is bounded by the Kunlun Mountains in the south, the Pamir Mountains in the west, and the Tian Mountains in the north [4,5]. Dust from TD affects the weather and climate in TP and the surrounding areas [6,7,8].
The TP is a relatively pristine area except for the north and south poles because of its small population and lack of overexploitation. However, studies have shown that many pollution air masses are distributed over the TP [9,10,11]. These pollution air masses are mainly from the TD and its surrounding areas [12,13]. Dust aerosol is the primary aerosol [9,10]. It has been pointed out that the heating of the atmosphere by dust aerosol and other absorptive particles will lead to the warming of the TP and accelerate the melting of snow in the western TP and the Himalayas, even enhancing the monsoon [14,15,16].
Dust aerosol is a vital aerosol, which plays an important role in radiation balance and climate change due to the direct and indirect effects [4,17,18,19]. The absorption characteristics and vertical distribution of dust aerosols are the most considerable uncertainties defining the radiation effect of dust in the solar spectrum [20,21,22,23].
The vertical distribution of dust aerosol is essential to evaluate the radiative heating rate of dust [24,25]. However, in northwest China, the sparse ground observations make it difficult to obtain the accurate and complete vertical distribution information of dust aerosol aloft, which hinders to some extent the further study in the radiation effect of dust aerosol. CALIPSO combines active lidar instruments with passive infrared and visible-light imagers to detect the vertical structure and properties of thin clouds and aerosols around the globe [26,27]. Combining CALIPSO data and model simulations, the climatic effect of dust aerosol can be discussed more scientifically [28]. Some scholars used the WRF-Chem model to simulate the radiation effect of dust aerosols and found that dust aerosols in the dust source region cooled the surface atmosphere and heated the upper atmosphere in the shortwave (SW) band [29]. The climatic effect of dust aerosol can be understood more clearly under the synergy of in situ observation and modeling [28]. Numerical modeling found that dust aerosol cooled the surface and heated the upper air in the shortwave (SW) band [29]. Huang et al. (2009) estimated the radiative forcing and heating rate of dust aerosol in the TD in northwest China using the Fu-Liou radiation model and satellite observation data [6]. The maximum daily average net heating rate was up to 5.5 K⋅day−1. Liu et al. (2016) used the WRF-Chem model to find that surface cooling and atmospheric heating caused by dust during the day increased the stability of the boundary layer, indicating a very significant effect of dust in the boundary layer meteorology [30].
The vertical distribution of dust affects the vertical variation of heating rate, resulting in changes in the regional water cycle and radiation balance [31]. Mishra et al. (2015) found that the aerosol radiation effect and aerosol layer height were significantly sensitive, especially dust was most sensitive to altitude [32]. Some scholars have found that, when using the measured vertical profile instead of the standard profile, the simulated daily radiative forcing changes up to 100% [33], which in turn changes the upward and downward radiative flux and heating rate profiles [34]. Perrone et al. (2012) reported that the uncertainty could increase up to 35% in radiative forcing calculation due to the lack of accurate aerosol vertical profiles [35]. This uncertainty would be reduced substantially using ground-based or airborne observed aerosol profiles [34,36,37].
In this work, the temporal and spatial distribution of dust and its radiative heating effect over TD and TP from 2007 to 2020 are presented using CALIOP/CALIPSO aerosol products and the SBDART (Santa Barbara DISORT Atmospheric Radiative Transfer) model [38]. The data and methods are presented in Section 2. The variation of dust optical depth and extinction profile are shown in Section 3.1 and Section 3.2. In Section 3.3 and Section 3.4, the heating effect of dust is discussed in detail.
2. Data and Methods
2.1. CALIPSO
CALIPSO combines active lidar instruments with passive infrared and visible-light imagers to detect the vertical structure and properties of thin clouds and aerosols around the globe [39,40]. It provides aerosol type information, which is helpful to distinguish different types of aerosols and corresponding absorption characteristics. CALIPSO detects aerosols into seven types, namely, clean marine, dust, polluted continental/smoke, clean continental, polluted dust, elevated smoke, and dusty marine. CALIPSO level 2 products repeat 16 days as a cycle and have a horizontal resolution of 5 km, and a vertical resolution of 60 m and 120 m in altitude ranges of −0.5–20.2 km and 20.2–30.1 km, respectively. As a satellite remote sensing product, CALIPSO also has data errors, which sources include data calibration, feature detection, cloud and aerosol discrimination (CAD), aerosol subtype and lidar ratio selection, and measurement noise [41]. In this study, the vertical distributions of dust over Taklimakan Desert (TD) and Tibetan Plateau (TP) were analyzed on the basis of the monthly averages which were calculated from CALIOP Level 2 version 4 products of aerosol profiles at 532 nm from 2007 to 2020. The extinction coefficient and optical thickness were obtained using the following processing method:
—Dust extinction coefficient was defined as the ratio of total dust aerosol extinction coefficient (σ) to the number of dust aerosol profiles in a certain altitude layer. The dust aerosol was picked out with a negative CAD score within a reasonable range of |CAD| ≥ 20 [42].
—Dust aerosol optical depth (DAOD) is the integral of the dust extinction coefficient at 532 nm in the vertical direction, given by the following equation: .
2.2. SBDART
The SBDART model calculates plane-parallel radiative transport in the Earth’s atmosphere and at the surface under clear skies and cloudy conditions. The model considers all the important processes affecting the ultraviolet, visible, and infrared radiation fields and is suitable for various atmospheric radiation energy balances. In this work, the SBDART model was used to calculate the heating rate of dust in both shortwave (SW: 0.25–4 μm) and longwave (LW: 4–80 μm) bands. The main parameters imported to SBDART included the monthly mean surface albedos from MODIS, the monthly meteorological profiles of temperature, mixing ratio and ozone from ERA5, and monthly profiles of dust aerosol from CALIOP, which were interpolated into a horizontal resolution of 1° × 1°. Optical Properties of Aerosol and Cloud (OPAC) classifies dust into four types, each with different optical properties [43]. Wang et al. (2020) found the transported mode of dust showing the best fitness over TD [44], which is also the main source of dust over TP [9]. Therefore, the single scattering albedo (SSA = 0.890) and asymmetry factor (g = 0.746) of the transported mode were selected in the modeling.
Although the horizontal resolution of CALIPSO level 2 aerosol profile dataset is 5 km, its sparse revisit period (16 days) and narrow field of view limit the number of valid samples. Therefore, we enlarged the grid horizontal resolution to 1° × 1° to ensure we were getting enough dust profiles in monthly calculation. Monthly mean meteorological fields of ERA5 during 2007–2020 were used in the modeling. The original spatial resolution of 0.25° × 0.25° was interpolated into a 1° × 1° grid as meteorological inputs for the SBDART model. Surface albedo was collected from MERRA-2 monthly reanalysis products. Additionally, the acronyms of MAM, JJA, SON, and DJF represent spring, summer, autumn, and winter, respectively.
2.3. Dust Heating Rate and Efficiency
The atmospheric heating rate (HR) is defined as follows (Liou, 2002):
where T, t, F, g, and cp are the temperature (K), time (s), net radiation flux (W·m−2), gravitational acceleration (m·s−2), and specific heat (J·kg−1·K−1) at constant pressure, respectively. Hence, the dust heating rate (DHR) is defined as the difference in the heating rates with and without dust, i.e.,
where i denotes the band of SW or LW. The dust heating efficiency (DHE) is defined as the ratio between the column-averaged DHR and DAOD, which is given by the following equation:
Although errors are reduced through CALIPSO measured data, data quality control, and setting of optical properties of dust, there are still inevitable errors in the accuracy of data and model simulation. The error sources of simulation are mainly SSA, surface albedo, and AOD. In this study, DAOD was calculated from the CALIPSO lidar ratio. Li et al. (2010) pointed out that the uncertainty of SSA (±0.03) causes an error of 8.79 ± 2.98 W⋅m−2 in the radiant flux simulation [45]. The uncertainty of AOD (2–6%) causes an error of 2.24 ± 0.91 W⋅m−2 in the surface flux simulation, and the surface albedo (±0.01) causes an average error of 3.43 ± 1.93 W⋅m−2 in calculating the radiant flux.
3. Results and Analysis
In this section, the distributions and variations of dust aerosol optical properties and its heating effect over TD and TP are analyzed on the basis of seasonal and annual averages during 2007–2020.
3.1. Dust AOD
Figure 1 shows the geographical characteristics and the multiyear average DAOD at 532 nm over the study domain during 2007–2020. Overall, the DAOD was higher than 0.3 over most of TD, while it was lower than 0.1 over most of TP. The highest DAOD of 0.3–0.4 over TP appeared in the Qaidam Basin.
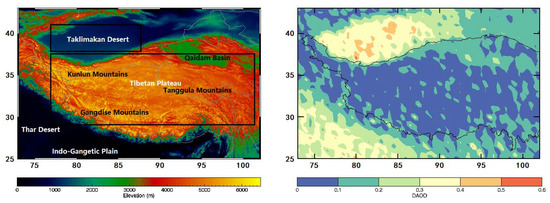
Figure 1.
Topography of the study domain (73–102°E, 25–43°N, from SRTM30) and mean DAOD (532 nm, calculated from CALIOP/CALIPSO level 2 aerosol dataset) during 2007–2020. The two boxes define the TD (Taklimakan Desert) and TP (Tibetan Plateau) regions.
Figure 2 shows the seasonal mean distributions of DAOD over TD and TP from 2007 to 2020. The regional means of seasonal DAOD over TD ranged from 0.110 to 0.578, showing a decreasing trend from spring to winter. The regional mean DAODs of TD from spring to winter were 0.375 ± 0.020, 0.334 ± 0.028, 0.235 ± 0.026, and 0.212 ± 0.045, respectively. The overall annual average of regional DAOD in TD was 0.286 ± 0.015, showing the relatively higher DAOD in the southern part. The DAOD was higher than 0.4 over most of TD in spring, but below 0.3 in winter. From spring to summer, along with the southward moving of the high-value center, the heavy dust loading area over TD was about one-third smaller. The loading of dust in autumn and winter was significantly lower and more evenly distributed, which is consistent with the results of Wang et al. (2020) for the period of 2007–2016 [11]. Over TP, the grid DAODs ranged from 0.01 to 0.36, with the high center in the Qaidam Basin. Unlike TD, the DAOD of TP was the highest in summer and the lowest in autumn. The regional mean DAODs of TP from spring to winter were 0.107 ± 0.010, 0.110 ± 0.010, 0.071 ± 0.008, and 0.083 ± 0.011, respectively. The stronger local convection and larger inflows of dust from the IGP (Indo-Gangetic Plain) in summer, combined with more frequent lifting of local dust in the eastern TP in winter [46,47], may have resulted in the increase in DAOD in these two seasons. Additionally, the enhancive transport of dust from the Thar Desert to the TP in summer may have increased the DAOD in the southern TP, as also found by some previous studies [48,49].
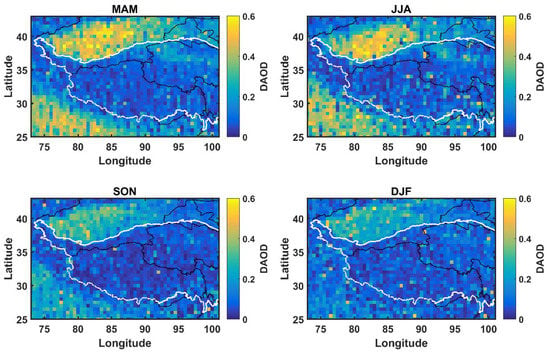
Figure 2.
Seasonal distributions of DAOD during 2007–2020.
Figure 3 shows the time series of annual and seasonal mean DAODs over TD and TP. Although neither the annual nor the seasonal DAODs showed a statistically significant trend over both TD and TP, their yearly fluctuations were apparent. The overall annual mean DAODs of TD and TP were 0.286 and 0.097, respectively. Over TD, the annual DAODs ranged from 0.266 to 0.318, showing an insignificant increasing trend. The spring DAOD of TD appeared as the maximum in almost each year, followed by the summer one, while the DAODs of autumn and winter were nearly half of the spring one. Over TP, an insignificant decreasing trend of annual DAODs was observed ranging from 0.086 to 0.108 with a very low standard deviation of 0.006. The spring DAOD appeared as the maximum of each year in half of the study period, with the summer one in the other half. The overall mean DAODs of spring and summer over TP were 0.107 and 0.110, respectively. Although the values of DAOD were lower in autumn and winter, their coefficients of variation (CV: standard deviation divided by average) were larger, indicating more fluctuant of dust loading in the two seasons. The CVs of seasonal DAODs over TD were 0.053, 0.055, 0.110, and 0.212 from spring to winter, respectively. The corresponding CVs over TP were 0.089, 0.088, 0.119, and 0.130, respectively.
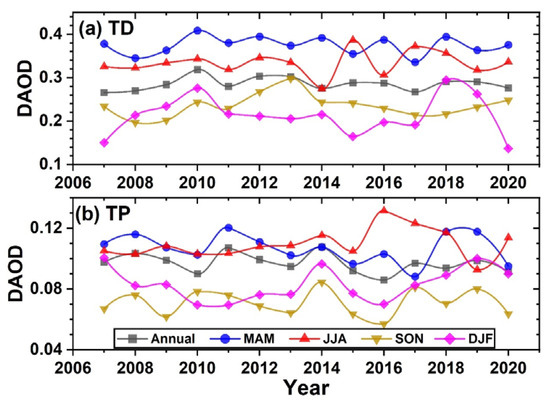
Figure 3.
Variations of annual and seasonal DAODs over (a) TD and (b)TP.
3.2. Vertical Distributions of Dust
Figure 4 shows the multiyear seasonal and annual average profiles of dust extinction coefficient (σD) at 532 nm over TD and TP. Over TD, it showed a long-standing dust layer between the heights of 1–3 km, with the maximum σD of 0.35, 0.27, 0.22, and 0.27 km−1 from spring to winter, respectively. The thickest dust layer appeared in spring, whose σD was higher than 0.2 km−1 under 4 km. Although the σD in winter was smaller than that in summer at most heights, it was larger below 1.5 km. Over TP, the σD exhibited the highest value in summer, followed by spring, with the lowest in autumn. The maximum σD was 0.13–0.21 km−1. The reducing rate of σD with height was significantly smaller over TP than over TD. It had strong vertical convections over TP, resulting in the dust mixing well vertically. The σD of TP was twice as much as that of TD above the height of 5 km, which is a synthetical effect contributed by the dust conveyed from TD to TP and lifted locally [47,50].
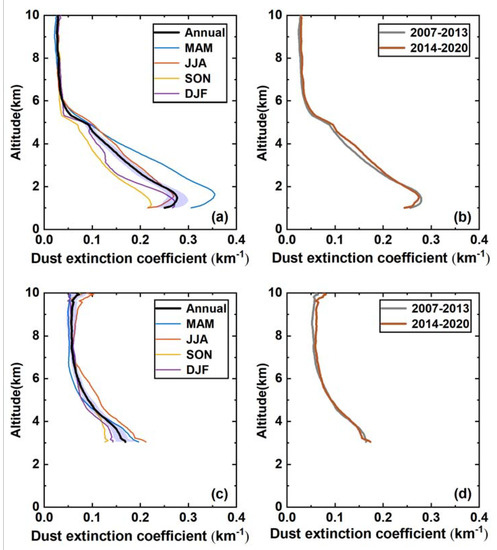
Figure 4.
Seasonal and annual average profiles of dust extinction coefficient at 532 nm during 2007–2020 and the first and second 7 year averaged annual profiles over (a,b) TD and (c,d) TP. The shaded area represents the standard deviation of annual means.
To explore the change of vertical distributions of dust over TD and TP, the multiyear mean profiles of σD were analyzed in two successive stages of 2007–2013 and 2014–2020 (Figure 4b,d). As can be seen from Figure 4b, the σD of TD was a little lower in the second stage in the layers below 2 km, but a little higher from 2 to 5 km. Similar to TD, the σD of TP decreased a bit below 3.5 km during the second stage, while it increased above 7 km, with the maximum increment of 0.02 km−1. The σD decreased in the lower layer and increased in the upper layer during 2007–2020 over both TD and TP.
To further understand the vertical distribution of dust, the seasonal average dust extinction coefficient and the average wind field from 2007 to 2020 on four longitudinal transects are shown in Figure 5. The dust could be lifted to a height greater than 5 km in spring over TD, transporting substantial dust to TP. Below 4 km, a strong dust layer appeared over most of TD, with the σD larger than 0.3 km−1. In summer, with σD lower than 0.25 km−1 over most of the area, the intensity and affected area of large σD over TD were lower than in spring. However, the intensity and top height of dust increased significantly over the south part of TP. The dust could be elevated higher than 6 km over the IGP and the Thar Desert in summer, which would have conveyed more dust to the southern TP. In autumn, due to the lowest surface wind and weaker vertical convection, the dust concentration of TD decreased to the lowest point, while that of IGP was still high. In winter, the thicker temperature inversion layer suppressed the vertical development of the dust layer over TD [47,51,52], which reduced the dust transport from TD to TP [44]. The dust concentration of IGP also decreased substantially in winter.
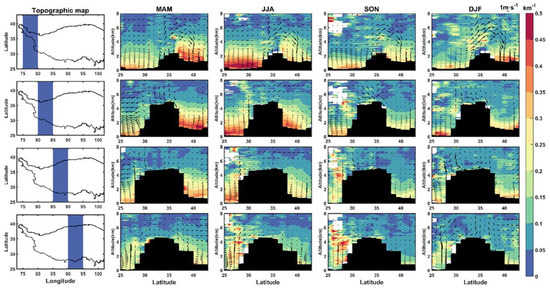
Figure 5.
Distributions of the seasonal dust extinction coefficient (σD at 532 nm and the wind field on four longitudinal transects (75–80°, 80–85°, 85–90°, and 90–95°E) during 2007–2020. The black shaded area and the white blank area indicate the elevation and the missing data, respectively; the same applies below.
The annual trends of σD during 2007–2020 are presented in Figure 6. A weak increasing trend of σD existed over both TD and TP in spring, but a decreasing trend was seen in autumn. In summer, it showed a decreasing trend at the lower layer of TD, but an increasing trend at the upper layer. In winter, the σD presented an increasing trend at the lower layer of TD. Additionally, the σD presented a significant increasing tendency along the southern slope of TP in winter, which suggests a growing influx of dust transported from IGP. For the Qaidam Basin (90–95°E, 35–40°N), the σD showed an increasing trend in both spring and summer, but presented a decline in autumn. Figure 7 and Figure 8 present the distributions of annual trends of wind speed and CAPE (convective available potential energy) from ERA5, respectively. Generally, the areas of increasing σD showed an increase in lower-level wind speed and CAPE, which were beneficial for lifting the dust aloft. For example, a significant increasing of σD existed over TD in spring in the longitudinal band of 80–85°E, where synchronous variations of lower-level wind speed and CAPE appeared.
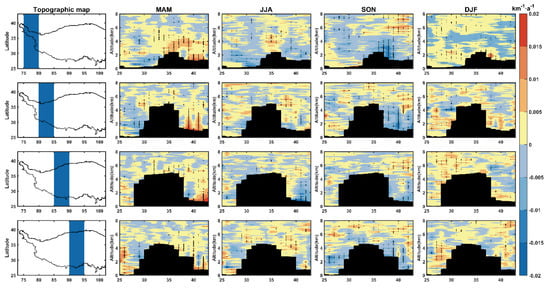
Figure 6.
Distributions of the linear annual trends of the seasonal dust extinction coefficient (σD) at 532 nm on four longitudinal transects during 2007–2020. The black point represents the linear trend passing the significance test at the level of 0.05.
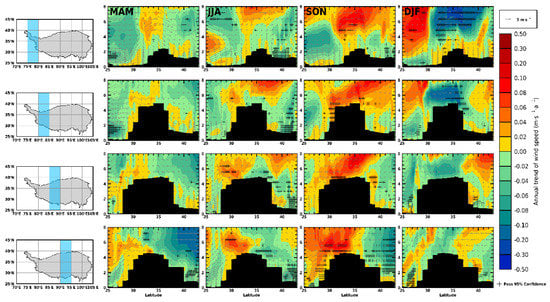
Figure 7.
Similar to Figure 6, but for the annual trend of wind speed.
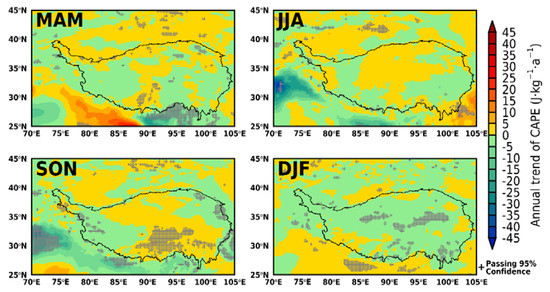
Figure 8.
Distributions of the annual trend of seasonal mean CAPE during 2007–2020.
3.3. Dust Heating Rate
Figure 9 shows the seasonal and annual average profiles of dust heating rate (DHR) in the SW band simulated by the SBDART model. The atmosphere was heated by dust in all seasons over both TD and TP, with the greatest DHR in spring. Over TD, the dust heating layer showed the thickest depth and strongest intensity in spring, with a thickness of ~4 km for DHR >2 K⋅day−1. The maximum DHR of 4.14 K⋅day−1 appeared at the height of 2–3 km. In summer, the top height of the heating layer with DHR > 2 K⋅day−1 was about 4 km, which is ~0.5 km lower than that in spring. However, it still showed an obvious heating layer from 2 to 3 km, with a DHR > 3 K⋅day−1 and an average of 3.13 K⋅day−1. A thinner and weaker heating layer with a mean DHR of 2.12 K⋅day−1 appeared from 1.5 to 3 km in autumn. Although the DHR of winter was larger than that of summer and autumn near the surface, it decreased fastest with height, showing a reduction in DHR to 2 K⋅day−1 at 2 km. The mean DHRs of TD under 5 km were 3.52, 2.50, 1.88, and 1.71 K⋅day−1 from spring to winter, respectively. Over TP, the maximal dust heating effect appeared in spring while the minimum appeared in autumn. Although the DHR of winter was much lower than that of summer below 6 km, it became the second largest between 6 and 8 km. Although the DHR of TP under 5 km was lower in most seasons, it was higher than that of TD in winter. Additionally, the lapse rate of DHR was faster over TD than that over TP. The mean DHRs of TP (TD) within 3–8 km were 1.58 (1.67), 1.31 (1.31), 0.93 (0.76), and 1.06 (0.54) K⋅day−1 from spring to winter, respectively. On average, the annual columnar mean DHRs under 8 km were 1.22 and 1.95 K⋅day−1 for TP and TD, respectively.
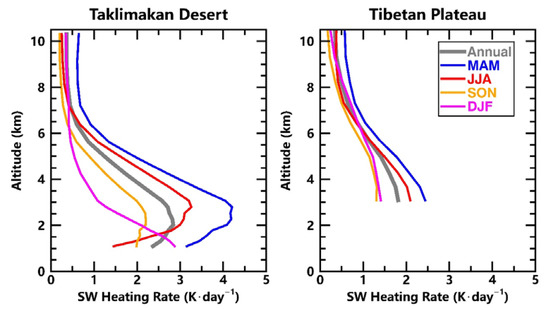
Figure 9.
Annual and seasonal profiles of dust heating rate (DHR) in shortwave (SW) band simulated by SBDART over TD and TP.
As for the monthly differences, Figure 10 shows the monthly SW DHR profiles over TD and TP during 2007–2020. From March to June, it showed the strongest dust heating effect over the study domain, with the maximum DHR approaching 5 and 3 K⋅day−1 over TD and TP, respectively. The thickness of the heating layer (HR > 2 K⋅day−1) over TD maintained a depth thicker than 3 km from March to August, reaching the maximum of ~3.5 km in March and April and shrinking to the minimum of less than 0.5 km in December. The heights of the monthly maximal DHR over TD experienced a first increasing and then decreasing trend and reached the maximum in July, which was related to the variations of the thermodynamic convection strength [53,54]. Over TP, the heating layer with DHR > 2 K⋅day−1 was held from March to June, with the thickness of ~1.3 km. Above 4 km, the DHR of TP was significantly larger than that of TD from October to next February. A similar phenomenon also occurred in spring and summer, but it showed a smaller bias and appeared at higher altitudes (above 5 km).
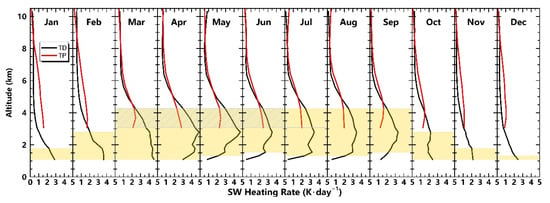
Figure 10.
Monthly SW DHR profiles over TD and TP. The shaded areas filled with the yellow color and the slanted lines are the heating layers with DHR > 2 K⋅day−1 over TD and TP, respectively.
Figure 11 shows the seasonal distributions of DHR simulated by the SBDART in the longwave (LW) band. In contrast to the SW DHR, the main radiative effect of dust in the LW band was to cool the atmosphere. The seasonal DHRs over TD presented a similar vertical variation in all seasons except winter, i.e., a trend of first decreasing to a negative maximum and then reducing to almost zero, and the maximal DHR appeared at the height of ~3 km. A positive heating effect appeared near the surface in spring and summer. The long-standing elevated thick dust layer over TD in spring and summer heated the atmosphere underneath by emitting more thermal radiation downward due to intensive absorption, with the maximum DHR of ~0.15 K⋅day−1 near the surface. In winter, the cooling rate showed a decreasing trend with altitude, with the maximum of −0.36 K⋅day−1 near the surface. Over TP, the dust showed a cooling effect at most heights in all seasons except above 8 km in summer. The cooling rate decreased with height, with the maximum of −0.17 K⋅day−1 in spring. Above 6 km, it showed the largest cooling rate in winter. Due to the much larger positive DHR in SW band, the elevated dust layer contributed a net heating effect to the atmosphere over both TD and TP. Hence, we focused on the distributions and variations of SW DHR in this work.
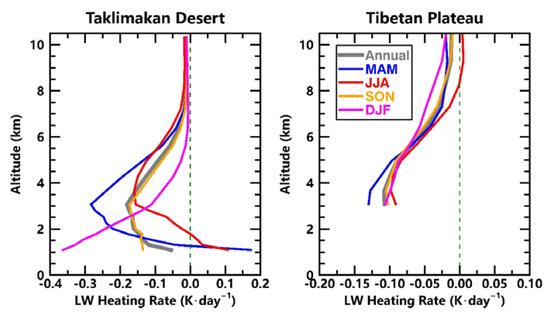
Figure 11.
Seasonal and annual profiles of DHR in LW band over TD and TP.
Figure 12 shows the vertical distribution of SW DHR on four longitudinal transections during 2007–2020. There was a significant dust heating layer over TD, especially in spring and summer. The most intense heating effect appeared in spring, with the maximal DHR approaching 8 K⋅day−1. Under 5 km, a very thick dust layer with DHR > 2 K⋅day−1 existed throughout the whole spring over TD. The strongest heating layer appeared at about 3 km, with the maximal DHR exceeding 6 K⋅day−1. In summer, although the dust heating intensity was lower than that in spring, the top of the heating layer could be lifted higher. For example, the top of the heating layer (>2 K⋅day−1) over central TD (80–85°N) could reach up to 5 km, which is about 500 m higher than that in spring. This was conducive to the trans-region expansion of the dust heating layer from TD to TP. Although the dust heating effect in autumn and winter was lower than that in spring and summer, the dust heating effect over TD was still strong in the region of 75–80°N. Over TP, it also presented a strong dust heating in spring and summer, with the top of the heating layer (>1 K⋅day−1) exceeding 7 km. The dust heating effect was very strong along the northern slope of the TP, especially in spring and summer. The Qaidam Basin (90–95°N) is an important dust source on the TP. In spring, the heating layer (>2 K⋅day−1) over the Qaidam Basin could be raised up to more than 5 km and merged with the heating layer of TD. Additionally, the dust from the Thar Desert (75–85°N) also contributed to some extent to the dust heating over TP in spring and summer. Over the southern slope of the TP (90–95°N), the dust from the IGP (Indo-Gangetic Plain) heated the air within 4–5 km significantly in autumn.
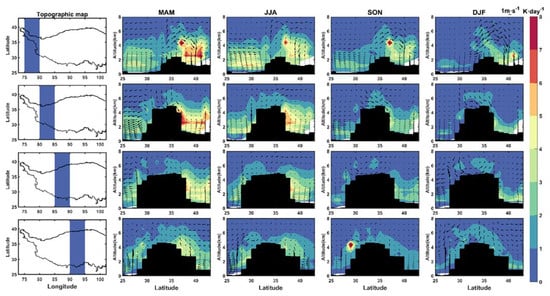
Figure 12.
The seasonal distributions of SW DHR and wind field on four longitudinal transects during 2007–2020.
To further understand the temporal variations of DHRs, Figure 13 shows the seasonal distributions of the linear annual trend of the seasonal SW DHRs during 2007–2020. On the whole, an increasing trend of dust heating effect was shown over both TD and TP in spring and winter, but a decreasing trend was seen in summer and autumn. In spring, the DHR showed a stronger increasing trend, with a maximum of ~0.3 K·day−1·a−1 within 2–3 km over TD. The increasing strength of DHR was a little lower in winter, with a mean value of ~0.1 K·day−1·a−1 over TD. Despite not passing the significance test, the DHR of TP showed an increasing trend in spring and winter. Conversely, it overall presented a negative trend in summer and autumn over both TD and TP, with the largest trend during summer over TD. Additionally, an increasing of DHR appeared on the southern slope of the TP in winter, suggesting more dust transported in from the IGP.
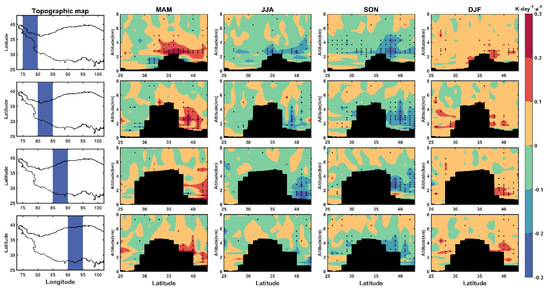
Figure 13.
Distributions of linear annual trends of the seasonal SW DHRs during 2007–2020 on four longitudinal transects. The black point represents the linear trend passing the significance test at the level of 0.05.
To analyze the heating contributions at different heights, the seasonal distributions of SW DHR in four altitude layers, namely, 0–2, 2–4, 4–6, and 6–8 km, are presented in Figure 14. Over TD, the most intense heating appeared in the layer of 2–4 km in spring and summer, with the average DHRs ranging from 2 to 4 K⋅day−1. The strength and high-value area of DHR over TD within the layer of 2–4 km reduced from spring to winter, showing a minimal regional mean of ~1 K⋅day−1 in winter. Over TP, it showed the highest DHR over the Qaidam Basin, with a maximum of 3–4 K⋅day−1 in the layer of 4–6 km in spring. Unlike the TD, the minimal regional mean DHR of TP appeared in autumn, which was consistent with the mean profiles in Figure 9. Furthermore, the north part of TP showed stronger heating effect than that in the south path, which was directly related to the dust inputted from TD. Additionally, the dust heating layers of 4–6 km were mixed from TD to TP in spring and summer, which offered an intense heat source above the study region. In the layer of 2–4 km, the Qaidam Basin acted as an important transport channel of heat between TD and TP. Above 6 km, the DHR dropped to less than 1 K⋅day−1 over most areas and the relative higher value appeared mostly over TP.
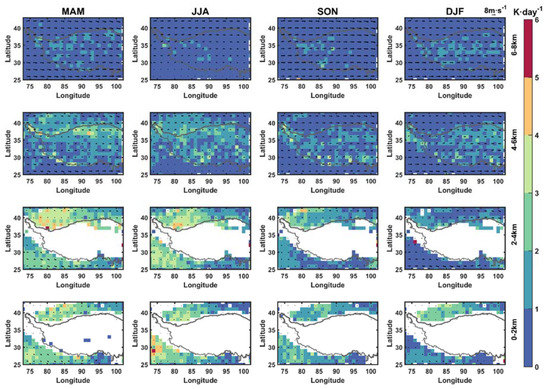
Figure 14.
Seasonal distributions of mean SW DHRs in four altitude layers during 2007–2020. The four layers are 0–2, 2–4, 4–6, and 6–8 km, respectively. The empty spaces indicate the missing data.
Figure 15 shows the multiyear mean SW DHR and annual variation of the regional means in the air column below 10 km from 2007 to 2020. As the main dust sources, the average DHRs were higher over TD, Qaidam Basin, and the Thar Desert than over the other regions. The average DHRs were in the range of 0.6–1.2 K⋅day−1 over Qaidam Basin and the Thar Desert, in contrast to 0.8–1.8 K⋅day−1 over TD. In terms of the spatial disparity, the relatively higher DHRs of TD mainly concentrated in the west and south parts, while that of TP concentrated in the east part. The annual variation of the regional means presented an insignificant trend of increasing and decreasing for TD and TP, respectively, consistent with the trend of DAOD in Figure 3. The overall columnar mean DHRs of TD and TP were 0.93 and 0.48 K⋅day−1, respectively.
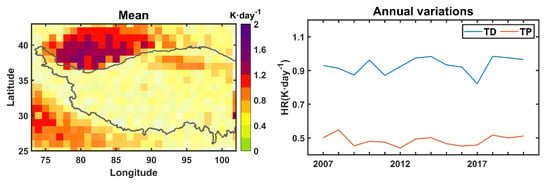
Figure 15.
The distributions and variations of annual column–averaged DHR (under 10 km) from 2007 to 2020.
3.4. Dust Heating Efficiency
To further explore the dust heating effect, Figure 16 shows the relationships of monthly grids of column-averaged SW DHR and DAOD below 10 km over the two regions. The DAOD was positively proportional to the DHR. The correlation coefficients were above 0.93 over both regions. Although the DAOD and DHR were both lower, the SW dust heating efficiency (DHE) of TP was 1.7 times that of TD. The mean DHEs of TP and TD were 3.07 and 1.83 K⋅day−1, respectively. The commensurate dust over TP absorbed more solar radiation due to more intense solar radiation at the higher altitude. This also suggested that a certain amount of dust imported to TP could generate a stronger heating effect than it did at the source.
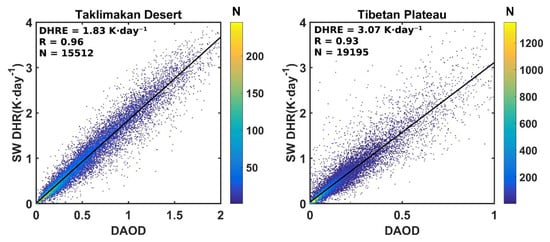
Figure 16.
Scatterplots of monthly DAOD and column–averaged SW DHR. The color bar represents the number of samples.
4. Conclusions
In this study, we analyzed the spatial and temporal distribution characteristics of dust aerosol and its heating effect over Taklimakan Desert and Tibetan Plateau during 2007–2020 using CALIPSO level 2 aerosol profile products and accordingly calculated dust heating rates from the SBDART model.
The overall annual mean DAOD was 0.286 ± 0.015 and 0.097 ± 0.006 over TD and TP, respectively. The seasonal DAOD of TD showed a decreasing trend from spring to winter, while that of TP was highest in summer and lowest in autumn. The dust of TD was concentrated within 1–4 km, showing the thickest dust layer in spring. Over TP, the dust extinction coefficient (σD) of summer appeared as the largest at almost all heights, which was contributed more by the dust inputted from the Thar Desert and lifted locally in the Qaidam Basin. Above 5 km, the annual mean σD of TP was twice as much as that of TD, which was a synthetic result of the dust transported from the surrounding area and the locally strong thermodynamic lifting effect. A weak increasing trend of σD appeared over both TD and TP in spring, but a decreasing trend was seen in autumn. The growing input of dust from IGP enhanced the σD over the southern slope of TP in winter. The dust radiative effect showed much stronger heating in shortwave but small cooling in the longwave band. It presented a thick dust heating layer in all seasons over TD, with the strongest SW DHR of 4.14 K·day−1 in spring. In winter, the DHR of TD presented a decline with height, showing a maximum of ~3 K·day−1 near the surface. Over TP, the strongest dust heating effect was exhibited in spring, while the weakest was seen in autumn. The largest SW DHR of TP appeared over the Qaidam Basin. It showed an increasing trend of the SW DHR in spring and winter over both TD and TP, but a decreasing trend in summer and autumn. Although the columnar mean SW DHR of TD was nearly twice that of TP, the average SW dust heating efficiency (DHE) of TD was nearly two-thirds that of TP, showing an average DHE of 1.83 and 3.07 K·day−1, respectively. The higher DHE over TP could result in the same amount of dust absorbing more energy than it did over TD.
Author Contributions
Conceptualization, X.X.; methodology, X.X. and S.P.; software, S.P.; validation, X.X., T.L. and Y.Y.; formal analysis, X.X. and S.P.; investigation, X.X., S.P. and Z.X.; resources, X.X.; data curation, S.P.; writing—original draft preparation, X.X. and S.P.; writing—review and editing, X.X.; visualization, S.P. and Z.X.; supervision, X.X.; project administration, X.X.; funding acquisition, X.X. All authors have read and agreed to the published version of the manuscript.
Funding
This research was funded by [National Natural Science Foundation of China] grant number [42030612] And The APC was funded by [42030612].
Data Availability Statement
The CALIPSO dataset is retrieved from the website of https://search.earthdata.nasa.gov/portal/idn/search?q=CALIOP (accessed on 19 December 2022). The ERA5 dataset is retrieved from the website of https://www.ecmwf.int/en/forecasts/datasets/reanalysis-datasets/era5 (accessed on 19 December 2022).
Acknowledgments
The authors are grateful to the websites of NASA Earthdata and ECMWF for the data used in this work. This research was supported by the National Natural Science Foundation of China (grant number: 42030612).
Conflicts of Interest
The authors declare no conflict of interest.
References
- Wu, G.; Mao, J.; Duan, A.; Zhang, Q. Current progresses in study of impacts of the Tibetan Plateau on Asian summer climate. Acta Meteorol. Sin. 2006, 20, 144. [Google Scholar]
- Xu, X.; Lu, C.; Shi, X.; Gao, S. World water tower: An atmospheric perspective. Geophys. Res. Lett. 2008, 35, L20815. [Google Scholar] [CrossRef]
- Chen, Y.; Li, W.; Deng, H.; Fang, G.; Li, Z. Changes in Central Asia’s Water Tower: Past, Present and Future. Sci. Rep. 2016, 6, 35458. [Google Scholar] [CrossRef]
- Xin, W.; Jianping, H.; Mingxia, J.; Kaz, H. Variability of East Asia dust events and their long-term trend. Atmos. Environ. 2008, 42, 3156–3165. [Google Scholar]
- Kang, S.; Xu, Y.; You, Q.; Flügel, W.-A.; Pepin, N.; Yao, T. Review of climate and cryospheric change in the Tibetan Plateau. Environ. Res. Lett. 2010, 5, 015101. [Google Scholar] [CrossRef]
- Huang, J.; Fu, Q.; Su, J.; Tang, Q.; Minnis, P.; Hu, Y.; Yi, Y.; Zhao, Q. Taklimakan dust aerosol radiative heating derived from CALIPSO observations using the Fu-Liou radiation model with CERES constraints. Atmos. Chem. Phys. 2009, 9, 4011–4021. [Google Scholar] [CrossRef]
- Yang, J.; Duan, K.; Kang, S.; Shi, P.; Ji, Z. Potential feedback between aerosols and meteorological conditions in a heavy pollution event over the Tibetan Plateau and Indo-Gangetic Plain. Clim. Dyn. 2017, 48, 2901–2917. [Google Scholar] [CrossRef]
- Yuan, T.; Chen, S.; Huang, J.; Wu, D.; Lu, H.; Zhang, G.; Ma, X.; Chen, Z.; Luo, Y.; Ma, X. Influence of Dynamic and Thermal Forcing on the Meridional Transport of Taklimakan Desert Dust in Spring and Summer. J. Clim. 2019, 32, 749–767. [Google Scholar] [CrossRef]
- Che, H.; Zhang, X.-Y.; Xia, X.; Goloub, P.; Holben, B.; Zhao, H.; Wang, Y.; Zhang, X.-C.; Wang, H.; Blarel, L. Ground-based aerosol climatology of China: Aerosol optical depths from the China Aerosol Remote Sensing Network (CARSNET) 2002–2013. Atmos. Chem. Physics 2015, 15, 7619–7652. [Google Scholar] [CrossRef]
- Huang, J.; Minnis, P.; Yi, Y.; Tang, Q.; Wang, X.; Hu, Y.; Liu, Z.; Ayers, K.; Trepte, C.; Winker, D. Summer dust aerosols detected from CALIPSO over the Tibetan Plateau. Geophys. Res. Lett. 2007, 34, L18805. [Google Scholar] [CrossRef]
- Wang, T.; Chen, Y.; Gan, Z.; Han, Y.; Li, J.; Huang, J. Assessment of dominating aerosol properties and their long-term trend in the pan-third pole region: A study with 10-year multi-sensor measurements. Atmos. Environ. 2020, 239, 117738. [Google Scholar] [CrossRef]
- Liu, Y.; Sato, Y.; Jia, R.; Xie, Y.; Huang, J.; Nakajima, T. Modeling study on the transport of summer dust and anthropogenic aerosols over the Tibetan Plateau. Atmos. Chem. Phys. 2015, 15, 12581–12594. [Google Scholar] [CrossRef]
- Ma, X.; Huang, Z.; Qi, S.; Huang, J.; Zhang, S.; Dong, Q.; Wang, X. Ten-year global particulate mass concentration derived from space-borne CALIPSO lidar observations. Sci. Total Environ. 2020, 721, 137699. [Google Scholar] [CrossRef] [PubMed]
- Lau, K.M.; Kim, K.M. Observational relationships between aerosol and Asian monsoon rainfall, and circulation. Geophys. Res. Lett. 2006, 33, L21810. [Google Scholar] [CrossRef]
- Kuhlmann, J.; Quaas, J. How can aerosols affect the Asian summer monsoon? Assessment during three consecutive pre-monsoon seasons from CALIPSO satellite data. Atmos. Chem. Phys. 2010, 10, 4673–4688. [Google Scholar] [CrossRef]
- Lau, W.K.; Kim, M.-K.; Kim, K.-M.; Lee, W.-S. Enhanced surface warming and accelerated snow melt in the Himalayas and Tibetan Plateau induced by absorbing aerosols. Environ. Res. Lett. 2010, 5, 025204. [Google Scholar] [CrossRef]
- Forster, P.; Ramaswamy, V.; Artaxo, P.; Berntsen, T.; Betts, R.; Fahey, D.; Haywood, J.; Lean, J.; Lowe, D.; Myhre, G.; et al. Changes in Atmospheric Constituents and in Radiative Forcing. In The Physical Science Basis; Cambridge University Press: Cambridge, UK; New York, NY, USA, 2007; pp. 131–234. [Google Scholar]
- Shi, G.; Wang, B.; Zhang, H.; Zhao, J.; Tan, S. The Radiative and Climatic Effects of Atmospheric Aerosols. Chin. J. Atmos. Sci. 2008, 32, 826–840. [Google Scholar]
- Choobari, O.A.; Zawar-Reza, P.; Sturman, A. The global distribution of mineral dust and its impacts on the climate system: A review. Atmos. Res. 2014, 138, 152–165. [Google Scholar] [CrossRef]
- Claquin, T.; Schulz, M.; Balkanski, Y.; Boucher, O. Uncertainties in assessing radiative forcing by mineral dust. Tellus B 1998, 50, 491–505. [Google Scholar] [CrossRef]
- Zhu, A.; Ramanathan, V.; Li, F.; Kim, D. Dust plumes over the Pacific, Indian, and Atlantic oceans: Climatology and radiative impact. J. Geophys. Res. Atmos. 2007, 112, D16208. [Google Scholar] [CrossRef]
- McComiskey, A.; Schwartz, S.E.; Schmid, B.; Guan, H.; Lewis, E.R.; Ricchiazzi, P.; Ogren, J.A. Direct aerosol forcing: Calculation from observables and sensitivities to inputs. J. Geophys. Res. 2008, 113, D09202. [Google Scholar] [CrossRef]
- Zarzycki, C.M.; Bond, T.C. How much can the vertical distribution of black carbon affect its global direct radiative forcing? Geophys. Res. Lett. 2010, 37, L20807. [Google Scholar] [CrossRef]
- Feng, Y.; Kotamarthi, V.R.; Coulter, R.; Zhao, C.; Cadeddu, M. Radiative and thermodynamic responses to aerosol extinction profiles during the pre-monsoon month over South Asia. Atmos. Chem. Phys. 2016, 16, 247–264. [Google Scholar] [CrossRef]
- Vuolo, M.R.; Schulz, M.; Balkanski, Y.; Takemura, T. A new method for evaluating the impact of vertical distribution on aerosol radiative forcing in general circulation models. Atmos. Chem. Phys. 2014, 14, 877–897. [Google Scholar] [CrossRef]
- Hu, Y.; Liu, Z.; Winker, D.; Vaughan, M.; Noel, V.; Bissonnette, L.; Roy, G.; McGill, M. A simple relation between depolarization and multiple scattering of water clouds and its application for lidar calibration. Opt. Lett. 2006, 31, 1809–1811. [Google Scholar] [CrossRef]
- Winker, D.; Vaughan, M.; Hunt, B. The CALIPSO Mission and Initial Results from CALIOP; SPIE6409: Goa, India, 2006. [Google Scholar]
- Konsta, D.; Binietoglou, I.; Gkikas, A.; Solomos, S.; Marinou, E.; Proestakis, E.; Basart, S.; Garcia-Pando, C.P.; El-Askary, H.; Amiridis, V. Evaluation of the BSC-DREAM8b regional dust model using the 3D LIVAS-CALIPSO product. Atmos. Environ. 2018, 195, 46–62. [Google Scholar] [CrossRef]
- Chen, S.; Huang, J.; Zhao, C.; Qian, Y.; Leung, L.R.; Yang, B. Modeling the transport and radiative forcing of Taklimakan dust over the Tibetan Plateau: A case study in the summer of 2006. J. Geophys. Res. Atmos. 2013, 118, 797–812. [Google Scholar] [CrossRef]
- Liu, L.; Huang, X.; Ding, A.; Fu, C. Dust-induced radiative feedbacks in north China: A dust storm episode modeling study using WRF-Chem. Atmos. Environ. 2016, 129, 43–54. [Google Scholar] [CrossRef]
- Huang, J.; Wang, T.; Wang, W.; Li, Z.; Yan, H. Climate effects of dust aerosols over east Asian arid and semiarid regions. J. Geophys. Res. Atmos. 2014, 119, 11398–11416. [Google Scholar] [CrossRef]
- Mishra, A.K.; Koren, I.; Rudich, Y. Effect of aerosol vertical distribution on aerosol-radiation interaction. A theoretical prospect. Heliyon 2015, 1, e00036. [Google Scholar] [CrossRef]
- Meloni, D.; di Sarra, A.; Di Iorio, T.; Fiocco, G. Influence of the vertical profile of Saharan dust on the visible direct radiative forcing. J. Quant. Spectrosc. Radiat. Transf. 2005, 93, 397–413. [Google Scholar] [CrossRef]
- Guan, H.; Schmid, B.; Bucholtz, A.; Bergstrom, R. Sensitivity of shortwave radiative flux density, forcing, and heating rate to the aerosol vertical profile. J. Geophys. Res. Atmos. 2010, 115, D06209. [Google Scholar] [CrossRef]
- Perrone, M.R.; Tafuro, A.M.; Kinne, S. Dust layer effects on the atmospheric radiative budget and heating rate profiles. Atmos. Environ. 2012, 59, 344–354. [Google Scholar] [CrossRef]
- Johnson, B.T.; Heese, B.; McFarlane, S.A.; Chazette, P.; Jones, A.; Bellouin, N. Vertical distribution and radiative effects of mineral dust and biomass burning aerosol over West Africa during DABEX. J. Geophys. Res. Atmos. 2008, 113, D00C12. [Google Scholar] [CrossRef]
- Zhang, L.; Li, Q.B.; Gu, Y.; Liou, K.N.; Meland, B. Dust vertical profile impact on global radiative forcing estimation using a coupled chemical-transport–radiative-transfer model. Atmos. Chem. Phys. 2013, 13, 7097–7114. [Google Scholar] [CrossRef]
- Paul Ricchiazzi, S.Y.; Gautier, C.; Sowle, D. SBDART: A Research and Teaching Software Tool for Plane-Parallel Radiative Transfer in the Earth’s Atmosphere. Bull. Am. Meteorol. Soc. 1998, 79, 2101–2114. [Google Scholar] [CrossRef]
- Hu, Y.; Vaughan, M.; Liu, Z.; Lin, B.; Yang, P.; Littner, D.; Hunt, B.; Kuehn, R.; Huang, J.; Wu, D. The depolarization-attenuated backscatter relation: CALIPSO lidar measurements vs. theory. Opt. Express 2007, 15, 5327–5332. [Google Scholar] [CrossRef]
- Winker, D.M.; Vaughan, M.A.; Omar, A.; Hu, Y.; Powell, K.A.; Liu, Z.; Hunt, W.H.; Young, S.A. Overview of the CALIPSO mission and CALIOP data processing algorithms. J. Atmos. Ocean. Technol. 2009, 26, 2310–2323. [Google Scholar] [CrossRef]
- Huang, J.; Guo, J.; Wang, F.; Liu, Z.; Jeong, M.-J.; Yu, H.; Zhang, Z. CALIPSO inferred most probable heights of global dust and smoke layers. J. Geophys. Res. Atmos. 2015, 120, 5085–5100. [Google Scholar] [CrossRef]
- Tackett, J.L.; Winker, D.M.; Getzewich, B.J.; Vaughan, M.A.; Young, S.A.; Kar, J. CALIPSO lidar level 3 aerosol profile product: Version 3 algorithm design. Atmos. Meas. Tech. 2018, 11, 4129–4152. [Google Scholar] [CrossRef]
- Hess, M.; Koepke, P.; Schult, I. Optical Properties of Aerosols and Clouds: The Software Package OPAC. Bull. Am. Meteorol. Soc. 1998, 79, 831–844. [Google Scholar] [CrossRef]
- Wang, T.; Han, Y.; Huang, J.; Sun, M.; Jian, B.; Huang, Z.; Yan, H. Climatology of Dust-Forced Radiative Heating Over the Tibetan Plateau and Its Surroundings. J. Geophys. Res. Atmos. 2020, 125, e2020JD032942. [Google Scholar] [CrossRef]
- Li, Z.; Lee, K.-H.; Wang, Y.; Xin, J.; Hao, W.-M. First observation-based estimates of cloud-free aerosol radiative forcing across China. J. Geophys. Res. 2010, 115, D00K18. [Google Scholar] [CrossRef]
- Hu, Z.; Huang, J.; Zhao, C.; Jin, Q.; Ma, Y.; Yang, B. Modeling dust sources, transport, and radiative effects at different altitudes over the Tibetan Plateau. Atmos. Chem. Phys. 2020, 20, 1507–1529. [Google Scholar] [CrossRef]
- Xu, X.; Wu, H.; Yang, X.; Xie, L. Distribution and transport characteristics of dust aerosol over Tibetan Plateau and Taklimakan Desert in China using MERRA-2 and CALIPSO data. Atmos. Environ. 2020, 237, 117670. [Google Scholar] [CrossRef]
- Ginoux, P.; Prospero, J.M.; Gill, T.E.; Hsu, N.C.; Zhao, M. Global-scale attribution of anthropogenic and natural dust sources and their emission rates based on MODIS Deep Blue aerosol products. Rev. Geophys. 2012, 50, RG3005. [Google Scholar] [CrossRef]
- Tiwari, S.; Kumar, A.; Pratap, V.; Singh, A. Assessment of two intense dust storm characteristics over Indo–Gangetic basin and their radiative impacts: A case study. Atmos. Res. 2019, 228, 23–40. [Google Scholar] [CrossRef]
- Xu, C.; Ma, Y.; Yang, K.; You, C. Tibetan Plateau Impacts on Global Dust Transport in the Upper Troposphere. J. Clim. 2018, 31, 4745–4756. [Google Scholar] [CrossRef]
- Liou, K.N. An Introduction to Atmospheric Radiation; Academic Press: Cambridge, MA, USA, 2002. [Google Scholar]
- Tao, M.; Chen, L.; Wang, J.; Wang, L.; Wang, W.; Lin, C.; Gui, L.; Wang, L.; Yu, C.; Wang, Y. Characterization of dust activation and their prevailing transport over East Asia based on multi-satellite observations. Atmos. Res. 2021, 265, 105886. [Google Scholar] [CrossRef]
- Tsai, F.; Chen, G.; Liu, T.; Lin, W.; Tu, J. Characterizing the transport pathways of Asian dust. J. Geophys. Res. 2008, 113, D17311. [Google Scholar] [CrossRef]
- Voss, K.; Evan, A.; Ralph, F. Evaluating the meteorological conditions associated with dusty atmospheric rivers. J. Geophys. Res. Atmos. 2021, 126, e2021JD035403. [Google Scholar] [CrossRef]
Disclaimer/Publisher’s Note: The statements, opinions and data contained in all publications are solely those of the individual author(s) and contributor(s) and not of MDPI and/or the editor(s). MDPI and/or the editor(s) disclaim responsibility for any injury to people or property resulting from any ideas, methods, instructions or products referred to in the content. |
© 2023 by the authors. Licensee MDPI, Basel, Switzerland. This article is an open access article distributed under the terms and conditions of the Creative Commons Attribution (CC BY) license (https://creativecommons.org/licenses/by/4.0/).