Article

Algorithm–Hardware Co-Optimization and Deployment Method for Field-Programmable Gate-Array-Based Convolutional Neural Network Remote Sensing Image Processing

1
Beijing Key Laboratory of Embedded Real-Time Information Processing Technology, Beijing Institute of Technology, Beijing 100081, China
2
China Academy of Space Technology, Beijing 100098, China
*
Author to whom correspondence should be addressed.
Remote Sens. 2023, 15(24), 5784; https://doi.org/10.3390/rs15245784
Submission received: 3 November 2023 / Revised: 5 December 2023 / Accepted: 11 December 2023 / Published: 18 December 2023
(This article belongs to the Section AI Remote Sensing)

Abstract

:
In recent years, convolutional neural networks (CNNs) have gained widespread adoption in remote sensing image processing. Deploying CNN-based algorithms on satellite edge devices can alleviate the strain on data downlinks. However, CNN algorithms present challenges due to their large parameter count and high computational requirements, which conflict with the satellite platforms’ low power consumption and high real-time requirements. Moreover, remote sensing image processing tasks are diverse, requiring the platform to accommodate various network structures. To address these issues, this paper proposes an algorithm–hardware co-optimization and deployment method for FPGA-based CNN remote sensing image processing. Firstly, a series of hardware-centric model optimization techniques are proposed, including operator fusion and depth-first mapping technology, to minimize the resource overhead of CNN models. Furthermore, a versatile hardware accelerator is proposed to accelerate a wide range of commonly used CNN models after optimization. The accelerator architecture mainly consists of a parallel configurable network processing unit and a multi-level storage structure, enabling the processing of optimized networks with high throughput and low power consumption. To verify the superiority of our method, the introduced accelerator was deployed on an AMD-Xilinx VC709 evaluation board, on which the improved YOLOv2, VGG-16, and ResNet-34 networks were deployed. Experiments show that the power consumption of the accelerator is 14.97 W, and the throughput of the three networks reaches 386.74 giga operations per second (GOPS), 344.44 GOPS, and 182.34 GOPS, respectively. Comparison with related work demonstrates that the co-optimization and deployment method can accelerate remote sensing image processing CNN models and is suitable for applications in satellite edge devices.

1. Introduction

In recent years, space remote sensing technology has developed rapidly. Remote sensing image processing technologies such as object detection [1,2] and scene classification [3,4] have gained widespread adoption in military and civilian fields [5,6]. With the advancements in deep learning algorithms, significant progress has been made in image processing models based on convolutional neural networks (CNNs), greatly enhancing the performance of remote sensing image processing [7,8]. Traditionally, image processing tasks in space remote sensing are carried out at ground stations [9]. The images are downloaded from satellites to processing equipment at ground stations, where algorithms are used to analyze and interpret the images. However, in recent years, remote sensing images’ resolution and data volume have increased rapidly, placing a considerable burden on data downlinks [10]. An intuitive and effective solution to this problem is to perform the image processing based on CNN models directly on satellite edge devices and only transmit the extracted relevant information to ground stations [11]. Consequently, many researchers focus on deploying CNN models on satellite edge devices [12,13].
Nevertheless, CNN models for image processing typically have a substantial number of parameters, leading to high computational and memory overheads. In deep learning, graphics processing units (GPUs) are commonly employed to train and infer CNN models [14,15]. However, the significant power consumption of GPUs makes them unsuitable for satellite platforms [16]. Despite NVIDIA’s introduction of some embedded GPUs that curtail power consumption, these are not aerospace-grade embedded devices, hence their inapplicability on satellites [17]. Field-Programmable Gate Arrays (FPGAs) and Application-Specific Integrated Circuits (ASICs) exhibit low power consumption and high computing power characteristics, meeting space image processing requirements. However, ASICs are not ideal due to their long development cycle and high costs [18]. Therefore, FPGAs have become the preferred choice for satellite edge processing devices [10,14].
Researchers have primarily focused on deploying CNN models on FPGA platforms. Neris et al. [19] conducted a comparative analysis of commonly used remote sensing image processing models and determined the MobileNet1Lite model to be the most well-suited for FPGA deployment. They developed a MobileNet1Lite accelerator on the FPGA platform using high-level synthesis (HLS) technology, implementing both 32-bit floating-point and 16-bit fixed-point precision. Kim et al. [20] proposed an RTL-level reconfigurable accelerator based on CNN for mobile FPGA and evaluated its performance on the ResNet-20 network. This accelerator demonstrated exceptional throughput and utilization. However, on-board remote sensing image processing imposes stringent requirements on power consumption and real-time performance [9,21], which the current FPGA-based CNN hardware accelerators lack in terms of sufficient energy efficiency.
Furthermore, typical remote sensing image processing tasks, such as object detection and scene classification, often require diverse CNN models with different structures [22,23]. Additionally, the requirements for these tasks may change [24], or the algorithms may be updated [25], necessitating the replacement of various CNN models. However, most existing research focuses on custom-designed FPGA-based CNN acceleration schemes. For instance, Wang et al. [26] trained the L-CNN model and developed a customized FPGA accelerator specifically for ship detection on satellites. Although these custom accelerators are effective in accelerating CNN models with specific structures, they do not support the implementation of CNN models with different structures [27].
To address the aforementioned problems, an algorithm–hardware collaborative optimization and deployment method for FPGA-based CNN remote sensing image processing is proposed. In terms of algorithm optimization, a series of hardware-centric model optimization techniques are proposed to minimize the resource requirements of the remote sensing CNN model, making it more suitable for hardware deployment. As for hardware, a versatile hardware accelerator for remote sensing CNN models is presented, capable of accommodating a wide range of commonly used CNN models for remote sensing image processing. By co-optimizing both algorithm and hardware, the proposed accelerator achieves a balance between versatility and energy efficiency when accelerating remote sensing CNN models. The contributions of this paper can be summarized as follows:
  • An algorithm–hardware co-optimization and deployment method for FPGA-based CNN remote sensing image processing is proposed, including a series of hardware-centric model optimization techniques and a versatile FPGA-based CNN accelerator architecture.
  • A series of hardware-centric model optimization techniques are proposed, including operation fusion and unification, as well as loop tiling and loop unrolling based on the depth-first mapping technique. These techniques reduce the hardware overhead requirements of the model and consequently improve the energy efficiency of the accelerator.
  • An FPGA-based CNN accelerator architecture is proposed, comprising a highly parallel and configurable network processing unit. This architecture is specifically designed to accelerate the optimized CNN model effectively. Additionally, a multi-level storage structure is incorporated to enhance data access efficiency for tiled and unrolled models.
This study implemented the proposed CNN hardware accelerator on an AMD-Xilinx VC709 evaluation board and utilized it to accelerate improved YOLOv2, VGG-16, and Resnet-34 networks. The experimental results demonstrate notable achievements, with respective throughputs of 386.74 giga operations per second (GOPS), 344.44 GOPS, and 182.34 GOPS. Moreover, the power consumption of the system was measured to be 14.97 W, indicating superior energy efficiency compared to existing related work.
The rest of this paper is organized as follows: Section 2 introduces the fundamental structure of CNNs and the network quantization method employed in this paper. In Section 3, this study initially performs operational fusion and unification on the network, followed by the proposition of a depth-first mapping technique for convolutional operations. Additionally, the architecture of the designed hardware accelerator is introduced. Section 4 presents the experimental results and provides a comprehensive performance evaluation. Finally, Section 5 discusses the experimental results, and Section 6 concludes this paper.

2. Background

This section introduces the fundamental composition of commonly used CNN models and the network quantization method employed in this paper.

2.1. The Composition of CNNs

Standard convolution is the primary component in CNNs. Additionally, CNNs include depth-wise convolution, batch normalization, fully connected layers, global average pooling, activation functions, and shortcuts. This sub-section will introduce these operations.

2.1.1. Standard Convolution

Convolutional layers are employed to extract features from an input image [28]. Figure 1a illustrates the 3-D convolution operation in a convolutional layer. The input of a convolutional layer is a 3-D feature map (fmap) of the size L i × L i × C i where L i and C i denote the length and the number of channels of the input fmaps, respectively. The input fmap is convolved with C o weights with the size of K × K × C i to generate a 3-D output fmap of the size L o × L o × C o , where K ,   L o , and C o are respectively the length of weight, the length of output fmap and the number of the output fmap channels. The convolution operation is defined as follows:
o j x , y = i = 0 C i 1 u = 0 K 1 v = 0 K 1 I i x S + u , y S + v w i j u , v + b j        0 x , y L o , 0 j C o ,        L o = L i K + 2 P / S + 1
where I and o represent the input fmap and output fmap, respectively, while w and b denote the weights and bias. S represents the stride of the convolution operation and P represents the number of paddings. C i ,   C o , K ,   S , and P are considered the hyperparameters of convolution [29].

2.1.2. Depth-Wise Convolution

Depth-wise convolution, unlike standard convolution, does not alter the number of channels in the fmap but extracts features utilizing fewer parameters [30]. Figure 1b illustrates the operation process of depth-wise convolution. The input fmap size for depth-wise convolution remains the same, L i × L i × C i , while only one weight with a size of K × K × C i is utilized. Unlike standard convolution, the c i th channel of the input fmap in depth-wise convolution is convolved solely with the corresponding channel of the weight. Consequently, the result becomes the c i th channel of the output fmap. Therefore, both the input and output fmaps have C i channels. The depth-wise convolution operation is defined as follows:
o j x , y = u = 0 K 1 v = 0 K 1 I j x S + u , y S + v w j u , v + b j      0 x , y L o , 0 j C i ,      L o = L i K + 2 P / S + 1
Figure 1. The convolutional layers in CNNs. (a) The normal convolutional operation. (b) The depth-wise convolution operation.
Remotesensing 15 05784 g001

2.1.3. Batch Normalization

Batch normalization (BN) is used in CNN training to promote network convergence and prevent overfitting [31]. Due to its advantageous properties, BN has been widely adopted in state-of-the-art networks [32,33]. Typically, BN layers are placed after convolutional layers to normalize the output fmaps [34]. BN is a channel-wise operation, and the formula for BN can be expressed as follows:
  y = γ i x μ i σ i 2 + ε + β i
where y and x represent the outputs of batch-normalization and convolutional layers, respectively. μ i and σ i 2 are the channel-wise mean and variance estimations of the output fmaps from the preceding convolutional layer. γ i and β i are the trainable channel-wise scale and bias, respectively. ε is a small constant for numerical stability.

2.1.4. Full Connection and Global Average Pooling

Fully connected layers are commonly utilized in classification CNN algorithms [35]. In fully connected layers, each neuron is connected to all the neurons in the previous layer, allowing local information integration [36]. The equation of the fully connected layer is as follows:
o j = i = 0 C i 1 I i w i j 0 j C i
where C i represents the input nodes, w i j represents the weight at position ( i ,   j ) in the weight matrix, and o j represents the output node at position j .
In state-of-the-art models such as ResNet and GoogLeNet, global average pooling (GAP) is used instead of the FC layer to decrease the number of parameters in the network [37,38]. The GAP layer has no weight matrix and does not change the number of channels in the fmap. It can be defined as follows:
o j = x = 0 L i 1 y = 0 L i 1 I j x , y 1 L i 2    0 j C i
where i and o denote the input and output fmap, respectively. The size of the input fmap is L i × L i × C i , while the size of the output fmap is 1 × 1 × C i .

2.1.5. Activation Function

Activation functions are primarily employed to introduce nonlinear characteristics in neural networks [39]. In remote sensing image processing, the Rectified Linear Unit (ReLU) activation function is commonly utilized in CNN models [40]. Its equation is as follows:
  y = max x , 0
However, the ReLU function has drawbacks such as node death during training [41]. In this case, some models use LeakyReLU as a replacement [42]. The equation for LeakyReLU is as follows:
  y =   x   x 0   α x   x < 0

2.1.6. Shortcut

Shortcut connections are highly effective structures that have emerged in the development of CNN models to address the problem of degradation in deep neural networks. They are widely used in models such as ResNet [43]. The relationship between the input x and output y of the shortcut structure is shown in Equation (8):
  y = F x , W + x
where F x , W represents a certain function mapping relationship. For example, in the residual structure of ResNet illustrated in Figure 2, this mapping relationship involves two convolution operations and one activation function [43].

2.2. Quantify

Network quantization can significantly reduce the number of parameters and computational resource consumption of an algorithm, provided that it remains within an acceptable range of performance loss [44]. Our previous work [45] presents a hardware-friendly symmetric network quantization scheme for efficient FPGA-based implementation of CNNs. Considering the general case of k -bit symmetric quantization as described in [45], the quantization function Q is defined as follows:
  q = Q r ; k = σ r s + 1 2 , 2 k 1 + 1 , 2 k 1 1
where r Z denotes the full-precision value in matrix Z and q denotes the quantized value. For k -bit quantization, q is quantized as a k -bit signed integer. σ is used to limit the quantized value to the range [ 2 k 1 + 1 ,   2 k 1 1   ] . s is a floating-point value that denotes the scaling factor and is defined as follows:
  s = max ( | max ( Z ) | ,   | min ( Z ) | ) 2 k 1 1
The weights can be quantized into integers for inference using Equations (9) and (10). However, directly obtaining the scaling factor of input fmaps with Equation (10) is not feasible. It would be inefficient to collect the ranges of each input fmap. To address this issue, approximate maximum and minimum values via exponential moving averages (EMA) are adopted for fmap quantization.
As mentioned in [45], it was found that BN requires higher calculation accuracy. Therefore, integer/floating-point Hybrid-Type Inference is used in the quantization strategy. In this strategy, convolutional and fully connected layers are computed using low-bit signed integers while maintaining floating-point normalization and activations. To implement the Hybrid-Type Inference strategy, a dequantization layer is inserted after the quantized convolution layer, which converts fixed-point fmaps into floating-point fmaps. The equation for the dequantization layer is as follows:
r = q × s

3. Algorithm–Hardware Co-Optimization Method for CNN Models

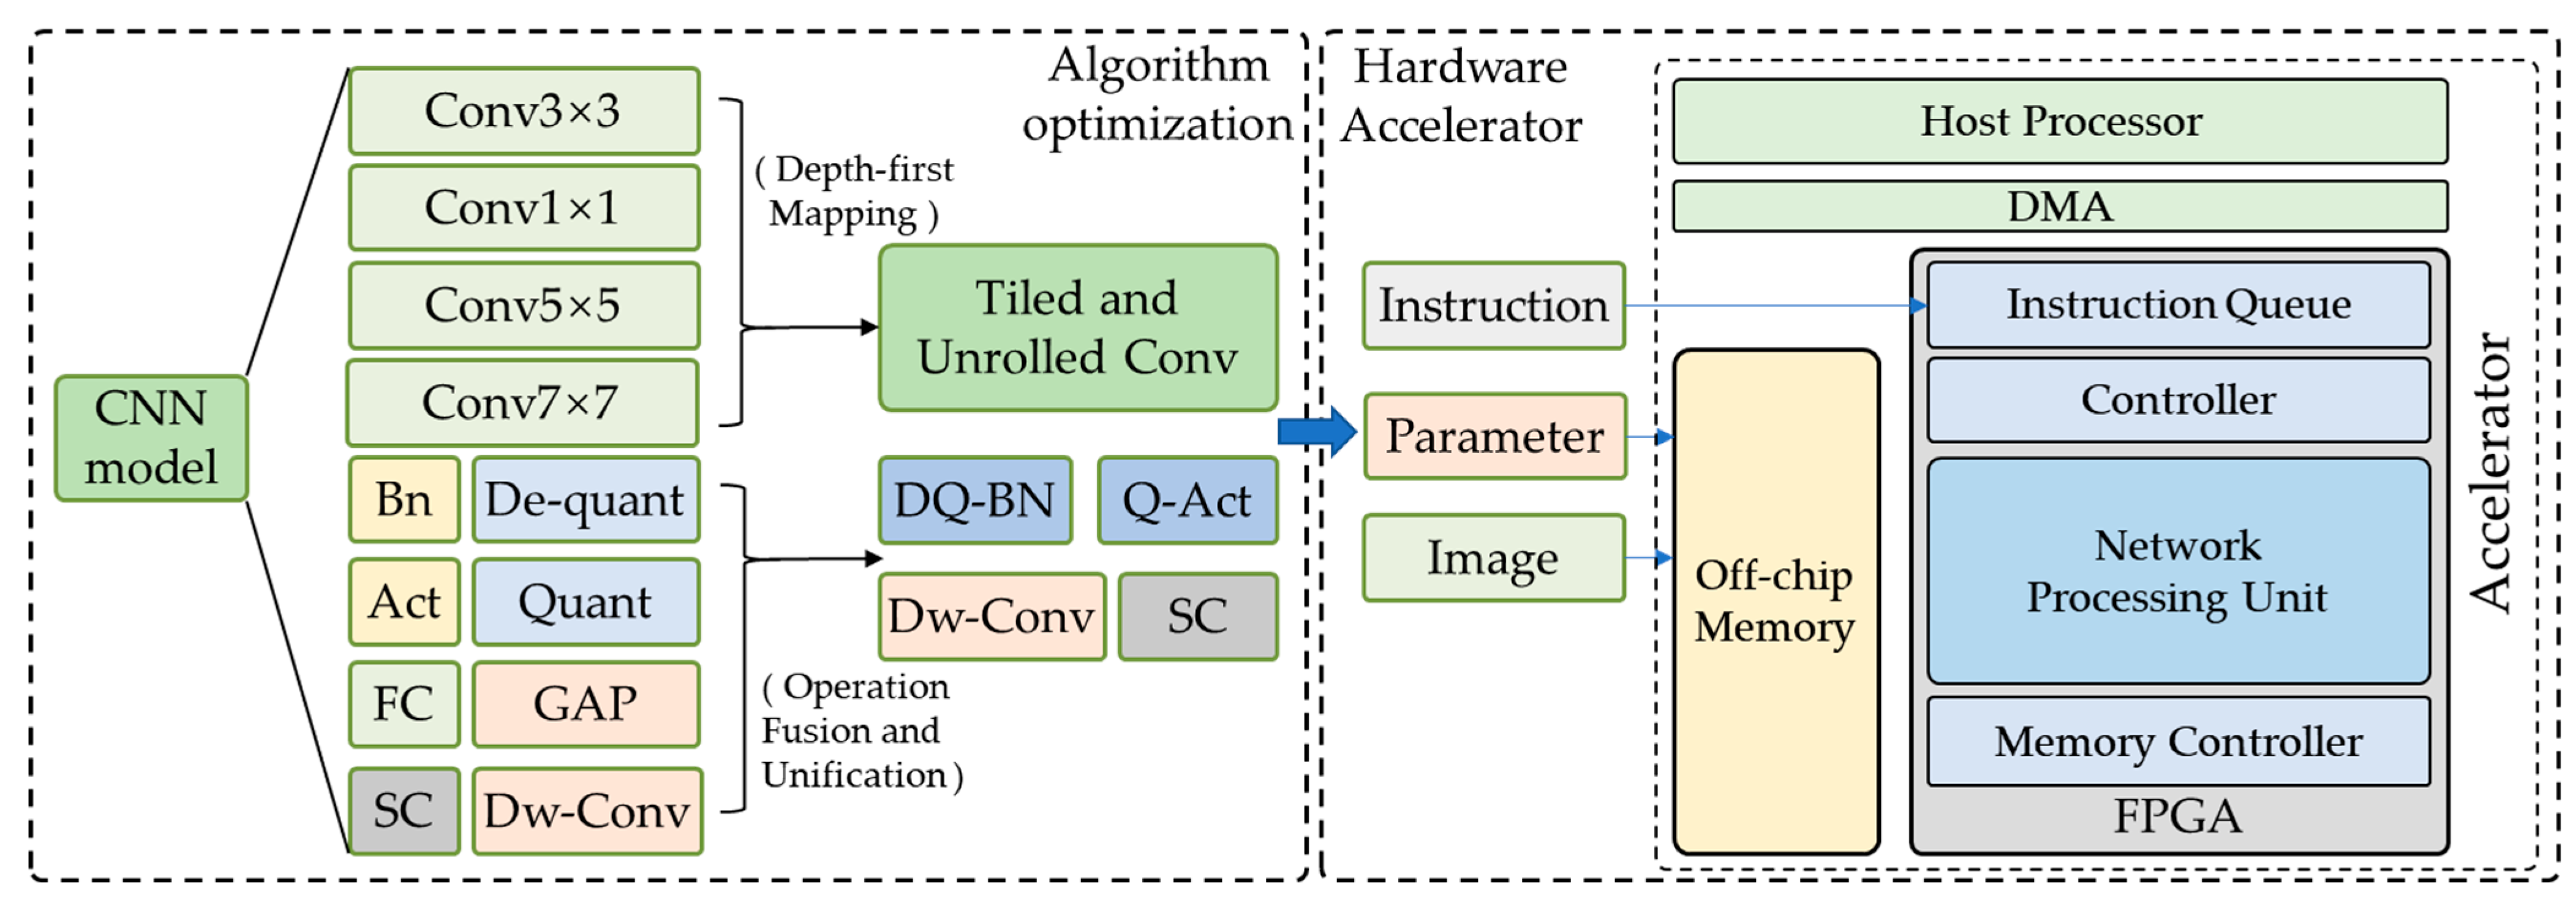
This paper proposes a novel algorithm–hardware co-optimization method for FPGA-based CNN remote sensing image processing, as shown in Figure 3. In this method, the CNN models are firstly unified and simplified to minimize resource consumption during hardware deployment. Subsequently, the models are converted into parameters and instructions, which are then utilized by the proposed hardware accelerator to facilitate rapid inference of the models. Through algorithms and hardware co-optimization, the proposed accelerator achieves a balance between versatility and energy efficiency when accelerating remote sensing CNN models.

3.1. Hardware-Centric Optimization

A series of hardware-centric model optimization techniques are proposed to enhance the suitability of remote sensing CNN-based models for hardware deployment. Under the premise of adopting the symmetric quantization scheme, certain operations in CNN are unified or fused to conserve hardware resources. Additionally, this study introduces a depth-first mapping technique that unifies the implementation of convolution with varying hyperparameters. The details are described in the following two sub-sections.

3.1.1. Operation Fusion and Unification

It is evident that when a = 0 in Equation (7), it will reduce to Equation (6), allowing for the completion of LeakyReLU and ReLU within the same implementation structure.
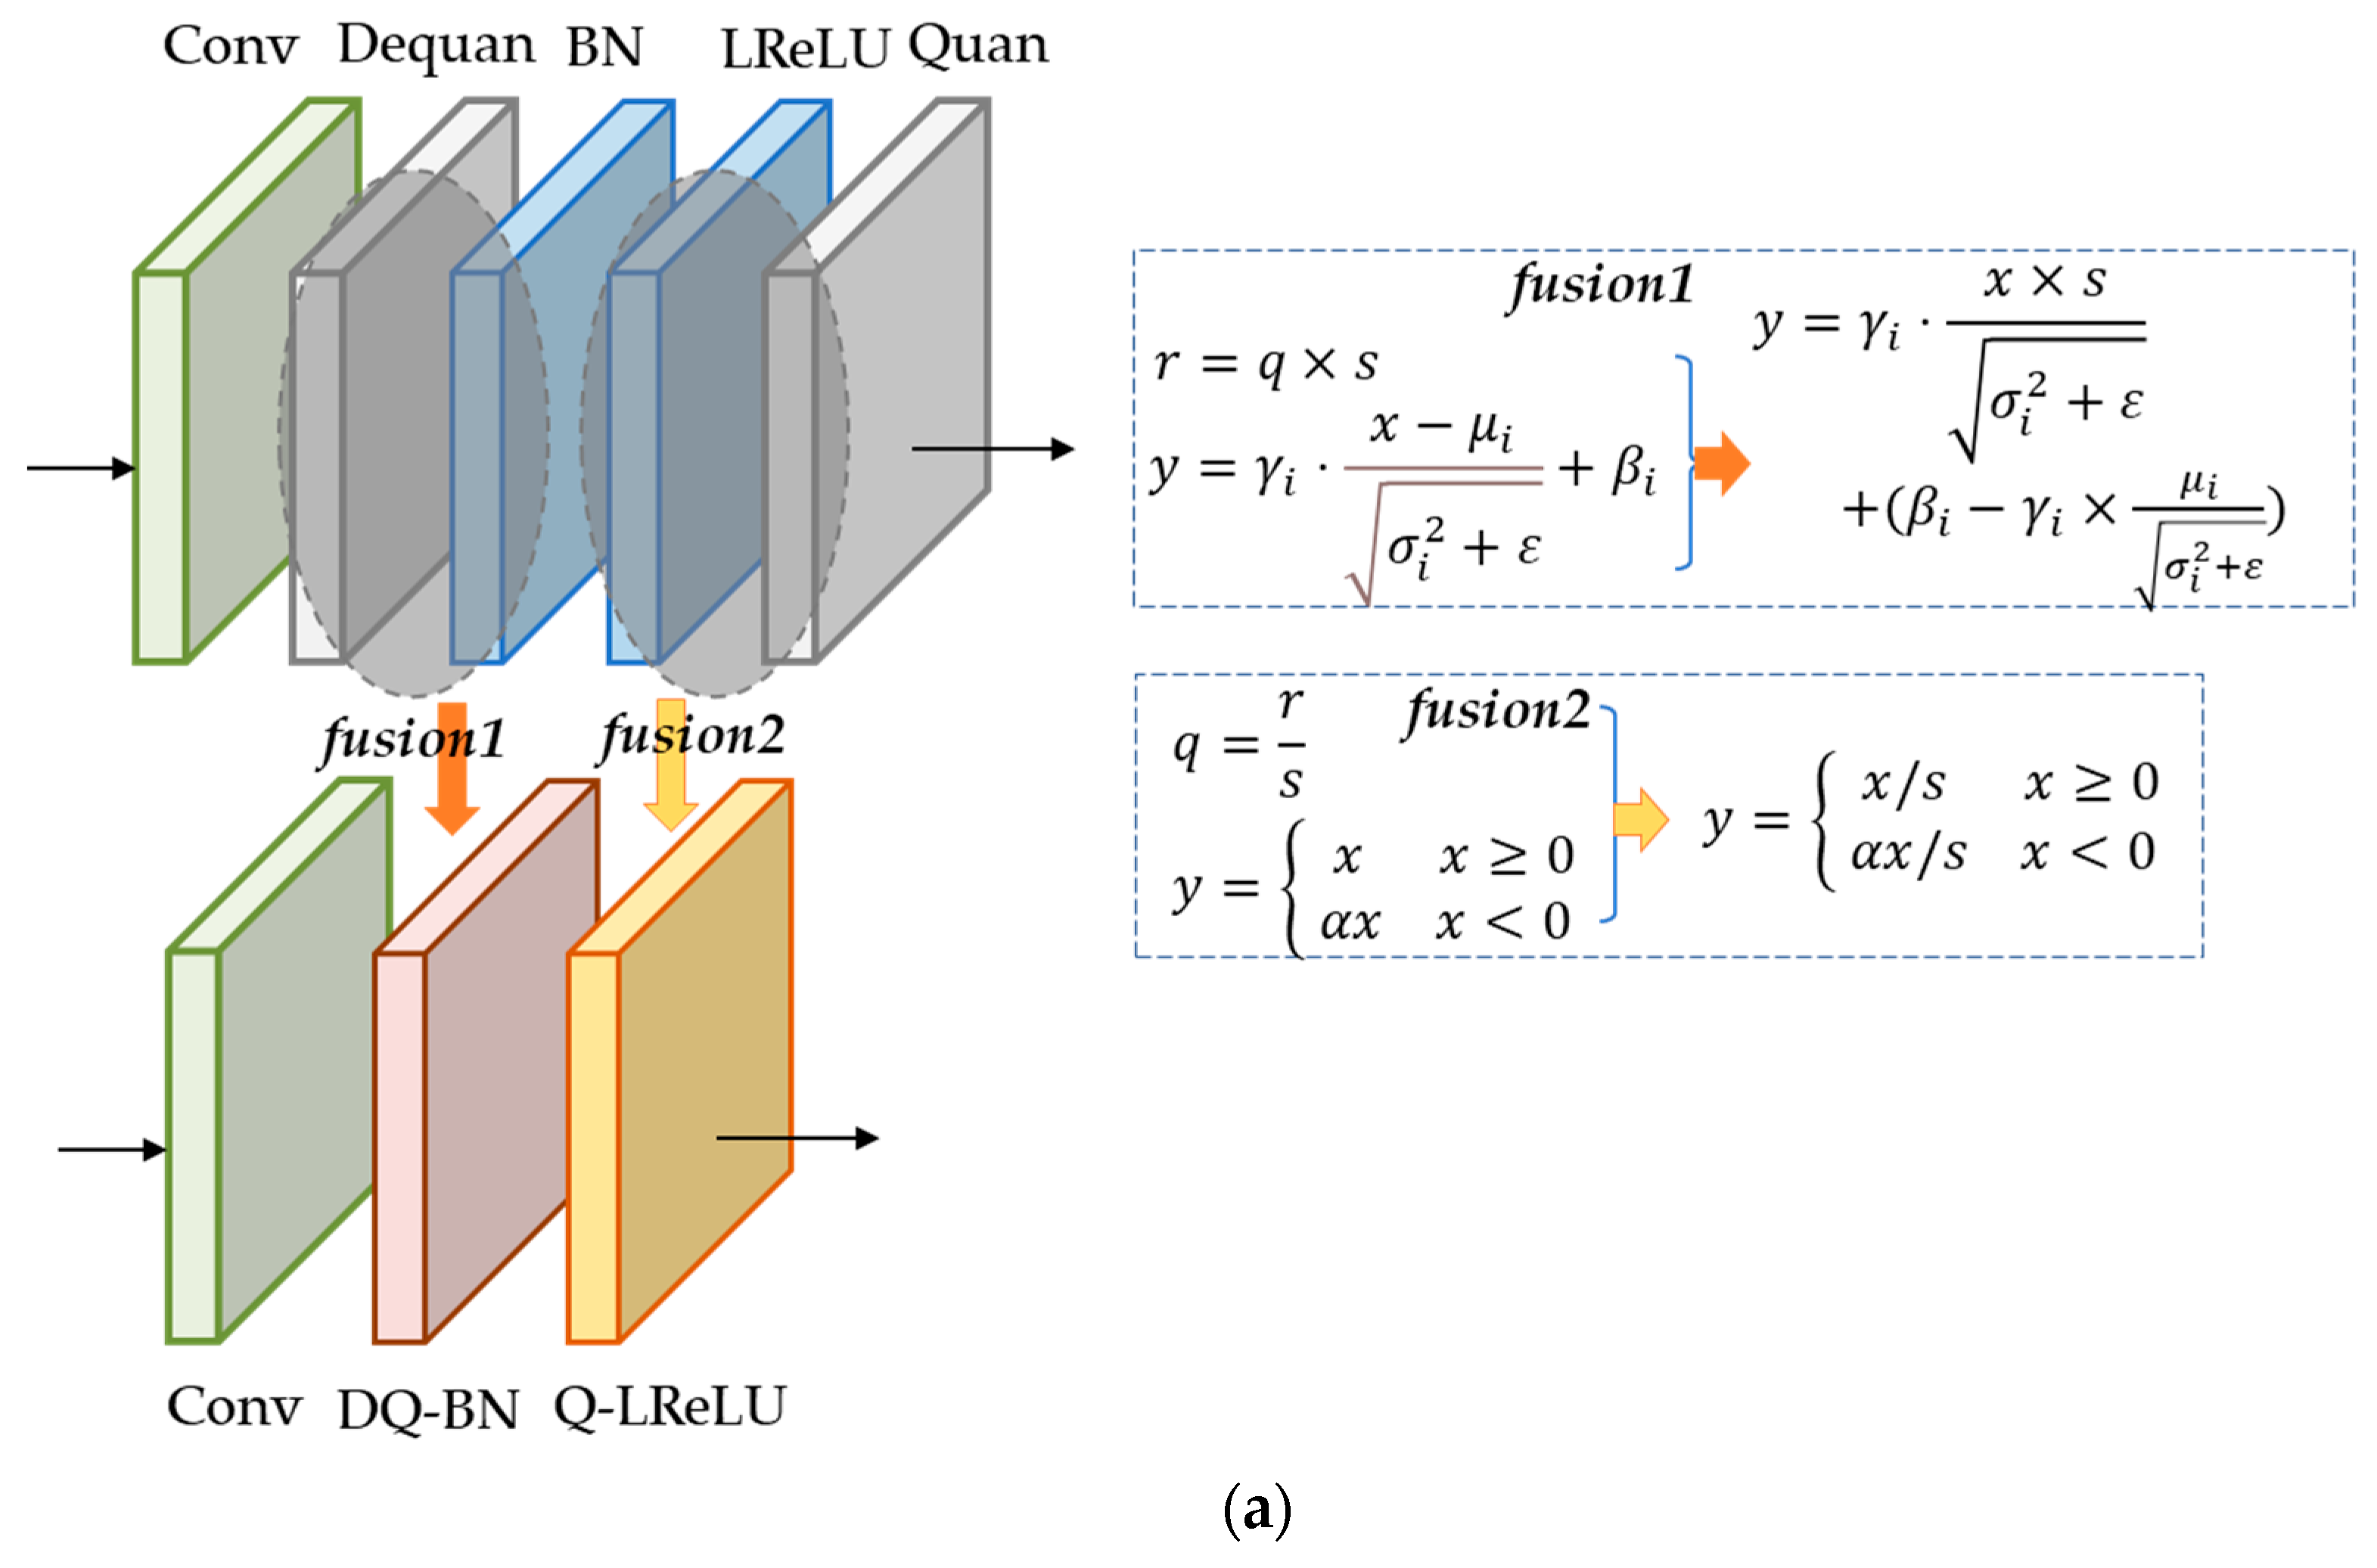
When adopting the mixed-precision quantization mentioned in [45], an inverse quantization layer and a quantization layer are added to the existing neural network structure. Inspired by our previous work [12], this study fuses the inverse dequantization layer with the BN layer. It simplifies them into one multiplication and addition operation, referred to as the DQ-BN layer. Similarly, the fusion of the leaky ReLU with the quantization layer is termed the Q-LReLU layer. The fusion is depicted in Figure 4a.
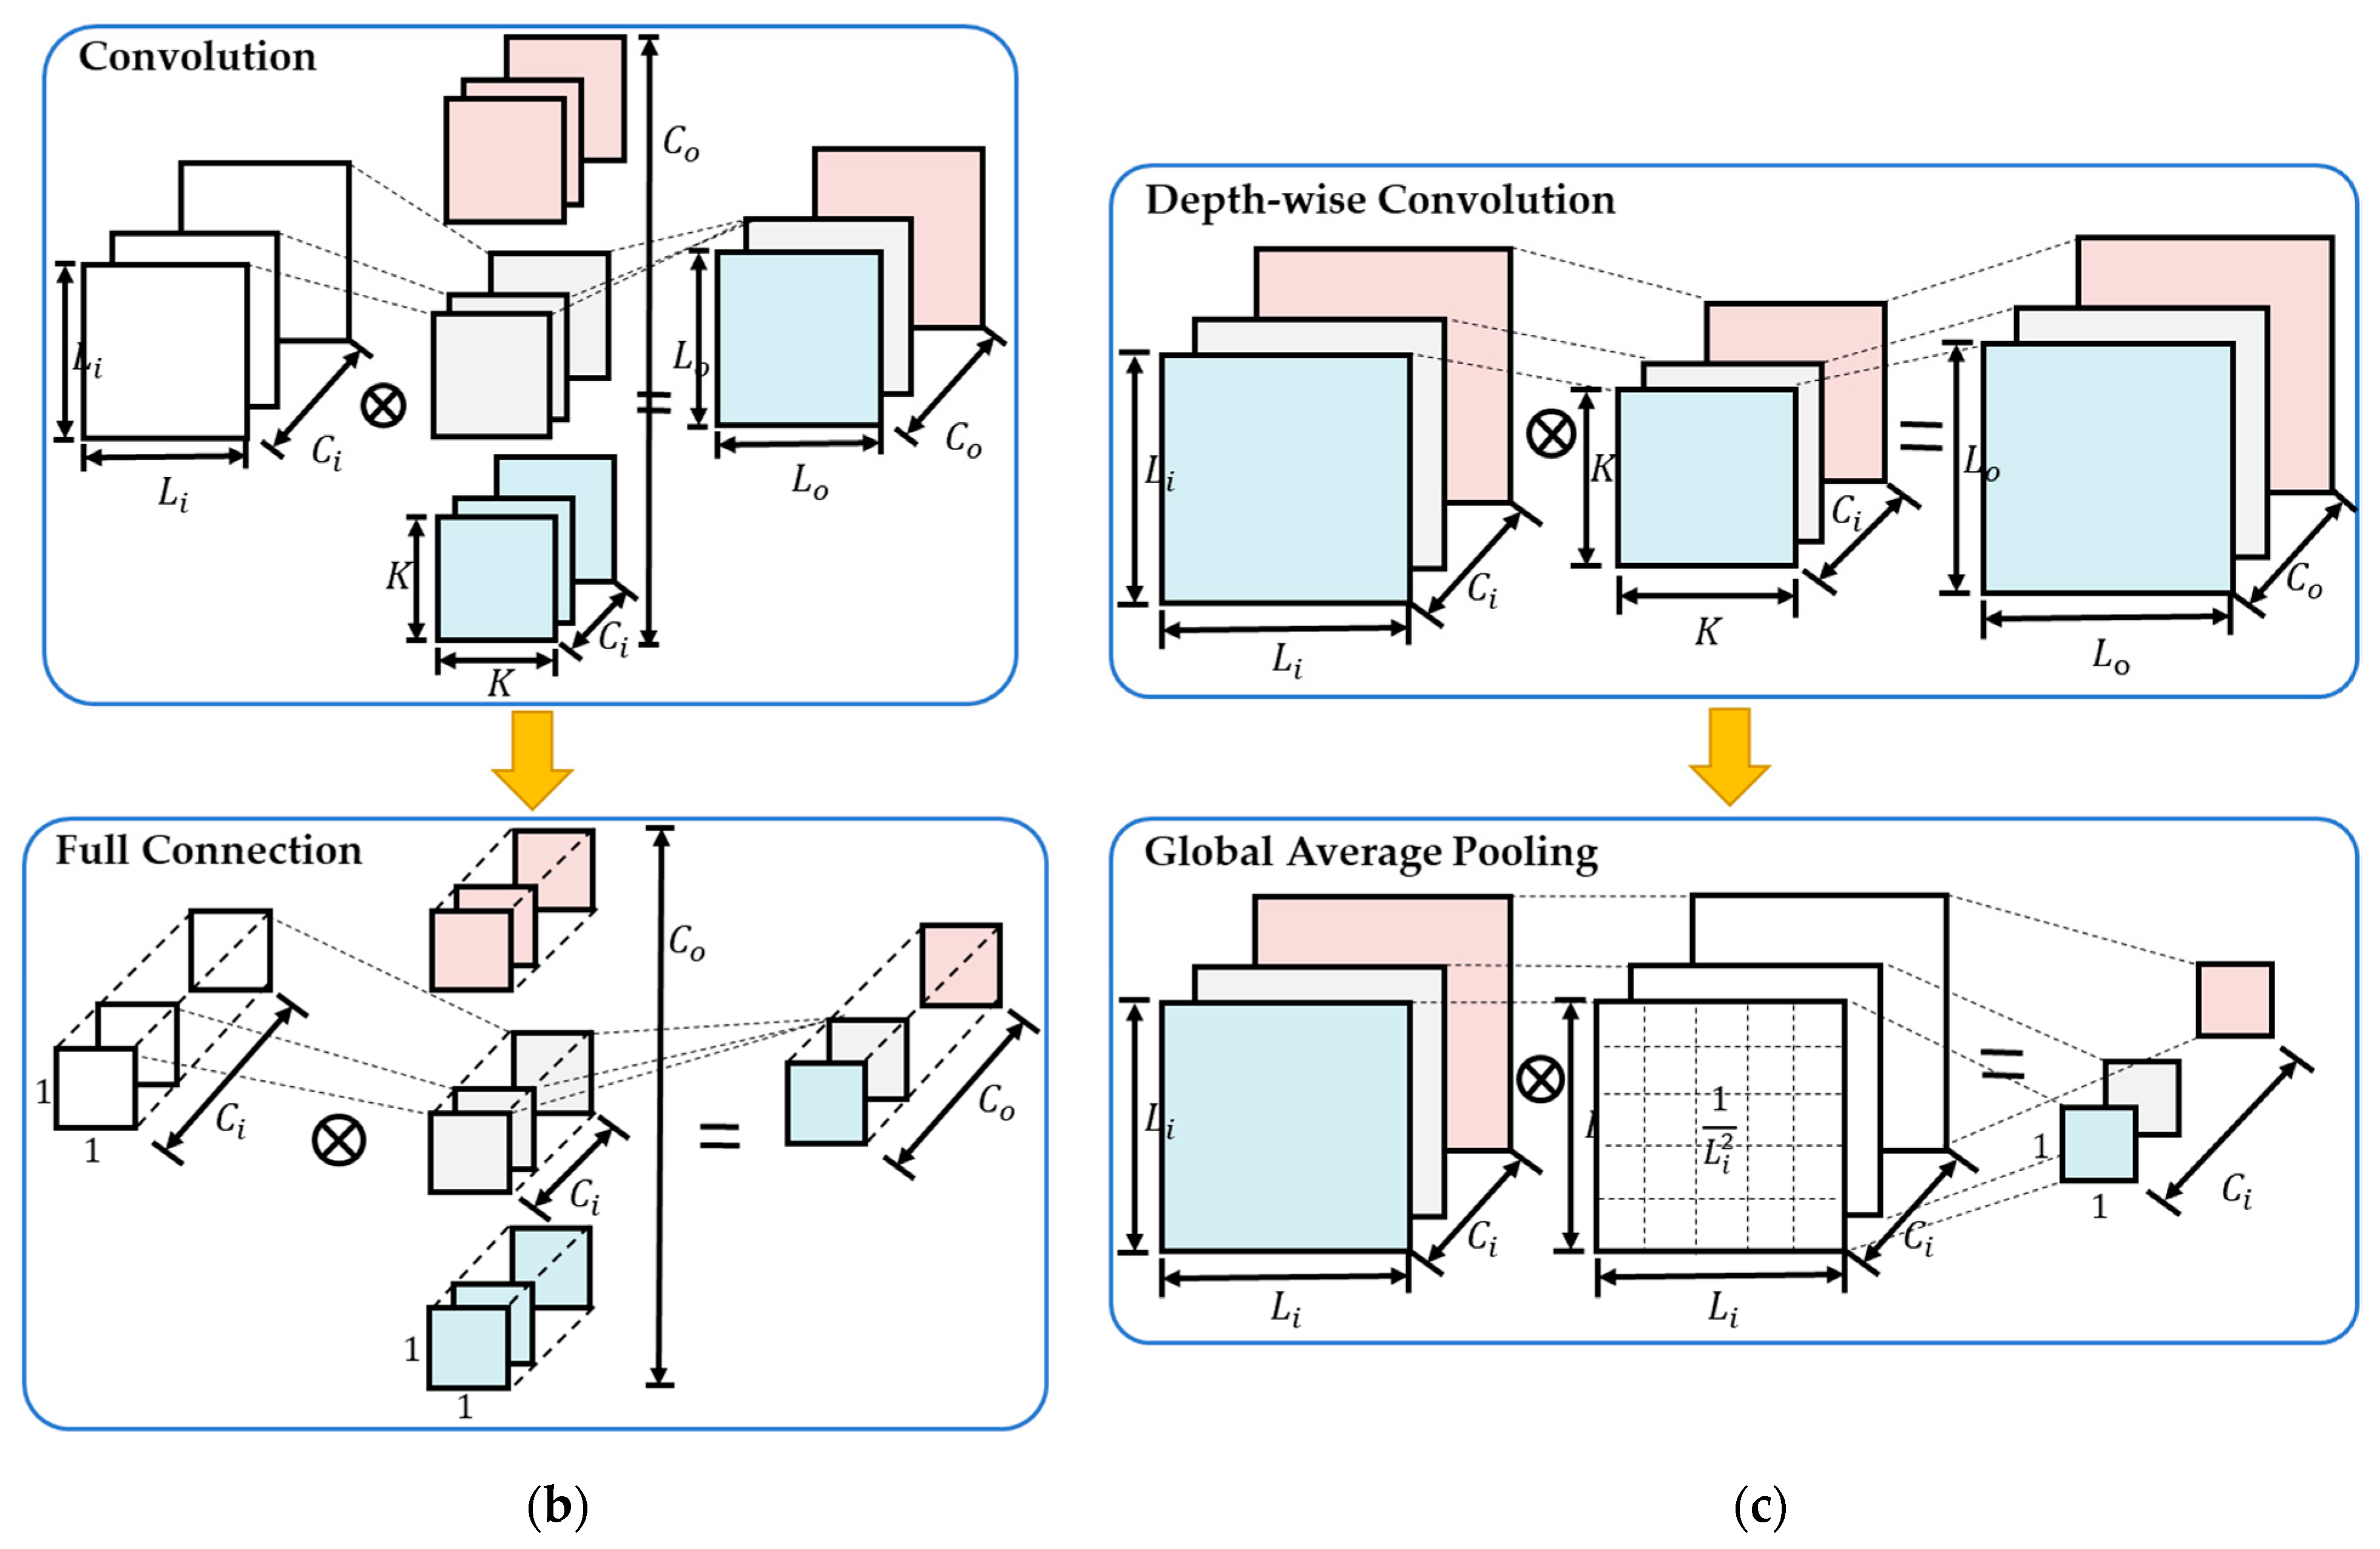
Based on Equation (1) and Equation (4), Equation (4) can be considered as a simplified version of Equation (1). Specifically, when S = 1 ,   P = 0 ,   K = 1 , and L i = 1 in Equation (1), Equation (1) reduces to Equation (4). Therefore, the fully connected operation can be regarded as a specialized variant of the convolution operation. In this specific convolution, both the length of the fmap and weight kernel are 1 × 1 . The number of input nodes in the fully connected layer is equivalent to the number of input channels in the convolution, while the number of output nodes corresponds to the number of output channels, as shown in Figure 4b. Consequently, convolution and fully connected operations can be implemented using the same structure.
Similarly, the GAP layer and the depth-wise convolutional layer can also be implemented using a unified structure. When the kernel size L of the depth-wise convolution is the same as the size K of the input fmap, setting the weight 1/ L 2 leads to the degeneration of the depth-wise convolution into a GAP layer, as shown in Figure 4c.
By fusing and unifying operations, the variety of model operations is reduced. This eliminates the necessity of developing separate modules for these operations within the hardware accelerator, reducing hardware resource consumption and decreasing system power consumption.

3.1.2. Depth-First Mapping Technique

As mentioned previously, achieving parallel acceleration of CNN on the FPGA platform entails several challenges, including addressing the limitations of on-chip storage and implementing convolutions with varying hyperparameters. Referring to Equation (1), the standard convolution operation primarily consists of six levels of loops, as demonstrated in Algorithm 1. The key to resolving these challenges lies in determining the optimal tile and unroll configurations for the convolution loops.
Algorithm 1: Standard convolution loops
for  c o = 0 ; c o < C o ; c o + + ;do
for  y = 0 ; y < L o ; y + + ;do
  for x = 0 ; x < L o ; x + + ;do
    for  c i = 0 ; c i < C i ; c i + + ;do
  for  v = 0 ; v < K ; v + + ;do
  for  u = 0 ; u < K ; u + + ;do
  out_fmap[ c o , x , y ] += in_fmap[ c i , x S + u , y S + v ] * weight[ c o , c i , u , v ]
In this paper, a depth-first mapping technique is proposed to optimize the convolution operation. This approach enables the tiling of the input fmap and kernel weight, thereby converting convolutions with different hyperparameters into a unified vector format. The depth-first mapping technique consists of loop tiling and loop unrolling, which will be elaborated on as follows:
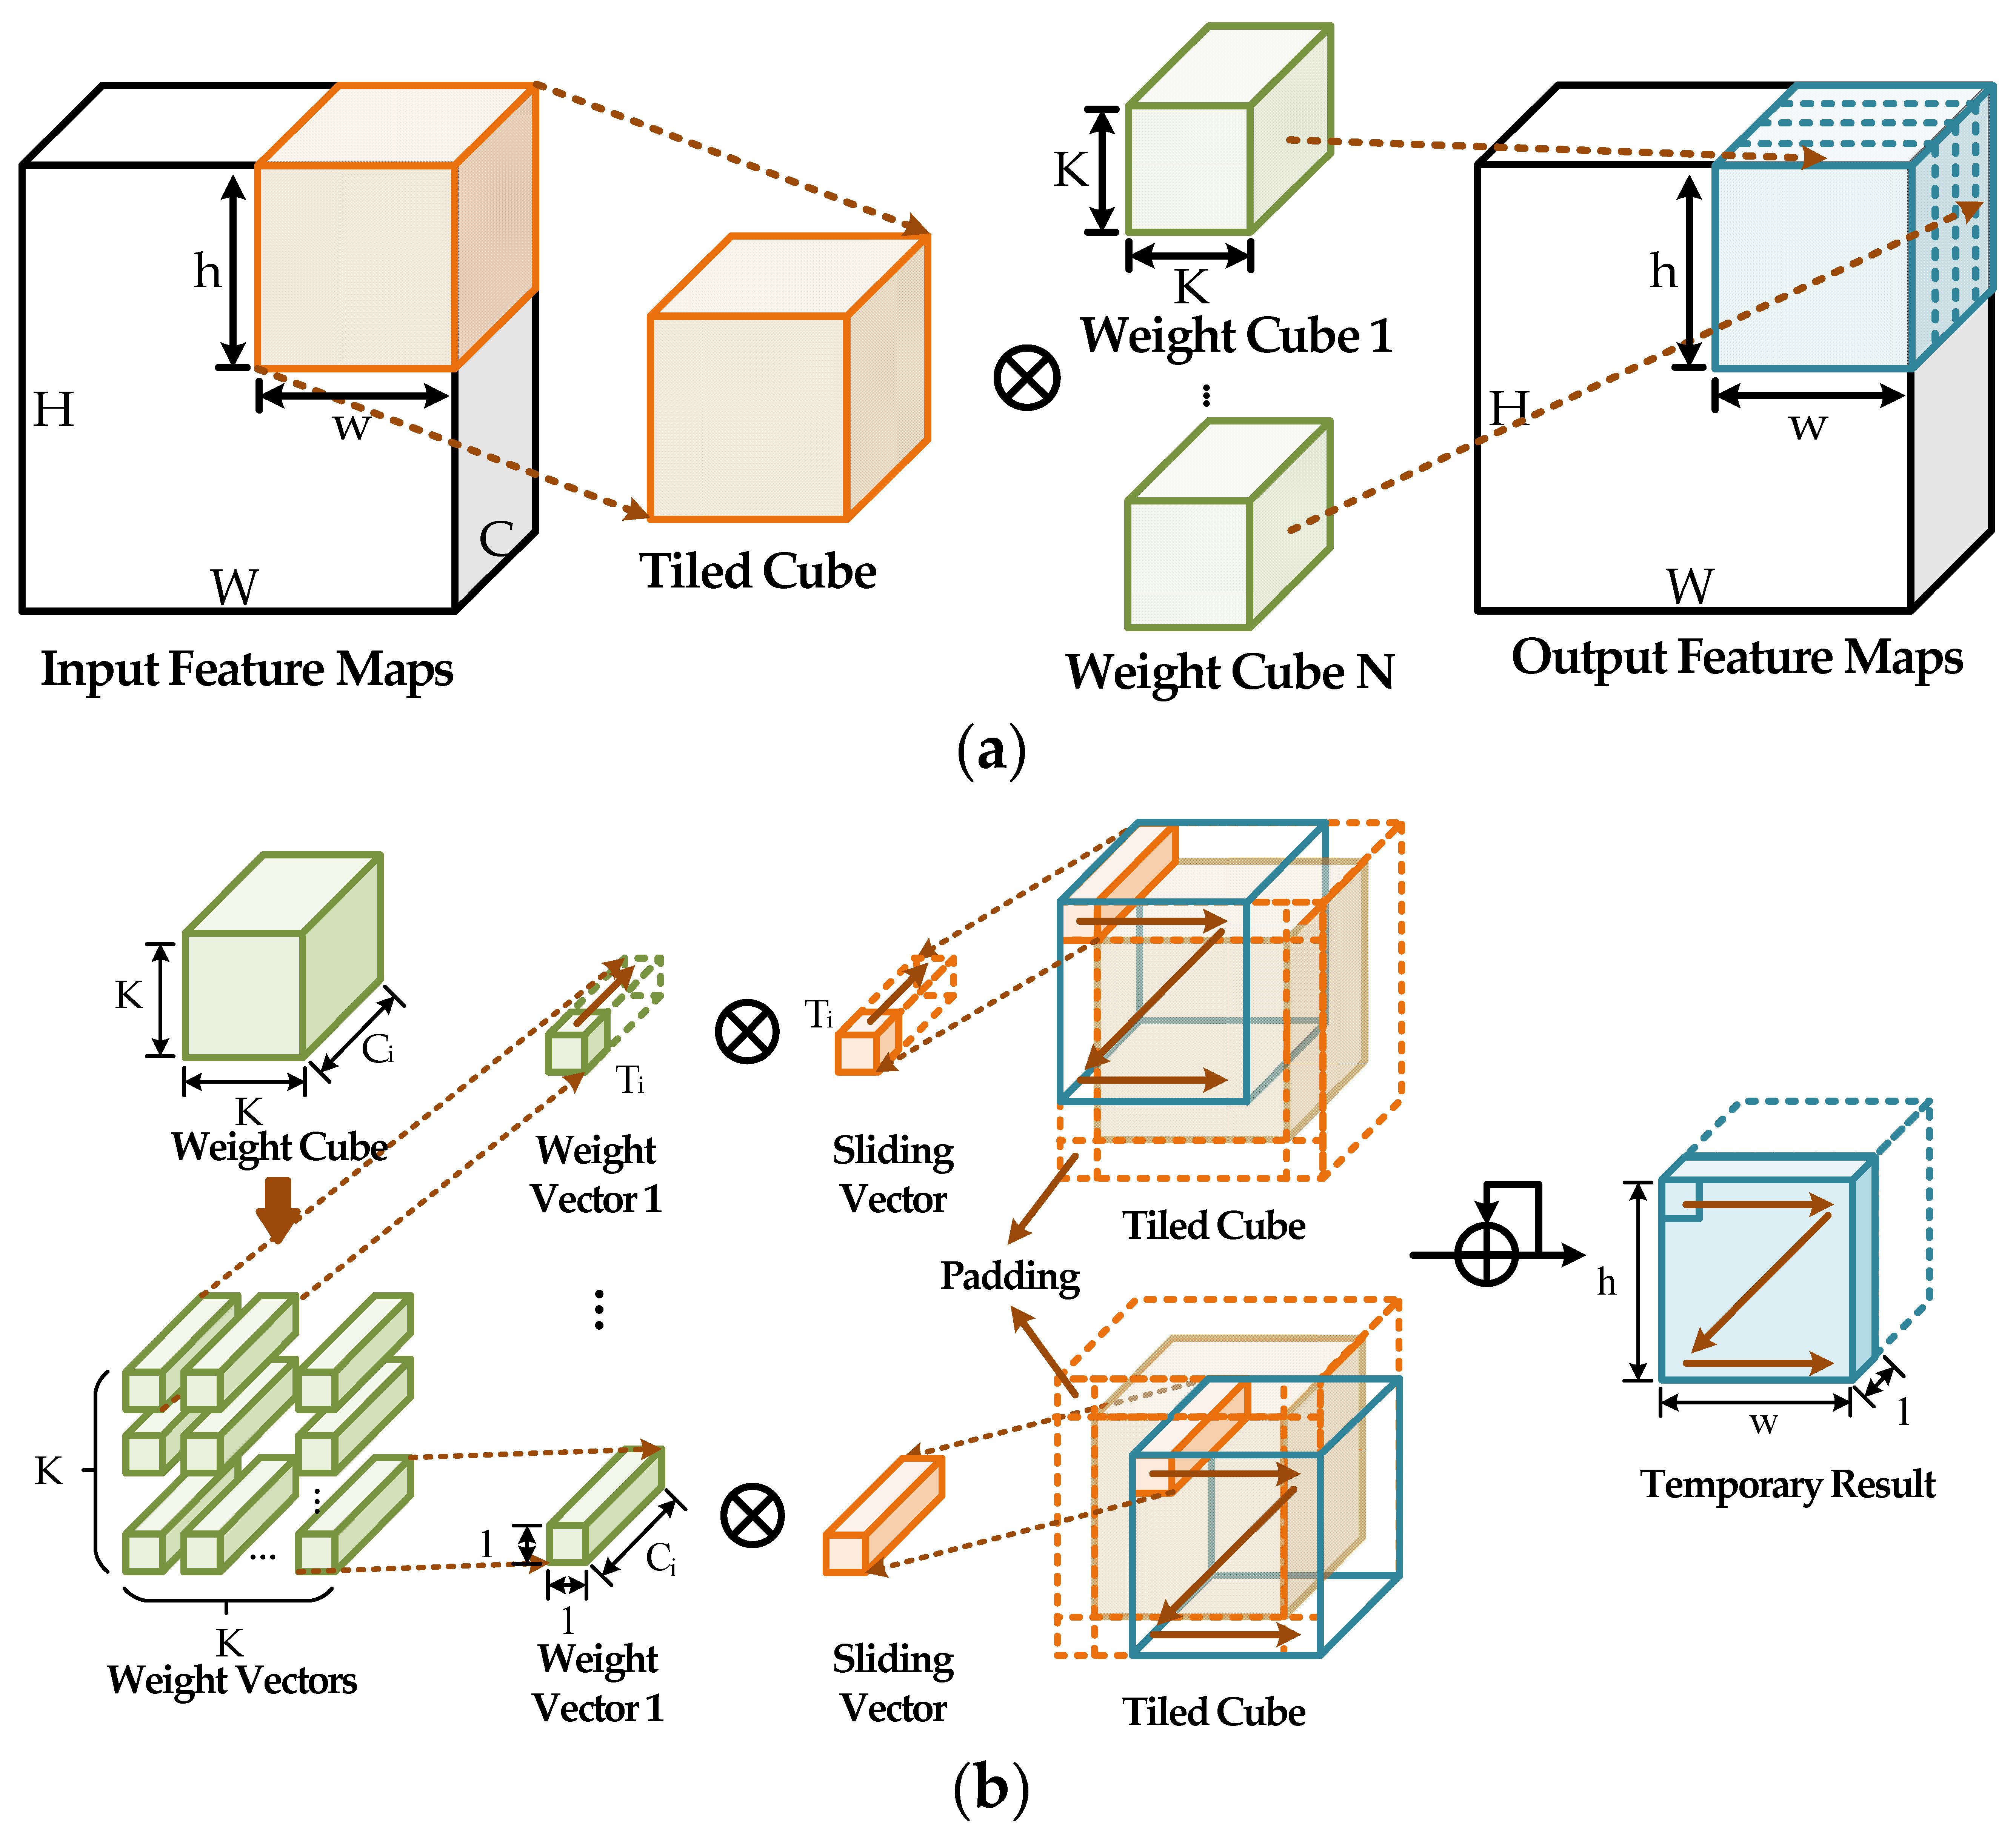
Loop tiling is a technique employed to address convolutions involving large-scale input fmaps or weights. It divides the convolutions into multiple smaller steps, enabling the on-chip storage to accommodate the fmap and weight components of each step. Figure 5a illustrates the process of loop tiling. Initially, a h × w × C i input tiled cube is cropped from the L i × L i × C i input fmap. Simultaneously, T o weight cubes are retrieved from memory, with each cube consisting of K × K × C i weight data. The input tiled cube is convolved with these weight cubes each time to produce T o output sub-fmaps of size h × w (with paddings). These T o computations are processed in parallel and stored in buffers for subsequent data rearrangement. Then, new T o weight cubes are fetched and convolved with the input tiled cube, producing additional T o channels of output fmaps. This process repeats N o = C 0 / T o times until all C o output channels have been computed. The values of h , w , and T o depend on the storage capacity of the designed buffer, which can be reconfigured to accommodate convolutions with varying hyperparameters.
The generation of h × w × T o tiled output fmaps is called a tile pass. For the subsequent computation, the tiled cube is first shifted w pixels toward the end of the input width with overlapping (for paddings). The new tiled cube is convoluted with the entire weights to generate a new tiled output fmap. After sliding on the width of input fmaps, the tiled cube shifts down by h rows. Then, the process mentioned above is repeated. To finish a tile pass, the entire weights of the convolutional layer are accessed from the memory. After W / w × H / h tile passes, the desired output fmap of the convolution is obtained. Therefore, to complete the calculation of the entire convolutional layer, the weights are read W / w × H / h times, while the input fmaps need to be read only once.
Loop unrolling optimizes loop operation between the tiled cube and the weight cube. Figure 5b shows the process of loop unrolling. The K × K × C i weight cube is split into K 2 weight vectors, each of size 1 × 1 × C i along the height and width dimensions. The blue cube within the padded tiled cube represents the corresponding fmaps that will be computed with the weight vector. The 1 × 1 × C i sliding vector comprises pixels from the same position across different C i channels within the corresponding tiled cube. By calculating the inner product between the sliding vector and weight vector, a one-pixel temporary result is generated. The C i multiply–accumulate operations in the inner product can be processed in parallel to accelerate the calculations. However, in deep CNN layers, the number of channels, C i , can be large, making it challenging to execute large-size inner products in parallel. To overcome this issue, the vectors are divided into several parts of length T i to perform small inner products. The resulting N i = C i / T i partial outputs are then accumulated to generate the one-pixel temporary result. The sliding vector slides along the width and height of the corresponding cube, generating h × w temporary results that are stored in the buffer. In the subsequent computation, a new weight vector is fetched and calculated with the corresponding sliding vector. The inner product outputs are accumulated with the corresponding values from the buffer and saved in the same position in the buffer. This operation is performed K 2 times to generate the final output tiled fmaps. Notably, for the zero padding operation, a zero vector is used as the sliding vector.
Through loop tiling and loop unrolling based on the depth-first mapping technology, various hyperparameter convolution operations, such as kernel sizes of 3 × 3 , 5 × 5 , and 7 × 7 , are converted into a unified form for hardware implementation, enhancing the versatility of the accelerator. Notably, no additional hardware resource overhead is required, resulting in reduced system power consumption and improved energy efficiency.

3.2. The Proposed Accelerator Architecture

This section presents the overall architecture of the proposed accelerator and provides detailed descriptions of the neural network processing unit and the multi-level storage structure.

3.2.1. Overall Architecture of the Proposed Accelerator

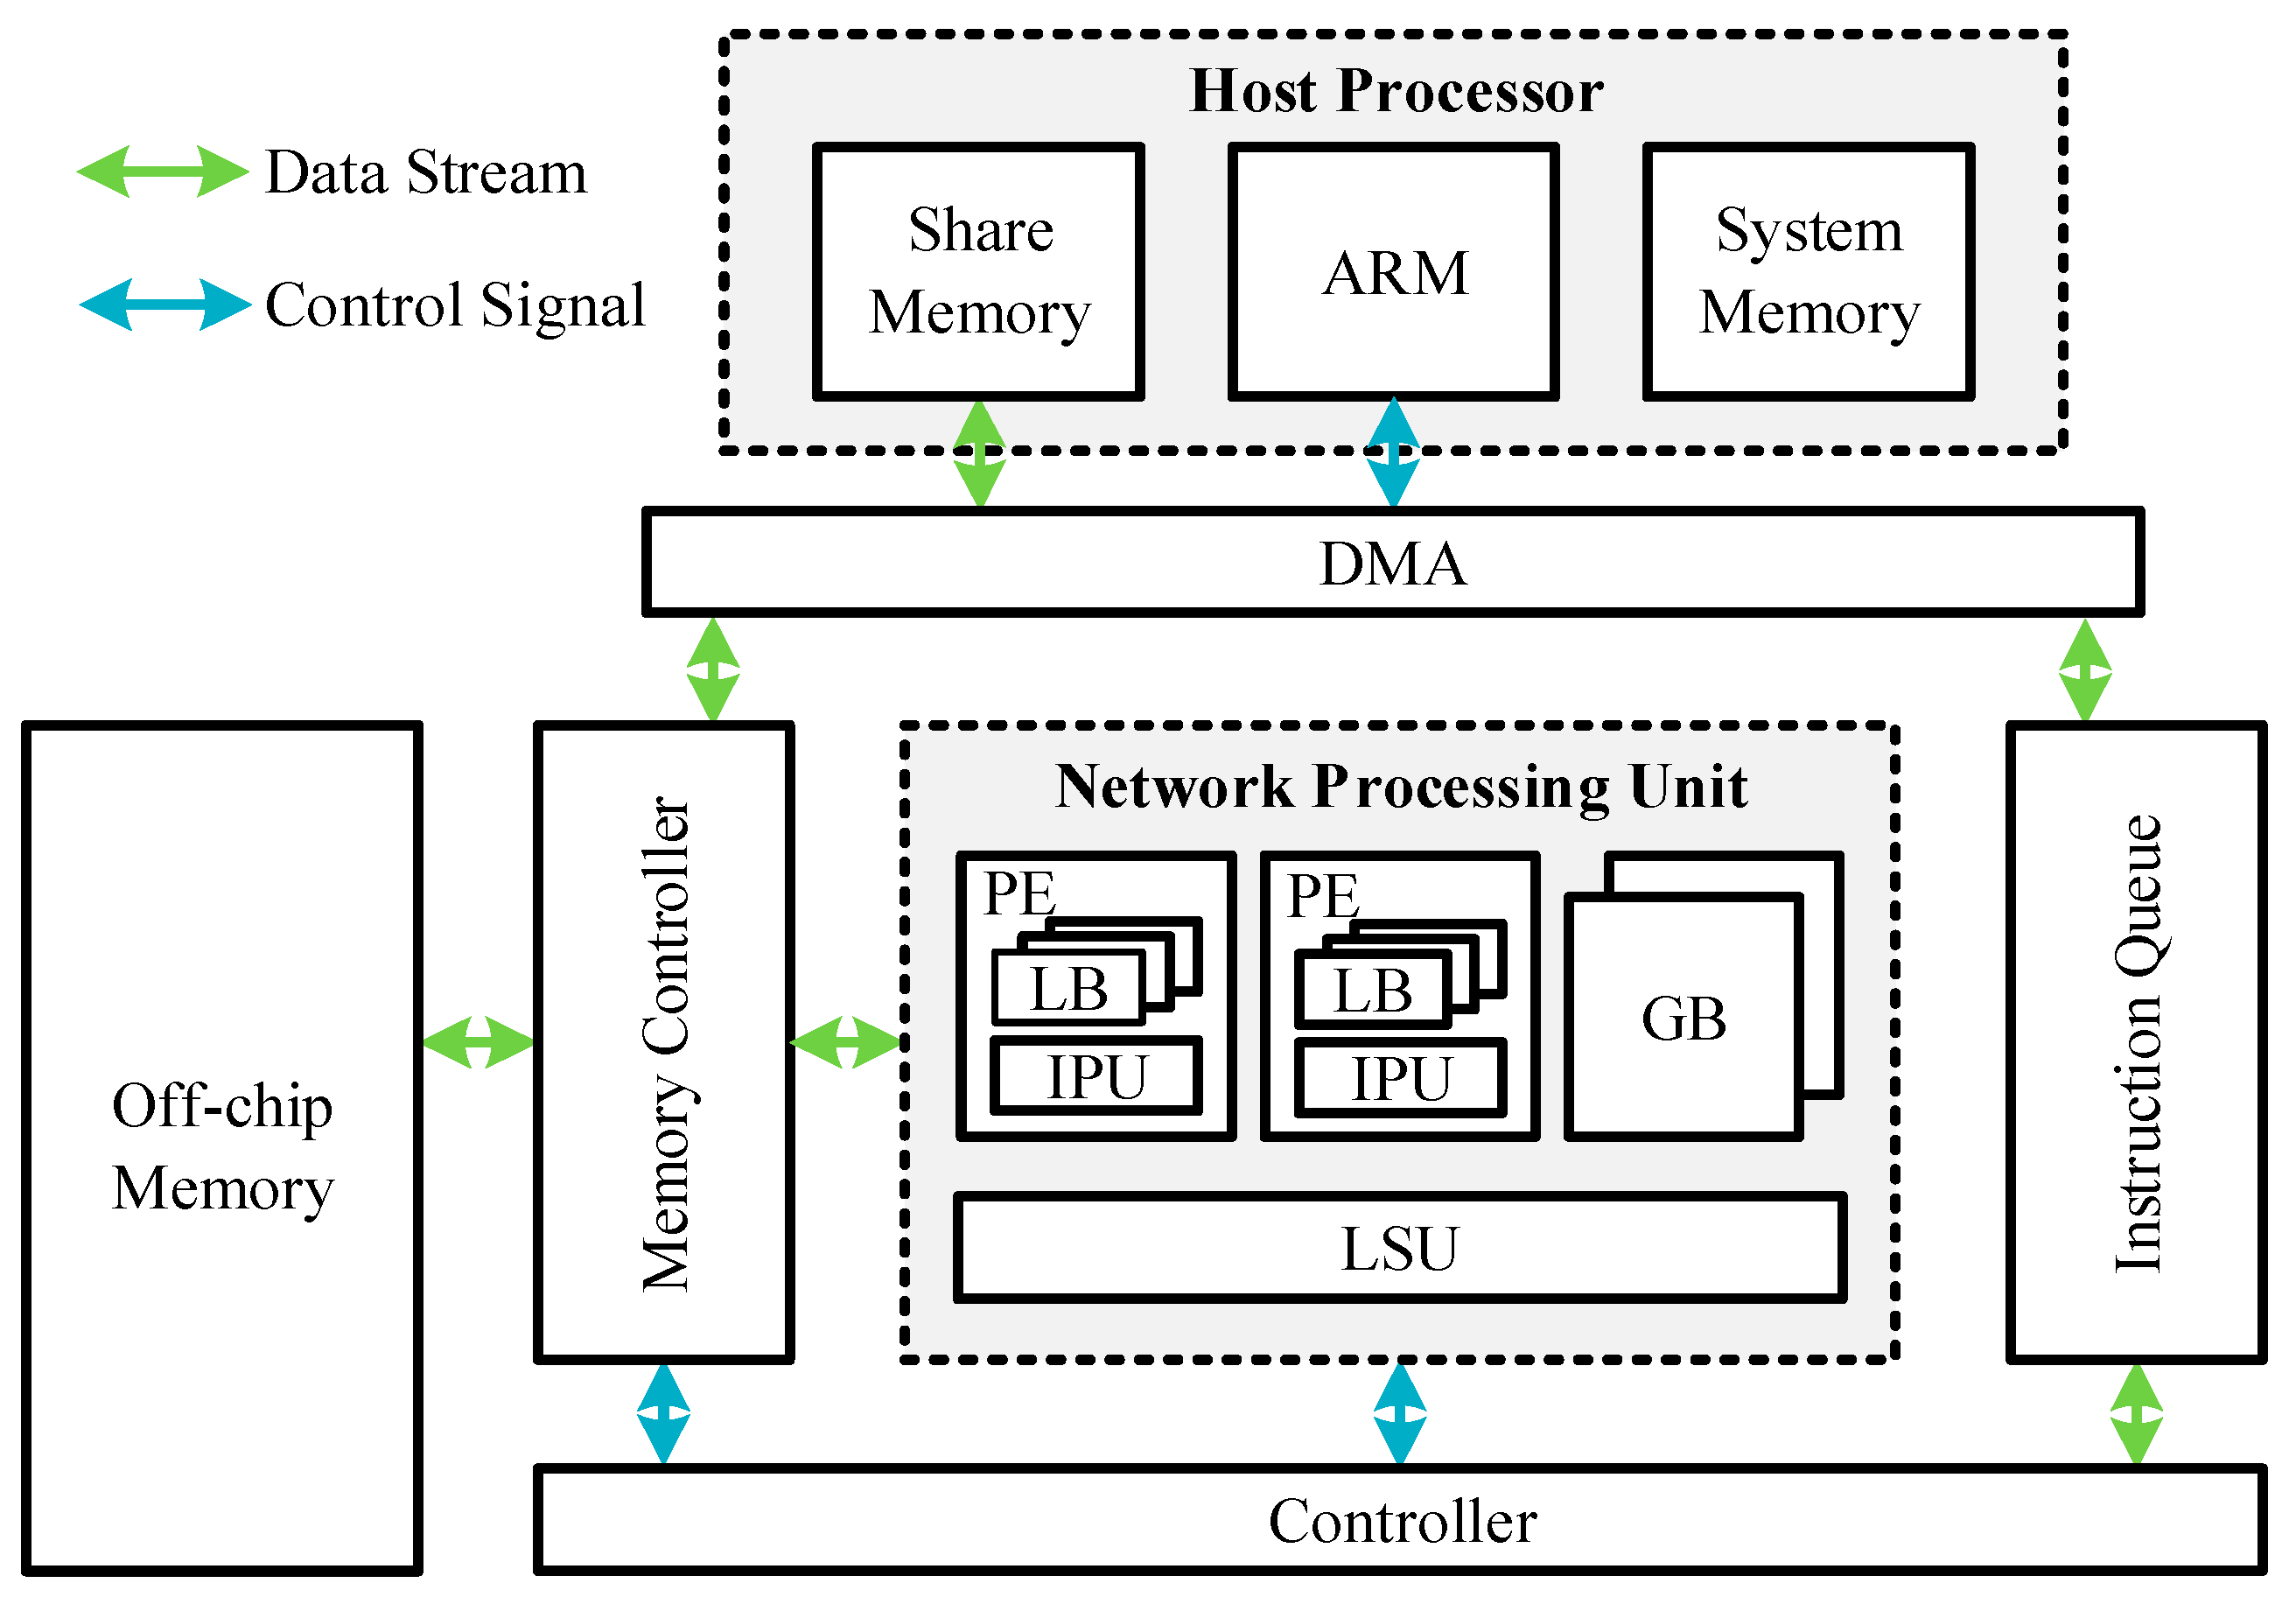
Figure 6 illustrates the block diagram of the proposed accelerator’s overall architecture. The host processor comprises an ARM processor, system memory, and shared memory. The ARM processor is responsible for controlling the entire system and performing post-processing tasks. The shared memory stores three types of data: trained CNN models, input images to be processed, and hardware instructions. A direct memory access (DMA) unit is employed to facilitate data transfers. At the beginning of the inference process, the weights and input images are loaded into off-chip memory, and the instructions are transmitted to the instruction queue via DMA. The controller fetches these instructions from the instruction queue and generates control signals to manage the Network Processing Unit (NPU). Once the NPU completes the CNN calculations, the final results are moved to the host processor for post-processing via DMA.
The NPU is designed to accelerate CNN calculations and consists of two global buffers (GBs), a processing engine (PE) array, and a load and store unit (LSU). The GBs are used to store the input fmaps and output fmaps, respectively. Implemented with the on-chip memories, the GBs maximize data reuse and minimize off-chip memory accesses. Each PE in the PE array consists of multiple local buffers (LBs) and an inner-product unit (IPU). The LBs serve as storage for weights and temporary results, while the IPU is responsible for implementing convolution operations. The IPU is optimized using the methods described in Section 3.1. The inference processes involve substantial amounts of data loading from and writing back to off-chip memory. To fulfill these requirements, the LSU is designed as a high-bandwidth data channel. The LSU retrieves input fmaps and weights from off-chip memory and stores them in buffers. During the calculations performed by the PE array, the LSU rearranges the data into a suitable format and provides the processed data to the PE array. After the calculations are finalized, the LSU collects the result of each PE within the PE array and sends them to the off-chip memory.

3.2.2. Network Processing Unit

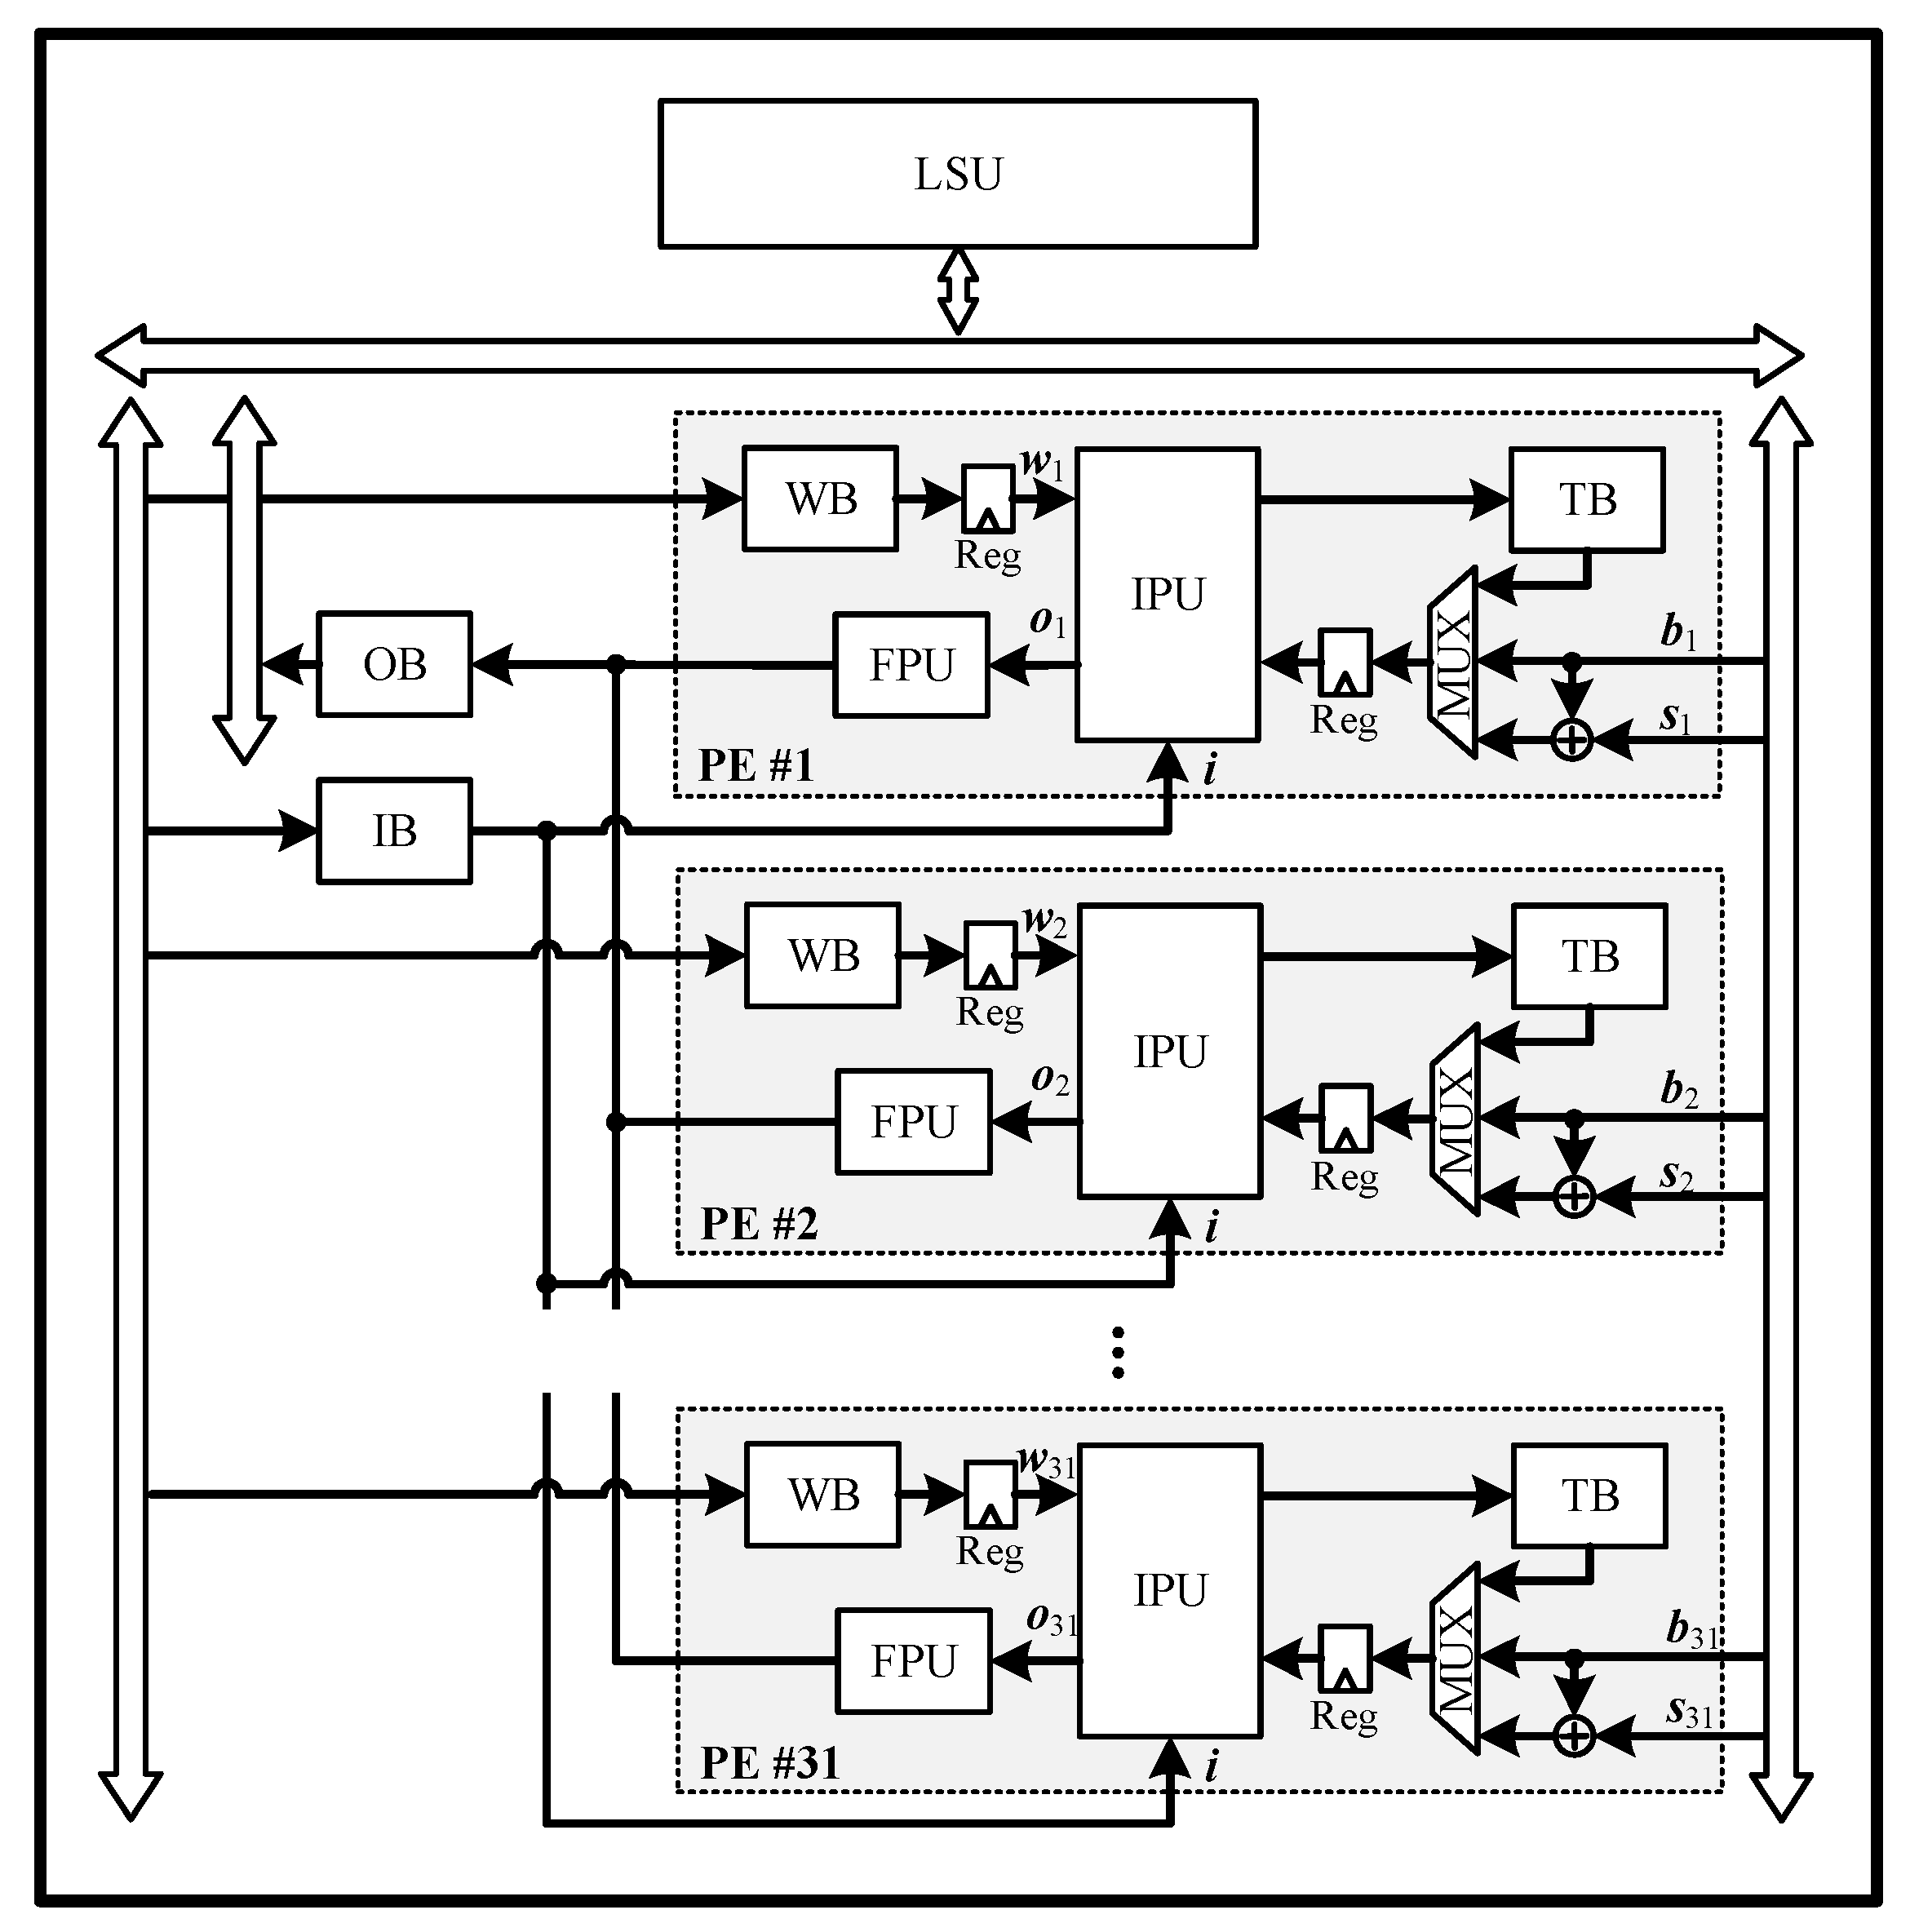
The structure of the NPU is illustrated in Figure 7. The NPU consists of a PE array comprising 32 PEs. Each PE is equipped with a weight buffer (WB) that stores weights for different output channels and supplies them to the IPU. The input fmaps stored in the input buffer (IB) are broadcasted to the IPU in each PE. Leveraging the input fmaps and weights, the PE array simultaneously generates 32-channel output fmaps through parallel inner-product computations. During this process, the intermediate results are written into the temporary buffer (TB). To deal with the bias addition in a convolutional layer or a shortcut in a residual block, a 3-to-1 multiplexer is employed to drive the third input of the IPU in each PE. The multiplexer selects one among the temporary results, a bias, and the sum of the bias and the residual connection. Specifically, the output of the TB is chosen to accumulate the temporary results during the convolution computation, except for the first calculation. The bias and the sum are selected during the initial calculation of a convolutional layer and a convolutional layer with a residual connection, respectively. For the large-scale convolutional layer, the data in the TB is repeatedly read to the IPU and accumulated with the new inner product result. Once all the required accumulations by the TB are completed, the 32-bit fixed-point convolutional results are passed to the floating-point unit (FPU).
The FPU is designed to implement the DQ-BN layer and Q-LReLU layer, as proposed in Section 3.1. Initially, the 32-bit convolution results are converted into 32-bit floating-point data. According to the layer fusion equation described in Figure 4a, the DQ-BN layer involves one floating-point multiplication and addition, while the Q-LReLU layer requires one gating and one floating-point multiplication. Finally, the FPU converts the floating-point result to an 8-bit fixed-point result, which is then outputted. The 8-bit final results are stored in the output buffer (OB) for reordering and subsequently written to off-chip memory in depth-first order by the LSU. These results are saved as the input fmaps for the next convolutional layer.
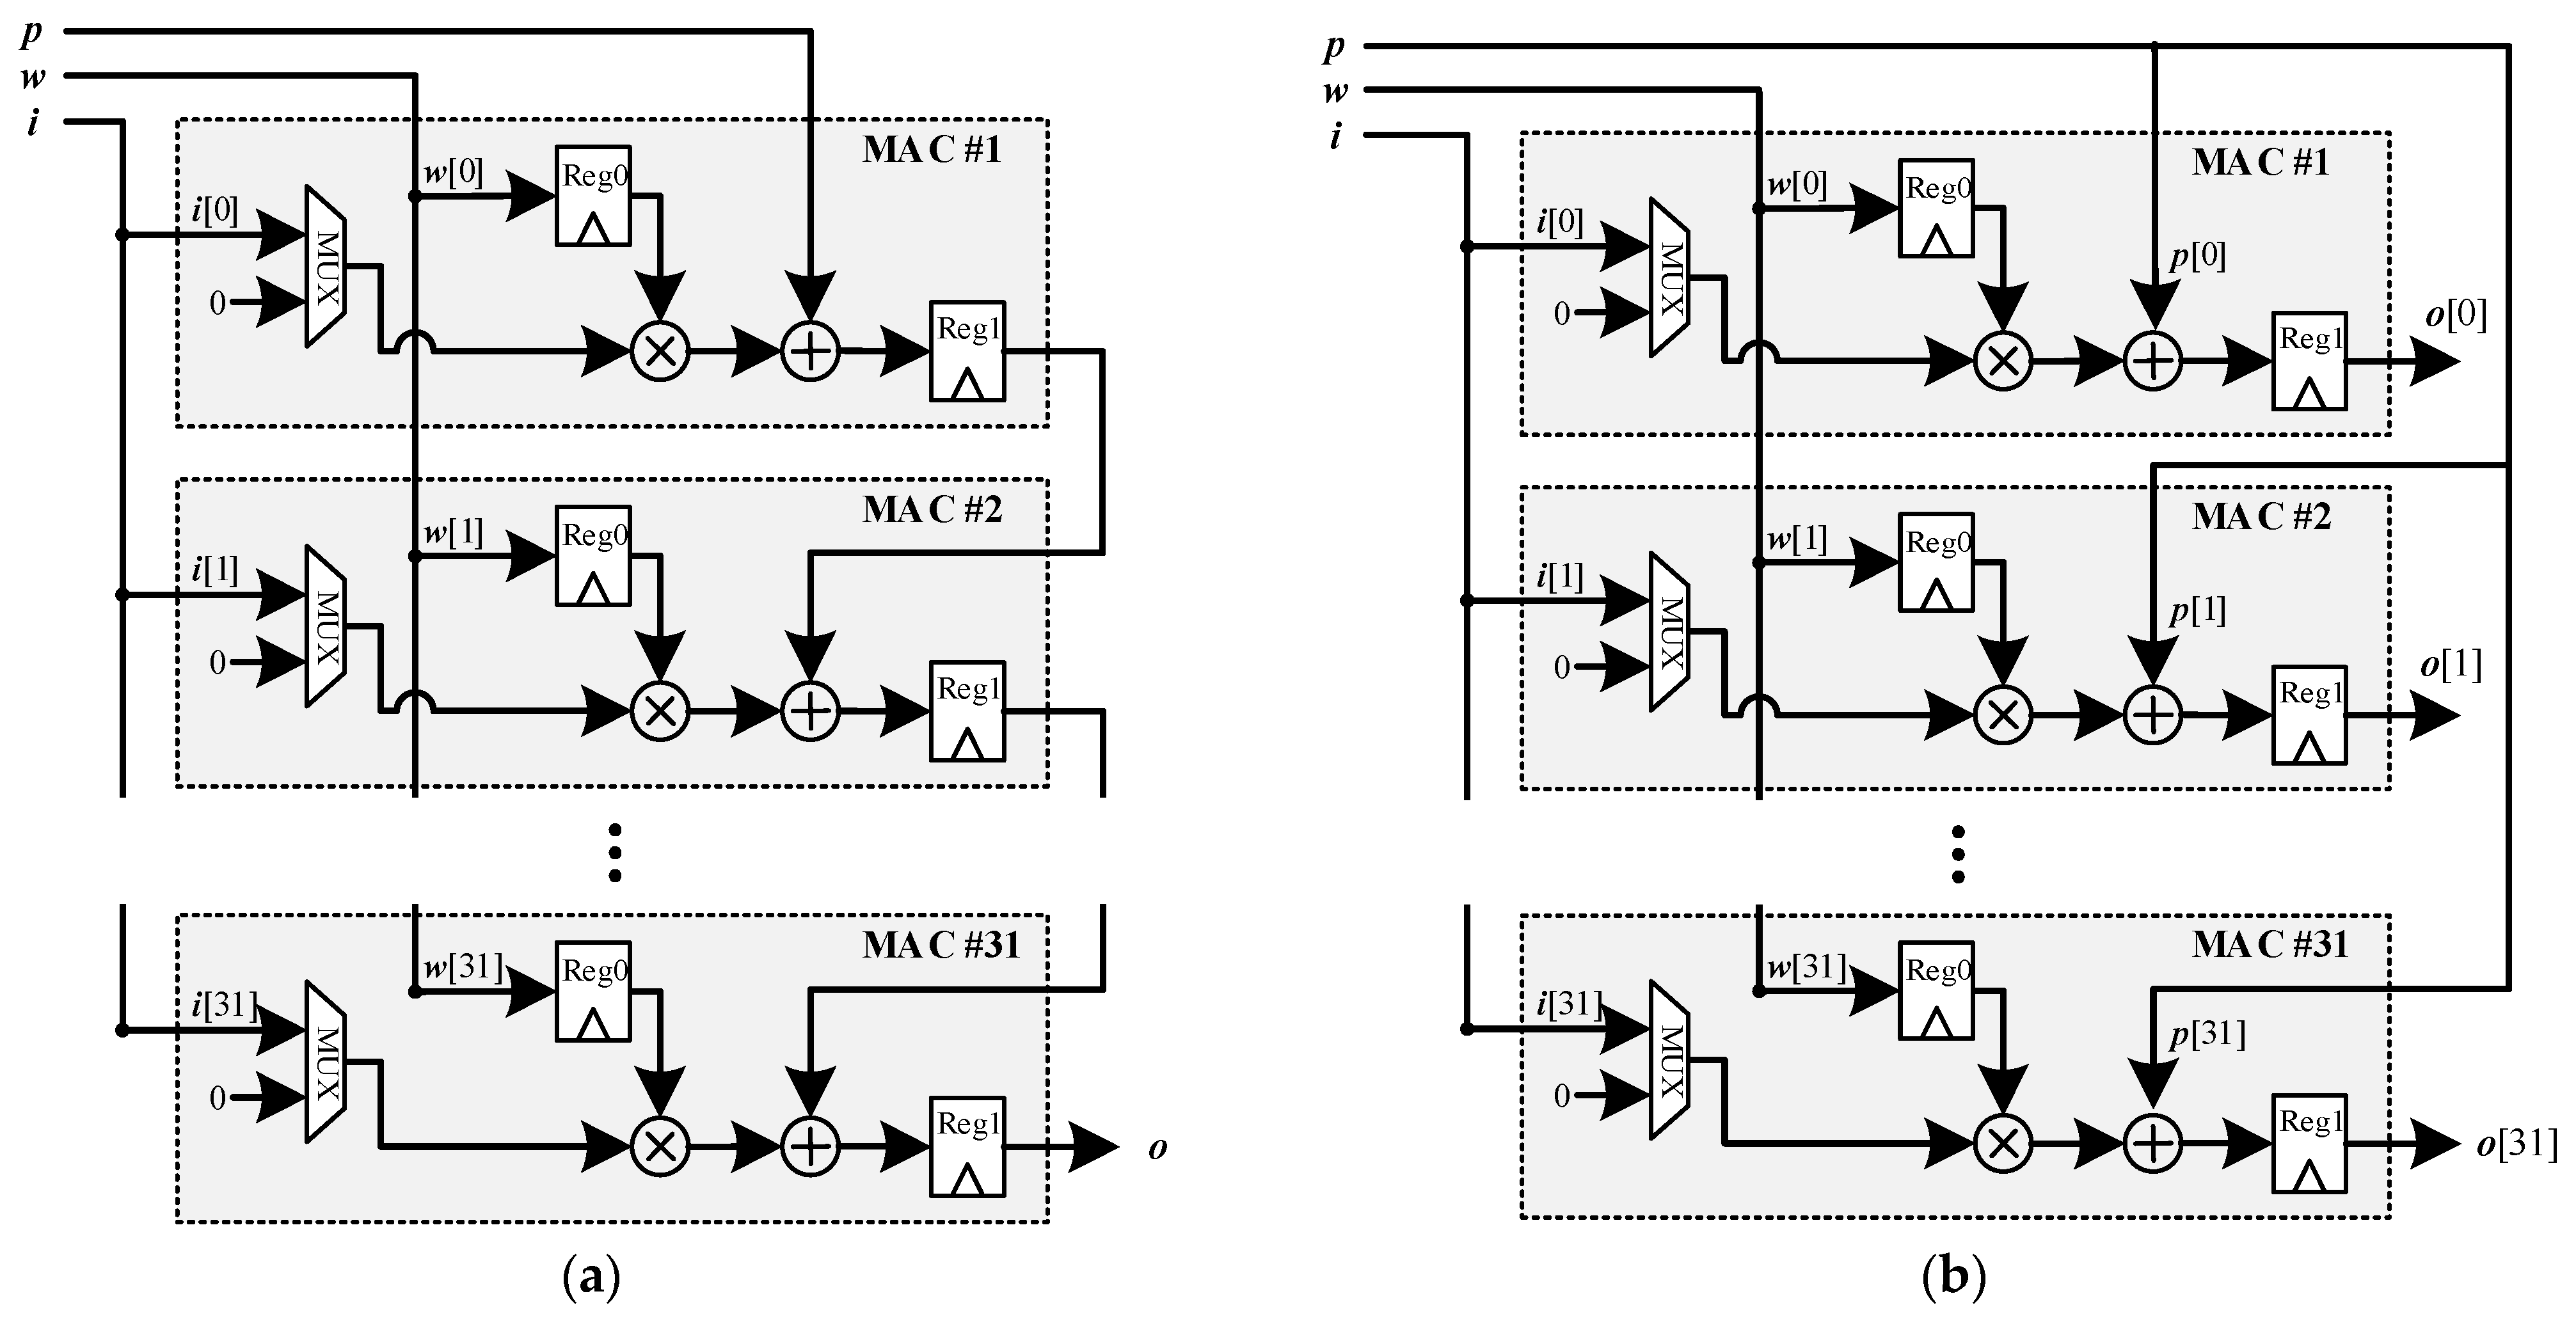
Figure 8a shows the structure of the IPU, which performs the inner product in a pipeline fashion. Each IPU contains 32 multiply–accumulate (MAC) units to support the vector inner product with a maximum length of 32. The input and weight vectors are split into 32 parts and processed by the MAC units. In each MAC unit, the input value is multiplied by the weight and added to a partial sum. The partial sum is the inner product of the previous MAC unit, except for the first MAC unit, which receives the output of the 3-to-1 MUX in each PE in Figure 7. Additionally, the 2-to-1 multiplexer in each MAC unit facilitates zero padding.
To analyze the processing cycle of the IPU, we examine a K × K convolutional layer with an h × w × C i input fmap size. The input vectors are continuously fed into the IPU every cycle, while the weight vector remains unchanged. After generating an h × w temporary result, a new weight vector is loaded into the IPU, and the same operation is repeated K × K times. This step represents the basic process of the IPU. When the number of input channels C i is less than 32, only one basic process is required for the convolutional layer calculation. However, if C i 32 , the calculation can be divided into C i / 32 basic processes using the loop unrolling method described in Section 3.1. Thus, the total number of clock cycles required to generate an h × w output fmap is h × w × K × K × C i / 32 .
The IPU also supports depth-wise convolutional layers, with a slight modification in the process. The IPU needs to be switched to the depth-wise mode, where the result of one MAC unit is directly output instead of being used as the following input partial sum, as shown in Figure 8b. In this case, only one MAC unit in the IPU is utilized, as several MUX units are consumed to support the two modes. For a depth-wise convolutional layer, the IPU requires h × w × K × K clock cycles to create an h × w output fmap.
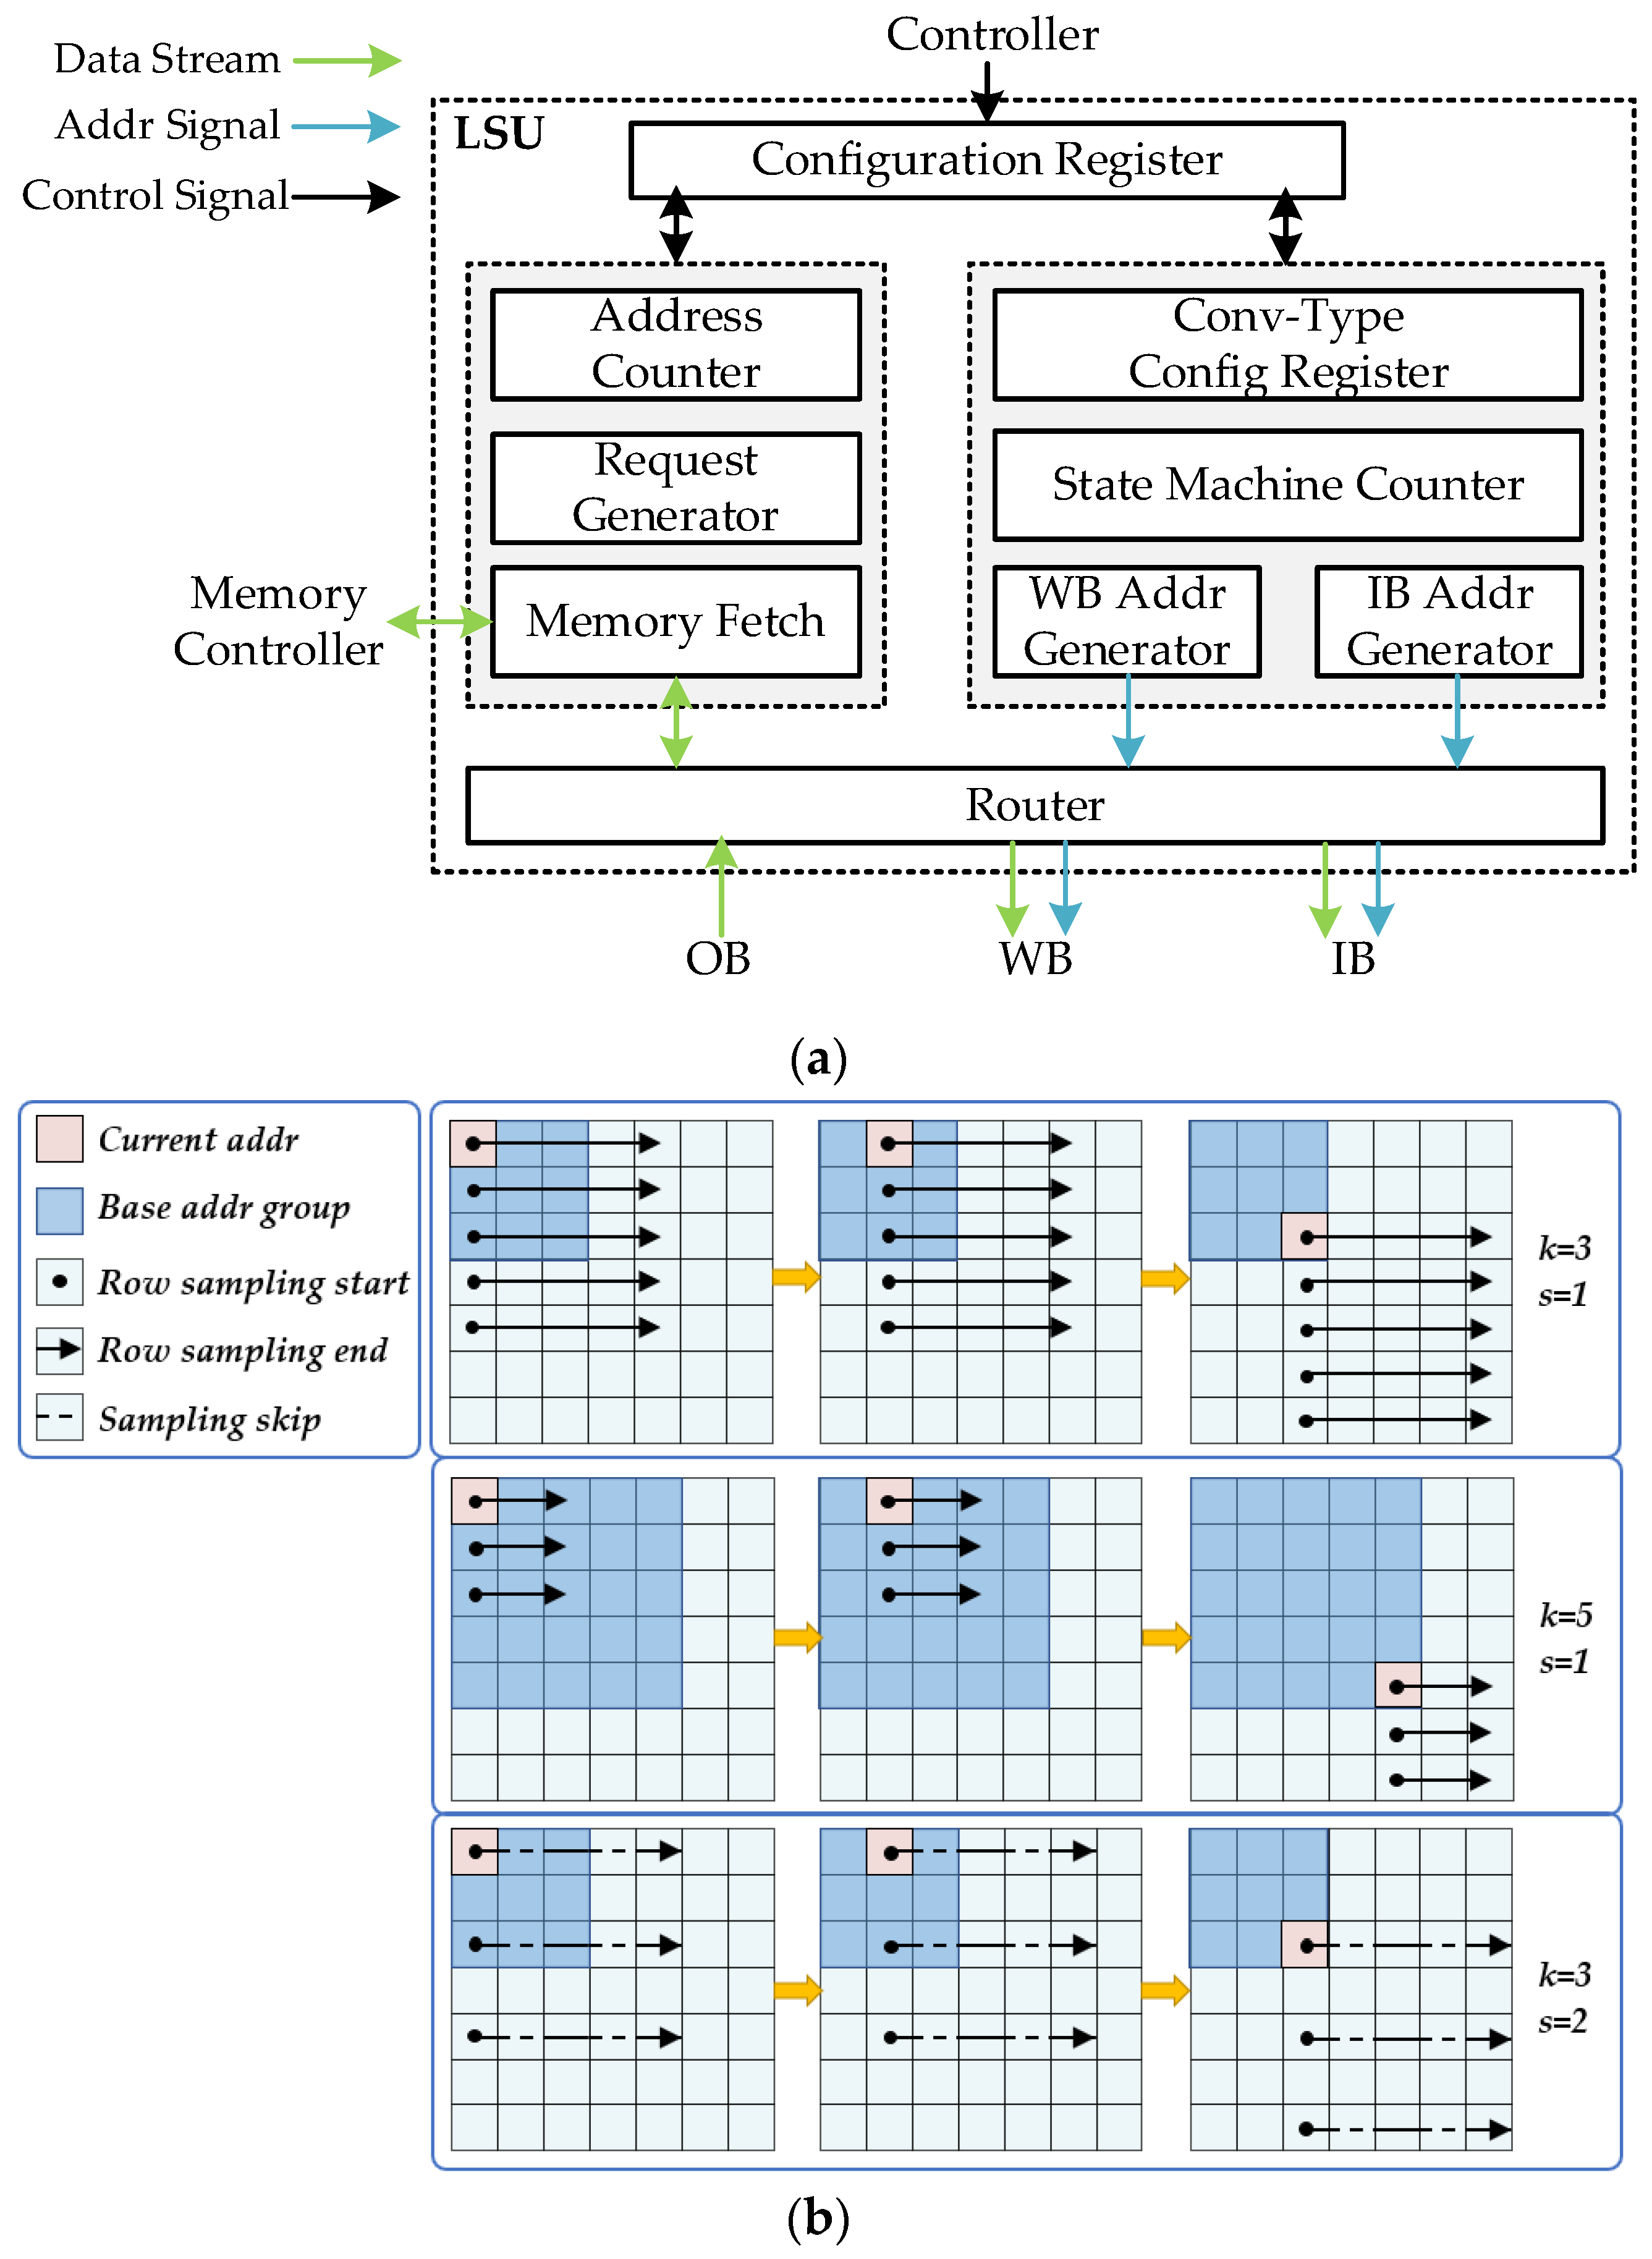
The structure of the LSU is shown in Figure 9a. The configuration register within the LSU is controlled by the system controller based on instructions. Before calculation, the LSU sends requests to the memory controller to read data from off-chip memory, with the address being generated by the address counter. The input fmaps and weights are read from off-chip memory through the high-bandwidth data channel and written into the PE’s input buffer and weight buffer through the router. Once the computation is complete, the LSU retrieves the results from the output buffer and writes them back to the off-chip memory in the same way. During computing, the LSU dynamically generates the addresses for the weight buffer and input buffer in real-time using a state machine counter based on the internal conv-type register. The corresponding data from the input buffer and weight buffer is then sent to the IPU for vector inner-product operations.
To illustrate the address generation rule for the input buffer, the example considers standard convolution with different hyperparameters of stride S and kernel size K . The address generation process is depicted in Figure 9b, focusing on the two dimensions ( H and W ) of the feature map. Each point represents the data of all channels at the same position. Before the convolution starts, the state machine generates a base address group based on the conv-type register, represented by the blue block in the figure. Subsequently, the IB address generator uses the first base address as the current address and traverses the data based on the conv-type hyperparameters to generate the IB read address. The black arrows in Figure 9b indicate the starting and ending positions of each row traversal. When the C o of the weight exceeds 32, the traversal needs to be repeated C o / 32 times. Once the traversal of a base address is completed, the generator switches to the following base address until all base address groups have been processed. It should be noted that the conv-type register contains not only S and K hyperparameters but also C i , C o , P , and flags for depth-wise convolution and shortcuts, ensuring compatibility with various convolution situations.

3.2.3. Multi-Level Storage Structure

The accelerator system is designed with a multi-level storage structure, which includes shared memory, off-chip memory, two global buffers (input buffer and output buffer), multiple weight buffers, and temporary buffers.
The shared memory is implemented as an off-chip ROM, which stores the trained CNN models, the input images, and the hardware instructions. It ensures that the data will not be lost due to power outages. During the inference process, the weights and input images are loaded into the off-chip memory, which consists of two independent DDRs (DDRA and DDRB). To avoid access conflicts while reading the input fmaps and writing the output fmaps, a ping-pong storage strategy is employed. Specifically, when the neural network’s inference proceeds to the n th layer, the system reads the results of the previous layer from DDRA as the input fmap while storing the output fmap in DDRB. This arrangement is swapped when processing the ( n + 1 ) th layer. Similarly, to enable independent reading of the input fmaps and weights simultaneously, a hierarchical alternating storage strategy is adopted for the weights. DDRA stores the weights of the even layers, while DDRB stores the weights of the odd layers.
In the proposed NPU architecture, the convolution, BN, and activation operations are pipelined. To execute a CONV-BN-ACTIV pipeline operation, the system requires not only the convolution kernel weight but also the convolution bias, BN parameters, and activation parameters. Additionally, it is essential to note that the off-chip utilizes burst transfer mode, where reading data at consecutive addresses is faster than at non-consecutive addresses. Therefore, based on the alternating storage weight strategy, the convolution kernel bias, BN parameters, and activation parameters are inserted into the convolution weight data at intervals of 32 channels, as shown in Figure 10. This arrangement enables all data read from the off-chip memory in a pipeline operation to have continuous addresses. Moreover, storing parameters in units of 32 channels aligns with the parallelism of the NPU, ensuring efficient pipeline processing of the system.
A global input buffer and 32 weight buffers store the input fmaps and weights required for on-chip calculations. According to the depth-first mapping technology described in Section 3.1.2, each on-chip calculation accesses an h × w × C i -sized input tiled cube and T 0 weight cubes from the off-chip memory. Each weight cube consists of K × K × C i weight data. In the designed accelerator architecture, T 0 is set to 32. Each weight cube is stored in the corresponding weight buffer, while the input tiled cube is stored in the global input buffer. During the calculation process, both the tiled cube and weight cube are divided into multiple C i length vectors. These vectors are further segmented into several parts of length T i , which are then inputted into the IPU for vector inner product operations. Similarly, T i is set to 32. The partial sums of these vector inner products are stored in the respective temporary buffers within each PE. Once all partial sums in the temporary buffer have been accumulated, the data is sent to the global output buffer. The global output buffer obtains the results corresponding to all C o / T o weight cubes and reintegrates them in a depth-first order to generate an output cube of h × w × C o size. Finally, the output cube is stored in the off-chip memory and used as the input fmap for the subsequent convolutional layer.

4. Experiments and Results

This section presents several experiments designed to evaluate the performance of the proposed hardware accelerator. Experimental details and results are illustrated and compared with other works, demonstrating the performance of our approach.

4.1. Experimental Settings

To evaluate the proposed hardware accelerator for CNN-based remote sensing image processing, this study conducted an object detection experiment based on the improved YOLOv2 network [46] and a scene classification experiment based on the ResNet-34 [47] and VGG-16 networks [48]. The trained networks were deployed on the VC709 board to assess the performance of the designed accelerator.

4.1.1. Datasets Description

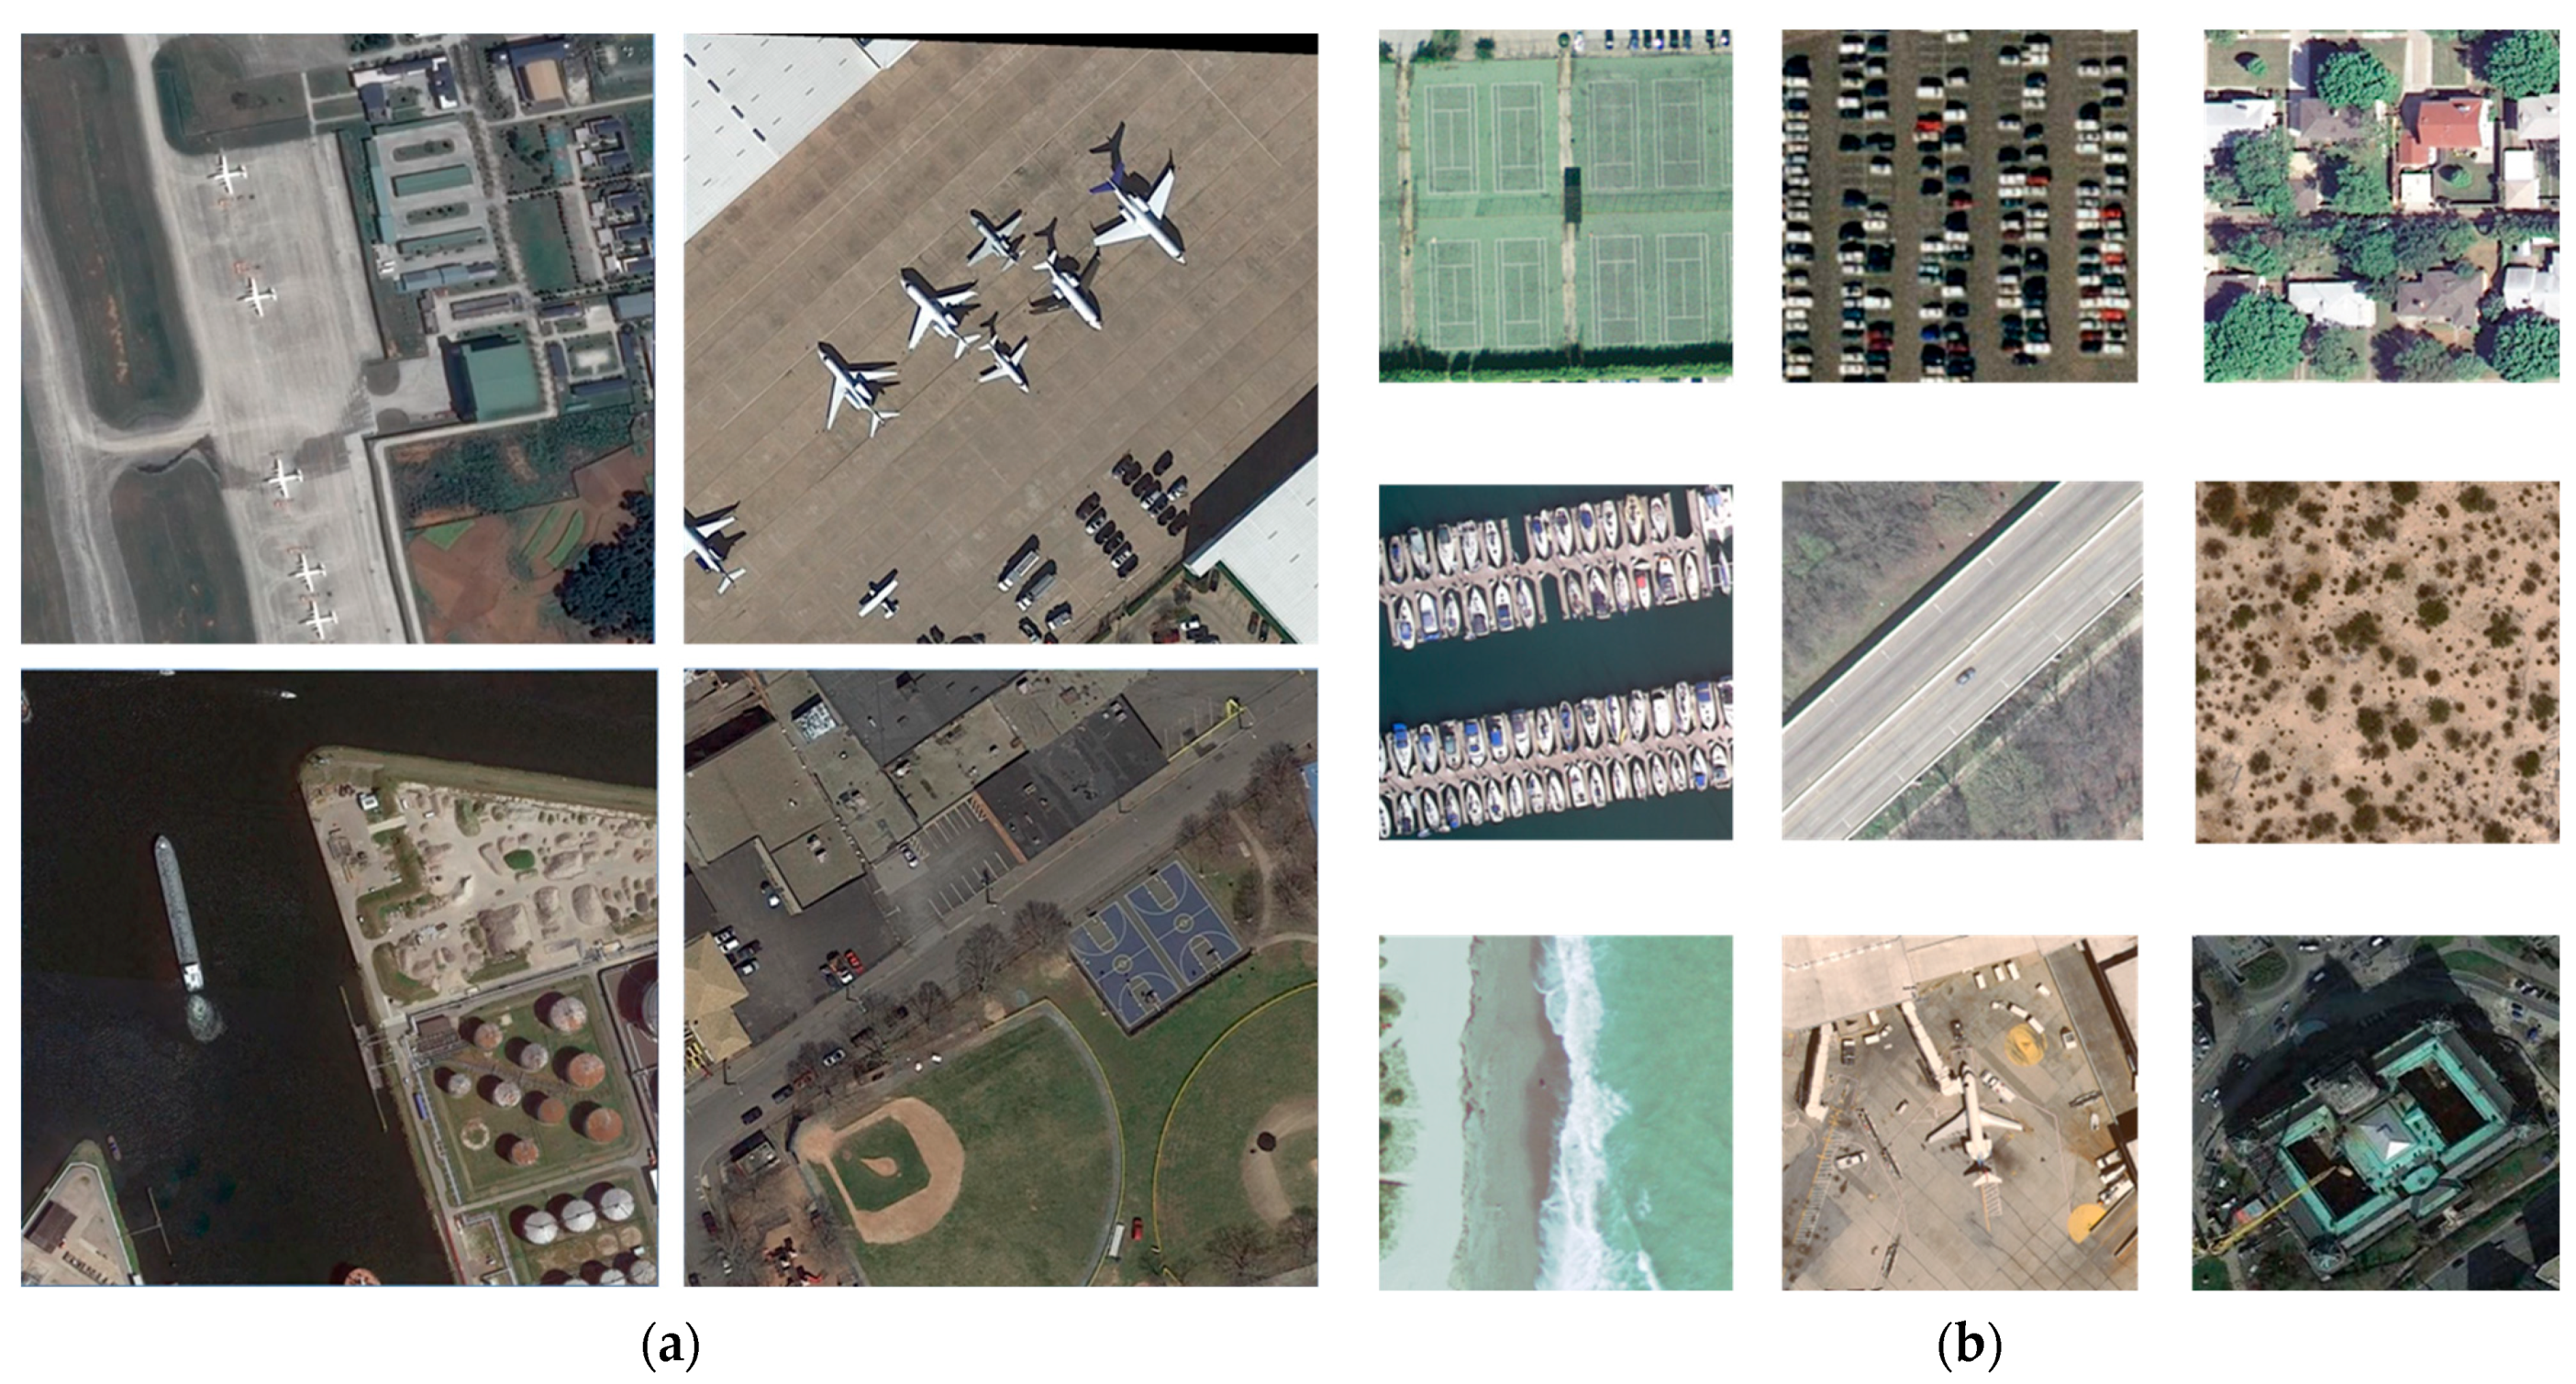
For remote sensing object detection, this study utilized the DOTA-v1.0 [49] dataset, a large-scale dataset designed explicitly for object detection in aerial images, to train the improved YOLOv2 network. The DOTA dataset contains 2806 aerial images with resolutions ranging from 800 × 800 to 4000 × 4000. It includes 188282 labeled instances across 15 object categories, such as planes, ships, bridges, and tennis courts. The training set of the DOTA dataset is used to train the improved YOLOv2 network, while the validation set was employed for verification. All images were cropped into 1024 × 1024 patches during the training process using the DOTA development kit. In the testing phase, the images were cropped with a stride of 512 pixels, and the detection results of each patch were merged to obtain the final detection results for the original images. Several sample images of the DOTA dataset are shown in Figure 11a.
For remote sensing scene classification, the NWPU-RESISC45 dataset [50] was used to train VGG-16 and ResNet-34 networks. The NWPU-RESISC45 dataset consists of 31,500 scene images divided into 45 scene classes, such as forest, agricultural, dense residential, and storage tanks. Each scene class contains 700 images, and the size of each image is 256 × 256. In this experiment, 20% of the images were used for training, while the remaining images were used for validation and testing. Notably, the input image size of VGG-16 and ResNet-34 images is 224 × 224. For the training set, a 224 × 224 pixel area was randomly selected from the original images through random cropping. For the validation and testing sets, a center crop was used, followed by normalization. Several samples of the NWPU-RESISC45 testing set are shown in Figure 11b.

4.1.2. Experimental Setup

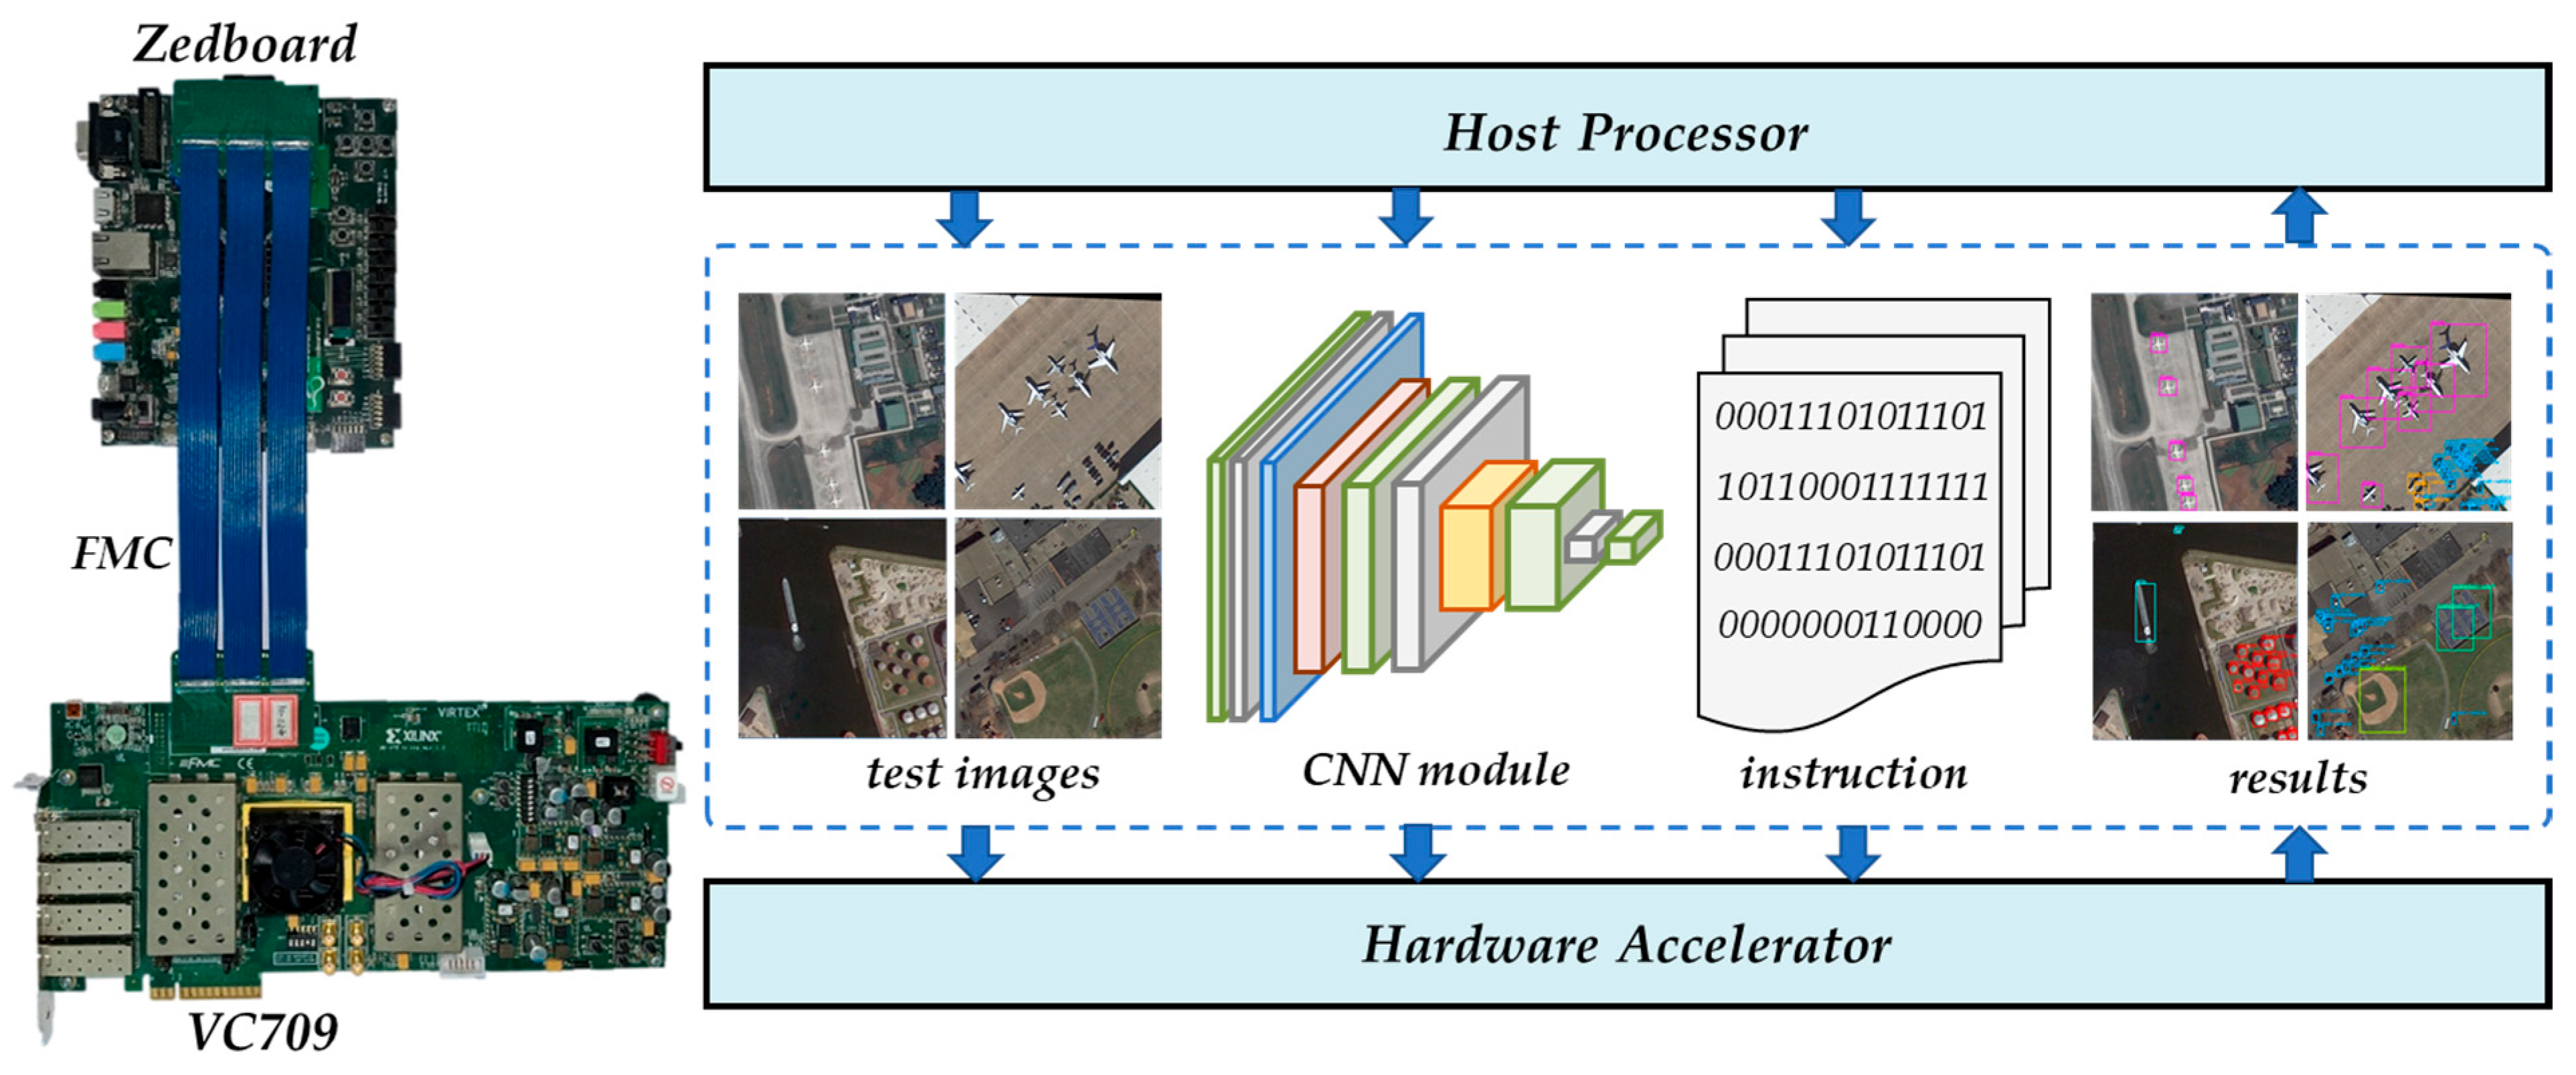
To evaluate the performance of the proposed hardware accelerator, it is implemented on the AMD-Xilinx VC709 board, which features an XC7VLX690T FPGA chip and two 4GB DDR3 SODIMMs. In order to facilitate processing with the VC709 board, the host processor part of the accelerator architecture was implemented on the AMD-Xilinx Zedboard, which is equipped with the XC7Z020 SoC chip. This chip integrates an ARM Cortex-A9 processor and programmable logic. The Zedboard and VC709 are connected physically through the FMC interface and utilize the Aurora protocol for data exchange. The system structure is shown in Figure 12. As the system master, the Zedboard is responsible for transmitting network model parameters, instruction set files, and test images to the hardware accelerator on the VC709 board before testing. Once the transmission is complete, the accelerator starts processing and uploads the results to the Zedboard. The project was built with the SystemVerilog language, and Vivado Design Suite 2019.2 from AMD-Xilinx was used for synthesis and implementation.
The trained and quantized models, including improved YOLOv2, VGG-16, and RenNet-34, were converted into parameter files and instruction set files in advance and stored in the off-chip ROM of the Zedboard alongside the images to be processed. The Zedboard can be externally controlled through UART, allowing for the selection of the images, parameters, and instruction set files to be sent to the VC709 board to control the accelerator for processing different network models. The images and parameters are transmitted to the two DDRs of the VC709 board, while the instruction set file is transmitted to the instruction queue FIFO inside the accelerator.

4.1.3. Evaluation Metrics

In remote sensing scene classification, the overall accuracy (OA) is commonly used to evaluate the classification performance of the network [51]. The OA is calculated by dividing the number of correctly classified images r by the total number of test images N , as shown in Equation (12):
O A = r N × 100 %
In remote sensing object detection, Mean Average Precision (mAP) is used to evaluate the detection performance [52]. The mAP is calculated by plotting a precision–recall curve for each category and calculating the average precision as the area under the curve, as shown in Equation (13), where p r represents the precision–recall curve. Precision and recall are defined in Equation (14) and Equation (15), respectively. TP represents the number of true positive samples, FN represents the number of false negative samples, and FP represents the number of false positive samples [53]. The mAP is obtained by taking the mean of the average precision across all categories, and it provides an overall evaluation of the object detection performance [54].
A v e r a g e   P r e c i s i o n = 0 1 p ( r ) d r
P r e c i s i o n = T P T P + F P
R e c a l l = T P T P + F N
For hardware accelerators, throughput, resource utilization, and power consumption are key performance indicators. During the model inference process, giga operations (GOPs) are used to measure the number of operations in a network model, which reflects the overall complexity of the inference operation. In a CNN model, both addition and multiplication operations are considered as one operation [54]. The throughput of an accelerator measures the processing speed and computing power and is generally expressed in giga operations per second (GOPS). Resource utilization encompasses the number of look-up tables (LUT), flip-flops (FF), block RAM (BRAM), and DSP units in the FPGA chip. Power consumption is evaluated using the AMD-Xilinx power estimator based on on-chip power information. The energy efficiency of an accelerator is measured by GOPS/W, derived from the ratio of throughput to power consumption. It should be noted that the proposed accelerator is deployed on the VC709 board, and the Zedboard is only responsible for parameter transmission initially and result reception finally, without participating in the inference calculations. Therefore, only the VC709 board is considered when determining resource and power consumption.

4.2. Experimental Result

The experimental results of the hardware accelerator for object detection and scene classification were analyzed. Optimized by the proposed method, the parameter size of the improved YOLOv2 network is 49.4 MB. It achieved an mAP of 67.30% on the DOTA verification set. Some detection results are shown in Figure 13a. The optimized VGG-16 and ResNet-34 networks have parameter sizes of 14.7 MB and 21.29 MB, respectively. For scene classification, the overall accuracy of VGG-16 and ResNet-34 on the NWPU-RESISC45 testing set was 91.90% and 92.81%, respectively. Several classification results are shown in Figure 13b.
Moreover, the resource utilization of the accelerator is summarized in Table 1. It includes the network processing unit, MIG, DMA, and others, excluding the host processor.
As shown in Table 1, the accelerator’s utilization of LUT, FF, BRAM, and DSP were 105509, 282807, 794, and 832, respectively. A significant portion of the BRAM is used to build large global buffers and weight buffers, reducing the number of fmap tiles. The utilization rates of LUT, FF, and DSP are all below 33%, demonstrating that the designed accelerator can effectively adapt to the on-board remote sensing platform with limited hardware resources.
Furthermore, the improved YOLOv2 network has 379.55 GOPs, the VGG-16 network has 30.69 GOPs, and the ResNet-34 network has 7.33 GOPs. At a system clock frequency of 200 MHz, the inference time for the improved YOLOv2 network is 981.4ms, for VGG-16 is 89.1ms, and for ResNet-34 is 40.2ms. Consequently, the accelerator achieves a throughput of 386.74 GOPS for improved YOLOv2, 344.44 GOPS for VGG-16, and 182.34 GOPS for ResNet-34. The power consumption of the accelerator is 14.97 W at 200 MHz. Consequently, the energy efficiency of the accelerator for improved YOLOv2, VGG-16, and ResNet-34 is 25.83GOPS/W, 23.01GOPS/W, and 12.18GOPS/W, respectively.

4.3. Performance Comparison

To demonstrate the advantages of the proposed accelerator, a series of performance comparison experiments were conducted. The improved YOLOv2, VGG-16, and ResNet-34 networks were deployed on the central processing unit (CPU) and image processing unit (GPU) for remote sensing object detection and scene classification. The CPU was the Intel Xeon E5-2697v4 with a main frequency of 2.3 GHz, and the GPU was the NVIDIA TITAN Xp GPU with a main frequency of 1.6 GHz. Table 2 presents the performance comparison between the CPU, GPU, and the proposed accelerator.
As shown in Table 2, the thermal design power (TDP) of the CPU and GPU used in the experiments were 145 W and 250 W, respectively. In contrast, the on-chip power of the proposed hardware accelerator was only 14.97 W. This indicates that our design is more suitable for application on satellite platforms with limited power. Regardless of the network being deployed, the throughput of the proposed accelerator is lower than that of the GPU but higher than that of the CPU. Regarding energy efficiency, the proposed accelerator exhibits clear advantages over the CPU, achieving power efficiencies of 69.8×, 15.7×, and 15.8×, respectively, for the improved YOLOv2, VGG-16, and ResNet-34 networks. Compared to the GPU, despite the proposed FPGA-based accelerator having a main frequency eight times lower than that of the GPU, our accelerator demonstrates similar or even higher energy efficiency on these networks. Additionally, the table presents a comparison of the accuracy of remote sensing object detection and scene classification among different platforms. Compared to the results obtained from the CPU and GPU, the mAP of detection decreased by approximately 0.2%, and the overall accuracy (OA) of classification decreased by about 0.04%. This discrepancy is attributed to the change in the calculation order of floating-point numbers during the fusion of the BN layer. Nevertheless, this slight error can be disregarded in practical applications. The data above supports the conclusion that the proposed accelerator outperforms the CPU and GPU for on-board remote sensing processing.
Additionally, the performance of our accelerator is compared with related state-of-the-art work, as shown in Table 3. The studies referenced in [55,56,57] focused on accelerating the YOLOv2 network. Yu et al. [55] proposed the OPU, a domain-specific FPGA overlay processor, implemented on the Xilinx XC7K325T FPGA. They achieved a throughput of 391 GOPS and an energy efficiency of 23.69 GOPS/W for the YOLOv2 network, using a multiplier scale of 1024, which matches our setup. Although their throughput slightly surpasses ours, our accelerator exhibits better energy efficiency. Cui et al. [56] utilized the Winograd algorithm to accelerate convolution operations and developed a dedicated accelerator for YOLOv2 using a High-Level Synthesis tool based on OpenCL on the Arria 10 GX platform. Their implementation achieved a throughput of 248.7 GOPS and an energy efficiency of 9.01 GOPS/W, which are both lower than our design. Zhai et al. [57] utilized various hardware optimization techniques, including memory interlayer multiplexing and multichannel transfer, to accelerate the YOLOv3 network for video stream vehicle detection on the ZYNQ7000 platform. However, their energy efficiency was only 7.40 GOPS/W, significantly lower than our results.
References [58,59,60] introduce the accelerator of the VGG-16 network. Donghyuk et al. [58] achieved a throughput of 402 GOPS for the VGG-16 network on the VCU118 platform at the cost of consuming 2.9x the DSP of our proposed accelerator, while the throughput is only 1.17× ours. It can be reasonably speculated that the power consumption of the accelerator proposed in [58] would exceed 30 W, resulting in significantly lower energy efficiency than ours. Mousouliotis et al. [59] proposed an FPGA acceleration architecture for small ImageNet-like CNN models, achieving a processing delay of 447ms on the VGG-16 network, equivalent to a throughput rate of 68.66 GOPS and an energy efficiency of 22.15 GOPS/W. Although this architecture offers low power consumption and comparable efficiency to our work, it is specifically designed to accelerate VGG-like network models and may not be suitable for other models. Wang et al. [60] proposed a CNN accelerator System-on-Chip (SoC) architecture embedded in instruction-extended RISC-V to accelerate high-frequency operations in CNN, which demonstrated good scalability. However, it exhibited lower efficiency. Despite utilizing a 16nm advanced FPGA platform, it only achieved an energy efficiency of 15.6 GOPs/W on the VGG16 network, which is lower than our work. Tong et al. [61] deployed both original and compressed ResNet-50 networks on the Xilinx-ZCU104 FPGA to implement radio frequency fingerprinting on edge devices, achieving processing delays of 15.06ms and 1.36ms, respectively. Although their processing latency is low, the energy efficiency of [61] is only 7.37 and 3.68 GOPS/W, which is lower than our design.

5. Discussion

The proposed algorithm–hardware co-optimization and deployment method show excellent results in remote sensing object detection and scene classification tasks. When deploying the improved YOLOv2, VGG-16, and ResNet-34 networks, the accelerator demonstrates lower power consumption compared to CPU and GPU implementations. While the accelerator’s throughput may not match that of GPUs, it achieves comparable or higher energy efficiency, especially when deploying the improved YOLOv2 and ResNet-34 networks, surpassing the energy efficiency of GPUs.
When comparing our proposed accelerator with existing related works, it achieves similar throughput and better energy efficiency on the improved YOLOv2, VGG-16, and ResNet-34 networks. This suggests that our accelerator is better suited for use in power-constrained satellite edge devices. Additionally, compared to custom-designed accelerators such as those proposed in [56,57,59,61], our accelerator can deploy various network architectures, demonstrating greater versatility and scalability.
The experiments and comparisons mentioned above demonstrate that the proposed accelerator achieves high energy efficiency for remote sensing image processing tasks, providing a solution to deploy CNN models on resource and power-constrained satellite platforms. Additionally, the proposed accelerator is capable of accelerating CNN models with different structures to perform various remote sensing image processing tasks, showcasing its versatility.

6. Conclusions

This paper presents an algorithm–hardware co-optimization and deployment method for FPGA-based CNN remote sensing image processing. Firstly, a series of hardware-centric techniques for optimizing CNN models is proposed, including operation fusion and depth-first mapping techniques. The depth-first mapping technology consists of two steps, loop tiling and loop unrolling, enabling efficient implementation of multiple hyperparameter convolution operations in a unified manner. Furthermore, a versatile FPGA-based CNN acceleration architecture is introduced that features a parallel configurable network processing unit and a multi-level storage system, capable of executing the optimized CNN models. To validate the effectiveness of the proposed approach, this study implements the accelerator architecture on an AMD-Xilinx VC709 board and deploys improved YOLOv2, VGG-16, and ResNet-34 networks for testing. The experimental results demonstrate that the accelerator consumes only 14.97 W of power, achieving energy efficiencies of 25.83 GOPS/W, 23.01 GOPS/W, and 12.18 GOPS/W on the tested networks, respectively. Compared to other related works, the proposed accelerator exhibits superior energy efficiency and can be applicable to various networks. Therefore, it holds significant potential for on-board remote sensing image processing.
In subsequent research, the proposed accelerator will be implemented on radiation-hardened FPGAs to assess its robustness and efficacy in challenging environments. Furthermore, our future plans involve developing an ASIC-based solution to investigate optimal resource utilization for spaceborne remote sensing applications.

Author Contributions

Conceptualization, S.N. and X.W.; methodology, S.N., X.W. and N.Z.; software, S.N., X.W. and N.Z.; validation, S.N., X.W. and N.Z.; formal analysis, S.N. and H.C.; investigation, S.N. and X.W.; resources, X.W. and H.C.; data curation, S.N. and N.Z.; writing—original draft preparation, S.N. and X.W.; writing—review and editing, S.N., X.W. and N.Z.; supervision, H.C.; project administration, H.C.; funding acquisition, H.C. All authors have read and agreed to the published version of the manuscript.

Funding

This research was funded in part by the grant JCKY2021602B037 and in part by the BIT Research and Innovation Promoting Project under grant 2023YCXY006.

Data Availability Statement

The data presented in this study are available on request from the corresponding author. The data are not publicly available due to privacy.

Conflicts of Interest

Author Xin Wei was employed by the company China Academy of Space Technology. The remaining authors declare that the research was conducted in the absence of any commercial or financial relationships that could be construed as a potential conflict of interest.

References

  1. Yan, P.; Liu, X.; Wang, F.; Yue, C.; Wang, X. LOVD: Land Vehicle Detection in Complex Scenes of Optical Remote Sensing Image. IEEE Trans. Geosci. Remote Sens. 2022, 60, 5615113. [Google Scholar] [CrossRef]
  2. Zhao, B.; Wang, Q.; Wu, Y.; Cao, Q.; Ran, Q. Target detection model distillation using feature transition and label registration for remote sensing imagery. IEEE J. Sel. Top. Appl. Earth Obs. Remote Sens. 2022, 15, 5416–5426. [Google Scholar] [CrossRef]
  3. Hou, Y.-E.; Yang, K.; Dang, L.; Liu, Y. Contextual Spatial-Channel Attention Network for Remote Sensing Scene Classification. IEEE Geosci. Remote Sens. Lett. 2023, 20, 6008805. [Google Scholar] [CrossRef]
  4. Shi, J.; Liu, W.; Shan, H.; Li, E.; Li, X.; Zhang, L. Remote Sensing Scene Classification Based on Multibranch Fusion Attention Network. IEEE Geosci. Remote Sens. Lett. 2023, 20, 3001505. [Google Scholar] [CrossRef]
  5. Du, X.; Song, L.; Lv, Y.; Qin, X. Military Target Detection Method Based on Improved YOLOv5. In Proceedings of the 2022 International Conference on Cyber-Physical Social Intelligence (ICCSI), Nanjing, China, 18–21 November 2022; pp. 53–57. [Google Scholar] [CrossRef]
  6. Zheng, Z.; Zhong, Y.; Su, Y.; Ma, A. Domain Adaptation via a Task-Specific Classifier Framework for Remote Sensing Cross-Scene Classification. IEEE Trans. Geosci. Remote Sens. 2022, 60, 5620513. [Google Scholar] [CrossRef]
  7. Li, Z.; Wu, Q.; Cheng, B.; Cao, L.; Yang, H. Remote Sensing Image Scene Classification Based on Object Relationship Reasoning CNN. IEEE Geosci. Remote Sens. Lett. 2022, 19, 8000305. [Google Scholar] [CrossRef]
  8. Wu, Y.; Guan, X.; Zhao, B.; Ni, L.; Huang, M. Vehicle Detection Based on Adaptive Multi-modal Feature Fusion and Cross-modal Vehicle Index using RGB-T Images. IEEE J. Sel. Top. Appl. Earth Obs. Remote Sens. 2023, 16, 8166–8177. [Google Scholar] [CrossRef]
  9. Yao, Y.; Zhou, Y.; Yuan, C.; Li, Y.; Zhang, H. On-Board Intelligent Processing for Remote Sensing Images Based on 20KG Micro-Nano Satellite. In Proceedings of the 2021 IEEE International Geoscience and Remote Sensing Symposium IGARSS, Brussels, Belgium, 11–16 July 2021; pp. 8107–8110. [Google Scholar] [CrossRef]
  10. Shivapakash, S.; Jain, H.; Hellwich, O.; Gerfers, F. A Power Efficiency Enhancements of a Multi-Bit Accelerator for Memory Prohibitive Deep Neural Networks. IEEE Open J. Circuits Syst. 2021, 2, 156–169. [Google Scholar] [CrossRef]
  11. Pan, Y.; Tang, L.; Jing, D.; Tang, W.; Zhou, S. Efficient and Lightweight Target Recognition for High Resolution Spaceborne SAR Images. In Proceedings of the 2019 IEEE International Conference on Signal, Information and Data Processing (ICSIDP), Chongqing, China, 11–13 December 2019; pp. 1–4. [Google Scholar] [CrossRef]
  12. Zhang, N.; Wei, X.; Chen, H.; Liu, W. FPGA Implementation for CNN-Based Optical Remote Sensing Object Detection. Electronics 2021, 10, 282. [Google Scholar] [CrossRef]
  13. Neris, R.; Guerra, R.; López, S.; Sarmiento, R. Performance evaluation of state-of-the-art CNN architectures for the on-board processing of remotely sensed images. In Proceedings of the 2021 XXXVI Conference on Design of Circuits and Integrated Systems (DCIS), Vila do Conde, Portugal, 24–26 November 2021; pp. 1–6. [Google Scholar] [CrossRef]
  14. Haut, J.M.; Alcolea, A.; Paoletti, M.E.; Plaza, J.; Resano, J.; Plaza, A. GPU-Friendly Neural Networks for Remote Sensing Scene Classification. IEEE Geosci. Remote Sens. Lett. 2022, 19, 8001005. [Google Scholar] [CrossRef]
  15. Behera, T.K.; Bakshi, S.; Nappi, M.; Sa, P.K. Superpixel-Based Multiscale CNN Approach Toward Multiclass Object Segmentation From UAV-Captured Aerial Images. IEEE J. Sel. Top. Appl. Earth Obs. Remote Sens. 2023, 16, 1771–1784. [Google Scholar] [CrossRef]
  16. Zhang, N.; Wang, G.; Wang, J.; Chen, H.; Liu, W.; Chen, L. All Adder Neural Networks for On-Board Remote Sensing Scene Classification. IEEE Trans. Geosci. Remote Sens. 2023, 61, 5607916. [Google Scholar] [CrossRef]
  17. Papatheofanous, E.A.; Tziolos, P.; Kalekis, V.; Amrou, T.; Konstantoulakis, G.; Venitourakis, G.; Reisis, D. SoC FPGA Acceleration for Semantic Segmentation of Clouds in Satellite Images. In Proceedings of the 2022 IFIP/IEEE 30th International Conference on Very Large Scale Integration (VLSI-SoC), Patras, Greece, 3–5 October 2022; pp. 1–4. [Google Scholar] [CrossRef]
  18. He, W.; Yang, Y.; Mei, S.; Hu, J.; Xu, W.; Hao, S. Configurable 2D-3D CNNs Accelerator for FPGA-Based Hyperspectral Imagery Classification. IEEE J. Sel. Top. Appl. Earth Obs. Remote Sens. 2023, 16, 9406–9421. [Google Scholar] [CrossRef]
  19. Neris, R.; Rodríguez, A.; Guerra, R.; López, S.; Sarmiento, R. FPGA-Based Implementation of a CNN Architecture for the On-Board Processing of Very High-Resolution Remote Sensing Images. IEEE J. Sel. Top. Appl. Earth Obs. Remote Sens. 2022, 15, 3740–3750. [Google Scholar] [CrossRef]
  20. Kim, V.H.; Choi, K.K. A Reconfigurable CNN-Based Accelerator Design for Fast and Energy-Efficient Object Detection System on Mobile FPGA. IEEE Access 2023, 11, 59438–59445. [Google Scholar] [CrossRef]
  21. Liu, Y.; Dai, Y.; Liu, G.; Yang, J.; Tian, L.; Li, H. Distributed Space Remote Sensing and Multi-satellite Cooperative On-board Processing. In Proceedings of the 2020 International Conference on Sensing, Measurement & Data Analytics in the era of Artificial Intelligence (ICSMD), Xi’an, China, 15–17 October 2020; pp. 551–556. [Google Scholar] [CrossRef]
  22. Chen, X.; Ji, J.; Mei, S.; Zhang, Y.; Han, M.; Du, Q. FPGA Based Implementation of Convolutional Neural Network for Hyperspectral Classification. In Proceedings of the IGARSS 2018—2018 IEEE International Geoscience and Remote Sensing Symposium, Valencia, Spain, 22–27 July 2018; pp. 2451–2454. [Google Scholar] [CrossRef]
  23. Li, X.; Cai, K. Method research on ship detection in remote sensing image based on Yolo algorithm. In Proceedings of the 2020 International Conference on Information Science, Parallel and Distributed Systems (ISPDS), Xi’an, China, 14–16 August 2020; pp. 104–108. [Google Scholar] [CrossRef]
  24. Liu, S.; Peng, Y.; Liu, L. A Novel Ship Detection Method in Remote Sensing Images via Effective and Efficient PP-YOLO. In Proceedings of the 2021 IEEE International Conference on Sensing, Diagnostics, Prognostics and Control (SDPC), Weihai, China, 13–15 August 2021; pp. 234–239. [Google Scholar] [CrossRef]
  25. Xie, T.; Han, W.; Xu, S. OYOLO: An Optimized YOLO Method for Complex Objects in Remote Sensing Image Detection. IEEE Geosci. Remote Sens. Lett. 2023. early access. [Google Scholar] [CrossRef]
  26. Wang, N.; Li, B.; Wei, X.; Wang, Y.; Yan, H. Ship Detection in Spaceborne Infrared Image Based on Lightweight CNN and Multisource Feature Cascade Decision. IEEE Trans. Geosci. Remote Sens. 2021, 59, 4324–4339. [Google Scholar] [CrossRef]
  27. Kim, J.; Kang, J.-K.; Kim, Y. A Low-Cost Fully Integer-Based CNN Accelerator on FPGA for Real-Time Traffic Sign Recognition. IEEE Access 2022, 10, 84626–84634. [Google Scholar] [CrossRef]
  28. Albawi, S.; Mohammed, T.A.; Al-Zawi, S. Understanding of a Convolutional Neural Network. In Proceedings of the 2017 International Conference on Engineering and Technology (ICET), Antalya, Turkey, 21–23 August 2017; IEEE: Piscataway, NJ, USA, 2017; pp. 1–6. [Google Scholar]
  29. Ma, Y.; Wang, C. SdcNet: A Computation-Efficient CNN for Object Recognition. In Proceedings of the 2018 IEEE 23rd International Conference on Digital Signal Processing (DSP), Shanghai, China, 19–21 November 2018; pp. 1–5. [Google Scholar] [CrossRef]
  30. Urbinati, L.; Casu, M.R. A Reconfigurable Depth-Wise Convolution Module for Heterogeneously Quantized DNNs. In Proceedings of the 2022 IEEE International Symposium on Circuits and Systems (ISCAS), Austin, TX, USA, 27 May 2022–1 June 2022; pp. 128–132. [Google Scholar] [CrossRef]
  31. Santurkar, S.; Tsipras, D.; Ilyas, A.; Madry, A. How does batch normalization help optimization? Adv. Neural Inf. Process. Syst. 2018, 31, 1–11. [Google Scholar]
  32. Abdukodirova, M.; Abdullah, S.; Alsadoon, A.; Prasad, P.W.C. Deep learning for ovarian follicle (OF) classification and counting: Displaced rectifier linear unit (DReLU) and network stabilization through batch normalization (BN). In Proceedings of the 2020 5th International Conference on Innovative Technologies in Intelligent Systems and Industrial Applications (CITISIA), Sydney, Australia, 25–27 November 2020; pp. 1–10. [Google Scholar] [CrossRef]
  33. Kusumawati, D.; Ilham, A.A.; Achmad, A.; Nurtanio, I. Vgg-16 and Vgg-19 Architecture Models in Lie Detection Using Image Processing. In Proceedings of the 2022 6th International Conference on Information Technology, Information Systems and Electrical Engineering (ICITISEE), Yogyakarta, Indonesia, 13–14 December 2022; pp. 340–345. [Google Scholar] [CrossRef]
  34. Bagaskara, A.; Suryanegara, M. Evaluation of VGG-16 and VGG-19 Deep Learning Architecture for Classifying Dementia People. In Proceedings of the 2021 4th International Conference of Computer and Informatics Engineering (IC2IE), Depok, Indonesia, 14–15 September 2021; pp. 1–4. [Google Scholar] [CrossRef]
  35. Yang, C.; Yang, Z.; Hou, J.; Su, Y. A Lightweight Full Homomorphic Encryption Scheme on Fully-connected Layer for CNN Hardware Accelerator achieving Security Inference. In Proceedings of the 2021 28th IEEE International Conference on Electronics, Circuits, and Systems (ICECS), Dubai, United Arab Emirates, 28 November–1 December 2021; pp. 1–4. [Google Scholar] [CrossRef]
  36. Liu, K.; Kang, G.; Zhang, N.; Hou, B. Breast Cancer Classification Based on Fully-Connected Layer First Convolutional Neural Networks. IEEE Access 2018, 6, 23722–23732. [Google Scholar] [CrossRef]
  37. Targ, S.; Almeida, D.; Lyman, K. Resnet in resnet: Generalizing residual architectures. arXiv 2016, arXiv:1603.08029. [Google Scholar]
  38. Al-Qizwini, M.; Barjasteh, I.; Al-Qassab, H.; Radha, H. Deep learning algorithm for autonomous driving using googlenet. In Proceedings of the 2017 IEEE Intelligent Vehicles Symposium (IV), Los Angeles, CA, USA, 11–14 June 2017; pp. 89–96. [Google Scholar]
  39. Williamson, I.A.; Hughes, T.W.; Minkov, M.; Bartlett, B.; Pai, S.; Fan, S. Reprogrammable electro-optic nonlinear activation functions for optical neural networks. IEEE J. Sel. Top. Quantum Electron. 2019, 26, 1–12. [Google Scholar] [CrossRef]
  40. Daubechies, I.; DeVore, R.; Foucart, S.; Hanin, B.; Petrova, G. Nonlinear approximation and (deep) ReLU networks. Constr. Approx. 2022, 55, 127–172. [Google Scholar] [CrossRef]
  41. Xu, J.; Li, Z.; Du, B.; Zhang, M.; Liu, J. Reluplex made more practical: Leaky ReLU. In Proceedings of the 2020 IEEE Symposium on Computers and Communications (ISCC), Rennes, France, 7–10 July 2020; pp. 1–7. [Google Scholar]
  42. Zhang, X.; Zou, Y.; Shi, W. Dilated convolution neural network with LeakyReLU for environmental sound classification. In Proceedings of the 2017 22nd International Conference on Digital Signal Processing (DSP), London, UK, 23–25 August 2017; pp. 1–5. [Google Scholar]
  43. Li, B.; He, Y. An improved ResNet based on the adjustable shortcut connections. IEEE Access 2018, 6, 18967–18974. [Google Scholar] [CrossRef]
  44. Mohagheghi, S.; Alizadeh, M.; Safavi, S.M.; Foruzan, A.H.; Chen, Y.W. Integration of CNN, CBMIR, and visualization techniques for diagnosis and quantification of covid-19 disease. IEEE J. Biomed. Health Inform. 2021, 25, 1873–1880. [Google Scholar] [CrossRef]
  45. Wei, X.; Liu, W.; Chen, L.; Ma, L.; Chen, H.; Zhuang, Y. FPGA-based hybrid-type implementation of quantized neural networks for remote sensing applications. Sensors 2019, 19, 924. [Google Scholar] [CrossRef]
  46. Liu, W.; Ma, L.; Wang, J. Detection of multiclass objects in optical remote sensing images. IEEE Geosci. Remote Sens. Lett. 2018, 16, 791–795. [Google Scholar] [CrossRef]
  47. He, K.; Zhang, X.; Ren, S.; Sun, J. Deep residual learning for image recognition. In Proceedings of the IEEE Conference on Computer Vision and Pattern Recognition, Las Vegas, NV, USA, 27–30 June 2016; pp. 770–778. [Google Scholar]
  48. Simonyan, K.; Zisserman, A. Very deep convolutional networks for large-scale image recognition. arXiv 2014, arXiv:1409.1556. [Google Scholar]
  49. Xia, G.S.; Bai, X.; Ding, J.; Zhu, Z.; Belongie, S.; Luo, J.; Datcu, M.; Pelillo, M.; Zhang, L. DOTA: A large-scale dataset for object detection in aerial images. In Proceedings of the IEEE Conference on Computer Vision and Pattern Recognition, Salt Lake City, UT, USA, 18–22 June 2018; pp. 3974–3983. [Google Scholar]
  50. Cheng, G.; Han, J.; Lu, X. Remote sensing image scene classification: Benchmark and state of the art. Proc. IEEE 2017, 105, 1865–1883. [Google Scholar] [CrossRef]
  51. Cheng, G.; Xie, X.; Han, J.; Guo, L.; Xia, G.S. Remote sensing image scene classification meets deep learning: Challenges, methods, benchmarks, and opportunities. IEEE J. Sel. Top. Appl. Earth Obs. Remote Sens. 2020, 13, 3735–3756. [Google Scholar] [CrossRef]
  52. Redmon, J.; Divvala, S.; Girshick, R.; Farhadi, A. You only look once: Unified, real-time object detection. In Proceedings of the IEEE Conference on Computer Vision and Pattern Recognition, Las Vegas, NV, USA, 27–30 June 2016; pp. 779–788. [Google Scholar]
  53. Li, C.; Xu, R.; Lv, Y.; Zhao, Y.; Jing, W. Edge Real-Time Object Detection and DPU-Based Hardware Implementation for Optical Remote Sensing Images. Remote Sens. 2023, 15, 3975. [Google Scholar] [CrossRef]
  54. Alwani, M.; Chen, H.; Ferdman, M.; Milder, P. Fused-layer CNN accelerators. In Proceedings of the 2016 49th Annual IEEE/ACM International Symposium on Microarchitecture (MICRO), Taipei, Taiwan, 15–19 October 2016; pp. 1–12. [Google Scholar]
  55. Yu, Y.; Wu, C.; Zhao, T.; Wang, K.; He, L. OPU: An FPGA-based overlay processor for convolutional neural networks. IEEE Trans. Very Large Scale Integr. VLSI Syst. 2019, 28, 35–47. [Google Scholar] [CrossRef]
  56. Cui, C.; Ge, F.; Li, Z.; Yue, X.; Zhou, F.; Wu, N. Design and Implementation of OpenCL-Based FPGA Accelerator for YOLOv2. In Proceedings of the 2021 IEEE 21st International Conference on Communication Technology (ICCT), Tianjin, China, 13–16 October 2021; pp. 1004–1007. [Google Scholar]
  57. Zhai, J.; Li, B.; Lv, S.; Zhou, Q. FPGA-based vehicle detection and tracking accelerator. Sensors 2023, 23, 2208. [Google Scholar] [CrossRef]
  58. Kim, D.; Jeong, S.; Kim, J.Y. Agamotto: A Performance Optimization Framework for CNN Accelerator with Row Stationary Dataflow. IEEE Trans. Circuits Syst. I Regul. Pap. 2023, 70, 2487–2496. [Google Scholar] [CrossRef]
  59. Mousouliotis, P.; Tampouratzis, N.; Papaefstathiou, I. SqueezeJet-3: An HLS-based accelerator for edge CNN applications on SoC FPGAs. In Proceedings of the 2023 XXIX International Conference on Information, Communication and Automation Technologies (ICAT), Sarajevo, Bosnia and Herzegovina, 11–14 June 2023; pp. 1–6. [Google Scholar]
  60. Wang, H.; Li, D.; Isshiki, T. Reconfigurable CNN Accelerator Embedded in Instruction Extended RISC-V Core. In Proceedings of the 2023 6th International Conference on Electronics Technology (ICET), Chengdu, China, 12–15 May 2023; pp. 945–954. [Google Scholar]
  61. Jian, T.; Gong, Y.; Zhan, Z.; Shi, R.; Soltani, N.; Wang, Z.; Dy, J.; Chowdhury, K.; Wang, Y.; Ioannidis, S. Radio frequency fingerprinting on the edge. IEEE Trans. Mob. Comput. 2021, 21, 4078–4093. [Google Scholar] [CrossRef]
Figure 2. The residual structure of ResNet.
Remotesensing 15 05784 g002
Figure 3. Algorithm–hardware co-optimization method overview.
Remotesensing 15 05784 g003
Figure 4. (a) DQ-BN and Q-LReLU layer fusion; (b) unification of convolution and full connection; (c) unification of depth-wise convolution and global average pooling.
Remotesensing 15 05784 g004aRemotesensing 15 05784 g004b
Figure 5. (a) Loop tiling in depth-first mapping technique; (b) loop unrolling in depth-first mapping technique.
Remotesensing 15 05784 g005
Figure 6. Overall block diagram of the proposed accelerator.
Remotesensing 15 05784 g006
Figure 7. Architecture of the network processing unit.
Remotesensing 15 05784 g007
Figure 8. (a) Structure of the IPU; (b) structure of the IPU in depth-wise mode.
Remotesensing 15 05784 g008
Figure 9. (a). Structure of LSU. (b). The address generation rule of the input buffer.
Remotesensing 15 05784 g009
Figure 10. DDR storage strategy.
Remotesensing 15 05784 g010
Figure 11. (a) Sample images of DOTA; (b) sample images of NWPU-RESISC45.
Remotesensing 15 05784 g011
Figure 12. The system structure for testing.
Remotesensing 15 05784 g012
Figure 13. (a) Some of the object detection results; (b) some of the scene classification results.
Remotesensing 15 05784 g013
Table 1. Resource utilization of the accelerator.
ResourceLUTFFBRAMDSP
Available in VC70943320086640014703600
Utilization105509282807794832
Utilization rate24.36%32.64%54.01%23.11%
Table 2. Performance comparison of the CPU, GPU, and the proposed accelerator in processing different networks.
CPUGPUThe Proposed Accelerator
DeviceIntel Xeon E5-2697v4 1NVIDIA TITAN Xp 2AMD-Xilinx XC7VLX690T 3
Technology (nm)141628
Frequency (MHz)23001582200
Power (W)14525014.97
NetworkYOLOv2 4VGG-16ResNet-34YOLOv2 4VGG-16ResNet-34YOLOv2 4VGG-16ResNet-34
Network complexity (GOP)379.5530.697.33379.5530.697.33379.5530.697.33
Accuracy (mAP or OA)67.50%91.93%92.87%67.50%91.9392.87%67.30%91.90%92.81%
Processing time (ms)7127.0143.765.371.95.312.0981.489.140.2
Throughput (GOPS)53.26213.57112.255278.865790.57610.83386.74344.44182.34
Energy efficiency (GOPS/W)0.371.470.7721.1623.162.4525.8323.0112.18
Relative energy efficiency 1 × 1 × 1 × 57.19 × 15.76 × 3.18 × 69.81 × 15.65 × 15.82 ×
1 Intel Xeon E5-2697v4 (Intel Corporation, Santa Clara, CA, USA). 2 NVIDIA TITAN Xp (NVIDIA Corporation, Santa Clara, CA, USA). 3 AMD-Xilinx XC7VLX690T (Advanced Micro Devices, Inc., Santa Clara, CA, USA). 4 This YOLOv2 represents the improved YOLOv2 proposed in [46].
Table 3. Performance comparison with other accelerators.
[55] [56] [57]Our Work [58] [59] [60]Our Work [61]Our Work
PlatformXC7K325t 1Arria
10 GX 2
ZYNQ
7000 3
XC7VLX
690T
VCU118 4XC
7Z020 5
Alveo-U200 6XC7VLX
690T
ZCU104 7XC7VLX
690T
Technology (nm)28202828162816281628
Frequency (MHz)20021320920020020073200200200
NetworkYOLOv2YOLOv2YOLOv3YOLOv2 8VGG-16VGG-16VGG-16VGG-16ResNet-50ResNet-34
Quantization8-bit8-bit16-bit8-bit8-bit8-bit8-bit8-bitN/A8-bit
DSPs516N/A2948322286334388832N/A832
Power (W)16.527.615.6414.97>303.13.2614.971414.97
Throughput
(GOPS)
391248.7115.7386.7440268.6651.0344.44103.2(51.5)182.34
Energy
efficiency (GOPS/W)
23.699.017.4025.83<13.422.1515.623.017.37(3.68)12.18
1 XC7K325t (Advanced Micro Devices, Inc., Santa Clara, CA, USA). 2 Arria 10 GX (Intel Corporation, Santa Clara, CA, USA). 3 ZYNQ7000 (Advanced Micro Devices, Inc., Santa Clara, CA, USA). 4 VCU118 (Advanced Micro Devices, Inc., Santa Clara, CA, USA). 5 XC7Z020 (Advanced Micro Devices, Inc., Santa Clara, CA, USA). 6 Alveo U200(Advanced Micro Devices, Inc., Santa Clara, CA, USA). 7 ZCU104 (Advanced Micro Devices, Inc., Santa Clara, CA, USA). 8 This YOLOv2 represents the improved YOLOv2 proposed in [46].
Disclaimer/Publisher’s Note: The statements, opinions and data contained in all publications are solely those of the individual author(s) and contributor(s) and not of MDPI and/or the editor(s). MDPI and/or the editor(s) disclaim responsibility for any injury to people or property resulting from any ideas, methods, instructions or products referred to in the content.