Abstract
To take full advantage of rapidly deployable unmanned aerial vehicles (UAVs), it is essential to effectively compose many UAV images into one observation image over a region of interest. In this paper, we propose fast image mosaicking using a triangulated irregular network (TIN) constructed from tiepoints. We conduct pairwise tiepoint extraction and rigorous bundle adjustment to generate rigorous tiepoints. We apply a bucketing algorithm to the tiepoints and generate evenly distributed tiepoints. We then construct a TIN from the bucketed tiepoints and extract seamlines for image stitching based on the TIN. Image mosaicking is completed by mapping UAV images along the seamlines onto a reference plane. The experimental results showed that the image mosaicking based on a TIN of bucketed tiepoints could produce image mosaics with stable and fast performance. We expect that our method could be used for rapid image mosaicking.
1. Introduction
Unmanned aerial vehicles (UAVs) can be used for fast field monitoring because they are one of the most rapidly deployable platforms for remote sensing. UAVs have a small field of view (FOV). Therefore, they usually need to acquire a lot of images to cover a target region of interest. To take full advantage of fast UAV deployment, it is essential to rapidly mosaic multiple UAV images into one seamless observation image. Image mosaicking can be divided into a terrain-based approach and an image-based approach [1]. The former is an external-based approach since it requires additional information. The latter is an internal-based approach since it uses the information derived from images only [2]. The terrain-based approach mainly utilizes digital surface models (DSMs) as a basic terrain model [3]. It conducts ortho-rectification of individual images using DSMs and maps the orthoimages onto a reference plane. Since this approach is based on a terrain model, it is generally the most accurate way to mosaic multiple images. However, it has disadvantages of time and cost for precise DSM preparation and of the dependency of its quality on that of DSMs.
To overcome these disadvantages, many researchers have applied the Structure from motion (SfM) method [4,5]. This method extracts feature points from multiple images and estimates the pose of those images. It then performs 3D reconstruction with point cloud and produces an ortho image. This technique is highly useful because it generates precise 3D information by utilizing the acquired images; it also attempts to apply hierarchical-based or deep learning-based optimization to reduce the time and space complexity. As these studies show, it is not easy to make a dense DSM suitable for ortho-rectifying UAV images with a ground sample distance (GSD) of a few centimeters. Although there were attempts to speed up precise DSM generation and UAV image mosaicking though the use of parallel algorithm [6] or dedicated hardware [7], terrain-based image mosaicking is time-consuming.
Image-based mosaicking carries out image resampling based on the geometry among images [8,9]. The geometry among images can be estimated by precisely extracting tiepoints [10,11]. This approach does not use a terrain model and instead assumes a planar surface for mosaicking. It can produce image mosaics faster than the terrain-based approach. Recent proposals of real-time image mosaicking techniques also fall under this category [12,13,14]. They attempted real-time mosaicking by promptly estimating the image geometry with tiepoints or image orientations. Sharma et al. further tried to improve the quality of mosaiced images by choosing the optimal tiepoint extraction algorithm. However, the image-based approach suffers from misalignments on image seamlines [15], particularly when mosaicked terrain cannot be approximated by a plane. A way to overcome this drawback is required for fast and accurate image-based mosaicking.
In this study, we aimed to develop a fast image mosaicking technique that combines the terrain-based and image-based approaches. We wish to improve the speed of the terrain-based approach by removing the necessity of DSMs in the mosaicking process. We also wish to improve the accuracy of the image-based approach by utilizing the ground coordinates of rigorously processed tiepoints for approximating non-planar surfaces in mosaicking processes. We generate rigorous tiepoints with accurate ground coordinates by applying rigorous bundle adjustment to tiepoints extracted from image pairs. We apply a bucketing algorithm to evenly sample the rigorous tiepoints. We then construct a TIN from the bucketed tiepoints and form a basic terrain elevation information from them. We extract seamlines for image stitching based on the TIN. Image mosaicking is completed by mapping UAV images along the seamlines onto a mosaicked plane.
We tested the proposed method with three datasets acquired over flat terrain. The experimental results showed that the image mosaicking based on a TIN of bucketed tiepoints could produce image mosaics with stable and fast performance. As TINs of bucketed rigorous tiepoints were used to generate basic terrain elevation information, our proposed method worked faster than terrain-based techniques. As the assumption of non-planar surface was not applied, our method could generate seamless image mosaics with very high quality.
In this paper, we tested our method using datasets acquired over flat areas. The flat environment does not contain abrupt height discontinuity such as the boundaries of high-rise buildings. This may offer a favorable condition for our method to ease the necessity of precise DSMs for mosaicking. Nevertheless, we argue that techniques for fast monitoring and mapping of UAV images over smooth terrain is still demanding. It is not trivial to generate DSMs dense enough to ortho-rectify UAV images with centimeters-level GSDs. Our proposal of using a TIN of tiepoints to replace dense DSMs may contribute to fast monitoring and mapping of UAV images.
2. Materials and Methods
Table 1 shows three datasets used for our study. The imaging areas of Datasets 1 and 2 were flat fields of agriculture. The imaging area of Dataset 3 was an athletic field. The UAV used in Dataset 1 was a rotary wing. It was equipped with a position sensor based on a real time kinematic (RTK) global positioning system (GPS). The UAV acquired 175 images at a height of 180 m, with a GSD of 4.92 cm. The UAV used in Datasets 2 and 3 was a fixed wing. It was equipped with a position sensor based on differential GPS. For Dataset 2, the UAV flew at a height of 200 m and acquired 172 images, with a ground sample distance (GSD) of 5.65 cm. For Dataset 3, the UAV acquired 60 images at a height of 180 m, with a GSD of 2.42 cm.

Table 1.
Descriptions of the dataset.
Figure 1 is a flowchart of our proposed method. First, tiepoints are extracted from UAV images. Tiepoints are then filtered to select inlier tiepoints over multiple images for bundle adjustment. Next, a rigorous bundle adjustment is carried out and generates accurate orientation parameters of individual UAV images and accurate ground coordinates of the tiepoints. Next, the tiepoints are bucketed and sampled within each bucket. Evenly distributed tiepoints are then generated. Next, from the bucketed tiepoints, a TIN is constructed and the extent of a reference plane for image mosaic is defined. After that, to each TIN facet, all images covering the facet are ordered based on their obliqueness and the optimal image for stitching is assigned. Mosaic seamlines are determined as the boundaries of TIN facets with different images stitched to each other. Mosaicking is performed by mapping image areas corresponding to TIN facets onto the reference plane. The details are described in the following subsections.
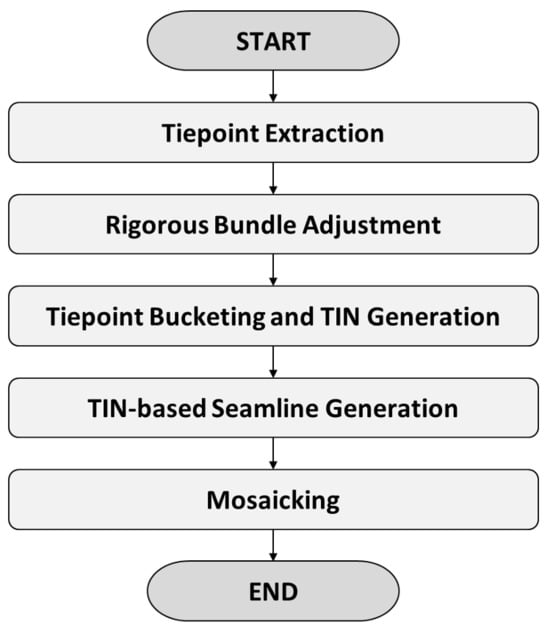
Figure 1.
Flowchart of proposed method.
2.1. Tiepoint Extraction
Tiepoints are keypoints that commonly appear in overlapped regions between neighboring images. Since our purpose is to achieve fast image mosaicking, it is important to extract tiepoints that are visible in multiple images. We attempt to increase the speed of tiepoint extraction by reducing the overall number of image pairs to match and by employing fast matchers. To reduce the number of image pairs, we group the overall images along their flight strips. Based on the horizontal translation of the initial orientations of images, the motion vectors of the UAV are determined as in our previous study [16].
Figure 2 shows how images are grouped by flight paths and how neighboring image pairs to match are determined. The differences in motion vectors are calculated for each consecutive image pair. By combining the images with small motion difference as one group and diving the images with a significant difference as another group, all images are grouped accordingly. Within an image strip, we define two consecutive images as image pairs to perform tiepoint matching. Among image strips, we select a reference image in one strip and find the images in the other strip with large overlap to the reference image. We define the reference and the selected images as image pairs to match. This strip-based image pair selection can reduce the number of pairwise tiepoint matching combinations greatly while maintaining the quality of image mosaics.
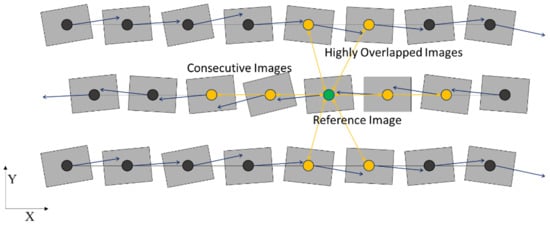
Figure 2.
Reference and selected images as image pairs on UAV flight strips. The arrow indicates the direction of flight of the UAV, and the circle indicates the position of the UAV.
A tiepoint extraction algorithm consists of the detector, descriptor, and matcher. There are lots of methods for each element, and many algorithms can be defined based on combinations of these [17,18]. The open computer vision (OpenCV) library provides several tiepoint extraction algorithms [19]. It also supports GPU-based optimized functions of some of these algorithms. To employ a fast tiepoint matcher for the proposed method, we try to apply one of the GPU-based tiepoint extraction algorithms as listed in Table 2. Their performances will be compared in the following section and an optimal algorithm will be selected.

Table 2.
OpenCV’s two GPU-based tiepoint extraction algorithms tested.
After tiepoint matching, pairwise tiepoints are merged to form tiepoints for overall image sets. After merging, a tiepoint may contain keypoints from two images, if it is visible only in two images, or more than two images, if it is visible in multiple images. For bundle adjustments, we need tiepoints that are visible in more than three images. We filter out the tiepoints visible in only two images.
2.2. Rigorous Bundle Adjustments
Tiepoints are used as observations for bundle adjustments. As the number of tie points increases, the processing time for bundle adjustments increases. To improve the accuracy of bundle adjustments and reduce processing time, it is necessary to reduce the number of tiepoints and eliminate outliers before bundle adjustment. For this process, we select three neighboring images and apply a RANSAC (Random Sampled Consensus) approach. Figure 3 is a flowchart of RANSAC-based tiepoint filtering. First, we randomly sample a minimum tiepoint from the three images. We then model the exterior orientation parameters (EOPs) of the three images with the tiepoints and calculate the ground coordinates of the tiepoints. After that, we check how many tiepoints are supported by the modelled EOPs and select the inlier tiepoints.
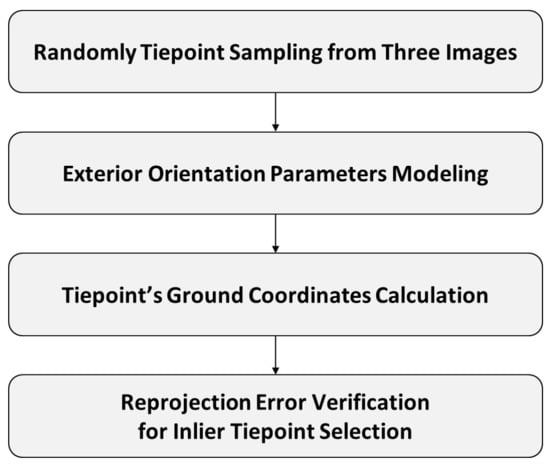
Figure 3.
Flowchart of tiepoint’s ground coordinates calculation and reprojection error verification on three UAV images.
Figure 4 explains the process of the support determination. Let us explain the process using this figure as an example. In the figure, represent the three images selected and whose EOPs are already modelled. The point A represents the ground coordinates determined by intersecting image points from two images among the three images. A is then re-projected onto the rest image . The re-projected image coordinates are compared with the actual image coordinates on the rest image. In this study, the difference between the re-projected and actual image coordinates is defined as reprojection error. This projection error is calculated from three combinations: and to , and to , and and to . If the reprojection error is small for all three combinations, we accept this tiepoint as a supporting point. We repeat this process of modelling EOPs by random sampling and checking the supporting points. We select the case with the maximum supporting numbers and accept the supporting tiepoints as inlier tiepoints for the three images selected.
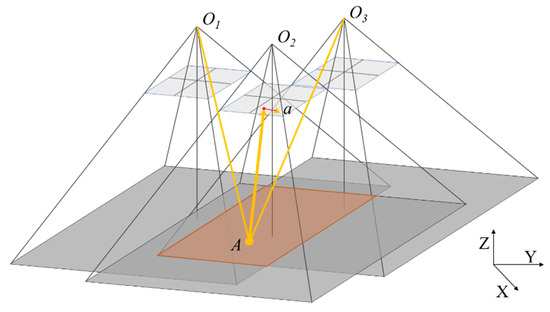
Figure 4.
Tiepoint’s ground coordinates calculation and reprojection error verification on three UAV images.
We repeat the above process of inlier tiepoints selection for all three neighboring images among all UAV images. We use the resulting inlier tiepoints for rigorous bundle adjustment. Figure 5 shows the layout of the bundle adjustment. We adjust the EOPs of UAV images and the ground locations of tiepoints simultaneously. The following collinear equations are used to set up observation matrices for bundle adjustments.
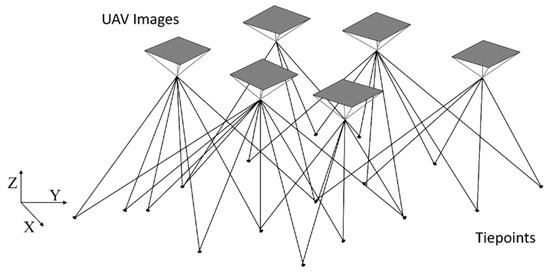
Figure 5.
UAV images and tiepoints for bundle adjustments.
In the above equations, the subscript indicates the n-th tiepoint and the superscript the j-th image. are the ground coordinates of the n-th tiepoint and are its image coordinates on the j-th image. are the position of the EOPs for the j-th image and are the elements of the rotation matrix from the j-th image frame to the ground frame. In the equations, is the focal length.
The collinearity equations in Equations (1) and (2) are used to form a model of bundle adjustments. The following matrix equation can represent the rigorous bundle adjustments applied in this paper,
where is a weight matrix for the collinear equations in Equations (1) and (2), is a weight block matrix for the EOP correction, is a weight block matrix for the updates of the ground coordinates of tiepoints, is the first-order partial differentials of the collinear equations with respect to the EOPs, is the first order partial differentials of the collinear equation with respect to the ground coordinates of the tiepoints, is the matrix for EOP adjustments, is the matrix for adjusting the ground coordinates of the tiepoints, is the residual of the collinear equations, is the constraints for EOP adjustments, and is the constraints for tiepoint adjustments [22,23].
2.3. Tiepoint Bucketing and TIN Generation
In this paper, the tiepoints whose ground coordinates are estimated via bundle adjustments are referred to as georeferenced tiepoints. The georeferenced tiepoints are unevenly distributed because their locations are determined by keypoint extraction. Since they are used as nodes of the TIN, their distribution determines the size of the facets of the TIN. In this study, the facets are utilized as the transformation units from original image to mosaicked image. Therefore, the distribution and quantity of the georeferenced tiepoints determine the size and number of image transformations. In areas with dense georeferenced tiepoints, many TIN facets may be determined and many image transformations may be performed. In areas with sparse georeferenced tiepoints, facets can be determined that are too large for a single image to cover. For reliable image transformation, it is desirable that georeferenced tiepoints are evenly distributed.
For areas with a high density of tiepoints, a bucketing algorithm is applied to sample one georeferenced tiepoint per one regularly spaced bucket as shown in Figure 6. First, the distribution range of the georeferenced tiepoints is calculated and a bounding box is defined. The bounding box can be used for bucketing and also for defining the extent of a reference plane for mosaicking. After that, it is partitioned into buckets of constant size. The georeferenced tiepoints with most image points in each bucket are selected for TIN construction. The optimal bucket size can be determined by considering the extent of individual UAV images and that of the reference plane.

Figure 6.
Bucketing algorithm for georeferenced tiepoints. The x’s indicate the location of the tiepoints.
For areas with sparse georeferenced tiepoints, there are buckets without any georeferenced tiepoints. These buckets are shown in the middle image of Figure 6 as ‘Empty’ buckets. For each empty bucket, we generate a supplementary tiepoint, which is shown in the right image of Figure 6 as a triangular dot. We set the center locations of empty buckets as X and Y coordinates of supplementary tiepoints. The height values are estimated by the height values of neighboring georeferenced tiepoints based on inverse distance weighting. These supplementary tiepoints reduce the regions without tiepoints and enable evenly distributed TIN generation.
To apply the georeferenced tiepoints as nodes of a TIN, we need to convert their ground coordinates into the coordinates within a mosaic frame. The origin of the mosaic frame can be set as the top-left corner of the bounding box. The resolution of the resulting mosaicked image can be set by users. The conversion can be expressed by the following equations.
where are the coordinates of the georeferenced tiepoints on the mosaic frame, are their coordinates in the ground frame, are the resolutions of the mosaicked image, and are the origins of the mosaic frame. A TIN is then constructed by Delaunay triangulation [24] using the bucketed tiepoints as shown in Figure 7. After that, each facet of the TIN is used for determination of stitching image and mosaic seamlines.
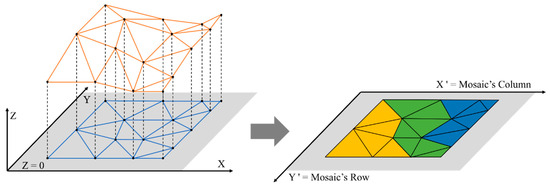
Figure 7.
TIN generation and assignment to each image. The colors indicate that they are different images.
2.4. TIN-Based Seamline Extraction
The same ground objects look different in each UAV image depending on the orientation of the UAV image. Since this effect may cause distortions in the image mosaicking, the images with the smallest effect should be used for mosaicking. Figure 8 shows the optical axis defined by image orientations and the obliqueness defined as the angle between the nadir direction and the optical axis. The smaller the image obliqueness is, the less the ground objects are distorted in images. Therefore, it is important to select the image with the smallest oblique angle as the image to be stitched from for mosaic generation.
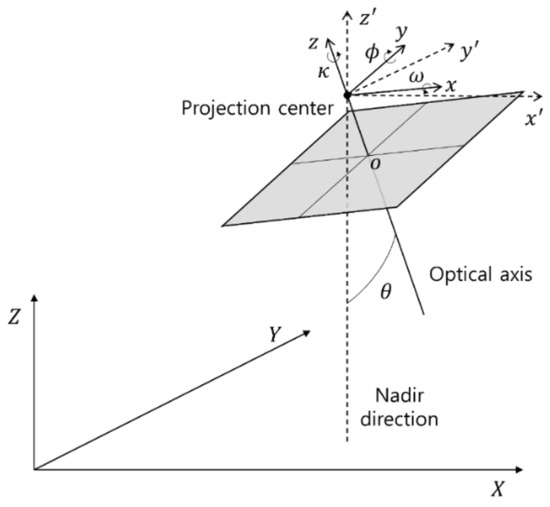
Figure 8.
Image geometry and obliqueness.
Since the nadir direction is the same line as the -axis, only the -axis and -axis rotation elements are considered for the optical axis of the obliqueness calculation. The oblique angle is then determined by inner product of the optical axis’s direction vector and the nadir direction vector . Equation (5) shows the relationship between the optical axis and the nadir vector and Equation (6) shows the formula for the oblique angle as follows,
In our method, for each TIN facet, all images covering the facet are identified and the distance between their nadir directions to the facet are calculated. The image with the smallest distance is selected as the image to be stitched.
Once all TIN facets are analyzed and stitching images are assigned to all images, the facets with the same stitching images are merged. The merged TIN facets define the region of mosaic generation from the corresponding image. Therefore, the boundaries of the merged TIN facets become mosaic seamlines as in Figure 9.

Figure 9.
Mosaic seamline determination.
2.5. Affine Transformation-Based Image Mosaicking
Figure 10 shows that image patches are stitched into the reference plane along the facets of the TIN. After assigning images to all facets, image mosaicking is carried out by mapping image patches corresponding the TIN facets to the reference plane. Equation (7) is an affine transformation and can interpret the transformation relationship with just three points. Since image mosaicking is performed in units of triangular facets in this study, the transformation relationship between the original and the mosaicked image is estimated by affine transformation.
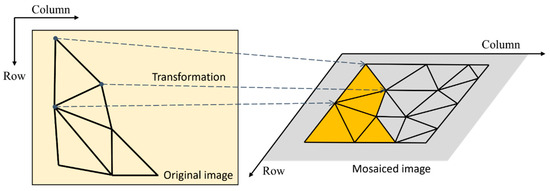
Figure 10.
Affine transformation-based mosaicking on TIN facet.
In the above equation, are the coordinates of the original image, are those of the mosaicked image, is the rotation factors of the affine transformation model, and is the translation factors of the affine transformation model. All image patches are stitched from the original images and mapped to the mosaicked images by the transformation coefficient. As a result, an image mosaic can be generated without external terrain information and without misalignment along seamlines.
3. Experiment Results
3.1. Results of Tiepoint Extraction and Bundle Adjustment
We tested the GPU-based ORB algorithm and GPU-based SURF algorithm for their processing time and suitability of bundle adjustment. The algorithm was implemented on a computer with a CPU i7-11700 at 2.50 GHz and with a RAM of 32 GB under Windows 11 Pro 64 bit. Table 3 shows the results of the tiepoint extraction by GPU-based ORB algorithm. We set the maximum number of keypoints per image as 32,767 and Table 3 shows the total number of keypoints extracted from all images for each dataset. For each dataset, image pairs for tiepoint matching were selected based on their flight path and their vicinity analysis. Pairwise tiepoint matching was performed. The average number of tiepoints per image pair and the total number of tiepoints extracted are shown in Table 3. About 11% of keypoints were matched. More importantly, Table 3 also shows the average number of triplet and quadruple tiepoints per image pair. Less than 1% of the total tiepoints were extracted across three or more images.

Table 3.
Results of GPU-based ORB tiepoint extraction.
Next, Table 4 shows the results of the tiepoint extraction by GPU-based SURF algorithm. As before, the maximum number of keypoints per image was set as 32,767. Table 4 shows the total number of keypoints extracted from all images for each dataset. The number of keypoints extracted was slightly different from the ORB case. The number of image pairs for matching was set the same as in the ORB case. The average number of tiepoints per image pair and the total number of tiepoints are shown in Table 4. In this case, about 8% of keypoints were matched, which was smaller than the matching ratio of the ORB case. However, among the matched tiepoints, the number of multiple tiepoints was a lot more than that of the ORB case. About 34% of the total tiepoints were extracted across three or more images.

Table 4.
Results of GPU-based SURF tiepoint extraction.
The bundle adjustment was carried out with the multiple tiepoints from the SURF case. Table 5 summarizes the results of bundle adjustment. The total multiple tiepoints were filtered further by the RANSAC process described earlier. In Table 5, the number of inlier tiepoints indicates the number of triple tiepoints selected for bundle adjustment. Through bundle adjustment, EOPs of images and ground coordinates of the triple tiepoints were updated iteratively. The number of iterations for adjustment were around eight for all three datasets, indicating that the adjustment converged to stable values relatively fast. The sum of residuals and the values for the sigma-not of estimated variables also indicate the stability and precision of the estimation. Reprojection errors in Table 5 were calculated by the RMS difference between the image location of each tiepoint and the projected image location by its ground coordinates and the EOPs of the image. The Y-parallax was calculated by the RMS values of Y-parallax of each pairwise tiepoint when an image pair was rectified to have an epipolar geometry.

Table 5.
Results of bundle adjustment using tiepoints by GPU-based SURF algorithm.
3.2. Results of Tiepoint Bucketing and TIN Generation
Tiepoint bucketing was applied to the tiepoints obtained as a result of bundle adjustment. Figure 11, Figure 12 and Figure 13 show the ground locations of the tiepoints for each dataset before tiepoint bucketing. In each image, the left side shows the tiepoint locations plotted on a base image map, and the right side shows the tiepoint location of the zoomed-in area. As shown in the images, tiepoints were mostly located in texture-rich regions, such as roads and buildings. They were rarely located in texture-poor regions, such as paddy fields. In Dataset 1, tiepoints were densely clustered along roads and on some textured fields, while sparsely distributed on paddy fields. In Dataset 2, tiepoints were sparse overall and absent on most paddy fields. In Dataset 3, tiepoints were relatively dense overall as the dataset was over texture-rich regions.
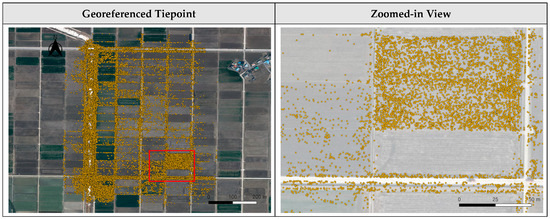
Figure 11.
Initial georeferenced tiepoint on satellite basemap for Dataset 1. The yellow points indicate the location of the initial georeferenced tiepoint, and the red boxes show the zoomed-in area.
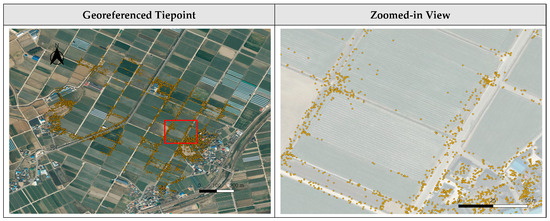
Figure 12.
Initial georeferenced tiepoint on satellite basemap for Dataset 2.
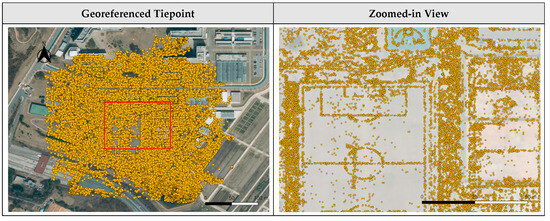
Figure 13.
Initial georeferenced tiepoint on satellite basemap for Dataset 3.
Tiepoint bucketing was applied using multiple bucket sizes. In this study, the bucket sizes used were 5 m, 10 m, and 15 m. The results of applying a 10 m bucket are in this session, and the rest of the results are in Appendix A. For each dataset and for each bucket size, one georeferenced tiepoint was sampled for each non-empty bucket. The results of bucketing are shown in Figure A1, Figure A2 and Figure A3 for Dataset 1 to 3, respectively. The images in the first and second rows of these figures show the results of tiepoint sampling by the 5 m and 15 m buckets. The images show that the 5 m buckets still showed a clustering of georeferenced tiepoints and that the 15 m buckets show excessive removal of tiepoints. The images in the first and second rows of Figure 14 show the results of tiepoint sampling by the 10 m buckets for all datasets. The 10 m bucket seemed suitable for the datasets used in this experiment.
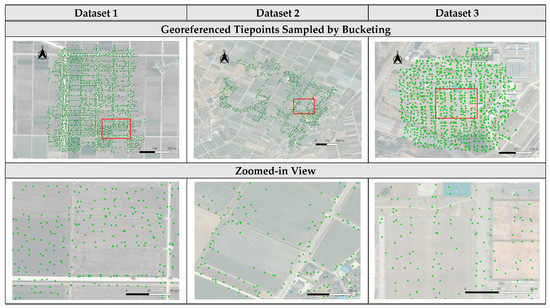
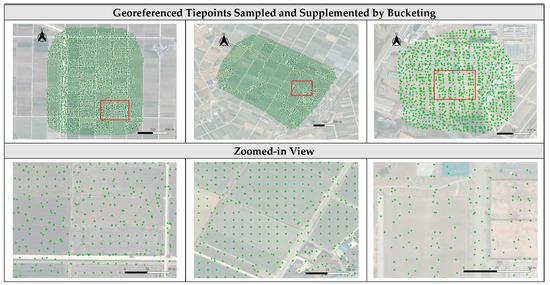
Figure 14.
Bucketed tiepoints by 10 m on satellite basemap. The green points indicate the location of the georeferenced tiepoint, and the red boxes show the zoomed-in area.
In addition, a tiepoint supplementing process was applied. Supplementary tiepoints were created for empty buckets by interpolating neighboring tiepoints. The interpolation radius was set proportional to the bucket size. When there were no neighboring tiepoints within the interpolation radius, no supplemented tiepoints were assigned. The images in the third and fourth rows of Figure 14 and Figure A1, Figure A2 and Figure A3 show the results of tiepoint supplementing. The images show that the 5 m buckets generated more points than necessary. For tiepoint supplementing, the results of the 10 m buckets and 15 m buckets showed adequate point generation for areas lacking georeferenced tiepoints. Considering the comparison of tiepoint sampling results and tiepoint supplementing results, the 10 m buckets seemed suitable for our proposed method. Nevertheless, the results of all three bucket sizes were used for TIN generation and mosaicking for the purpose of comparison. Compared to the initial georeferenced tiepoints shown in Figure 11, Figure 12 and Figure 13, evenly distributed tiepoints were generated by the proposed tiepoint bucketing. Table 6, Table 7 and Table 8 summarize the results of TIN generation for each dataset and for each bucket size. As the bucket size increased, the number of bucketed tiepoints and the number of TIN facets decreased.

Table 6.
Results of TIN generation using initial and bucketed tiepoints for Dataset 1.

Table 7.
Results of TIN generation using initial and bucketed tiepoints for Dataset 2.

Table 8.
Results of TIN generation using initial and bucketed tiepoints for Dataset 3.
Figure 15 shows the results of the TIN construction using the tiepoints after the 10 m bucketing. Figure A4, Figure A5 and Figure A6 show the results of the TIN construction using initial georeferenced tiepoints, the tiepoints after the 5 m and 15 m bucketing. The TINs based on initial georeferenced tiepoints had very irregular sized facets, depending on the distribution of the initial tiepoints. All TINs based on the bucketed tiepoints had relatively uniform-sized facets compared to the initial TIN. For the TIN from the 5 m buckets, TIN facets were very tightly packed. For the TINs from the 10 m and 15 m buckets, TIN facets were distributed more evenly and with more uniform shape.
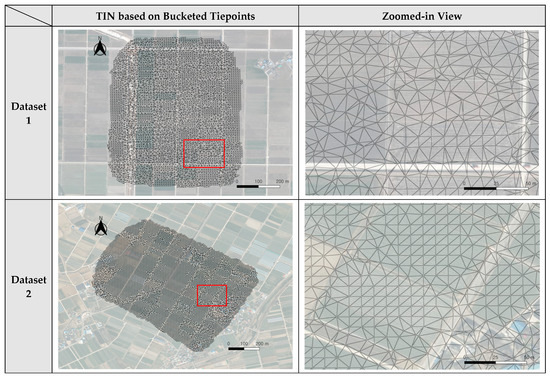

Figure 15.
Results of TIN generation for overall region of interest (left images) and for enlarged regions shown as red boxes (right images) using the 10 m bucketing. The red boxes show the zoomed-in area.
3.3. Results of TIN-Based Image Mosaicking
Using the TINs generated by bucketed tiepoints, the process of seamline determination was proceeded. We first assigned the stitching image to each TIN facet and defined seamlines as the boundaries of adjacent TIN facets with different stitching images. The mosaicked image was generated by mapping the image patch corresponding to each TIN facet to the reference plane. In this paper, we applied image mosaicking to the TINs generated from initial georeferenced tiepoints and from bucketed tiepoints by the three bucket sizes. Figure 16, Figure 17 and Figure 18 show the mosaicked images and seamlines extracted in the case of applying 10 m buckets. Figure A7, Figure A8 and Figure A9 show the results for using initial georeferenced tiepoints, the tiepoints after the 5 m and 15 m bucketing. In these figures, seamlines are plotted as black lines.
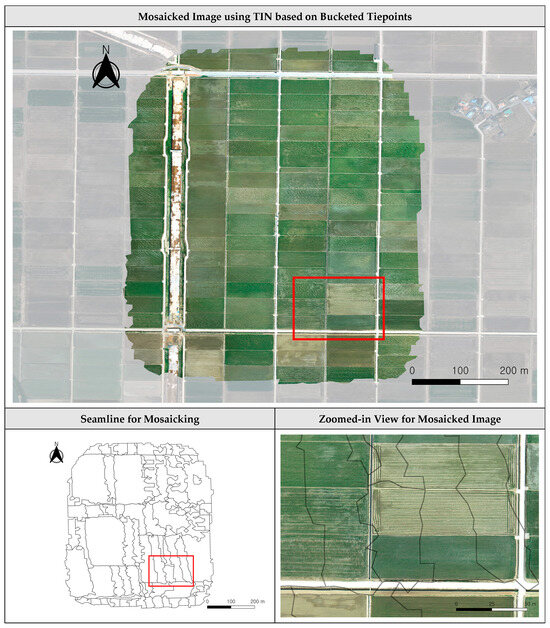
Figure 16.
Mosaicked image using TIN based on bucketed tiepoints by 10 m for Dataset 1.
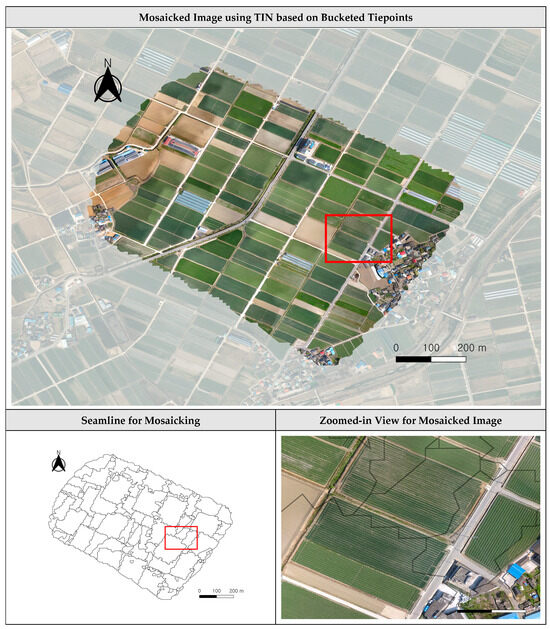
Figure 17.
Mosaicked image using TIN based on bucketed tiepoints by 10 m for Dataset 2.
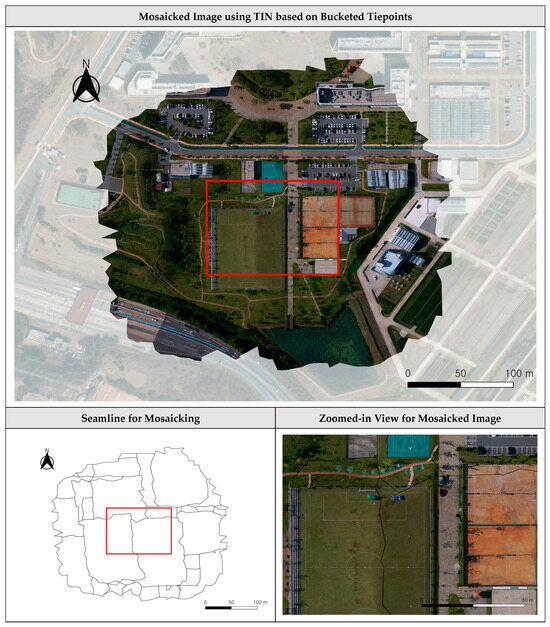
Figure 18.
Mosaicked image using TIN based on bucketed tiepoints by 10 m for Dataset 3.
For all datasets, the mosaicked images based on the initial tiepoints had no misalignment along seamlines. In Dataset 2, some TIN facets in areas with sparse georeferenced tiepoints were too large to be included in a single image. Therefore, the mosaicked image from the TIN by initial tiepoints suffered from large omissions and mosaic holes.
Table 9, Table 10 and Table 11 show the overall processing times of the proposed method according to the bucket size. The processing times for tiepoint extraction and bundle adjustment were the same for all cases. They were the largest among the processing time taken for each step for all cases. The process of tiepoint bucketing TIN generation and image mosaicking took much less time. This confirms that our proposed method could generate image mosaics promptly in less than 5 s per image.

Table 9.
Total processing time for proposed mosaicking by tiepoints used for Dataset 1.

Table 10.
Total processing time for proposed mosaicking by tiepoints used for Dataset 2.

Table 11.
Total processing time for proposed mosaicking by tiepoints used for Dataset 3.
On the other hand, the overall processing time for the 5 m bucket size was the largest among all cases. The processing times for the 10 m bucket size and the 15 m bucket size were similar to each other. The processing time for TIN generation was proportional to the number of bucketed tiepoints as already shown in Table 6, Table 7 and Table 8. In Datasets 1 and 3, there were many initial georeferenced tiepoints and the processing times for TIN generation from bucketed tiepoints were much shorter than the time using the initial georeferenced tiepoints. However, in Dataset 2, there were fewer georeferenced tiepoints. The processing time for TIN generation from the 5 m bucketed tiepoints was larger than the time using the initial georeferenced tiepoints. This was due to the time taken for empty bucket supplementing. The processing time for mosaicking decreased slightly as the bucket size increased to 10 and 15 m.
4. Discussion
Reprojection error verification, which refines tiepoints before bundle adjustment, requires triple tiepoints matched from three or more images. Therefore, the ORB algorithm, which extracts relatively few triple tiepoints, did not seemed to be suitable for our proposed method. Since our bundle adjustment requires triple tiepoints, the ORB algorithm tested seemed unsuitable for image mosaicking. However, the processing time of the ORB algorithm showed fast tiepoint extraction. The SURF algorithm has performed consistent keypoint extraction and matching across multiple images. The processing time per image was about 2.7 s, which was slower than the ORB algorithm. However, the larger number of multiple tiepoints outweighed the processing time. The GPU-based SURF algorithm seemed to be more suitable for our method.
In the bundle adjustments, the reprojection errors and Y-parallaxes indicate that the bundle adjustment achieved accurate image orientations and precisely georeferenced tiepoints. The bundle adjustments took about 4 min, resulting in a processing time of 1.76 s per image. This meant that it was relatively fast, despite performing highly accurate bundle adjustments. Tiepoints by bundle adjustments were densely located in some parts and sparsely in other parts for Dataset 1. After bucketing, tiepoints were successfully sampled and supplemented. For Dataset 2, the tiepoints extracted were smallest among the three datasets. Tiepoint supplementing was most effective for Dataset 2. For Dataset 3, the tiepoints extracted were largest among the three datasets. Tiepoint sampling was most effective for Dataset 3. In terms of processing time, the time for tiepoint sampling was not significant for all cases. Tiepoint supplementing took the most processing time for bucketing.
TINs formed from initial georeferenced tiepoints have many small facets in texture-rich regions and many large facets in texture-poor regions, depending on the distribution of those tiepoints. In contrast, TINs formed from bucketed type points have an even size and distribution of facets. This allowed the facets of a TIN formed by bucketed tiepoints to be used as a stable unit of image transformation for proposed mosaicking. The time for TIN generation was proportional to the number of the final bucketed tiepoints and the TIN facets. Compared to the TIN generation time using initial georeferenced tiepoints, a significant reduction in the processing time was achieved with tiepoint bucketing. The mosaicked images based on the bucketed tiepoints were also free of seamline misalignment errors. In these mosaicked images, all omission errors that occurred in initial mosaicked images were removed. As the bucket size increased, the supplemented area on the outer mosaic became smaller, and the seamlines in each image became simpler. The problems such as mosaic holes, which were present in the initial mosaicked images of Dataset 2, were also eliminated. When looking at overall processing times among different bucket sizes, the bucket sizes of 10 and 15 m were suitable for our experimental setting. In conclusion, we achieved very fast image mosaicking without seamline misalignments and mosaic holes by the use of TIN of the bucketed tiepoints proposed in this paper. The experimental areas defined in this study have a simple terrain and few objects such as buildings. For these areas, our proposed method was able to generate a mosaicked image without the seamline misalignments, even not generating a dense DSM like the SfM technique.
5. Conclusions
In this study, we proposed a TIN-based novel image mosaicking approach that combines the terrain-based and image-based approaches. By applying a rigorous bundle adjustment, we obtained tiepoints with accurate ground coordinates. We applied a bucketing algorithm to generate evenly distributed tiepoints. We then constructed a TIN from the bucketed tiepoints. Finally, we determined mosaic seamlines using the TINs and stitched images along the TIN facets.
To improve the speed of image mosaicking, we utilized a self-generated TIN using tiepoints instead of DSMs. Further, we extracted bucketed tiepoints to optimize the quantity and distribution of TIN. As a result, we reduced the computation of image mosaicking and could confirm fast processing times of around 5 s per image. The traditional image-based approach assumes a planar surface for mosaicking. Our approach removed this assumption by forming TIN facets based on the ground coordinates of tiepoints. Using only the images, we achieved fast image mosaicking without misalignment problems along mosaic seamlines.
The major contribution of this paper includes that we proposed the usage of TIN of tiepoints as a replacement of dense DSM for image mosaicking. The experimental results showed that our method can be used for fast UAV image mosaicking. These contributions may be due to the characteristics of flat terrain in that it does not contain abrupt elevation changes. The application of our proposed method to other surface types, such as dense urban terrain, shall be left as our further research.
Author Contributions
Conceptualization, T.K.; Methodology, S.-J.Y. and T.K.; Software, S.-J.Y. and T.K.; Validation, S.-J.Y.; Formal analysis, T.K.; Writing—original draft, S.-J.Y.; Writing—review & editing, T.K.; Visualization, S.-J.Y. All authors have read and agreed to the published version of the manuscript.
Funding
This study was carried out with the support of “Cooperative Research Program for Agriculture Science and Technology Development (Project No. PJ0162332022)” Rural Development Admin-istration, Republic of Korea.
Data Availability Statement
Data are contained within the article.
Acknowledgments
The authors thank the reviewers for their comments on the manuscript.
Conflicts of Interest
The authors declare no conflict of interest.
Appendix A. Results by the 5 m Buckets and 15 m Buckets for All Datasets
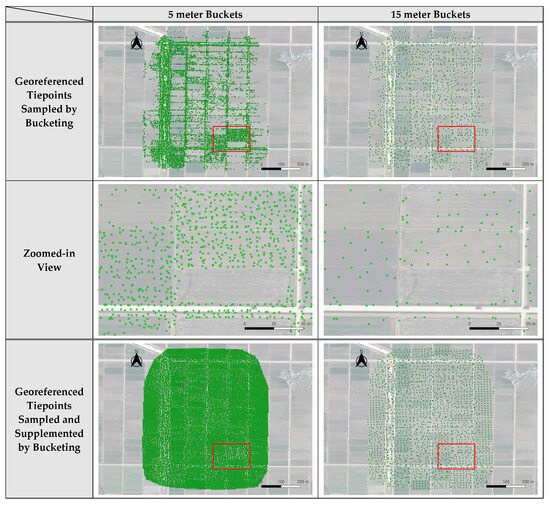

Figure A1.
Bucketed tiepoints by 5 and 15 m on satellite basemap for Dataset 1. The green points indicate the location of the georeferenced tiepoint, and the red boxes show the zoomed-in area.
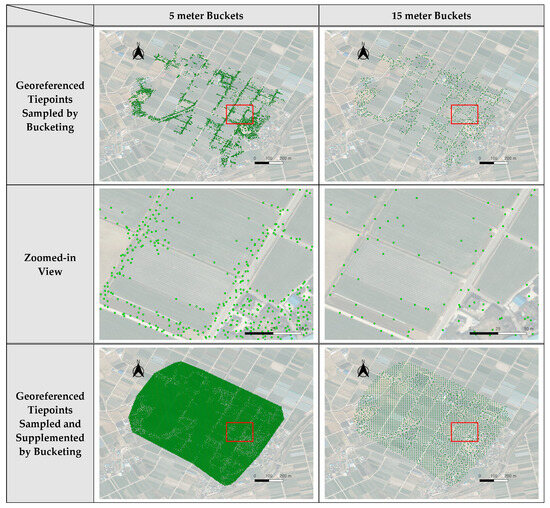

Figure A2.
Bucketed tiepoints by 5 and 15 m on satellite basemap for Dataset 2.
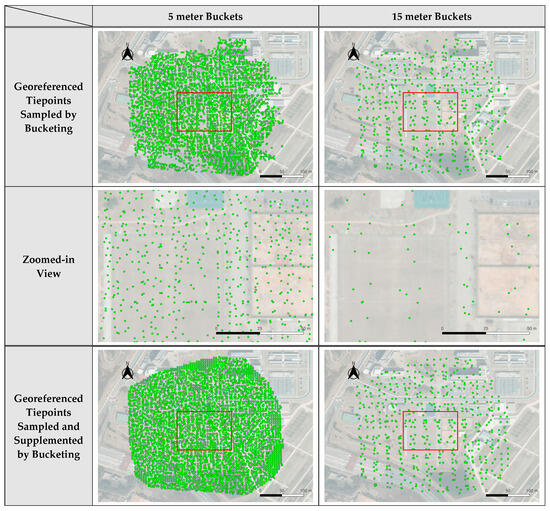

Figure A3.
Bucketed tiepoints by 5 and 15 m on satellite basemap for Dataset 3.
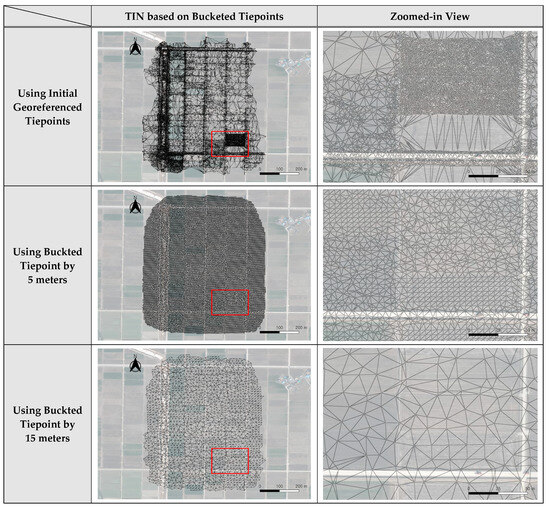
Figure A4.
Results of TIN generation for overall region of interest (left images) and for enlarged regions shown as red boxes (right images) using the initial georeferenced tiepoints (top row), the 5 m bucketing (second row) and the 15 m bucketing (bottom row) for Dataset 1.
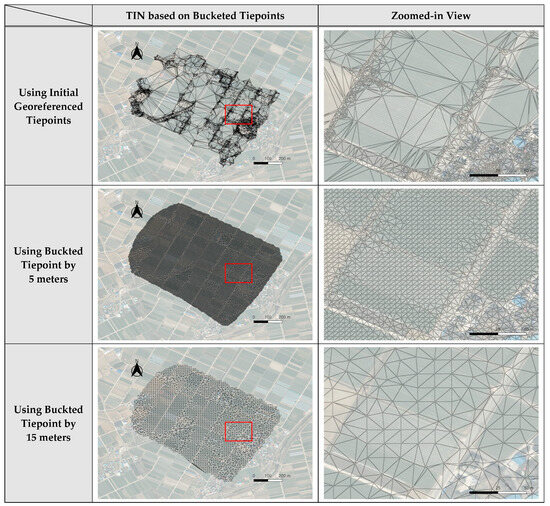
Figure A5.
Results of TIN generation for overall region of interest (left images) and for enlarged regions shown as red boxes (right images) using the initial georeferenced tiepoints (top row), the 5 m bucketing (second row) and the 15 m bucketing (bottom row) for Dataset 2.
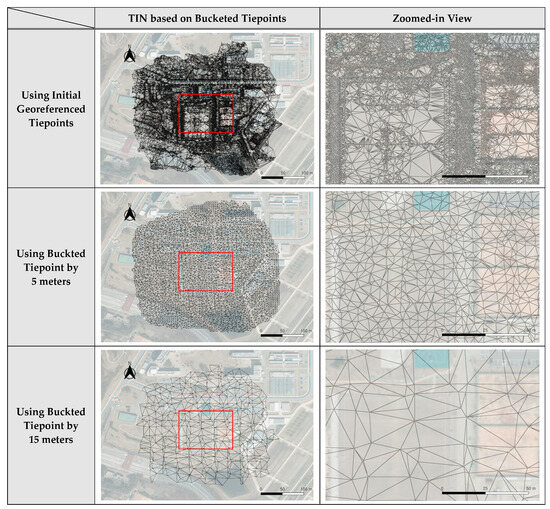
Figure A6.
Results of TIN generation for overall region of interest (left images) and for enlarged regions shown as red boxes (right images) using the initial georeferenced tiepoints (top row), the 5 m bucketing (second row) and the 15 m bucketing (bottom row) for Dataset 3.
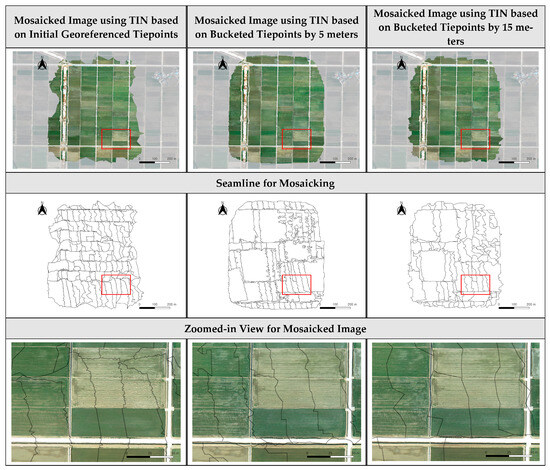
Figure A7.
Mosaicked image using TIN based on initial georeferenced tiepoints, bucketed tiepoints by 5 and 15 m for Dataset 1.
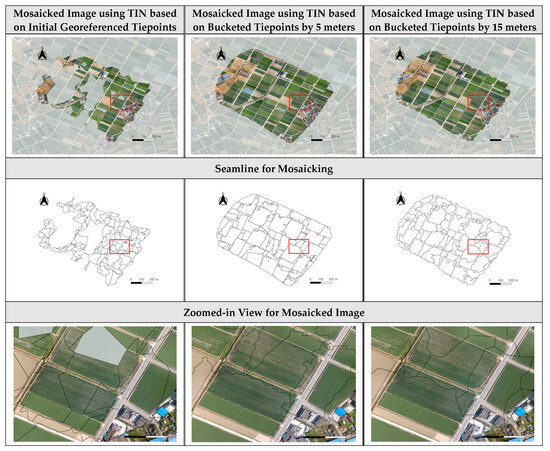
Figure A8.
Mosaicked image using TIN based on initial georeferenced tiepoints, bucketed tiepoints by 5 and 15 m for Dataset 2.
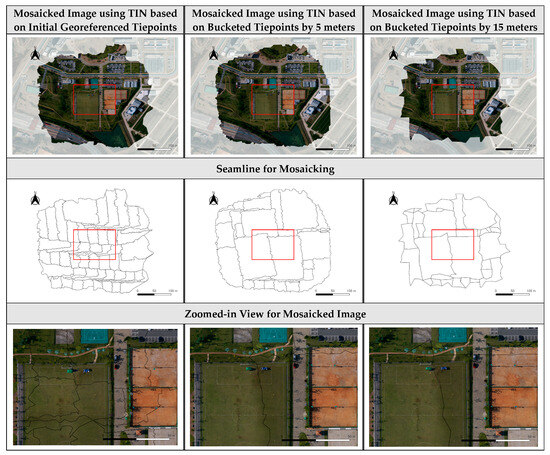
Figure A9.
Mosaicked image using TIN based on initial georeferenced tiepoints, bucketed tiepoints by 5 and 15 m for Dataset 3.
References
- Li, X.; Feng, R.; Guan, X.; Shen, H.; Zhang, L. Remote sensing image mosaicking: Achievements and challenges. IEEE Geosci. Remote Sens. Mag. 2019, 7, 8–22. [Google Scholar] [CrossRef]
- Kim, J.; Kim, T.; Shin, D.; Kim, S.H. Robust mosaicking of UAV images with narrow overlaps. Int. Arch. Photogramm. Remote Sens. Spat. Inf. Sci. 2016, 41, 879–883. [Google Scholar] [CrossRef]
- Wu, J.; Pan, S.; Luo, Y.; Chen, D. Online Ortho-rectification and Mosaic of UAV aerial imagery for emergency remote sensing. In Proceedings of the ICETIS 2022 7th International Conference on Electronic Technology and Information Science, Harbin, China, 21–23 January 2022. [Google Scholar]
- Zhang, J.; Xu, S.; Zhao, Y.; Sun, J.; Xu, S.; Zhang, X. Aerial orthoimage generation for UAV remote sensing. Inf. Fusion 2023, 89, 91–120. [Google Scholar] [CrossRef]
- Schonberger, J.L.; Frahm, J.M. Structure-from-motion revisited. In Proceedings of the IEEE Conference on Computer Vision and Pattern Recognition, Las Vegas, NV, USA, 27–30 June 2016. [Google Scholar]
- Im, C.; Jeong, J.H.; Jeong, C.S. Parallel Large-Scale Image Processing for Orthorectification. In Proceedings of the TENCON 2018–2018 IEEE Region 10 Conference, Jeju, Republic of Korea, 28–31 October 2018. [Google Scholar]
- Zhou, G.; Zhang, R.; Zhang, D.; Huang, J.; Baysal, O. Real-time ortho-rectification for remote-sensing images. Int. J. Remote Sens. 2019, 40, 2451–2465. [Google Scholar] [CrossRef]
- Yuan, Y.; Fang, F.; Zhang, G. Superpixel-based seamless image stitching for UAV images. IEEE Trans. Geosci. Remote Sens. 2020, 59, 1565–1576. [Google Scholar] [CrossRef]
- Kim, J.I.; Kim, T.; Shin, D.; Kim, S. Fast and robust geometric correction for mosaicking UAV images with narrow overlaps. Int. J. Remote Sens. 2017, 38, 2557–2576. [Google Scholar] [CrossRef]
- Shao, R.; Du, C.; Chen, H.; Li, J. Fast anchor point matching for emergency UAV image stitching using position and pose information. Sensors 2020, 20, 2007. [Google Scholar] [CrossRef] [PubMed]
- Liu, Y.; He, M.; Wang, Y.; Sun, Y.; Gao, X. Farmland aerial images fast-stitching method and application based on improved sift algorithm. IEEE Access 2022, 10, 95411–95424. [Google Scholar] [CrossRef]
- Li, R.; Gao, P.; Cai, X.; Chen, X.; Wei, J.; Cheng, Y.; Zhao, H. A Real-Time Incremental Video Mosaic Framework for UAV Remote Sensing. Remote Sens. 2023, 15, 2127. [Google Scholar] [CrossRef]
- Zhang, F.; Yang, T.; Liu, L.; Liang, B.; Bai, Y.; Li, J. Image-only real-time incremental UAV image mosaic for multi-strip flight. IEEE Trans. Multimed. 2020, 23, 1410–1425. [Google Scholar] [CrossRef]
- Sharma, S.K.; Jain, K.; Shukla, A.K. A Comparative Analysis of Feature Detectors and Descriptors for Image Stitching. Appl. Sci. 2023, 13, 6015. [Google Scholar] [CrossRef]
- Pham, N.T.; Park, S.; Park, C.S. Fast and efficient method for large-scale aerial image stitching. IEEE Access 2021, 9, 127852–127865. [Google Scholar] [CrossRef]
- Lim, P.C.; Rhee, S.; Seo, J.; Kim, J.I.; Chi, J.; Lee, S.B.; Kim, T. An optimal image–selection algorithm for large-scale stereoscopic mapping of uav images. Remote Sens. 2021, 13, 2118. [Google Scholar] [CrossRef]
- Forero, M.G.; Mambuscay, C.L.; Monroy, M.F.; Miranda, S.L.; Méndez, D.; Valencia, M.O.; Gomez Selvaraj, M. Comparative analysis of detectors and feature descriptors for multispectral image matching in rice crops. Plants 2021, 10, 1791. [Google Scholar] [CrossRef] [PubMed]
- Diarra, M.; Gouton, P.; Jerome, A.K. A comparative study of descriptors and detectors in multispectral face recognition. In Proceedings of the 2016 12th International Conference on Signal-Image Technology & Internet-Based Systems (SITIS), Naples, Italy, 28 November–1 December 2016. [Google Scholar]
- Noble, F.K. Comparison of OpenCV’s feature detectors and feature matchers. In Proceedings of the 2016 23rd International Conference on Mechatronics and Machine Vision in Practice (M2VIP), Nanjing, China, 28–30 November 2016. [Google Scholar]
- Rublee, E.; Rabaud, V.; Konolige, K.; Bradski, G. ORB: An efficient alternative to SIFT or SURF. In Proceedings of the 2011 International Conference on Computer Vision, Barcelona, Spain, 6–13 November 2011. [Google Scholar]
- Bay, H.; Ess, A.; Tuytelaars, T.; Van Gool, L. Speeded-up robust features (SURF). Comput. Vis. Image Underst. 2008, 110, 346–359. [Google Scholar] [CrossRef]
- Thompson, M.M.; Eller, R.C.; Radlinski, W.A.; Speert, J.L. Manual of Photogrammetry, 6th ed.; American Society for Photogrammetry and Remote Sensing (ASPRS): Bethesda, MD, USA, 2013; pp. 121–159. [Google Scholar]
- Bergström, P.; Edlund, O. Robust registration of point sets using iteratively reweighted least squares. Comput. Optim. Appl. 2014, 58, 543–561. [Google Scholar] [CrossRef]
- Park, D.; Cho, H.; Kim, Y. A TIN compression method using Delaunay triangulation. Int. J. Geogr. Inf. Sci. 2001, 15, 255–269. [Google Scholar] [CrossRef]
Disclaimer/Publisher’s Note: The statements, opinions and data contained in all publications are solely those of the individual author(s) and contributor(s) and not of MDPI and/or the editor(s). MDPI and/or the editor(s) disclaim responsibility for any injury to people or property resulting from any ideas, methods, instructions or products referred to in the content. |
© 2023 by the authors. Licensee MDPI, Basel, Switzerland. This article is an open access article distributed under the terms and conditions of the Creative Commons Attribution (CC BY) license (https://creativecommons.org/licenses/by/4.0/).