Abstract
Semantic segmentation plays a pivotal role in the intelligent interpretation of remote sensing images (RSIs). However, conventional methods predominantly focus on learning representations within the spatial domain, often resulting in suboptimal discriminative capabilities. Given the intrinsic spectral characteristics of RSIs, it becomes imperative to enhance the discriminative potential of these representations by integrating spectral context alongside spatial information. In this paper, we introduce the spectrum-space collaborative network (SSCNet), which is designed to capture both spectral and spatial dependencies, thereby elevating the quality of semantic segmentation in RSIs. Our innovative approach features a joint spectral–spatial attention module (JSSA) that concurrently employs spectral attention (SpeA) and spatial attention (SpaA). Instead of feature-level aggregation, we propose the fusion of attention maps to gather spectral and spatial contexts from their respective branches. Within SpeA, we calculate the position-wise spectral similarity using the complex spectral Euclidean distance (CSED) of the real and imaginary components of projected feature maps in the frequency domain. To comprehensively calculate both spectral and spatial losses, we introduce edge loss, Dice loss, and cross-entropy loss, subsequently merging them with appropriate weighting. Extensive experiments on the ISPRS Potsdam and LoveDA datasets underscore SSCNet’s superior performance compared with several state-of-the-art methods. Furthermore, an ablation study confirms the efficacy of SpeA.
1. Introduction
Remote sensing images (RSIs) are acquired through intermediate imaging sensors, typically mounted on satellites, aircraft, and unmanned aerial vehicles (UAVs), enabling non-contact observation of terrestrial objects [1]. A comprehensive semantic understanding of RSIs significantly influences various downstream applications, including water resource management [2,3], land cover classification [4,5,6], urban planning [7,8,9], and hazard assessment [10,11]. To achieve the precise labeling of individual pixels with specific classes, semantic segmentation [12], originally designed for natural image processing, has been successfully applied to RSIs with exceptional performance.
Traditional segmentation methods primarily relied on manually crafted features as guidance for pixel recognition. In the initial stages, classical techniques such as logistic regression [13] and distance measures [14] were favored for their stability and user-friendliness. Subsequently, more advanced models, including support vector machines (SVMs) [15], Markov random fields (MRFs) [16], random forests (RFs) [17], and conditional random fields (CRFs) [18], were developed to enhance the classification process. However, despite the introduction of robust classifiers, the use of artificially selected features inherently limited overall performance, particularly in terms of accuracy.
Deep convolutional neural networks (DCNNs) have gained prominence for their exceptional performance in a multitude of computer vision tasks [19,20,21]. DCNNs possess the ability to automatically derive task-specific features, making them an optimal choice for handling complex scenarios. Consequently, the remote sensing community has become increasingly intrigued by the potential application of DCNNs in processing RSIs. This interest has led to the development of several DCNN-based RSI interpretation methods, showcasing their adaptability in comprehending multi-source and multi-resolution RSIs [22,23]. While these methods have significantly improved representation learning and classifier training, they are fundamentally constrained by the fixed geometry of convolutional neural networks, resulting in limited local receptive fields and short-range contextual awareness. Moreover, RSI presents unique challenges due to its broad scope, diverse objects, and varying resolutions compared to natural imagery.
Upon comprehensive review, it is evident that leveraging contextual information offers a promising approach to enhancing the discriminative capacity of learned representations. Two distinct methodologies have been proposed to integrate extensive contextual knowledge, thereby enriching pixel-wise representations within segmentation networks. Initially, several studies have incorporated different-scale dilated convolutional layers and pooling functions to capture multi-scale features. For instance, in the realm of RSI semantic segmentation, MLCRNet [24] introduced multi-level context aggregation and achieved superior performance on benchmark datasets such as ISPRS Potsdam [25] and Vaihingen [26]. Furthermore, Shang et al. devised a multi-scale feature fusion network using atrous convolutions [27], and Du et al. crafted a similar semantic segmentation network tailored for mapping urban functional zones [28].
A sophisticated approach involves the incorporation of attention modules designed to capture long-range dependencies. Attention, a cognitive process focusing selectively on specific information while disregarding other perceptible data, plays a pivotal role in human cognition and survival [29,30]. Leveraging the self-attention mechanism (SAM), the network can concentrate on information-rich regions, thereby enhancing the representation of crucial areas. Consequently, segmentation accuracy has witnessed a substantial rise with the emergence of attention-based methods [31]. In the realm of RSIs, Li et al. introduced innovative strategies for addressing the challenge of segmenting large-scale satellite RSI, including dual attention and deep fusion techniques [32]. Li et al. proposed a multi-attention network that extracts contextual dependencies while maintaining computational efficiency [33]. HCANet was developed to amalgamate cross-level contextual and attentive representations through the utilization of the attention mechanism [34]. EDENet skillfully learned edge distributions through the design of a distribution attention module, effectively injecting edge information in a learnable manner [35]. Lei et al. proposed LANet, which bridges the gap between high-level and low-level features by incorporating a patch attention module to focus locally [36]. In summary, the attention mechanism has demonstrated its superiority in the field of RSI, enabling models to recognize and accommodate diverse intra-class variances and subtle inter-class distinctions [37].
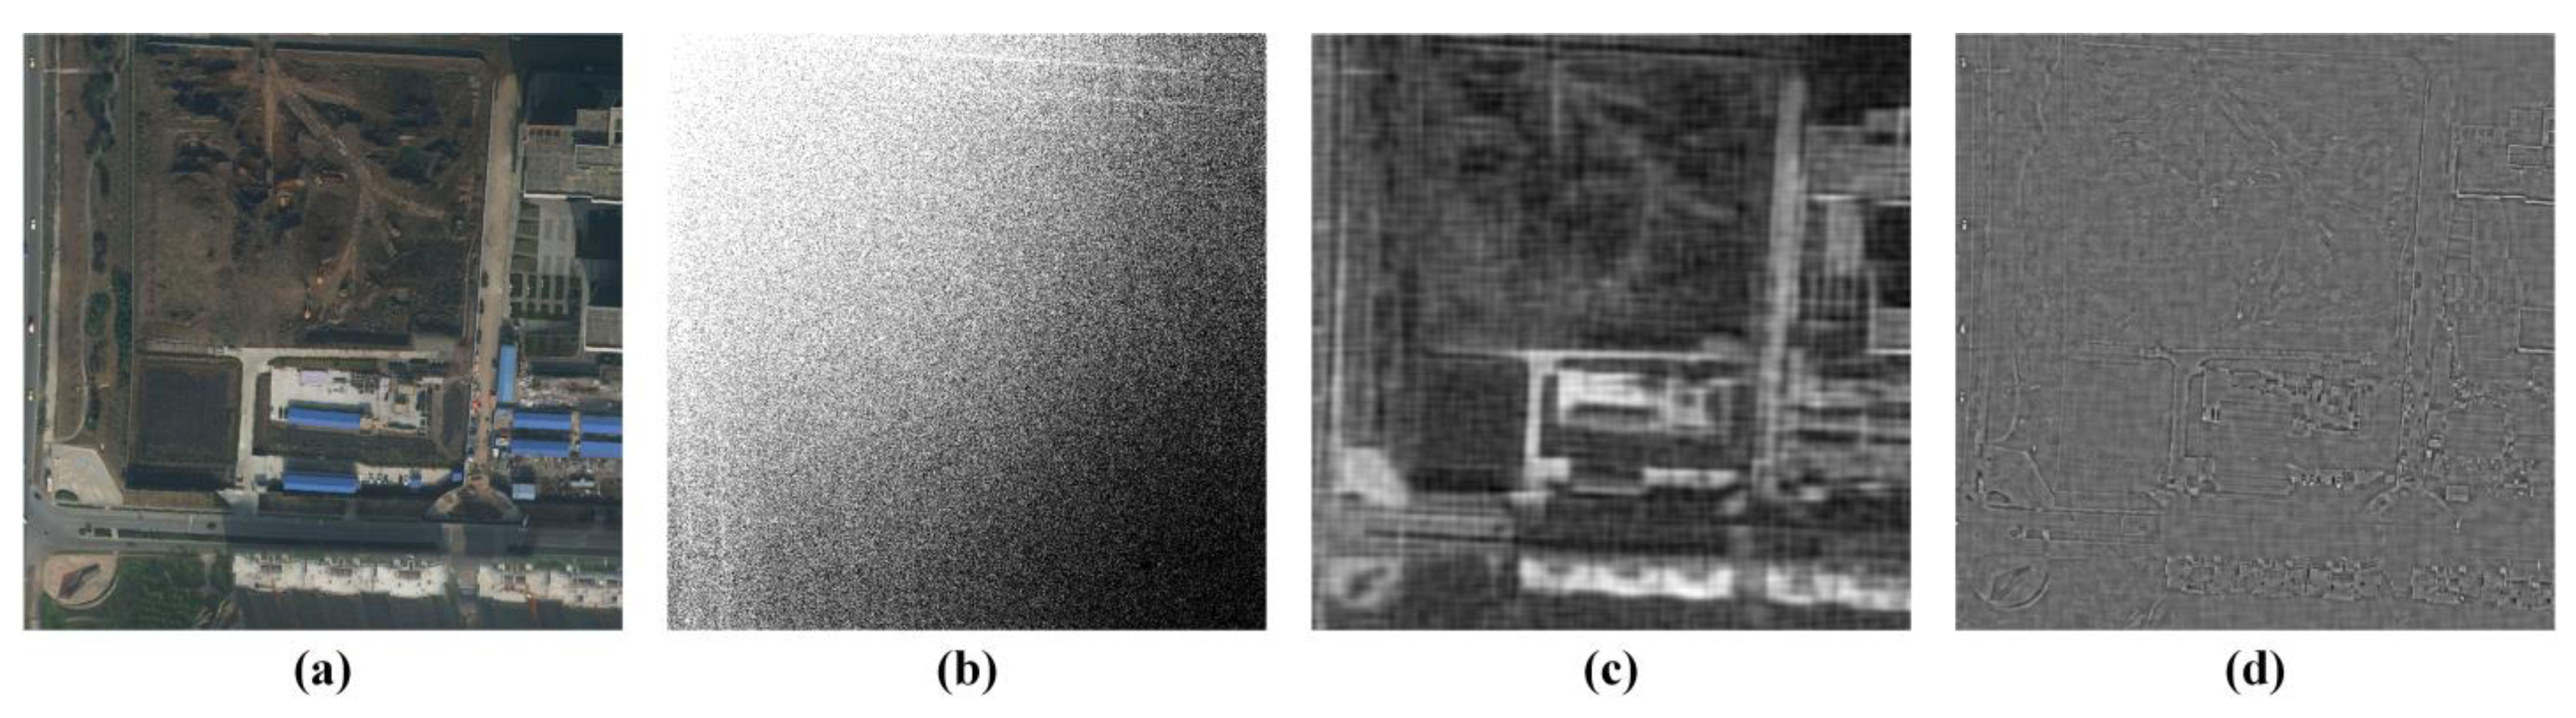
However, all the aforementioned methods were primarily designed for processing RSI and learning features within the spatial domain without giving due consideration to their spectral properties. In the realm of image processing, the inner body and edges correspond to low and high-frequency components, respectively. This relationship is visually represented in Figure 1, where we illustrate an RSI and provide a frequency image. In Figure 1c, we showcase the low-frequency component, while Figure 1d presents the high-frequency component, solidifying this assumption. Furthermore, self-attention is fundamentally developed to enhance the internal consistency of objects through similarity measurement. However, self-attention employs identical learnable parameters for all frequency components, hindering its ability to simultaneously enhance internal consistency and inter-object edge contouring. Therefore, the effective utilization of frequency domain features, particularly in learning the spectral context inherent in remote sensing images, becomes paramount.
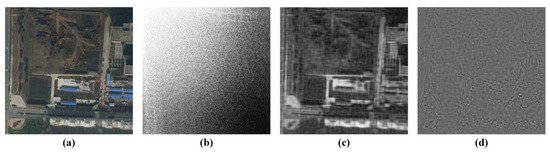
Figure 1.
Illustration of frequency domain features. (a) Raw image, (b) 2D FFT transformed frequency image, (c) low-frequency components, and (d) high-frequency components.
In summary, we contend that while learning representations of remote sensing images using convolutional neural networks and self-attention mechanisms within the spatial domain enhance internal consistency, they inadequately incorporate spectral contexts and erode edge details. Hence, this observation suggests the need to optimize learned representations in both the frequency and spatial domains, requiring skillful aggregation across these domains. To address these challenges, this paper introduces a novel approach. Firstly, we propose a joint spectral–spatial attention (JSSA) that deploys spectral attention (SpeA) and spatial attention (SpaA) in parallel. Instead of mere feature-level aggregation, we devise a post-weighted summation of the two attention maps to create a unified attention map that concurrently incorporates spectral and spatial contexts. To facilitate this, we formulate a novel loss function to train the network in learning discriminative representations within the spectral and spatial domains. Finally, this integrated approach results in the spectrum-space collaborative network (SSCNet), which accurately performs pixel-level segmentation of ground objects in remote sensing images. The primary contributions of this work are summarized as follows:
- (1)
- We propose a SpeA for capturing the spectral context in the frequency domain. SpeA first maps the feature map into the frequency domain using a 2D fast Fourier transform (2D FFT) layer. Considering that the transformed features may be complex, we compute pairwise similarity by measuring the complex spectral Euclidean distance (CSED) of the real and imaginary parts. Subsequently, we create SpeA maps by weighted summation, enabling the prioritization of spectral features in attention modeling.
- (2)
- To comprehensively model and utilize contexts that span spectral and spatial domains, we present the JSSA module. For spatial contexts, we incorporate position-wise self-attention as a parallel SpaA branch. Through an attention fusion (AttnFusion) module, we merge the attention maps obtained from SpeA and SpaA. This results in JSSA producing an attention map that considers both spectral and spatial contexts simultaneously.
- (3)
- We formulate a hybrid loss function (HLF) that encompasses both spectral and spatial losses. Concerning the high-frequency components, we calculate edge loss. While promoting the inner consistency of objects, mainly represented by low-frequency components, we introduce Dice loss to compensate. Simultaneously, we employ cross-entropy loss to supervise the spatial aspects. By combining these losses with appropriate weights, we establish a hybrid loss function that facilitates the network in learning discriminative representations within both the frequency and spatial domains.
- (4)
- Complementing the above-mentioned designs, we propose the SSCNet, a semantic segmentation network for remote sensing images. Thorough experimentation demonstrates its superior performance compared with other state-of-the-art methods. Furthermore, an ablation study corroborates the efficacy of the SpeA component.
This paper is structured as follows. Section 2 provides an overview of related research in semantic segmentation of RSI and methods focused on frequency domain-based learning. Section 3 introduces the comprehensive network architecture along with the individual sub-modules and their formulations. Section 4 compiles and compares the findings based on two prominent RSI datasets to verify the model’s performance, followed by in-depth discussions. Section 5 offers conclusions drawn from this study and outlines potential future research directions.
2. Related Works
2.1. Semantic Segmentation for RSIs
Semantic segmentation of RSIs aims to accurately assign pixel-level semantic labels corresponding to land cover types. Despite the advancements in computer vision, it has not yet led to a revolutionary transformation in the field of semantic segmentation for RSIs [38,39]. From an image processing perspective, semantic segmentation of remote sensing images and natural images exhibits several key distinctions. RSIs typically feature intricate details in diverse landscapes and often incorporate multiple spectral bands for enhanced discrimination. These images are susceptible to acquisition challenges, including cloud cover and seasonal variations, and demand georeferencing for geospatial analysis. RSIs contain a wide array of complex objects, such as buildings and vegetation, and are commonly employed in geospatial applications like land cover classification. In contrast, natural images possess very high spatial resolution and portray everyday objects and scenes under more controlled conditions. The complexity of objects in natural images is comparatively simpler, encompassing common subjects like animals and vehicles, and their utility extends to visual recognition and image editing tasks. These distinctions necessitate tailored image processing techniques and methodologies to address the specific requirements and challenges.
Significant enhancements are imperative in the domain of RSIs. Pastorino et al., building upon fully convolutional networks (FCNs), introduced a novel FCN variant by incorporating probabilistic graphical models. This model capitalizes on the inherent multi-scale nature of FCNs, aligning them with a hierarchical Markov model to address multi-scale data representations. The outcomes based on ISPRS Vaihingen and Potsdam datasets underscore remarkable improvements [40]. Additionally, Tao et al. devised MSNet, utilizing a dual-branch architecture to integrate comprehensive spectral information, leading to enhanced segmentation accuracy [41]. Similarly, Wang et al. presented DFANet, which encompasses a feature representation layer, intermediate and deep feature aggregation layers, and a feature aggregation module. This framework adeptly manages intricate transitions between distinct ground areas by capturing features at various resolutions, merging multi-scale features, assembling them into spatial feature maps, and optimizing results through a conditional random field module [42]. ResUNet-a [43] extends the U-Net baseline by introducing residual connections, atrous convolutions, pyramid scene parsing, pooling, and multi-tasking inference. Notably, it achieves remarkable accuracy despite having a high number of parameters. Likewise, PSE-UNet integrates principal component analysis (PCA) and attention mechanism based on U-Net to promote semantic segmentation of hyperspectral images [44]. Associated with PCA, PSE-UNet introduces cumulative variance contribution rate (CVCR) as a new metric for PCA-based dimensionality reduction. Taking advantage of the stable performance of U-Net architecture, Wei et al. proposed the DCCaps-UNet, a novel U-shaped hyperspectral image semantic segmentation model that leverages depthwise separable and conditional convolution capsule networks to enhance spatial information utilization and segmentation efficiency with fewer samples [45]. Although these designs effectively capture multi-scale features and enhance results through post-processing, they do not yet achieve optimal pixel-wise semantic inference due to limitations in contextual understanding.
Due to the versatile nature of the attention mechanism, RSIs have experienced significant exploration. The attention mechanism provides an effective means of learning and utilizing diverse RSI features beyond conventional convolution-only variants. For instance, Li et al. [32] introduced an innovative approach to enhance shallow layer features using spatial attention and deep layer features with channel attention, thereby enriching contextual clues for feature decoding. RAANet, incorporating residual connections, combines atrous spatial pyramid pooling with an attention mechanism, producing results that underscore the efficacy of the attention mechanism [46]. Zhang et al. [47] devised a hybrid network for segmenting very high-resolution remote sensing images, merging a Swin transformer and a CNN. This network features an encoder-decoder structure, spatial context modeling, a U-shaped decoder, and a boundary detection branch. Extensive experiments conducted on ISPRS benchmarks demonstrate that the network achieves the second-highest overall accuracy. Addressing the geo-homogeneity of superpixels in RSIs, Li et al. introduced HCANet [34], which hybridizes multi-level elements to enhance local representations without distorting the original pixel semantics. Similarly, LANet [36] treats local regions as semantically related objects and then proceeds to compute object-wise dependencies. In a parallel fashion, multiple attention modules are combined to ensure the extraction of ample contextual dependencies. In [48], an approach called attention aggregation feature pyramid network (A2-FPN) for the automatic segmentation of land in high-resolution remote sensing images was proposed. It enhances feature learning through an attention aggregation module (AAM), consequently enhancing segmentation accuracy. Comprehensive experiments conducted on four datasets validate the effectiveness of A2-FPN. More recently, Sun et al. introduced SPANet [49], a convolutional neural network designed to address the challenge of precisely segmenting small-scale objects and boundaries. SPANet amalgamates high-level and low-level features through a successive pooling attention module and a feature fusion module, thereby improving the accuracy of object edge segmentation. Experimental results demonstrate the effectiveness of SPANet on two remote sensing datasets. Li et al. [50] proposed a synergistic attention module (SAM) that jointly models spatial and channel affinities in remote sensing images. Similarly, a threshold attention network (TANet) designed for semantic segmentation in remote sensing images was introduced in [51]. TANet employs a threshold attention mechanism (TAM) to efficiently model feature dependencies, thereby reducing computational complexity. It combines an attentional feature enhancement module and a threshold attention pyramid pooling module, resulting in superior performance on the ISPRS Vaihingen and Potsdam datasets when compared to state-of-the-art models.
In summary, enhancing segmentation depends on the extraction and effective utilization of informative cues. However, conventional approaches primarily operate within the spatial domain while overlooking the inherent spectral properties. Moreover, these methods often result in distorted contextual information, especially in the spectral domain. To address this issue, our proposal involves synergistically modeling spectral and spatial contexts in an attentive manner. This approach refines the representation to preserve both spectral expressions and spatial details, consequently providing informative and valuable cues to boost discriminability.
2.2. Learning in Frequency Domain
Learning representations in the frequency domain offer a wealth of patterns for image understanding tasks. Ref. [52] employs frequency domain features for image classification, while Ref. [53] presents a model conversion algorithm to transform spatial-domain CNN models into the frequency domain. Ref. [54], on the other hand, sidesteps complex model transition procedures by utilizing SE blocks to select frequency channels. In addition, Ref. [55] introduces a frequency channel attention network. As can be observed, learning representations in the frequency domain allows the model to explicitly capture and process this spectral information, which may be less apparent in the spatial domain. Moreover, spectral analysis in the frequency domain can help discriminate subtle differences in spectral signatures of various land cover classes. By representing the data in the frequency domain, the model can better distinguish between materials or features that have similar spatial characteristics but distinct spectral properties, such as different types of vegetation or soil.
The frequency domain representations offer a natural framework for modeling spectral context. Spectral information often reveals correlations and interdependencies that are most effectively captured in the frequency domain. By learning representations in this domain, it becomes possible to harness this spectral context, which, in turn, proves beneficial in comprehending the intricate interactions across various spectral bands.
To summarize, the acquisition of representations in the frequency domain for spectral analysis in remote sensing images provides a robust approach to leverage the inherent spectral attributes of the data. This methodology enhances the model’s capacity to differentiate between different land cover classes, boosts its generalization capability, and facilitates the incorporation of spectral context into the semantic segmentation process. Ultimately, this results in more precise and resilient outcomes in remote sensing applications.
3. The Proposed Method
3.1. Overall Framework
As illustrated in Figure 2, the proposed SSCNet adopts the encoder-decoder architecture. SSCNet primarily introduces enhancements in two key areas. Firstly, we introduce a JSSA module, which comprehensively models and leverages contextual information spanning both the frequency and spatial domains. In the frequency domain, we generate a SpeA attention map, thoughtfully considering the spectral properties. Meanwhile, within the spatial domain, the position-wise self-attention mechanism captures context from the spatial-channel perspective. Post-fusion by the AttnFusion module, these two attention maps collectively provide JSSA with a well-rounded contextual foundation. JSSA effectively extends the integration of spectral context alongside the prevailing spatial-domain-based methodologies. Secondly, for the representation of high-frequency components, we incorporate edge distributions obtained from the ground truth to supervise the network. For the low-frequency ones, we introduce Dice loss to promote a low distortion in the inner consistency of objects. In correspondence, we formulate a hybrid loss function that embraces both spectral and spatial losses with appropriate weighting. This design encourages the network to learn informative spectral and spatial cues concurrently, thereby enhancing the discriminative capability of the acquired representation.
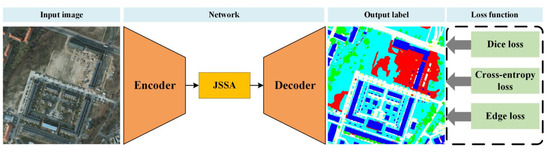
Figure 2.
Overall framework of SCCNet.
3.2. Joint Spectral–Spatial Attention
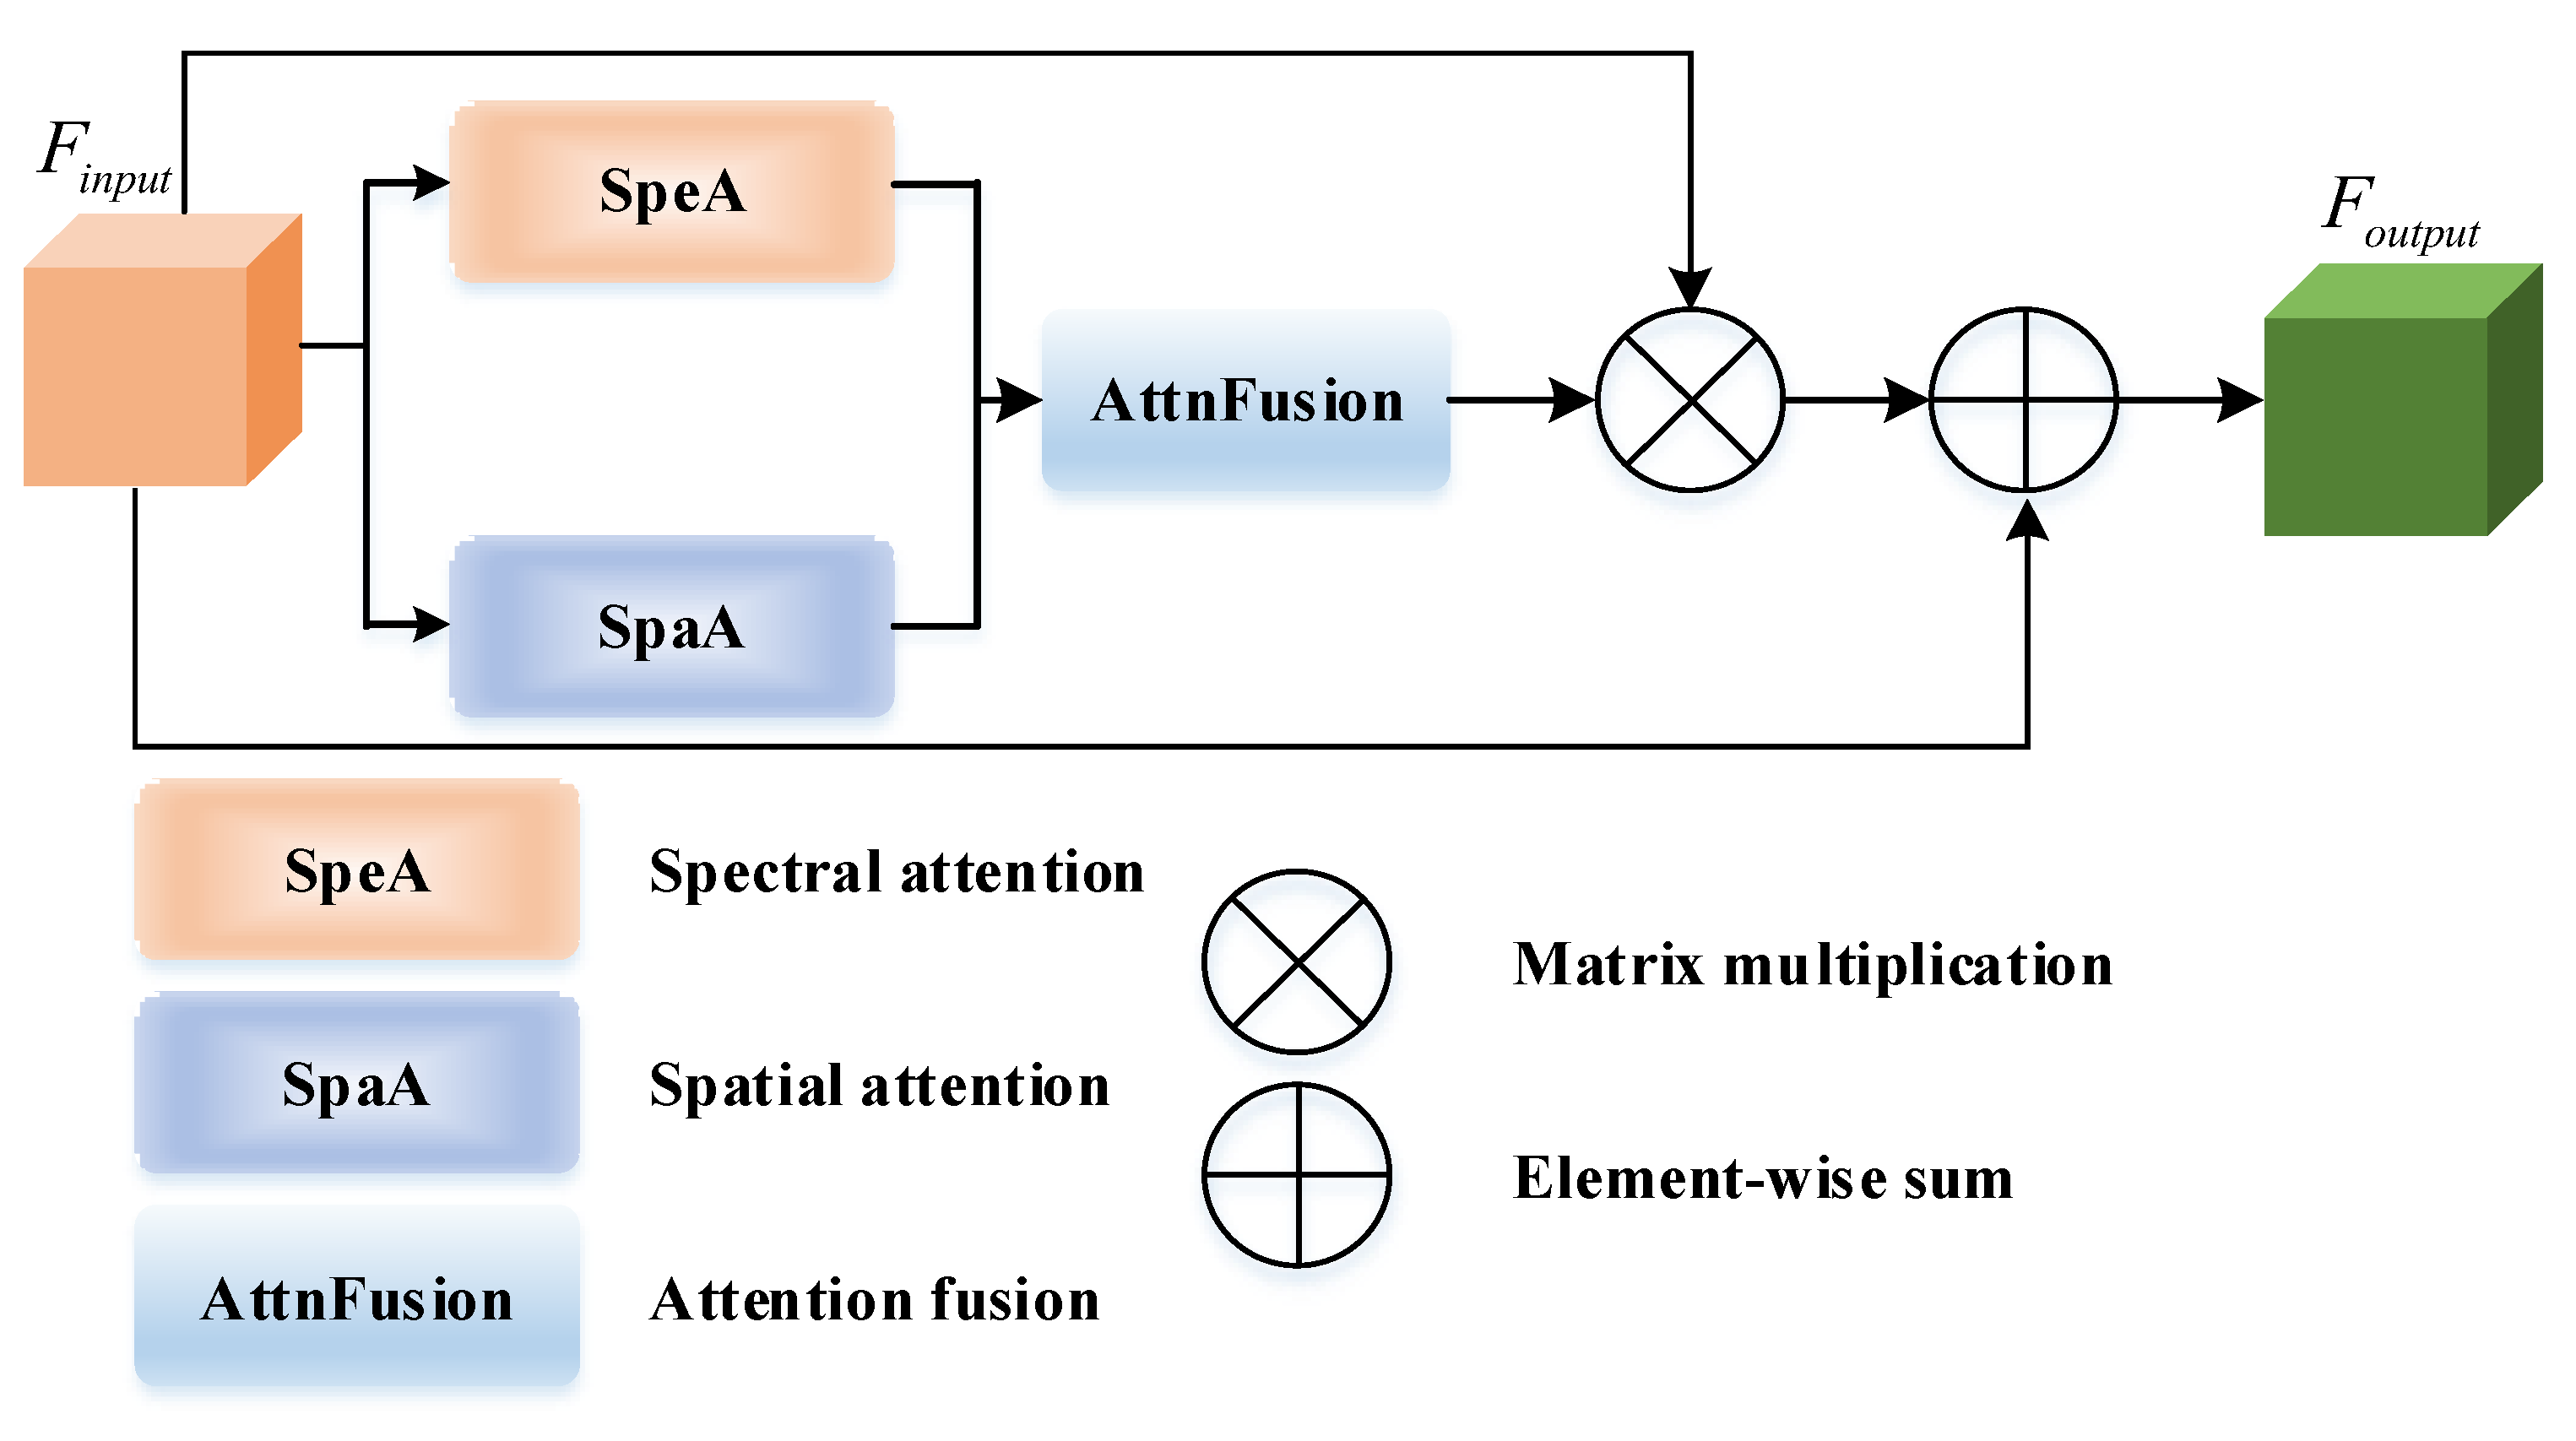
In this subsection, we provide a detailed exposition of the joint spectral–spatial attention (JSSA). Firstly, the pipeline of JSSA is depicted in Figure 3. In essence, JSSA simultaneously employs SpeA and SpaA. Subsequently, an attention fusion layer performs post-fusion, employing weighted summation of the attention maps generated by SpeA and SpaA. This architectural choice facilitates the generation of the JSSA’s attention map, which jointly evaluates pixel-wise correlations across both the frequency and spatial domains. To elaborate further, this process effectively captures and aggregates spectral and spatial contexts, subsequently enhancing feature refinement. This is followed by a matrix multiplication and element-wise summation, resulting in the acquisition of JSSA-refined representations. The precise steps are elucidated below.
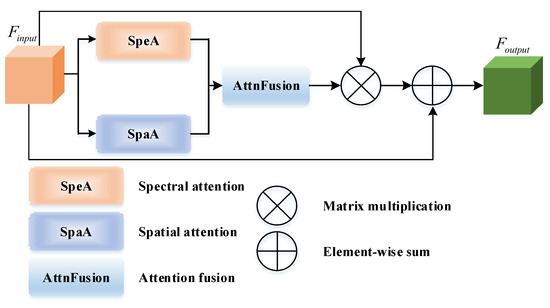
Figure 3.
Details of JSSA.
Considering the input feature of JSSA, denoted as , where , , and represent the number of channels, height, and width, respectively, in the SpeA branch, undergoes an initial transformation into the frequency domain using a 2D fast Fourier transform (2D FFT) function. It is worth noting that this transformation generates multiple frequency values, leading us to segment the transformed feature maps into two distinct components: the real part and the imaginary part.
As previously discussed, SpeA generates an attention map by projecting into the frequency domain and assessing spectrum-related similarity. In Figure 4, we begin with the input feature , which is initially transformed using a 2D FFT. The 2D FFT takes a spatial signal within and transforms it into a complex frequency signal .
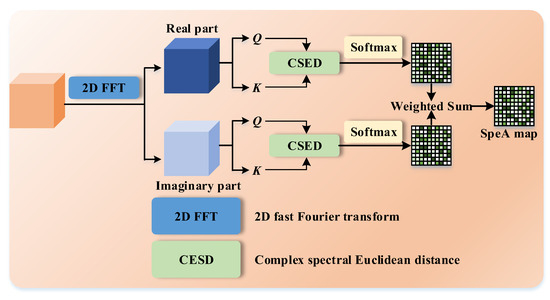
Figure 4.
Details of SpeA.
Suppose is defined as , where and represent the spatial frequency indices in the horizontal and vertical directions, respectively. The formula for the 2D FFT is expressed as follows:
Here, represents the imaginary unit. It is important to note that includes both real and imaginary components. For clarity, we denote these as and . Correspondingly, , , and all possess dimensions of .
Real and imaginary parts of complex numbers represent different aspects of the underlying data. The real part typically encodes amplitude or magnitude information, while the imaginary part encodes phase information. Separating these parts allows us to analyze and compare these two distinct aspects individually. Therefore, we design a parallel manner. In the generalized attention module, the similarity function is dynamically adjustable. In the frequency domain, we here strive to involve spectral context. Therefore, we utilize the complex spectral Euclidean distance followed by the Softmax function to quantify spectral similarity.
In the top branch of SpeA, is transposed to obtain the query feature (Q in Figure 4) , while the key feature (K in Figure 4) is with . The attention map can be formed as
where denotes the vector of position , and represents the vector of position . With Softmax, we have the attention map of the real part as
where the attention map of the real part is with . Likewise, we have the attention map of the imaginary part as
where . As can be observed, is the same size as .
Finally, a weighted summation is applied to produce the SpeA attention map by
where is a coefficient set as 0.5.
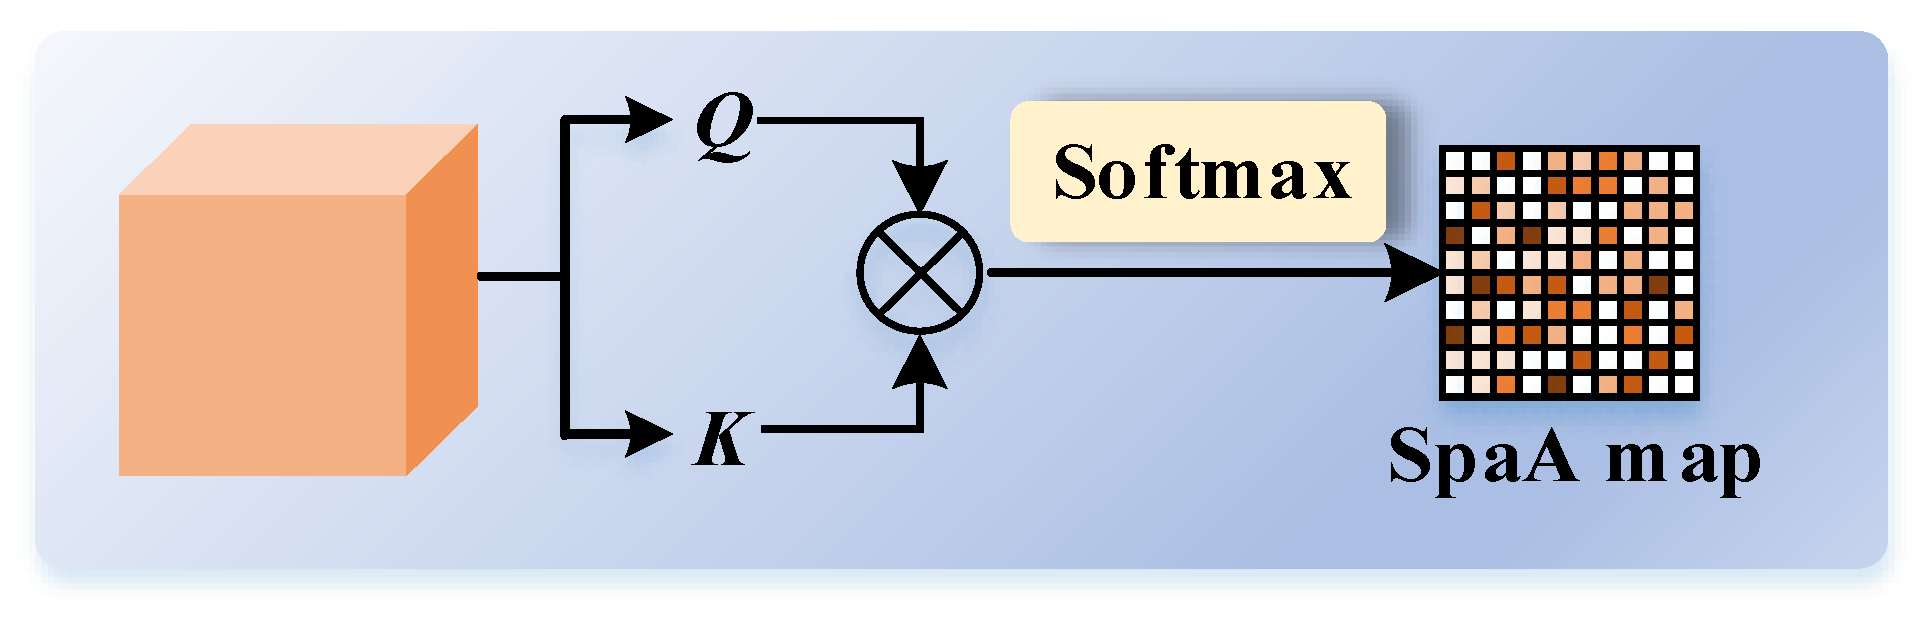
Figure 5 illustrates the pipeline of SpaA, in which we apply position-wise self-attention to . We perform matrix multiplication between and its transposed query feature. We obtain the SpaA attention map using the Softmax function, represented as
where .

Figure 5.
Details of SpaA.
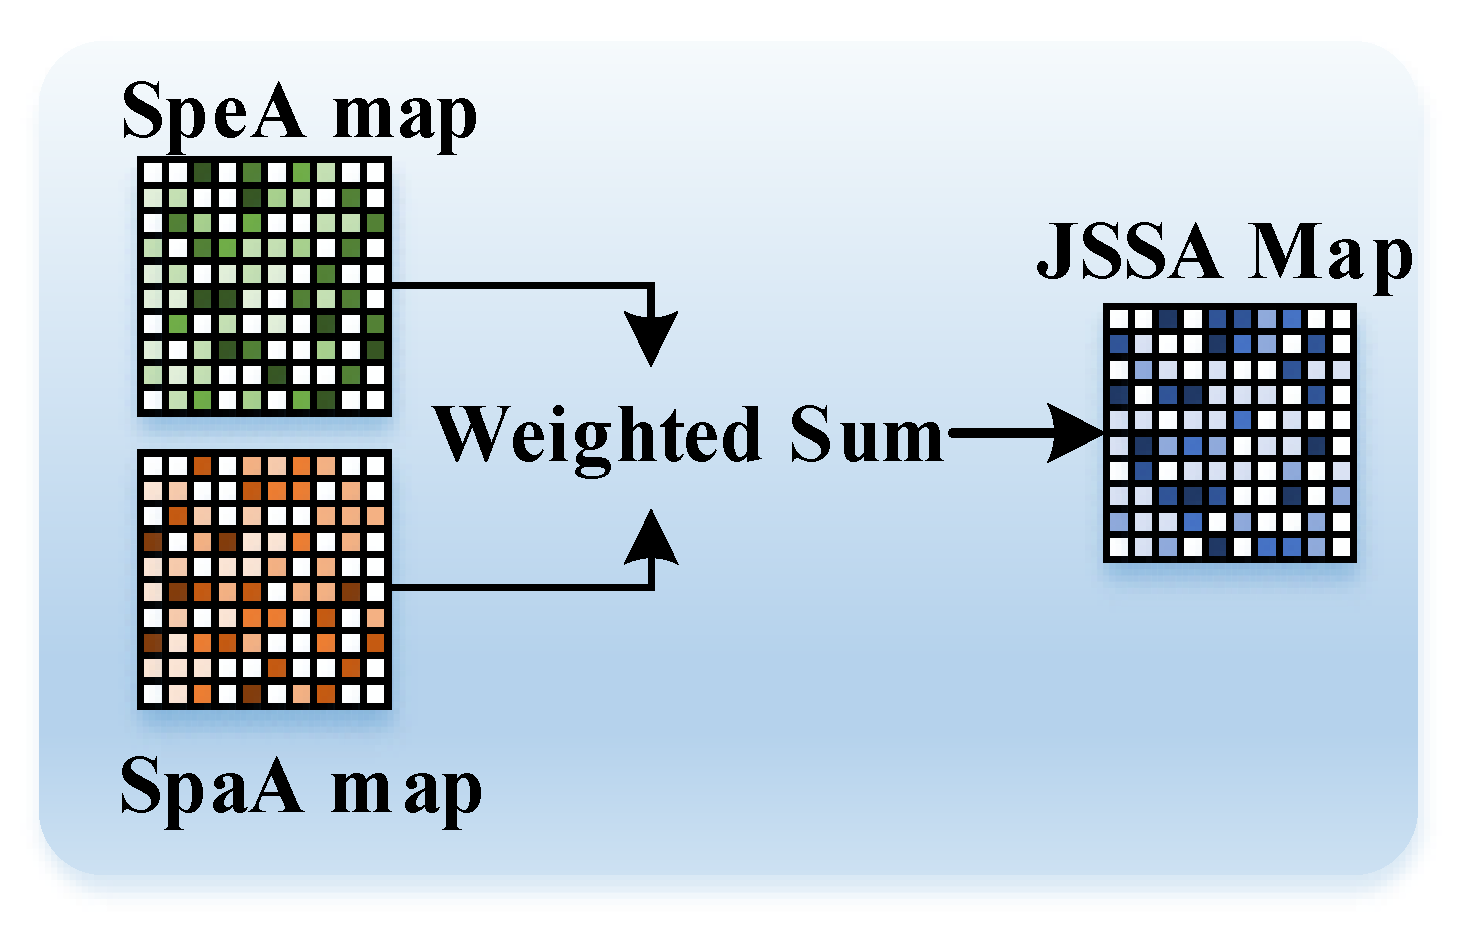
After separately attending to spectral and spatial correlations, in Figure 6, AttnFusion combines them through a straightforward weighted summation of and ,
where is a coefficient pre-defined as 0.5.
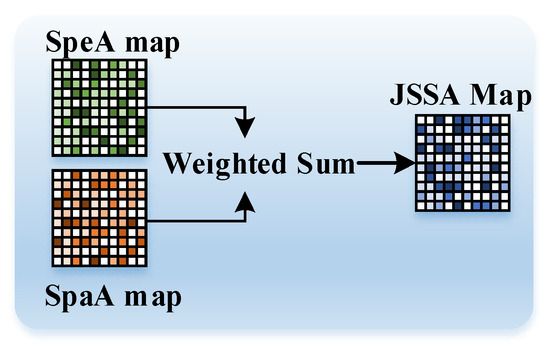
Figure 6.
Pipeline of AttnFusion.
Afterward, is multiplied by , followed by an element-wise summation,
In the end, we have the JSSA-refined feature map denoted as . Hereafter, is put forward to the decoder stage.
3.3. Hybrid Loss Function
In this section, we introduce a hybrid loss function (HLF) for network tuning. As previously discussed, the high-frequency and low-frequency components contribute to the edges and internal consistency of learned representations. Additionally, SpaA is adapted to the cross-entropy loss. Considering these factors, we have formulated a novel loss function.
where , and represent cross-entropy, Dice, and edge losses, respectively, and is a coefficient pre-defined as 0.5.
More concretely, Dice loss measures the spatial overlap between the predicted segmentation and the ground truth, quantifying the consistency of the two masks. It is defined as follows:
where denotes the binary segmentation mask generated by the neural network, where 1 represents the object region, 0 represents the background, and is the ground truth segmentation mask, which also consists of binary labels for the object (1) and background (0). represents the total number of pixels in the binary masks, and is the number of classes. In the context of ,
where is the location of pixel , and is the nearest ground truth pixel of the edge. Edge loss is commonly based on the average distance between boundary pixels in the predicted segmentation and their nearest counterparts in the ground truth boundary. In this study, we adopt Euclidean distance.
4. Experiments and Discussion
4.1. Datasets
4.1.1. ISPRS Potsdam Dataset
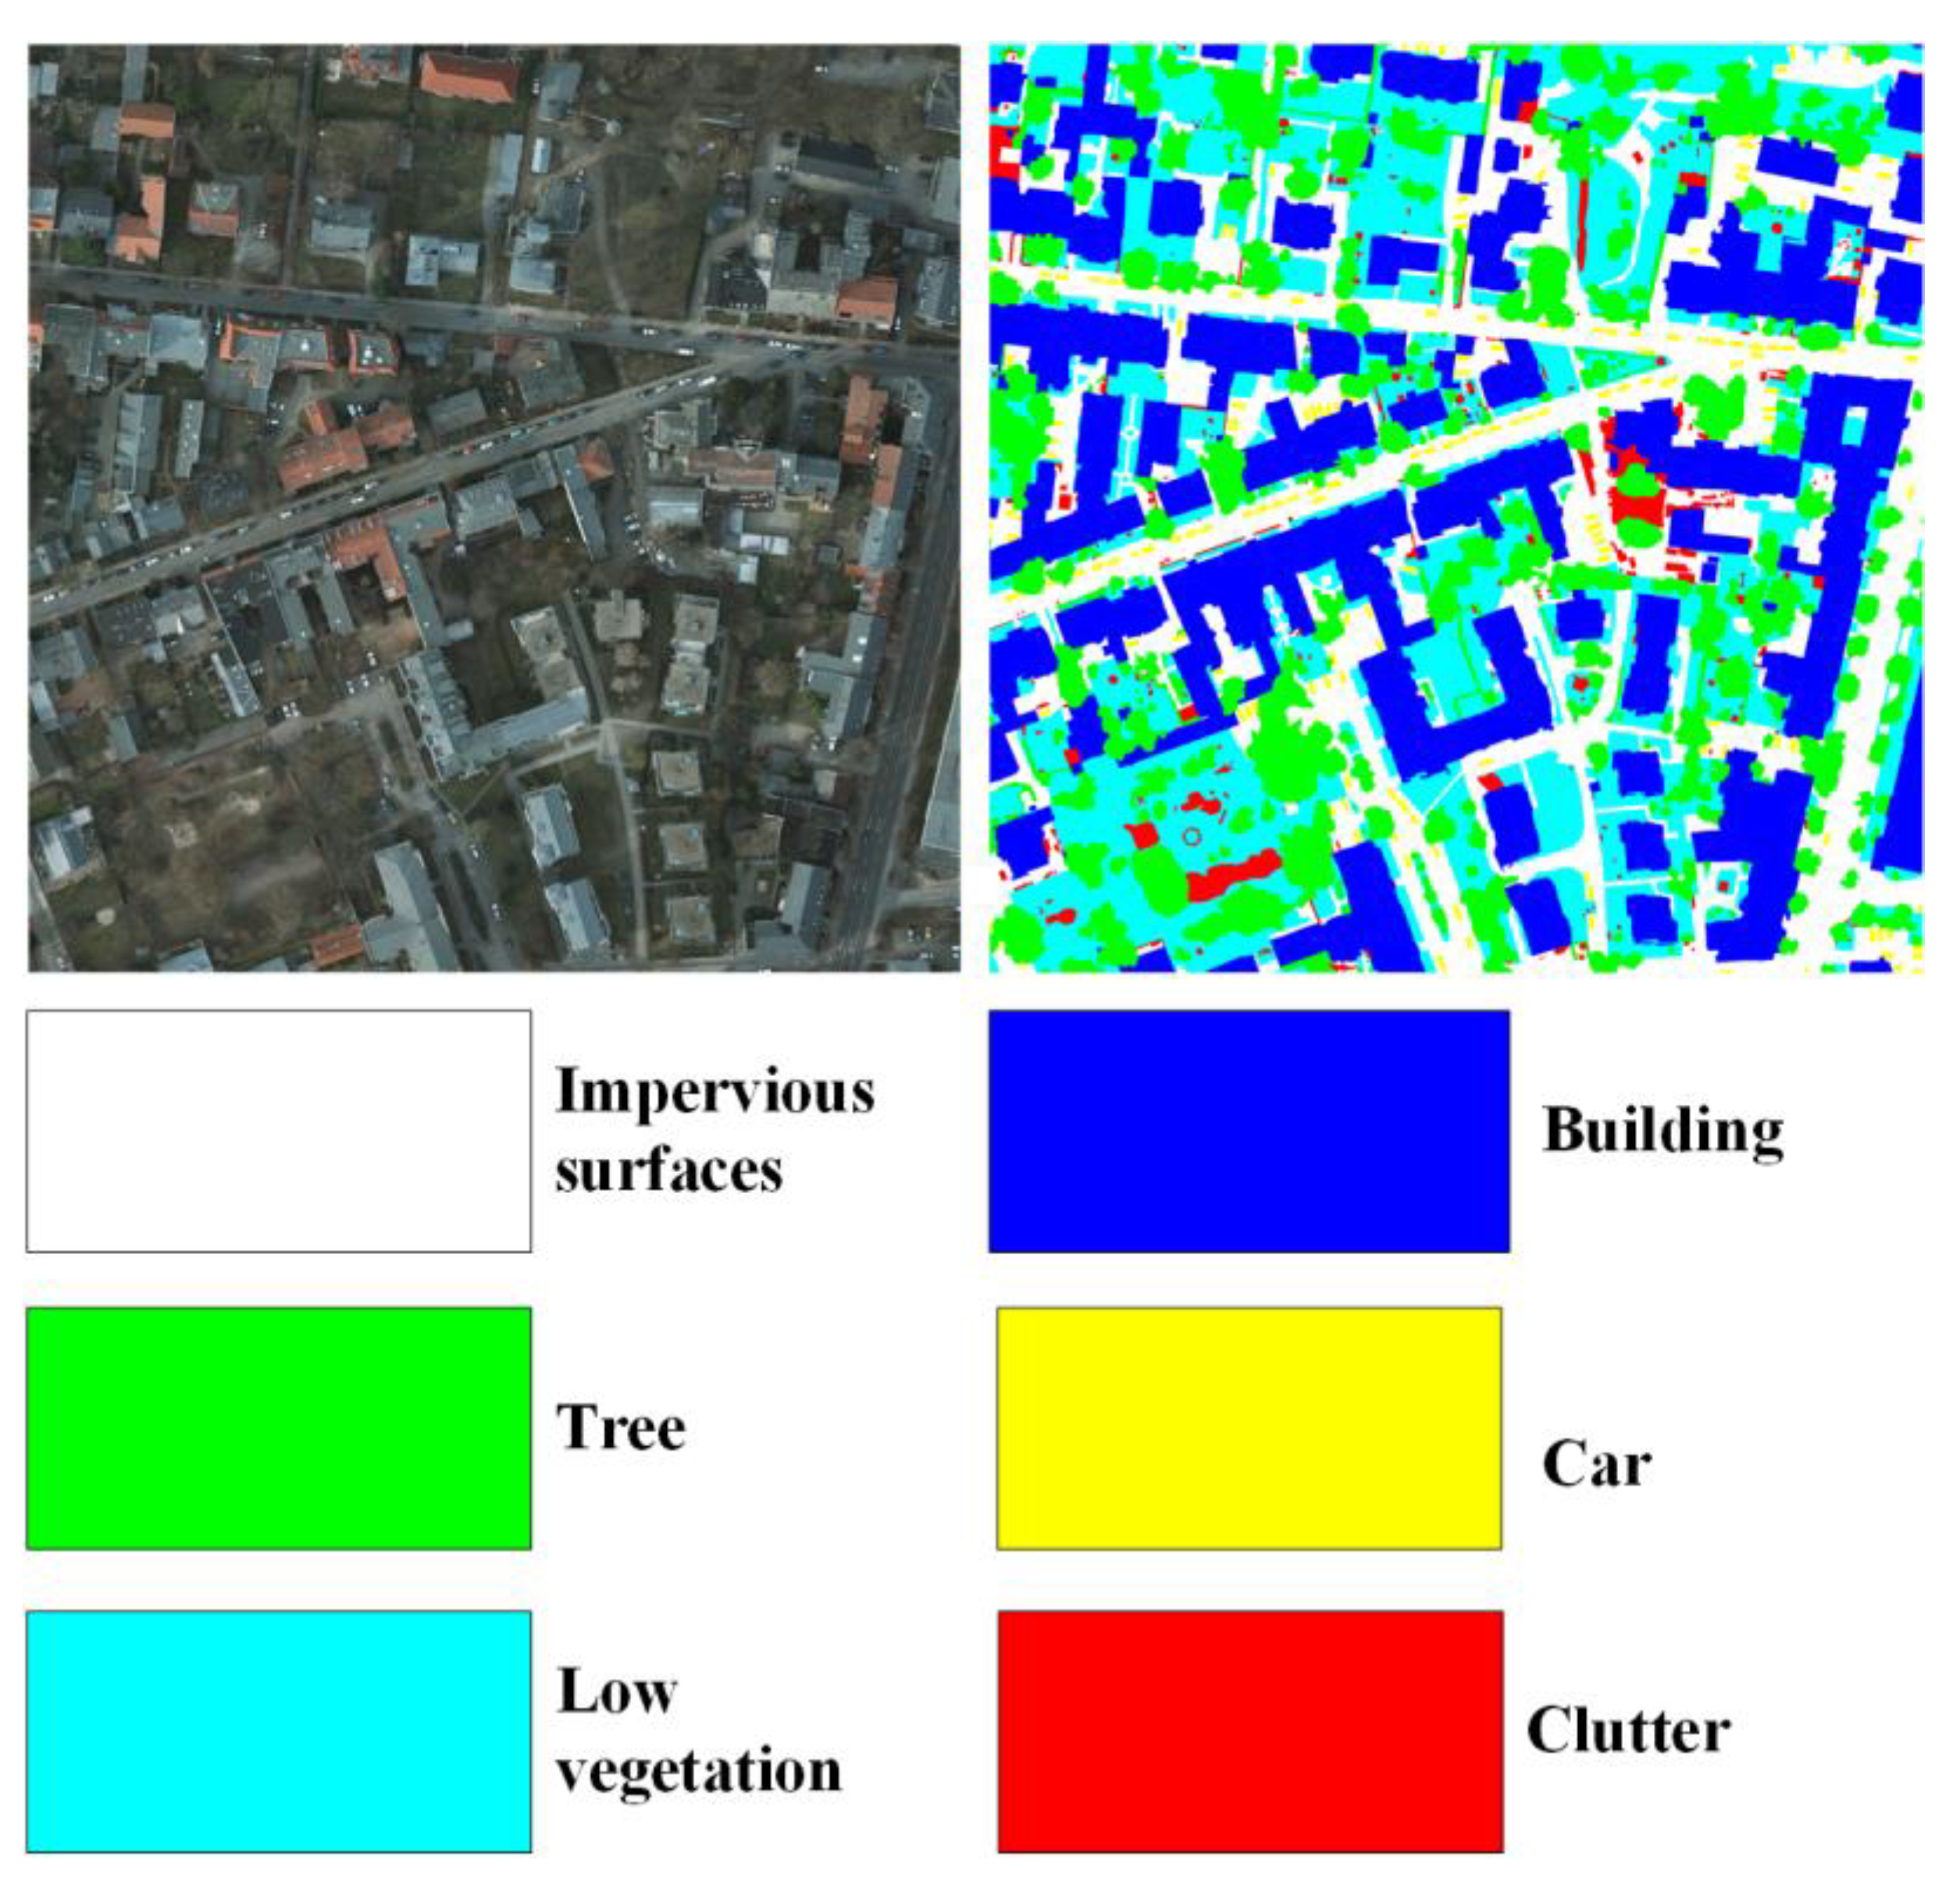
The ISPRS Potsdam dataset [23] exhibits a spatial resolution of 5 cm. It entails pixel-level ground truth annotations for land cover classification, wherein the category “clutter” designates the background class. Each image is characterized by a spatial dimension of 6000 × 6000 pixels, employing the red (R), green (G), and near-infrared (NIR) spectral bands. We have partitioned this dataset into three distinct subsets: a training set, a validation set, and a test set, comprising 17, 2, and 19 images, respectively. For visual reference, specific examples are depicted in Figure 7.

Figure 7.
Visualization of ISPRS Potsdam dataset.
4.1.2. LoveDA Dataset
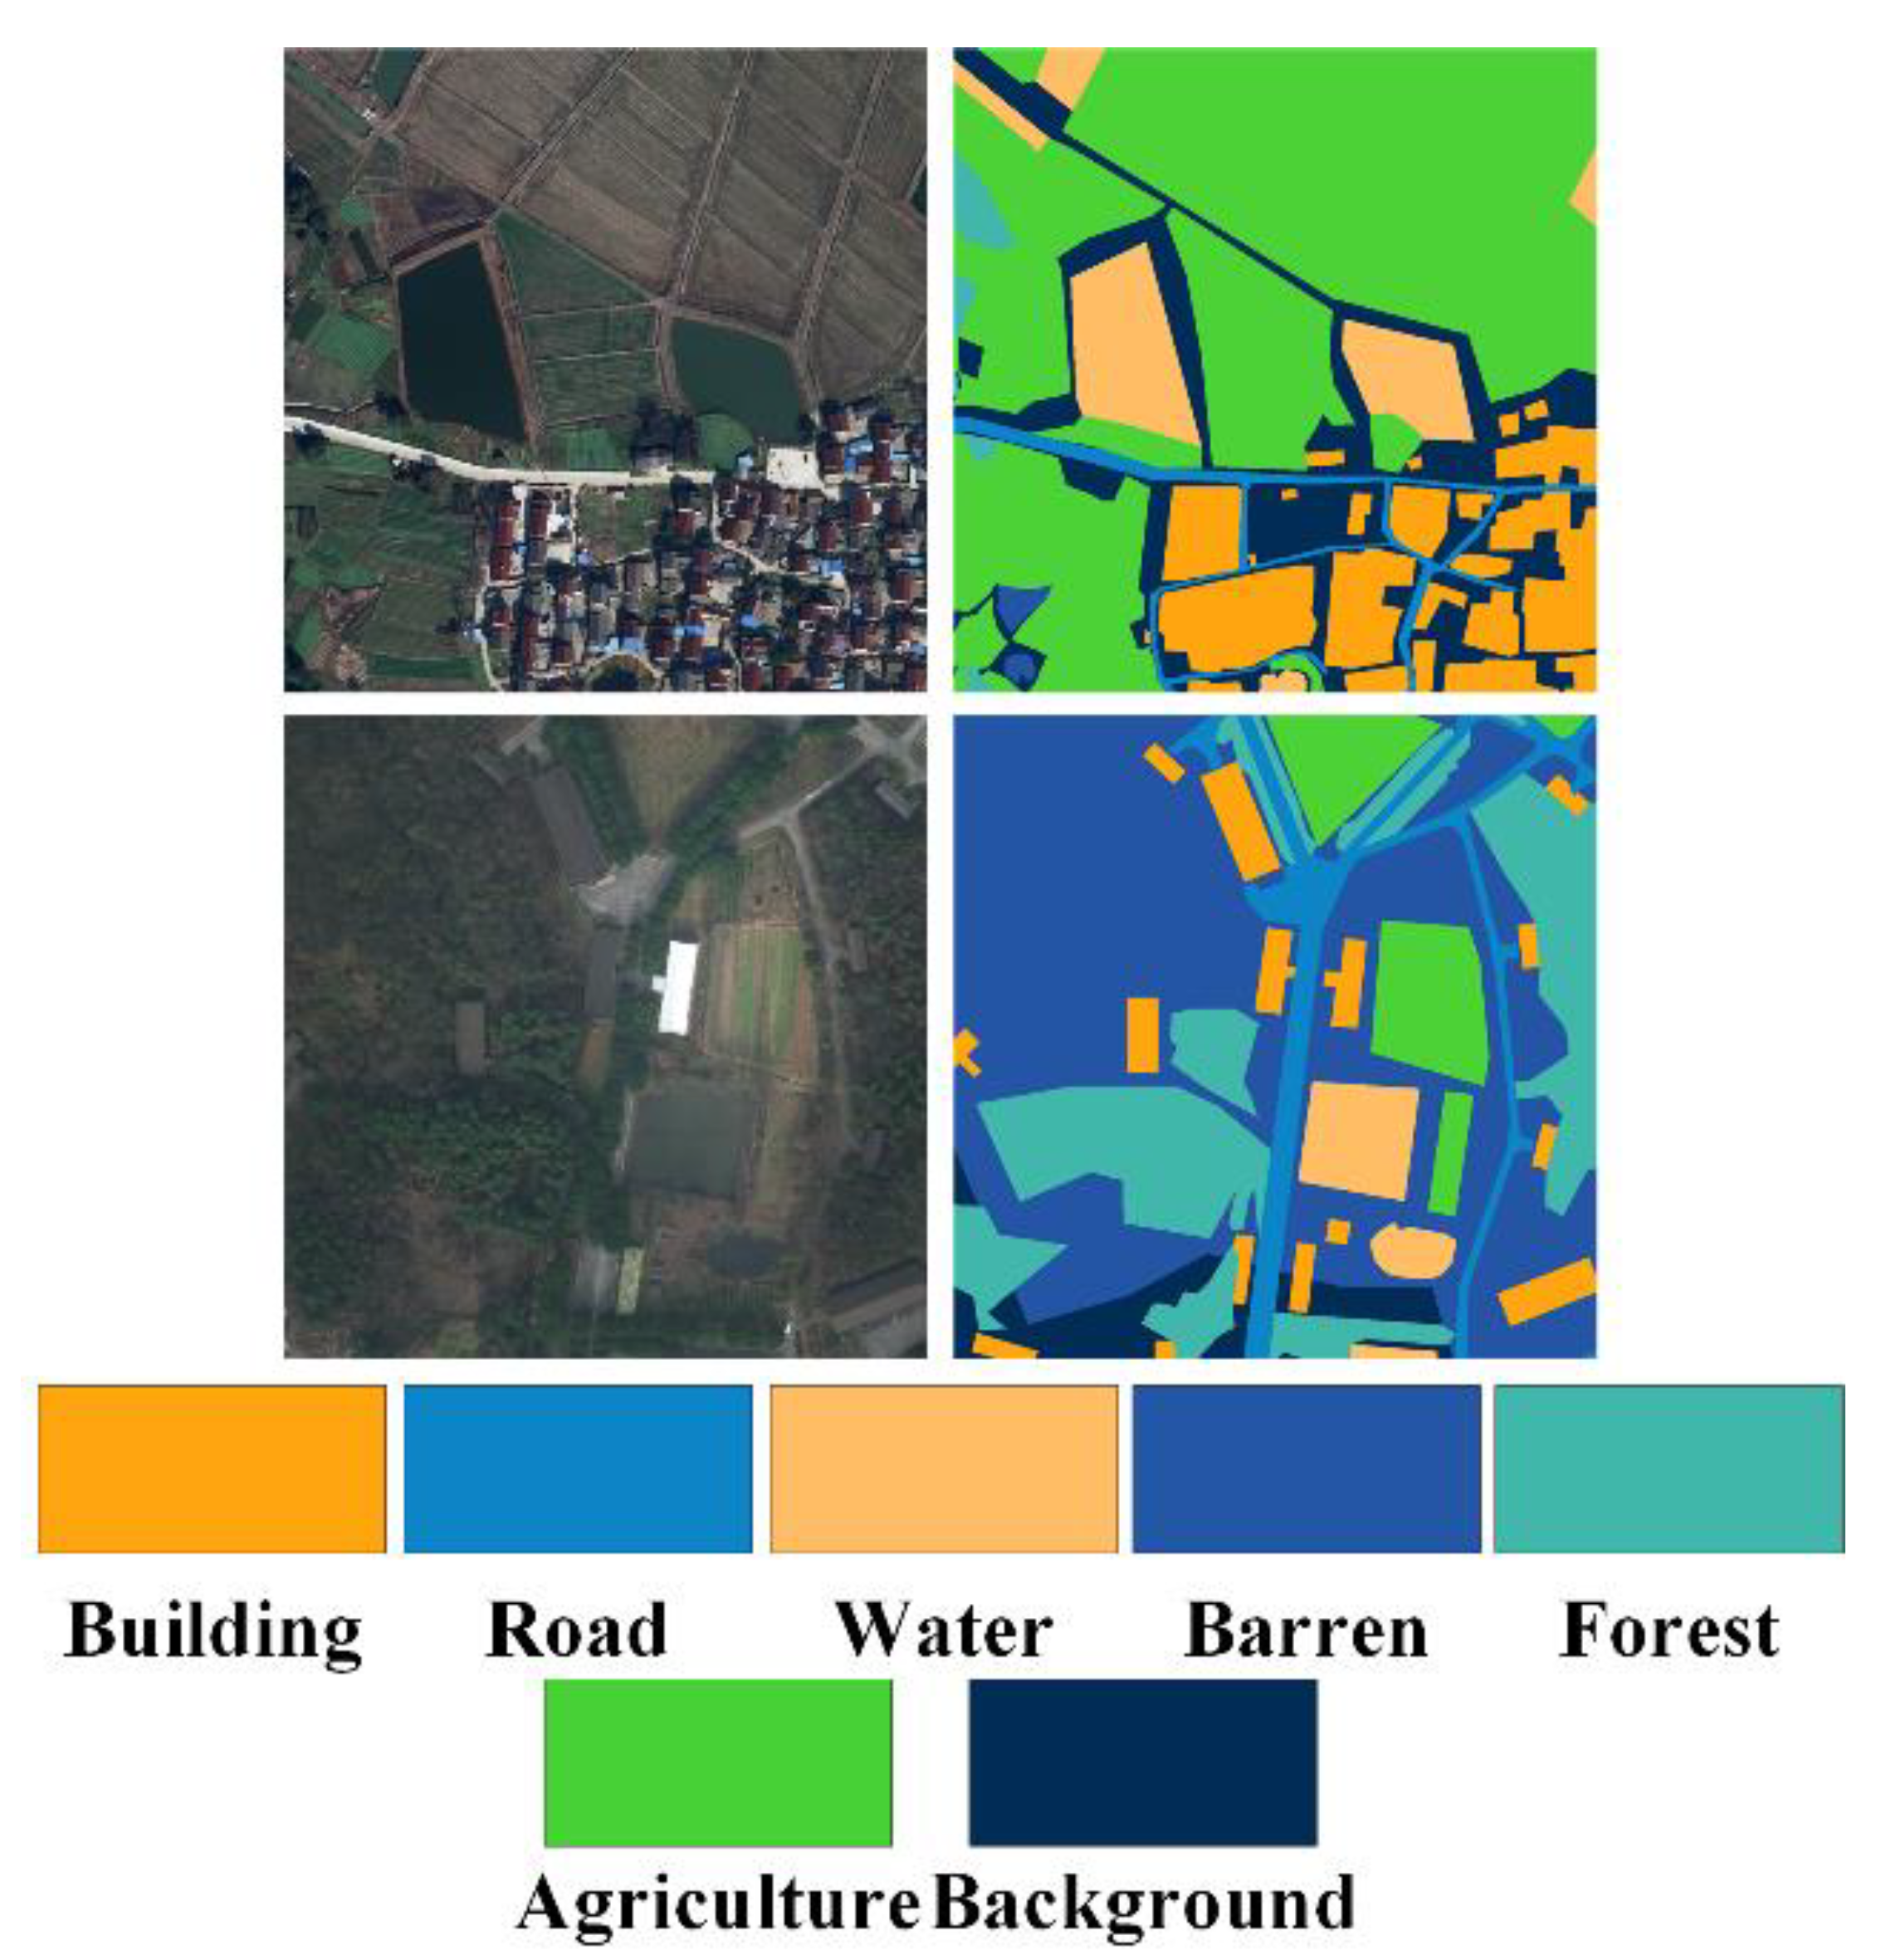
The LoveDA dataset [56] introduced a novel challenge in the realm of semantic segmentation for large-scale satellite images characterized by a spatial resolution of 0.3 m. Sourced from the Google Earth platform, LoveDA encompasses a vast expanse exceeding 536 square kilometers (km2). This dataset encompasses both rural and urban regions within three cities: Nanjing, Changzhou, and Wuhan. Each image within this dataset boasts a spatial dimension of 1024 × 1024 pixels. Our study utilized a total of 2522 images for training, 834 images for validation, and 835 images for testing. The dataset exhibits an imbalanced class distribution, and the objects belonging to the same category exhibit variations in terms of scale, size, and surface type, rendering LoveDA an even more formidable dataset for semantic segmentation. To provide a visual representation, specific examples are presented in Figure 8.

Figure 8.
Visualization of LoveDA dataset.
4.2. Implementation Details
The proposed SSCNet, alongside the compared semantic segmentation methods, was implemented using PyTorch on a Linux OS running on an NVIDIA A40 GPU. Data augmentations, such as random flipping and cropping operations, were uniformly applied to all datasets and networks, as outlined in Table 1. The initial learning rate was set at 0.02, and the maximum number of training epochs was fixed at 500. Additionally, we adopted stochastic gradient descent (SGD) as the optimizer, with the learning strategy employing poly decay and a momentum of 0.9. The model parameter file with the lowest validation loss was retained. The parameters and , introduced in Equations (7) and (9), respectively, are preset constants. We initialized both parameters to a value of 0.5 to ensure an equal weighting between the components they control. This choice was substantiated by preliminary experiments, which indicated that an equal balance yields effective performance on our validation dataset. We maintained these values throughout the training process, as our empirical results validated this initial setting. No further optimization was performed for these parameters. This decision aligns with our aim to minimize model complexity and maintain interpretability of the parameter settings. Besides, the hyperparameters are pre-defined in Table 2.

Table 1.
Dataset properties.
Table 2.
Hyperparameters.
We selected 10 methods for comparative analysis, encompassing representative baselines and designs specifically tailored for remote sensing imagery (RSI). The former category includes U-Net [57], DeepLab V3+ [58], and CBAM [59], while the latter consists of ResUNet-a [43], RAANet [46], SCAttNet [60], HCANet [34], A2FPN [48], and LANet [36].
4.3. Evaluation Metrics
In this study, we have employed standard evaluation metrics to assess the performance of the predicted results on the test set. These metrics include the class-wise -score, the average -score across all classes (AF), overall accuracy (OA), and mean intersection over union (mIoU). The -score serves as a balanced measure of precision and recall, providing insight into the trade-off between false positives and false negatives. OA quantifies the number of correctly classified pixels in relation to all pixels. mIoU is a global metric used to evaluate overall accuracy. Formally,
where and are calculated as follows:
In the equations, , , , and represent the counts of true positives, true negatives, false positives, and false negatives, respectively. The mIoU is computed as the mean of class-specific IoU values.
4.4. Comparison with State-of-the-Art Methods
4.4.1. Results on ISPRS Potsdam Dataset
In the presented comparative analysis of semantic segmentation performance on the ISPRS Potsdam dataset, various state-of-the-art methods were evaluated, including the newly proposed SSCNet. As listed in Table 3, these methods were examined across multiple land cover categories, namely impervious surfaces, buildings, low vegetation, trees, and cars. The results indicate that SSCNet achieved remarkable performance, outperforming most of the other methods in all classes. Particularly, SSCNet demonstrated superior results in the building, tree, and car classes, reaching 97.16%, 91.41%, and 93.26% -scores, respectively. This signifies SSCNet’s effectiveness in delineating fine details and complex object boundaries, which is critical in remote sensing applications.
Table 3.
Numerical comparisons on ISPRS Potsdam test set.
Comparing SSCNet with the baseline methods, we observe a consistent trend where SSCNet surpasses the others. DeepLabV3+, CBAM, ResUNet-a, and HCANet also show competitive results, especially in the impervious surfaces and building classes. This highlights that the proposed SSCNet indeed addresses the challenge of capturing intricate edge details and suppressing noise in remote sensing imagery. The OA and mIoU results show a similar trend, emphasizing the effectiveness of SSCNet in providing both accurate and spatially coherent predictions. The outcomes of this analysis underscore the significance of the newly introduced SSCNet, particularly its potential in remote sensing applications where accurate segmentation of land cover is essential. This substantial improvement in performance is indicative of SSCNet’s potential to enhance object detection and land cover classification in satellite and aerial imagery.
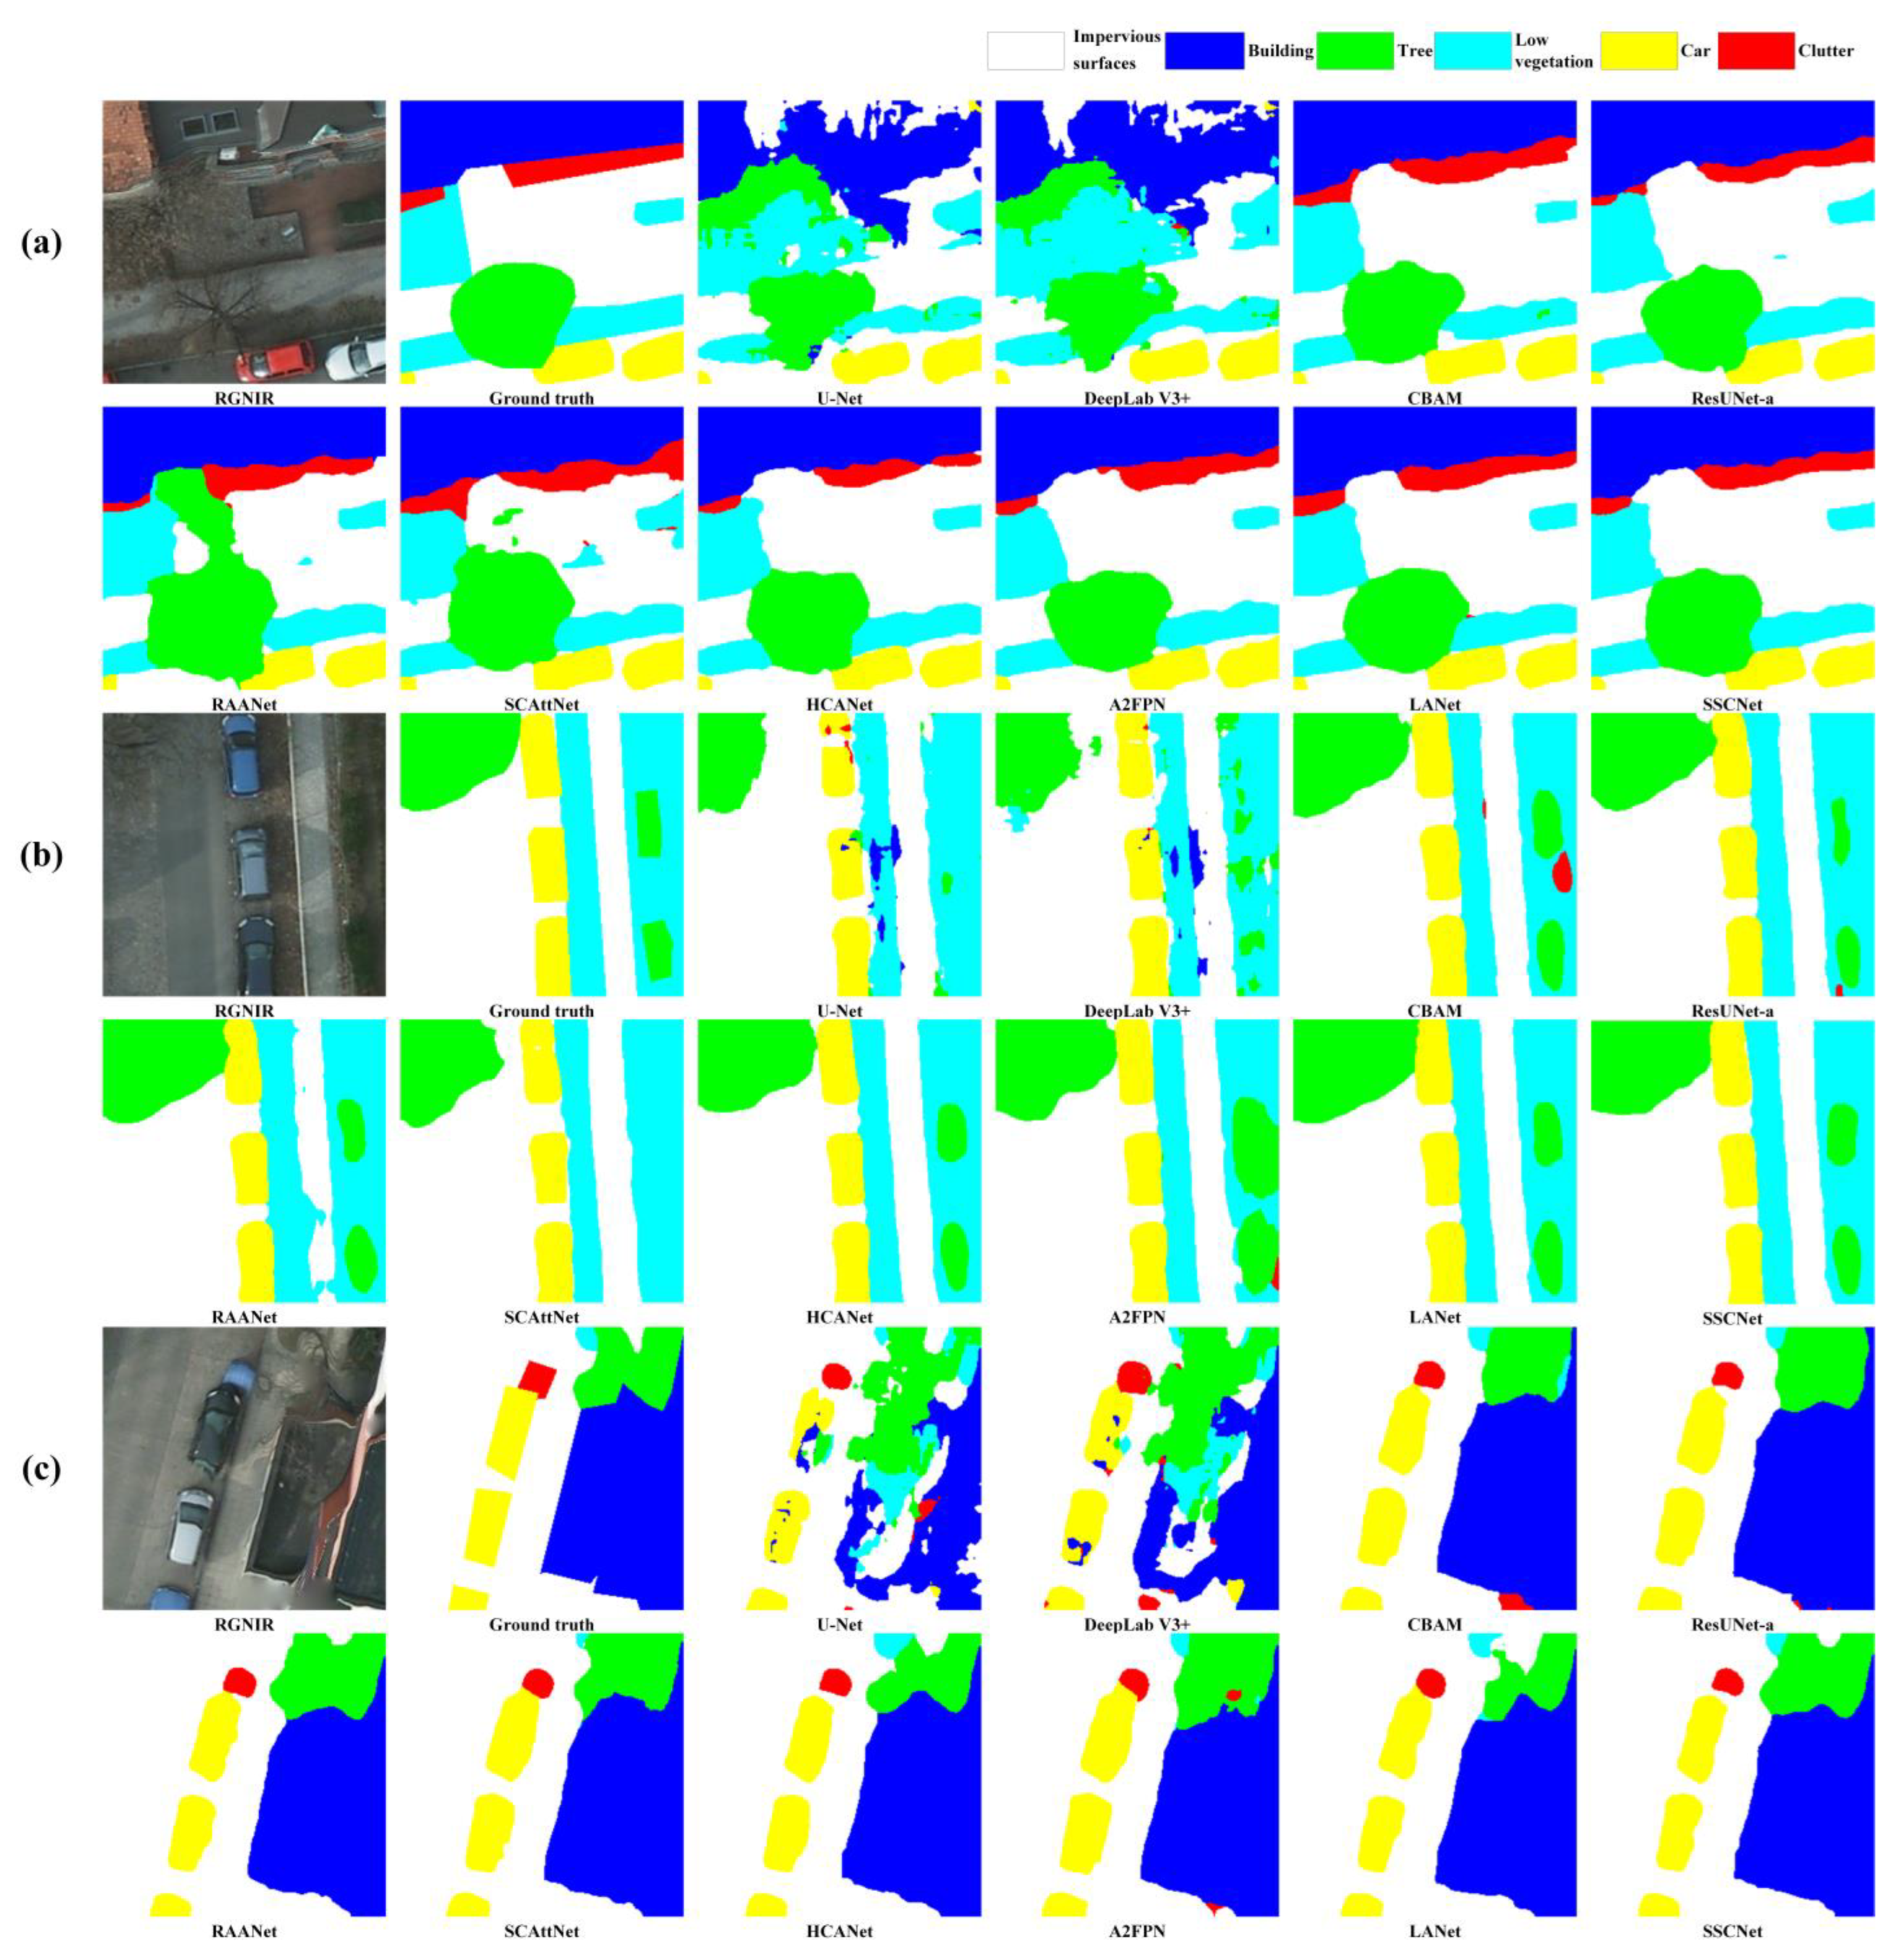
As shown in Figure 9, in a thorough visual inspection of the predicted labels on randomly sampled images from the ISPRS Potsdam dataset, several key observations come to light. SSCNet, our proposed semantic segmentation method, consistently showcases its prowess in accurately delineating land cover types. Notably, it excels in capturing intricate details, such as the edges of buildings and trees, where the SpeA module plays a pivotal role. The inclusion of this module allows SSCNet to better understand the spectral context, making it especially proficient in distinguishing fine-grained structures.
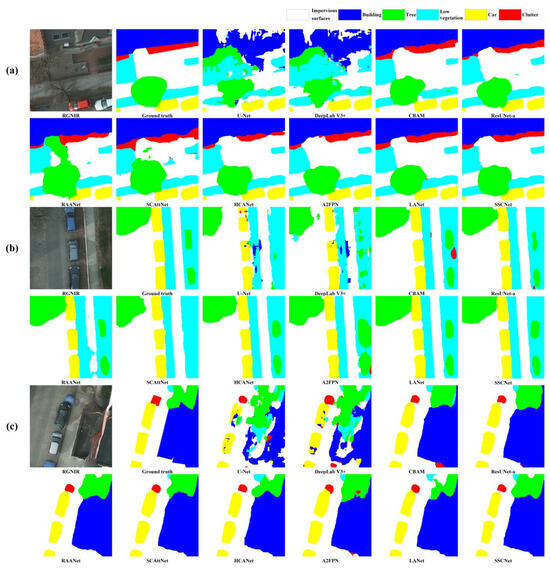
Figure 9.
(a–c) Visual inspections of random samples from test set of ISPRS Potsdam.
Moreover, the visual inspections also highlight SSCNet’s exceptional adaptability to diverse land cover scenarios. It consistently produces accurate labels across various classes, from impervious surfaces and buildings to low vegetation and water bodies. The model exhibits its ability to capture both large-scale features, such as roads and barren lands, as well as fine details, like trees and cars. This versatility reflects SSCNet’s proficiency in handling the diverse and complex landscapes present in the ISPRS Potsdam dataset. While challenges persist due to the dataset’s imbalanced class distribution and variation in scale, SSCNet’s robust performance, driven by the SpeA module, underscores its utility in real-world applications, particularly for urban and environmental monitoring.
4.4.2. Results on LoveDA Dataset
Table 4 offers a comprehensive assessment of various methods, including SSCNet, applied to semantic segmentation on the LoveDA dataset. SSCNet, the proposed model, presents outstanding performance across multiple classes, demonstrating its competence in accurate land cover classification. SSCNet achieves the highest -scores in most classes, with notable distinctions in the water, barren, and agriculture categories, reaching impressive -scores of 91.10%, 56.66%, and 85.35%, respectively. This signifies SSCNet’s effectiveness in capturing intricate details and accurately discerning land cover types. Comparing SSCNet with baseline models, it consistently outperforms them in terms of F1-scores, underlining its superiority in semantic segmentation. Other methods, such as LANet and HCANet, exhibit competitive results, particularly in the building and road classes, but SSCNet’s remarkable consistency across all classes showcases its robustness. SSCNet further outperforms the competition in OA and mIoU, confirming its ability to provide both precise and spatially coherent semantic segmentation. These results suggest SSCNet’s significance in remote sensing applications, particularly in challenging classes such as water and agriculture, with potential applications in accurate land cover analysis.
Table 4.
Numerical comparisons on LoveDA test set.
Examining SSCNet’s performance, it is clear that the model excels in capturing fine details, evident in the high -scores across various classes. The water class is notably challenging, but SSCNet demonstrates remarkable accuracy with an -score of 91.10%, indicating its proficiency in distinguishing small water bodies. The building and road classes also witness substantial performance improvements, with SSCNet achieving -scores of 76.36% and 81.91%, respectively. These results indicate SSCNet’s potential in applications requiring precise segmentation, such as urban planning and environmental monitoring. SSCNet surpasses existing models, including U-Net and DeepLab V3+, highlighting its state-of-the-art performance. SSCNet’s competence in handling both fine-grained land cover details and large-scale geographic areas is a testament to its versatility in remote sensing tasks. Its substantial lead in the AF, OA, and mIoU further emphasizes its significance, offering an advanced solution to semantic segmentation challenges in large-scale satellite imagery.
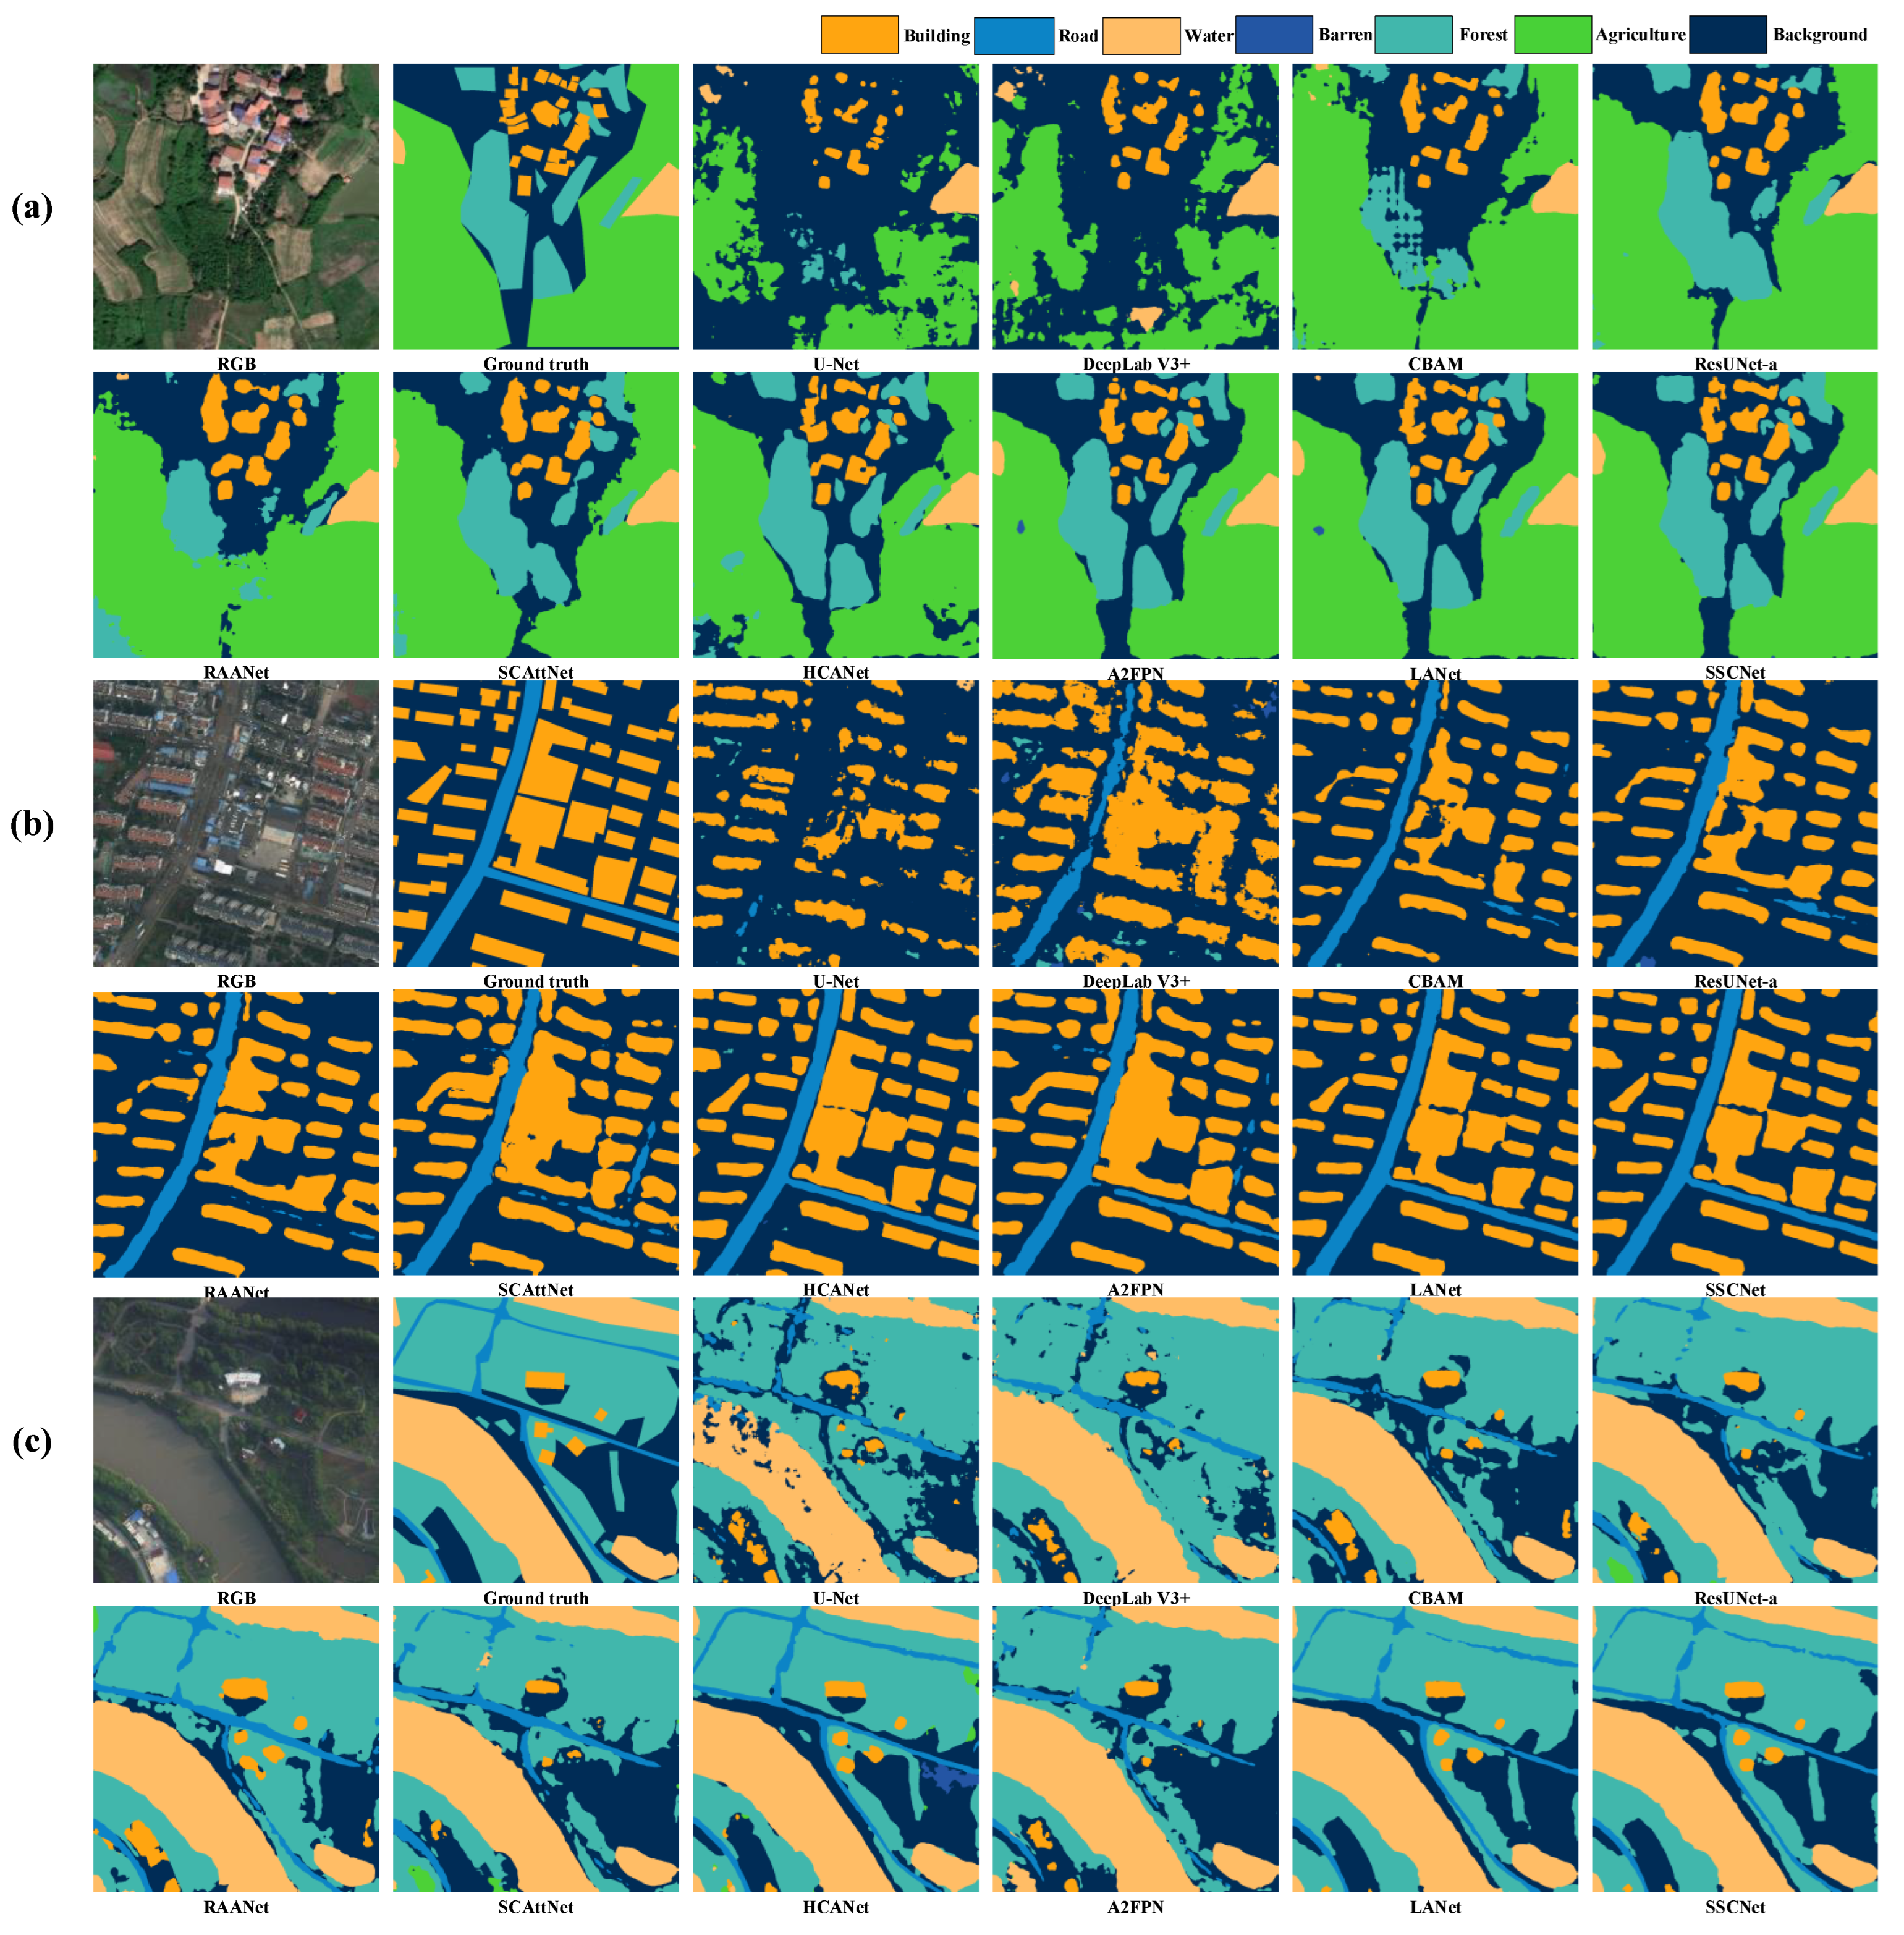
As shown in Figure 10, visual inspections of the predicted labels on random samples from the LoveDA dataset reveal valuable insights into the performance of SSCNet in the context of large-scale satellite image segmentation. SSCNet demonstrates its competence in effectively handling the diverse and intricate land cover types present in this dataset. Notably, the inclusion of the SpeA module contributes to the model’s remarkable performance. It excels in accurately delineating various classes, including background, buildings, roads, water bodies, barren lands, and forests. SSCNet’s superior performance in classifying these diverse land cover types underscores its versatility and robustness. Overall, these visual inspections demonstrate that SSCNet, with its SpeA module, stands out as a reliable choice for large-scale satellite image segmentation, particularly for applications such as land cover monitoring, urban planning, and environmental assessments in regions covered by the LoveDA dataset.
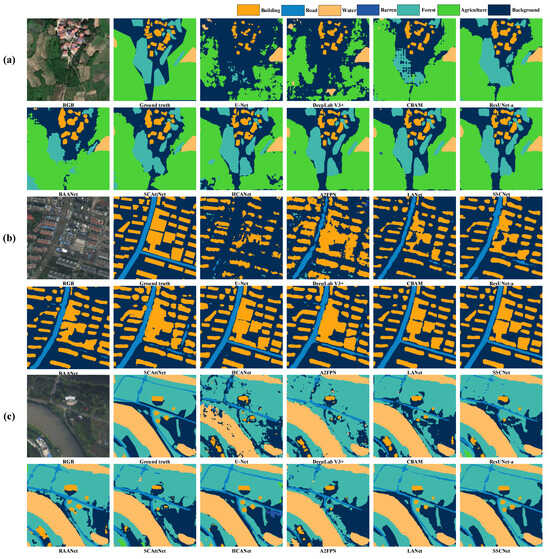
Figure 10.
(a–c) Visual inspections of random samples from test set of LoveDA.
4.5. Ablation Study on SpeA
Table 5 provides a comparison between SSCNet, the proposed method, and a variant, SSCNet w/o SpeA (without SpeA module), on both the ISPRS Potsdam and LoveDA datasets for semantic segmentation. This evaluation aims to elucidate the importance of the SpeA module in SSCNet’s performance. In the context of the ISPRS Potsdam dataset, SSCNet exhibits impressive performance with an AF of 91.03, an OA of 92.90, and an mIoU of 82.55. Notably, these metrics signify the model’s ability to achieve a high mean F1-score, overall accuracy, and intersection over union, underlining its competence in semantic segmentation. However, when the SpeA module is removed (SSCNet w/o SpeA), there’s a considerable decline in all metrics, resulting in an AF of 87.62, an OA of 87.92, and an mIoU of 79.55. This reduction demonstrates the detrimental impact of eliminating the SpeA module, highlighting its crucial role in enhancing SSCNet’s performance. The decrease in mIoU and overall accuracy implies that SpeA is pivotal for capturing fine details and providing accurate semantic segmentation.
Table 5.
Ablation study of SpeA. Results are in the form of AF/OA/mIoU.
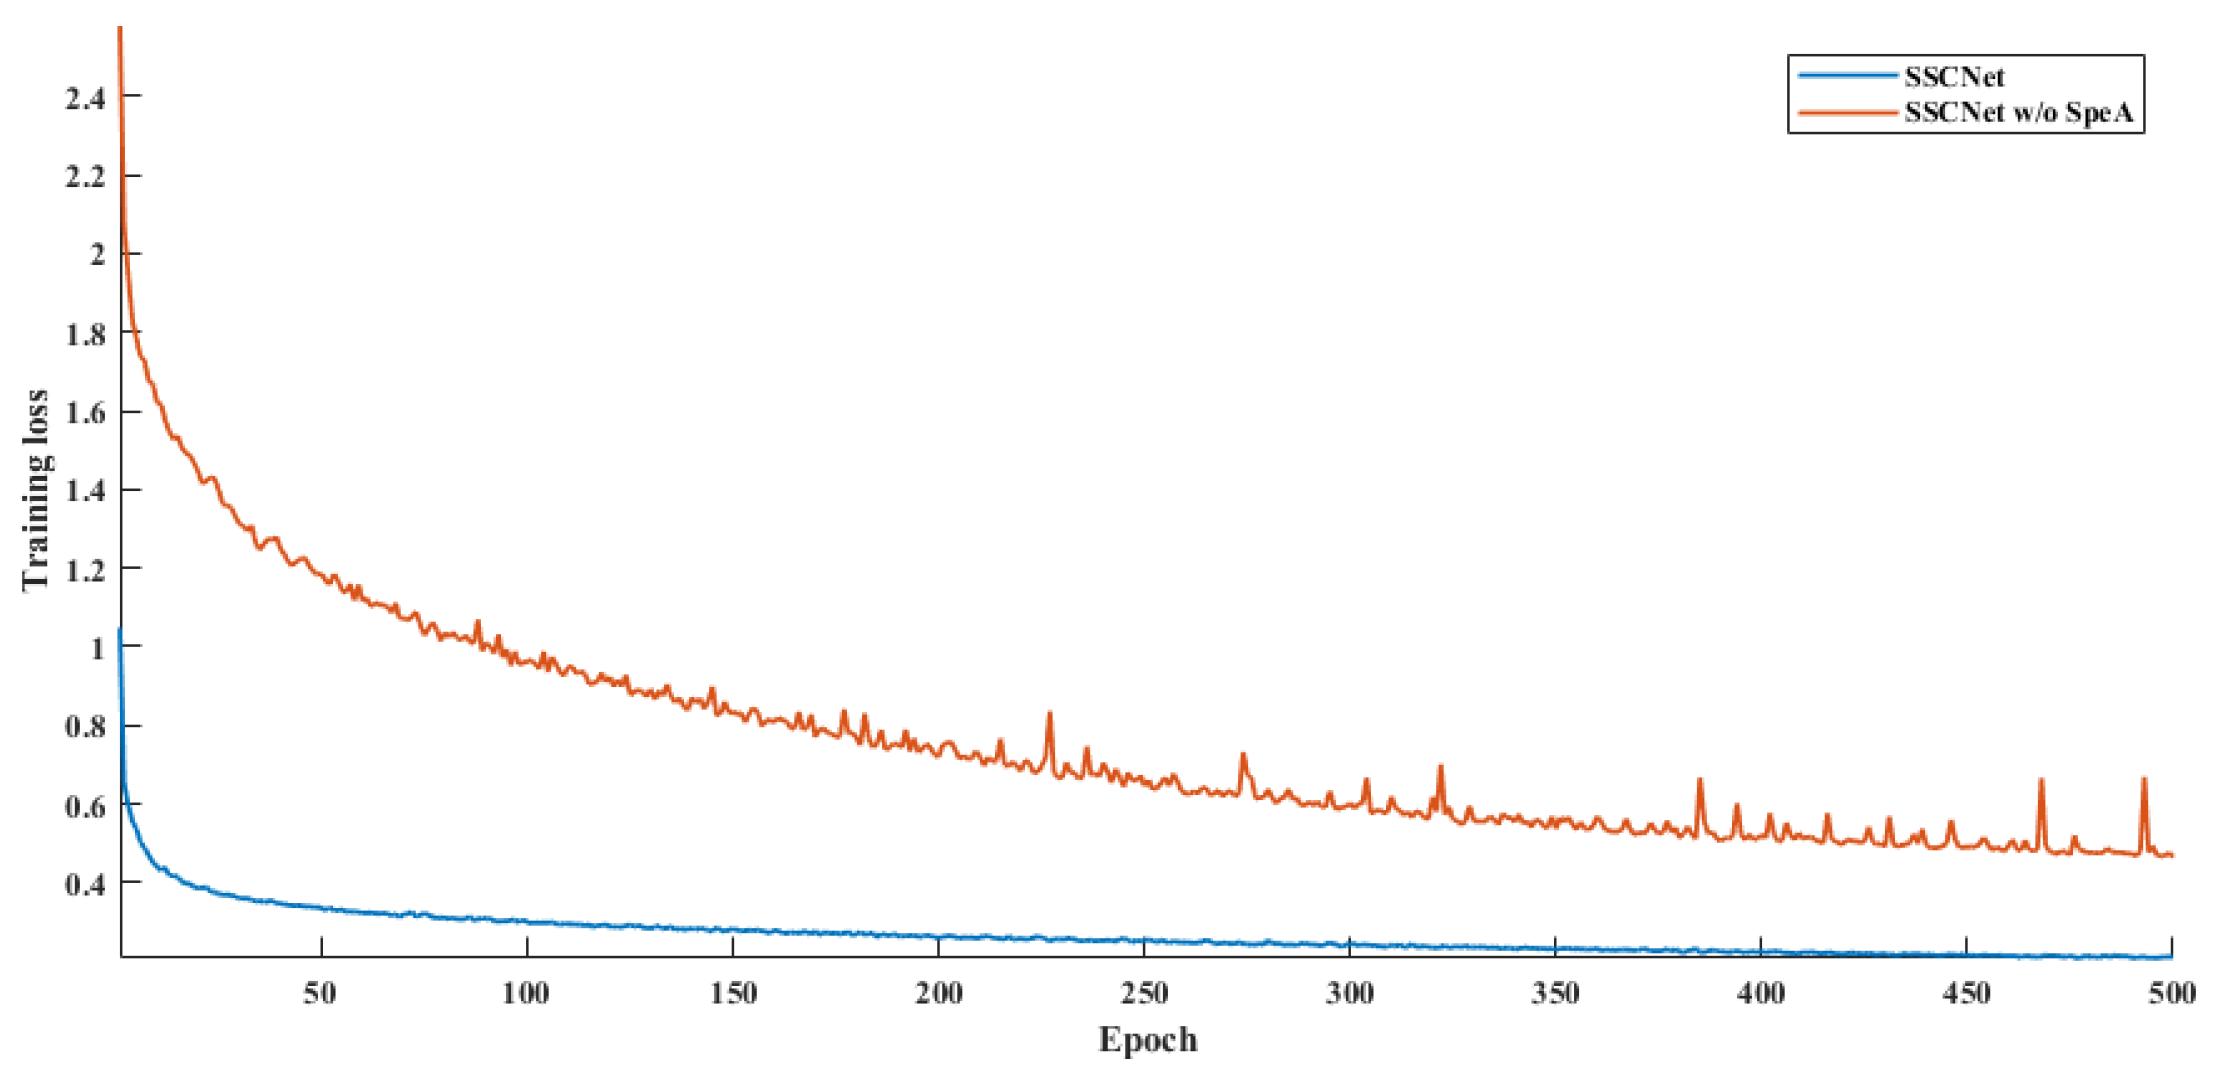
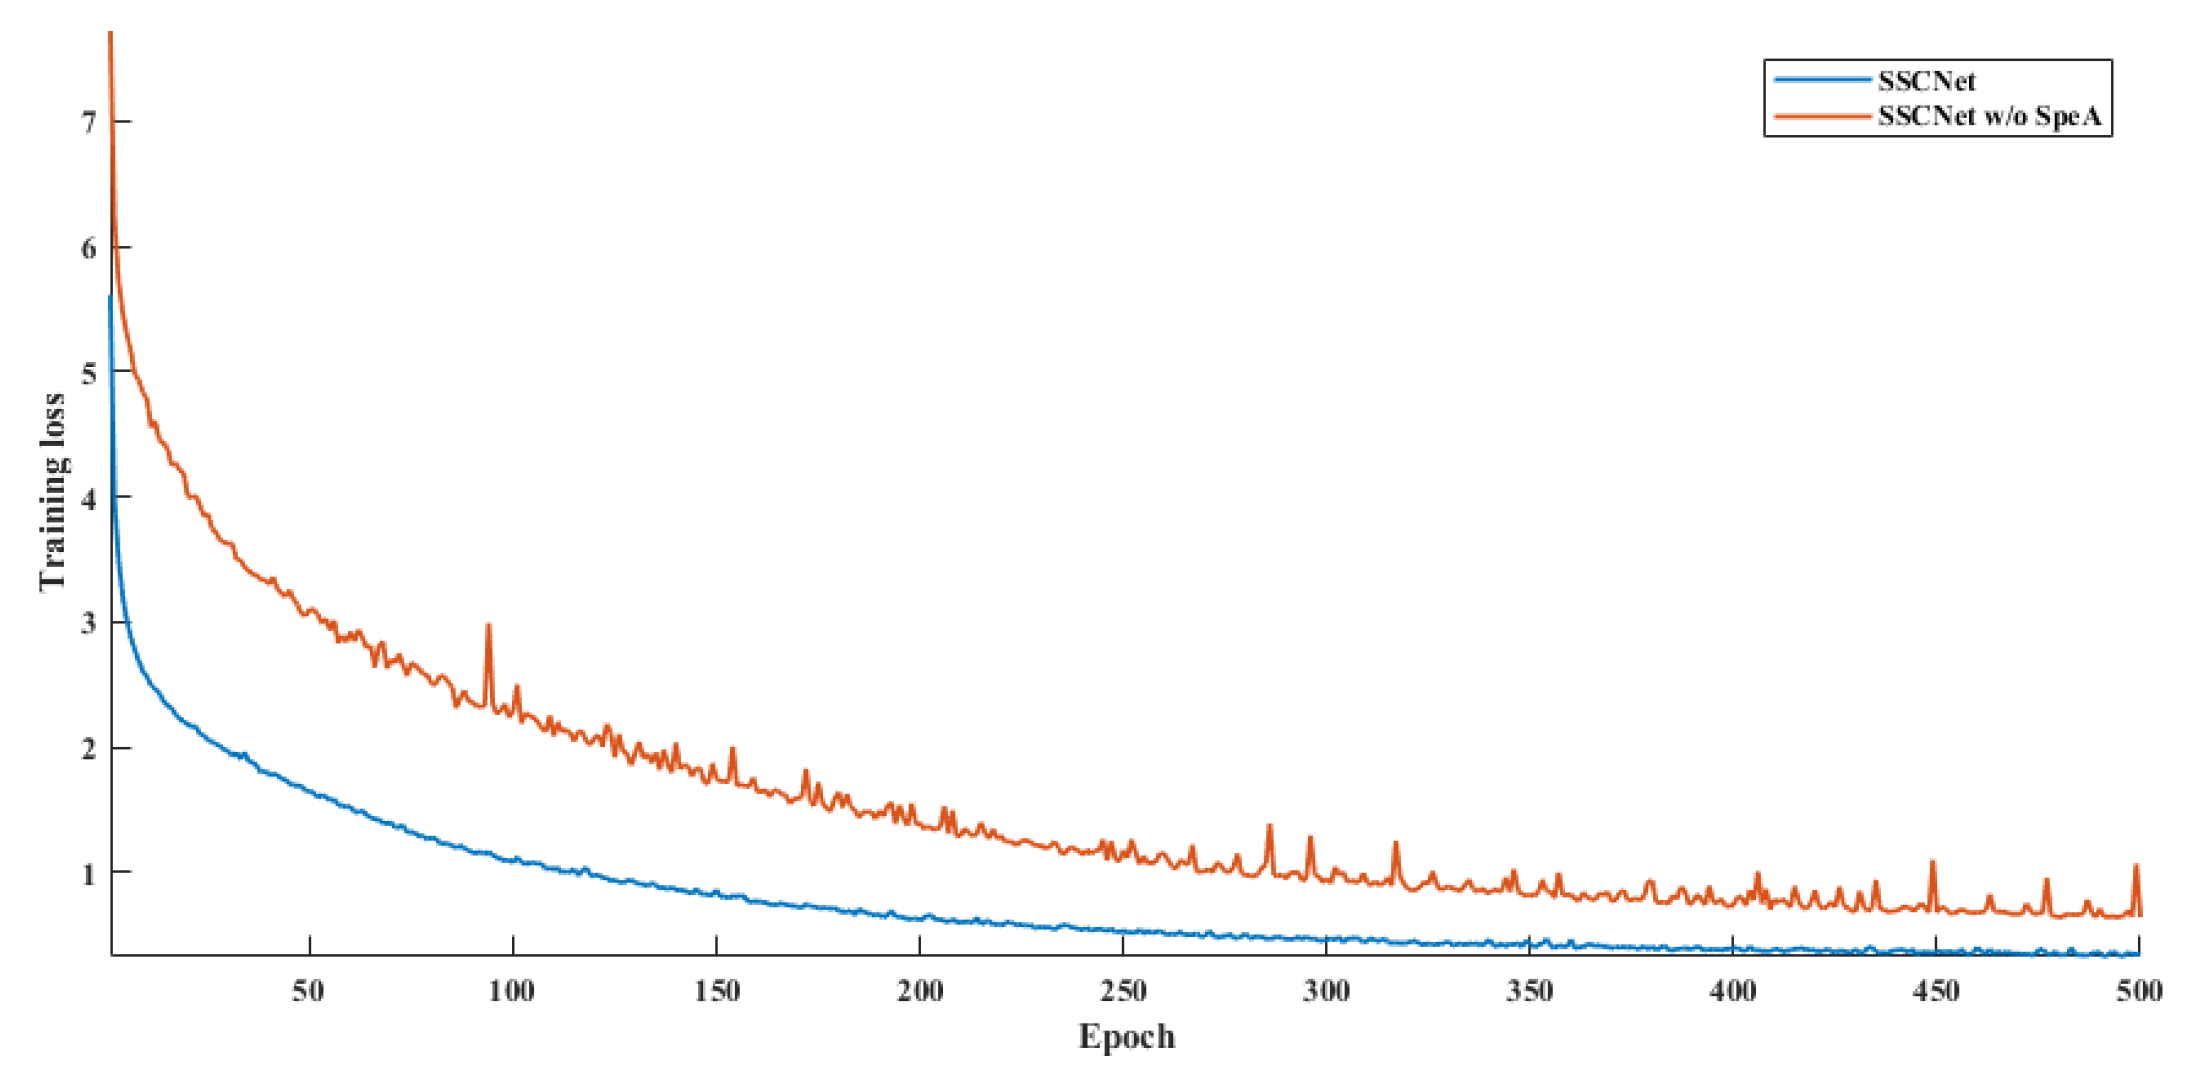
Transitioning to the LoveDA dataset, SSCNet again delivers commendable results, with an AF of 76.02, an OA of 72.01, and an mIoU of 65.91. These metrics indicate SSCNet’s ability to perform well on this dataset, exhibiting its adaptability. However, when the SpeA module is omitted (SSCNet w/o SpeA), there’s a more substantial drop in performance across all metrics. The model’s AF decreases to 60.16, OA to 62.65, and mIoU to 54.62. Moreover, as drawn in Figure 11 and Figure 12, we observe that SpeA significantly improves the convergence rate while keeping a lower loss than before. This significant reduction reaffirms the importance of the SpeA module in SSCNet, as its removal leads to a noticeable decrease in segmentation accuracy and overall performance.
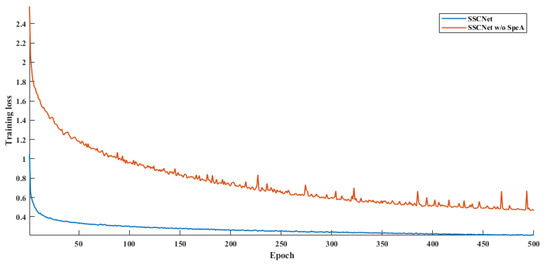
Figure 11.
Training loss for ISPRS Potsdam.

Figure 12.
Training loss for LoveDA.
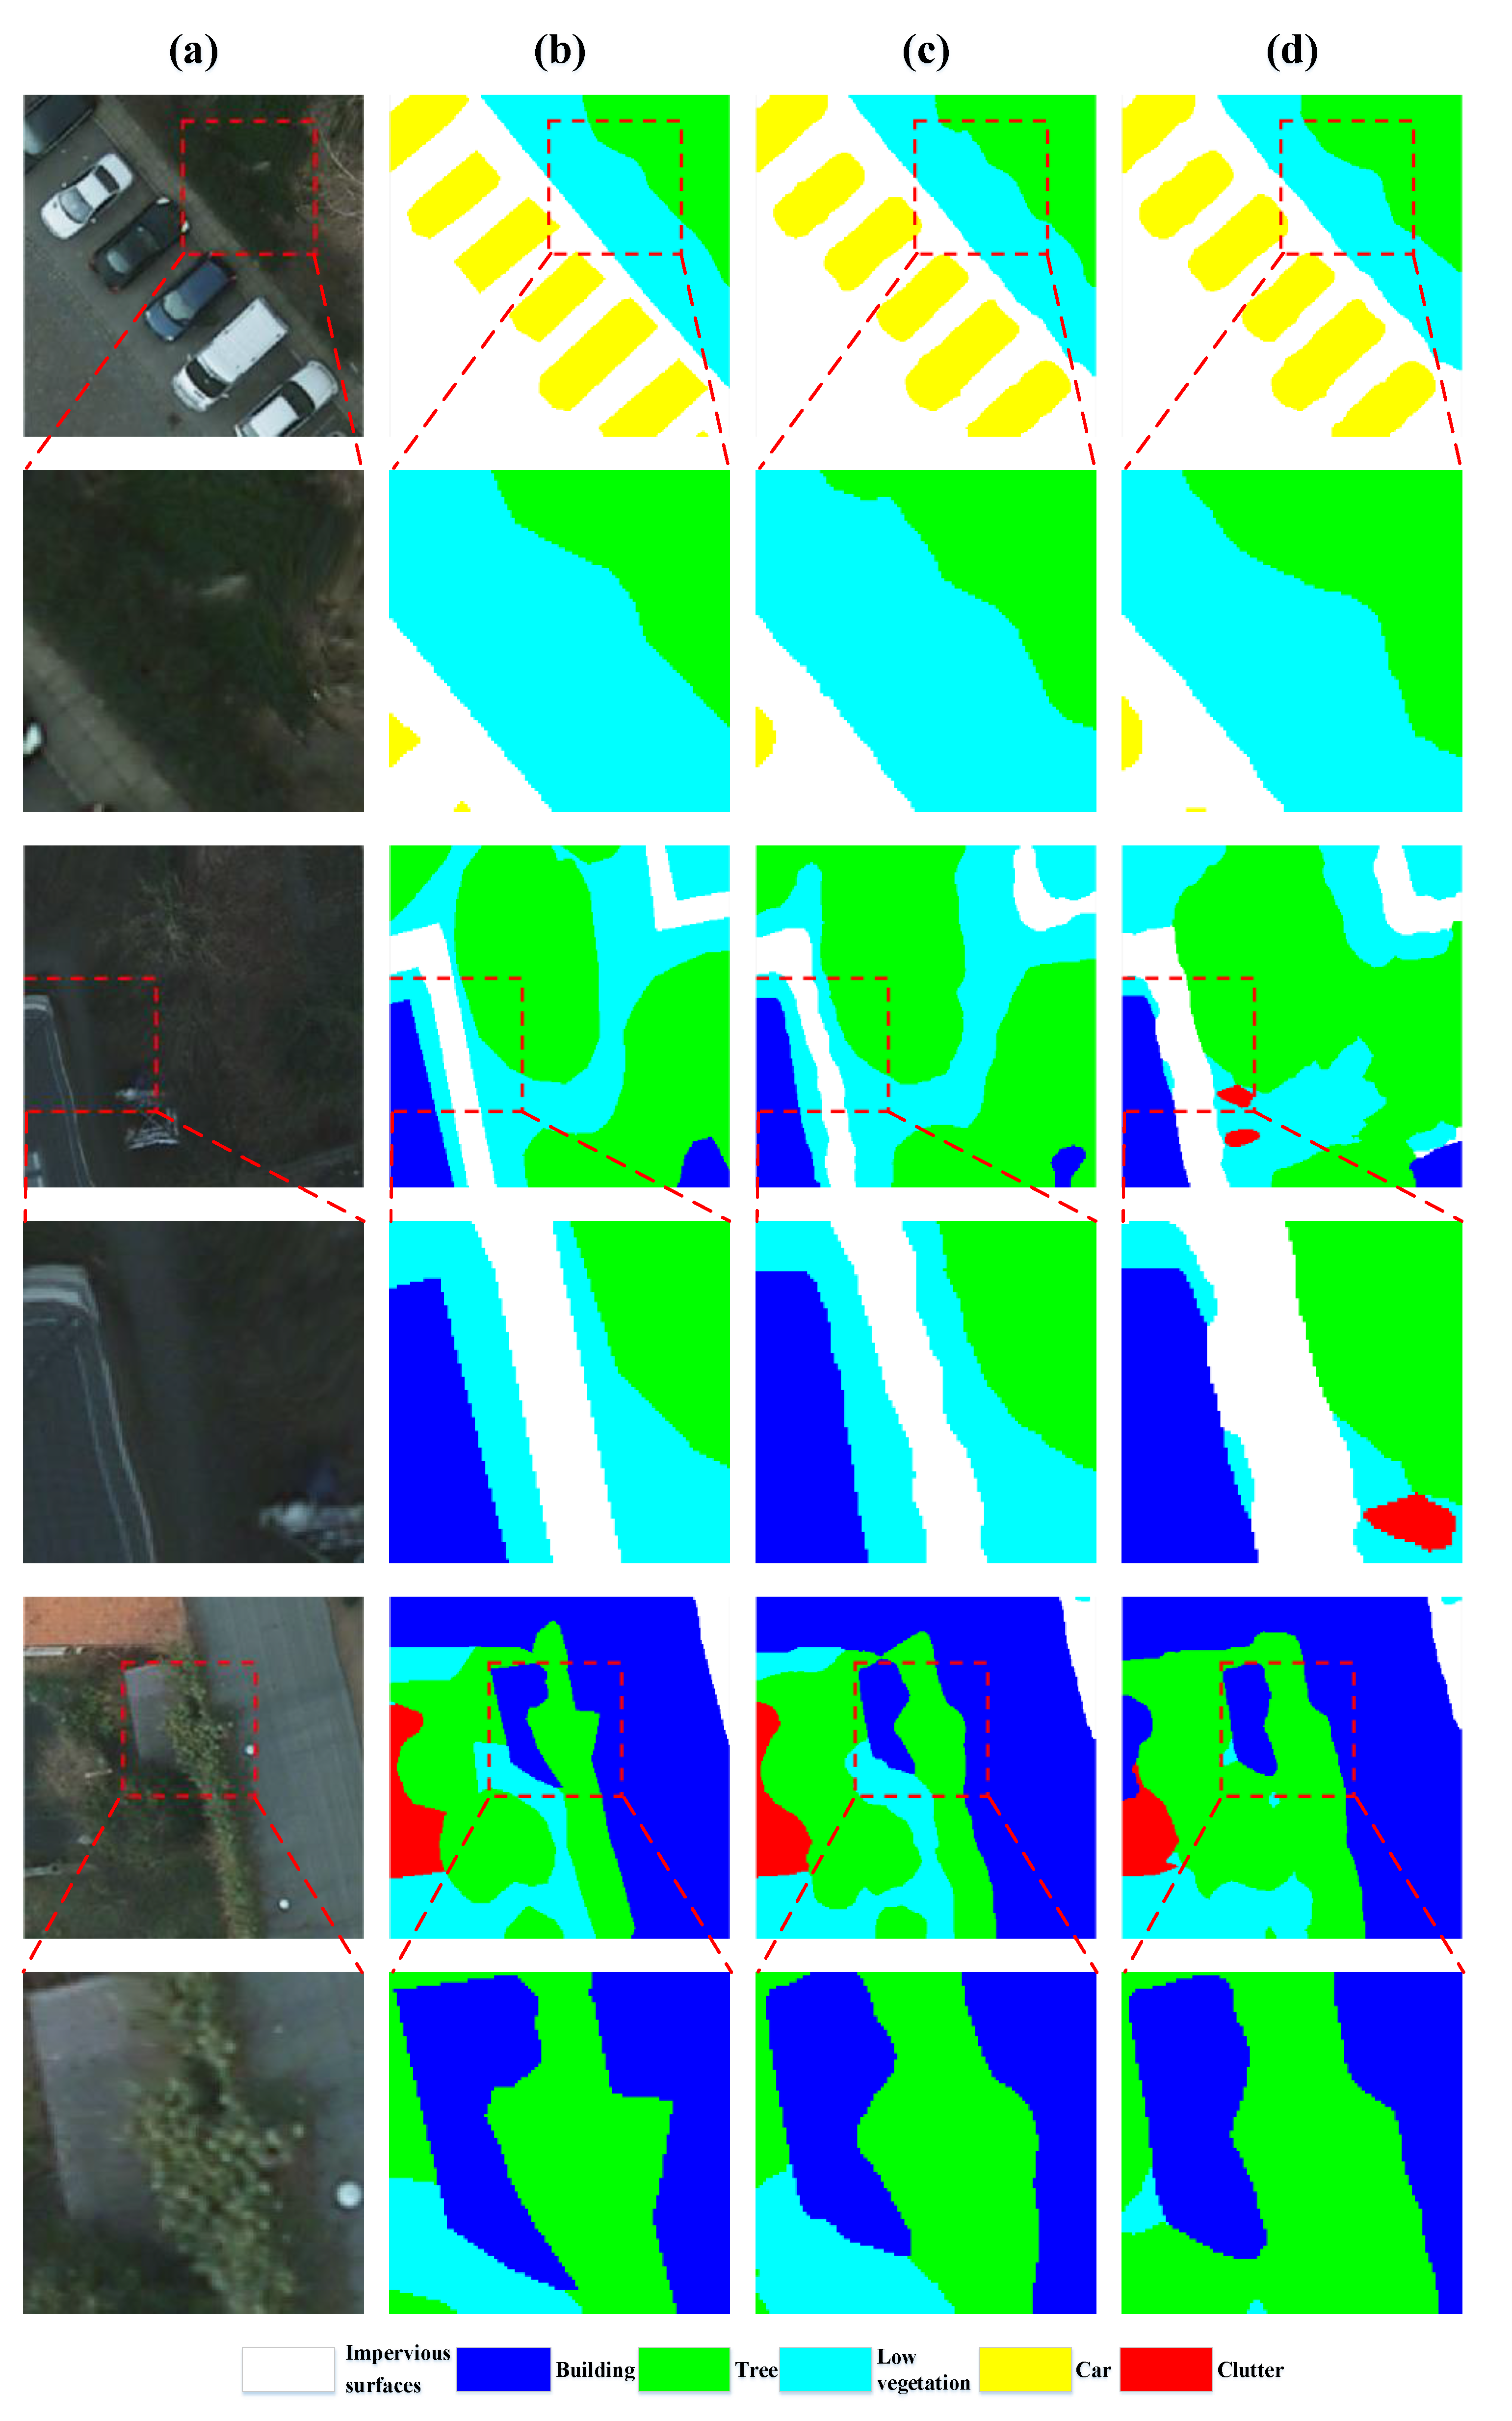
As shown in Figure 13 and Figure 14, the results predicted by SSCNet and SSCNet w/o SpeA are presented. With SpeA, SSCNet exhibits enhanced consistency in classifying various land covers, closely mirroring the ground truth, particularly around complex interfaces such as building edges and vegetative boundaries. The edge details are notably sharper, as SpeA aids in delineating clear and precise segmentations, a contrast to the SSCNet without SpeA, where the edges appear blurred and less defined. This comparative visualization underscores the efficacy of SpeA in augmenting the spatial resolution and fidelity of semantic segmentation in remote sensing imagery.
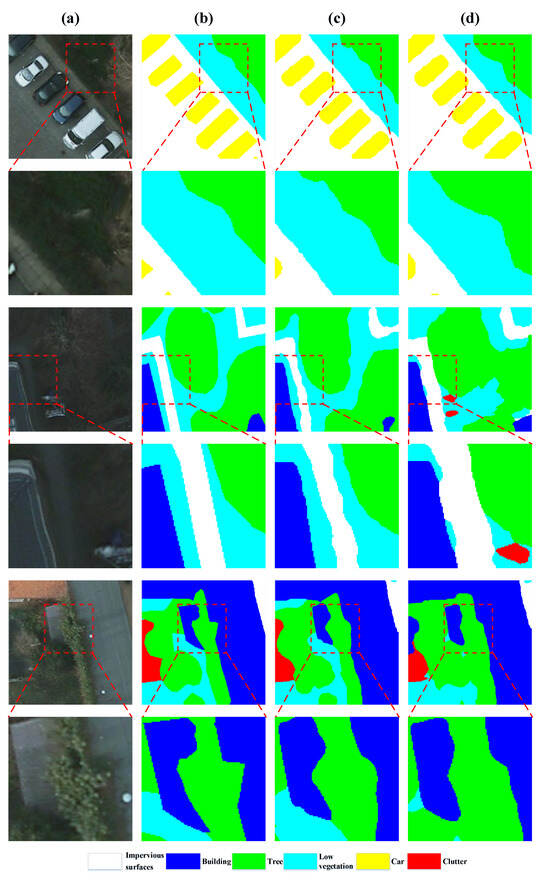
Figure 13.
Visualizations of samples of ISPRS Potsdam. (a) RGB images, (b) ground truth, (c) predictions by SSCNet, and (d) predictions by SSCNet w/o SpeA.
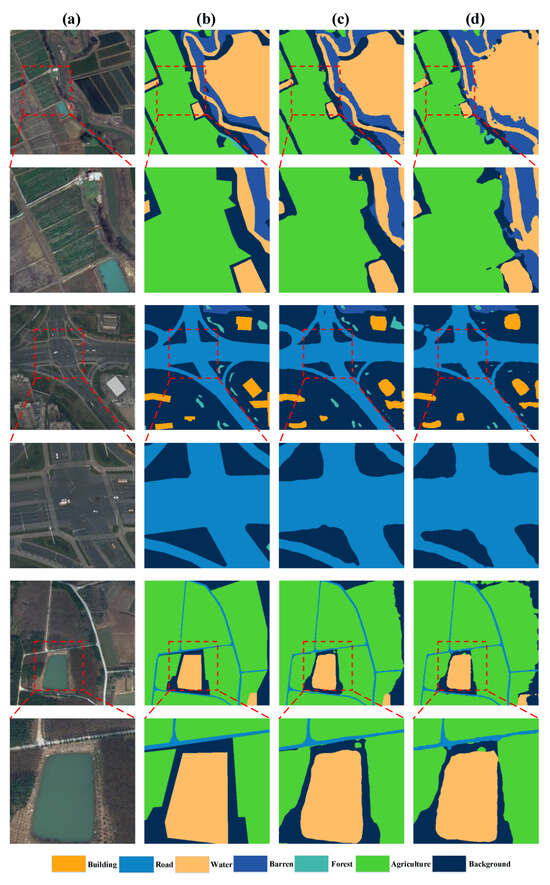
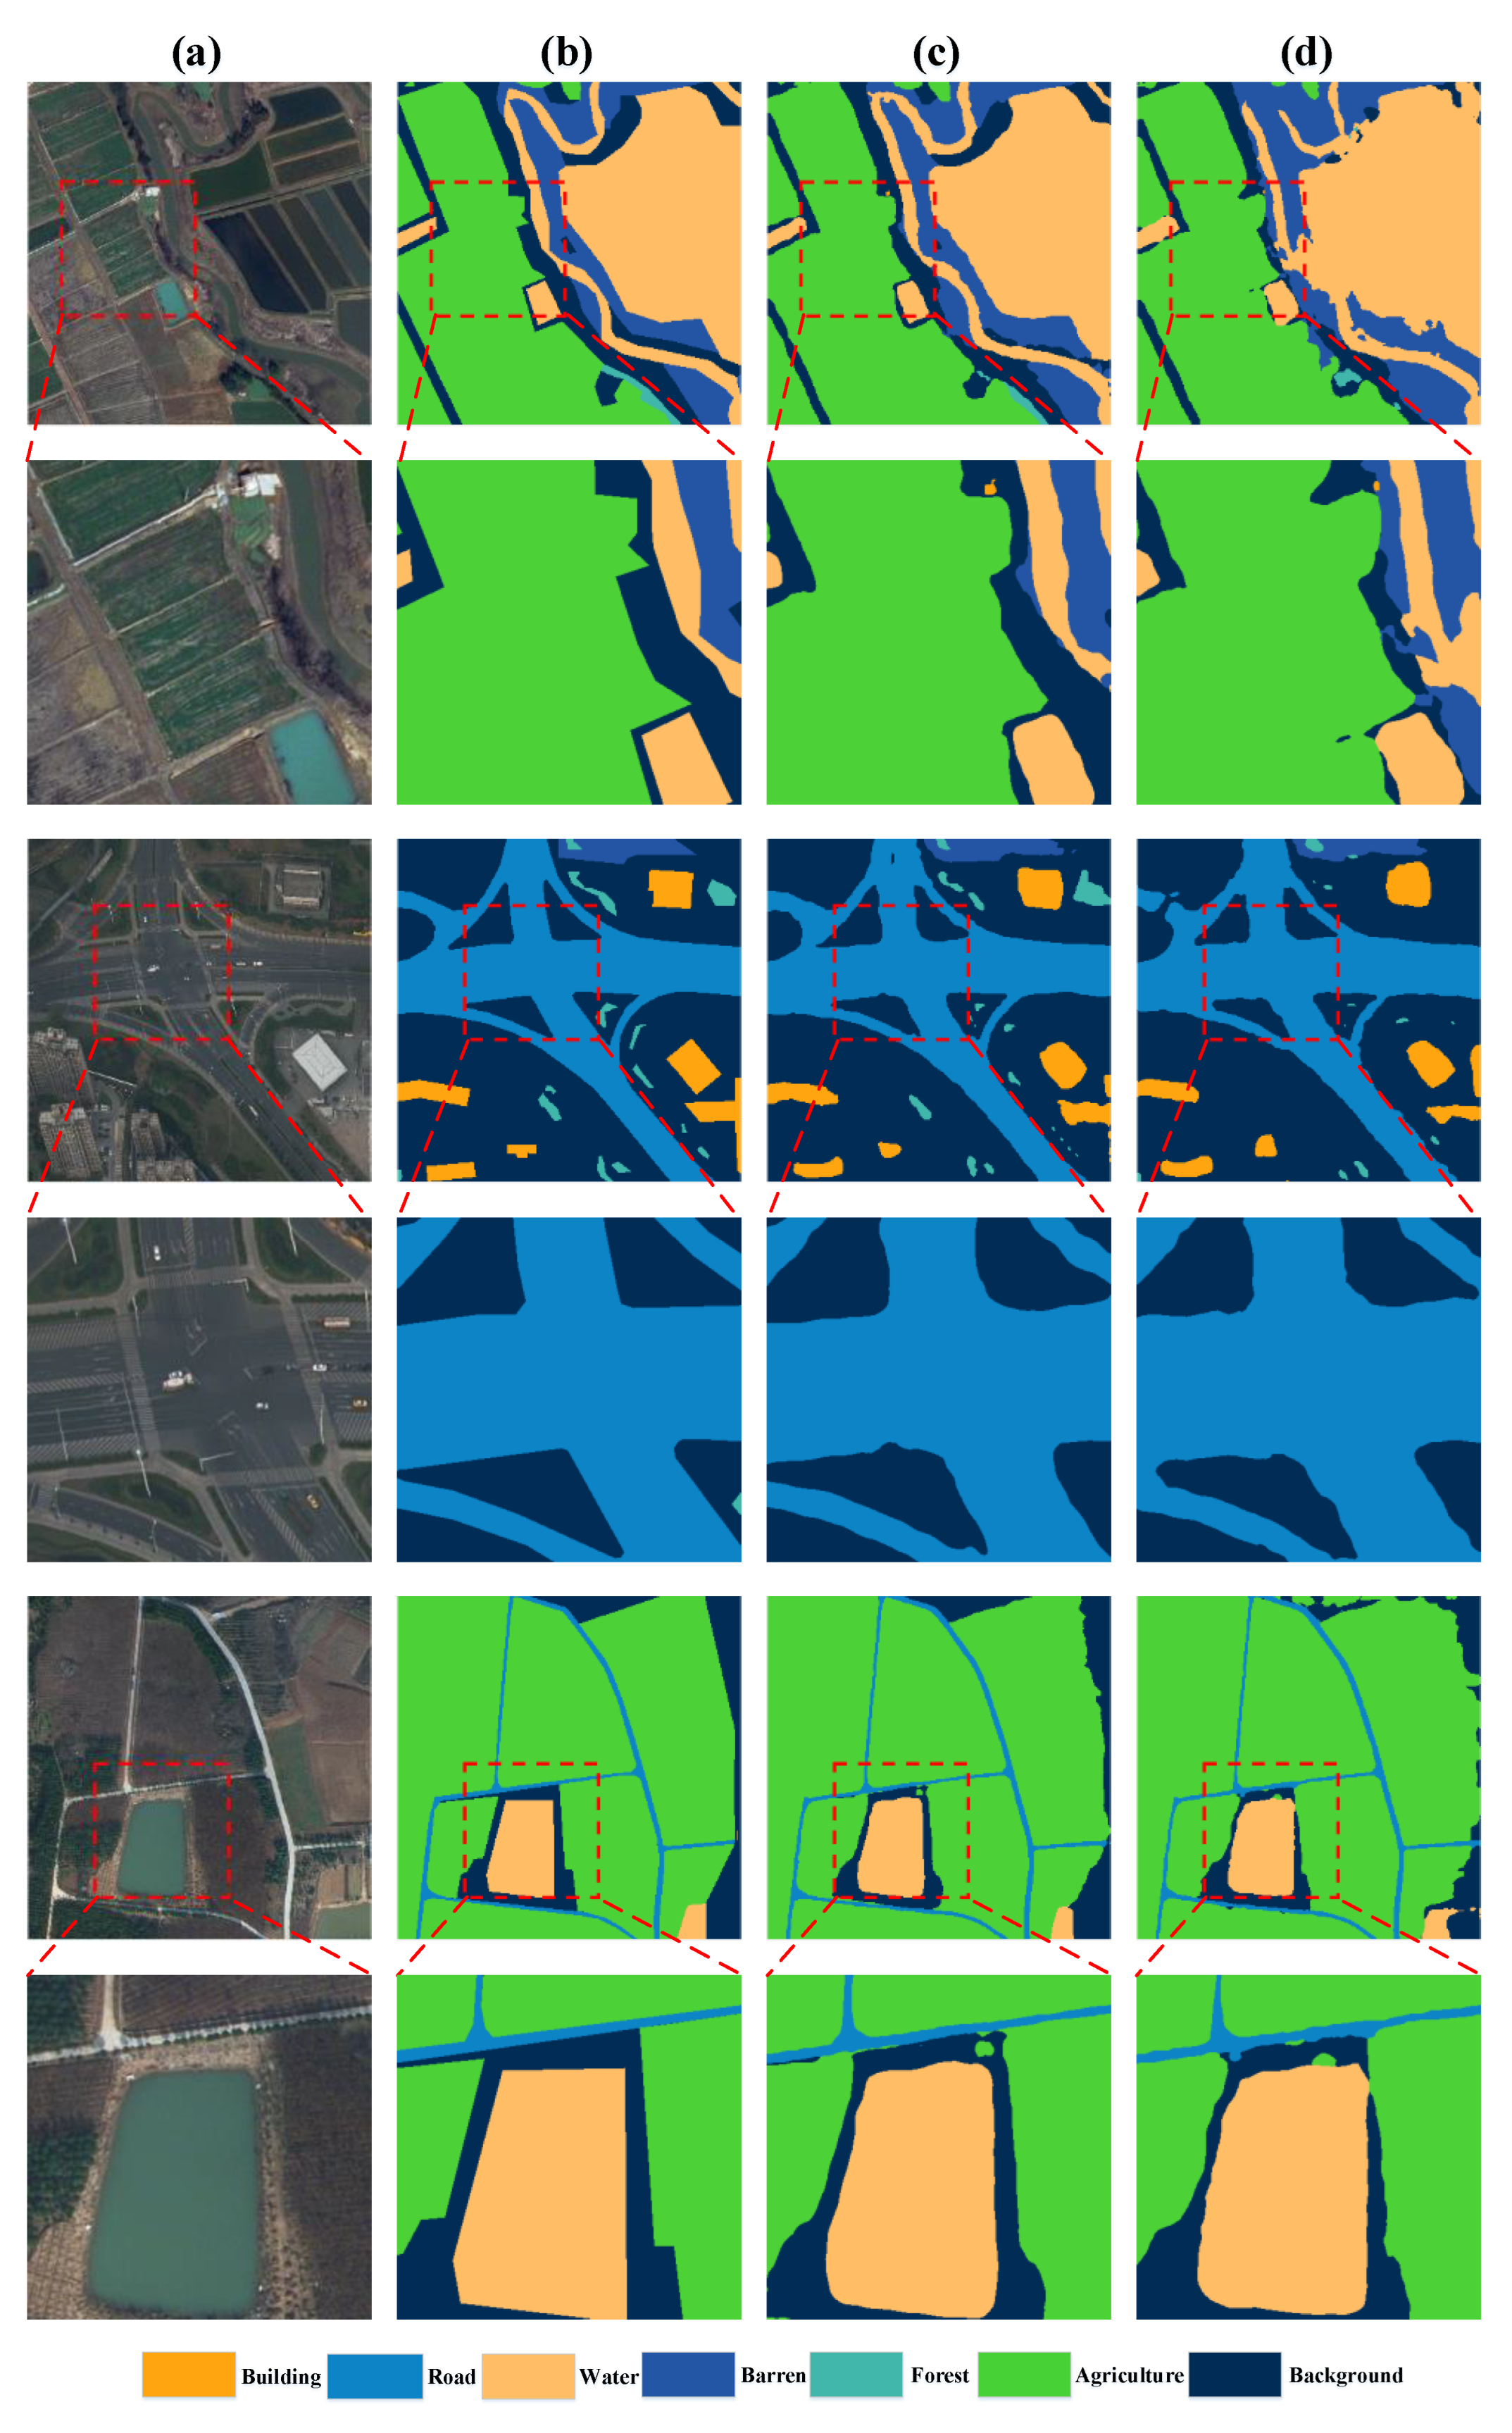
Figure 14.
Visualizations of samples of LoveDA. (a) RGB images, (b) ground truth, (c) predictions by SSCNet, and (d) predictions by SSCNet w/o SpeA.
These findings demonstrate that the SpeA module in SSCNet significantly contributes to its ability to handle both ISPRS Potsdam and LoveDA datasets, enhancing its semantic segmentation capabilities, especially in more challenging datasets like LoveDA. Therefore, retaining the SpeA module in SSCNet is essential for robust performance across various remote sensing applications.
4.6. Effects of the Value of
In this section, we delve into the effects of the coefficient on the model’s performance across two distinct datasets: ISPRS Potsdam and LoveDA. The coefficient is pre-defined to modulate the importance of spectral attention within the model’s architecture. Table 6 reports the results with different settings of . An analysis of the performance metrics indicates a non-linear relationship between the value of and the model’s effectiveness, with the model achieving optimal performance at an intermediate value.
Table 6.
Results with different values of α. Results are in the form of AF/OA/mIoU.
Specifically, the optimal results for both datasets are observed at , where the AF/OA/mIoU scores reach their peak. For the ISPRS Potsdam dataset, the performance improves consistently as increases from 0 to 0.5, suggesting that the incorporation of spectral attention up to a certain threshold contributes positively to the model’s accuracy and ability to generalize. However, beyond this point, there is a notable decline in performance, with showing a decrease and regressing to levels similar to the absence of spectral attention (). This trend is mirrored in the LoveDA dataset, albeit with more pronounced fluctuations, suggesting a higher sensitivity to the changes in spectral attention. The pronounced peak at , followed by a decline, indicates that while spectral attention is crucial, its overemphasis is counterproductive.
The results elucidate the critical balance required in spectral attention to enhance model performance. At low values of A (0 and 0.25), the model is likely underutilizing spectral information, while at high values (0.75 and 1.0), there is an overemphasis that may lead to overfitting or distraction from spatial features. The peak performance at across all metrics for both datasets underscores the importance of a moderated spectral attention mechanism. This balance ensures that the model is neither starved of spectral information nor overwhelmed by it, facilitating robust feature extraction that is evidently beneficial across different landscapes and urban settings, as represented by the ISPRS Potsdam and LoveDA datasets, respectively.
4.7. Discussion
The proposed SSCNet introduces an innovative approach to the semantic segmentation of remote sensing images by incorporating both spectral and spatial information within a unified framework. Theoretically, the architecture of SSCNet is designed to exploit the rich spectral information present in hyperspectral images through its joint spectral–spatial attention mechanism, potentially outperforming methods that do not utilize such integration. While our comparisons have been limited to methods utilizing 2D FFT conversion, the conceptual strengths of SSCNet suggest that it could excel in comparisons against recent state-of-the-art methods as well. Specifically, SSCNet’s feature representation in both the spatial and frequency domains may provide enhanced discriminative capabilities, particularly in complex segmentation scenarios.
Future work could extend these comparisons to include recent advancements in semantic segmentation that do not employ 2D FFT conversion, providing a more exhaustive benchmark for SSCNet’s performance. Moreover, investigations could be directed toward refining SSCNet’s spectral–spatial attention mechanisms to further leverage the complementarity of spectral and spatial features, thereby reinforcing its theoretical and practical superiority in the semantic segmentation of remote sensing images.
5. Conclusions
In conclusion, this study introduces SSCNet, a pioneering spectrum-space collaborative network aimed at enhancing semantic segmentation in RSIs. SSCNet adeptly capitalizes on the intrinsic spectral characteristics of RSIs by incorporating spectral and spatial context for discriminative representation learning. The novel joint spectral–spatial attention module, comprising SpeA and SpaA, dynamically captures the spectral and spatial dependencies simultaneously. The proposed CSED in SpeA is pivotal for modeling spectral contexts in the frequency domain, and the position-wise self-attention in SpaA complements this by addressing spatial aspects. The synergy achieved by merging these attention maps through AttnFusion results in SSCNet’s attention mechanism, which considers both spectral and spatial contexts. Additionally, the introduced hybrid loss function, which combines edge loss, Dice loss, and cross-entropy loss, ensures the comprehensive training of SSCNet, thus enabling it to learn discriminative features within both the spectral and spatial domains. Experimental results on the ISPRS Potsdam and LoveDA datasets demonstrate SSCNet’s superiority over state-of-the-art methods, reaffirming its efficacy in addressing the challenges of remote sensing image segmentation.
Looking forward, this work opens up several avenues for future research. First, SSCNet could be extended to address the task of pansharpening, which is critical for improving the spatial resolution of RSIs. Second, further investigations into adaptive fusion techniques for spectral and spatial features can be explored to enhance the network’s flexibility in handling diverse remote sensing scenarios. Additionally, the incorporation of more advanced spectral analysis tools and domain adaptation methods may improve the model’s performance under various conditions. Finally, research into the application of SSCNet in real-time semantic segmentation and its integration with autonomous systems, such as drones or satellites, could pave the way for transformative developments in the field of remote sensing and environmental monitoring.
Author Contributions
Conceptualization, X.L. (Xin Li) and F.X.; methodology, X.L. (Xin Li), F.X. and X.L. (Xin Lyu); software, X.L. (Xin Li), Z.C. and H.G.; validation, X.L. (Xin Li), X.Y., R.X. and D.C.; formal analysis, X.L. (Xin Li) and X.L. (Xin Lyu); investigation, X.L. (Xin Li), Z.C. and R.X.; data curation, X.L. (Xin Li), X.Y., Z.C., D.C., H.G. and X.L. (Xin Lyu); writing—original draft preparation, X.L. (Xin Li) and F.X.; writing—review and editing, X.L. (Xin Lyu) and F.X.; visualization, X.L. (Xin Li), X.Y. and Z.C.; supervision, F.X.; project administration, X.Y., B.Y., D.C. and H.G.; funding acquisition, X.Y., D.C. and X.L. (Xin Lyu). All authors have read and agreed to the published version of the manuscript.
Funding
This research was funded by the High-Resolution Earth Observing System—Water Application Demonstration (Grant No. 08-Y30F02-9001-20/22), the Special Funds for Basic Research Operating Expenses of Central-Level Public Welfare Research Institutes (Grant No. HKY-JBYW-2023-20), the Fundamental Research Funds for the Central Universities (Grant Nos. B230201007, B230204009, and B220206006), the National Natural Science Foundation of China (Grant Nos. 42104033, 42101343 and 82004498), and the Excellent Post-Doctoral Program of Jiangsu Province (Grant No. 2022ZB166).
Institutional Review Board Statement
Not applicable.
Informed Consent Statement
Not applicable.
Data Availability Statement
Publicly available datasets were analyzed in this study. The download links are as follows: [https://www.isprs.org/education/benchmarks/UrbanSemLab/default.aspx], accessed on 22 December 2022 and [https://github.com/Junjue-Wang/LoveDA], accessed on 5 May 2023.
Conflicts of Interest
The authors declare no conflict of interest.
References
- Sun, W.; Chen, C.; Liu, W.; Yang, G.; Meng, X.; Wang, L.; Ren, K. Coastline extraction using remote sensing: A review. GIScience Remote Sens. 2023, 60, 2243671. [Google Scholar] [CrossRef]
- Saeid, A.A.A. Remote Sensing in Water Quality and Water Resources Management. Int. J. Res. Appl. Sci. Biotechnol. 2022, 9, 163–170. [Google Scholar] [CrossRef]
- Li, X.; Lyu, X.; Tong, Y.; Li, S.; Liu, D. An object-based river extraction method via optimized transductive support vector machine for multi-spectral remote-sensing images. IEEE Access 2019, 7, 46165–46175. [Google Scholar] [CrossRef]
- Qin, R.; Liu, T. A review of landcover classification with very-high resolution remotely sensed optical images—Analysis unit, model scalability and transferability. Remote Sens. 2022, 14, 646. [Google Scholar] [CrossRef]
- Lv, Z.; Huang, H.; Li, X.; Zhao, M.; Benediktsson, J.A.; Sun, W.; Falco, N. Land cover change detection with heterogeneous remote sensing images: Review, progress, and perspective. Proc. IEEE 2022, 110, 1976–1991. [Google Scholar] [CrossRef]
- Li, Y.; Zhou, Y.; Zhang, Y.; Zhong, L.; Wang, J.; Chen, J. DKDFN: Domain knowledge-guided deep collaborative fusion network for multimodal unitemporal remote sensing land cover classification. ISPRS J. Photogramm. Remote Sens. 2022, 186, 170–189. [Google Scholar] [CrossRef]
- Bai, H.; Li, Z.; Guo, H.; Chen, H.; Luo, P. Urban green space planning based on remote sensing and geographic information systems. Remote Sens. 2022, 14, 4213. [Google Scholar] [CrossRef]
- Chen, Z.; Deng, L.; Luo, Y.; Li, D.; Junior, J.M.; Gonçalves, W.N.; Nurunnabi, A.A.M.; Li, J.; Wang, C.; Li, D. Road extraction in remote sensing data: A survey. Int. J. Appl. Earth Obs. Geoinf. 2022, 112, 102833. [Google Scholar] [CrossRef]
- Bitala, W.; Johnima, A.; Junta, U.; Browndi, I. Predictive Analysis Towards Integration of Urban Planning and GIS to Manage Health Care Organization. Int. J. Sci. Adv. Technol. 2022, 36, 81–87. [Google Scholar]
- Román, A.; Tovar-Sánchez, A.; Roque-Atienza, D.; Huertas, I.E.; Caballero, I.; Fraile-Nuez, E.; Navarro, G. Unmanned aerial vehicles (UAVs) as a tool for hazard assessment: The 2021 eruption of Cumbre Vieja volcano, La Palma Island (Spain). Sci. Total Environ. 2022, 843, 157092. [Google Scholar] [CrossRef]
- Ahmad, M.N.; Shao, Z.; Aslam, R.W.; Ahmad, I.; Liao, M.; Li, X.; Song, Y. Landslide hazard, susceptibility and risk assessment (HSRA) based on remote sensing and GIS data models: A case study of Muzaffarabad Pakistan. Stoch. Environ. Res. Risk Assess. 2022, 36, 4041–4056. [Google Scholar] [CrossRef]
- Yuan, X.; Shi, J.; Gu, L. A review of deep learning methods for semantic segmentation of remote sensing imagery. Expert Syst. Appl. 2021, 169, 114417. [Google Scholar] [CrossRef]
- Gonzalez-Diaz, I.; Diaz-de-Maria, F. A region-centered topic model for object discovery and category-based image segmentation. Pattern Recognit. 2013, 46, 2437–2449. [Google Scholar] [CrossRef]
- Anand, T.; Sinha, S.; Mandal, M.; Chamola, V.; Yu, F.R. AgriSegNet: Deep aerial semantic segmentation framework for IoT-assisted precision agriculture. IEEE Sens. J. 2021, 21, 17581–17590. [Google Scholar] [CrossRef]
- Wang, S.; Li, Y.; Yang, H. Self-adaptive mutation differential evolution algorithm based on particle swarm optimization. Appl. Soft Comput. 2019, 81, 105496. [Google Scholar] [CrossRef]
- Zhang, C.; Sargent, I.; Pan, X.; Li, H.; Gardiner, A.; Hare, J.; Atkinson, P.M. Joint Deep Learning for land cover and land use classification. Remote Sens. Environ. 2019, 221, 173–187. [Google Scholar] [CrossRef]
- Ma, L.; Li, M.; Ma, X.; Cheng, L.; Du, P.; Liu, Y. A review of supervised object-based land-cover image classification. ISPRS J. Photogramm. Remote Sens. 2017, 130, 277–293. [Google Scholar] [CrossRef]
- Liu, Y.; Piramanayagam, S.; Monteiro, S.T.; Saber, E. Semantic segmentation of multisensor remote sensing imagery with deep ConvNets and higher-order conditional random fields. J. Appl. Remote Sens. 2019, 13, 016501. [Google Scholar] [CrossRef]
- Li, Z.; Liu, F.; Yang, W.; Peng, S.; Zhou, J. A survey of convolutional neural networks: Analysis, applications, and prospects. IEEE Trans. Neural Netw. Learn. Syst. 2022, 33, 6999–7019. [Google Scholar] [CrossRef]
- Elngar, A.A.; Arafa, M.; Fathy, A.; Moustafa, B.; Mahmoud, O.; Shaban, M.; Fawzy, N. Image classification based on CNN: A survey. J. Cybersecur. Inf. Manag. 2021, 6, 18–50. [Google Scholar] [CrossRef]
- Arkin, E.; Yadikar, N.; Xu, X.; Aysa, A.; Ubul, K. A survey: Object detection methods from CNN to transformer. Multimed. Tools Appl. 2023, 82, 21353–21383. [Google Scholar] [CrossRef]
- Li, X.; Xu, F.; Lyu, X.; Tong, Y.; Chen, Z.; Li, S.; Liu, D. A remote-sensing image pan-sharpening method based on multi-scale channel attention residual network. IEEE Access 2020, 8, 27163–27177. [Google Scholar] [CrossRef]
- Li, X.; Xu, F.; Liu, F.; Xia, R.; Tong, Y.; Li, L.; Xu, Z.; Lyu, X. Hybridizing Euclidean and Hyperbolic Similarities for Attentively Refining Representations in Semantic Segmentation of Remote Sensing Images. IEEE Geosci. Remote Sens. Lett. 2022, 19, 1–5. [Google Scholar] [CrossRef]
- Huang, Z.; Zhang, Q.; Zhang, G. MLCRNet: Multi-Level Context Refinement for Semantic Segmentation in Aerial Images. Remote Sens. 2022, 14, 1498. [Google Scholar] [CrossRef]
- ISPRS Potsdam 2D Semantic Labeling Dataset. [Online]. Available online: http://www2.isprs.org/commissions/comm3/wg4/2d-sem-label-potsdam.html (accessed on 22 December 2022).
- ISPRS Vaihingen 2D Semantic Labeling Dataset. [Online]. Available online: http://www2.isprs.org/commissions/comm3/wg4/2d-sem-label-vaihingen.html (accessed on 22 December 2022).
- Shang, R.; Zhang, J.; Jiao, L.; Li, Y.; Marturi, N.; Stolkin, R. Multi-scale Adaptive Feature Fusion Network for Semantic Segmentation in Remote Sensing Images. Remote Sens. 2020, 12, 872. [Google Scholar] [CrossRef]
- Du, S.; Du, S.; Liu, B.; Zhang, X. Mapping large-scale and fine-grained urban functional zones from VHR images using a multi-scale semantic segmentation network and object based approach. Remote Sens. Environ. 2021, 261, 112480. [Google Scholar] [CrossRef]
- Guo, M.H.; Xu, T.X.; Liu, J.J.; Liu, Z.N.; Jiang, P.T.; Mu, T.J.; Zhang, S.H.; Martin, R.R.; Cheng, M.M.; Hu, S.M. Attention mechanisms in computer vision: A survey. Comput. Vis. Media 2022, 8, 331–368. [Google Scholar] [CrossRef]
- Aleissaee, A.A.; Kumar, A.; Anwer, R.M.; Khan, S.; Cholakkal, H.; Xia, G.S.; Khan, F.S. Transformers in remote sensing: A survey. Remote Sens. 2023, 15, 1860. [Google Scholar] [CrossRef]
- Huang, Z.; Wang, X.; Huang, L.; Huang, C.; Wei, Y.; Liu, W. CCNet: Criss-Cross Attention for Semantic Segmentation. IEEE Trans. Pattern Anal. Mach. Intell. 2023, 45, 6896–6908. [Google Scholar] [CrossRef]
- Li, X.; Xu, F.; Lyu, X.; Gao, H.; Tong, Y.; Cai, S.; Li, S.; Liu, D. Dual attention deep fusion semantic segmentation networks of large-scale satellite remote-sensing images. Int. J. Remote Sens. 2021, 42, 3583–3610. [Google Scholar] [CrossRef]
- Li, R.; Zheng, S.; Zhang, C.; Duan, C.; Su, J.; Wang, L.; Atkinson, P.M. Multiattention network for semantic segmentation of fine-resolution remote sensing images. IEEE Trans. Geosci. Remote Sens. 2021, 60, 1–13. [Google Scholar] [CrossRef]
- Li, X.; Xu, F.; Xia, R.; Lyu, X.; Gao, H.; Tong, Y. Hybridizing Cross-Level Contextual and Attentive Representations for Remote Sensing Imagery Semantic Segmentation. Remote Sens. 2021, 13, 2986. [Google Scholar] [CrossRef]
- Li, X.; Li, T.; Chen, Z.; Zhang, K.; Xia, R. Attentively Learning Edge Distributions for Semantic Segmentation of Remote Sensing Imagery. Remote Sens. 2022, 14, 102. [Google Scholar] [CrossRef]
- Ding, L.; Tang, H.; Bruzzone, L. LANet: Local attention embedding to improve the semantic segmentation of remote sensing images. IEEE Trans. Geosci. Remote Sens. 2021, 59, 426–435. [Google Scholar] [CrossRef]
- Jin, J.; Zhou, W.; Yang, R.; Ye, L.; Yu, L. Edge detection guide network for semantic segmentation of remote-sensing images. IEEE Geosci. Remote Sens. Lett. 2023, 20, 1–5. [Google Scholar] [CrossRef]
- Zhang, L.; Zhang, L. Artificial intelligence for remote sensing data analysis: A review of challenges and opportunities. IEEE Geosci. Remote Sens. Mag. 2022, 10, 270–294. [Google Scholar] [CrossRef]
- Richards, J.A.; Richards, J.A. Remote Sensing Digital Image Analysis; Springer: Berlin/Heidelberg, Germany, 2022; Volume 5. [Google Scholar]
- Pastorino, M.; Moser, G.; Serpico, S.B.; Zerubia, J. Semantic segmentation of remote-sensing images through fully convolutional neural networks and hierarchical probabilistic graphical models. IEEE Trans. Geosci. Remote Sens. 2022, 60, 1–16. [Google Scholar] [CrossRef]
- Tao, C.; Meng, Y.; Li, J.; Yang, B.; Hu, F.; Li, Y.; Cui, C.; Zhang, W. MSNet: Multispectral semantic segmentation network for remote sensing images. GIScience Remote Sens. 2022, 59, 1177–1198. [Google Scholar] [CrossRef]
- Yin, P.; Zhang, D.; Han, W.; Li, J.; Cheng, J. High-Resolution Remote Sensing Image Semantic Segmentation via Multiscale Context and Linear Self-Attention. IEEE J. Sel. Top. Appl. Earth Obs. Remote Sens. 2022, 15, 9174–9185. [Google Scholar] [CrossRef]
- Diakogiannis, F.I.; Waldner, F.; Caccetta, P.; Wu, C. ResUNet-a: A deep learning framework for semantic segmentation of remotely sensed data. ISPRS J. Photogramm. Remote Sens. 2020, 162, 94–114. [Google Scholar] [CrossRef]
- Li, J.; Wang, H.; Zhang, A.; Liu, Y. Semantic Segmentation of Hyperspectral Remote Sensing Images Based on PSE-UNet Model. Sensors 2022, 22, 9678. [Google Scholar] [CrossRef] [PubMed]
- Wei, S.; Liu, Y.; Li, M.; Huang, H.; Zheng, X.; Guan, L. DCCaps-UNet: A U-Shaped Hyperspectral Semantic Segmentation Model Based on the Depthwise Separable and Conditional Convolution Capsule Network. Remote Sens. 2023, 15, 3177. [Google Scholar] [CrossRef]
- Liu, R.; Tao, F.; Liu, X.; Na, J.; Leng, H.; Wu, J.; Zhou, T. RAANet: A residual ASPP with attention framework for semantic segmentation of high-resolution remote sensing images. Remote Sens. 2022, 14, 3109. [Google Scholar] [CrossRef]
- Zhang, C.; Jiang, W.; Zhang, Y.; Wang, W.; Zhao, Q.; Wang, C. Transformer and CNN hybrid deep neural network for semantic segmentation of very-high-resolution remote sensing imagery. IEEE Trans. Geosci. Remote Sens. 2022, 60, 1–20. [Google Scholar] [CrossRef]
- Li, R.; Wang, L.; Zhang, C.; Duan, C.; Zheng, S. A2-FPN for semantic segmentation of fine-resolution remotely sensed images. Int. J. Remote Sens. 2022, 43, 1131–1155. [Google Scholar] [CrossRef]
- Sun, L.; Cheng, S.; Zheng, Y.; Wu, Z.; Zhang, J. SPANet: Successive pooling attention network for semantic segmentation of remote sensing images. IEEE J. Sel. Top. Appl. Earth Obs. Remote Sens. 2022, 15, 4045–4057. [Google Scholar] [CrossRef]
- Li, X.; Xu, F.; Liu, F.; Lyu, X.; Tong, Y.; Xu, Z.; Zhou, J. A Synergistical Attention Model for Semantic Segmentation of Remote Sensing Images. IEEE Trans. Geosci. Remote Sens. 2023, 61, 1–16. [Google Scholar] [CrossRef]
- Long, W.; Zhang, Y.; Cui, Z.; Xu, Y.; Zhang, X. Threshold Attention Network for Semantic Segmentation of Remote Sensing Images. IEEE Trans. Geosci. Remote Sens. 2023, 61, 1–12. [Google Scholar] [CrossRef]
- Gueguen, L.; Sergeev, A.; Kadlec, B.; Liu, R.; Yosinski, J. Faster neural networks straight from jpeg. In Proceedings of the 32nd Conference on Neural Information Processing Systems (NIPS), Montreal, QC, Canada, 3–8 December 2018; pp. 3933–3944. [Google Scholar]
- Ehrlich, M.; Davis, L.S. Deep residual learning in the jpeg transform domain. In Proceedings of the IEEE International Conference on Computer Vision, Seoul, Republic of Korea, 27 October–2 November 2019; pp. 3483–3492. [Google Scholar]
- Xu, K.; Qin, M.; Sun, F.; Wang, Y.; Chen, Y.K.; Ren, F. Learning in the frequency domain. In Proceedings of the IEEE Computer Society Conference on Computer Vision and Pattern Recognition, Seattle, WA, USA, 13–19 June 2020; pp. 1740–1749. [Google Scholar]
- Qin, Z.; Zhang, P.; Wu, F.; Li, X. Fcanet: Frequency channel attention networks. In Proceedings of the IEEE International Conference on Computer Vision, Montreal, BC, Canada, 11–17 October 2021; pp. 763–772. [Google Scholar]
- Wang, J.; Zheng, Z.; Ma, A.; Lu, X.; Zhong, Y. LoveDA: A remote sensing land-cover dataset for domain adaptive semantic segmentation. arXiv 2021, arXiv:2110.08733. [Google Scholar]
- Ronneberger, O.; Fischer, P.; Brox, T. U-Net: Convolutional networks for biomedical image segmentation. In Proceedings of the Medical Image Computing and Computer-Assisted Intervention (MCCAI), Munich, Germany, 5–9 October 2015; Volume 9351, pp. 234–241. [Google Scholar]
- Chen, L.-C.; Papandreou, G.; Kokkinos, I.; Murphy, K.; Yuille, A.L. DeepLab: Semantic image segmentation with deep convolutional nets, atrous convolution, and fully connected CRFs. IEEE Trans. Pattern Anal. Mach. Intell. 2018, 40, 834–848. [Google Scholar] [CrossRef]
- Woo, S.; Park, J.; Lee, J.Y.; Kweon, I.S. CBAM: Convolutional block attention module. In Proceedings of the 15th European Conference on Computer Vision (ECCV), Munich, Germany, 8–14 September 2018; pp. 3–19. [Google Scholar]
- Li, H.; Qiu, K.; Chen, L.; Mei, X.; Hong, L.; Tao, C. SCAttNet: Semantic Segmentation Network with Spatial and Channel Attention Mechanism for High-Resolution Remote Sensing Images. IEEE Geosci. Remote Sens. Lett. 2021, 18, 905–909. [Google Scholar] [CrossRef]


Disclaimer/Publisher’s Note: The statements, opinions and data contained in all publications are solely those of the individual author(s) and contributor(s) and not of MDPI and/or the editor(s). MDPI and/or the editor(s) disclaim responsibility for any injury to people or property resulting from any ideas, methods, instructions or products referred to in the content. |
© 2023 by the authors. Licensee MDPI, Basel, Switzerland. This article is an open access article distributed under the terms and conditions of the Creative Commons Attribution (CC BY) license (https://creativecommons.org/licenses/by/4.0/).