Abstract
Surface reflectance measurement is an integral part of the vicarious calibration of satellite sensors and the validation of satellite-derived top-of-atmosphere (TOA) and surface reflectance products. A well-known practice for estimating surface reflectance is to conduct a field campaign with a spectrometer and a calibration panel, which is labor-intensive and expensive. To address this issue, the Radiometric Calibration Network, RadCalNet, has been developed, which automatically collects surface reflectance over several selected sites. Neither of these approaches can continuously track the atmosphere, which limits their ability to compensate for atmospheric transmittance change during target measurement. This paper presents the dual-spectrometer approach that uses a stationary spectrometer dedicated to continuously tracking changes in atmospheric transmittance by staring at a calibrated reference panel while the mobile spectrometer measures the target. Simultaneous measurement of the reflectance panel and target help to transfer calibration from the stationary spectrometer to the mobile spectrometer and synchronize the measurements. In this manner, atmospheric transmittance changes during target measurement can be tracked and used to reduce the variability of the target surface reflectance. This paper uses field measurement data from combined field campaigns between different calibration groups at Brookings, South Dakota, and Landsat 8 and Landsat 9 underfly efforts over Coconino National Forest, Arizona, and Guymon, Oklahoma. Preliminary results show that even in a clear sky condition, where atmospheric transmittance changes are minimal, the precision of target surface reflectance estimated using the dual-spectrometer approach is 2–6% better than the single-spectrometer approach. The dual-spectrometer approach shows the potential for a substantial improvement in the precision of the target spectral profile when the atmospheric transmittance is changing rapidly during field measurement. Results show that during non-optimal atmospheric conditions, the dual-spectrometer approach improved the precision of the surface reflectance by 50–60% compared to the single-spectrometer approach across most spectral regions. The ability to estimate surface reflectance more precisely using the dual-spectrometer approach in different atmospheric conditions improves the vicarious calibration of optical satellite sensors and the validation of both TOA and surface reflectance products.
1. Introduction
The Landsat satellite program is the longest contiguous Earth-observing program. It started in 1972 with medium-resolution land imaging top-of-atmosphere (TOA) products. These images are used to monitor Earth’s surface changes both locally and globally. In 2017, the U.S. Geological Survey (USGS) upgraded the archive to include a surface reflectance product in addition to the TOA products previously available to assist users in their Earth monitoring pursuits. These products are available on Earth Explorer and require variable processing times depending on the product [1]. Surface reflectance is derived using the TOA product after correction for the temporally, spatially, and spectrally varying scattering and absorbing effects of atmospheric gasses and aerosol [2]. Surface reflectance is necessary for the reliable study of Earth’s surface changes as the atmospheric effect is minimized. For this reason, most global land products from Moderate Resolution Imaging Spectrometer (MODIS) and Visible Infrared Imaging Radiometer Suite (VIIRS) sensors used surface reflectance products instead of TOA products.
Accurate and precise surface reflectance measurement is vital in satellite sensor calibration and validating satellite-derived products. Surface reflectance measurement is predominantly used for two purposes: (i) reflectance-based vicarious calibration and (ii) validation of satellite-derived TOA and surface reflectance products [3,4,5]. The reflectance-based vicarious calibration/validation approach measures surface reflectance and atmospheric parameters such as aerosol and water vapor during satellite overpass. These measurements are input to a radiative transfer code to model the atmosphere during satellite overpass and predict TOA reflectance. The predicted TOA reflectance is compared with the corresponding satellite digital number to derive radiometric calibration gain and bias for satellite sensor calibration, or it is compared with satellite TOA reflectance to validate the satellite TOA reflectance product. Similarly, surface reflectance during a satellite overpass is compared with the satellite-derived surface reflectance product to validate product accuracy. Satellite sensors and their product’s radiometric quality have been increasing with technological advancements. Thus, surface reflectance measurement is also expected to be improved to calibrate and validate such high-quality sensors and their products.
Typically, surface reflectance is measured by conducting a field campaign during sensor overpass. This approach has been used to calibrate and validate different types of satellite sensors and their products [3,4,5,6,7]. Two major pieces of equipment used during a field campaign for measuring a target are a spectrometer and a reference calibration panel. A spectrometer is used to measure reflected energy from the target and the reference calibration panel. The reference panel is sampled approximately every 5 min, which is commonly practiced during field campaigns to measure surface reflectance for validation and calibration of optical satellite sensors and their products [8]. Target reflectance is calculated using the ratio of upwelling radiance from the target and downwelling solar irradiance during the target measurement. Such measurement allows for a traceable knowledge of the absolute accuracy of the measurement. However, it is a labor-intensive and expensive process; thus, only a few campaigns have been carried out, yielding a low-frequency data collection [9]. To mitigate its shortcomings, RadCalNet, the Radiometric Calibration Network, has been developed by the Infrared Visible Optical Sensors (IVOS) subgroup of the Committee on Earth Observation Satellites (CEOS) Working Group on Calibration and Validation (WGCV). RadCalNet is an automated instrumentation developed to measure surface reflectance operationally over several selected sites [10]. The ground viewing radiometer (GVR) at Railroad Valley Playa and the spectrometer at Baotou measure the surface every two minutes [10]. Satellite TOA and surface products have been validated by comparing them with RadCalNet measurements [4,5,11].
A major limitation of the current approach to estimating surface reflectance is its inability to track atmospheric transmittance changes during the measurement of the unknown target and to take it into account while estimating its reflectance. This issue can be addressed using the dual-spectrometer approach. In the dual-spectrometer approach, the stationary spectrometer stares at the reference calibration panel and tracks changes in atmospheric transmittance, while the mobile spectrometer measures the unknown target. These simultaneous measurements are used to track changes in the atmosphere continuously and then to update the reflectance calibration of the mobile unit continuously during the time it was collecting upwelling radiance from the target by synchronizing the measurements. This synchronization tracks changes in atmospheric transmittance and reduces variability during surface reflectance measurement of the unknown target. The objective of this paper is to report a methodology that improves surface reflectance precision using the dual-spectrometer approach. Preliminary results have shown that the dual-spectrometer approach can estimate the surface reflectance of an unknown target more precisely than the single-spectrometer approach.
This paper is organized as follows: Section 2 describes the equipment used in the field campaign and the methodology used to collect and process the field data. Section 3 compares the surface reflectance from the single- and dual-spectrometer approaches. Section 4 discusses the reason for more precise surface reflectance estimation using the dual-spectrometer approach. Finally, Section 5 presents the conclusion of this work.
2. Materials and Methods
Datasets, equipment, and methodology used to implement the dual-spectrometer approach are described in the following subsections. A comparison of the target surface reflectance from both methods was performed to understand the cause of the improvement due to the dual-spectrometer approach over the single-spectrometer approach.
2.1. Field Campaign
The dual-spectrometer methodology was developed to evaluate the data obtained from two types of field campaigns: the Big Multi-Agency Collection (Big MAC) and the Landsat 8/9 underfly maneuver. The Big MAC was a joint agency field campaign with contributing members from the USGS Earth Resources Observation and Science Center (EROS), South Dakota State University (SDSU), Rochester Institute of Technology (RIT), and Labsphere [12]. Big MAC was conducted at the SDSU Research Park in Brookings, South Dakota, from 30 to 31 August 2021. The “Landsat 8/9 underfly” was a once-in-a-mission lifetime opportunity when Landsat 8 and Landsat 9 flew identical paths at the same time while Landsat 9 was moving into its planned orbit [13]. Data were taken from USGS EROS field campaign sites in Guymon, Oklahoma, and Coconino National Forest in Arizona on 14 and 15 November 2021, respectively.
2.2. Equipment Used for the Study
The primary instruments required for this study include a pair of general-purpose spectrometers paired with two white reference panels. The spectrometers were acquired from Malvern Panalytical. The company is known for its robust general-purpose field spectrometer, also known as an “ASD”, which measures spectral radiant energy. It is a compact and field-portable instrument (FieldSpec 4) with an 8° fore-optic field of view (FOV) that measures radiant energy in the range of 350–2500 nm in 1 nm spectral sampling increments. The spectral resolution is 3 nm for the region 350–1000 nm and 10 nm for the region 1000–2500 nm. The spectral sampling is 1.4 nm for the region 350–100nm and 1.1 nm for the region 1000–2500 nm. The wavelength accuracy across the wavelength range is ±0.5 nm. Malvern Panalytical calibrated the instrument, and its radiance calibration uncertainty at 350 nm, 654.6 nm, 900 nm, 1600 nm, 2000 nm, and 2400 nm is 3.58%, 2.56%, 2.38%, 2.35%, 2.35%, and 3.15%, respectively. The long-term stability of these channels is 2%. The FieldSpec 4 spectrometer is comprised of three separate internal spectrometers all in the same enclosure [14]: visible and near-infrared (VNIR) spectrometer (350–1000 nm), shortwave infrared (SWIR) 1 spectrometer (1000–1800 nm), and SWIR 2 spectrometer (1800–2500 nm). One of the FieldSpec 4 spectrometers operates as a fixed-based unit (FBU), which continuously measures reflected solar energy from a white reference panel, as shown in Figure 1a. The other spectrometer operates as a mobile unit (MU), which collects reflected solar energy from the target, as shown in Figure 1b. The output of the spectrometers is in raw digital number and radiance, these outputs are generated using ViewSpec Pro version 6.2.0. Output radiance is used in this work; however, a digital number can be used if the spectrometer response is linear.
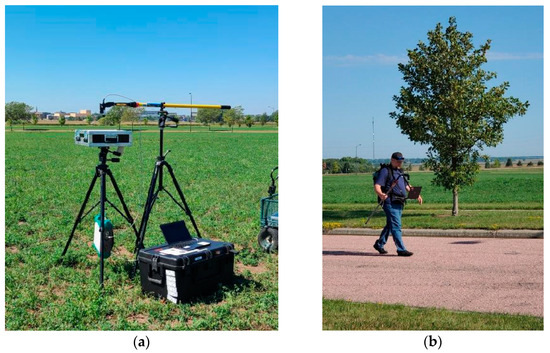
Figure 1.
Fixed-based unit continuously measuring calibration panel (a) and researcher carrying MU to measure target (b) at SDSU Research Park, Brookings, South Dakota.
Another key component used in this study is the Spectralon panel, manufactured by Labsphere, Inc., North Sutton, New Hampshire, USA. The Spectralon panel, 12′ × 12′ in size, is a source of reflectance calibration for spectrometer measurements and essential for calculating surface reflectance using a reflectance-based method [7,15,16]. The Spectralon calibration panels (also known as the “white reference panels”) were characterized at the manufacturing facility, where their reflectance was measured under laboratory conditions, and a set of calibration constants was delivered with them. However, no hemispherical bidirectional reflectance factor (BRF) characterizations were measured; therefore, the panels were further characterized by the University of Arizona’s College of Optical Sciences. The University of Arizona’s College of Optical Science fully analyzed the panels with its hemispherical BRF characterization and associated uncertainty, as shown in Figure 2. BRF is the ratio of radiance reflected by the surface in a particular direction to the radiance reflected by a perfect Lambertian radiator illuminated in an identical fashion [17]. The BRF of the panel is characterized at selected wavelengths and angles. The selected wavelengths are 401.8 nm, 455.4 nm, 502.9 nm, 554.1 nm, 651.0 nm, 699.3 nm, 800.6 nm, 846.4 nm, 951.2 nm, 1061.0 nm, 1243.5 nm, 1646.0nm, 2133.5 nm, 2164.2 nm, 2207.8 nm, 2262.9 nm, 2332.2 nm, and 2402.9 nm. The selected angles are 12°, 15°, 20°, 25°, 30°, 35°, 40°, 45°, 50°, 55°, 60°, 65°, 70°, and 75° for short wave infrared (SWIR) channels and additional 80° and 85° for visible near-infrared (VNIR) channels. BRF is linearly interpolated for the rest of the wavelengths, 350–2500 nm, and angles 0° to 75°. Figure 2 shows that the BRF can be occasionally greater than 1 and is possible, as it only means that the reflected signal is larger than that from a Lambertian diffuser for that same illumination/view geometry, while the integrated total flux from the diffuser would be less than that from the perfect, lossless, Lambertian diffuser. The measurements for generating these BRFs are carried out using a relative method where the standard is a Spectralon panel that has been calibrated at the National Institute of Standards and Technology. The panel to be measured is affixed to the goniometer and measured in a single plane, with the radiometer viewing the panel at a zero-degree zenith angle. The illumination angle is varied over a range of angles. This is fundamentally important because the white reference panels are the basis for converting spectrometer radiance or digital number measurements to surface reflectance values [18].
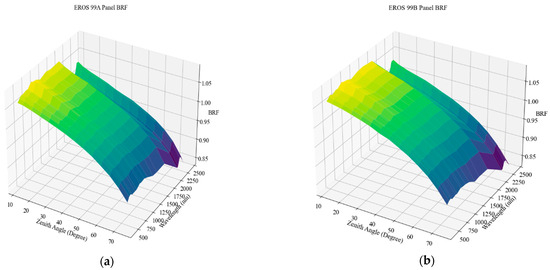
Figure 2.
Bidirectional reflectance factor (BRF) of (a) 99A calibration panel and (b) 99B calibration panel. Lighter and dark shade of green represent higher and lower value of BRF respectively.
The calibration panels selected for the field campaigns were 99% reflective. The panel used by the MU designated ‘99A panel’ was composed of the same material, Spectralon, and manufactured by the same company, Labsphere [19], as the panel used by the FBU-designated ‘99B panel’. Only one calibration panel is needed for calculating surface reflectance using the dual- or single-spectrometer approach. However, this study used two calibration panels to independently compare the surface reflectance computed using two approaches. The ‘99B panel’ was dedicated to calculating surface reflectance using the dual approach, whereas the ‘99A panel’ was used for the single-spectrometer approach. The panels are identical to each other and have very similar BRFs, as shown in Figure 2. However, their BRF discrepancy varies from 0.5% to 2% depending on different zenith angles and wavelengths. The discrepancy is within 0.5% for zenith angles less than 50⁰, and it could increase up to 2% for higher zenith angles.
2.3. Data Collection Methodology
Figure 3 shows a schematic diagram of the field data collection methodology for the single- and dual-spectrometer approaches. The outer black solid rectangular box represents dual-spectrometer approach data collection methodology. Inner dashed light gray rectangular box represents single-spectrometer approach data collection methodology. The procedure below was followed in the field:
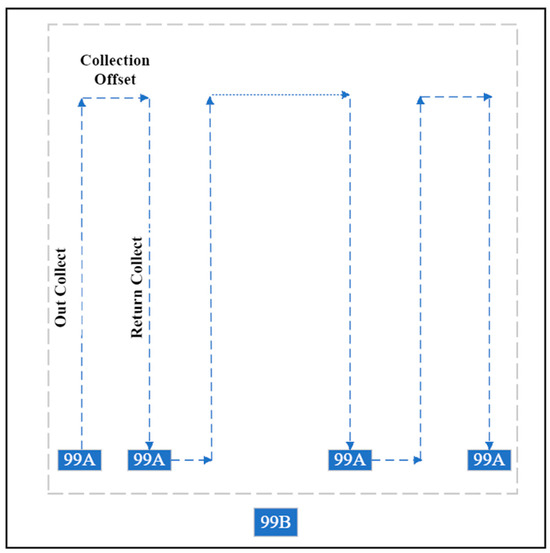
Figure 3.
Schematic diagram of data collection methodology for the single- and dual-spectrometer approaches. The labels 99A and 99B stand for 99A and 99B calibration panels, respectively. Outer black solid rectangular box represents the dual-spectrometer data collection methodology. Inner dashed gray rectangular box represents the single-spectrometer data collection methodology. ‘Out Collect’ is the path the researcher walks away from the calibration panel, and ‘Return Collect’ is the path the researcher walks towards the reference panel. ‘Collection Offset’ is the distance between Out and Return Collect, typically determined by the spatial resolution of satellite sensor.
- Spectrometer thermal stability was achieved prior to field collection by turning on the MU and FBU 10 min before making measurements;
- Both spectrometers were optimized to reset sensor gain and bias based on the illumination condition prior to data acquisition. The sensor head was carefully arranged in a way that it observes the panel at the nadir from ~15 cm above the panel and does not cast a shadow within the FOV of the spectrometer. The spectrometer operator wore dark clothes to mitigate secondary reflection while measuring the panel. Panel edge labeled as ‘Sun’ faces the Sun to account for solar azimuth angle;
- The first field measurement was the 99B panel with the FBU. The FBU continuously measures the 99B calibration panel throughout the field collection;
- The 99B calibration panel was measured with the MU, providing 10 spectra, while making sure this measurement ensures that FBU is already measuring 99B panel;
- The 99A calibration panel was measured by the MU, producing 10 spectra. The reference calibration panel is sampled approximately every 5 min;
- Ground Target was measured by walking the Out Collect and Return Collect, as shown in Figure 3 (approximately 120 spectra of the region of interest (ROI) are acquired by the MU). The number of spectra depends on the ROI size;
- The 99A calibration panel was re-measured by the MU;
- Steps 5–7 were repeated until the ROI selected for Ground Target Satellite Validation was measured;
- Upon completion of the ROI measurement, the 99B calibration panel was re-measured by the MU.
2.4. Single-Spectrometer Data Processing Methodology
The single-spectrometer approach uses only MU data to calculate surface reflectance. The MU measures the 99A calibration panel first, which helps to optimize its calibration. Following the measurements of the calibration panel, the researcher walks along the Out Collect path and Return Collect path at a constant rate of speed, taking measurements at a constant rate, bracketing the ground measurements with measurements of the 99A calibration panel before going to the next Out Collect path, as shown in Figure 3. During the field collection, the researcher carries the MU in a backpack and carefully holds the fore-optic at 1.5 m above the ground, as shown in Figure 1b. The combination of 8° fore-optics raised to a height of 1.5 m above the ground creates a circular surface sample of approximately 0.2 m in diameter. This process is repeated until the entire ROI is sampled, ending with a measurement of the 99A calibration panel [8]. During the Big MAC, the number of measurements was 120, whereas 540 target spectra were collected during the Guymon and Coconino National Forest field campaigns because the ROI size of the underfly sites was much larger than the Big MAC site.
Target surface reflectance using the single-spectrometer approach is calculated by taking the ratio of radiances from the target and 99A calibration panel and multiplying the ratio by the panel correction factor (BRF), as shown in Equation (1). The MU samples the 99A calibration panel once in ~5 min, so the panel radiance at the time of target measurement is linearly interpolated using two consecutive 99A calibration panel measurements. The panel correction factor is a panel calibration coefficient determined based on solar zenith angle during field measurement. Once each spectrum is converted to reflectance, all target spectra are averaged together to calculate a representative surface reflectance of the entire target.
where is target reflectance, is the upwelling radiance from the target, is calibration panel upwelling radiance, and is panel reflectance calibration coefficient (BRF) at solar zenith angle (θ).
2.5. Dual-Spectrometer Data Processing Methodology
The dual-spectrometer data processing methodology is shown in Figure 4. The methodology is briefly described in the following subsections.

Figure 4.
Flow chart of dual-spectrometer data processing methodology that includes the mobile unit (MU) and fixed-based unit (FBU).
2.5.1. Initial Calibration between MU and FBU
The MU and FBU were calibrated using coincident measurements of the 99B calibration panel, as shown in Figure 5. The red dots represent the MU 99B calibration panel radiance measurements at 865 nm. The blue curve represents the FBU radiance measurements at the same wavelength continuously throughout the field collection. Time on the figure is expressed in UTC seconds. The panel radiance measurements are corrected for the Bidirectional Reflection Distribution Function (BRDF) by dividing the panel radiance by their corresponding BRF factor. Coincident measurement of the 99B calibration panel occurred at the beginning and at the end of the field collection. The coincident measurement of the 99B calibration panel allows for transferring the panel calibration to the FBU and the MU. Either one of the coincident measurements is enough for implementing the dual-spectrometer approach. Typically, the first coincident measurement is used for implementing the dual-spectrometer approach, and second coincident measurement is used as a cross-check for consistency between the MU and FBU measurements.
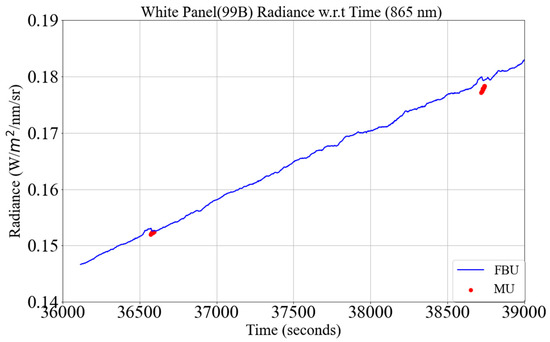
Figure 5.
Coincident measurement of 99B calibration panel using the mobile unit (MU) and fixed-based unit (FBU). The red symbols represent MU 99B panel measurements, and the blue curve represents FBU 99B panel measurements (30 August 2021 (10:00 AM) at SDSU Research Park, Brookings, South Dakota).
Figure 6a shows the MU and FBU coincident panel radiance measurements and panel reflectance. The black curve represents the reflectance of the 99B calibration panel, and the light gray error bar is uncertainty associated with panel calibration. The uncertainty is based on the uncertainty in the reference, stability, and accuracy of the source, radiometers, amplifiers, and other factors. The uncertainty is estimated at 400 nm, 650 nm, 1380 nm, 1646 nm, and 2332 nm. Uncertainty at the rest of the wavelengths is estimated using linear interpolation. The uncertainty varies with wavelength, with the longest wavelengths having larger uncertainties but are well within 2% across the entire spectral range. The red curve represents the MU 99B calibration panel radiance measurement, and the blue curve represents the FBU radiance measurement of the same calibration panel. At the beginning of the field collection, panel calibration is transferred to the MU and FBU by taking a ratio of the 99B panel reflectance and upwelling radiance measured by the MU and the FBU, as shown in Equation (2) for the MU and Equation (3) for the FBU. This ratio is called the reflectance calibration gain. In Figure 6b, the red curve represents the MU initial reflectance calibration gain, and the blue curve represents the FBU initial reflectance calibration gain. The reflectance calibration gain ranges from 4 to 210 at transmission wavelengths and is identical for both the MU and FBU. All the analysis in this paper is based on radiance measurement; however, a digital number can be used instead of the radiance if the spectrometer response is linear.
where is the 99B panel reflectance corrected for BRF and ), and ) are the reflectance panel radiance measurements using the MU and FBU, respectively, during first coincident panel measurement.
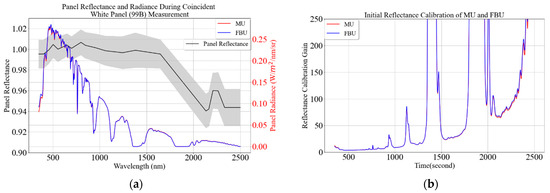
Figure 6.
Mobile unit (MU) and fixed-based unit (FBU) 99B calibration panel radiance measurement (a). The red curve represents MU radiance measurement, the blue curve represents FBU radiance measurement, the black curve represents panel reflectance, and the gray error bar represents uncertainty associated with the panel reflectance. Initial reflectance calibration of the MU and FBU (b). The red curve and blue curve represent the MU and FBU initial reflectance calibration gain, respectively (30 August 2021 (10:00 AM) at SDSU Research Park, Brookings, South Dakota).
2.5.2. Updating MU Reflectance Calibration
Initial reflectance calibration gain is valid for only a short period of time because downwelling radiance is continuously changing with time; therefore, the reflectance calibration gain must be updated continuously as a function of time. MU reflectance calibration gain at any time is calculated by taking the ratio of panel reflectance and MU radiance at a specific time, as shown in Equation (4).
where ) is MU reflectance calibration gain at any time during field measurement, is FBU 99B panel radiance as a function of time during field collection, and the and terms are from the first coincident radiance measurement of the 99B calibration panel using the FBU and MU, respectively.
The fundamental basis of the dual-spectrometer approach is to have the FBU dedicated to tracking the change in downwelling irradiance while the MU measures the target. Because the change in downwelling radiation is the same for both the MU and FBU, the relative change in the ratio of FBU radiance measurement (the ratio of FBU radiance at any specific time to the radiance at the initial time) is used to update the MU radiance throughout the field collection.
Figure 7 shows the change in the MU reflectance calibration gain as a function of time. Curves of different colors symbolize the center wavelengths of the coastal, blue, green, red, and near-infrared (NIR) bands of the Landsat 8 Operational Land Imager (OLI). These curves demonstrate the change in MU reflectance calibration gain as a function of time. The SWIR channels are not included in the figure due to scaling issues but show similar behavior as VNIR wavelengths. Reflectance calibration gains for all the wavelengths are decreasing as a function of time. The data acquisition was initiated at 10:00 AM local time, so the downwelling irradiance was increasing monotonically during the field measurement, as shown in Figure 5. Since the panel reflectance is always the same, 99% reflective, the reflectance calibration gain should decrease to compensate for the increasing downwelling irradiance, as shown in Equation (3). Therefore, the updated reflectance calibration gain is used to calculate the reflectance of the target measured by the MU at any specific time.
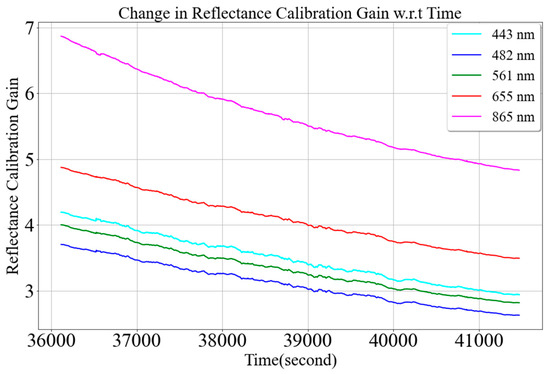
Figure 7.
Change in mobile unit (MU) reflectance calibration gains as a function of time (30 August 2021 (10:00 AM) at SDSU Research Park, Brookings, South Dakota).
2.5.3. Target Reflectance
The MU and FBU measurements have time discrepancy of a few seconds even though both spectrometers are taking measurements of the target and the panel simultaneously. The updated calibration gain is interpolated to calculate the gain corresponding to the MU time stamp. The reflectance of a target was calculated by multiplying MU radiance with the corresponding reflectance calibration gain at the same time stamp, as shown in Equation (5).
where is the target reflectance measured by the MU at any time t during field measurement, ) is the MU reflectance calibration gain at any time during field measurement, and is the corresponding MU radiance measurement of target.
3. Results
This section presents a surface reflectance comparison using the single- and dual-spectrometer approaches. Results from the BigMAC and Landsat 8/9 underfly field campaigns are presented in Section 3.1 and Section 3.2, respectively.
3.1. BigMAC Field Campaign
The BigMAC field campaign data were collected at the SDSU Research Park on Monday, 30 August 2021, and Tuesday, 31 August 2021. Data were collected three times each day: 10:00 AM, 12:00 PM, and 2:00 PM local time. However, data from only 10:00 AM on 30 August and 2:00 PM on 31 August are presented to demonstrate the results from two different atmospheric conditions. The 10:00 AM collection has an optimal atmospheric condition, and the 2:00 PM collection has a sub-optimal atmospheric condition. For this study, the optimal atmospheric condition represents a cloud-free atmosphere, and sub-optimal atmospheric conditions have some clouds, but they are not in the Sun-target-sensor path. Sky conditions during both acquisitions are shown in Figure 8.
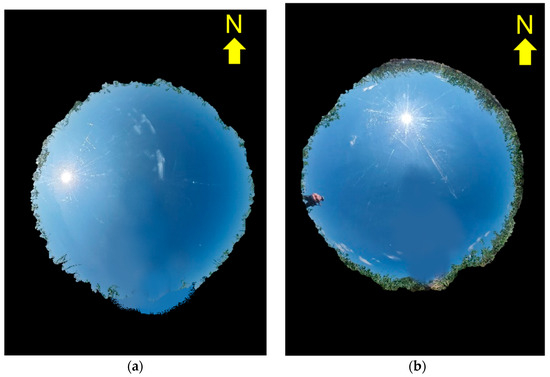
Figure 8.
All sky photos during (a) 10:00 AM, 30 August 2021, data acquisition, and (b) 2:00 PM, 31 August 2021, data acquisition.
3.1.1. Results from 30 August 2021
The surface reflectance of the target using the single- and dual-spectrometer approaches during the optimal atmospheric conditions is similar, as shown in Figure 9. Figure 9a,b show the individual reflectance spectrum of the target using the single- and dual-spectrometer approaches. These are typical spectra for vegetative surface types under optimal atmospheric conditions. The variation in the individual spectrum represents an intrinsic spatial variation of the site, which is similar for both approaches. The spatial variation is wavelength-dependent and has the maximum variation, ranging from ~0.25 to ~0.45, in the NIR spectral region.
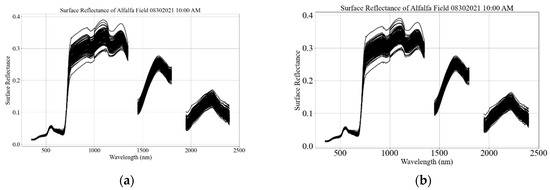
Figure 9.
Individual reflectance spectrum of vegetative target using a single (a) and dual spectrometer (b) (30 August 2021 (10:00 AM) at SDSU Research Park, Brookings, South Dakota).
Figure 10 shows a representative target spectral profile using the single- and dual-spectrometer approaches. Black and dashed blue curves represent the mean spectral profile using the single- and dual-spectrometer approaches. The gray and shaded blue regions represent the corresponding 1-sigma error bar, which is the standard deviation of the individual spectrum. Surface reflectance profiles from both approaches are on top of each other up to 1800 nm but have some discrepancy for the wavelengths greater than 1950 nm. Further research is needed to understand the observed discrepancy at the longer wavelengths.
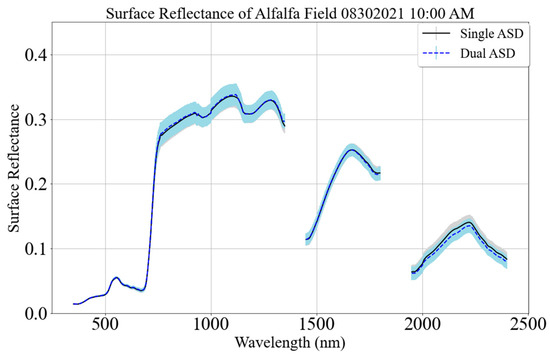
Figure 10.
A representative target spectral profile using the single- and dual-spectrometer approaches. The black curve represents the mean spectral profile, and the gray region represents the 1-sigma error bar using the single-spectrometer approach. The blue dashed curve represents the mean spectral profile, and the light blue shaded region represents the 1-sigma error bar using the dual-spectrometer approach (30 August 2021 (10:00 AM), SDSU Research Park, South Dakota).
3.1.2. Results from 31 August 2021
This subsection presents the scenario where an atmospheric condition was optimal for most of the field campaign; however, clouds passed in front of the Sun momentarily during the field campaign. It highlights one of the strengths of the dual-spectrometer approach: to identify spectra corresponding to cloud overpass and eliminate them from further analysis. Figure 11a shows the individual target spectrum using the single-spectrometer approach. Unlike in previous field measurements, a few individual spectra have lower reflectance than most spectra. Most spectra represent the green vegetative surface type; however, the spectrum having lower reflectance is a result of shadow [20].
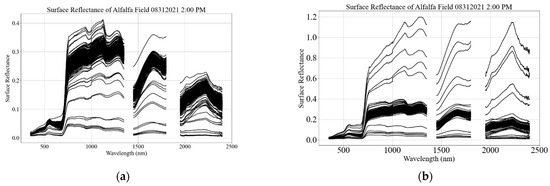
Figure 11.
Individual reflectance spectrum using the single (a) and dual spectrometer (b) (31 August 2021 (02:00 PM) at SDSU Research Park, Brookings, South Dakota).
Figure 11b also shows the spectrum estimated using the dual-spectrometer approach. Unlike Figure 11a, it has five spectra with higher reflectance than most spectra. During this field campaign, clouds passed momentarily between the Sun and the target, causing a sudden decrease in downwelling irradiance. MU reflectance calibration gain spikes to compensate for the decrease in downwelling irradiance. The higher MU reflectance calibration gain results in the surface reflectance of the target being more than 1. These spectra having reflectance greater than 1 are removed from further analysis in this section; however, this kind of scenario is discussed in detail in the discussion section. Figure 12 shows all the spectra from the dual-spectrometer approach after removing highly reflective target spectra. The spectra in Figure 11a and Figure 12 are similar except for the spectra corresponding to the cloud overpass. The dual-spectrometer approach can successfully identify and eliminate the spectra during cloud overpasses. However, the single-spectrometer approach cannot identify the spectra corresponding to the cloud overpass and considers them as intrinsic variability of the site. The spectra during cloud overpass are discarded instead of correcting them, as correcting the spectra would increase the uncertainty of the surface reflectance.
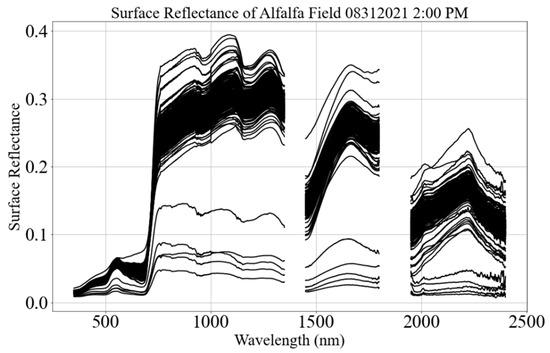
Figure 12.
Individual reflectance spectrum using the dual-spectrometer approach after excluding spectra corresponding to cloud overpass on 31 August 2021 (2:00 PM) at SDSU Research Park, Brookings, South Dakota.
Figure 13 compares the precision of target reflectance using the single- and dual-spectrometer approaches. It shows that the target spectral profile using the dual-spectrometer approach has better precision than the profile estimate using the single-spectrometer approach. The light blue shaded region is narrower than the gray shaded region in Figure 13. The target profile estimated using the dual spectrometer has more precision (lower error bar) as it identified the corrupt spectra due to the cloud overpass and removed them while calculating target reflectance. The mean target spectral profiles from both approaches are the same for the wavelengths up to 1800 nm and differ for the wavelengths more than 1950 nm, as in Figure 10.
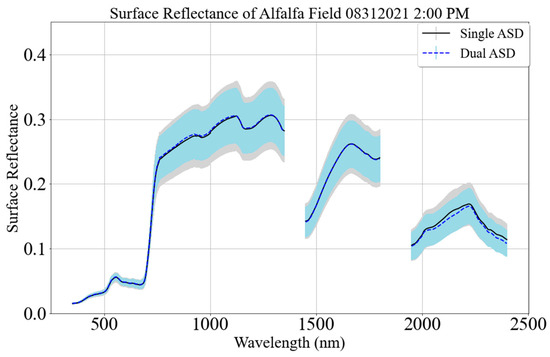
Figure 13.
A representative target spectral profile using single- and dual-spectrometer approaches. The black curve represents the mean spectral profile, and the gray region represents the 1-sigma error bar using the single-spectrometer approach. The blue dashed curve represents the mean spectral profile, and the light blue shaded region represents the 1-sigma error bar using the dual-spectrometer approach (31 August 2021 (02:00 PM) at SDSU Research Park, Brookings, South Dakota).
3.2. Landsat 8 and 9 Underfly Field Campaign
Field campaigns at Guymon and Coconino National Forest were conducted on 14 and 15 November 2021, respectively, as a part of the Landsat 8/9 underfly field campaign. Results from these field campaigns are presented below.
3.2.1. Guymon
The benefits of the dual-spectrometer approach can best be demonstrated using the Guymon, Oklahoma, underfly acquisition from 14 November 2021. The atmospheric conditions were sub-optimal, as shown in Figure 14, but the scientific opportunity was critical as this was a once-in-a-lifetime opportunity for the Landsat 9 mission; therefore, the acquisition of the target was of the highest priority. By ensuring continuous monitoring of downwelling solar irradiance during the target measurement, the variation of the target reflectance was reduced substantially, as is demonstrated in both Figure 15 and Figure 16. In Figure 15a, surface reflectance was calculated using the single-spectrometer approach. This is immediately compared with Figure 15b, where surface reflectance was calculated using the dual-spectrometer approach. The individual spectra calculated using the single-spectrometer approach exhibit a much broader range of variation than the corresponding spectra calculated using the dual-spectrometer approach. Surface reflectance at 1000 nm using the single-spectrometer method ranges from 0.10 to 0.50 reflectance units, whereas using the dual-spectrometer approach, surface reflectance only ranges from 0.20 to 0.38 reflectance units.

Figure 14.
Panorama view of sky condition during data collection in Guymon, Oklahoma.
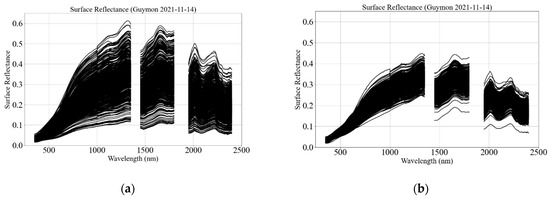
Figure 15.
Individual reflectance spectrum using the single (a) and dual spectrometer (b) (14 November 2021 (10:58 AM) in Guymon, Oklahoma).
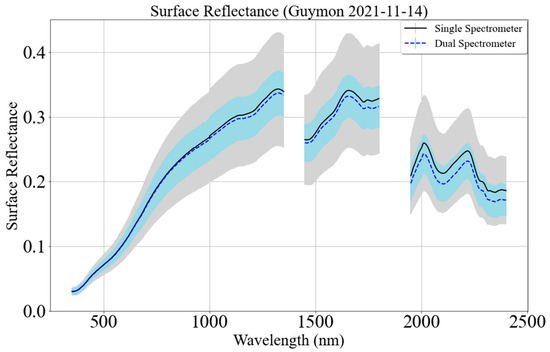
Figure 16.
A representative target spectral profile using the single- and dual-spectrometer approaches. The black curve represents the mean spectral profile, and the gray region represents the 1-sigma error bar using a single-spectrometer approach. The blue dashed curve represents the mean spectral profile, and the light blue shaded region represents the 1-sigma error bar using the dual-spectrometer approach (14 November 2021 (10:58 AM) in Guymon, Oklahoma).
Figure 16 demonstrates the benefit of the dual approach. Blue and black curves show the mean surface reflectance profile using the dual- and single-spectrometer approaches, respectively. Light blue and gray shaded areas are attributed to the variation of the surface reflectance profile measured using the single- and dual-spectrometer approaches, respectively. These results show that surface reflectance estimated using the dual-spectrometer has half the variation as the single-spectrometer approach.
3.2.2. Coconino
Optimal atmospheric conditions (Figure 17) result in a substantially reduced difference between the single- and dual-spectrometer approaches. This is the case presented for the underfly acquisition in Coconino National Forest in Arizona on 15 November 2021, as seen in Figure 17 and Figure 18. Figure 18 shows that individual spectra from the two approaches almost look identical to each other. Figure 19 exhibits the variation of mean surface reflectance associated with the single-spectrometer approach in the gray-shaded area. The light blue shaded area represents the variation associated with the dual-spectrometer approach. The mean surface reflectance profiles from the two approaches show good agreement for the wavelengths less than 1000 nm, and afterward, there is noticeable disagreement between the two spectral profiles. However, the variation of the spectral profile is similar in both approaches.

Figure 17.
Panorama view of sky condition during data collection in Coconino National Forest, Arizona.
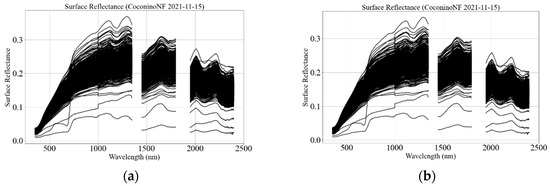
Figure 18.
Individual reflectance spectrum using the single (a) and dual spectrometer (b) (15 November 2021 (10:42 AM), Coconino National Forest, Arizona).
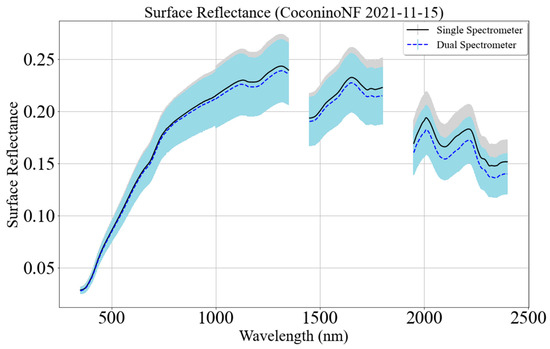
Figure 19.
A representative target spectral profile using the single- and dual-spectrometer approaches. The black curve represents the mean spectral profile, and the gray region represents the 1-sigma error bar using a single-spectrometer approach. The blue dashed curve represents the mean spectral profile, and the light blue shaded region represents the 1-sigma error bar using the dual-spectrometer approach (15 November 2021 (10:42 AM) in Coconino National Forest, Arizona).
4. Discussion
Based on the results presented in Section 3, this section discusses a comparison between the surface reflectance estimated using the dual- and single-spectrometer approaches in two scenarios: (1) a clear sky where improvement using the dual-spectrometer approach over the single-spectrometer approach is minimal and one in which (2) the sky changes rapidly where the dual-spectrometer approach estimated the surface reflectance more precisely than the single-spectrometer approach. This section also discusses the condition when the dual system could not compensate for atmospheric changes correctly.
The surface reflectance of a target using the single- and dual-spectrometer approaches is very similar during clear days when atmospheric transmittance is the same during target measurement. Figure 20 shows downwelling irradiance measured by the MU and FBU, represented by the red symbols and blue curve, respectively, at Coconino National Forest in Arizona on 15 November 2021 (10:42 AM). Green symbols represent predicted downwelling irradiance calculated by linearly interpolating MU’s consecutive downwelling irradiance measurements using a 99A calibration panel. Downwelling irradiance measured by MU and FBU and the predicted irradiance are similar during clear sky conditions. Even on such a ‘perfect’ day where the atmospheric condition is optimal, there is noticeable variability tracked by the FBU that the MU cannot measure. The unique ability of the dual-spectrometer approach to continuously track atmospheric changes and utilize it for estimating the surface reflectance improved the precision of the target surface reflectance compared to the single-spectrometer approach. The bias is noticeable between the downwelling solar irradiance measured by the MU and FBU. This bias is attributed to discrepancies in the BRFs of two panels, spectrometers, and data collection procedures. This leads to a discrepancy in the mean surface reflectance of the target, as shown in Figure 16 and Figure 19; however, it does not impact the precision of the surface reflectance of the target.
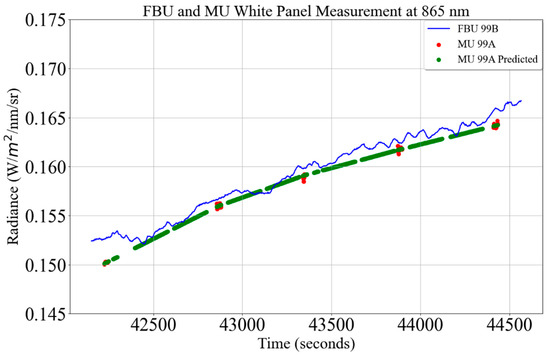
Figure 20.
Fixed-based unit (FBU) and mobile unit (MU) white panel measurements at 865 nm. The blue curve represents the FBU measurement of the 99B calibration panel. Red symbols represent the MU measurement of the 99A calibration panel, and green symbols represent the predicted MU measurement of the 99A panel (15 November 2021 (10:42 AM) in Coconino National Forest, Arizona).
Figure 21 shows the change in MU reflectance calibration gain as a function of time using the dual approach. Only visible and near-infrared regions are shown in the figure due to scaling issues. MU reflectance calibration gain decreases linearly as a function of time, as shown in Figure 21, as downwelling irradiance increases linearly temporally. The dual approach uses the simultaneous measurement of the calibration panel to track changes in the atmosphere continuously and use them to update the reflectance calibration of the mobile unit continuously during the time it was collecting upwelling radiance from the target. However, a single approach uses periodic sampling of the calibration panel to obtain reflectance calibration gain. Figure 22 compares the MU reflectance calibration gain of the 865 nm channel calculated using the single and dual approaches, as shown by blue and magenta curves, respectively. Both approaches show reflectance calibration gain decreases from approximately 6.5 to 6.0 from the start to the end of the target measurement. The calibration gain obtained from the dual-spectrometer approach captures the subtle variation of atmospheric transmittance changes, but the gain from the single-spectrometer approach could not capture the variation. The bias in the reflectance calibration curves is due to the discrepancy in BRFs of two panels, spectrometers, and data collection procedure and ranges up to 1.5%, as shown by the green curve in Figure 22.
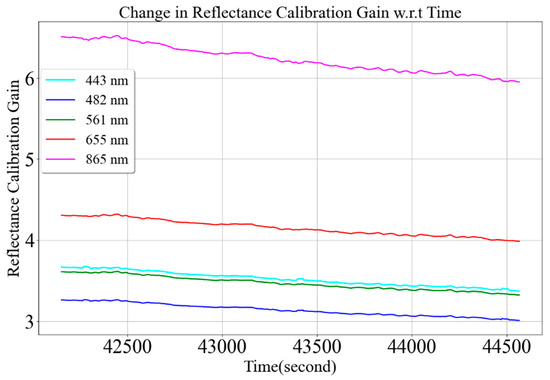
Figure 21.
Change in mobile unit (MU) reflectance calibration gains as a function of time (15 November 2021 (10:42 AM), Coconino National Forest, Arizona).
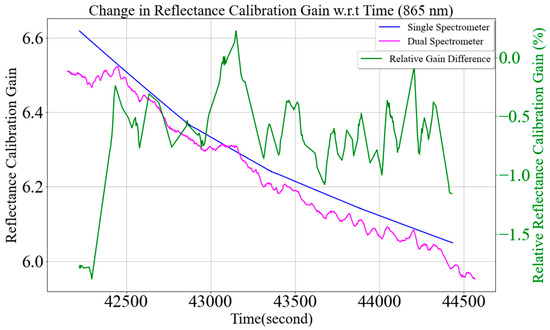
Figure 22.
Comparison of mobile unit (MU) reflectance calibration change using the single- and dual-spectrometer approaches at 865 nm. (15 November 2021 (10:42 AM), Coconino National Forest (CNF), Arizona).
Figure 23 compares surface reflectance at 865 nm from the single- and dual-spectrometer approaches. The blue and magenta symbols represent surface reflectance from the single- and dual-spectrometer approaches. Surface reflectance and its variation from both approaches are similar due to minimal changes in atmospheric transmittance as downwelling irradiance (shown by the green curve in Figure 23) changes reasonably linearly with small fluctuations during target measurement. However, surface reflectance from the single approach is overestimated as MU reflectance calibration gain is overestimated by 1–2% for the majority of spectral regions due to the bias between two independent calibration methods, as shown in Figure 24. Further research is being carried out to understand the source of the bias and mitigate it. Figure 25 shows surface reflectance comparison using the single- and dual-spectrometer approaches. It shows an improvement in the precision of surface reflectance using the dual-spectrometer approach, even during optimal atmospheric conditions. The black and blue curves represent the standard deviation of the target surface reflectance using the single- and dual-spectrometer approaches, respectively. The target surface reflectance precision improved by 2% across the majority of spectral regions and more than 6% beyond 1950 nm, as shown by the red curve in Figure 25.
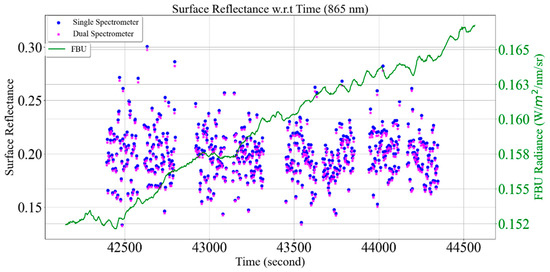
Figure 23.
Comparison of target surface reflectance using the single- and dual-spectrometer approaches (15 November 2021 (10:42 AM), Coconino National Forest (CNF), Arizona). The blue and magenta symbols represent surface reflectance from the single- and dual-spectrometer approaches, respectively. The green curve represents downwelling solar irradiance measured by the fixed-based unit (FBU) at 865 nm.
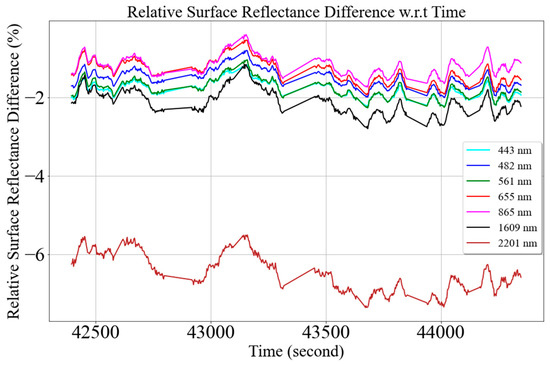
Figure 24.
Relative surface reflectance difference between the single- and dual-spectrometer approaches.
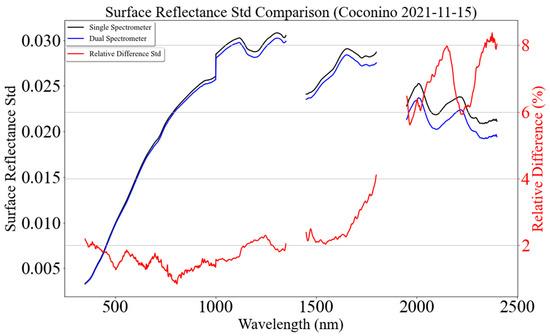
Figure 25.
Surface reflectance standard deviation (std) comparison between the single- and dual-spectrometer approaches. Surface reflectance std using the single spectrometer as a reference for calculating relative difference (15 November 2021 at Coconino National Forest, Arizona).
Figure 26 shows downwelling radiance measurements when atmospheric transmittance changes rapidly during target measurements. The blue curve and red symbols show downwelling irradiance measured by the FBU and MU. Similarly, the green symbols represent downwelling irradiance predicted using the MU periodic sampling of the 99A calibration panel. As atmospheric transmittance changes rapidly, predicted downwelling irradiance is not sufficient to estimate downwelling irradiance properly. Predicted downwelling irradiance either underestimates or overestimates the real measurement, as shown in Figure 26. Predicted downwelling irradiance is underestimated at approximately 40,100 s; downwelling radiance is predicted as ~0.12 radiance units, whereas actual downwelling irradiance measurement is ~0.17 radiance units. Similarly, the predicted downwelling irradiance is overestimated at approximately 40,600 s; downwelling irradiance is predicted as ~0.145 radiance units, whereas the real measurement is less than ~0.08 radiance units. These discrepancies result in a large difference between the surface reflectance precision estimated using the two approaches.
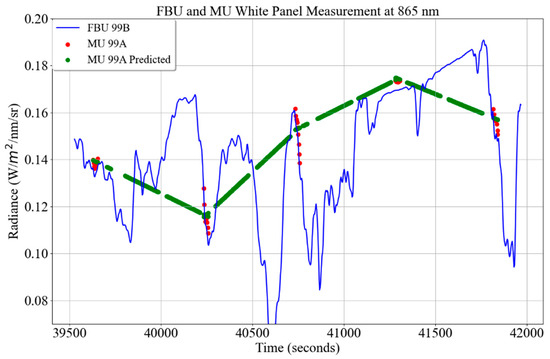
Figure 26.
Fixed-based unit (FBU) and mobile unit (MU) white panel measurements at Guymon, Oklahoma, at 865 nm. The blue curve represents the FBU measurement of the 99B panel. The red symbols represent the MU measurements of the 99A panel, and the green symbols represent the predicted radiance of the 99A panel using two consecutive MU measurements of the panel.
Figure 27 shows MU reflectance calibration gain change using the dual-spectrometer approach during target measurement, and different colors correspond to different wavelengths from the VNIR spectral region. The MU reflectance calibration gains across all the wavelength changes rapidly due to atmospheric transmittance fluctuation during target measurements.
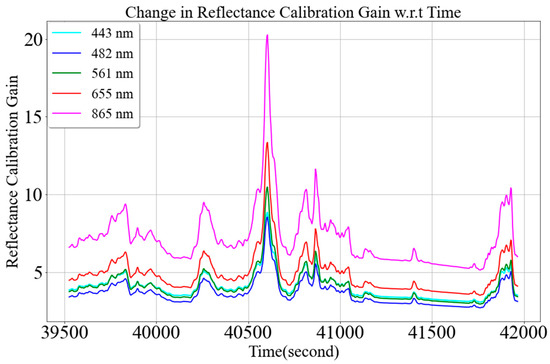
Figure 27.
Change in MU reflectance calibration gains as a function of time (14 November 2021 in Guymon, Oklahoma).
Figure 28 compares the MU calibration gain for 865 nm using the two approaches. The blue and magenta curves represent MU reflectance gain using the single- and dual-spectrometer approaches, respectively. Even though the MU reflectance calibration gain using the dual-spectrometer approach fluctuates, the calibration gain using the single-spectrometer approach does not change as this approach uses predicted downwelling irradiance calculated from periodic sampling from the 99A calibration panel. The MU reflectance gain using the dual spectrometer ranges from 5 to 20, but the gain ranges from only 6 to 9 using the single-spectrometer approach, as shown in Figure 28. Such discrepancy in the MU reflectance calibration gain is due to either underestimation or overestimation of downwelling solar irradiance from the single-spectrometer approach.
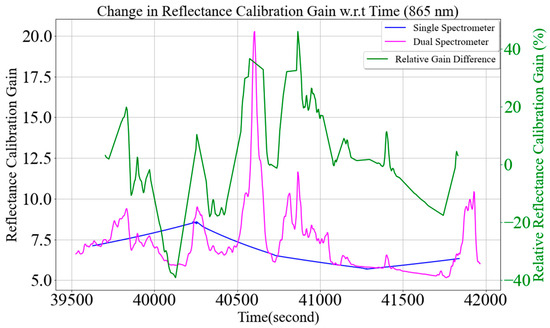
Figure 28.
Comparison of mobile unit (MU) reflectance calibration changes at 865 nm using single- and dual-spectrometer approaches.
MU reflectance calibration gain from the two approaches only agrees briefly at approximately 41,300 s when predicted, and actual downwelling irradiance is close to each other, as shown in Figure 28. The gain from these approaches differs up to 40% at approximately 40,100 and 40,900 s, as shown by the green curve in Figure 28. This amount of discrepancy in MU reflectance calibration gain using the single-spectrometer approach is due to a lack of simultaneous panel and target measurements.
Discrepancy in the MU reflectance calibration gain results in different surface reflectance of the target, as shown in Figure 29. The surface reflectance of the target from single and dual approaches is represented by blue and magenta symbols, whereas the green curve represents the FBU radiance measurements. During higher atmospheric transmittance, at approximately 40,100 s, the MU reflectance calibration gain using the single-spectrometer approach is overestimated compared to the dual-spectrometer approach, as shown in Figure 28. As a result, the average surface reflectance of the target at 865 nm using the single-spectrometer approach is overestimated as ~0.35, whereas from the dual-spectrometer approach, it is estimated as ~0.25. During lower atmospheric transmittance, at approximately 40,550 s, the MU reflectance calibration gain using the single-spectrometer approach is underestimated compared to the dual-spectrometer approach, as shown in Figure 28. As a result, the average surface reflectance of the target from the single-spectrometer approach is underestimated as ~0.15, whereas it is estimated as ~0.25 using the dual-spectrometer approach. A similar analysis has been presented for coastal sites, and the result shows that under sub-optimal sky conditions, the reflectance of sand measured using the single-spectrometer approach underestimates the true reflectance by as much as 20% [21].
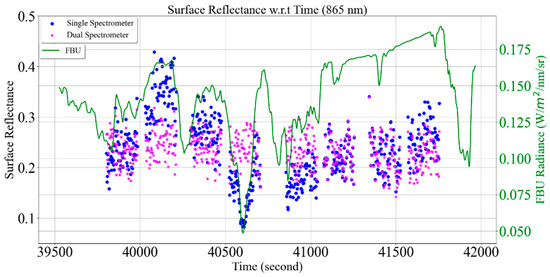
Figure 29.
Comparing target surface reflectance using single- and dual-spectrometer approaches at 865 nm. Blue and magenta symbols represent surface reflectance from single- and dual-spectrometer approaches, respectively. The green curve represents downwelling solar irradiance measured by the fixed-based unit (FBU).
Figure 30 shows a substantial improvement in the precision of surface reflectance using the dual-spectrometer approach during non-optimal atmospheric conditions. The black and blue curves represent the standard deviation of the target surface reflectance using the single- and dual-spectrometer approaches, respectively. The target surface reflectance precision improved by at least 50% across most spectral regions, as shown by the red curve in Figure 30. The surface reflectance of the target using the dual-spectrometer approach is more precise than the single-spectrometer approach. The dual-spectrometer approach continuously tracks changes in atmospheric transmittance and adjusts MU reflectance calibration gain. This adjusted MU reflectance gain helps to calculate the surface reflectance of a target more precisely by taking account of changes in atmospheric transmittance continuously. In contrast, the single-spectrometer approach assumes that the atmosphere is changing linearly and underestimates or overestimates MU reflectance calibration gain as a result of underestimation or overestimation of solar downwelling irradiance. As a result, the target surface reflectance estimate is either overestimated or underestimated, leading to less precision of target surface reflectance.
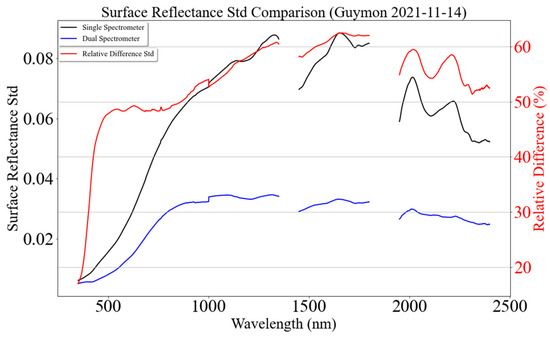
Figure 30.
Surface reflectance standard deviation (std) comparison between the single- and dual-spectrometer approaches. Surface reflectance std using the single spectrometer as a reference (14 November 2021 in Guymon, Oklahoma).
In the scenario shown in Figure 29, when there is both over-estimation and underestimation of surface reflectance, on average, surface reflectance estimates are about the same using both the single- and dual-spectrometer approaches. However, in a situation where there was a cloud in front of the Sun for a minute or two, that would result in only a decrease in downwelling irradiance, and the single approach would, therefore, have a substantial bias in it.
The dual-spectrometer approach calculates target reflectance more precisely than the single-spectrometer approach. However, the dual-spectrometer approach struggles to provide accurate surface reflectance of the target when there is a sharp change in atmospheric transmittance, as shown in Figure 31. The blue curve represents the FBU downwelling irradiance measurements, which dropped sharply at 51,065 seconds during the BigMAC field campaign (31 August, 2:00 PM CDT) at SDSU Research Park, Brookings, South Dakota. To compensate for the sudden decrease in downwelling irradiance, MU reflectance calibration gain spikes, as shown in Figure 32. Reflectance calibration gains for the wavelengths corresponding to visible near-infrared regions are only shown in Figure 32 due to scaling issues. The MU reflectance calibration gains for 443 nm, 482 nm, 561 nm, 655 nm, 865 nm, 1609 nm, and 2201 nm are 2.71, 2.43, 2.61, 3.25, 4.58, 19.57, and 56.77, respectively, during the optimal atmospheric condition as shown in Figure 32. However, during sharp changes in atmospheric transmittance (at 51,065 seconds), the calibration gain spikes to 6.61, 6.54, 8.19, 11.63, 19.07, 109.13, and 556.30, respectively, resulting in higher target surface reflectance than the rest of the spectra as shown in Figure 11b.
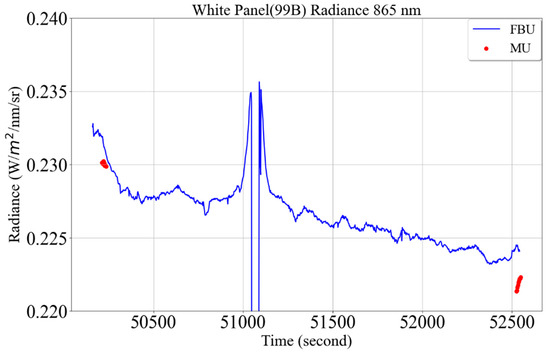
Figure 31.
Coincident measurement of 99B calibration panel using the mobile unit (MU) and fixed-based unit (FBU). Red symbols represent MU 99B panel measurements, and blue curves represent FBU 99B panel measurements (31 August 2021 (02:00 PM) at SDSU Research Park, Brookings, South Dakota).
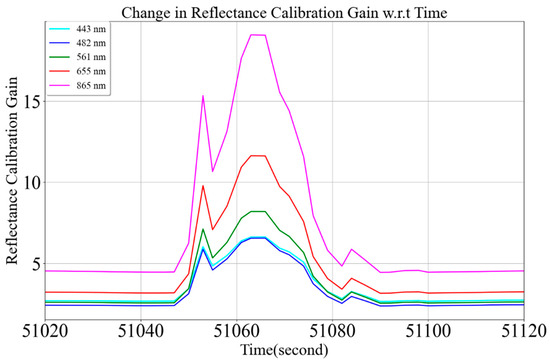
Figure 32.
Reflectance calibration gains change at sudden atmospheric change during field campaigns by wavelength (31 August 2021 (02:00 PM) at SDSU Research Park, Brookings, South Dakota).
Figure 33 shows a relative change in MU relative reflectance calibration gain. It is calculated by taking a ratio of reflectance calibration gain difference at any time with the initial reflectance calibration gain ((t))/. The relative reflectance calibration change is within 5% during the field campaign. However, during the sharp decrease in atmospheric transmittance, its value increases by 145%, 323%, and 903% for 443 nm, 865 nm, and 2201 nm, respectively. This large increase in reflective calibration overestimated target surface reflectance substantially more than the rest of the spectra, as shown in Figure 11b. The target surface reflectance for 865 nm is approximately 0.28; however, during sharp atmospheric transmittance changes, it is estimated to be 0.4 to 0.8, as shown in Figure 11b.
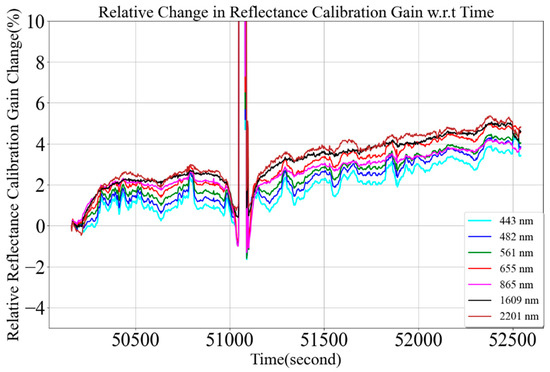
Figure 33.
Relative reflectance calibration gain changes during the field campaign by wavelength.
The dual-spectrometer approach has a limitation for correctly compensating MU reflectance calibration gain during sudden atmospheric changes. However, it correctly identifies the corrupt spectra and removes them from further analysis, which estimates target surface reflectance more precisely than the single-spectrometer approach.
One possible source of error in spectrometer measurement could be spectrometer dark current drift. Dark current is the current flowing through the detector when there is no incident flux upon the detector [22,23]. It is a systematic noise from the instrument electronics and detector and is primarily caused by thermal energy within the sensor. Dark current can be measured and subtracted from all measurements. It is measured by blocking the optics of the spectrometers so that zero illumination strikes the detector. The FieldSpec spectrometer has software for recording and automatically subtracting dark current from all its measurements.
Dark current is relatively constant within a short period of time; however, it changes temporally as internal components and external ambient temperature attempt to reach thermal equilibrium [14]. So, it is crucial to understand the dark current stability of both spectrometers as a typical field campaign for surface reflectance measurement takes ~30–40 min [3,8]. FBU and MU dark currents were recorded by blocking spectrometer optics by its cap for approximately an hour, equivalent to a typical field campaign time. Three sets of experiments were conducted to study dark current drift. Within each set of experiments, dark current was measured for approximately an hour when the spectrometers were exposed to the sunlight and kept in a shadow. The analysis for understanding dark current drift is similar for both spectrometers, so the detailed analysis for FBU (18,844) is only presented in this article. The mean dark current for FBU is shown in Figure 34a, along with the 1-sigma error bar. The green curve shows the mean dark current when the spectrometer was exposed to sunlight, and the blue curve represents the current when the spectrometer was kept in shadow. In both scenarios, three different levels of dark current were observed for three internal spectrometers. Each spectrometer has three internal spectrometers because of the different quantum efficiency of different detectors [14,24]. VNIR spectrometer (350–1000 nm) is made up of a silicon detector, and SWIR 1 (1000–1800 nm) and SWIR 2 (1800–2500 nm) spectrometers are made up of Indium Gallium Arsenide (InGaAs) detector [14]. The VNIR and SWIR 1 channels have the mean dark current of less than three digital numbers (DNs). The mean dark current for the VNIR channels is similar to the number reported by other researchers [22]. The mean dark current of the SWIR 2 channels ranges from 70 to 300. SWIR 2 channels are noisy in comparison to VNIR and SWIR 1 channels, as the dark current std for its channels is higher than for VNIR and SWIR 1 channels.
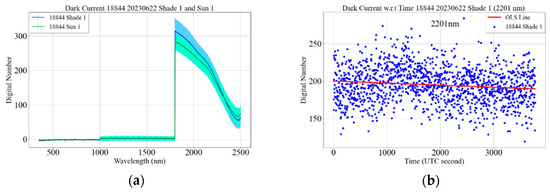
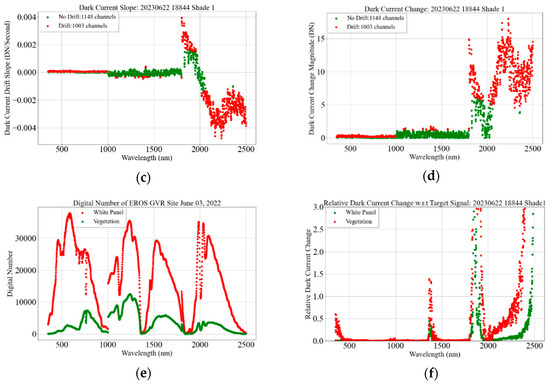
Figure 34.
(a) Mean dark current of FBU (18,844), the green curve represents the dark current when the spectrometer was exposed to sunlight, and the blue curve represents the dark current when the spectrometer was kept in shadow. (b) OLS line fitted to temporal dark current measurement. (c) Dark current drift of FBU spectral channels; red symbols represent the channels having statistically significant dark current drift, and green symbols represent the channels having statistically insignificant dark current drift. (d) Dark current changes magnitude within an hour. (e) Digital number of a 99% reflectance white reference panel (red symbols) and a typical vegetative target (green symbols). (f) Relative dark current change with respect to 99% white reference panel (red symbols) and a typical vegetative target (green symbols).
The dark current drift was calculated by fitting the ordinary least square (OLS) to the dark current measurements recorded for an hour, as shown in Figure 34b. Blue symbols represent temporal dark current measurements at 2201 nm, and the red line represents the fitted OLS line. The significance of the slope of the OLS line is tested using Student’s t-test statistics. A total of 1003 spectral channels of FBU show statistically significant drift, represented by red symbols in Figure 34c, whereas 1148 channels show statistically insignificant drift, represented by green symbols in Figure 34c. The spectral channels showing the statistically significant drift are different in different experiments. Among the channels showing statistically significant drift, maximum drift (~0.004 DN/s) was observed in the SWIR2 channels. The change in digital number due to dark current drift within an hour is shown in Figure 34d. The change is within 1 and 2 DN for VNIR and SWIR 1 channels, respectively. The change ranges from 1 to 19 DN for SWIR 2 channels.
The impact of dark current change in the measured signal is investigated by comparing the change in DN due to dark current drift with the target signal. Figure 34e shows the DN of the 99% reflective white panel and vegetation in red and green curves, respectively. Relative DN changes with respect to the calibration panel and vegetation signal are shown by red and green symbols, respectively, in Figure 34f. The impact of dark current change is less than 0.1% for the majority of VNIR and SWIR 1 spectral channels, whereas it is within 1% for SWIR 2 spectral channels as well.
Uncertainty due to dark current changes from all three sets of experiments is well within 0.1% for 350–1800 nm. It is within 0.5% for 1800–2500 nm; however, it is occasionally observed as high as 2.5%.
Sensitivity analysis at the intersection of the internal spectrometers was performed by tracking reflectance change at the intersections for a vegetative surface type. The sensitivity analysis at the VNIR and SWIR 1 intersection is presented in this article. The sensitivity analysis at the SWIR 1 and SWIR 2 intersection is also performed in a similar manner, but results are not presented. Figure 35a,b show vegetation spectra where a jump in reflectance is observed between 1000 nm and 1001 nm. To further understand and quantify the jump, surface reflectance at 999 nm, 1000 nm, and 1001 nm are plotted as a function of time. Figure 35c shows surface reflectance at 999 nm and 1000 nm as a function of time. The surface reflectance of adjacent spectral channels within the same VNIR spectrometer lies on top of each other, and the mean surface reflectance difference is 0.09%. However, surface reflectance of adjacent spectral channels from two different spectrometers, 1000 nm (VNIR) and 1001 nm (SWIR 1), are different. Surface reflectance at 1001 nm is either higher or lower than the reflectance at 1000 nm. The mean difference in surface reflectance between these two wavelengths is 2.08%. Similarly, the mean surface reflectance difference between 1799 nm and 1800 nm and 1801 nm and 1800 nm are 0.05% and 3.49%, respectively.
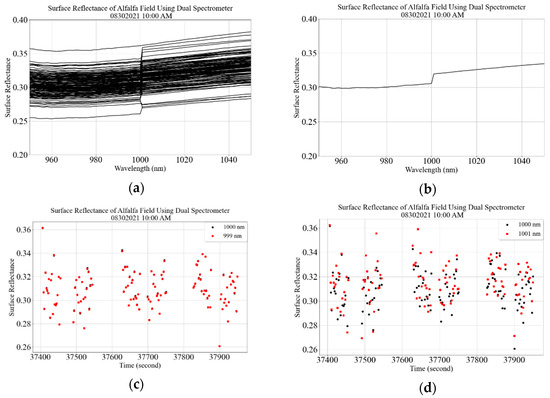
Figure 35.
Surface reflectance of vegetative target using dual-spectrometer approach: (a) all individual spectrum; (b) individual spectrum. (c) Surface reflectance as a function of time at 999 nm (red symbols) and 1000 nm (black symbols). (d) Surface reflectance as a function of time at 1001 nm (red symbols) and 1000 nm (black symbols) (30 August 2021 (10:00 AM) at SDSU Research Park, Brookings, South Dakota).
The dual-spectrometer approach, despite its limitation during a sharp change in atmospheric transmittance, has the ability to measure the calibration panel continuously via the FBU and update MU calibration by synchronizing their measurements. This approach tracks any change in atmospheric transmittance continuously and adjusts MU reflectance calibration. As a result, the surface reflectance of the unknown target using the dual spectrometer has higher precision than the single-spectrometer approach.
5. Conclusions
This work reports the methodology for the dual-spectrometer approach to estimate the surface reflectance of the unknown target. This approach measures simultaneous downwelling and upwelling irradiance to calculate the surface reflectance of the target. Simultaneous measurement is obtained by using a separate spectrometer dedicated to tracking changes in atmospheric transmittance while another spectrometer measures the target. Such simultaneous atmospheric measurement helps to compensate for atmospheric changes during field measurement and results in more precise surface reflectance than using a single spectrometer. This work also compares the surface reflectance of the unknown target estimate by using the single- and dual-spectrometer approaches.
Surface reflectance from the two approaches was compared using data from various locations: (1) Brookings, South Dakota; (2) Coconino National Forest, Arizona; and (3) Guymon, Oklahoma. It was found that the precision of the surface reflectance using the dual-spectrometer approach is better than the single-spectrometer approach during different atmospheric conditions. The dual-spectrometer approach shows a 2–6% improvement in the precision of surface reflectance even in a clear sky condition. During non-optimal atmospheric conditions, the precision of the surface reflectance using the dual-spectrometer approach is improved by 50–60% across most of the spectral regions. This work also showed that the dual-spectrometer approach correctly identified the spectra corresponding to cloud overpass events and eliminated them from further analysis.
As the quality of satellite sensors and their products have increased, precise surface reflectance is necessary for evaluating their performance. This work shows that the dual-spectrometer approach can estimate the surface reflectance of the unknown target precisely in both optimal and non-optimal atmospheric conditions. Further field experience is planned to validate the advantages of the dual-spectrometer system and improve understanding of the ability of the dual-spectrometer system to improve surface reflectance measurements of the target during both optimal and non-optimal atmospheric conditions.
Author Contributions
Conceptualization, M.S., J.M. and D.H.; methodology, M.S., J.M., J.I., T.K. and D.H.; software, M.S. and T.K.; formal analysis, M.S. and D.H.; investigation, M.S.; data curation, M.S., J.M., T.R., J.I., T.K. and E.M.; writing—original draft preparation, M.S.; writing—review and editing, M.S., J.M., J.I. and D.H.; visualization, M.S. and D.H.; supervision, D.H., J.M. and J.I.; project administration, E.M., J.M., and J.I. All authors have read and agreed to the published version of the manuscript.
Funding
This work was performed by a KBR contractor supporting the ECCOE under USGS contract number 140G0121D0001.
Data Availability Statement
The data presented in this study, collected by USGS, are openly available in ScienceBase at https://doi.org/10.5066/P9E3F6LV, accessed on 20 November 2023.
Acknowledgments
The authors would like to express their gratitude to Michelle While, Obaidul Haque, and Sandra Martinka Preaux for their invaluable suggestions in the manuscript. The authors would also like to appreciate the constructive and insightful comments from the reviewers.
Conflicts of Interest
The authors declare no conflict of interest. Any use of trade, firm, or product name(s) is for descriptive purposes only and does not imply endorsement by the U.S. Government.
References
- Wu, Z.; Snyder, G.; Vadnais, C.; Arora, R.; Babcock, M.; Stensaas, G.; Doucette, P.; Newman, T. User needs for future Landsat missions. Remote Sens. Environ. 2019, 231, 111214. [Google Scholar] [CrossRef]
- Vermote, E.; Justice, C.; Claverie, M.; Franch, B. Preliminary analysis of the performance of the Landsat 8/OLI land surface reflectance product. Remote Sens. Environ. 2016, 185, 46–56. [Google Scholar] [CrossRef] [PubMed]
- McCorkel, J.; Thome, K.; Ong, L. Vicarious calibration of EO-1 Hyperion. IEEE J. Sel. Top. Appl. Earth Obs. Remote Sens. 2012, 6, 400–407. [Google Scholar] [CrossRef]
- Teixeira Pinto, C.; Jing, X.; Leigh, L. Evaluation Analysis of Landsat Level-1 and Level-2 Data Products Using In Situ Measurements. Remote Sens. 2020, 12, 2597. [Google Scholar] [CrossRef]
- Shrestha, M.; Helder, D.; Christopherson, J. DLR Earth Sensing Imaging Spectrometer (DESIS) Level 1 Product Evaluation Using RadCalNet Measurements. Remote Sens. 2021, 13, 2420. [Google Scholar] [CrossRef]
- Thome, K.J.; Arai, K.; Tsuchida, S.; Biggar, S.F. Vicarious calibration of ASTER via the reflectance-based approach. IEEE Trans. Geosci. Remote Sens. 2008, 46, 3285–3295. [Google Scholar] [CrossRef]
- Thome, K.J.; Helder, D.L.; Aaron, D.; Dewald, J.D. Landsat-5 TM and Landsat-7 ETM+ absolute radiometric calibration using the reflectance-based method. IEEE Trans. Geosci. Remote Sens. 2004, 42, 2777–2785. [Google Scholar] [CrossRef]
- Leigh, L.; Aarron, D. Absolute Radiometric Vicarious Calibration of on Orbit Imaging Satellites. In Proceedings of the Asian Conference on Remote Sensing (ACRS), Bali, Indonesia, 20–24 October 2013. [Google Scholar]
- Helder, D.; Thome, K.J.; Mishra, N.; Chander, G.; Xiong, X.; Angal, A.; Choi, T. Absolute radiometric calibration of Landsat using a pseudo invariant calibration site. IEEE Trans. Geosci. Remote Sens. 2013, 51, 1360–1369. [Google Scholar] [CrossRef]
- Bouvet, M.; Thome, K.; Berthelot, B.; Bialek, A.; Czapla-Myers, J.; Fox, N.P.; Goryl, P.; Henry, P.; Ma, L.; Marcq, S. RadCalNet: A Radiometric Calibration Network for Earth Observing Imagers Operating in the Visible to Shortwave Infrared Spectral Range. Remote Sens. 2019, 11, 2401. [Google Scholar] [CrossRef]
- Jing, X.; Uprety, S.; Liu, T.-C.; Zhang, B.; Shao, X. Evaluation of SNPP and NOAA-20 VIIRS Datasets Using RadCalNet and Landsat 8/OLI Data. Remote Sens. 2022, 14, 3913. [Google Scholar] [CrossRef]
- Irwin, J.R.; Shrestha, M.; Robbins, T.J.; Mann, J.J. ECCOE 2021 Surface Reflectance Validation Dataset: U.S. Geological Survey Data Release; U.S. Geological Survey Earth Resources Observation and Science (EROS) Center: Sioux Falls, SD, USA, 2023. [Google Scholar] [CrossRef]
- Kaita, E.; Markham, B.; Haque, M.O.; Dichmann, D.; Gerace, A.; Leigh, L.; Good, S.; Schmidt, M.; Crawford, C.J. Landsat 9 Cross Calibration Under-Fly of Landsat 8: Planning, and Execution. Remote Sens. 2022, 14, 5414. [Google Scholar] [CrossRef]
- Hatchell, D.C. ASD Technical Guide; Analytical Spectral Devices Inc.: Boulder, CO, USA, 1999; Volume 5335. [Google Scholar]
- Biggar, S.F.; Slater, P.; Gellman, D. Uncertainties in the in-flight calibration of sensors with reference to measured ground sites in the 0.4–1.1 μm range. Remote Sens. Environ. 1994, 48, 245–252. [Google Scholar] [CrossRef]
- Thome, K. Absolute radiometric calibration of Landsat 7 ETM+ using the reflectance-based method. Remote Sens. Environ. 2001, 78, 27–38. [Google Scholar] [CrossRef]
- Schott, J.R. Remote Sensing: The Image Chain Approach; Oxford University Press on Demand: Oxford, UK, 2007. [Google Scholar]
- Helder, D.; Thome, K.; Aaron, D.; Leigh, L.; Czapla-Myers, J.; Leisso, N.; Biggar, S.; Anderson, N. Recent surface reflectance measurement campaigns with emphasis on best practices, SI traceability and uncertainty estimation. Metrologia 2012, 49, S21. [Google Scholar] [CrossRef]
- Labsphere, I. Calibration Panel. Available online: https://www.labsphere.com/ (accessed on 10 June 2022).
- Zhang, L.; Sun, X.; Wu, T.; Zhang, H. An analysis of shadow effects on spectral vegetation indexes using a ground-based imaging spectrometer. IEEE Geosci. Remote Sens. Lett. 2015, 12, 2188–2192. [Google Scholar] [CrossRef]
- Bachmann, C.M.; Montes, M.J.; Parrish, C.E.; Fusina, R.A.; Nichols, C.R.; Li, R.-R.; Hallenborg, E.; Jones, C.A.; Lee, K.; Sellars, J. A dual-spectrometer approach to reflectance measurements under sub-optimal sky conditions. Opt. Express 2012, 20, 8959–8973. [Google Scholar] [CrossRef] [PubMed]
- Schaepman, M.E.; Dangel, S. Solid laboratory calibration of a nonimaging spectroradiometer. Appl. Opt. 2000, 39, 3754–3764. [Google Scholar] [CrossRef] [PubMed]
- Bhattacharya, P.; Fornari, R.; Kamimura, H. Comprehensive Semiconductor Science and Technology; Newnes: Oxford, UK, 2011. [Google Scholar]
- Manolakis, D.G.; Lockwood, R.B.; Cooley, T.W. Hyperspectral Imaging Remote Sensing: Physics, Sensors, and Algorithms; Cambridge University Press: Cambridge, UK, 2016. [Google Scholar]
Disclaimer/Publisher’s Note: The statements, opinions and data contained in all publications are solely those of the individual author(s) and contributor(s) and not of MDPI and/or the editor(s). MDPI and/or the editor(s) disclaim responsibility for any injury to people or property resulting from any ideas, methods, instructions or products referred to in the content. |
© 2023 by the authors. Licensee MDPI, Basel, Switzerland. This article is an open access article distributed under the terms and conditions of the Creative Commons Attribution (CC BY) license (https://creativecommons.org/licenses/by/4.0/).