Article

Characterizing Transitions between Successional Stages in a Tropical Dry Forest Using LiDAR Techniques

Centre for Earth Observation Sciences (CEOS), Department of Earth and Atmospheric Sciences, University of Alberta, Edmonton, AB T6G 2R3, Canada
*
Author to whom correspondence should be addressed.
Remote Sens. 2023, 15(2), 479; https://doi.org/10.3390/rs15020479
Submission received: 30 October 2022 / Revised: 8 January 2023 / Accepted: 11 January 2023 / Published: 13 January 2023
(This article belongs to the Special Issue New Advancements in the Field of Forest Remote Sensing)

Abstract

:
Secondary succession is defined as natural regeneration following complete forest clearance from anthropogenic or natural disturbances. Traditional strategies aimed to map and characterize secondary succession using remote sensing are usually based on deterministic approaches, where transitions between successional stages are not considered. These transitions represent rich environments between successional stages and play a key role in ecosystem regeneration. Here, we evaluate the use of the Full-waveform Airborne LiDAR to characterize changes in forest structure between the transition of early-to-intermediate and intermediate-to-late forest succession at the Santa Rosa National Park Environmental Monitoring Super Site (SRNP-EMSS), Guanacaste, Costa Rica. The vertical forest structure was analyzed on twenty cross-sections selected between forest transitions previously mapped using machine learning; leaf area density (LAD) and waveform metrics were studied based on the waveform profile derived from twenty-seven plots distributed in different successional forest patches. Results suggest that LiDAR techniques can identify forest structure differences between successional stages and their transitions. The significance proves that transitions exist, highlights the unique transitional characteristics between intermediate and late successional stages and contributes to understanding the significance of inter-successional stages (transitions) in secondary dry forests.

1. Introduction

Tropical dry forest (TDF) ecosystems are dominated by deciduous species (trees and lianas), have total annual precipitation ranges from 700 to 2000 mm, and have a mean annual temperature of ≥25 °C [1]. TDFs contain a wealth of biodiversity and essential habitats for wildlife [2] and, in combination with other tropical ecosystems, play a significant role in climate regulation and the carbon cycle [3]. Furthermore, TDFs are a critical source of ecosystem services [4,5]. However, up to the beginning of the 21st century, nearly 98% of all TDFs suffered destruction worldwide, and the rate of disturbance and deforestation far surpasses land use and land cover change processes in other tropical biomes [6]. Moreover, it was estimated that only 40% of all tropical dry forests in the Americas were left in 2010, although these remnants were highly fragmented [7].
Despite the high rate of tropical dry forest deforestation, some areas in the Americas, due to changes in socio-economic conditions, are reverting the deforestation process, and the landscape is now a mosaic of tropical secondary forests [4]. This landscape, classification denoted as “agro-landscapes”, is defined as sites where forests emerge between agricultural systems and where regeneration depends upon a combination of factors, including land-use history, germination of seeds transported via biotic and abiotic vectors, as well as recovery of remnant vegetation [8,9,10].
Tropical dry forest succession is a natural and complex ecological process affected by climatic and land-use history processes [11,12]. Associated with these processes, diverging opinions exist on the characterization of TDF based on the successional stage or age since abandonment [11]. Most work associated with the characterization of tropical dry forests succession has been led by Kalacska et al. [2,13,14] and Arroyo-Mora et al. [15]. Kalacska et al. [2,13,14] provided important baselines for structural properties and their association with the Holdridge Complexity Index, which in turn were used for TDF characterization using hyperspectral remote sensing data [16]. Arroyo-Mora et al. [15] proposed a well-accepted definition of successional stages in TDFs based on (1) the horizontal and vertical structure, (2) leaf flushing dynamics, and (3) the density of green canopy cover. This definition characterizes TDF along a continuum divided into three principal successional stages, i.e., early, intermediate, and late. Near the boundary of these successional stages, the species composition of leaf-litter invertebrates changes, small mammal populations develop alterations in their behavioral and biological characteristics, and the number and structure of bird communities alter [17,18,19]. Under the approaches proposed by Kalacska et al. [14] and Arroyo-Mora et al. [15], different successional stages derive noticeable differences in horizontal and vertical forest structures such as canopy height, canopy gaps, leaf area index (LAI), and photosynthetically active radiation (PAR). These differences have been extended to generate TDF classifications by Castillo et al. [20,21], Gu et al. [22], and more recently, Zhao et al. [23], which combined advanced machine learning classifiers to generate advanced forest cover maps based on age and succession.
Remote sensing technologies, either active (such as LiDAR and SAR) or passive (optical), have been proven to have the potential to quantify secondary TDFs succession [2,20]. In particular, LiDAR provides a new way to characterize forest structure [24,25,26]. LiDAR systems have the capacity to penetrate dense forest canopies, making it easier to detect the vertical distribution of forest structural components than with optical spectroscopy [27]. LiDAR applications in forestry can be categorized into airborne laser scanning (ALS) and terrestrial laser scanner (TLS) according to different system platforms. Among ALS sensors, discrete ALS (ALSD) is traditionally used to estimate the stand attributes or classify tree species [28] and forest canopy fuel [29]. However, little attention has been attributed to full-waveform ALS (ALSFW) because of the raw waveform data’s complexity and lack of processing software [30]. ALSFW sensors can avoid the drawbacks of ALSD by sampling as a continuous return signal to provide information within vertical forest components beyond the first and last returns. Furthermore, information from ALSFW sensors has been effectively correlated with changes in the vertical distribution of sub-canopy components of boreal forests as well as the neotropical rainforest [31,32].
Over the years, ALSFW has been applied widely to study vegetation and forest inventories using various methods; Chaulagain et al. [33] studied the modeling of hydraulic roughness in the presence of riparian vegetation using field-based and LiDAR-based data. Crespo-Peremarch et al. [32] investigated the independent capability of ALSFW, ALSD and TLS to estimate the spatial distribution of understory vegetation from the lower strata (height < 4 m) for two structurally contrasting conifer-dominated forests. The result of this work indicated that understory vegetation density classes can be determined more accurately with ALSFW than ALSD or TLS. The first approach (ALSFW) by Castillo et al. [20,21] demonstrated that changes in the vertical forest structure (such as height) associated with the main successional stages (early, intermediate, and late) of a secondary TDF could be effectively identified using ALSFW data. In their results, the spatial agreement between the ISODATA classification and the “literature-based” classification was 97%, 56%, and 99% for the early, intermediate, and late successional stages, respectively. Furthermore, Muss et al. [34] were the first to propose the use of centroids and the radius of gyration (RG) of the ALSFW to predict forest biomass in northern Wisconsin. Gu et al. [22] identified successional stages of a TDF in Costa Rica using ALSFW and demonstrated that shape-based metrics (such as centroids and the radius of gyration) can be used to detect those ecological successional stages. Working in the same study area, Zhao et al. [23] assessed the ability of hyperspectral images and LiDAR data to map ecological succession with respect to a given age attribute and not the discrete age groups or successional stages. These studies provide evidence that approaches based on ALSFW can be successfully implemented to characterize changes in TDF’s structure.
The common denominator of the former studies is that their products are basically deterministic. Deterministic classification approaches consider that the presence between forest boundaries of different successional stages/ages is not continuous, ignoring the fact that transitions are present between these boundaries. Until today, with the exception of Li et al. [21] and Zhao et al. [20], most work in the mapping and characterization of TDFs has ignored the subtle differences present among the principal successional stages as they deterministically divide secondary forests into early, intermediate, and late successions, as mentioned in Figure 1. In this context, this paper aims to be the first one to assess how well ALSFW characterizes the structural properties of the transition between different TDF successional stages. Here we seek the answer to the following questions: (1) How does the canopy height change along the successional path? (2) How do structural parameters derived from full-waveform Airborne LiDAR and its associated metrics change across the transition linking intermediate to late forest succession? This work expands on previous studies by Li et al. [35] and Sanchez-Azofeifa et al. [12], who proposed the idea that mapping secondary TDFs succession should consider the transition between principal successional stages but did not identify their characterization. Therefore, our work will try to fill this gap.

2. Materials and Methods

2.1. Study Area

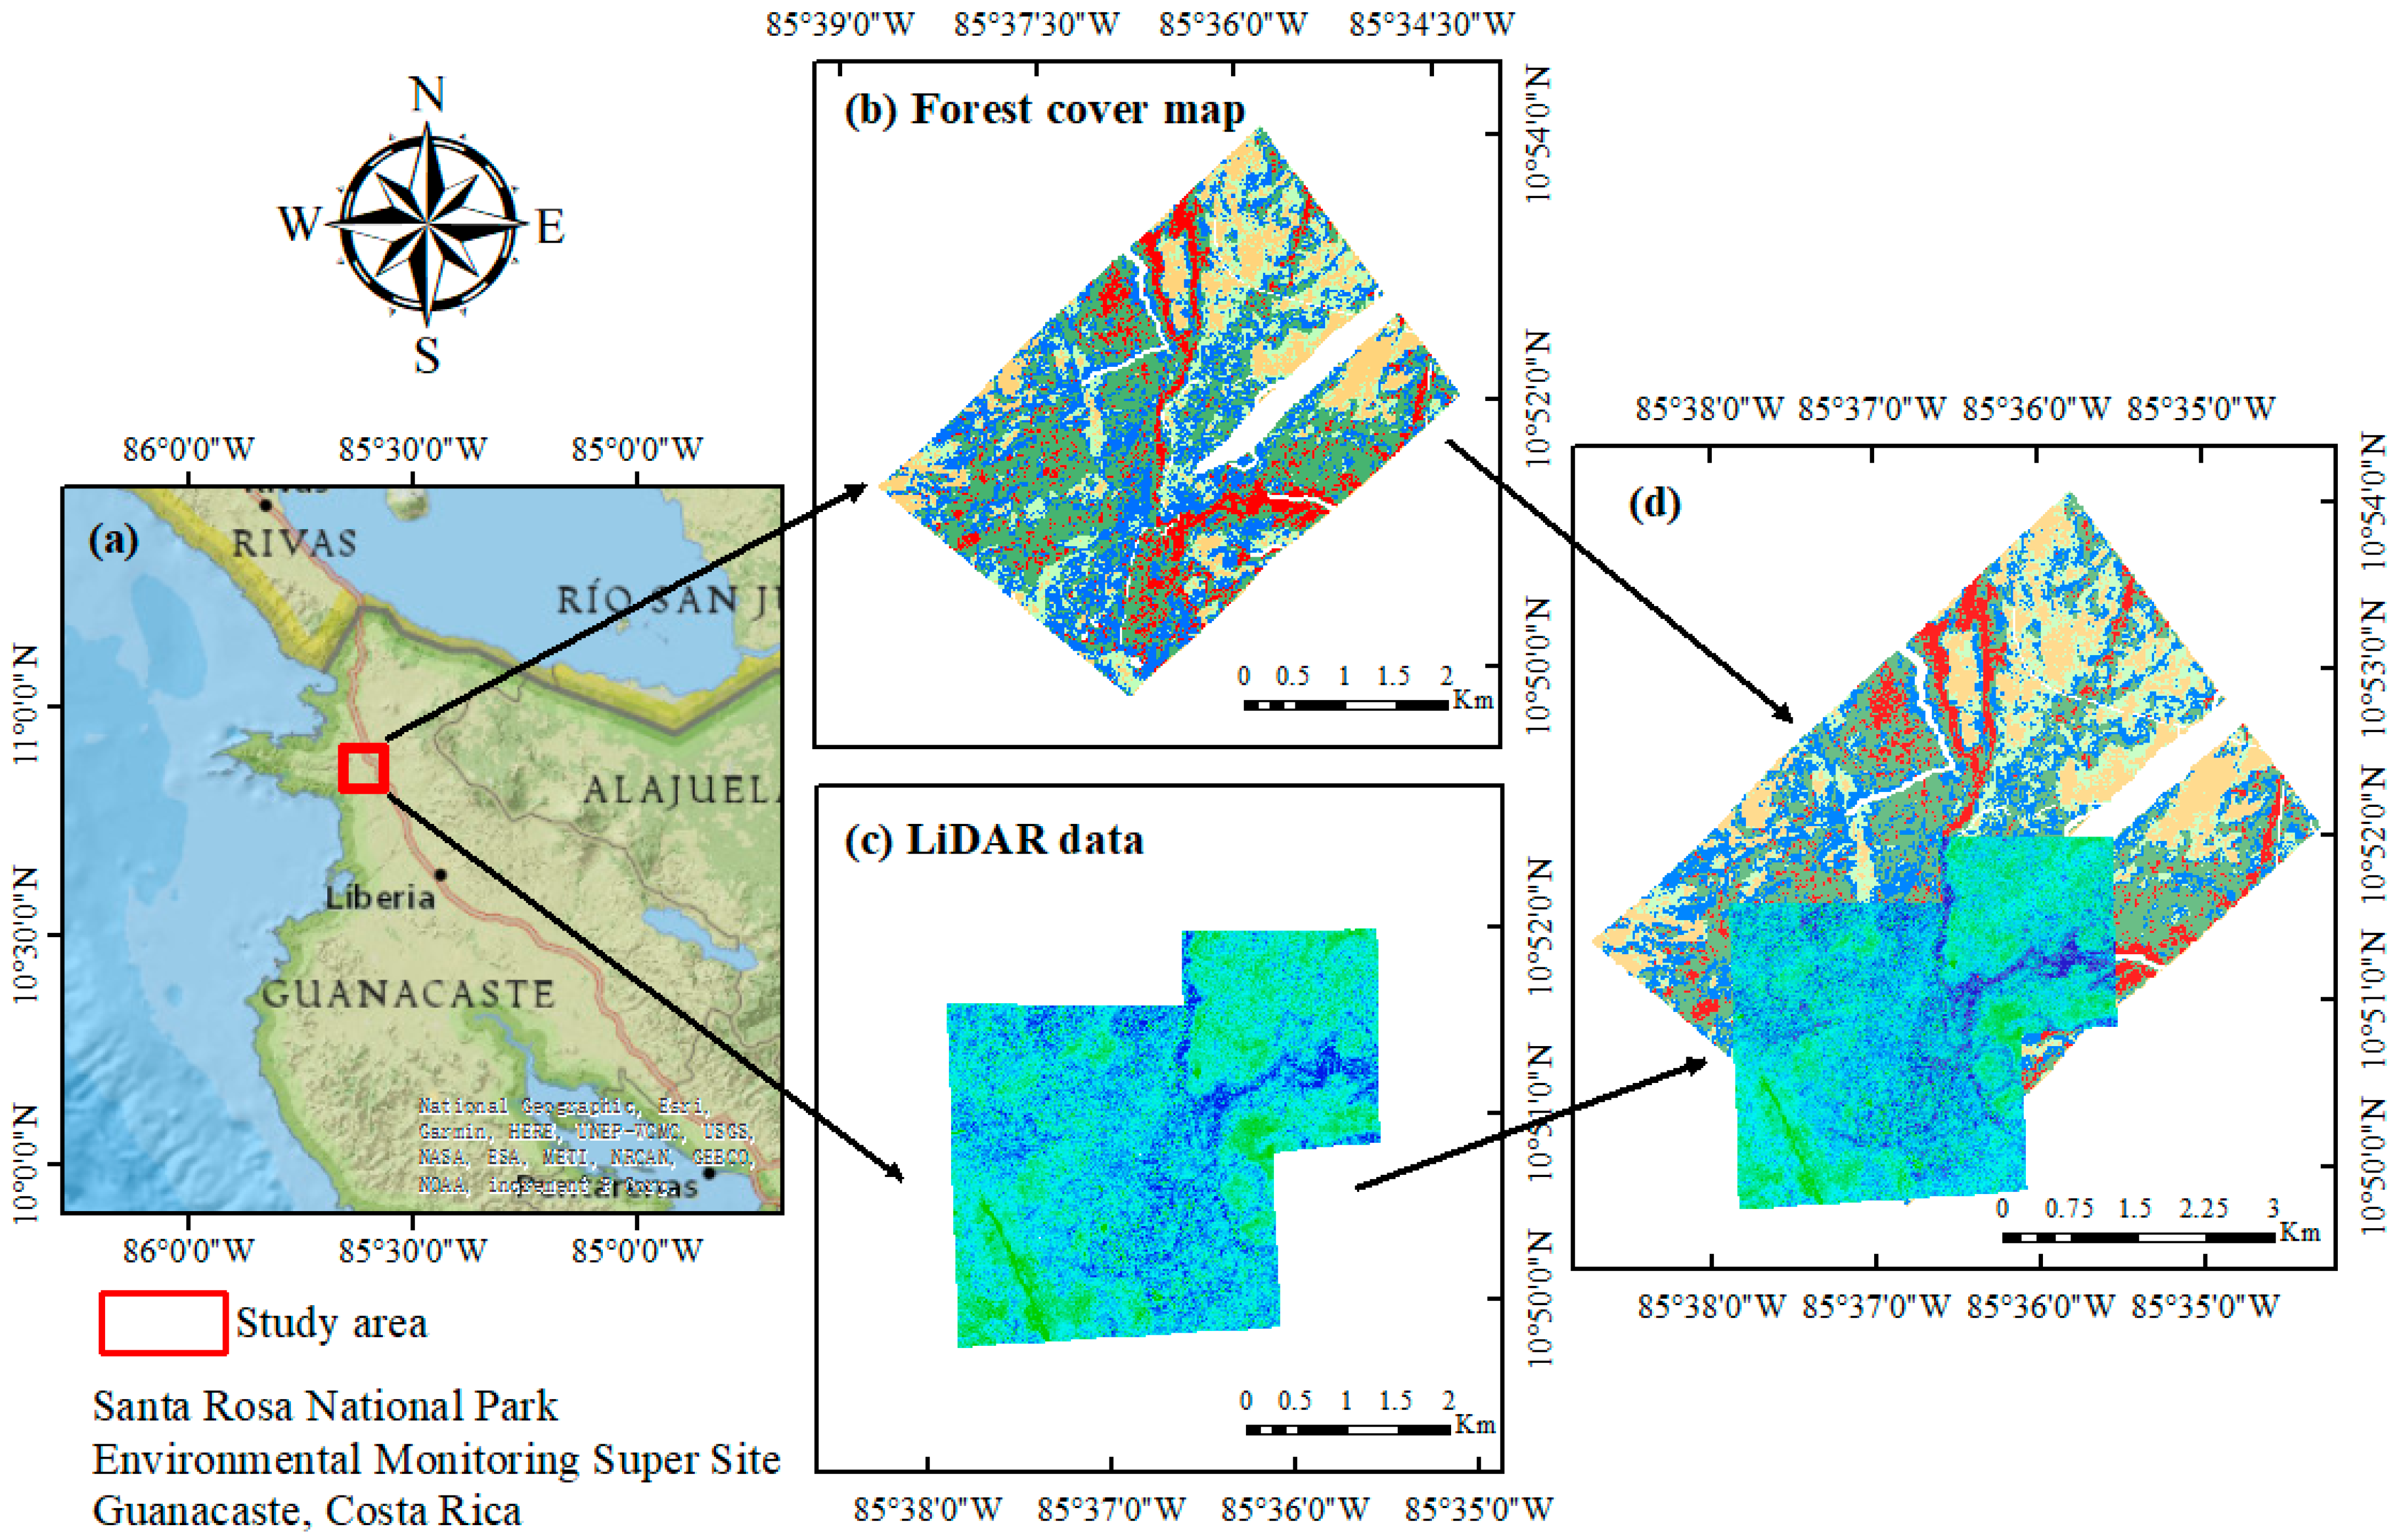
The study was conducted in an area of approximately 50 km2 at the Santa Rosa National Park Environmental Monitoring Super Site (SRNP-EMSS), located in the northwest of the Guanacaste province in Costa Rica (10°48′53″N, 85°36′54″W) (Figure 2). The topography of the study area is relatively flat, although there are some hills and even small cliffs in the eastern parts. SRNP-EMSS is located at a TDF with a mean annual temperature of 25 °C and annual precipitation of 1720 mm. Most precipitation occurs in the wet season from June to November, and water availability is extremely limited in the 6-month dry season lasting from December to May [1]. SRNP-EMSS is a mosaic of diverse vegetation communities with pastures and secondary forests in different gradients of succession [23]. Before the national park was established in 1971, SRNP-EMSS had suffered intense deforestation since the early 1600s, resulting from natural and anthropogenic disturbances such as forest fires, agriculture and timber extraction [13]. Drought deciduous species dominate the vegetation. The area has forest patches in three successional stages: early, intermediate and late. Of these, 80–100%, 30–50% and 10–40% of woody plants are deciduous during the dry season in early, intermediate and late-stage forests, correspondingly [15].

2.2. Datasets

2.2.1. Forest Cover Map

This study uses a forest cover map with a combination of age and succession compiled by Zhao et al. [23] to identify the transition zones of the study area, which is the only goal of using this data set in this study. Zhao et al. [23] created the map by combining hyperspectral (HyMap) and waveform LiDAR data LVIS (Land Vegetation and Ice Sensor) acquired in 2005 over the study area (Figure 2b). The map has a 1 by 1 m spatial resolution and five age groups: 0–10, 10–20, 20–30, 30–50 and 50+ years. The map was compiled using age-attribute metrics that were used as entry-level variables on a randomized nonlinear archetypal analysis (RNAA) model to select the most informative metrics to map different successional stages [23]. After that, they adopted a relative attribute learning (RAL) algorithm for independent and fused metrics to learn the relative attribute levels of the forest ages. In the map, the age attributes of a TDF are considered a continuous expression of relative attribute scores/levels that change along the process of ecological succession. Furthermore, the fusion of four HyMap metrics and five LVIS metrics significantly improves the accuracy of the generated forest age map. Additional information can be found in Zhao et al. [23].

2.2.2. Full-Waveform LiDAR

Once the known transition regions were identified using the forest cover map, we used a colorized small footprint (1 m × 1 m) full-waveform airborne LiDAR data set with two main goals: (1) to create a canopy height model (CHM) to quantify canopy height changes along the cross-section between intermediate and late forests, as well as their transition; and (2) to characterize vertical structure differences of plots in transitions and main successional stages based on the corresponding leaf area density profile and several shape-based metrics. The full-waveform LiDAR data set was acquired on 21 May 2021, by Stereocarto (Madrid, Spain) using a RIEGL LMS-Q680i sensor (Riegl Laser Measurement Systems GmbH, Horn, Austria). The aircraft used for this work is a Piper Azteca PA23. For the execution of the flight, the LiteMapper IGI 6800i System (sn. 10-0104), which integrates into the same platform as the LiDAR system RIEGL LMS-Q680i, a Photogrammetric camera DigiCAM H5D-50, a video camera, and GPS INS, equipped with an electronic device for the compensation of the drag of the image and microprocessor for the automatic control of the exposure, were used. Relevant flight parameters are shown in Table 1.

2.3. Data Processing

2.3.1. Transition Identification

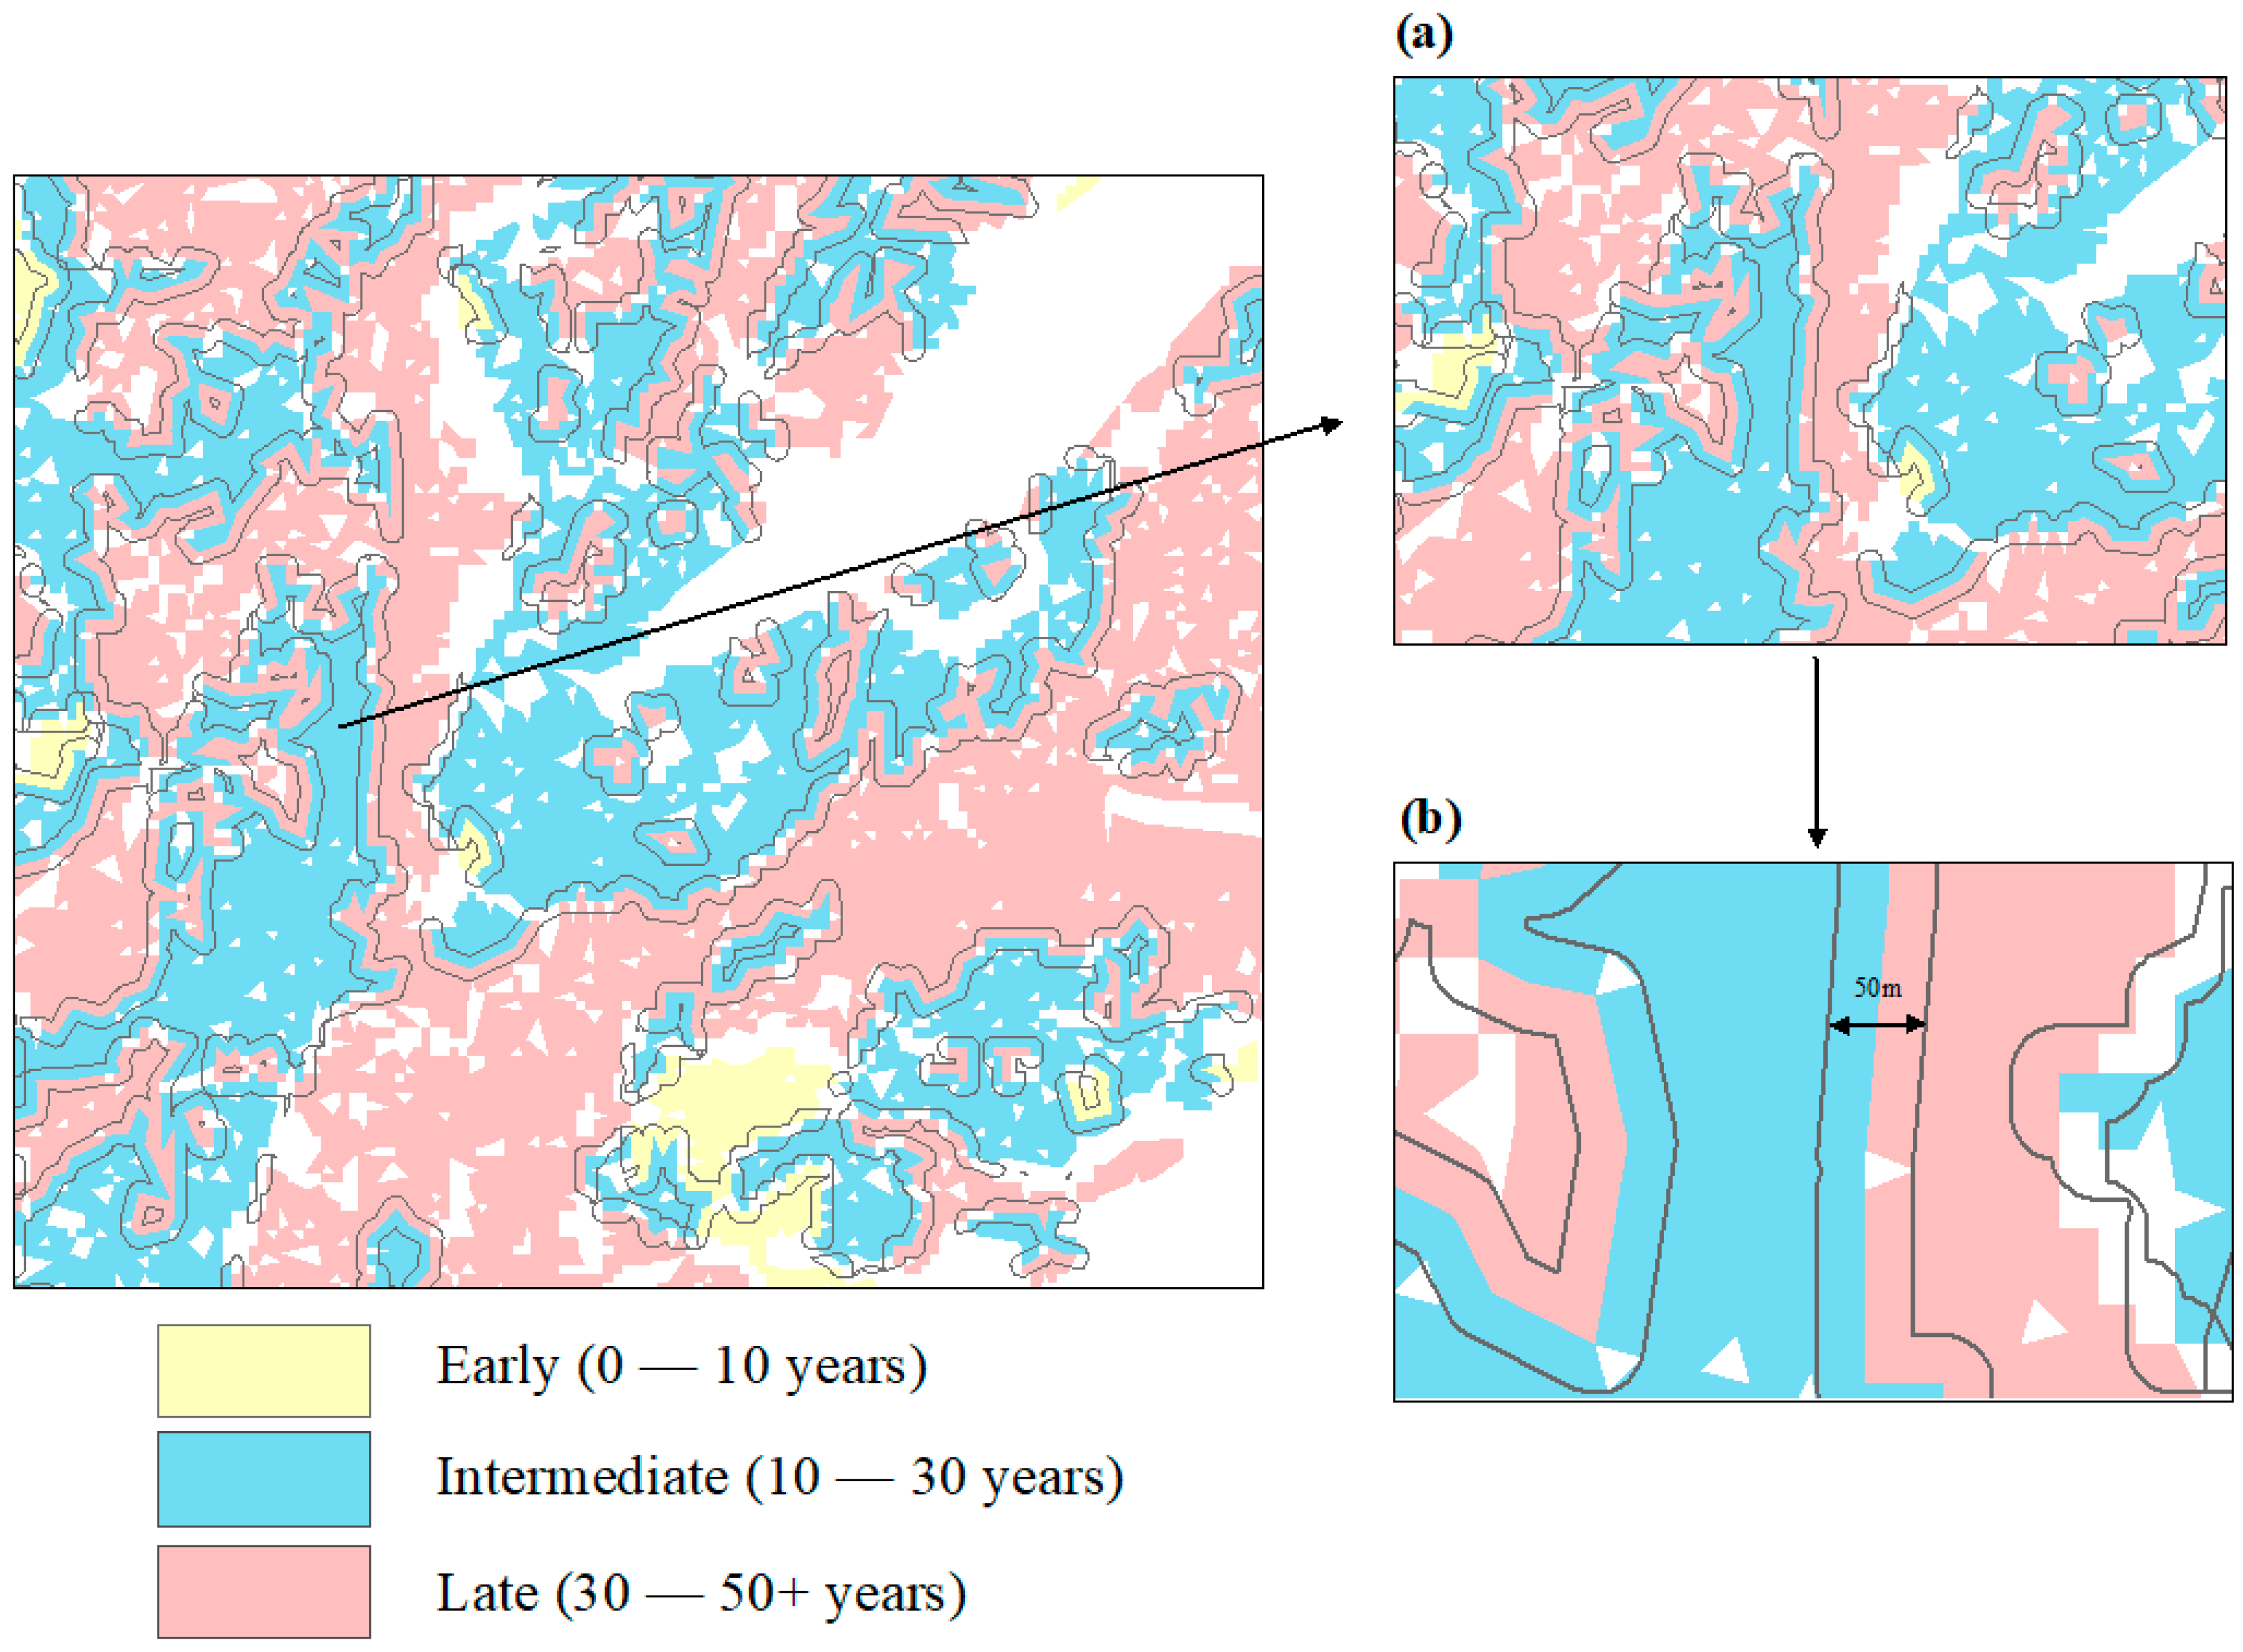
Transitions connecting early (0–10 years), intermediate (10–30 years) and late (30–50+ years) forest patches were used in this study. All patches with an area less or equal to 5000 m2 were selected and removed from the forest cover map by Zhao et al. [23]. This was done to standardize the transitions between forest patches. Once the select and remove operation was performed, a 25 m buffer was created around all three principal successional stages, extracting the overlap between each of them as their respective transitions [19].

2.3.2. Estimation of Canopy Height Variability

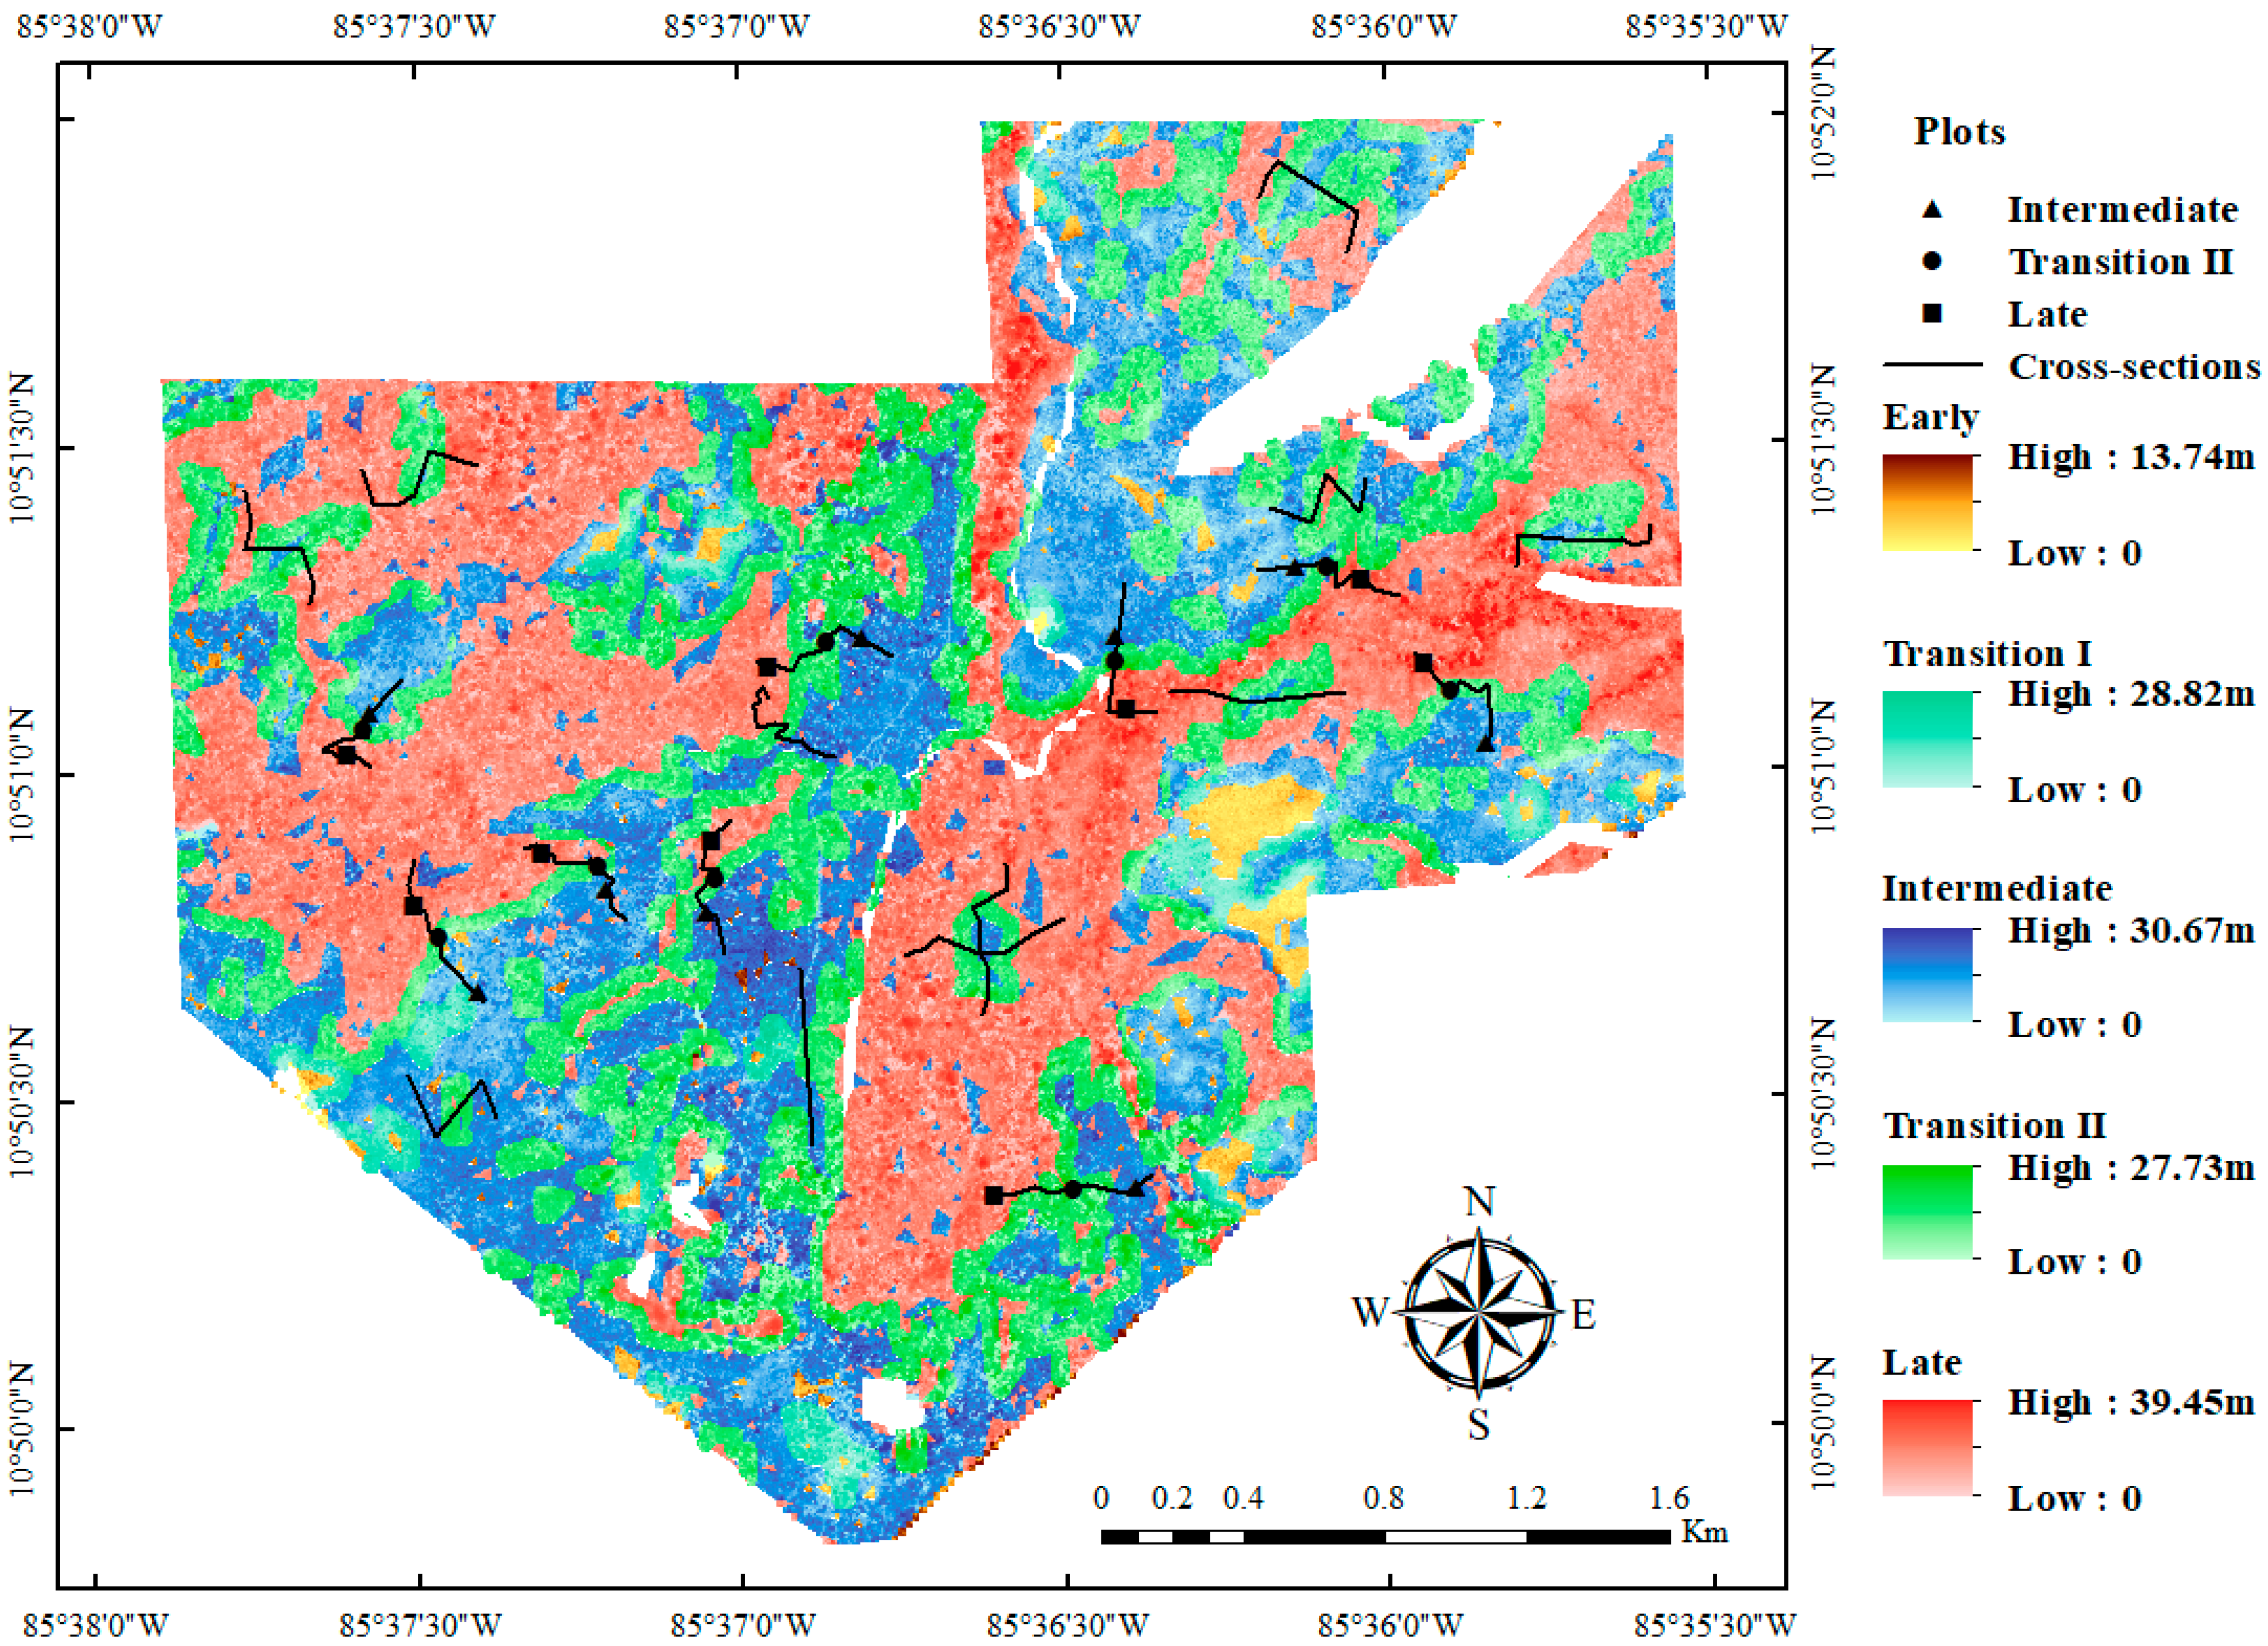
The ALSFW data were used to create a high-resolution canopy height model image (1 m × 1 m) after it was denoised, classified, interpolated and normalized (Figure 3). The “cloth” simulation filter (CSF) algorithm was used to classify ground points and off-ground points [36], which were interpolated into a DEM (from ground points) and DSM (from off-ground points) using Delaunay triangulations [37,38]. Especially for the processing of huge data sets, such as our full-waveform Airborne LiDAR data in this study, Delaunay triangulation is faster, more robust, and provides better results than other methods, including inverse distance weighting (IDW), natural neighbors, Kriging, and splines, etc. [37,38]. After that, the DSM was used to subtract the DEM to derive the canopy height model (CHM). For the overlapped part of two datasets (Figure 2d), a local maximum filter (LMF) with a fixed 3 × 3 windows size was applied to the smoothed CHM (1 m × 1 m) to find the local highest or local maxima within its peaks. These local maxima points correspond to individual tree-top locations and heights, so we can segment individual trees and extract the corresponding canopy height information for three main successional stages and two transitions. One limitation of this method is it will underestimate the result because CHM is a raster image in which understories cannot be detected. A univariate analysis of variance (ANOVA) for canopy height and the successional stage was conducted to study the effect of the successional stages on vertical structure (canopy height).

2.3.3. Canopy Height Comparison between Transitions and Principal Successional Stages

Here, we made efforts to identify the change in canopy height between transitions and the other main successional stages. More specifically, emphasis was placed on the intermediate, transition II, and late successional stages. In this context, it refers to the successional stage from intermediate to late when the “transition II” or “transition II” is mentioned. The canopy height model was interpolated from 1 m × 1 m to 5 m × 5 m using bilinear interpolation [39] to make the canopy height changes smoother and more realistic. We then randomly and evenly selected twenty cross-sections of 500 m length along four different successional paths (Intermediate–Transition II–Intermediate, Intermediate–Transition II–Late, Late–Transition II–Intermediate–Transition II–Late, Intermediate–Transition II–Late–Transition II–Intermediate) in the study area (Figure 3) to extract canopy height values so as to generate vertical profiles. Furthermore, forest canopy gaps were avoided as much as possible when selecting these twenty cross-sections over the study area [25].

2.3.4. Estimation of Vertical Forest Structure

In addition to canopy height information derived from CHM, full-waveform LiDAR data provide valuable understory information. In this section, twenty-seven of the 45 m × 45 m plots were selected randomly along nine cross-sections (Intermediate–Transition II–Late) to capture the inter-stage (Transition II) and intra-stage (Intermediate and Late) forest structure for further analysis (Figure 3) using Airborne LiDAR data, including the estimation of leaf area index (LAI), and the generation of a leaf area density profile. LAI represents the area of leaves per unit of ground area (m2·m−2) [40]. In this study, LAI was calculated for each plot using a gap fraction approach that is based on the Beer–Lambert Law. The Beer–Lambert Law quantitively describes the attenuation process of light penetrating into the canopy:
e k L A I z = I z I 0
where k is the extinction coefficient, LAI is the effective leaf area index, I z is PAR transmittance at canopy depth z, and I 0 is the total incoming photosynthetically active radiation (PAR). The value of k is affected by the view zenith angle and the leaf angle distribution. Assuming that the leaves’ individual size is small enough compared to the canopy and leaves are randomly distributed [2], the gap fraction can be equivalent to transmittance [41]. The expression for k should be:
k = k θ , α = G θ , α cos θ
where θ is the view zenith angle, α is the leaf angle distribution, and G θ , α is the G-function, which corresponds to the fraction of foliage projected onto the plane normal to the zenith direction [26]. The leaf angle describes the spatial distribution information of the foliage, and the spherical model can simply and reliably simulate the distribution of leaf angles. Thus, we assumed that the foliage distributes randomly and leaf angles distribute as a spherical distribution [42]. Through the Beer–Lambert Law, LAI and gap fraction ( P θ ) could be connected:
P θ = e G θ , α L A I / c o s θ
For direct-lighting conditions, the gap fraction was estimated by the ratio between the number of returns below a specified height threshold and the total number of returns [26]. Cumulative LAI at a given canopy depth z can, therefore, be calculated through the fraction of photosynthetically active radiation (PAR) that is transmitted at canopy depth z using the following adaptation of the Beer–Lambert Law:
L A I z = l n P z k
where L A I z is the leaf area index value for layer z; P z is the gap fraction from the top of the canopy to a given height z. We calculated LAI using a k-value of 0.5 for all twenty-seven plots in this study [43]. It is logical that different k-values might affect the derived LAI value; however, it would not significantly change the profile shapes. In addition, all LAI profiles were calculated from gap fractions at each height interval with the given thickness dz as 0.5 m in this study. The resulting L A I z values were then divided by dz to derive the vertical profile of canopy height versus leaf area density, LAD. The LAD distribution is expressed as the leaf area at each height interval per canopy volume (m2·m−3). Therefore, LAD values are the partial volumetric components of LAI [40].

2.3.5. Derivation of LiDAR Metrics

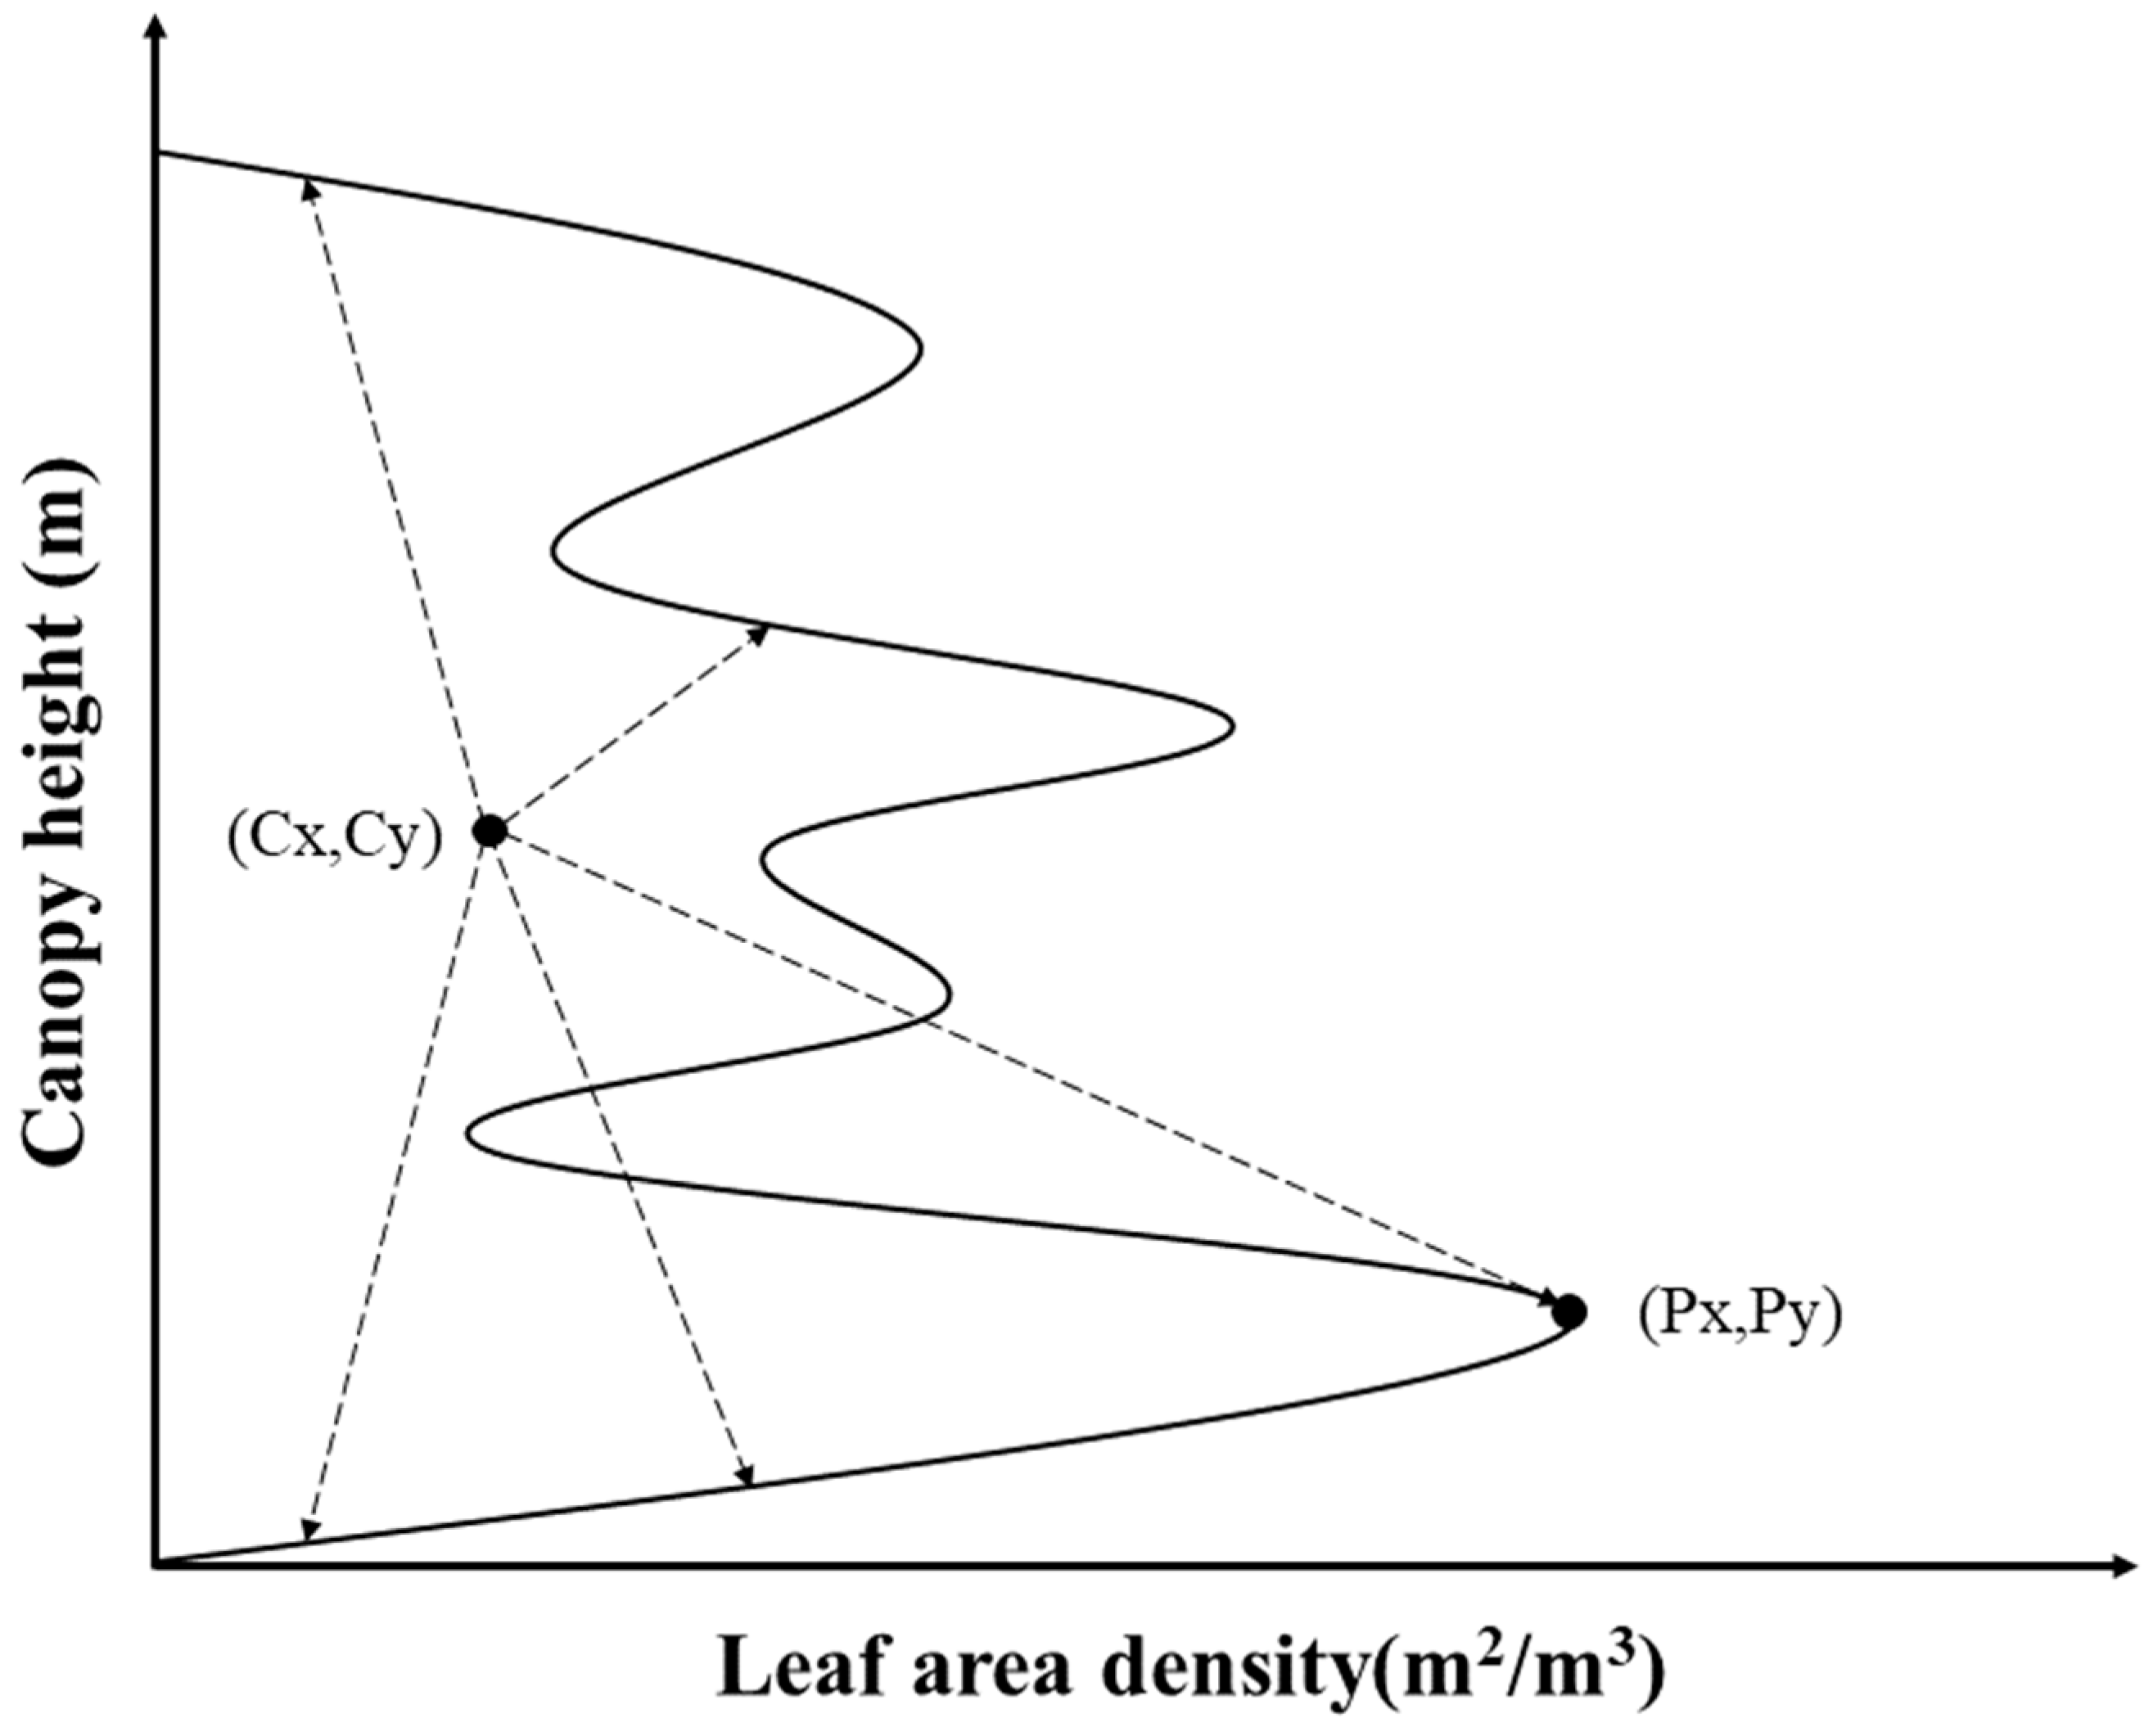
Gu et al. (2018) [22] analyzed the potential of 21 LiDAR metrics from the LVIS (land vegetation and ice sensor) system to differentiate and quantify TDF successions and proved that some of these metrics were significantly different between successional stages (Table 2). Using the shape of the leaf area density profile, we calculated seven metrics for each plot along the cross-section: x coordinate of the centroid (Cx), y coordinate of the centroid (Cy), the radius of gyration (RG), the x coordinate of the maximum waveform amplitude (Px); and the y coordinate of the maximum waveform amplitude (Py); the maximum tree height (Hmax); the leaf area index (LAI) (Figure 4). We also conducted the univariate analysis of variance (ANOVA) to describe the effect of the successional stages on LiDAR metrics and forest structure parameters.
We paid particular attention to shape-based metrics, including centroid components (C) and the radius of gyration (RG), to understand how the vertical profile changes along the transition. C represents the centroid and is also called the center for mass in physics, which could be visualized as “the balance point” of the waveform [34]. It is feasible to detect the waveform’s shape and distribution relative to the ground in the LAD profile through C. RG is the root mean square of the sum of distances for all points, which would fluctuate with the relative area of each peak in the waveform’s modality. RG allows an understanding of how the waveform is distributed around its centroid. This permits the use of the waveform’s shape better than just the centroid itself. RG can be visualized as the relationship between the total length of the vertical profile and its shape and position [34], which could be expressed as:
R G = x i C x 2 + y i C y 2 n
These three shape-based metrics were mainly used in LiDAR waveforms to describe the motion of objects and the manner in which material is distributed around an axis [34]. Apart from these, we also proposed to derive Px and Py (x and y coordinates of the maximum waveform amplitude, respectively) to capture waveform distribution features.

3. Results

3.1. Transitions

Figure 5 shows that intermediate and late successions (denoted in blue and rose, respectively) account for a large percentage of forest patches at the SRNP-EMSS, whereas only small areas of early succession are present (yellow parts) (Figure 3 and Figure 5). As a result, transition II (from intermediate to late successions) dominates the entire study area. Thus, apart from small areas representing transition I (from early to intermediate successions), most transitions belong to type II. On the other hand, because of abundant species diversity, more considerable variability in canopy openness and significant differences in species composition are shown in intermediate and late successional stages [44]. Therefore, the subsequent study will focus specifically on transition II.

3.2. Changes in Canopy Height across Transitions

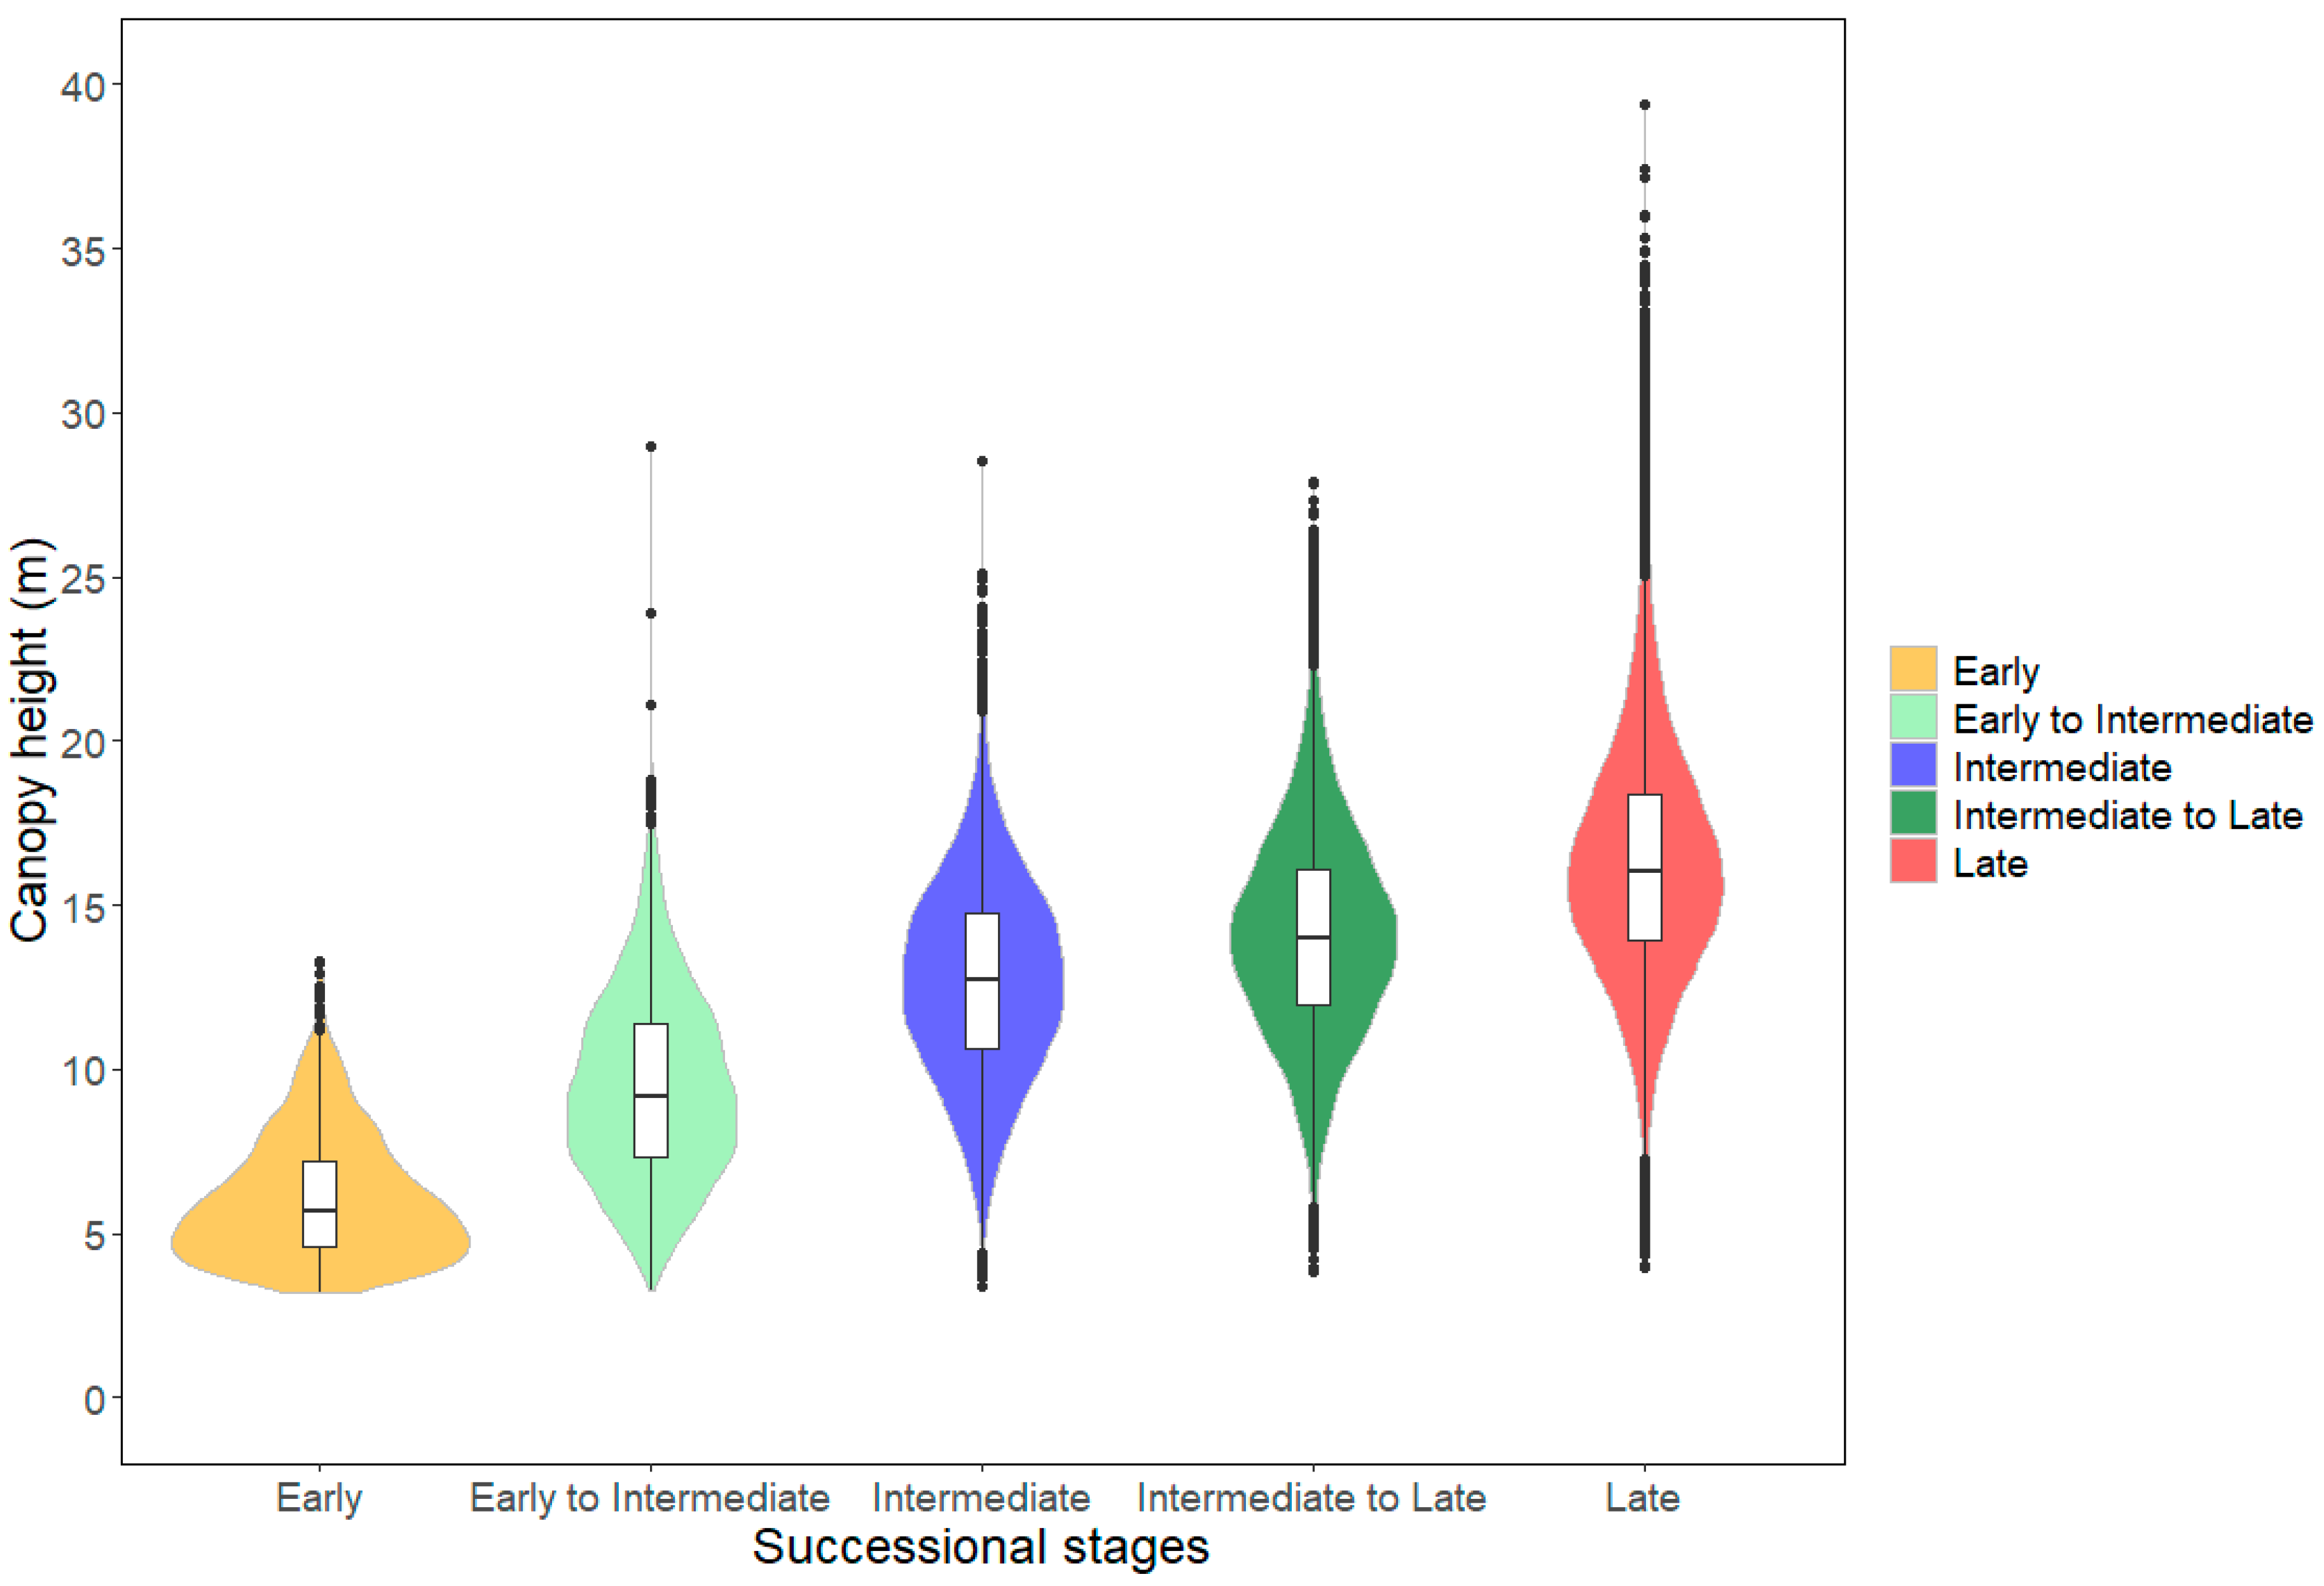
An overall view of the canopy height range distribution of the CHM over the three successional stages and two transitions (Figure 6) shows a straightforward continuous process, with the canopy heights increasing along the succession based on individual tree segmentation. More specifically, the average canopy height in the early successional stage is nearly 6 m, while that of the intermediate and the late successional stages are 12 and 16 m, respectively. The canopy height range of transition I and transition II is mainly distributed between 7 to 12 m and 13 to 16 m, respectively. The late successional stage and transition II show higher values of standard deviation for canopy height in comparison with the early succession and transition I stages (Table 3). The ANOVA results (Table 3) indicate that canopy height and successional gradients are statistically different, and those differences are significant (F(4,80495) = 8329.7; p < 0.05).
More detailed within some random areas (instead of all forest patches for each entire stage), Figure 7 shows the change in canopy height along the path of succession from twenty cross-section profiles with a 500 m length, containing four different order combinations over the study area. From the violin plot (Figure 6) and twenty cross-section profiles, we captured a general trend in canopy height along the path of succession: the canopy height increases with the successional stages (Intermediate–Transition II–Late). However, if we capture the canopy height changes through some specific transects, different findings can be shown: a constant change in the canopy height of the three successional stages can be seen in Figure 7g,j,t. In detail, Figure 7g shows the value in transition II is even higher than that of the late; however, the canopy height of the late stage is obviously higher than that of the intermediate stage. On the other hand, some solid ups and downs in the light blue highlight parts (transition II) suggest instability and significant transition features in the successional stage from the intermediate to the late (Figure 7c,e,f,m–o), which is unique compared with other primary successional stages.

3.3. Forest Structure Characteristics across Transitions

The LAD versus canopy height profiles were extracted for the twenty-seven plots along nine cross-sections that have two different successional stages and one transition (i.e., Intermediate stage, Transition II and Late stage). Figure 8 shows the profile waveform variation in plots. The results show that, in general, the plots in the intermediate successional stage are characterized by two peaks: one peak is at the above-ground height of approximately 11 m (Figure 8a), and the other occurs at the elevation of 0.5–1.0 m. In addition, a slightly stratified phenomenon is shown. In contrast, highly stratified plots from the late stage derived a LAD profile with constantly changing LAD values and multiple peaks occurring at 0–5 m, 10–15 m and 18–22 m (Figure 8c). On the other hand, similar to the intermediate stage, some plots in transition II also show two peaks feature similar to that of the intermediate stage. The elevation of the first peak increases slightly to 10–15 m (Figure 8b), and the other is still at 0.5–1 m; however, other plots show a moderate but not strongly stratified trend, which shows the waveform distribution is becoming more irregular compared with the intermediate stage.
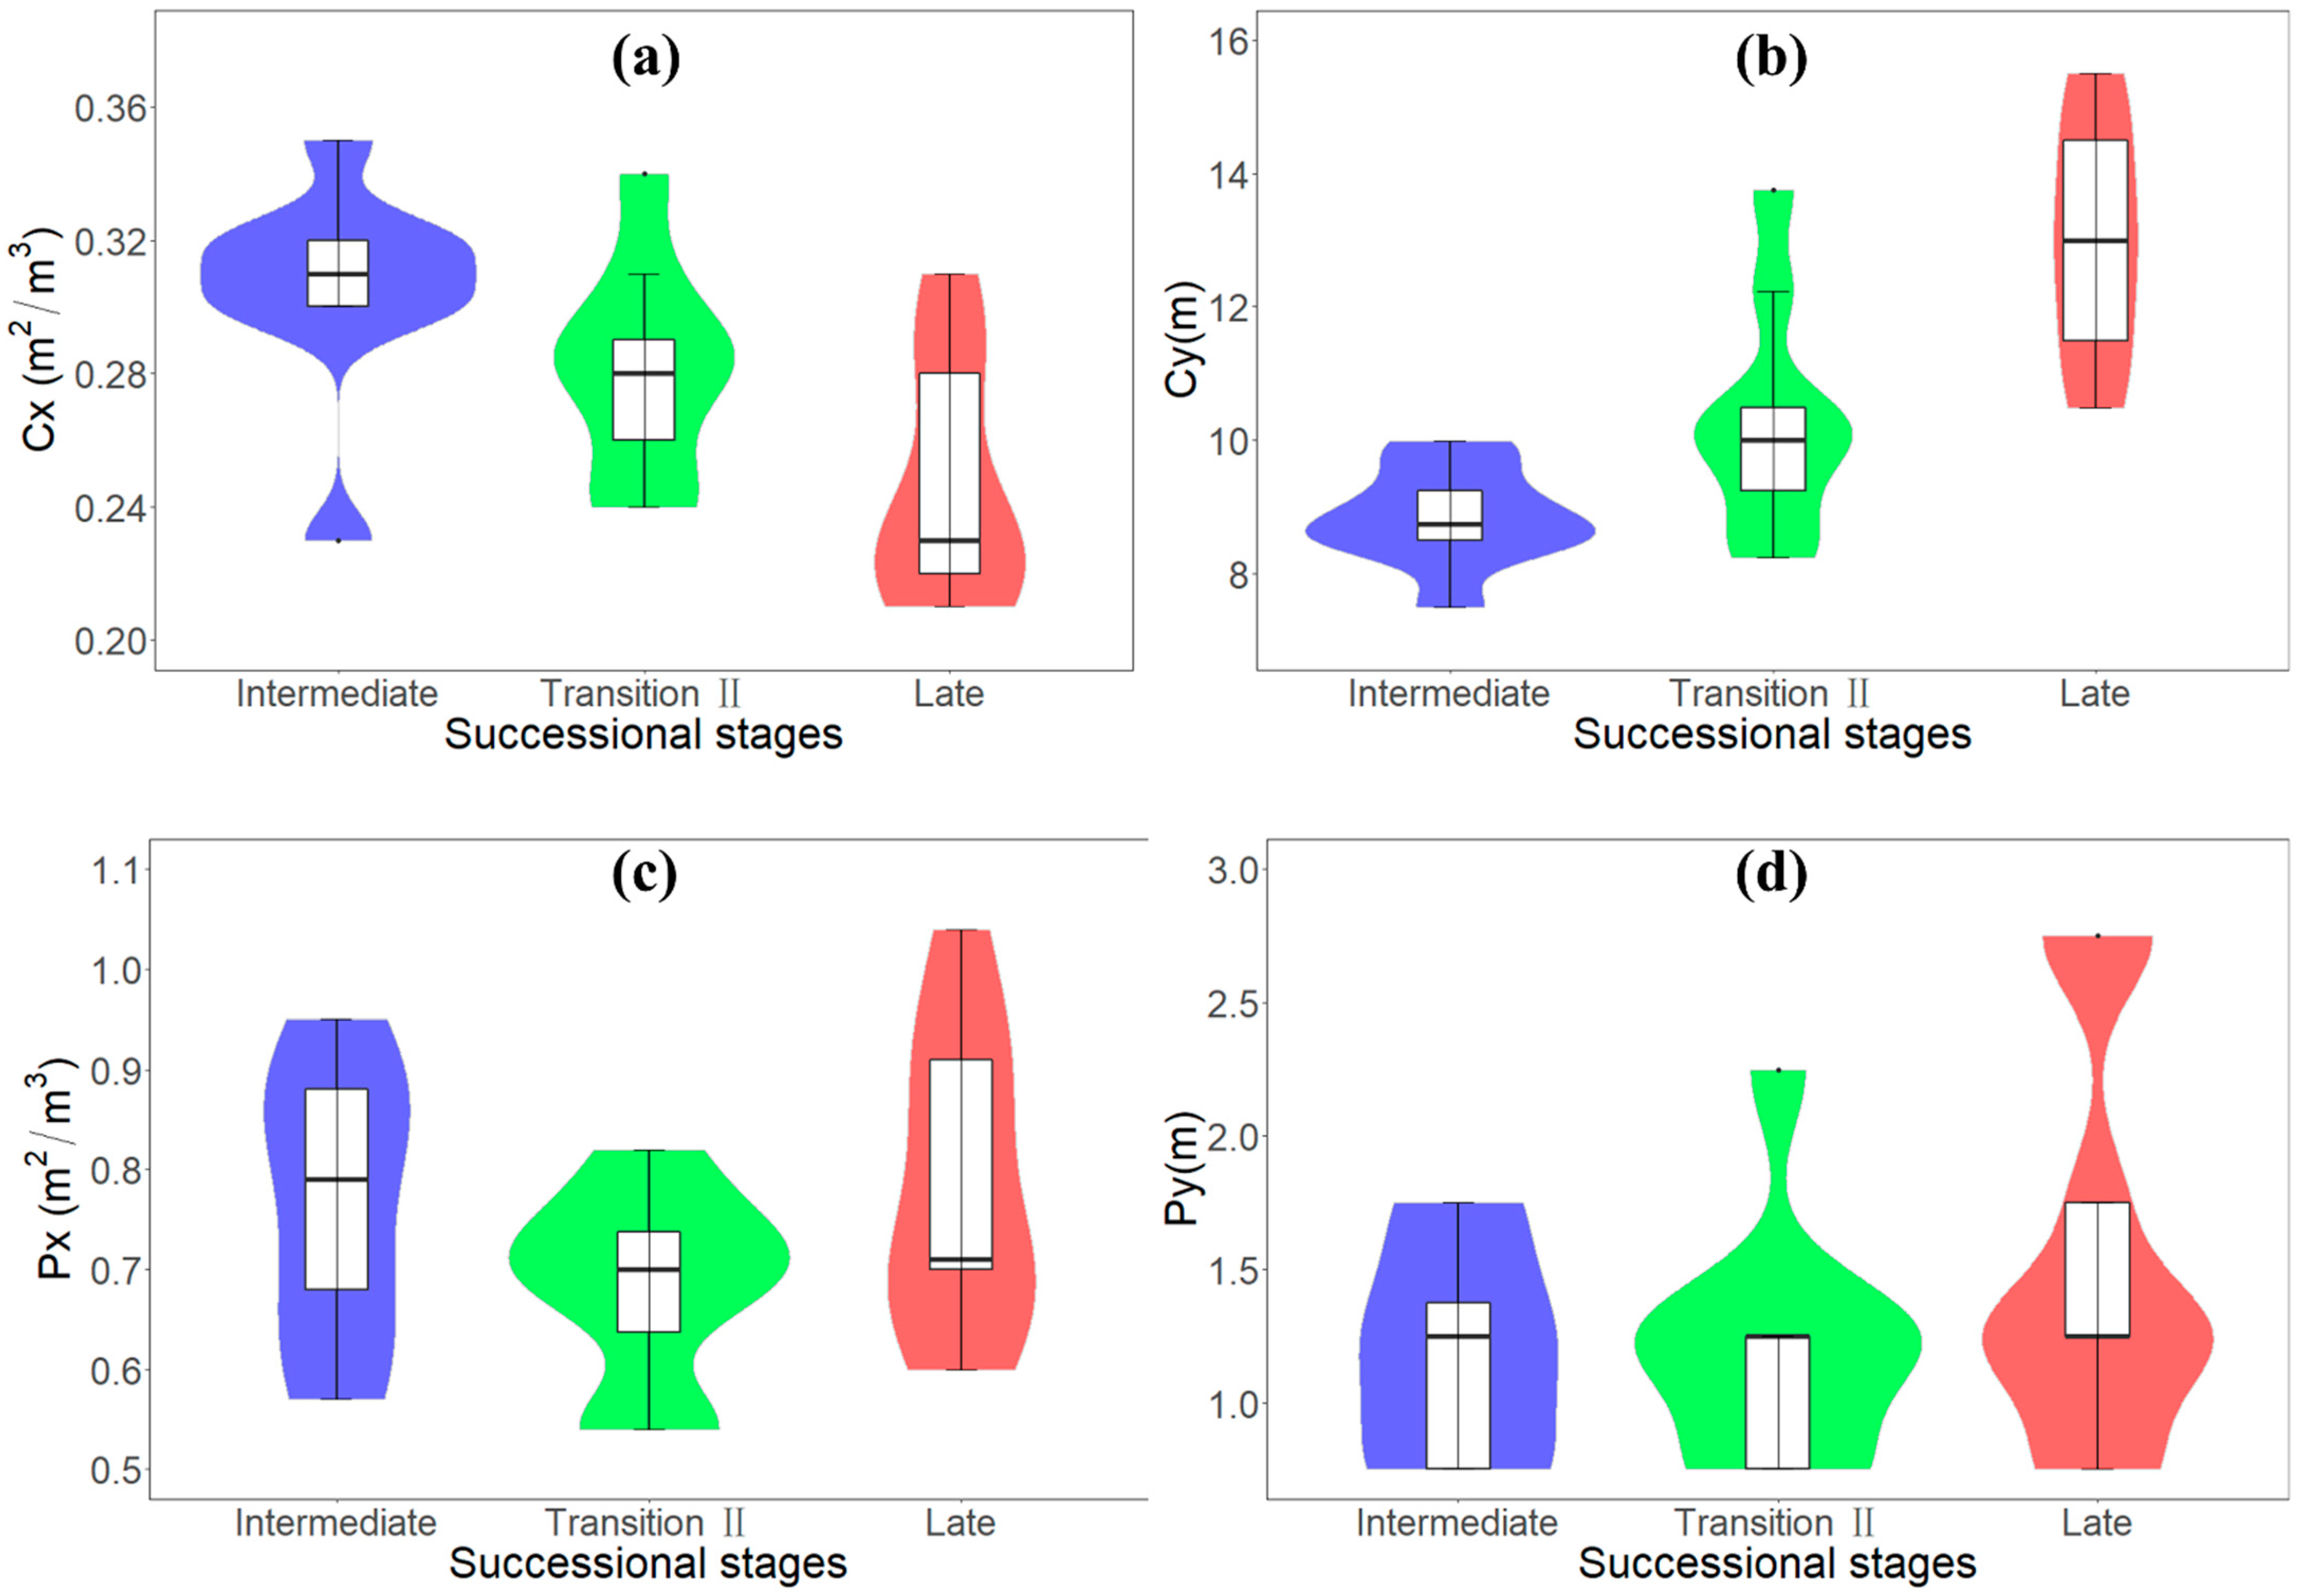
Using the LAD profiles, five LiDAR metrics (Cx, Cy, RG, Px and Py) and two forest structure parameters (Hmax and LAI) were derived (Table 4 and Figure 9). Three shape-based LiDAR metrics (Cx, Cy and RG) significantly differentiated between successional stages (p < 0.05). At the same time, Px and Py do not show significant differences for various successional stages (p1 = 0.09 > 0.05, p2 = 0.72 > 0.05). Moreover, the intermediate successional plots showed higher values of leaf area density (0.31) than transition II (0.28) and late plots (0.25). In contrast, the values of Cy and Hmax increase with the three successional stages: from 8.69 to 10.30 (intermediate stage to transition II) to 13.00 (transition II to late stage) and from 17.47 to 20.36 (intermediate stage to transition II) to 25.75 (transition II to late stage), respectively. However, a fluctuation in Cy and Hmax of transition II and the late stage was shown through the higher standard deviation value compared to the intermediate successional stage. Similarly, plots associated with transition II and the late successional stage yielded an RG value with a more significant standard deviation (Table 4). The results also suggest that there is an increase in the leaf area index (LAI) with the successional gradient. This is most likely because of the growth of vegetation and a higher abundance of mixed species along the successional gradient from early to late: the highest LAI values are associated with the late successional stage (LAI = 12.61), the lowest with the intermediate successional stage (LAI = 10.79), and moderate with transition II (LAI = 11.47).

4. Discussion

Previous traditional approaches used to detect the succession of secondary TDFs have followed deterministic strategies that define sharp boundaries between different successional stages. More recent studies by Li et al. [35] linked canopy height range to successional stages (i.e., 0 to 7 m, 7.1 to 13.7 m and 13.71 to 35 m for early, intermediate, and late successional stages, respectively). Their strategy was to define forest successional stages based on empirical canopy height ranges extracted from LVIS data [21] and field data [13]. Nevertheless, the authors sort of stopped trying to find the relationship between the canopy heights and two transitions. Uncertainties between existing transitions and different successional stages were ignored. In this study, we considered the regrowth process of secondary TDFs as a continuous stochastic phenomenon [35]. We first identified three successional stages at the SRNP-EMSS based on the forest age and then defined the buffer areas of these stages as transition zones. These are important because differences in species composition, photosynthetic active radiation (PAR), and forest structure manifest themselves in transitions, which also affect the soil moisture conditions and micro-climate [2,13]. According to our results, after decades of regrowth, few forest patches currently exist in the early stage or transition I stage at the SRNP-EMSS up to 2021 (Figure 3, Table 3). As expected, the median canopy height shows a positive trend from 6.1 m in the early stage to 12.68 m in the intermediate stage to 16.3 m in the late stage (Table 3). This result can be validated by the study area’s inventory data by Kalacska et al. (2007) [2]. The intermediate, transition II and the late stage have higher standard deviations of canopy heights because of complex multi-layers of vegetation, such as mature trees, deciduous species of woody plants (with the existence of lianas), shrubs etc.
Within a forest patch, all vegetation, including canopy, understory, and shrubs, compete for sunlight and water or nutrition from the soil, which leads to variable tree heights within the same stage. The other factor might be the presence of lianas, especially in intermediate, transition II and late successional stages. Although lianas account for a small percentage (less than 10%) of the above-ground biomass in tropical forests, they represent a large proportion (up to 40%) of leaf productivity [45,46,47,48]. Some forest structures, such as canopy height and plant area, can essentially decrease with liana infestation [12] because lianas and host trees also compete for available above- and under-ground resources, which include incoming solar radiation (above-ground) and nutrition (under-ground) in forest stands [49]. For instance, a liana-infested plot had more irregular canopies with heights from 10 to 20 m, whereas the surrounding forest patches had significantly taller canopies from 25 to 35 m (Figure 7c). Even in Figure 7j,k,r,t, there are no apparent changes in canopy height with successions. This may be explained by the lianas infestation.
According to Li et al. (2017) [35] and Sanchez et al. (2017) [12], we carefully selected 27 plots, including 9 intermediate, 9 transition and 9 late successional stage sites along the successional path. Forest structure characteristics for mid-canopy and understory were identified from full-waveform LiDAR data and metrics derived from the LAD profile waveform. In particular, the waveform information is sensitive to changes in structural attributes along the path of succession due to the vertical distribution of biomass in varying successional stages [21]. The intermediate successional stage with monotonous vegetation structures is characterized by shorter trees and relatively sparser shrubs than transition II and late successional stages, which leads to two distinct peaks on the vertical profile (Figure 8a). One is caused by the single strata of sparse canopy crowns at an elevation of 8–12 m, while the other is at 0.5–2 m due to pastures or shrubs. Within forest regeneration plots, mixed species, including higher canopy, abundant understory, and even dense shrubs, dominate the forest patches in the late successional stage, leading to more vertical layers (Figure 8c). Nonetheless, in the case of transition II, the waveform distribution shows moderate changes when compared to the characteristics from the intermediate and late successional stages. In some plots, the apparent “two peaks” feature could still be seen because of the existence of a dense canopy and sparse understory, similar to that of the intermediate stage. There was a noticeable increase in the elevation of the upper canopy peak in transition II when compared to the intermediate stage, though. In addition, more plots in transition II show a relatively smooth waveform change (i.e., noticeable but not strongly stratified) caused by a higher abundance of vertical layers and biomass. A recent study [50] demonstrated that the intermediate stage has a higher growth rate than the late successional stage, which could be interpreted as a change in the species composition and vegetation density in transition I and II.
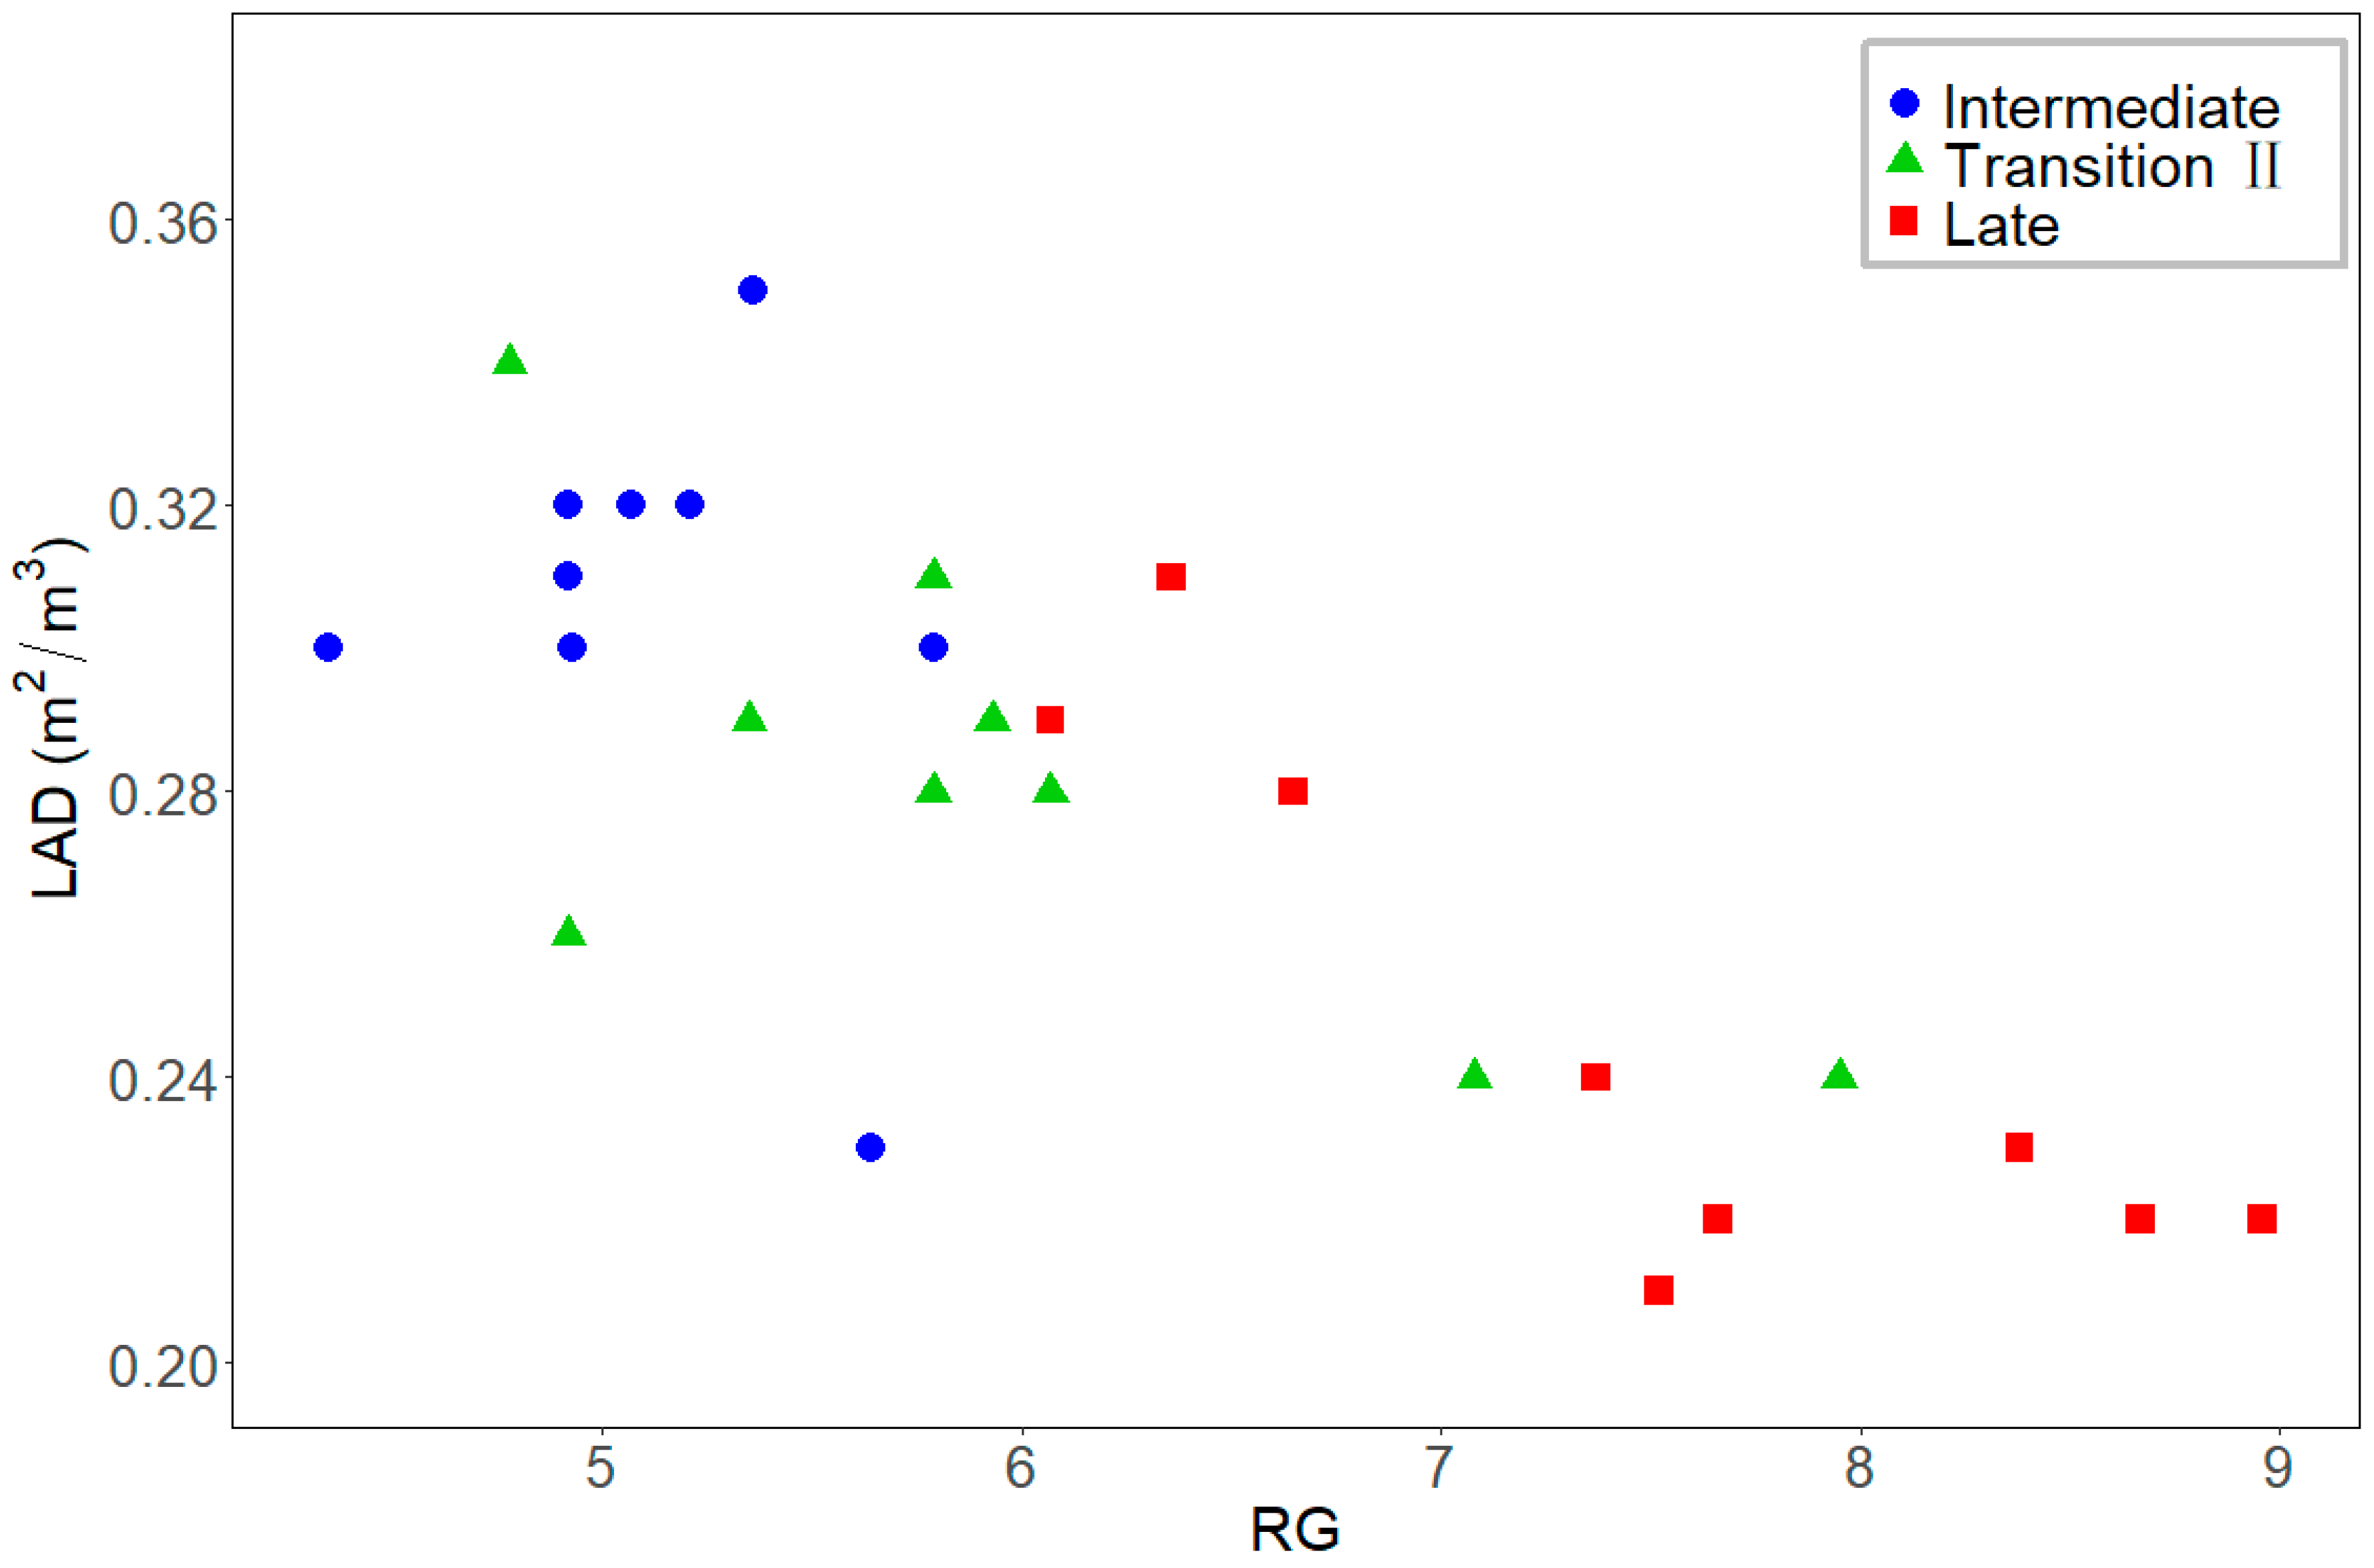
Regarding the comparison of metrics derived from the vertical profile, several forest structure parameters, such as Cy, Hmax, LAI, and biomass, had statistically significant differences along the successional gradients (Table 4 and Figure 9b); in contrast, there are no such differences in Px and Py with successional gradients (Table 4 and Figure 9c,d). The reasonable explanation for this is that almost all forest patches in the intermediate, transition II and late successional stages at the SRNP-EMSS are covered by dense shrubs, tall grasses, or short trees, leading to the corresponding maximum peak in the vertical profile of all three successional stages. The value of Px is affected by LAI as a function of understory components (pastures, shrubs, and lianas) along the successional trajectory of a TDF so that the increasing trend could be seen from intermediate, transition II to late successional stages. The standard deviations of these metrics reflect variations in the waveform distribution along the different successional stages (Table 4). Cx is moving to the left in the LAD profile along the successional path (Intermediate–Transition II–Late); this can be explained as most lianas put on leaves leading to overestimating LAD. Furthermore, the intermediate stage is infested by lianas most seriously, and lianas abundance decreases from the intermediate to the late stage. This is because canopy gaps decrease from the intermediate to the late stage, leading to the lack of sunlight. As a result, more lianas are killed in transition II and the late stage. Therefore, the value of LAD decreases with succession. In addition, as mentioned above, the variation in canopy height within one successional stage due to lianas tangles will cause a higher standard deviation for Cy, especially for transition II and the late successional stages. In addition, the transition II and the late stages create more heterogeneous space compared to the intermediate stage, which is captured by the variability in RG (Figure 10). The higher value of RG, reflected as an irregular waveform distribution in vertical profiles, may be interpreted as resulting from heterogeneity in the forest, unevenly aged trees, and mixed species. A clear distinction between the intermediate and late successional stages can be seen in Figure 10, which links the RG metric to the LAD metric. However, plots in transition II show a prominent transition feature, which spreads among the intermediate and late stages. We also can see that a few green triangles are much further away from others (Figure 10), which might be caused by misclassification from the forest cover map. There were statistically significant changes in shape-based metrics (centroid and RG), and thus, these metrics can significantly differentiate successional stages. This highlights the importance of taking advantage of the overall vertical structures of forests in identifying the succession of TDFs. It also highlights how the process of ecological succession is a combination of transitional forest types along a stochastic path instead of one that is deterministic.
It is worth mentioning that the smoothing involved in the derivation of raster products may have influenced the ability to distinguish between successional stages. Smoothing effects may mute emergent species signals, which are often present in late-stage successional forests. Further, in tropical forests and especially tropical dry forests, one must consider the effects of lianas on the forest structure [51]. In some cases, trees infested by liana tangles probably never evolve into the following successional gradient, although they are getting older. This, however, is beyond the original scope of the study. One potential issue identified in this study is that the forest cover map [23] is based on LVIS data acquired in 2005, whereas the Stereocarto full-waveform LiDAR was acquired in 2021. Forests are dynamic and likely to change dramatically over 16 years, but they were changing together. In other words, the sequence of succession did not change. In the case of our study, the 2005 data (the forest cover map) were simply used to locate regions of interest (transitions). Once the known transition regions were identified, the 2021 data (Stereocarto full-waveform LiDAR data) were used to confirm their unique structure. In doing so, we have successfully shown that transitions have and maintain their unique structural identity as transitions between the established successional stages.

5. Conclusions

This study characterized the inter-successional stages (transitions) of a tropical dry forest at the Santa Rosa National Park, Guanacaste, Costa Rica, using full-waveform airborne LiDAR data. Our work highlights (1) the potential of the LiDAR technique in studying the succession of TDFs; (2) that the process of ecological succession is a combination of transitional forest types along a stochastic path instead of deterministic in nature as discussed before; (3) that forest structures of transitions show interesting variations vertically and horizontally with that of principal successional stages along the successional gradient; (4) that shape-based metrics can successfully capture the variability of the different waveform distribution, which is expected to change with the vertical structure. We proposed unique characteristics and the ecological significance of transitions, specifically transition II (from intermediate to late successional stages). Although our study is limited to one single site in Costa Rica, this is the first step to exploring and understanding forest structure characteristics of inter-successional stages or transitions in TDFs.

Author Contributions

M.D. and A.S.-A. presented and designed the experiments; M.D. carried out the experiments, analyzed the data, and wrote the manuscript; N.M. (Nelson Mattie) helped with Stereocarto LiDAR data normalization; C.B., K.L., N.M. (Nooshin Mashhadi), N.M. (Nelson Mattie) and A.S.-A. contributed to reviewing and editing; A.S.-A. also made contributions to supervising. All authors have read and agreed to the published version of the manuscript.

Funding

This research was funded by the National Science and Engineering Research Council of Canada (NSERC) Discovery Grant.

Data Availability Statement

The data presented in this study are available on request from the corresponding author.

Acknowledgments

We thank the Centre for Earth Observation Sciences (CEOS), University of Alberta, for providing data processing workstation. We also thank Michael Hesketh for his coordination and support in the lab.

Conflicts of Interest

The authors declare no conflict of interest.

References

  1. Sánchez-Azofeifa, G.A.; Quesada, M.; Rodríguez, J.P.; Jafet, M.; Stoner, K.E.; Castillo, A.; Garvin, T.; Zent, E.L.; Calvo-Alvarado, J.C.; Kalacska, M.E.R.; et al. Research Priorities for Neotropical Dry Forests. Biotropica 2005, 37, 477–485. [Google Scholar]
  2. Kalacska, M.; Sanchez-Azofeifa, G.A.; Rivard, B.; Caelli, T. Ecological Fingerprinting of Ecosystem Succession: Estimating Secondary Tropical Dry Forest Structure and Diversity Using Imaging Spectroscopy. Remote Sens. Environ. 2007, 108, 82–96. [Google Scholar] [CrossRef]
  3. Novotný, J.; Navrátilová, B.; Janoutová, R.; Oulehle, F.; Homolová, L. Influence of Site-Specific Conditions on Estimation of Forest above Ground Biomass from Airborne Laser Scanning. Forests 2020, 11, 268. [Google Scholar] [CrossRef] [Green Version]
  4. Cao, S.; Yu, Q.; Sanchez-Azofeifa, A.; Feng, J.; Rivard, B.; Gu, Z. Mapping Tropical Dry Forest Succession Using Multiple Criteria Spectral Mixture Analysis. ISPRS J. Photogramm. Remote Sens. 2015, 109, 17–29. [Google Scholar] [CrossRef]
  5. Calvo-Rodriguez, S.; Sanchez-Azofeifa, A.G.; Duran, S.M.; Espírito-Santo, M.M. Assessing Ecosystem Services in Neotropical Dry Forests: A Systematic Review. Environ. Conserv. 2016, 44, 34–43. [Google Scholar] [CrossRef]
  6. Hoekstra, J.M.; Boucher, T.M.; Ricketts, T.H.; Roberts, C. Confronting a Biome Crisis: Global Disparities of Habitat Loss and Protection. Ecol. Lett. 2005, 8, 23–29. [Google Scholar] [CrossRef]
  7. Portillo-Quintero, C.A.; Sánchez-Azofeifa, G.A. Extent and Conservation of Tropical Dry Forests in the Americas. Biol. Conserv. 2010, 143, 144–155. [Google Scholar] [CrossRef]
  8. Janzen, D.H. The Future of Tropical Ecology. For. Ecol. Manag. 1986, 17, 305–324. [Google Scholar] [CrossRef]
  9. Martínez-Garza, C.; González-Montagut, R. Seed Rain from Forest Fragments into Tropical Pastures in Los Tuxtlas, Mexico. Plant Ecol. 1999, 145, 255–265. [Google Scholar] [CrossRef]
  10. Burrough, P.A. GIS and Geostatistics: Essential Partners for Spatial Analysis. Environ. Ecol. Stat. 2001, 8, 361–377. [Google Scholar] [CrossRef]
  11. Quesada, M.; Sanchez-Azofeifa, G.A.; Alvarez-Añorve, M.; Stoner, K.E.; Avila-Cabadilla, L.; Calvo-Alvarado, J.; Castillo, A.; Espírito-Santo, M.M.; Fagundes, M.; Fernandes, G.W.; et al. Succession and Management of Tropical Dry Forests in the Americas: Review and New Perspectives. For. Ecol. Manag. 2009, 258, 1014–1024. [Google Scholar] [CrossRef]
  12. Sánchez-Azofeifa, G.A.; Guzmán-Quesada, J.A.; Vega-Araya, M.; Campos-Vargas, C.; Durán, S.M.; D’Souza, N.; Gianoli, T.; Portillo-Quintero, C.; Sharp, I. Can Terrestrial Laser Scanners (TLSs) and Hemispherical Photographs Predict Tropical Dry Forest Succession with Liana Abundance? Biogeosciences 2017, 14, 977–988. [Google Scholar] [CrossRef] [Green Version]
  13. Kalacska, M.; Sanchez-Azofeifa, G.A.; Calvo-Alvarado, J.C.; Quesada, M.; Rivard, B.; Janzen, D.H. Species Composition, Similarity and Diversity in Three Successional Stages of a Seasonally Dry Tropical Forest. For. Ecol. Manag. 2004, 200, 227–247. [Google Scholar] [CrossRef]
  14. Kalácska, M.; Calvo-Alvarado, J.C.; Sánchez-Azofeifa, G.A. Calibration and Assessment of Seasonal Changes in Leaf Area Index of a Tropical Dry Forest in Different Stages of Succession. Tree Physiol. 2005, 25, 733–744. [Google Scholar] [CrossRef] [Green Version]
  15. Arroyo-Mora, J.P.; Sánchez-Azofeifa, G.A.; Kalacska, M.; Rivard, B.; Calvo-Alvarado, J.C.; Janzen, D.H. Secondary Forest Detection in a Neotropical Dry Forest Landscape Using Landsat 7 ETM+ and IKONOS Imagery. Biotropica 2005, 37, 497–507. [Google Scholar] [CrossRef]
  16. Kalacska, M.; Member, S.; Sanchez-Azofeifa, G.A.; Caelli, T.; Rivard, B.; Boerlage, B. Using Bayesian Networks. IEEE Trans. Geosci. Remote Sens. 2005, 43, 1866–1873. [Google Scholar] [CrossRef]
  17. Laurance, W.F.; Lovejoy, T.E.; Vasconcelos, H.L.; Bruna, E.M.; Didham, R.K.; Stouffer, P.C.; Gascon, C.; Bierregaard, R.O.; Laurance, S.G.; Sampaio, E. Ecosystem Decay of Amazonian Forest Fragments: A 22-Year Investigation. Ecosyst. Decay Amaz. Fragm. 2002, 16, 605–618. [Google Scholar] [CrossRef] [Green Version]
  18. Manu, S.; Peach, W.; Cresswell, W. The Effects of Edge, Fragment Size and Degree of Isolation on Avian Species Richness in Highly Fragmented Forest in West Africa. Ibis 2007, 149, 287–297. [Google Scholar] [CrossRef]
  19. Portillo-Quintero, C.; Sánchez-Azofeifa, A.; Espírito-Santo, M.M. Edge Influence on Canopy Openness and Understory Microclimate in Two Neotropical Dry Forest Fragments. In Tropical Dry Forests in the Americas; Sanchez-Azofeifa, A., Powers, J.S., Fernandes, G.W., Quesada, M., Eds.; CRC Press: Boca Raton, FL, USA, 2013; pp. 157–172. [Google Scholar]
  20. Castillo-Núñez, M.; Sánchez-Azofeifa, G.A.; Croitoru, A.; Rivard, B.; Calvo-Alvarado, J.; Dubayah, R.O. Delineation of Secondary Succession Mechanisms for Tropical Dry Forests Using LiDAR. Remote Sens. Environ. 2011, 115, 2217–2231. [Google Scholar] [CrossRef]
  21. Castillo, M.; Rivard, B.; Sánchez-Azofeifa, A.; Calvo-Alvarado, J.; Dubayah, R. LIDAR Remote Sensing for Secondary Tropical Dry Forest Identification. Remote Sens. Environ. 2012, 121, 132–143. [Google Scholar] [CrossRef]
  22. Gu, Z.; Cao, S.; Sanchez-Azofeifa, G.A. Using LiDAR Waveform Metrics to Describe and Identify Successional Stages of Tropical Dry Forests. Int. J. Appl. Earth Obs. Geoinf. 2018, 73, 482–492. [Google Scholar] [CrossRef]
  23. Zhao, G.; Sanchez-Azofeifa, A.; Laakso, K.; Sun, C.; Fei, L. Hyperspectral and Full-Waveform LiDAR Improve Mapping of Tropical Dry Forest’s Successional Stages. Remote Sens. 2021, 13, 3830. [Google Scholar] [CrossRef]
  24. Clark, M.L.; Clark, D.B.; Roberts, D.A. Small-Footprint Lidar Estimation of Sub-Canopy Elevation and Tree Height in a Tropical Rain Forest Landscape. Remote Sens. Environ. 2004, 91, 68–89. [Google Scholar] [CrossRef]
  25. Bagaram, M.B.; Giuliarelli, D.; Chirici, G.; Giannetti, F.; Barbati, A. UAV Remote Sensing for Biodiversity Monitoring: Are Forest Canopy Gaps Good Covariates? Remote Sens. 2018, 10, 1397. [Google Scholar] [CrossRef]
  26. Bouvier, M.; Durrieu, S.; Fournier, R.A.; Renaud, J. Remote Sensing of Environment Generalizing Predictive Models of Forest Inventory Attributes Using an Area-Based Approach with Airborne LiDAR Data. Remote Sens. Environ. 2015, 156, 322–334. [Google Scholar] [CrossRef]
  27. Drake, J.B.; Dubayah, R.O.; Clark, D.B.; Knox, R.G.; Blair, J.B.; Hofton, M.A.; Chazdon, R.L.; Weishampel, J.F.; Prince, S.D. Estimation of Tropical Forest Structural Characteristics Using Large-Footprint Lidar. Remote Sens. Environ. 2002, 79, 305–319. [Google Scholar] [CrossRef]
  28. Bottalico, F.; Chirici, G.; Giannini, R.; Mele, S.; Mura, M.; Puxeddu, M.; Mcroberts, R.E.; Valbuena, R.; Travaglini, D. Modeling Mediterranean Forest Structure Using Airborne Laser Scanning Data. Int. J. Appl. Earth Obs. Geoinf. 2017, 57, 145–153. [Google Scholar] [CrossRef]
  29. Ruiz, L.A.; Hermosilla, T.; Mauro, F.; Godino, M. Analysis of the Influence of Plot Size and LiDAR Density on Forest Structure Attribute Estimates. Forests 2014, 5, 936–951. [Google Scholar] [CrossRef] [Green Version]
  30. Crespo-Peremarch, P.; Ángel, L.; Balaguer-Beser, Á.; Estornell, J.; Cartography, G.; Sensing, R.; Cgat, G.; De València, U.P.; De Vera, C. Analyzing the Role of Pulse Density and Voxelization Parameters on Full-Waveform LiDAR-Derived Metrics. ISPRS J. Photogramm. Remote Sens. 2018, 146, 453–464. [Google Scholar] [CrossRef]
  31. Leafsky, M.A.; Cohen, W.B.; Parker, G.G.; Harding, D.J. Lidar Remote Sensing for Ecosystem Studies. Bioscience 2002, 52, 19–30. [Google Scholar] [CrossRef]
  32. Crespo-Peremarch, P.; Fournier, R.A.; Nguyen, V.T.; van Lier, O.R.; Ruiz, L.Á. A Comparative Assessment of the Vertical Distribution of Forest Components Using Full-Waveform Airborne, Discrete Airborne and Discrete Terrestrial Laser Scanning Data. For. Ecol. Manag. 2020, 473, 118268. [Google Scholar] [CrossRef]
  33. Chaulagain, S.; Stone, M.C.; Dombroski, D.; Gillihan, T.; Chen, L.; Zhang, S. An Investigation into Remote Sensing Techniques and Field Observations to Model Hydraulic Roughness from Riparian Vegetation. River Res. Appl. 2022, 38, 1730–1745. [Google Scholar] [CrossRef]
  34. Muss, J.D.; Aguilar-Amuchastegui, N.; Mladenoff, D.J.; Henebry, G.M. Analysis of Waveform Lidar Data Using Shape-Based Metrics. IEEE Geosci. Remote Sens. Lett. 2013, 10, 106–110. [Google Scholar] [CrossRef]
  35. Li, W.; Cao, S.; Campos-Vargas, C.; Sanchez-Azofeifa, A. Identifying Tropical Dry Forests Extent and Succession via the Use of Machine Learning Techniques. Int. J. Appl. Earth Obs. Geoinf. 2017, 63, 196–205. [Google Scholar] [CrossRef]
  36. Zhang, W.; Qi, J.; Wan, P.; Wang, H.; Xie, D.; Wang, X.; Yan, G. An Easy-to-Use Airborne LiDAR Data Filtering Method Based on Cloth Simulation. Remote Sens. 2016, 8, 501. [Google Scholar] [CrossRef]
  37. Isenburg, M.; Liu, Y.; Shewchuk, J.; Snoeyink, J.; Thirion, T. Generating Raster DEM from Mass Points via TIN Streaming. In Geographic Information Science. GIScience 2006; Lecture Notes in Computer Science; Springer: Berlin/Heidelberg, Germany, 2006; Volume 4197, pp. 186–198. [Google Scholar] [CrossRef] [Green Version]
  38. Isenburg, M.; Liu, Y.; Shewchuk, J.; Snoeyink, J. Streaming Computation of Delaunay Triangulations. ACM Trans. Graph. 2006, 25, 1049–1056. [Google Scholar] [CrossRef]
  39. Smith, P.R. Bilinear Interpolation of Digital Images. Ultramicroscopy 1981, 6, 201–204. [Google Scholar] [CrossRef]
  40. De Almeida, D.R.A.; Stark, S.C.; Shao, G.; Schietti, J.; Nelson, B.W.; Silva, C.A.; Gorgens, E.B.; Valbuena, R.; Papa, D.d.A.; Brancalion, P.H.S. Optimizing the Remote Detection of Tropical Rainforest Structure with Airborne Lidar: Leaf Area Profile Sensitivity to Pulse Density and Spatial Sampling. Remote Sens. 2019, 11, 92. [Google Scholar] [CrossRef] [Green Version]
  41. Bréda, N.J.J. Ground-Based Measurements of Leaf Area Index: A Review of Methods, Instruments and Current Controversies. J. Exp. Bot. 2003, 54, 2403–2417. [Google Scholar] [CrossRef] [Green Version]
  42. Vose, J.M.; Sullivan, N.H.; Clinton, B.D.; Bolstad, P.V. Vertical Leaf Area Distribution, Light Transmittance, and Application of the Beer-Lambert Law in Four Mature Hardwood Stands in the Southern Appalachians. Can. J. For. Res. 1995, 25, 1036–1043. [Google Scholar] [CrossRef]
  43. Martens, S.N.; Ustin, S.L.; Rousseau, R.A. Estimation of Tree Canopy Leaf Area Index by Gap Fraction Analysis. For. Ecol. Manag. 1993, 61, 91–108. [Google Scholar] [CrossRef]
  44. Calvo-Rodriguez, S.; Sánchez-Azofeifa, G.A.; Durán, S.M.; Do Espírito-Santo, M.M.; Nunes, Y.R.F. Dynamics of Carbon Accumulation in Tropical Dry Forests under Climate Change Extremes. Forests 2021, 12, 106. [Google Scholar] [CrossRef]
  45. Schnitzer, S.A. A Mechanistic Explanation for Global Patterns of Liana Abundance and Distribution. Am. Nat. 2005, 166, 262–276. [Google Scholar] [CrossRef] [PubMed] [Green Version]
  46. Ingwell, L.L.; Joseph Wright, S.; Becklund, K.K.; Hubbell, S.P.; Schnitzer, S.A. The Impact of Lianas on 10 Years of Tree Growth and Mortality on Barro Colorado Island, Panama. J. Ecol. 2010, 98, 879–887. [Google Scholar] [CrossRef] [Green Version]
  47. Rodríguez-Ronderos, M.E.; Bohrer, G.; Sanchez-Azofeifa, A.; Powers, J.S.; Schnitzer, S.A. Contribution of Lianas to Plant Area Index and Canopy Structure in a Panamanian Forest. Ecology 2016, 97, 3271–3277. [Google Scholar] [CrossRef] [PubMed] [Green Version]
  48. Han, T.; Sánchez-Azofeifa, G.A. Extraction of Liana Stems Using Geometric Features from Terrestrial Laser Scanning Point Clouds. Remote Sens. 2022, 18, 4039. [Google Scholar] [CrossRef]
  49. Paul, G.S.; Yavitt, J.B. Tropical Vine Growth and the Effects on Forest Succession: A Review of the Ecology and Management of Tropical Climbing Plants. Bot. Rev. 2011, 77, 11–30. [Google Scholar] [CrossRef]
  50. Cao, S.; Sanchez-Azofeifa, G.A.; Duran, S.M.; Calvo-Rodriguez, S. Estimation of Aboveground Net Primary Productivity in Secondary Tropical Dry Forests Using the Carnegie-Ames-Stanford Approach (CASA) Model. Environ. Res. Lett. 2016, 11, 075004. [Google Scholar] [CrossRef]
  51. Schnitzer, S.A.; Van Der Heijden, G.; Mascaro, J.; Carson, W.P. Lianas in Gaps Reduce Carbon Accumulation in a Tropical Forest. Ecology 2014, 95, 3008–3017. [Google Scholar] [CrossRef]
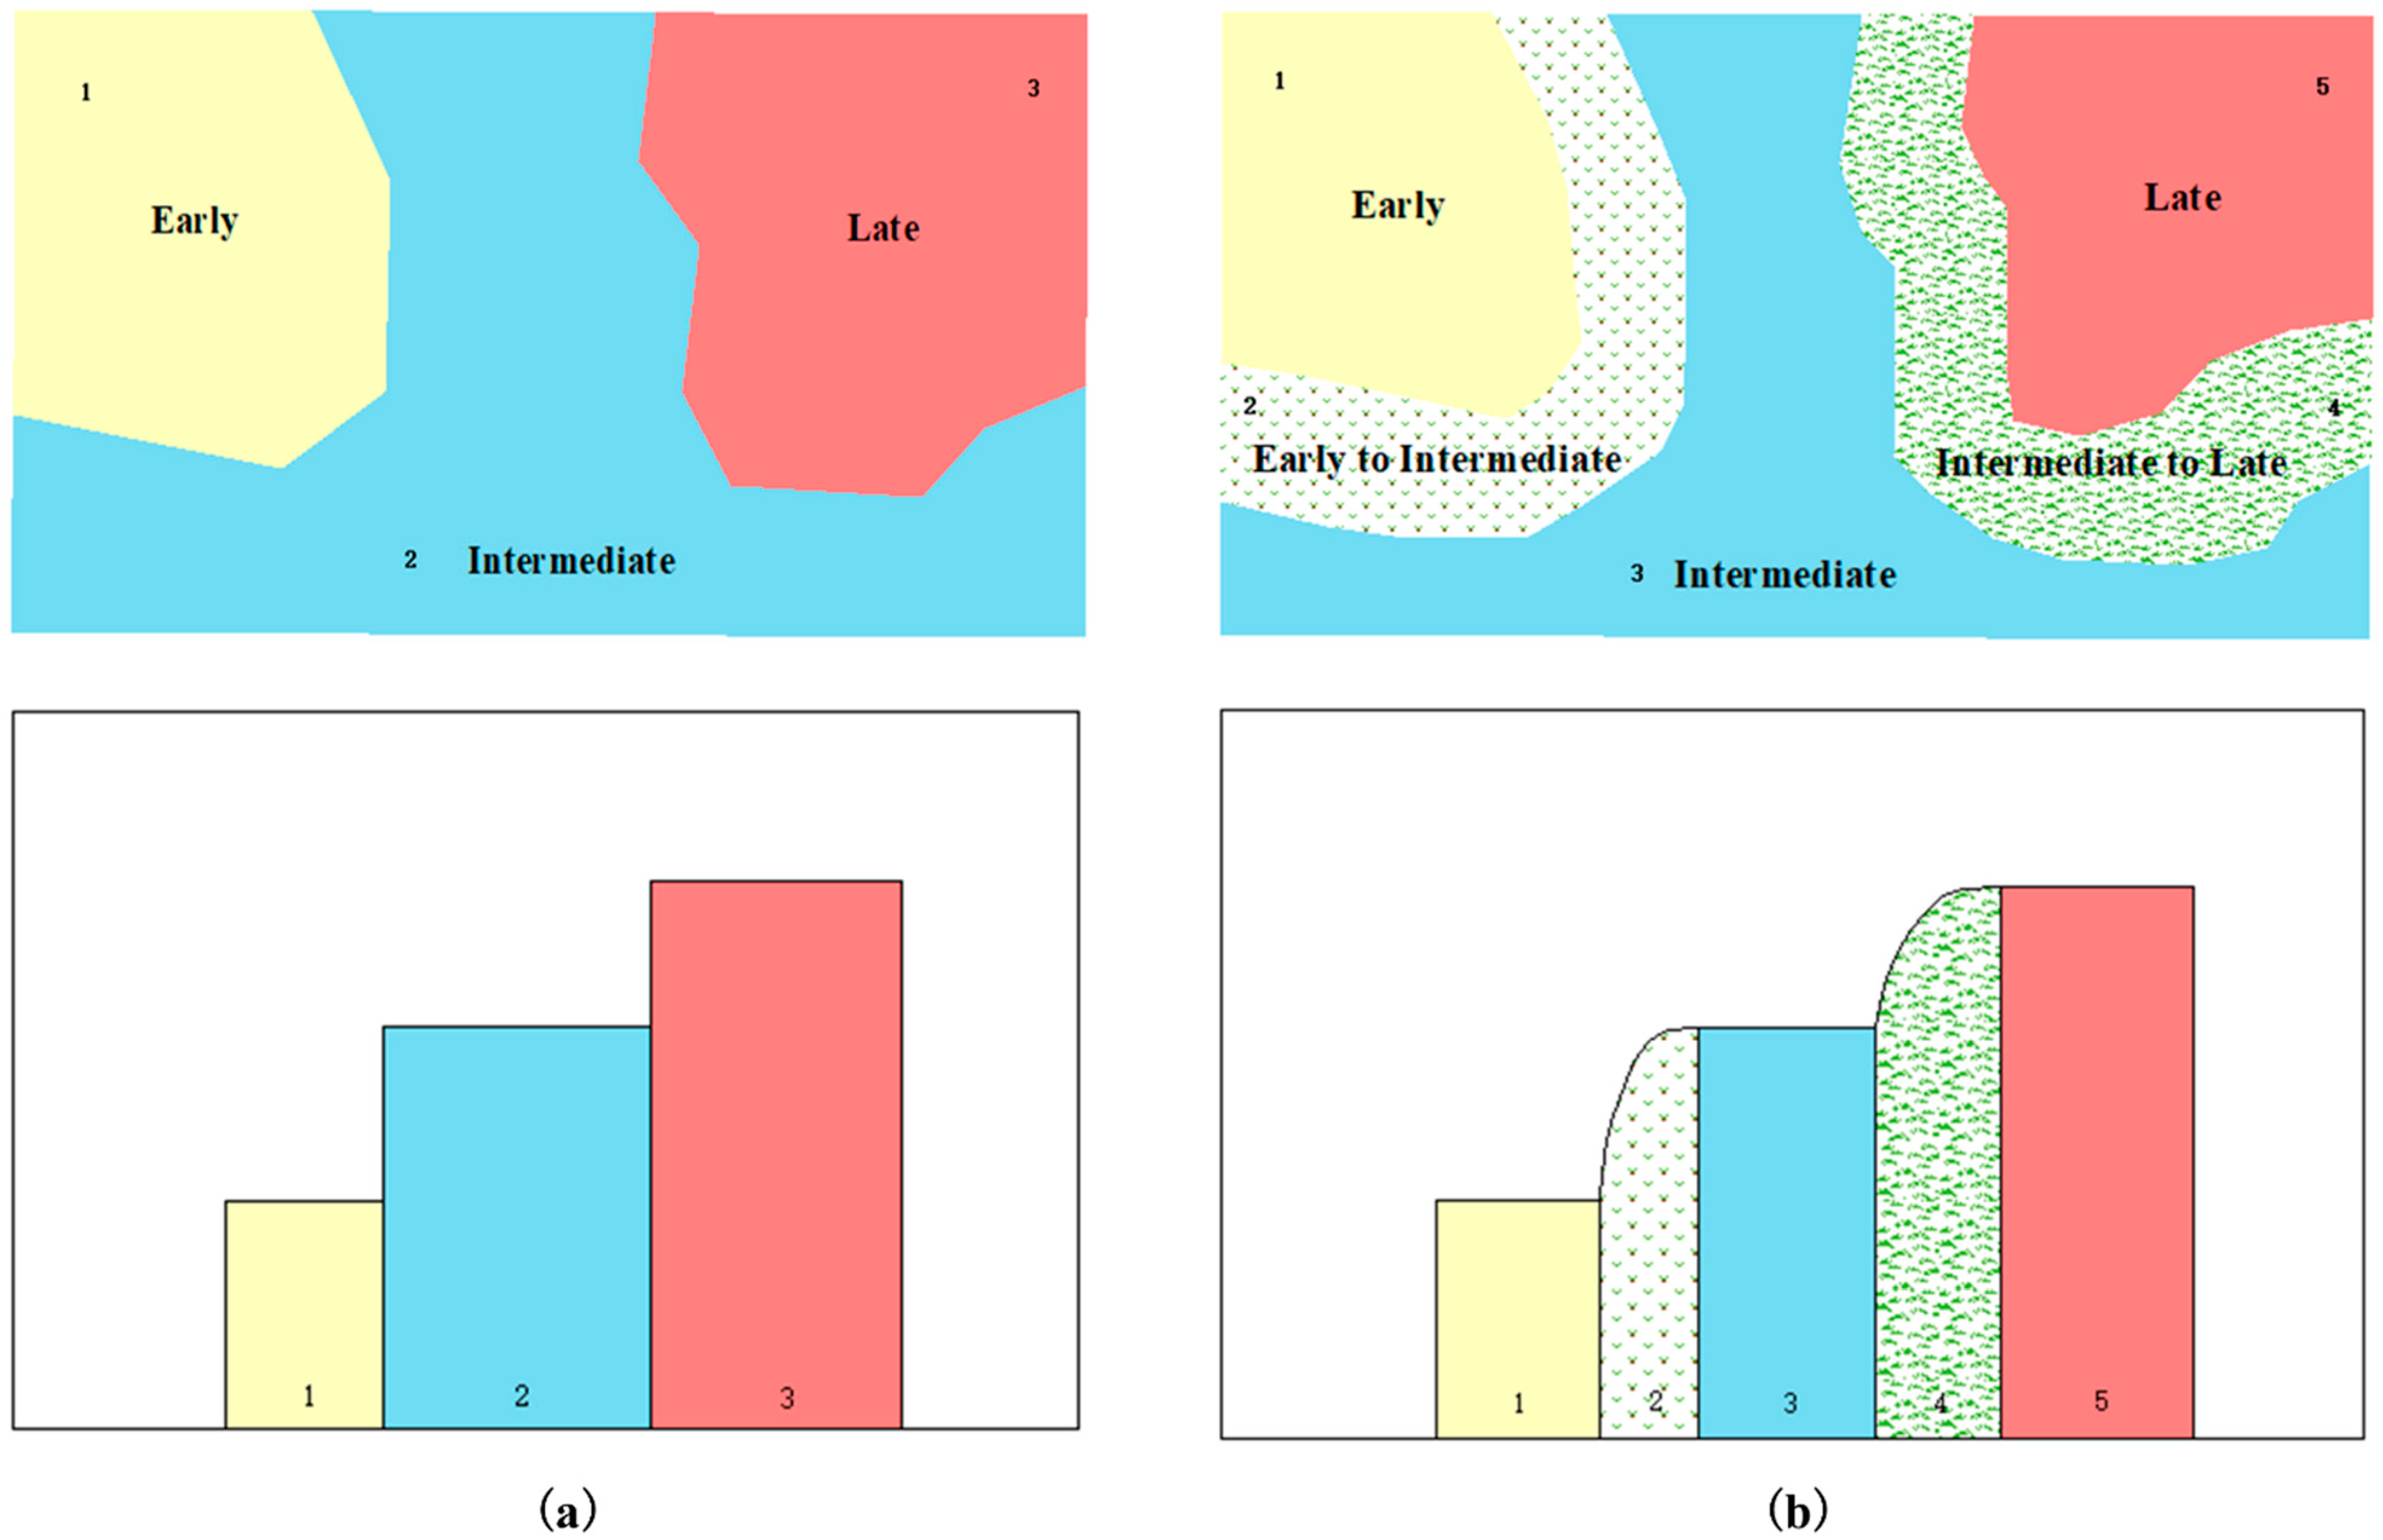
Figure 1. The traditional and refined principles for mapping secondary TDF succession. (a) Traditional definitions assume that different successional stages (1, 2 and 3) have deterministic extents. (b) Approaches considering the presence of transitions (such as 2 and 4) between the principal successional stages 1, 3 and 5.
Remotesensing 15 00479 g001
Figure 2. The study area at the Santa Rosa National Park Environmental Monitoring Super Site (SRNP-EMSS), Guanacaste, Costa Rica (a), the forest cover map from Zhao et al. (2021) [23] generated with LVIS and HyMap data in (b), Riegl Full-waveform Airborne LiDAR data 2021, acquired in SRNP-EMSS (c), the datasets from subfigures (b,c) overlay each other to define the study area.
Remotesensing 15 00479 g002
Figure 3. A canopy height model with a 5 m × 5 m spatial resolution derived from Airborne LiDAR data and the spatial distribution of three successional stages and two transitions at the SRNP-EMSS, Guanacaste, Costa Rica. The range is the overlapping between the forest cover map [23] and full-waveform LiDAR data (Figure 2d). Twenty cross-sections (black lines) of 500 m in length and twenty-seven plots (nine for each successional stage) with an area of 45 m × 45 m along the successional gradient were extracted randomly and evenly over the study area.
Remotesensing 15 00479 g003
Figure 4. The figure describes the centroid (Cx and Cy), the radius of gyration (RG), and the coordinate of maximum waveform amplitude (Px and Py) based on the LAD profile waveform (after Muss et al. [34]).
Remotesensing 15 00479 g004
Figure 5. Transitions were extracted by building a 25 m buffer from the forest age map, which was defined into three principal successional stages according to age [23]. To improve the accuracy and reasonability of transition zone extraction, some forest patches with small areas (<5000 m2 in early, <10,000 m2 in intermediate, and <2000 m2 in late) were dropped (i.e., white dots represent data gaps and strips represent invalid noise). (a,b) are examples and magnifications of a selected transition zone at the SRNP-EMSS, Guanacaste, Costa Rica.
Remotesensing 15 00479 g005
Figure 6. Canopy height variability of successional stages at the SRNP-EMSS, Guanacaste, Costa Rica, derived from a canopy height model (CHM) over Early, Transition I: Early to Intermediate, Intermediate, Transition II: Intermediate to Late, and Late successional stages.
Remotesensing 15 00479 g006
Figure 7. Twenty profiles were derived from randomly selected cross-sections along the path of succession at the SRNP-EMSS (Figure 3). The x-axis is the distance along the profile (i.e., 0–500 m). The y-axis is canopy height in meters (the range: 0–35 m). “I” refers to the intermediate successional stage and “T” refers to transition II (from Intermediate to Late successional stage). (ag) describe the change in canopy height along the Late–Transition II–Intermediate–Transition II–Late; (h) describes the change in canopy height along the Intermediate–Transition II–Late–Transition II–Intermediate; (i,j) describe the change in canopy height along the Intermediate–Transition II–Intermediate; (kt) describe the change in canopy height along the Intermediate–Transition II–Late (all transitions refer to the successional stage from intermediate to late). Transition II is highlighted in light blue. The solid red line represents a fitted smooth change trend.
Remotesensing 15 00479 g007
Figure 8. The vertical LAD profile of the nine plots for the Intermediate (a), Transition II (b), and Late successional stage (c). The solid red line in each subfigure is the average for the corresponding nine waveforms.
Remotesensing 15 00479 g008
Figure 9. Violin plots for the LiDAR metrics (Cx, Cy, Px and Py) distribution along the forest successional gradients (Intermediate–Transition II–Late) from 27 plots at the SRNP-EMSS, Guanacaste, Costa Rica. Cx, the x coordinate of the waveform centroid; Cy, the y coordinate of the waveform centroid; Px, the x coordinate of the maximum waveform amplitude; Py, the y coordinate of the maximum waveform amplitude.
Remotesensing 15 00479 g009
Figure 10. A scatter plot of RG (the radius of gyration) versus LAD (leaf area density) from 27 plots distributed in three successional gradients (Intermediate, Transition II and Late) at the SRNP-EMSS, Guanacaste, Costa Rica.
Remotesensing 15 00479 g010
Table 1. Technical specifications of the flight parameters and sensors of the study. Data were acquired in the SRNP-EMSS on 21 May 2021. Abbreviations: GSD = ground sampling distance, FOV = field of view.
ParametersData
Average flight height over the field (H)500 m
Piper PA-23-250 Azteca D aircraftFlight speed158 km/h
Scanning frequency266,000 points/s
Field Pixel Size (GSD)6.0 cm
Width of stripes488 m
DigiCAM H5D-50FOV60°
Longitudinal overlaps60%
Transverse overlaps50%
RIEGL LMS-Q680iAverage density36 points/m2
Table 2. LiDAR metrics are used to characterize a waveform as a function of the successional stage (after Gu et al. [22]).
TypeMetricsDescription
Point-basedPxx coordinate of the maximum waveform amplitude
ECThe total bin number of the effective waveform
RH50Height at which 50% of the waveform energy occurs
Area-basedAH1e10Total waveform amplitude where the relative height is less than 10 m
AH1015Total waveform amplitude where the relative height is between 10 and 15 m
AH1520Total waveform amplitude where the relative height is between 15 and 20 m
Shape-basedCxThe x coordinate of the waveform centroid
CyThe y coordinate of the waveform centroid
RGThe radius of gyration
Table 3. Mean values with one standard deviation of canopy height with three successional stages and two transitions at the SRNP-EMSS were extracted from LiDAR data. Significant differences (F values) according to the successional stages are presented from ANOVA. Height was extracted in meters and tree individuals per stage.
Successional StagesMean Height (m)Tree Individuals per Stage
Early6.07 ± 1.911545
Transition I: Early to Intermediate9.42 ± 2.843546
Intermediate12.68 ± 2.9822,470
Transition II: Intermediate to Late14.09 ± 3.1723,815
Late16.28 ± 3.7029,124
ANOVA8329.7 *N/A
* p value < 0.05.
Table 4. Mean (±SD) of metrics derived from the full-waveform LiDAR along the nine cross-sections over two successional stages and one transition in the dry forest at the SRNP-EMSS, Guanacaste, Costa Rica. Significant differences (F values) according to different successional stages are provided. Cx, the x coordinate of the waveform centroid; Cy, the y coordinate of the waveform centroid; RG, the radius of gyration; Px, the x coordinate of the maximum waveform amplitude; Py, the y coordinate of the maximum waveform amplitude; Hmax, maximum tree height (m); LAI, leaf area index.
MetricsIntermediateTransition IILateANOVA
Cx0.31 ± 0.030.28 ± 0.030.25 ± 0.046.87 *
Cy8.69 ± 0.8710.30 ± 1.7513.00 ± 1.7817.64 *
RG5.13 ± 0.435.96 ± 1.017.52 ± 1.0217.55 *
Px0.73 ± 0.140.75 ± 0.220.78 ± 0.150.09
Py2.31 ± 3.381.25 ± 0.431.41 ± 0.790.72
Hmax17.47 ±1.5020.36 ± 3.4925.75 ± 3.5417.61 *
LAI10.79 ± 1.3411.47 ± 1.2312.61 ± 0.835.71 *
* p-value < 0.05.
Disclaimer/Publisher’s Note: The statements, opinions and data contained in all publications are solely those of the individual author(s) and contributor(s) and not of MDPI and/or the editor(s). MDPI and/or the editor(s) disclaim responsibility for any injury to people or property resulting from any ideas, methods, instructions or products referred to in the content.