Article

Improving GEDI Forest Canopy Height Products by Considering the Stand Age Factor Derived from Time-Series Remote Sensing Images: A Case Study in Fujian, China

1
Key Laboratory of Spatial Data Mining and Information Sharing of Ministry of Education, National & Local Joint Engineering Research Center of Satellite Geospatial Information Technology, Fuzhou University, Fuzhou 350108, China
2
Center for Spatial Information Science and Systems (CSISS), George Mason University, Fairfax, VA 22030, USA
3
Institute of Geoinformatics, Alba Regia Technical Faculty, Obuda University, 8000 Székesfehérvár, Hungary
*
Author to whom correspondence should be addressed.
Remote Sens. 2023, 15(2), 467; https://doi.org/10.3390/rs15020467
Submission received: 23 November 2022 / Revised: 6 January 2023 / Accepted: 10 January 2023 / Published: 12 January 2023

Abstract

:
Forest canopy height plays an important role in forest resource management and conservation. The accurate estimation of forest canopy height on a large scale is important for forest carbon stock, biodiversity, and the carbon cycle. With the technological development of satellite-based LiDAR, it is possible to determine forest canopy height over a large area. However, the forest canopy height that is acquired by this technology is influenced by topography and climate, and the canopy height that is acquired in complex subtropical mountainous regions has large errors. In this paper, we propose a method for estimating forest canopy height by combining long-time series Landsat images with GEDI satellite-based LiDAR data, with Fujian, China, as the study area. This approach optimizes the quality of GEDI canopy height data in topographically complex areas by combining stand age and tree height, while retaining the advantage of fast and effective forest canopy height measurements with satellite-based LiDAR. In this study, the growth curves of the main forest types in Fujian were first obtained by using a large amount of forest survey data, and the LandTrendr algorithm was used to obtain the forest age distribution in 2020. The obtained forest age was then combined with the growth curves of each forest type in order to determine the tree height distribution. Finally, the obtained average tree heights were merged with the GEDI_V27 canopy height product in order to create a modified forest canopy height model (MGEDI_V27) with a 30 m spatial resolution. The results showed that the estimated forest canopy height had a mean of 15.04 m, with a standard deviation of 4.98 m. In addition, we evaluated the accuracy of the GEDI_V27 and the MGEDI_V27 using the sample dataset. The MGEDI_V27 had a higher accuracy (R2 = 0.67, RMSE = 2.24 m, MAE = 1.85 m) than the GEDI_V27 (R2 = 0.39, RMSE = 3.35 m, MAE = 2.41 m). R2, RMSE, and MAE were improved by 71.79%, 33.13%, and 22.53%, respectively. We also produced a forest age distribution map of Fujian for the year 2020 and a forest disturbance map of Fujian for the past 32 years. The research results can provide decision support for forest ecological protection and management and for carbon sink analysis in Fujian.

1. Introduction

Forests, as the main part of the ecosystem, are the largest carbon reservoir in terrestrial ecosystems and make important contributions to global carbon sinks [1,2,3]. In order to mitigate climate change, and to protect forest ecosystems, we need accurate access to large-scale forest structure parameters for monitoring and managing forest resources [4]. Among the many forest parameters, forest canopy height is both a visual representation of forest resources and an important attribute for estimating forest biomass and carbon stock [5,6]. At present, the accuracy of large-scale forest canopy height estimation is still limited, especially in mountainous and hilly areas [7,8]. Therefore, the rapid and accurate acquisition of large-scale forest canopy height and the analysis of the spatial pattern of the forest height can provide scientific and reasonable decision support to policy makers for forestry carbon sink trading, dynamic monitoring, and the assessment of forest carbon neutrality [9].
The traditional methods to obtain forest canopy height over large areas are time consuming and labor intensive, are difficult for surveyors to perform in areas with a complex terrain, and are dangerous. The satellite-based light detection and ranging (LiDAR) technology has the ability to actively acquire the global surface and target 3D information, and it can play an important role in vegetation height measurement, sea surface height measurement, and global climate monitoring, thus providing a new way to acquire forest canopy height over large areas [10,11]. In December 2018, the National Aeronautics and Space Administration (NASA) launched the global ecosystem dynamics investigation (GEDI) LiDAR altimetry mission. The GEDI is equipped with the world’s first multi-beam linear laser altimeter for high-resolution forest vertical structure measurement, which is mainly used for the precise measurement of forest canopy height, vertical structure, and ground elevation in tropical and temperate regions. Compared with the early full-waveform laser altimeter ICESat (2003–2009), the GEDI provides denser coverage of observations and more accurate estimates [12,13]. However, the GEDI data still have limitations in their application. Firstly, the data are footprint-level and thus cannot cover the ground comprehensively, and they are sparse in subtropical mountainous regions compared with other regions. Secondly, they are missing time series information, which is not suitable for tracking data information through time. These shortcomings can be effectively remedied if the GEDI data are combined with time-series optical images.
For forest canopy height estimation, some scholars have used the spectral variation of long-time-series remote sensing images and have extracted the time series features for regression analysis in order to obtain the latest canopy height [14,15,16]. These studies have confirmed that time series features such as forest disturbance time, disturbance intensity, and spectral indices before and after the disturbance all have good correlation with the canopy height. In LiDAR applications, the mainstream approach for the large-scale mapping of forest canopy height is to use spatially continuous satellite imagery to extrapolate the vegetation attributes that are derived from satellite-based or airborne LiDAR [17,18]. With the availability of high-resolution satellite imagery and a new generation of on-board LiDAR data, the accuracy of regional and global forest canopy height mapping has been greatly improved compared to previous studies.
Potapov et al. [19] proposed a machine learning algorithm with bagged regression trees to map a global canopy height product (GEDI_V27) at a 30 m resolution for 2019, using the 95th percentile relative height metric from GEDI_2A footprint data as the dependent variable. Compared with the GEDI validation data (RMSE = 6.6 m; MAE = 4.45 m; R2 = 0.62) and the available airborne LiDAR (RMSE = 9.07 m; MAE = 6.36 m, R2 = 0.61), the GEDI_V27 product is a more stable canopy height model (CHM) that is obtained by machine learning inversion using a large number of spectral, textural, and phenological features; however, the accuracy of GEDI_V27 product is lower in subtropical complex mountainous regions, making it difficult to use the product for subsequent studies in such regions. The GEDI_V27 product mainly has the following deficiencies: (1) GEDI is easily affected by topography and thick cloud cover when collecting canopy height data, which leads to a large instability in the accuracy of the data that is collected in subtropical complex mountainous regions [20,21,22]. Therefore, during the inversion process, the value of the dependent variable RH_95 in the mountainous region has errors, which leads to the fact that no matter how high the model accuracy is, the results that are obtained still have large errors. (2) This product extrapolates satellite-based LiDAR footprint data using optical images, and the generated canopy height product still has the problem of potential saturation [23]. (3) The product is based on a global study area, and it is difficult to take into account all of the regions during the sample selection for model calibration. As a result, the accuracy of the regions with a small sample size is lower [24,25,26]. Based on the above-mentioned problems, we improved GEDI forest canopy height products in 2020 in Fujian province by considering the stand age factor derived from long time-series Landsat data from 1986 to 2020 and a large amount of local data in the paper, which reduces the influence of complex terrain and effectively reduces the problem of data saturation. Finally, it should be noted that the research region of this study is Fujian province, and the GEDI collected data in Fujian from April 2019 to September 2020, therefore, the forest age and sample set in this study were limited to this time period.
There is a very close correlation between forest stand age and its tree height, especially for immature forests, with a very clear linear relationship [27,28]. In this paper, therefore, we use long time series Landsat satellite data to produce a forest age distribution map and then combine the growth curves of different forest types in order to estimate the tree height. Finally, the tree height results are merged with the satellite-based LiDAR forest canopy height product GEDI_V27 in order to create a modified forest canopy height distribution map. The correlated features, such as spectral and texture features in the forest stand images, are usually adopted for remote sensing estimation of forest age [29]. Numerous remote sensing data have been used in order to establish the relationship between stand age and optical, LiDAR, and microwave parameters, including MODIS, ICESat, SPOT-5, and SAR [30,31,32,33]. Although the traditional remote sensing methods can be used to produce thematic maps of forest age, the spectral saturation of mature forests and the frequent areas of land change can reduce the accuracy of the forest age estimation models [34,35]. In addition, most forest age products that are estimated by traditional remote sensing have low spatial resolution and limited time points, and thus cannot capture forest disturbance and restore the history sufficiently in a space or time domain [33,36]. With Landsat time-series data archived and freely available, forest disturbance information, such as forest fires, logging, and afforestation, have been detected at a 30 m resolution over the past 35 years, allowing researchers to obtain the time point and spatial location of the origin of most of the existing forest stands for forest stand age estimation [37,38]. In this paper, LandTrendr, which is a long-time-series forest disturbance and restoration detection algorithm that was proposed by Kennedy et al. [39], was used to estimate forest age. This algorithm extracted the change process track of the spectral index pixel by pixel, for which potential vertices were used as segmentation nodes, and the node positions and spectral values provided effective information that could explain the forest structure. The trajectory curves before and after it represent the continuous changes or the stable states of the forest pixels in the spectral trajectory. Through this method, the forest disturbance and restoration time nodes were obtained in order to infer the starting time of afforestation, so as to obtain the distribution map of the existing forest age.
In order to reduce the error of forest canopy height estimation in mountainous regions, time series satellite remote sensing was adopted in order to estimate the forest stand age factor and the forest canopy height, which, by merging the forest canopy height that is derived from stand age, can reduce the uncertainty of exogenous factors in the process of data acquisition by satellite-based LiDAR and improve the accuracy of the GEDI canopy height models in mountainous regions. This study had the following four main objectives: (1) construct the growth curves of needleleaf, broadleaf, and mixed forests in Fujian, (2) estimate the forest age based on long time series Landsat satellite data, (3) merge the estimated tree height with the GEDI canopy height model to develop a modified forest canopy height model, and (4) evaluate and compare the accuracy of the modified canopy height product in the paper with the GEDI_V27 canopy height product.

2. Materials and Data
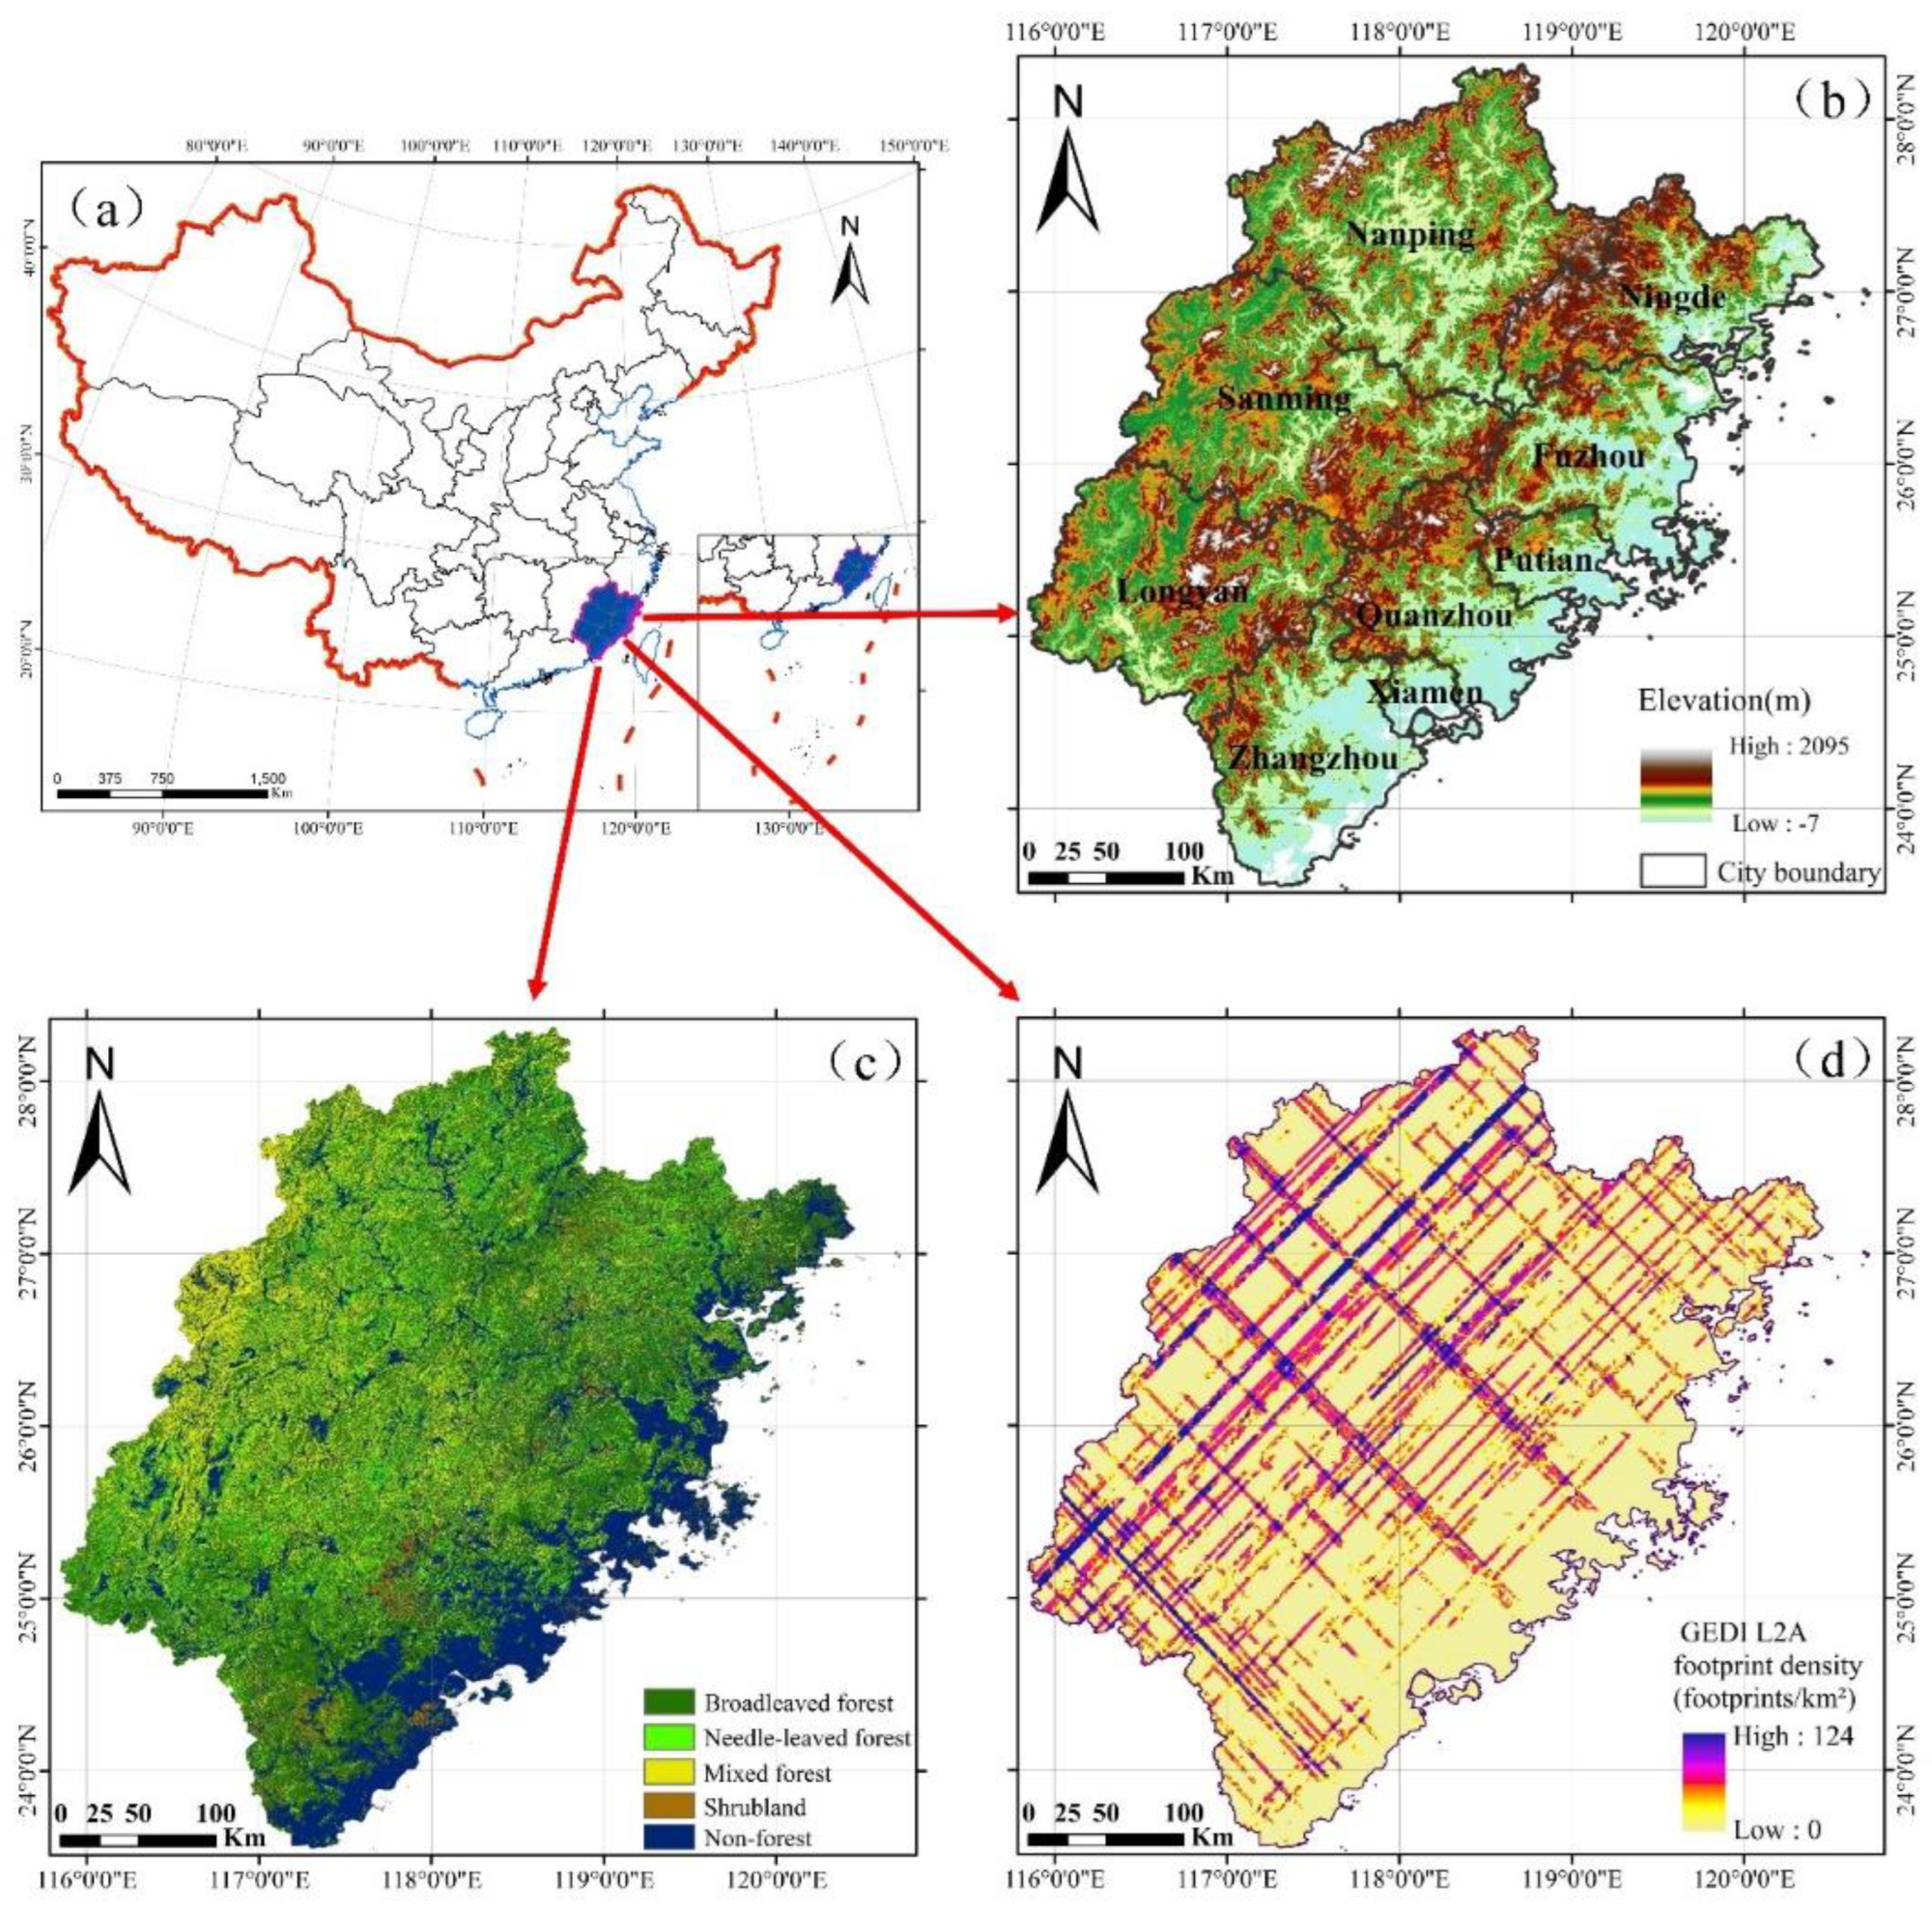
2.1. Study Area

The study area of this paper is Fujian, which is situated in Southeastern China. Fujian covers an area of 124,000 km2 and has a subtropical maritime monsoon climate, with mountains and hills accounting for more than 80% of the province’s area (Figure 1a,b). Fujian is rich in forest resources and is a key collective forest area in Southern China, with a forest coverage rate of over 66%. The forest types are mainly needleleaf, broadleaf, and mixed (Figure 1c). The forest types cover map of Fujian was produced by using 2020 Sentinel satellite images (with a spatial resolution of 10 m) and China’s Gaofen series satellites (with a spatial resolution of 1–2 m), combined with the field survey data, using the random forest method. In order to understand the coverage of the GEDI original footprint data in Fujian, all of the GEDI level 2A datasets in Fujian were downloaded from the Land Processes Distributed Active Archive Center [40]. The time span of the GEDI Fujian data collection is from April 2019 to September 2020. There are 345 GEDI track files in HDF5 format. The quality filtering and the data visualization were completed using the pyGEDI package [41] in order to obtain 1,375,019 footprint data. The data collection of the GEDI in the forest region of Fujian was relatively sparse, and the available footprints per square kilometer were from 0 to 124, which partly explains the low accuracy of the GEDI_V27 in the Fujian region.

2.2. Landsat Time-Series Imagery and Preprocessing

The time-series Landsat dataset that has been used in this study includes the surface reflectance products of Landsat-5, Landsat-7, and Landsat-8, corresponding to the sensors TM, ETM+, and OLI, respectively. The data that were acquired from the time range 1986–2020 were processed on the GEE platform, with the specific Landsat satellite parameters, which are shown in Table 1.

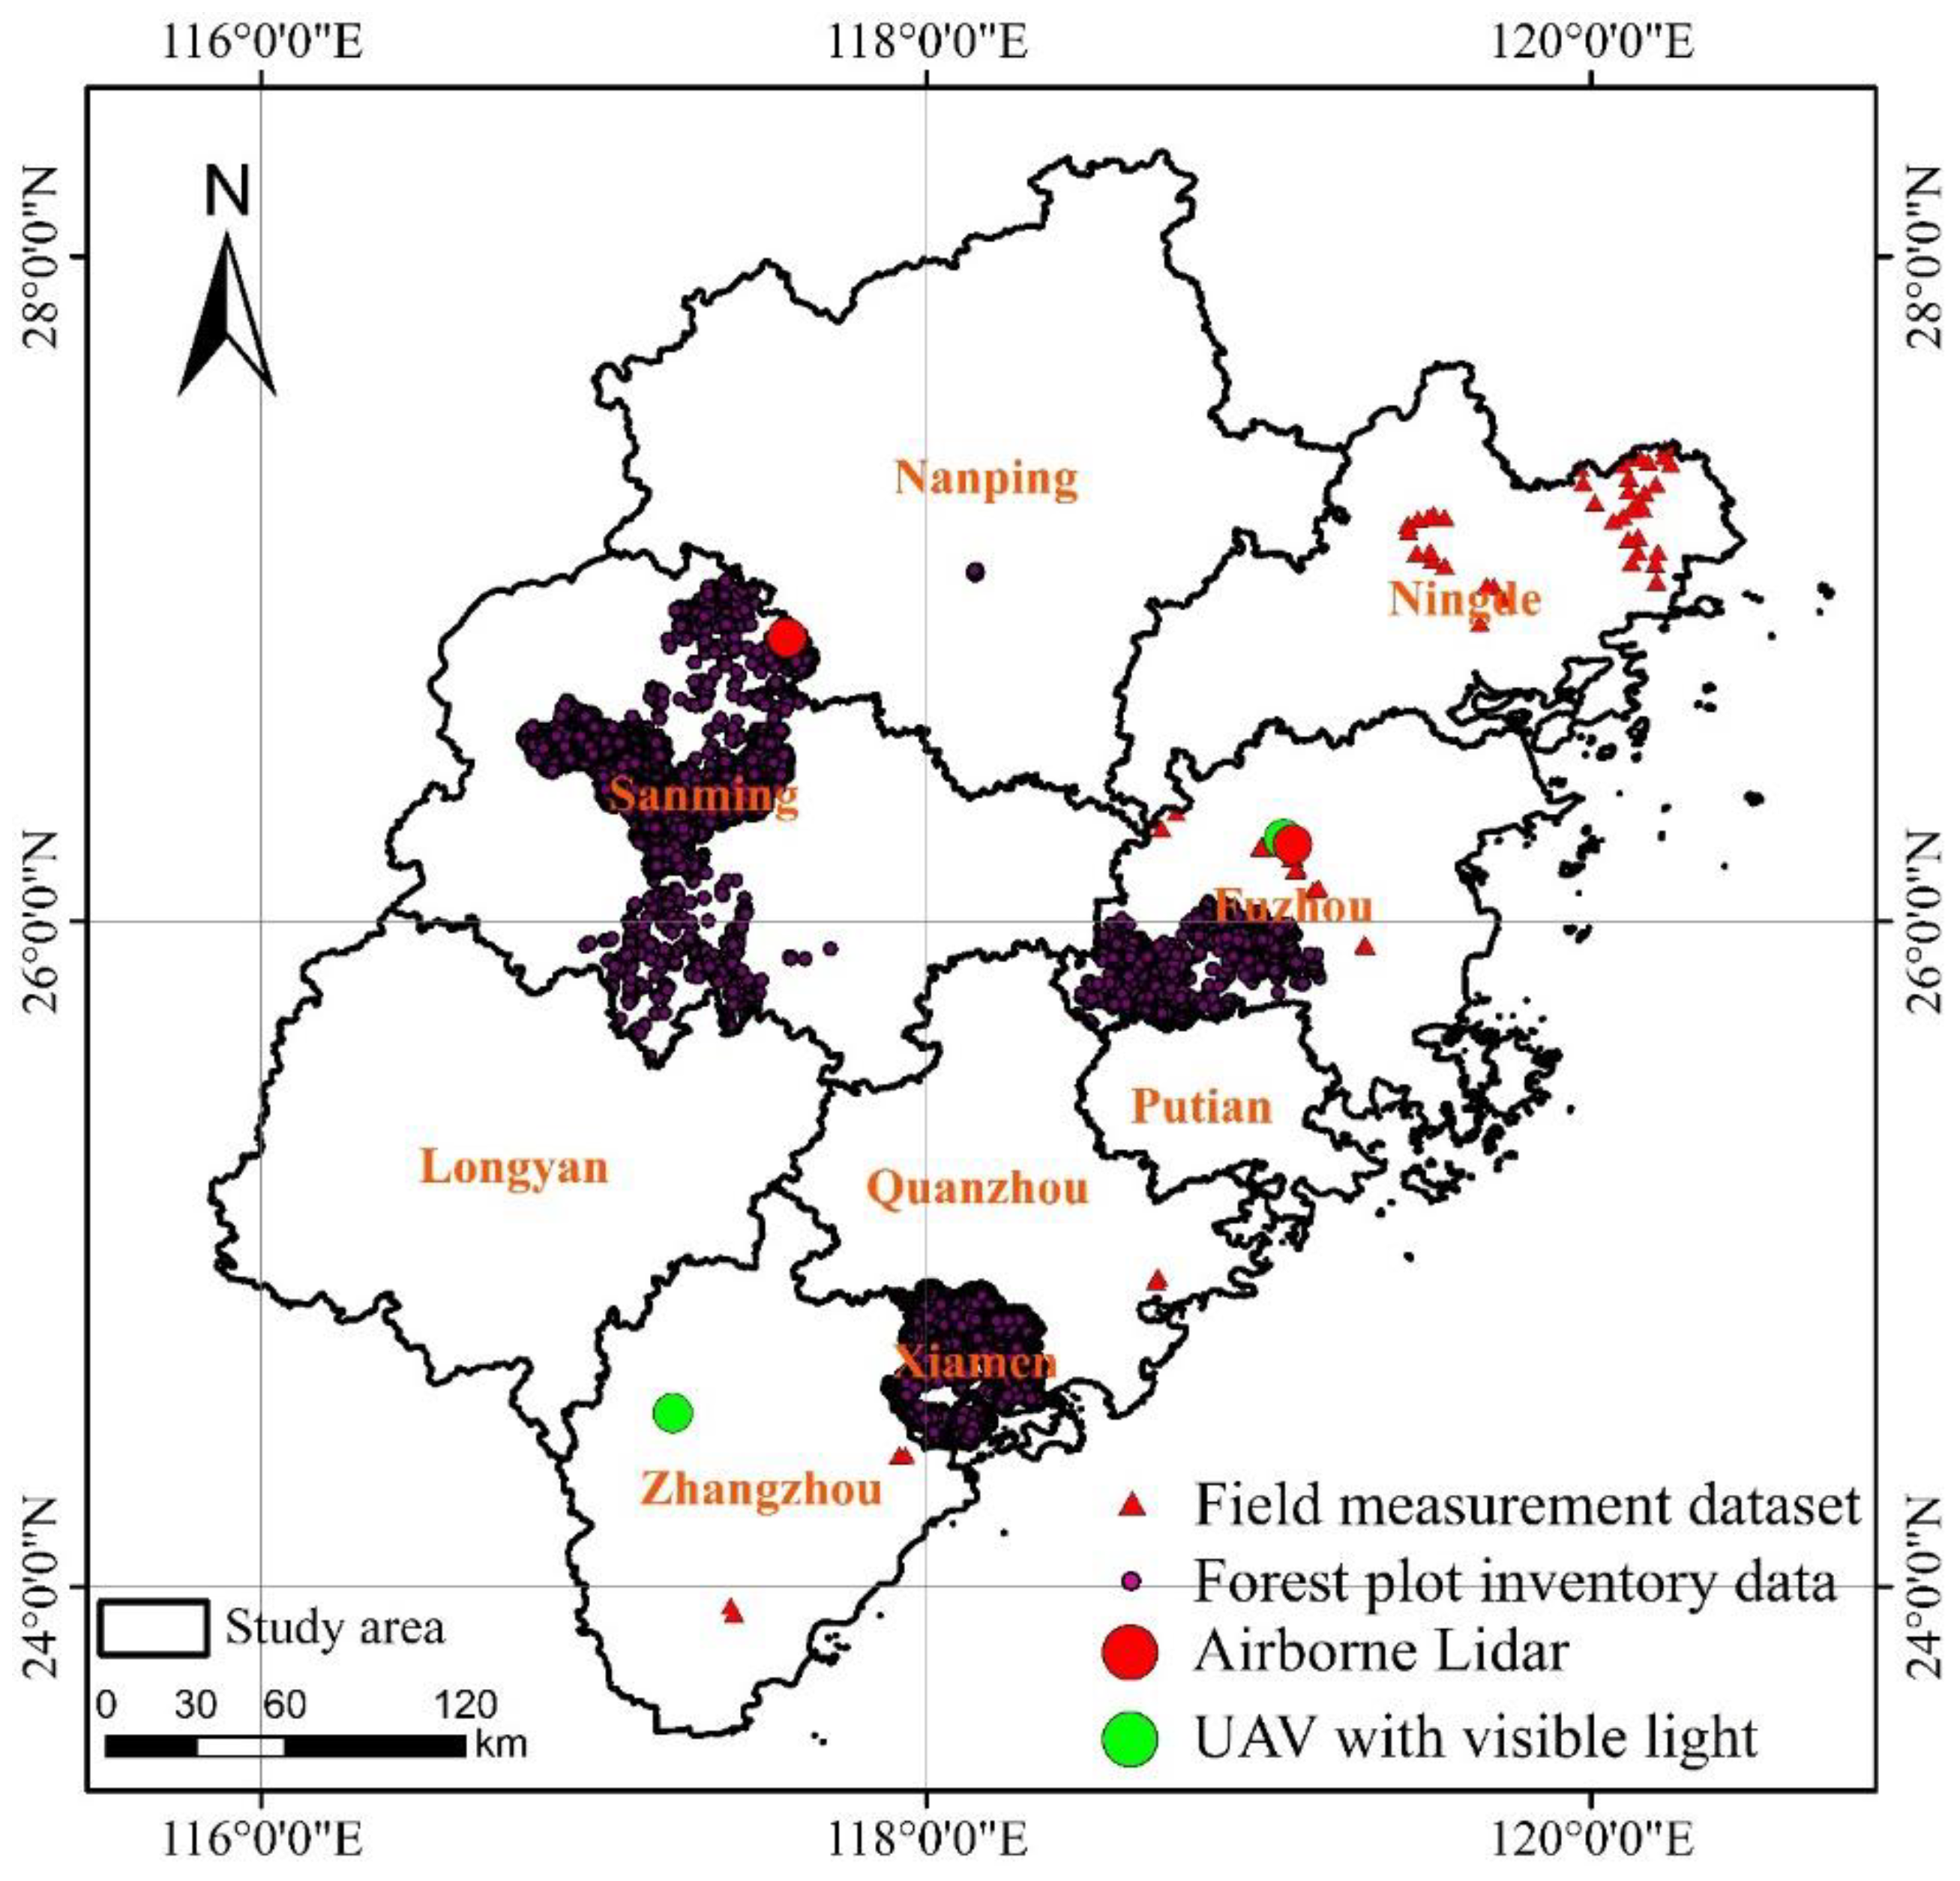
2.3. Field Survey Dataset
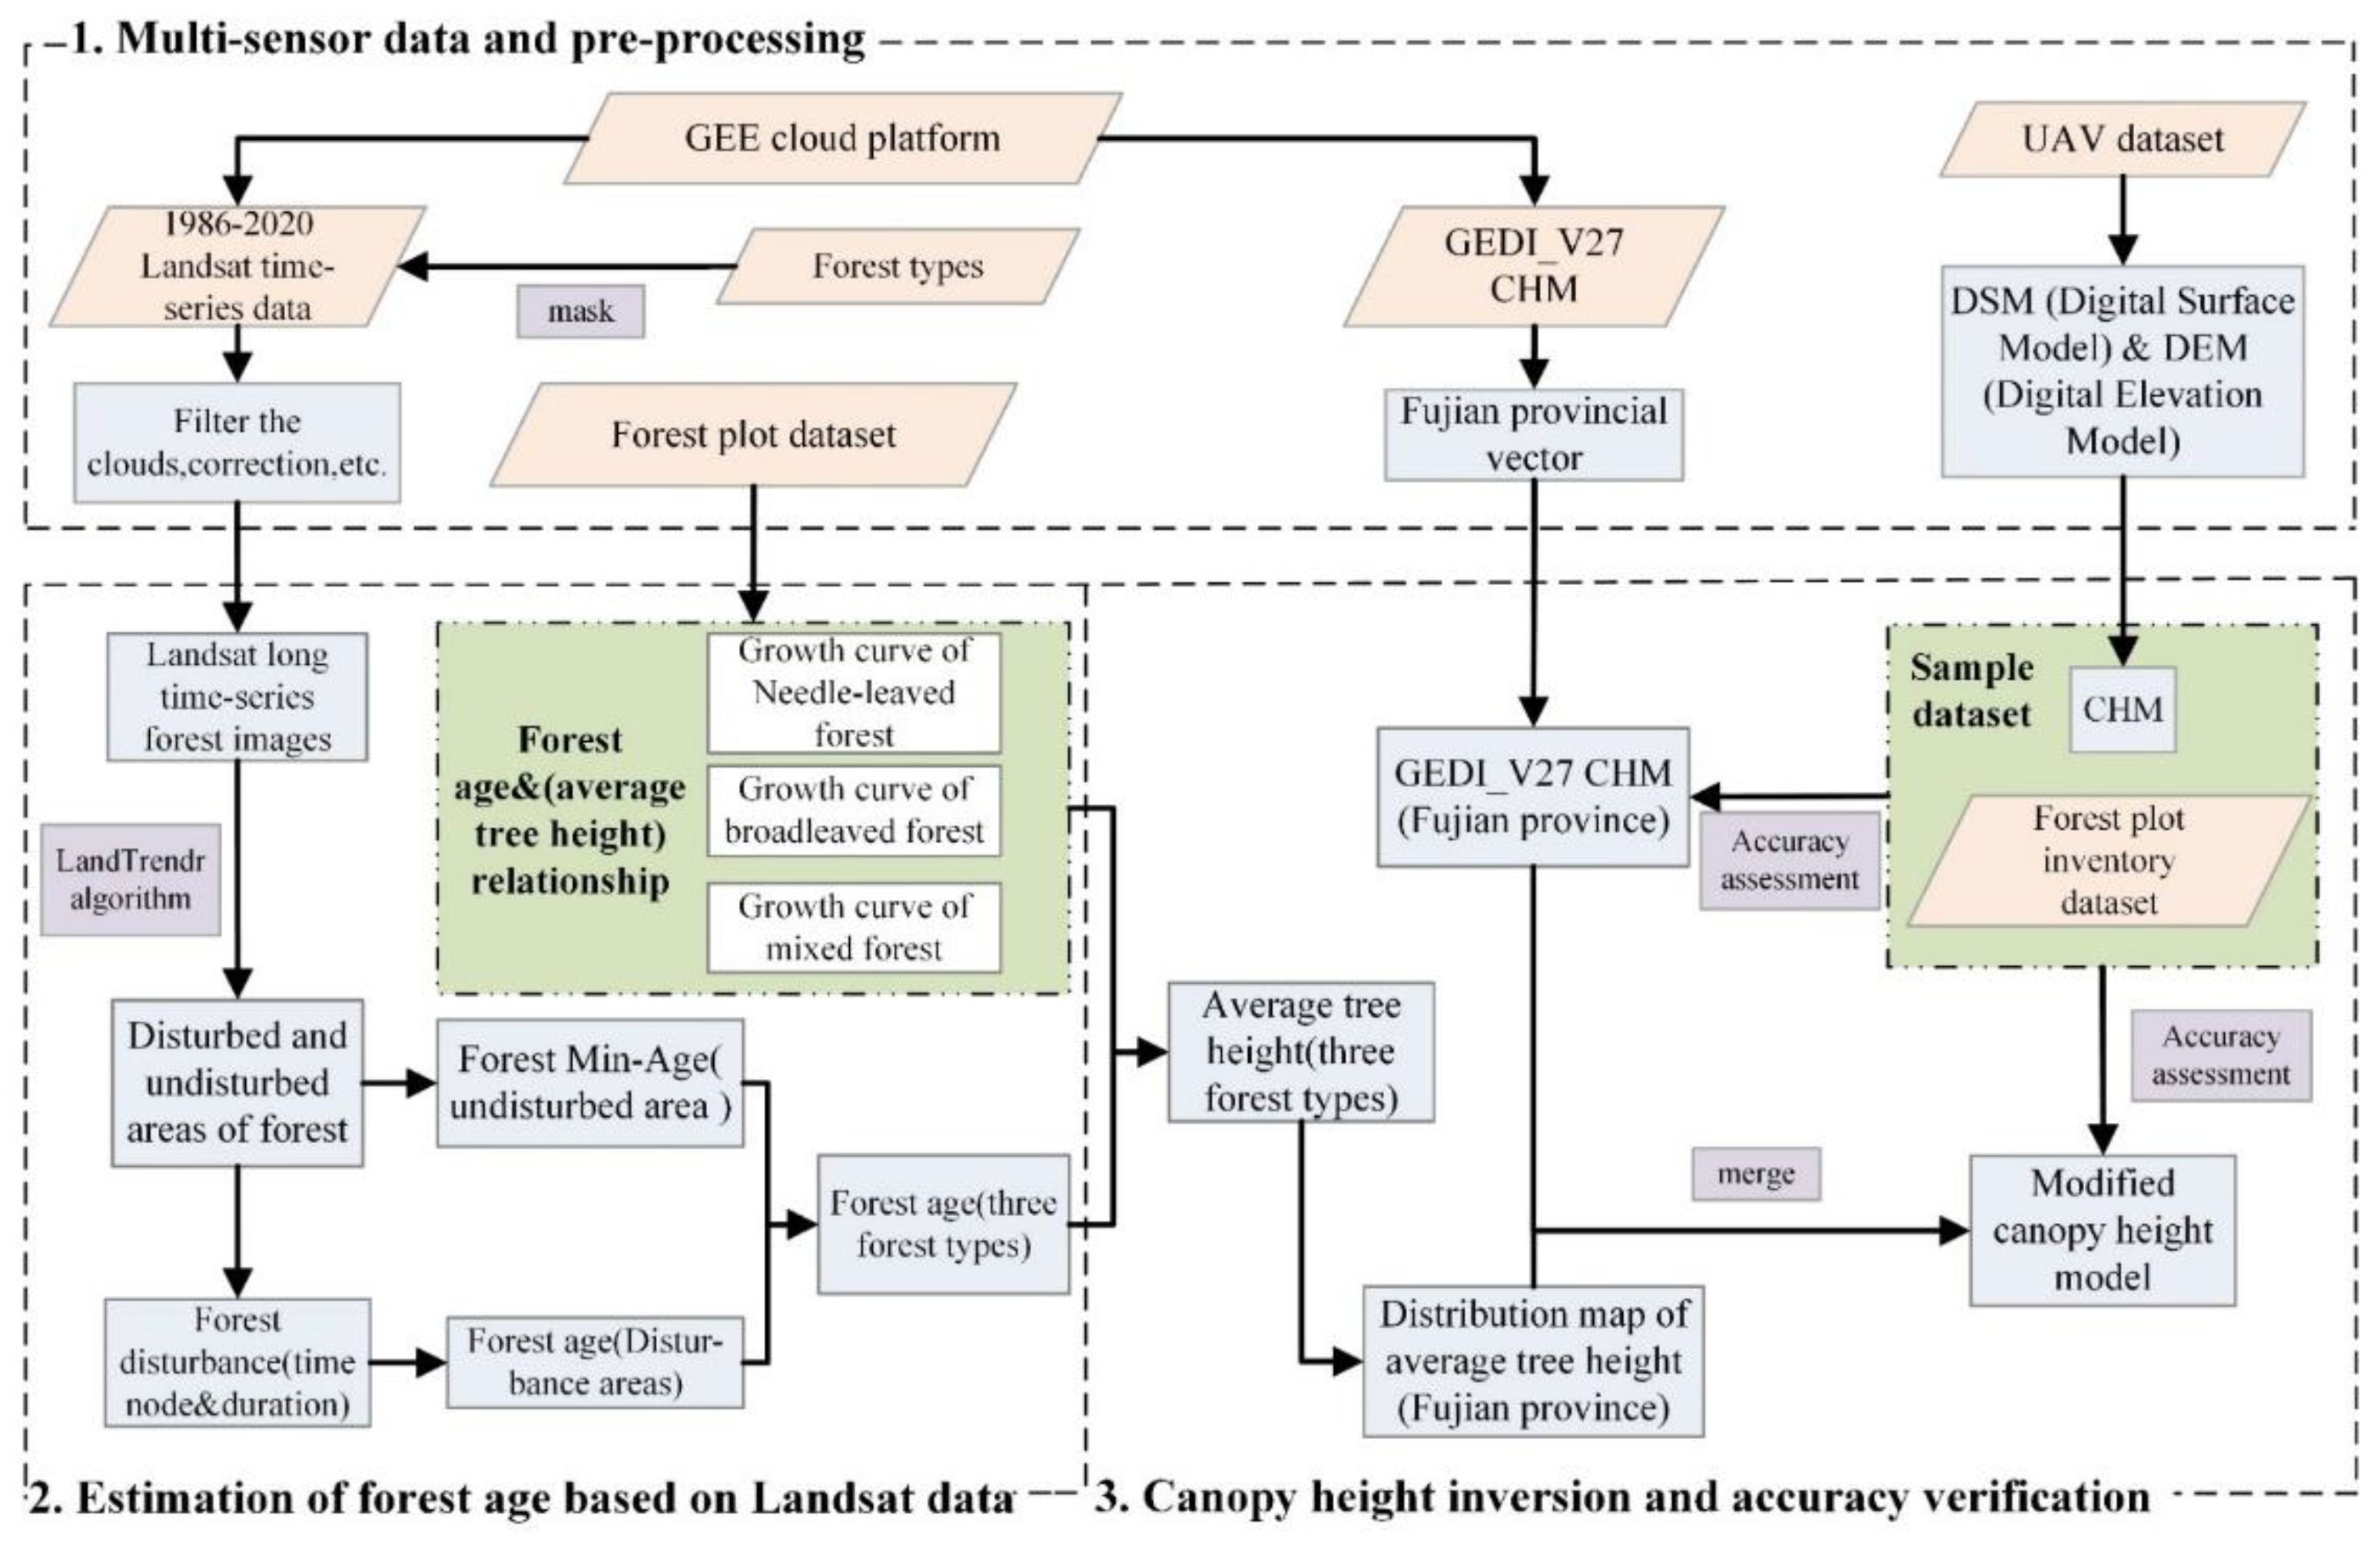
The field survey dataset mainly includes UAV data, forest plot inventory data, and field measurement datasets (Figure 2). The UAV data that were used in this study include LiDAR data and visible light images from 2020 to 2021. The distribution of the data includes Baisha forestry farms in the city of Fuzhou, Jiangle County in Sanming, and the Hu Boliao reserve in Zhangzhou.
The forest plot inventory data were divided into a plot according to the stand conditions, the stand factors, and the harvesting methods that were consistent with the stand. The forest plot data include information on the average tree height, the average diameter at breast height, the denseness, and the stocking volume. The forest plot inventory data that were used in this study include 66,413 forest plots in Mingxi County in 2008, Xiamen in 2009, Jiangle County in 2015, 2019, and 2021, the Wanmulin reserve in Nanping city in 2016, Yongtai County in 2021, and Yongan County in 2021. The field measurement data were collected from October 2020 to December 2021. The average tree heights in a rectangular sample plot with a side length of 30 m were measured and recorded, with measuring tools such as a tape measure, a breast height ruler, a laser range altimeter, and the HUACE i70 GNSS receiver.

3. Methods

The technical flow of this study is shown in Figure 3. The first part of the research involved fitting curves between the average forest height from inventory plots and the forest age estimated from Landsat time series. Second, the forest age was estimated using time series Landsat satellite data. The time nodes of forest disturbance and restoration were obtained based on the LandTrendr algorithm using long-time-series Landsat data, and Fujian was divided into disturbance areas and non-disturbance areas. The forest stand age can be calculated in a disturbance area based on the recovery node; forest stand ages in the non-disturbance area were labeled as greater than the maximum forest age in the disturbance areas. Third, the canopy height model and the accuracy evaluation were inverted. The average tree height was calculated based on the obtained forest age factor and the growth curves of the different forest types in Fujian, and it was merged with the GEDI_V27 to obtain the canopy height model of Fujian in 2020. The sample data were used as reference data to evaluate and analyze the accuracy of the modified canopy height model and the GEDI_V27 canopy height model obtained by the proposed method.

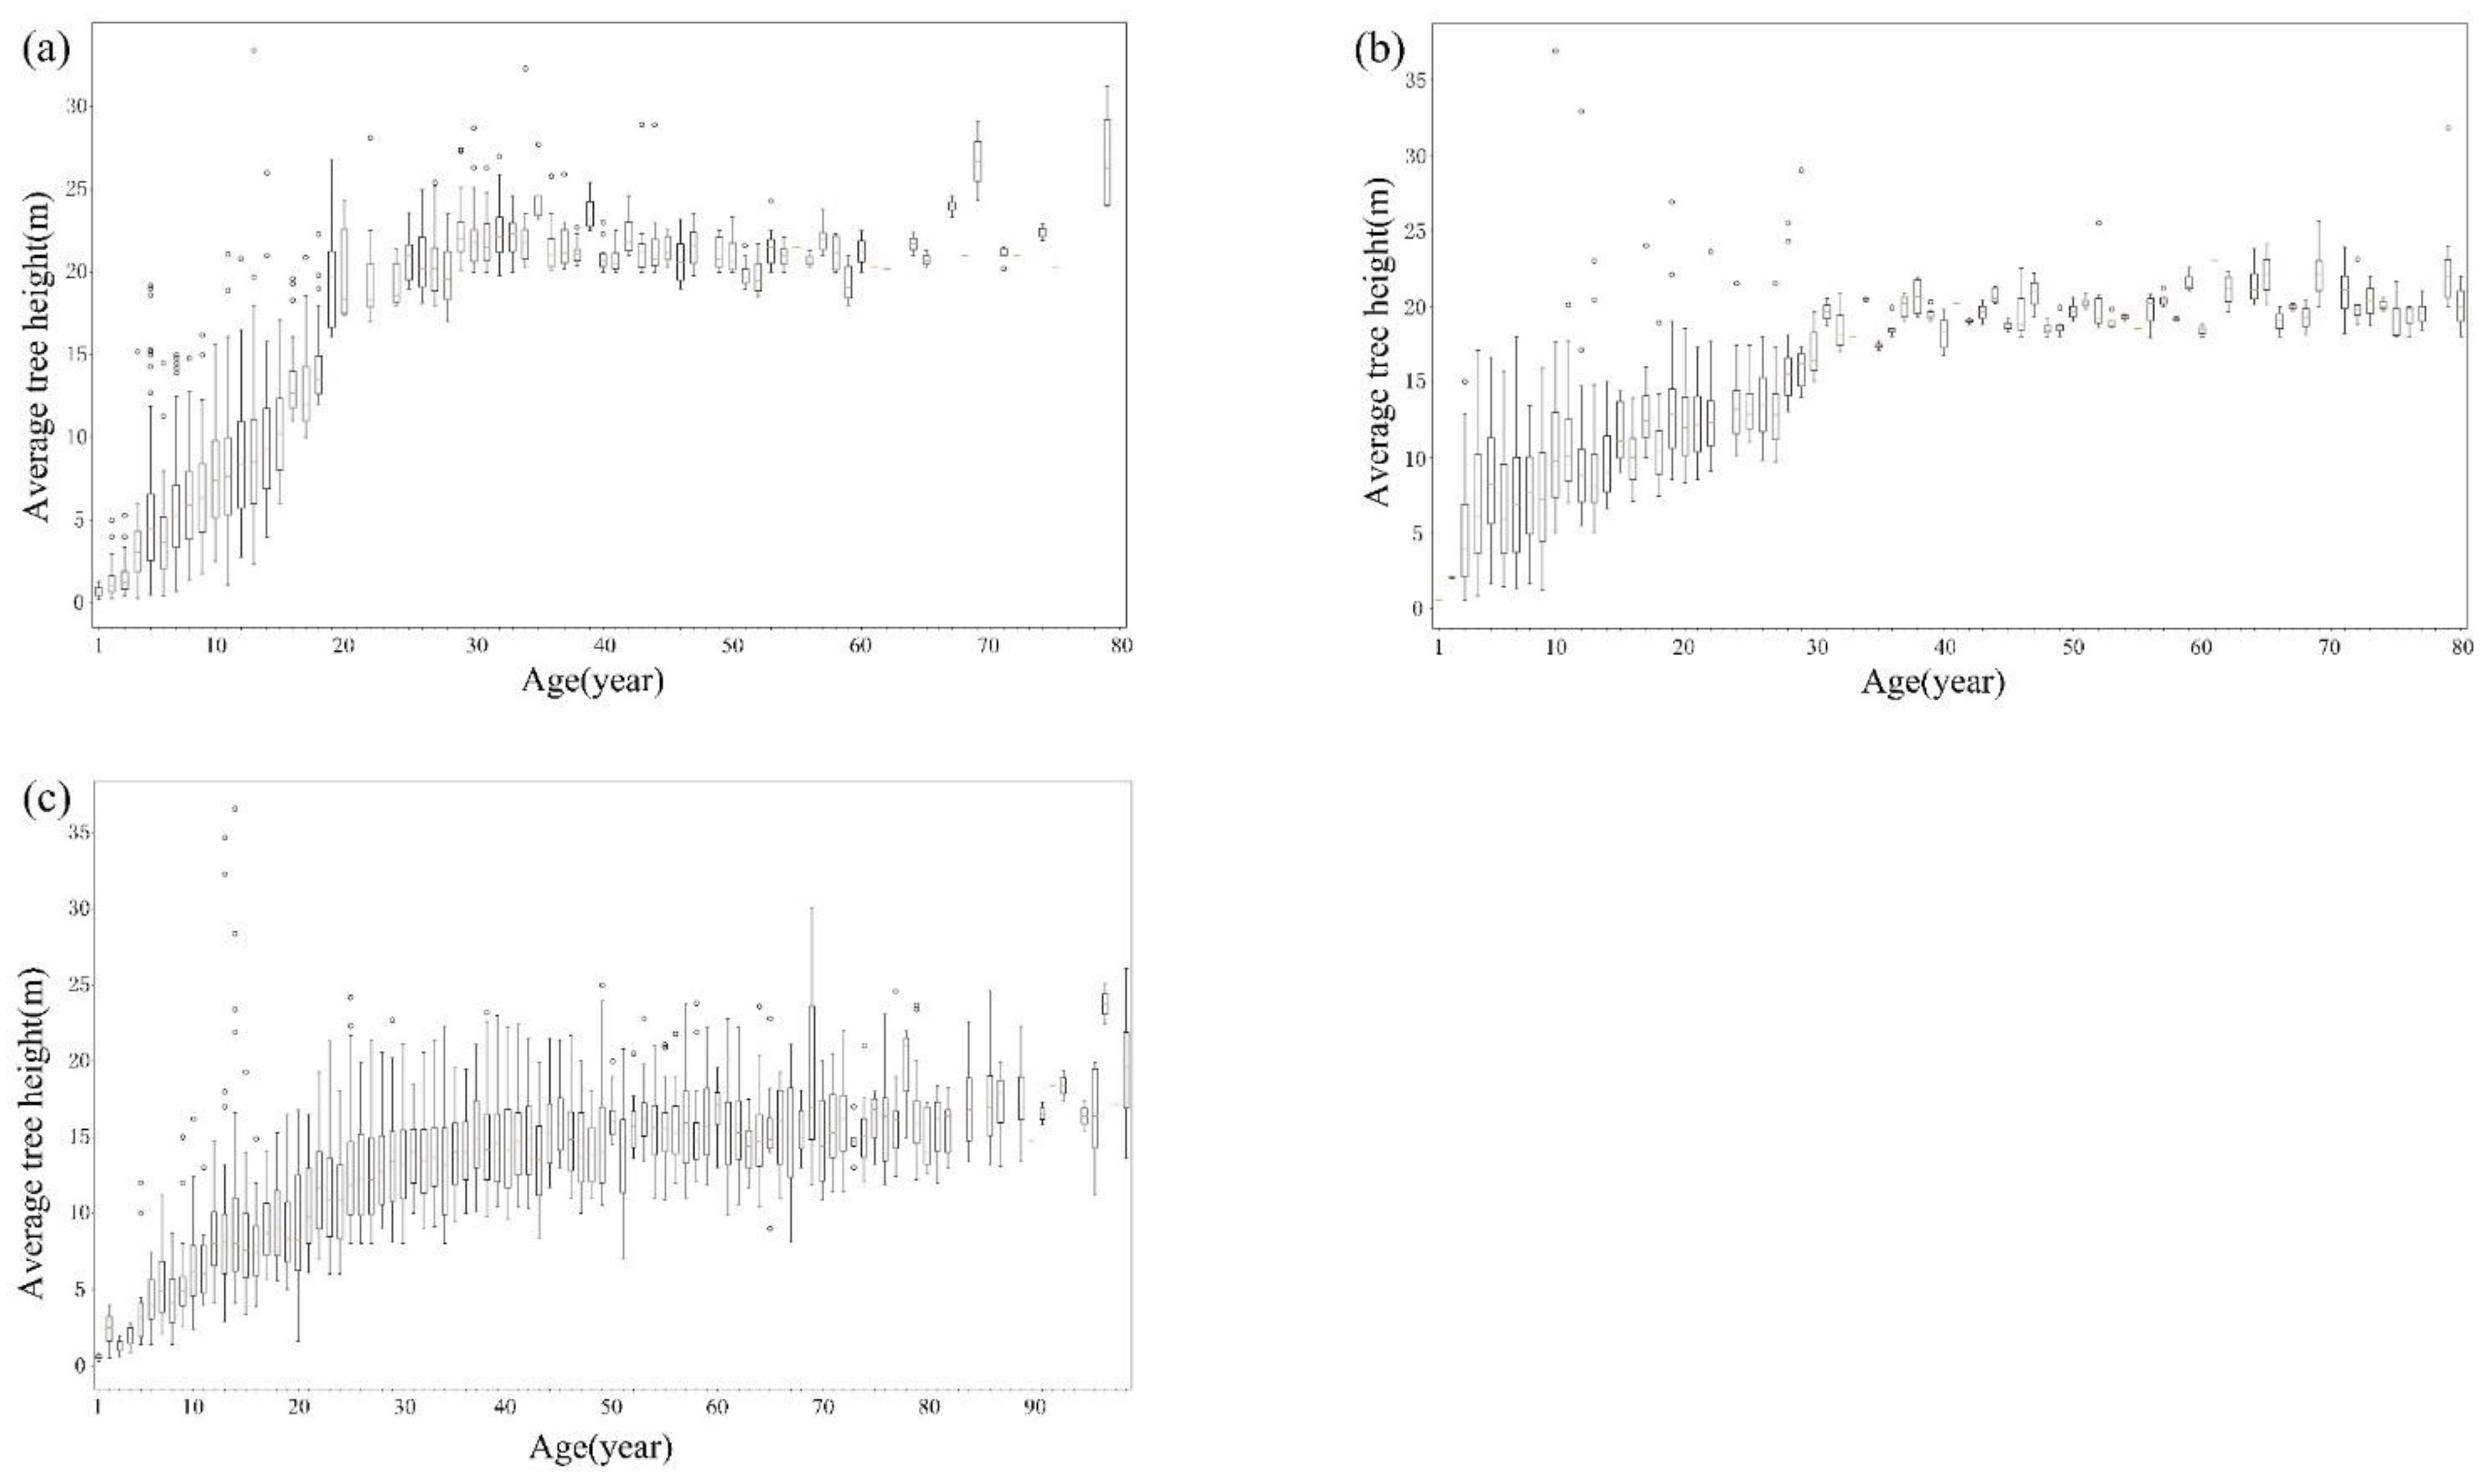
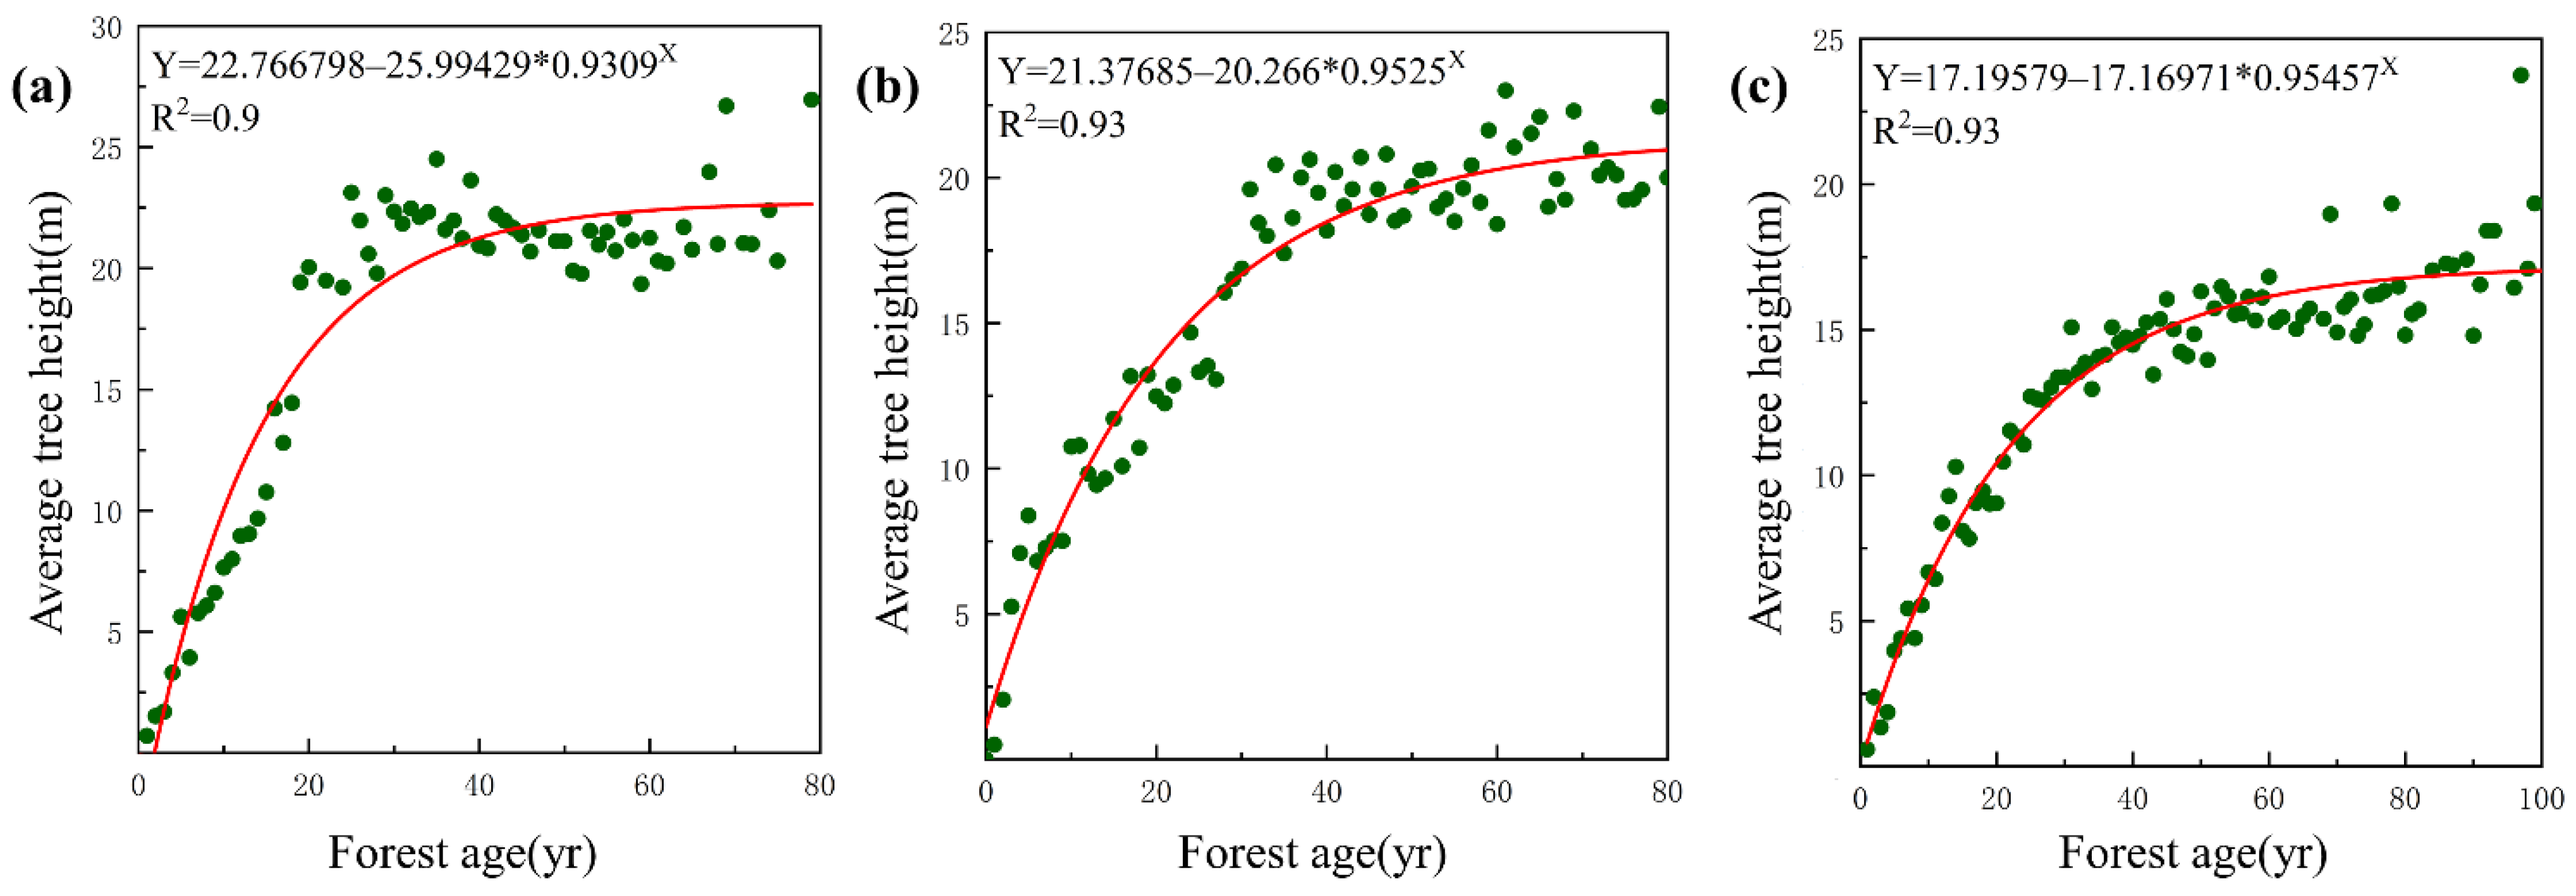
3.1. Curve Fitting of Forest Age and Average Tree Height

In order to obtain growth curves for each forest type in Fujian, we collected a large amount of historical forest plot inventory samples distributed in Xiamen, Mingxi County, Jiangle County, and the Wanmulin reserve, as follows: 61,414 forest patches that contain forest structure information, such as average tree height, average diameter at breast height (DBH), forest age, and forest type. We statistically analyzed the samples and plotted the distribution of the average tree height data corresponding to each age in the forest patches (Figure 4a–c). We then used Origin software to determine the relationship between the forest age and the average tree height for the following three forest types: needleleaf, broadleaf, and mixed forests (Figure 5a–c). By comparing the accuracy of fitting results of various functions and analyzing the residual error, we found that the fitting effect of the exponential function was the most consistent with the relationship between the forest age and the average tree height. Therefore, the exponential function was selected as the optimal fitting function between the forest age and the average tree height in this study. The graph shows that the growth trends of the three forest types are basically the same, with faster growth before immaturity and a gradual flattening with maturity, at which point trees no longer increase in height. The negative values calculated for the coniferous forest equation are replaced by minimum positive values.

3.2. Forest Age Estimation

In order to estimate the forest age in 2020 in Fujian, the LandTrendr forest disturbance detection algorithm, which is based on long-time-series Landsat satellite data from 1986 to 2020, was adopted to distinguish the study area into forest disturbance and non-disturbance areas, and the forest age in 2020 was calculated based on the forest disturbance features extracted by the algorithm. A forest disturbance area refers to an area where the forest status is changed, and this paper takes the forest cover in 2020 as the research object, therefore the areas where disturbance occurs are restored to the forest, not other land types. A forest non-disturbance area is an area where no disturbance was detected in the Landsat time-series images during or after 1986. Since the tree height no longer changes significantly as the trees mature, the forest age in the undisturbed areas is based on the maximum forest age in the disturbed area as the minimum threshold.

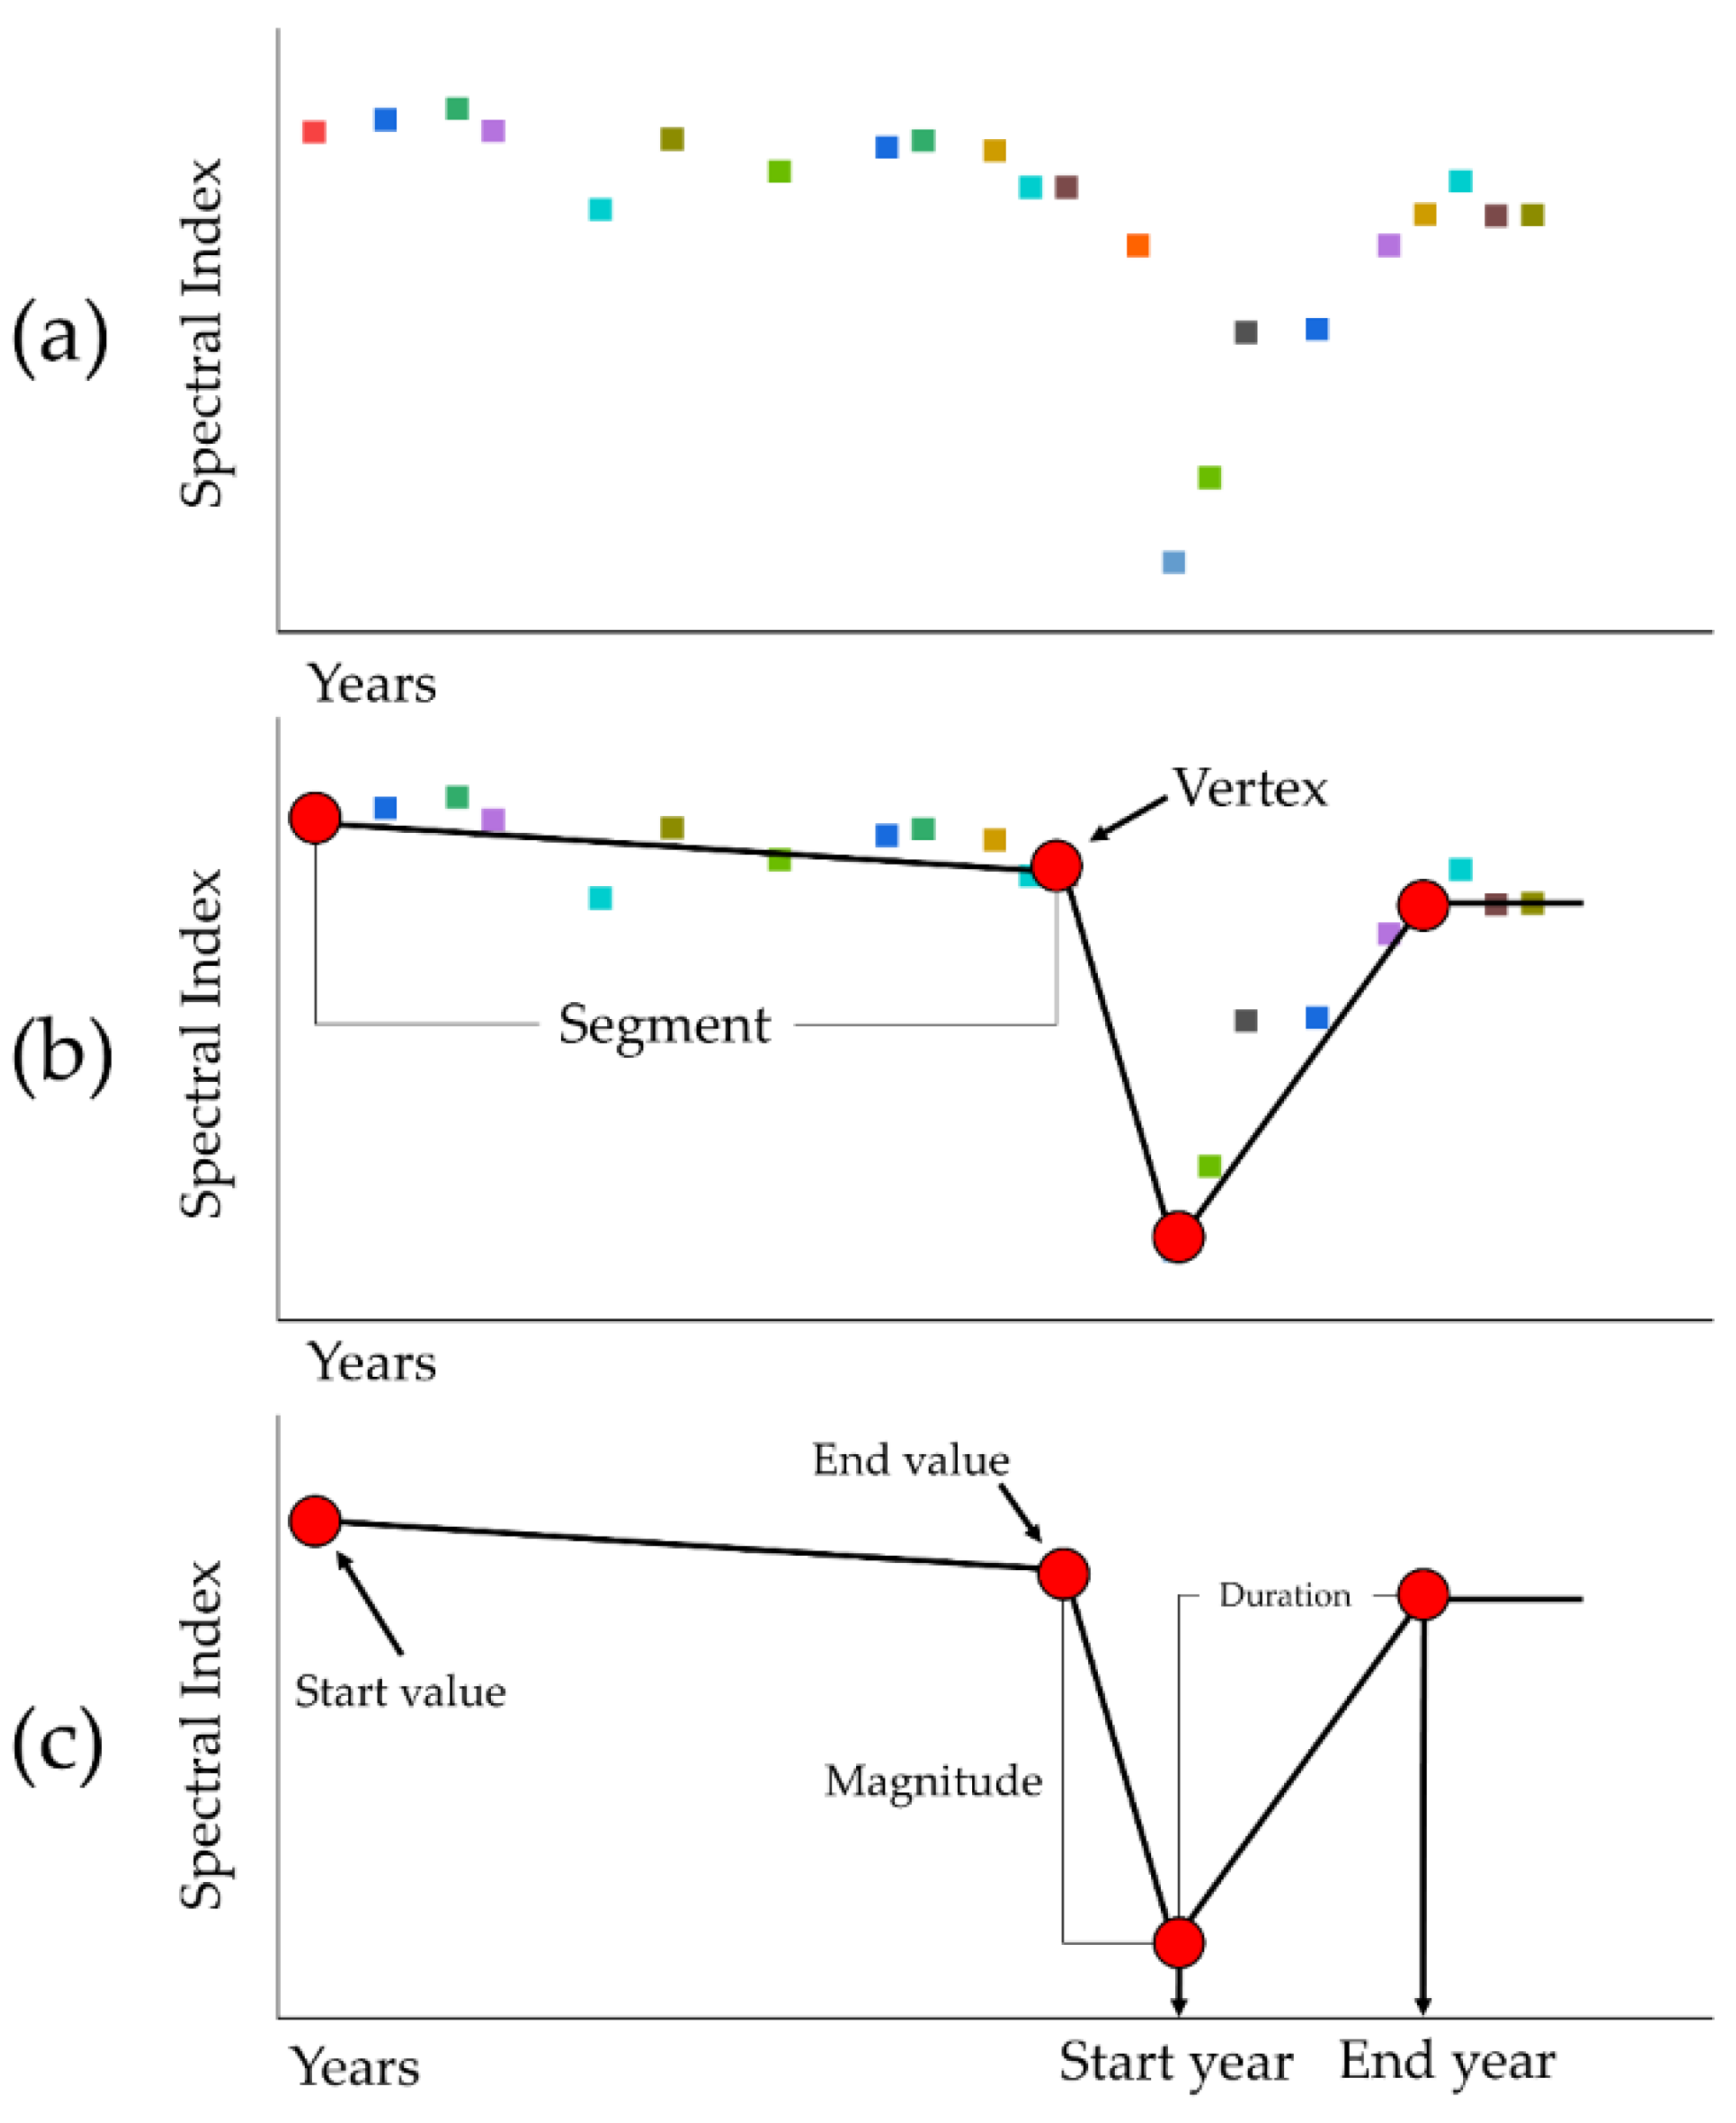
3.2.1. The LandTrendr Algorithm

The forests in Fujian have the characteristics of short-term rotation and high productivity, and LandTrendr can identify both short-term drastic forest disturbances and determine long-term vegetation recovery times. Therefore, long-time-series Landsat data with a large amount of native Fujian data were used to invert the canopy height data, which can reduce the influence of complex topography and the problem of data saturation. The LandTrendr algorithm [39,42] is essentially a spectrum-time segmentation algorithm that focuses on the detection of changes in the time series of medium-resolution satellite images. The core of the algorithm lies in the segmented fitting of time series and in extracting spectral time trajectories image by image, by which both short-term drastic forest disturbances and long-term vegetation recoveries can be identified. The LandTrendr algorithm in general appears to only consider the trend component of the time-series data and fits a concise straight-line segment based on the dynamic trajectory of the spectrum (Figure 6).
For the selection of indices, scholars have investigated the differentiation of image reflectance and derived vegetation indices for forest disturbance types, such as deforestation and fire, showing that the shortwave infrared (SWIR) band reflectance has the highest differentiation among the disturbance types [43,44]. Kennedy et al. [39] showed that the corresponding normalized burn ratio (NBR) has the highest sensitivity for capturing the disturbance time of harvesting and fire. Therefore, in this study, NBR was chosen as the spectral index to construct the time series pixel by pixel, and the NBR was calculated as follows:
NBR = ( NIR SWIR ) / ( NIR + SWIR )  
The spectral value is the ratio of the difference between the near-infrared (NIR) and the shortwave infrared (SWIR) values to the sum of those values. Healthy vegetation has a high NIR value and a low SWIR value, therefore, it will have a high NBR index, which will suddenly become smaller when healthy vegetation is disturbed, and forest status information is detected by such a change. The LandTrendr algorithm was implemented based on the GEE cloud platform, which can efficiently determine the forest disturbance and restoration in Fujian. After obtaining the forest disturbance time nodes and duration, while afforestation is generally within one year after harvesting, the afforestation time could be inferred, and the forest age of the disturbance area could be obtained. The forest age of the undetected disturbance area was estimated to be above the maximum forest age in the disturbance area, and this result was used to make the overall forest age distribution map at a 30 m resolution.

3.2.2. Accuracy Verification of Forest Age

The sample sets for verifying the accuracy of the forest age were the forest plot inventory data from Mingxi County in 2008, Xiamen in 2009, and Jiangle County in 2019. These data were used to verify the distribution of the forest age at different disturbance times to verify that the disturbance recovery time occurred in areas before 2009, and to compare the forest age of the data in 2009 with the estimated forest age results. Three hundred forest plots were selected from the data at three sites for the validation and accuracy evaluation of the forest age.

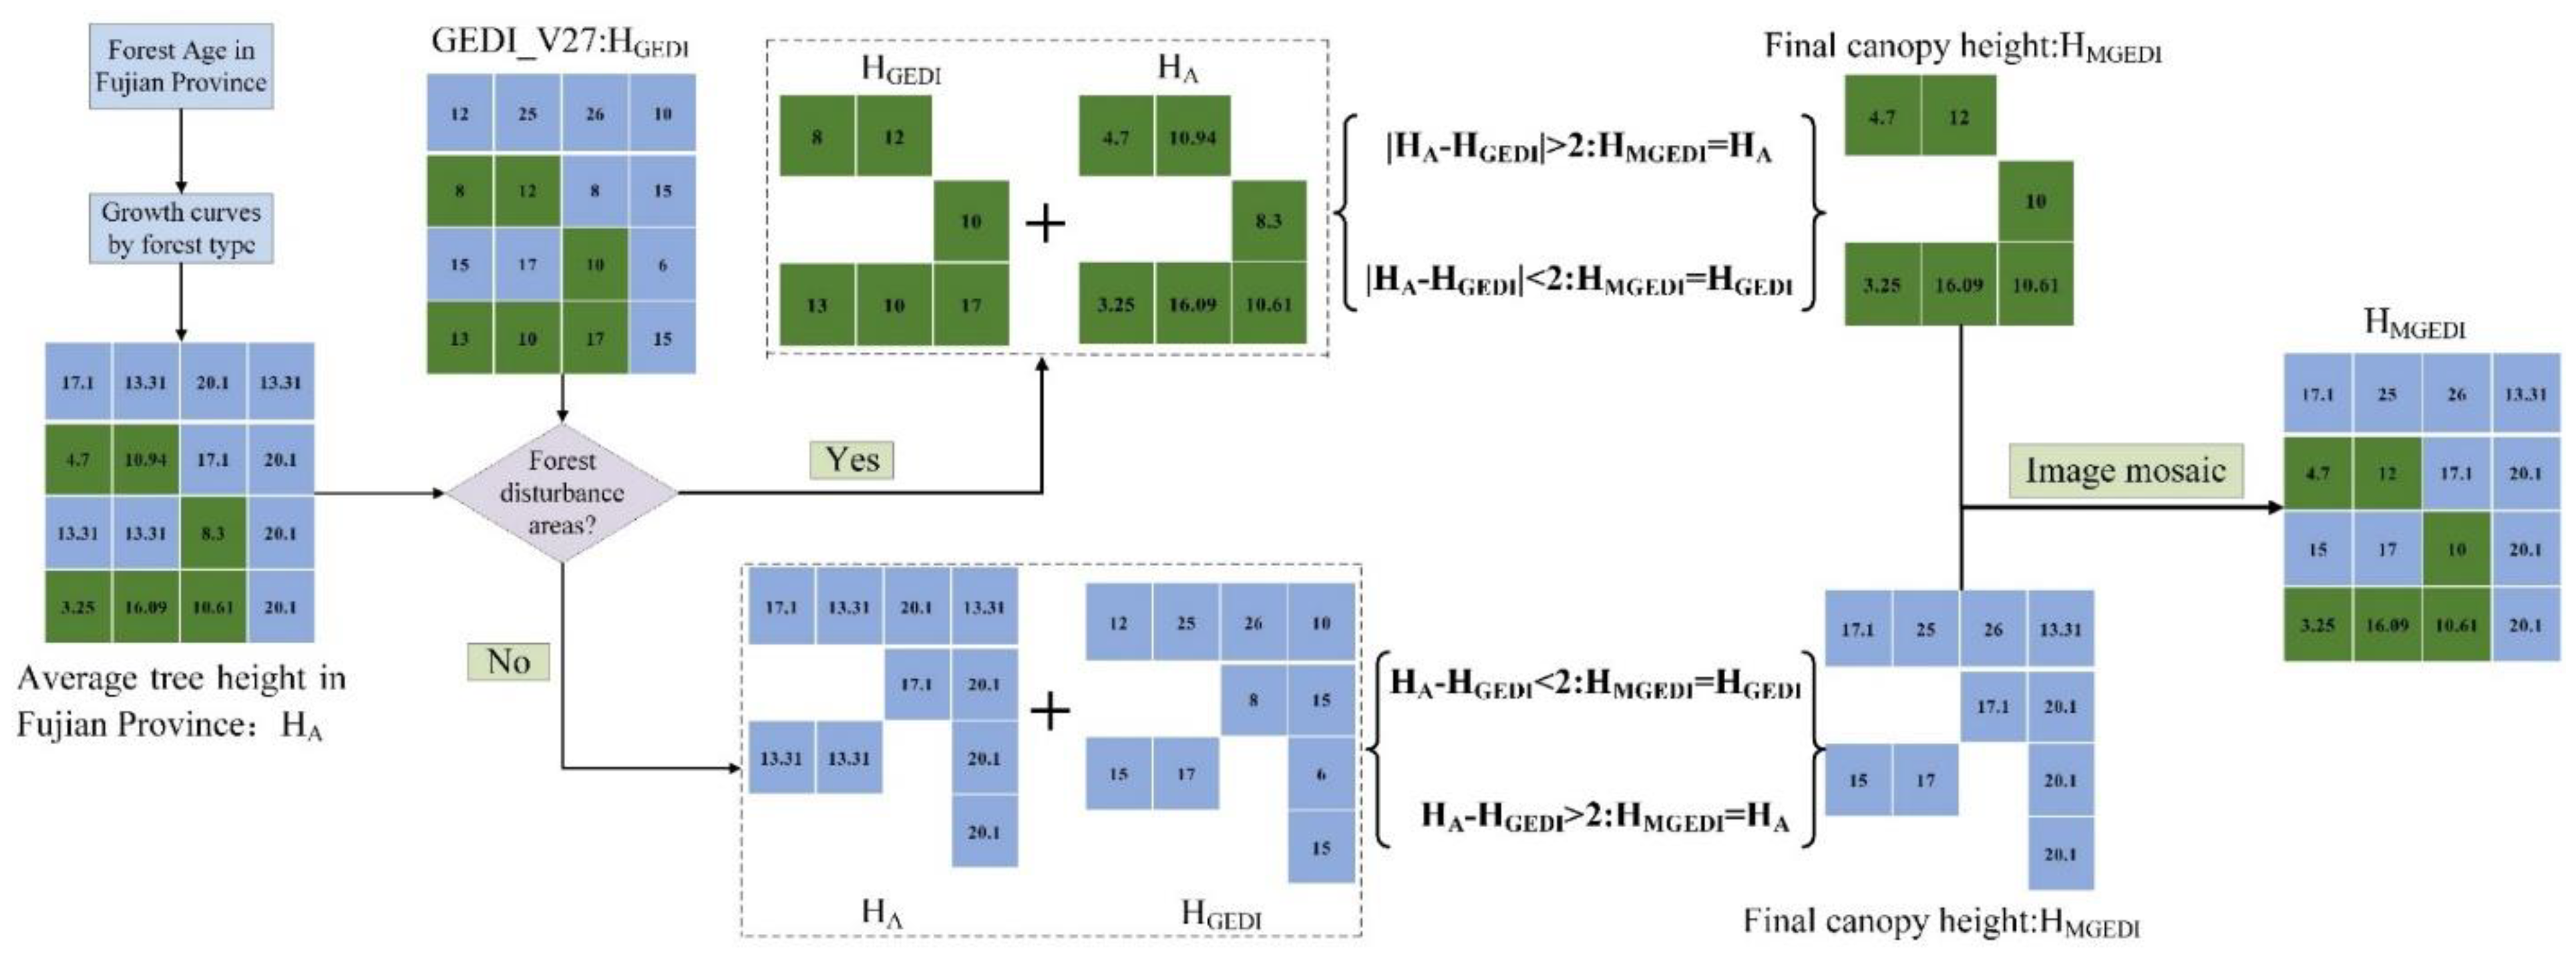
3.3. Canopy Height Estimation

The process of canopy height estimation has two steps (Figure 7). The first step is to combine the forest age factor and the forest type growth curve for tree height estimation for the average tree height distribution in Fujian. The second step is to combine that with the average tree height distribution with the GEDI_V27 to obtain the final canopy height model: the modified GEDI_V27 (MGEDI_V27). In terms of determining the average tree height, this modified model has the advantage of not being limited by environmental factors, but the tree height of the same stand age has a certain fluctuation range. The GEDI_V27 shows a large difference in the accuracy of the canopy height estimated by the model in different areas. Based on a large number of sample datasets, we found that the average tree height in Fujian at the same age fluctuates within a range of 2 m, and only a small fraction will have a relatively large error due to special tree species. Therefore, in this paper, 2 m is the threshold value for combining the average tree height with the GEDI_V27 canopy height products. In the area of Fujian where the slope is less than 15°, the canopy height of the GEDI_V27 is selected. For other areas, the following strategy was employed in the merging process: if the difference between the mean tree height and the height value of the GEDI_V27 was within the range of 2 m, then the GEDI_V27 was considered to be an accurate estimation, therefore, the canopy height of the MGEDI_V27 was used as the canopy height value of the GEDI_V27. Within a forest disturbance area, since the forest age and the average tree height were a one-to-one correspondence, when the difference between the average tree height and the height value of the GEDI_V27 was greater than 2 m, we decided that the GEDI_V27 deviated from the growing range of tree height and considered the average tree height as the canopy height of the area. In an undisturbed forest area, since the average tree height was the minimum threshold, when the height value of the GEDI_V27 was greater than this threshold, the value of the GEDI_V27 was selected as the canopy height of the MGEDI_V27, and when the GEDI_V27 value was lower than the average tree height and the difference was more than 2 m, the average tree height was used instead of the canopy height.

3.4. Accuracy Verification of Canopy Height

The canopy height accuracy validation process is divided into the following two steps: The first step is to use the sample set to statistically analyze the canopy height model product GEDI_V27 and assess its accuracy through statistical quantities. The second step is to use the sample set to evaluate the accuracy of the modified forest canopy height model and compare it with the accuracy of the GEDI_V27 to test the effectiveness of this study’s approach.
The sample dataset was uniformly resampled to a 30 m resolution and was then compared with the canopy height model. The following three statistical parameters were calculated: the coefficient of determination (R2), the root mean squared error (RMSE), and the mean absolute deviation (MAE), as follows:
R 2 = 1 i = 1 n ( x i y i ) 2 i = 1 n ( y i y ¯ ) 2
RMSE = 1 n × i = 1 n ( x i y i ) 2  
MAE = 1 n × i = 1 n ( | x i y i | )
where x is the canopy height of the canopy height model; y is the canopy height in the sample data; n is the number of samples, and y ¯ is the mean of the canopy height of the sample set.

4. Results

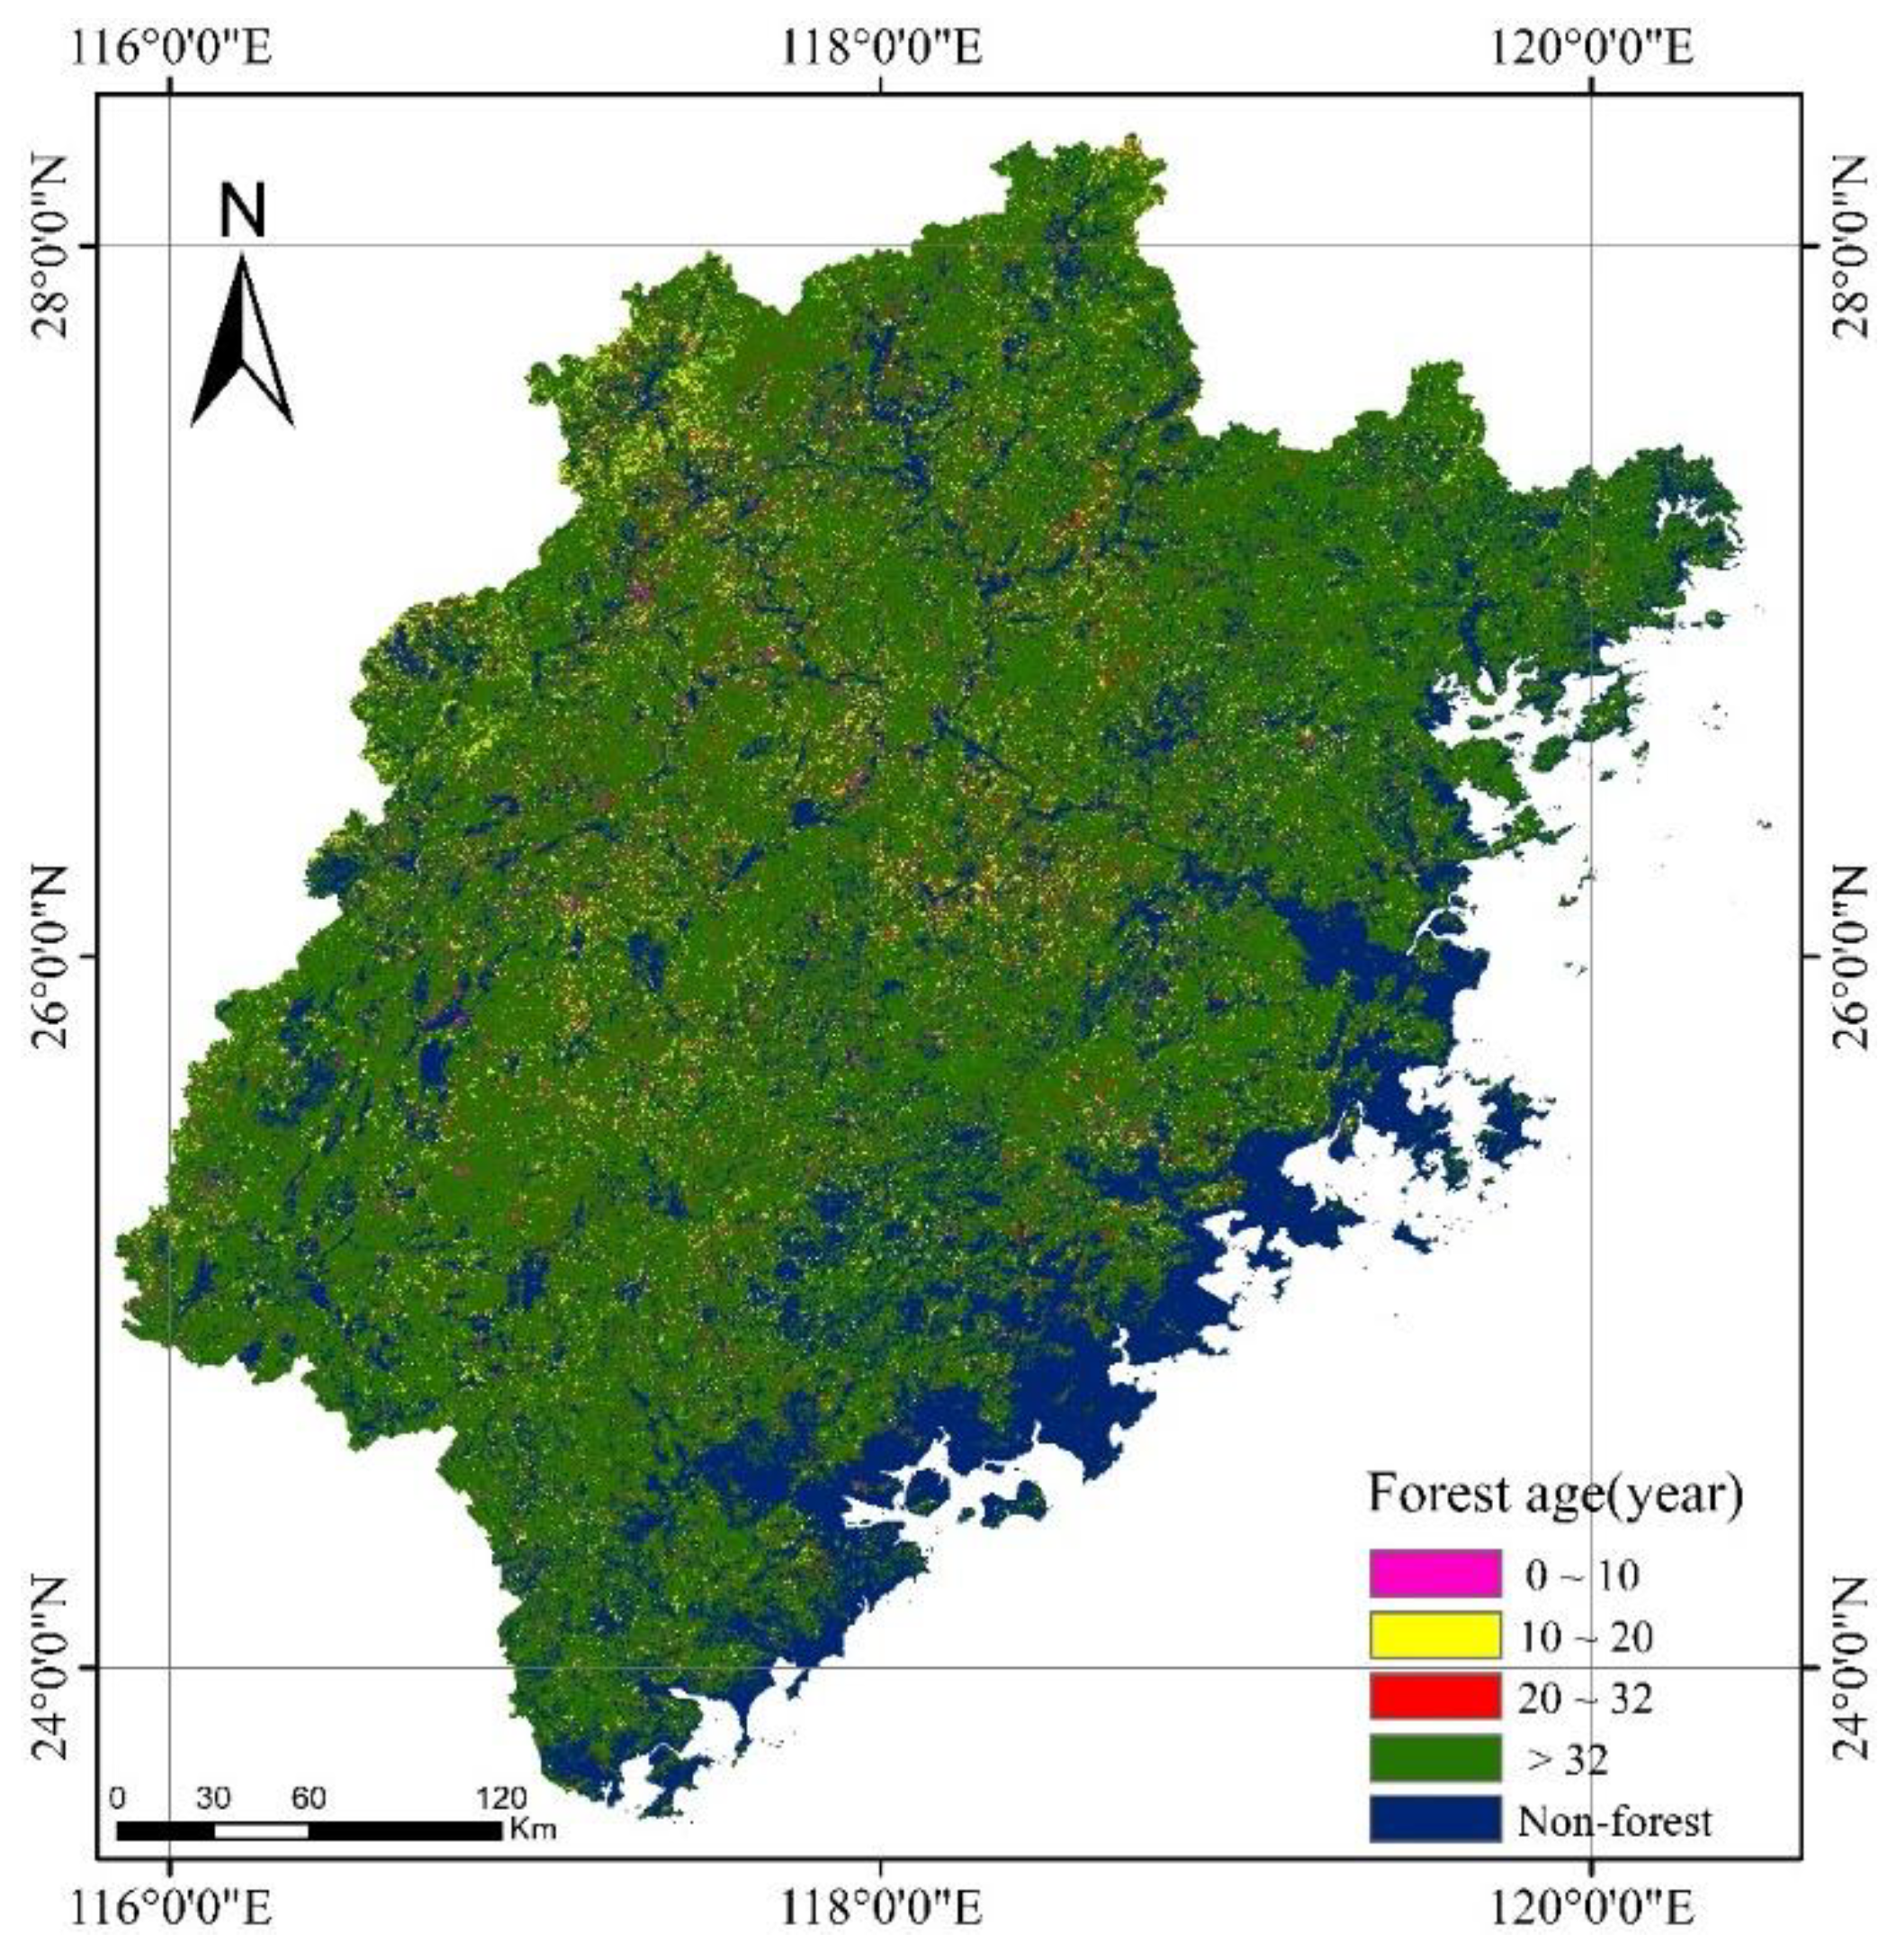
4.1. Forest Age Estimation Results

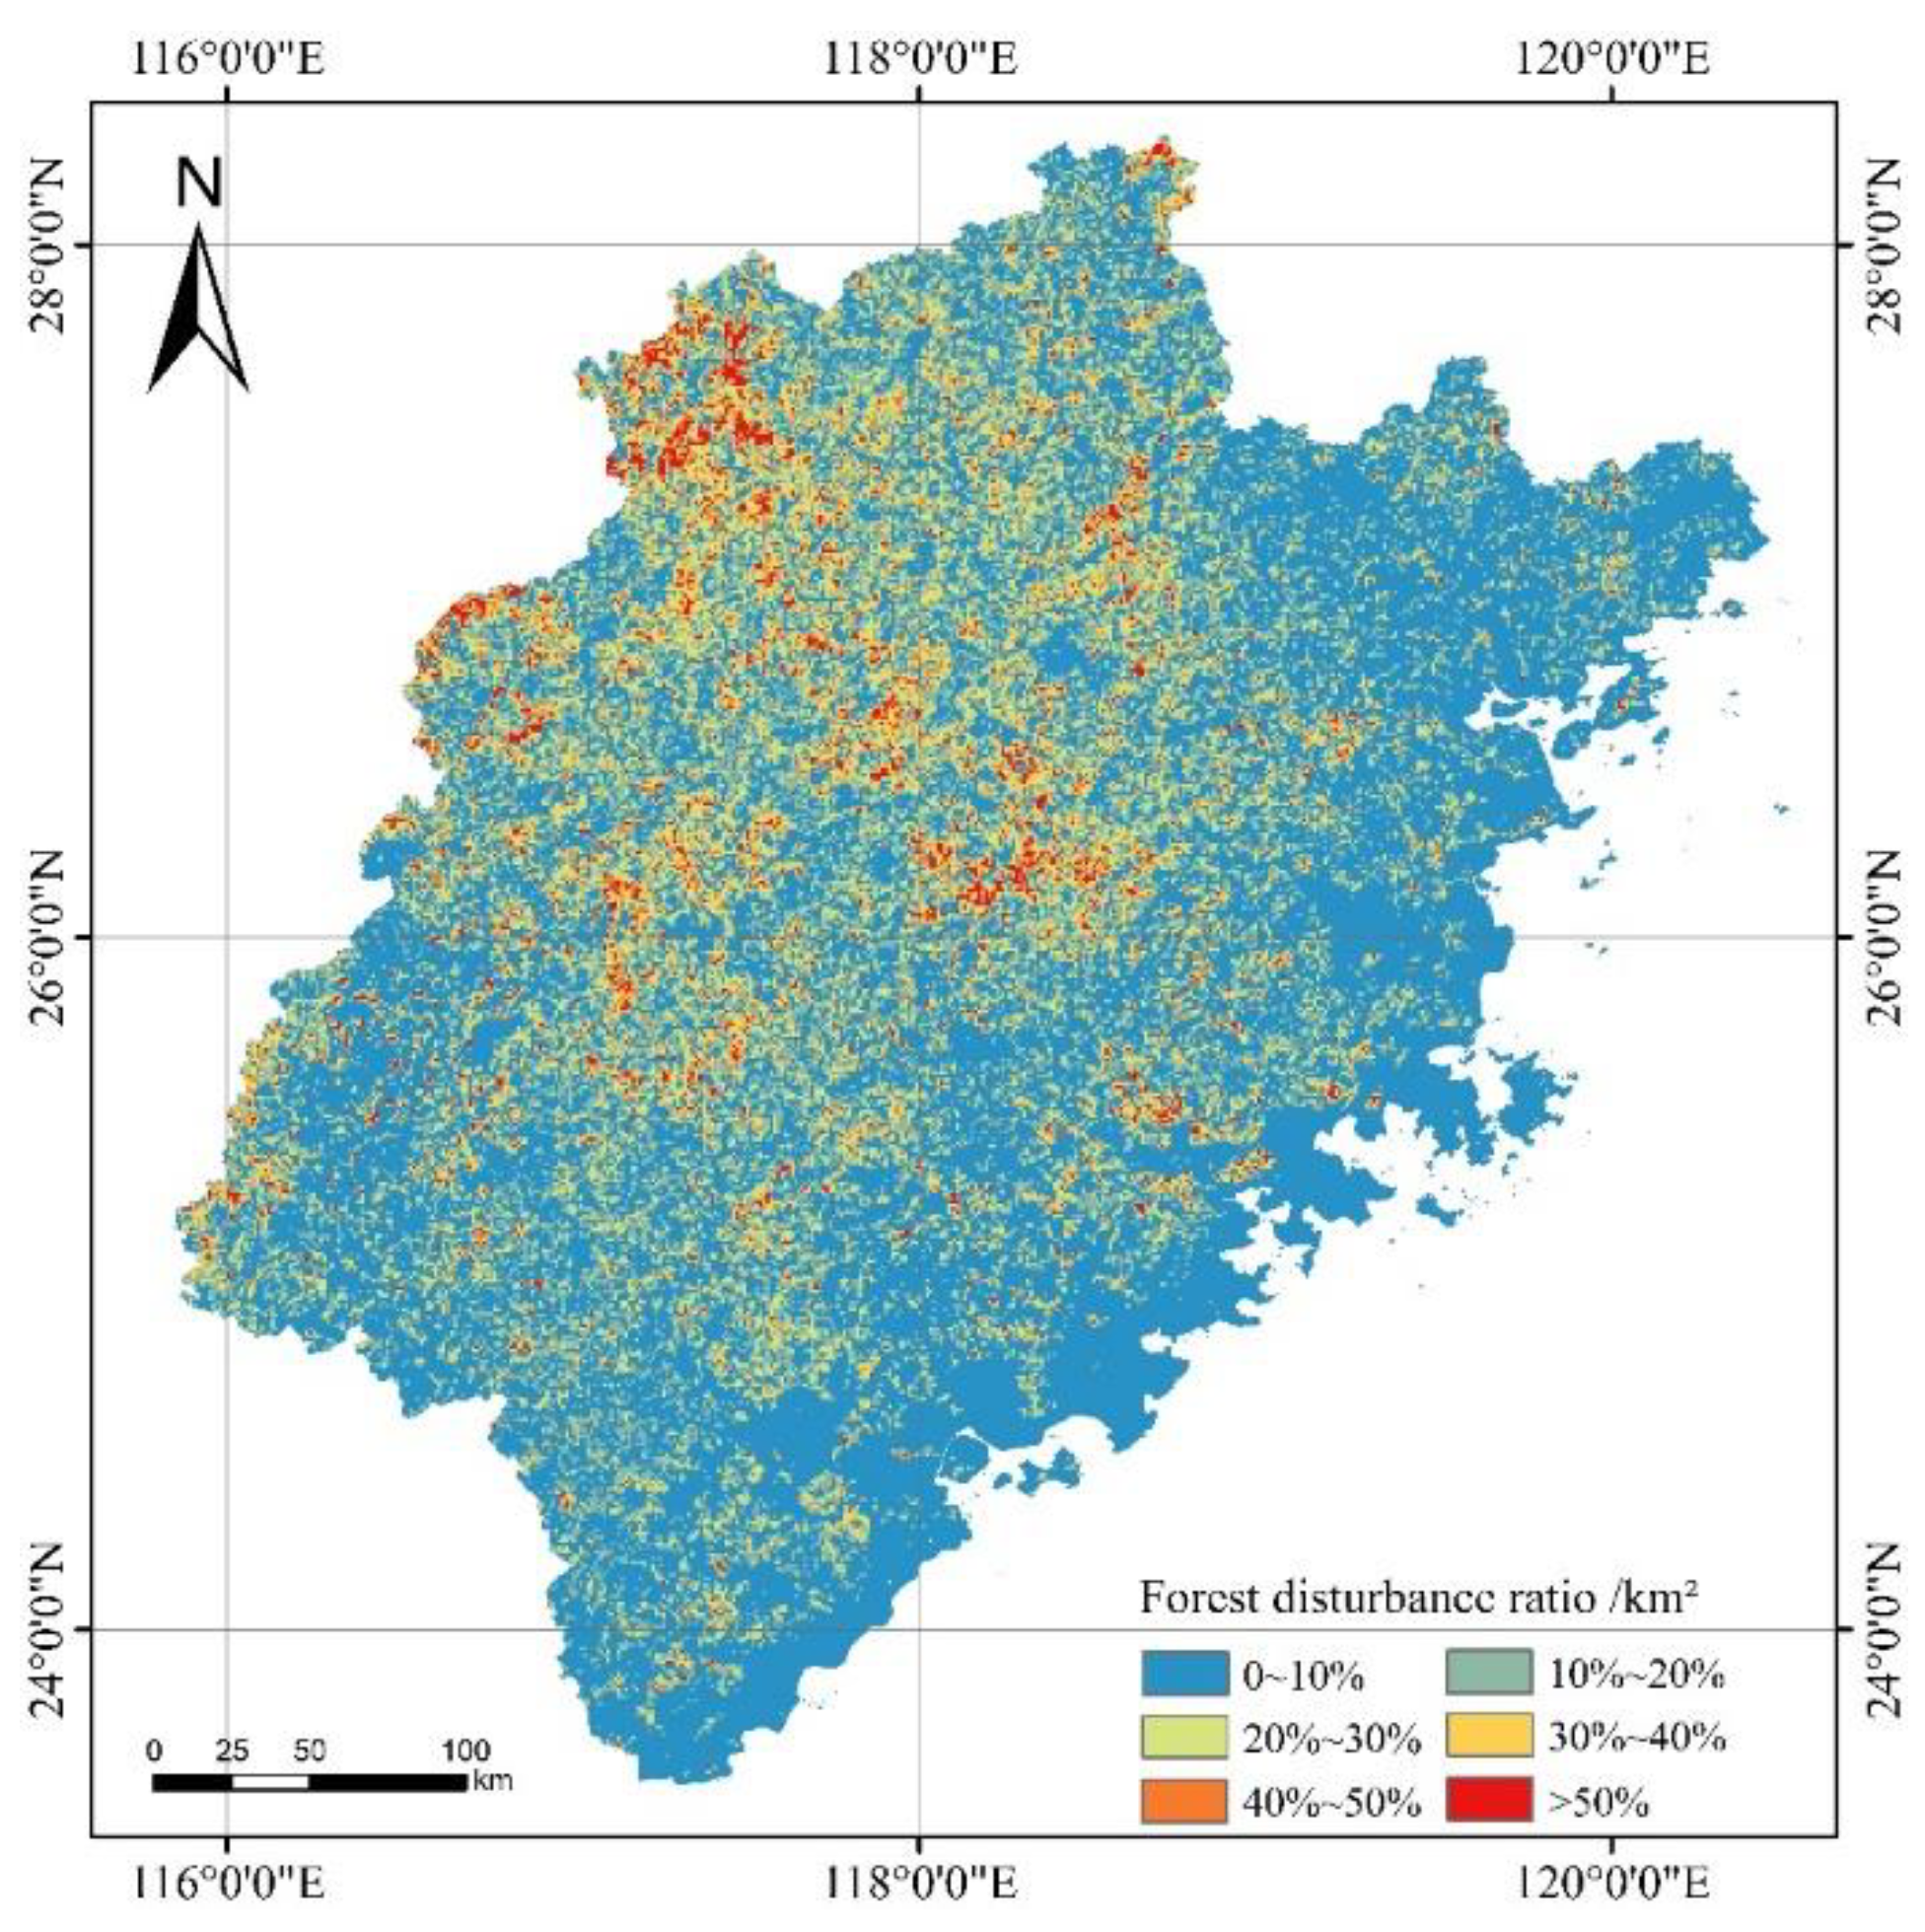
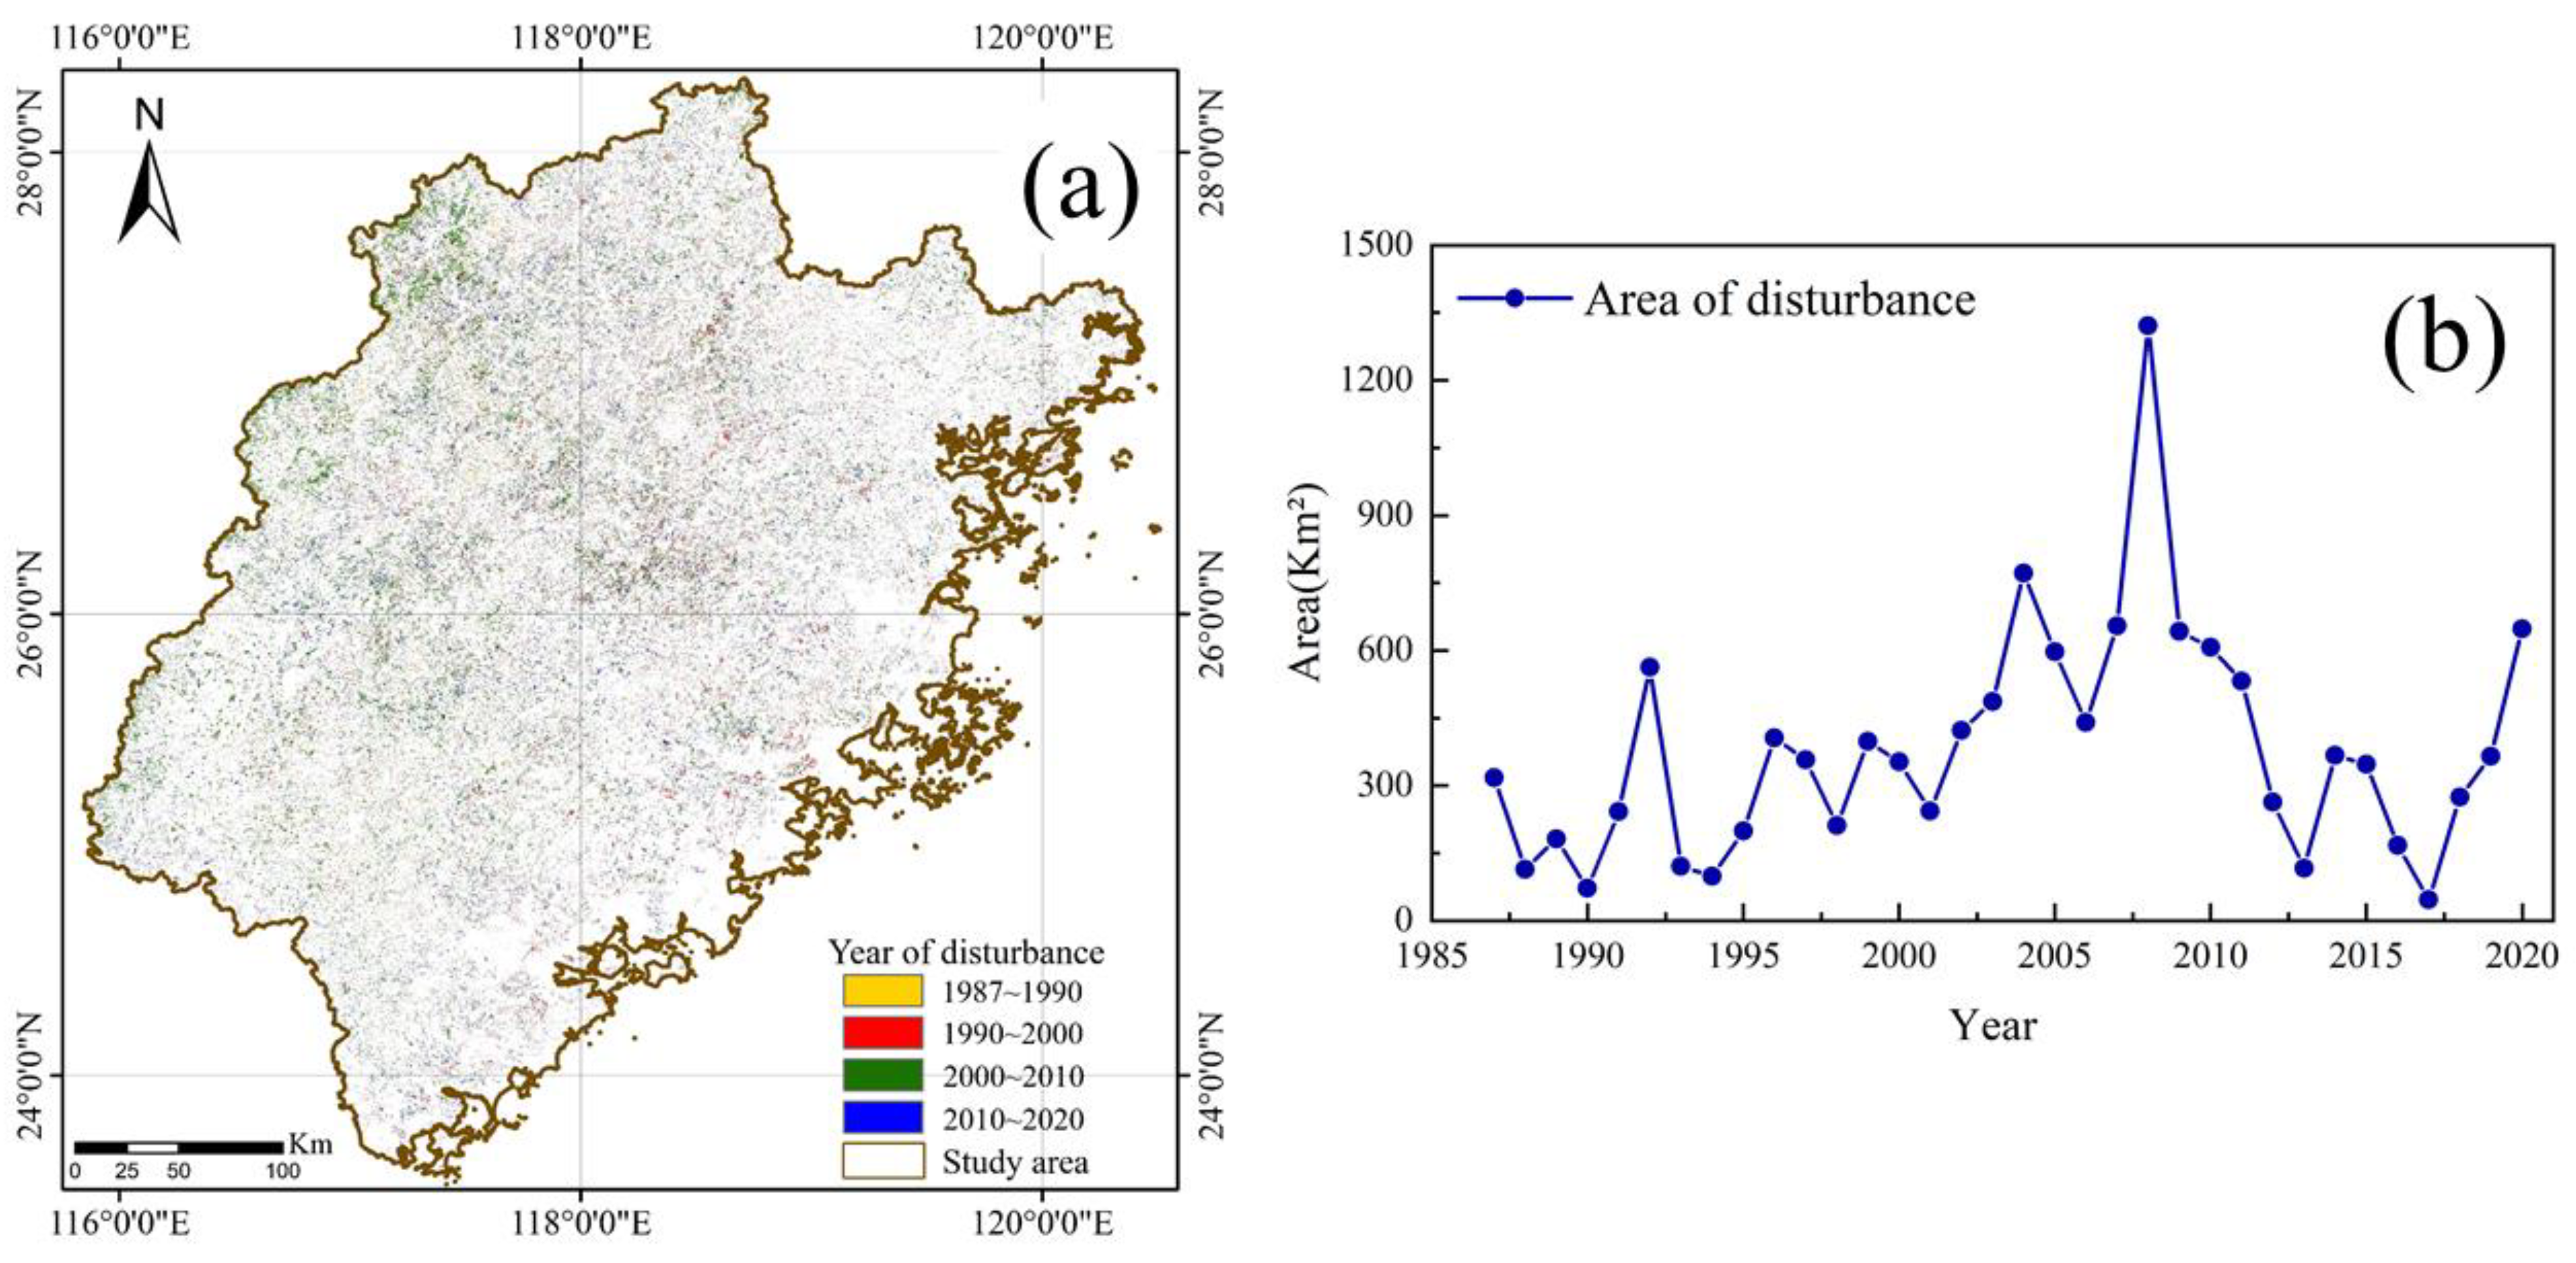
4.1.1. Disturbed Area Feature Extraction Results

We extracted the forest disturbance area in Fujian based on the LandTrendr algorithm. From 1987 to 2020, strong forest disturbances, such as deforestation and forest fires, in Fujian accounted for 13.22% of the forest area, among which the western and central parts of Fujian were subject to more forest disturbance, and the distribution ratio of this area per square kilometer was mostly less than 30% (Figure 8). We also plotted the time and temporal trends of the forest disturbance in Fujian, from which we can see that the area of forest disturbance in Fujian did not fluctuate regularly, with a large area of forest disturbance occurring between 2005 and 2010 (Figure 9a,b).

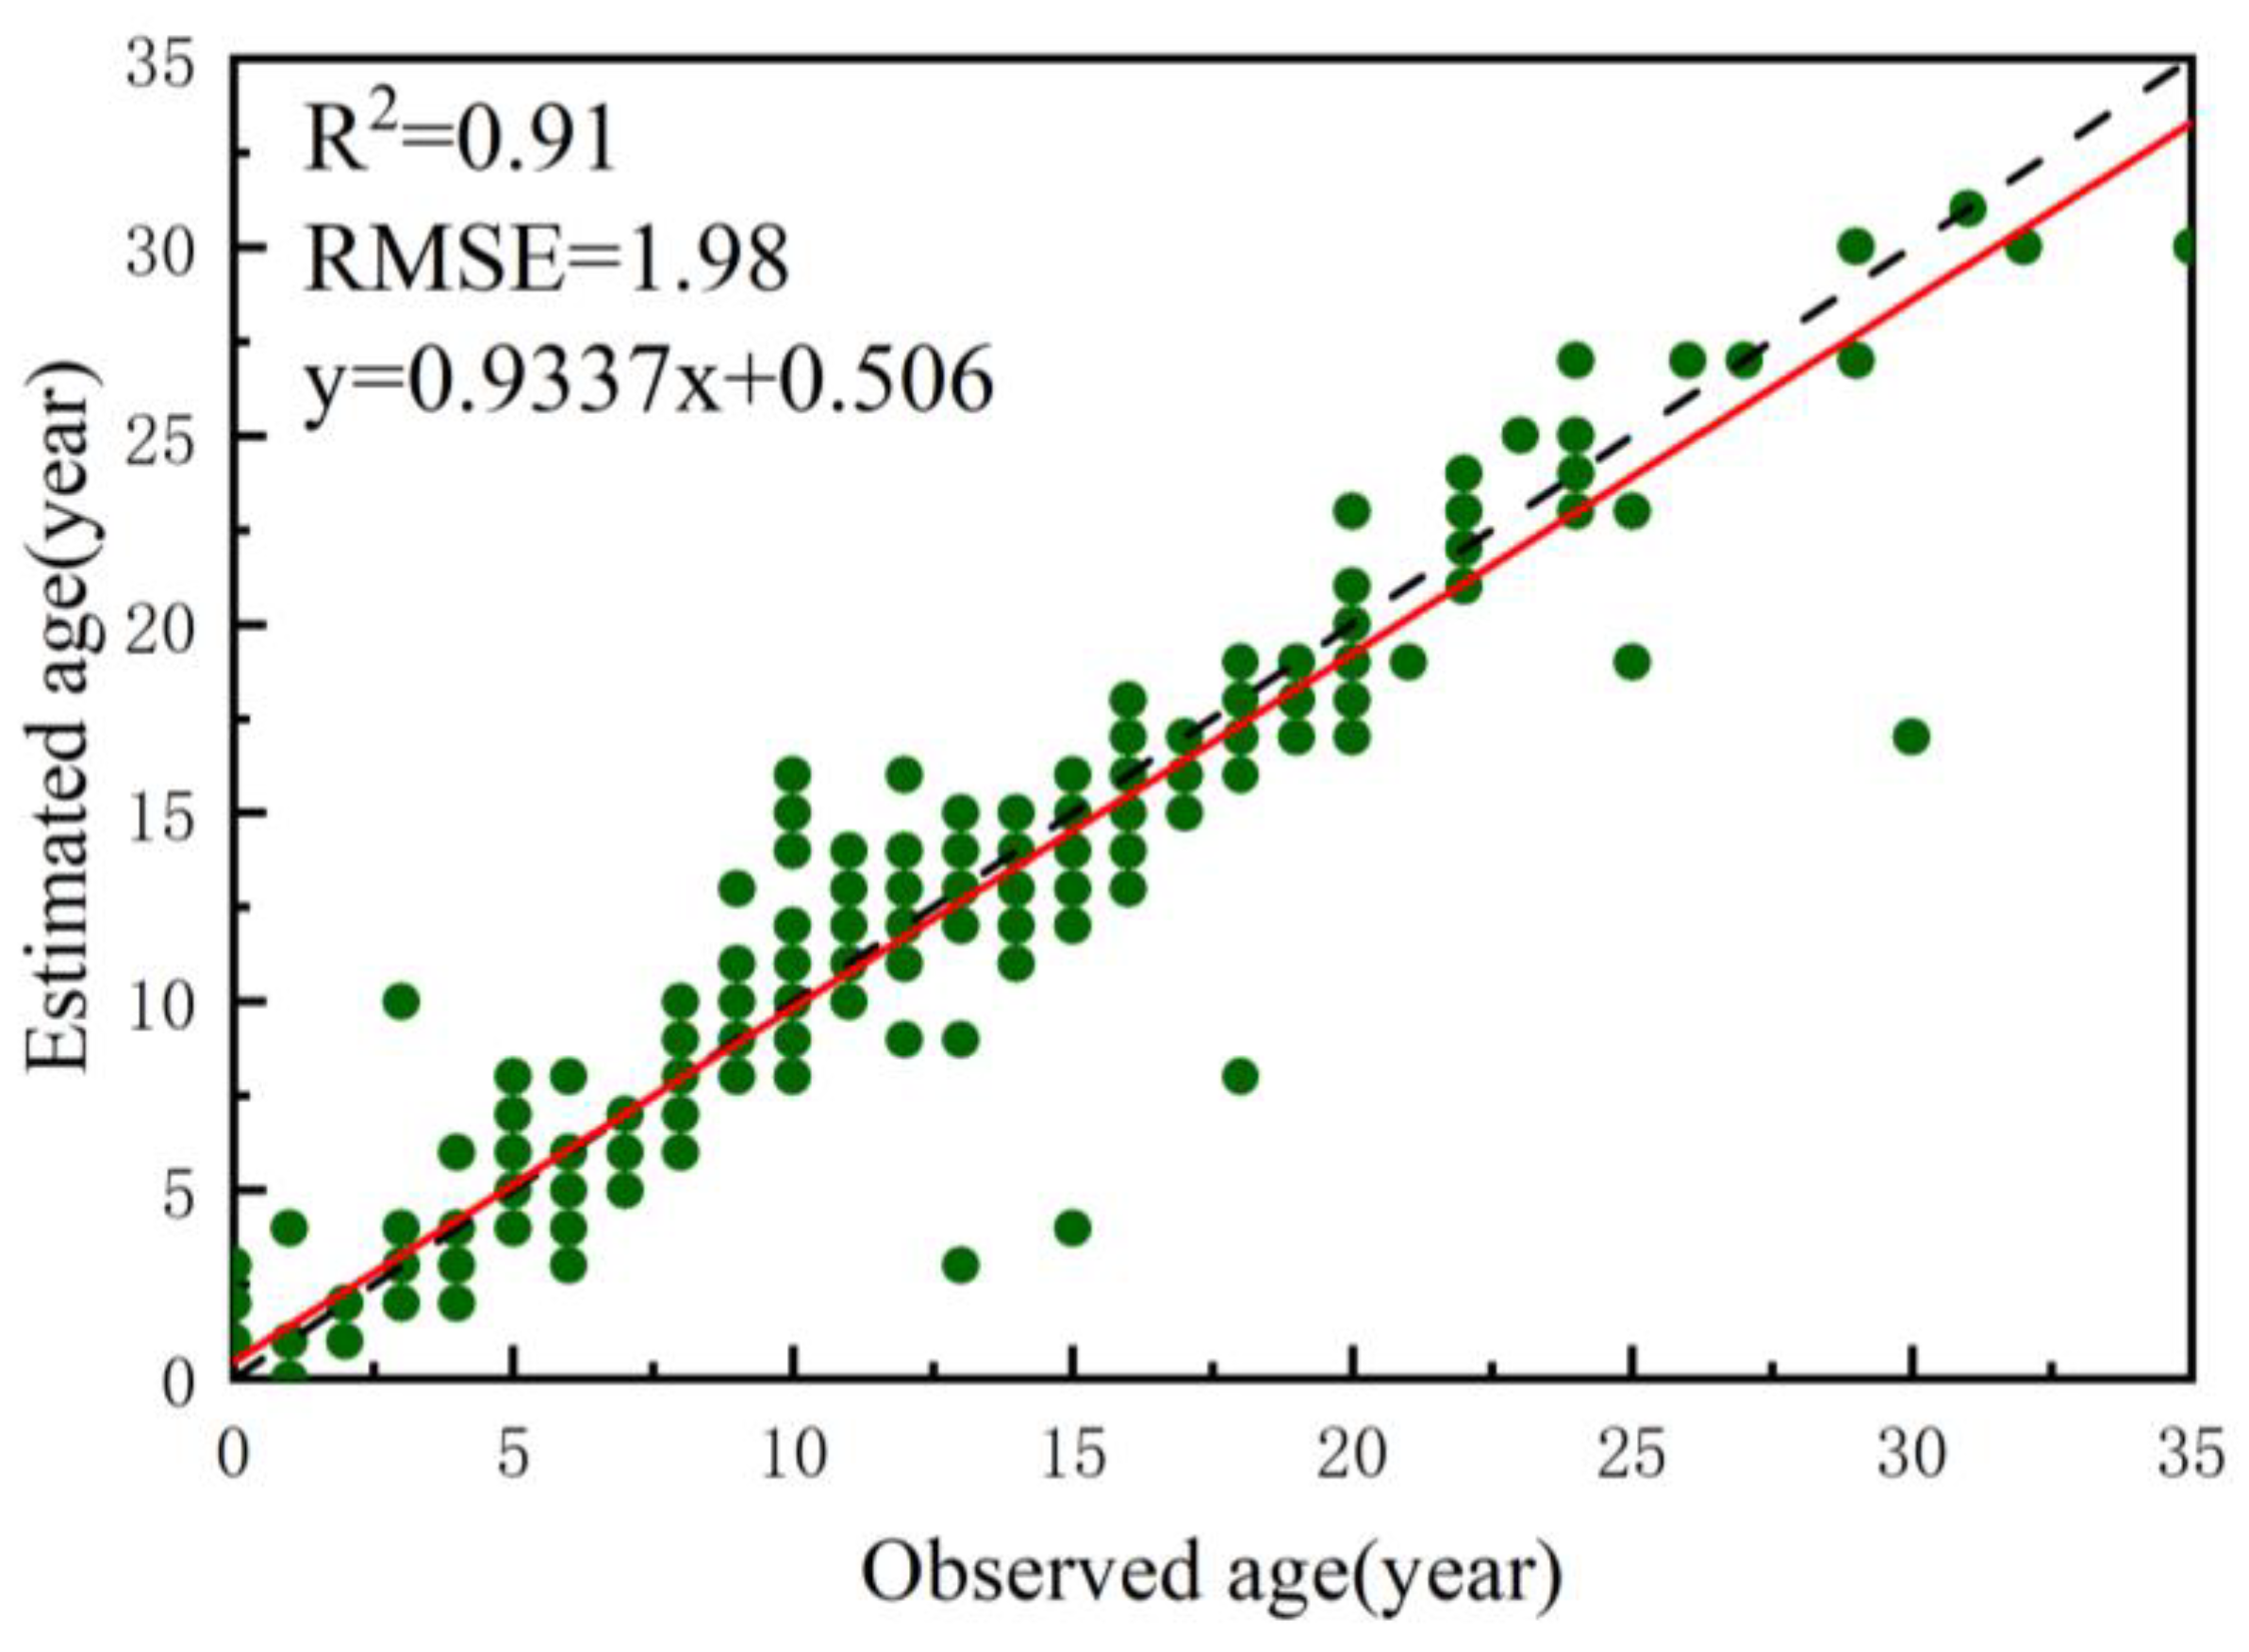
4.1.2. Accuracy Evaluation of Forest Age Results

Based on the characteristics of the disturbance area, the specific forest age of the disturbance area in Fujian can be calculated, while the age of the non-disturbance area takes the maximum forest age of the disturbance area as the minimum threshold, and the forest age distribution of Fujian in 2020 was mapped (Figure 10). Overall, most of the stands were older than 32 years, while within the disturbance area, the estimated forest age had a mean of 14.98 years, with a standard deviation of 7.5 years.
In this study, forest sub-compartment datasets from three cities, Mingxi, Jiangle, and Xiamen, were selected as reference data, from which 300 samples were randomly selected in order to verify the accuracy of the forest age. The estimated stand age results showed good agreement with three validation datasets (Figure 11, R2 = 0.91; RMSE = 1.98 years).

4.2. Canopy Height Estimation and Accuracy Assessment

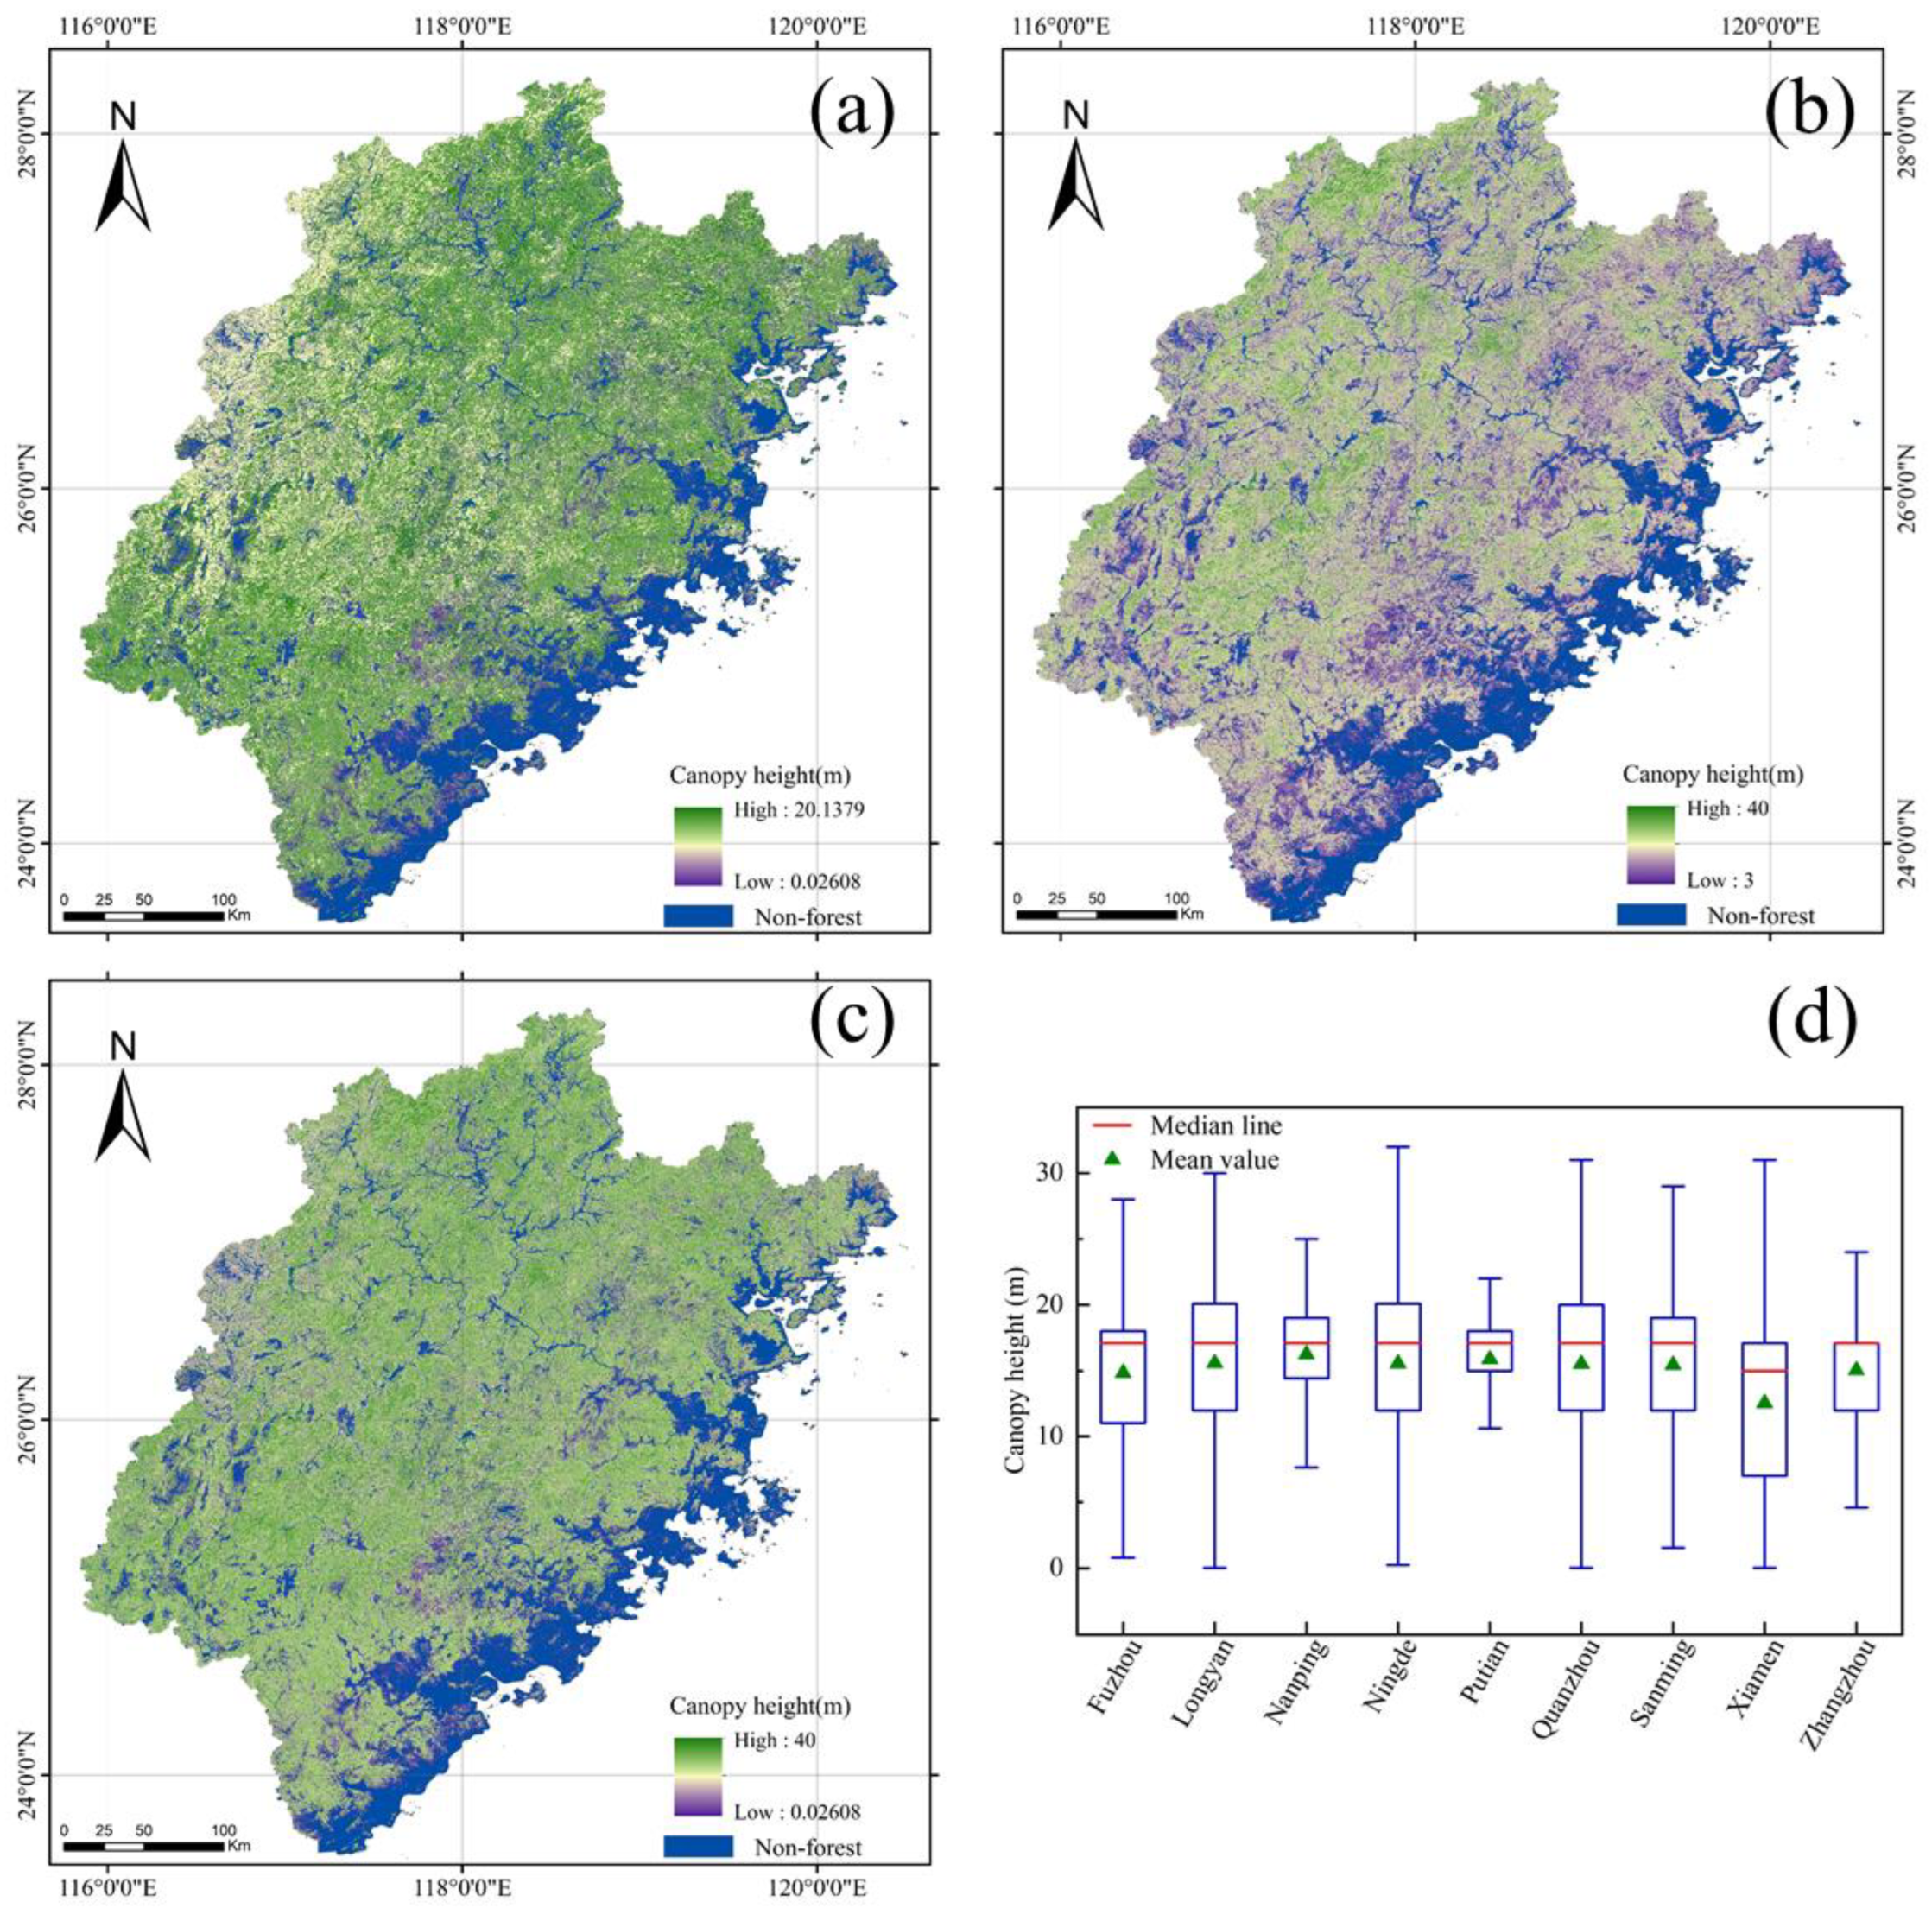
4.2.1. Canopy Height Estimation Results

The GEDI_V27 canopy height product, as well as the average tree height that was derived from the forest age (TH_A) in this paper, are shown in Figure 12a,b. The total average canopy heights of the TH_A and the GEDI_V27 in Fujian were 16.07 m and 11.92 m, with a standard deviation of 3.43 m and 4.68 m, respectively. According to the merging strategy in the method of this paper, the average tree height distribution was merged with the GEDI_V27 canopy height model in order to obtain the final canopy height distribution of Fujian in 2020 at a 30 m resolution (Figure 12c). Overall, the forest canopy heights in most of these areas ranged from 10 to 20 m. The mean of the MGEDI_V27 was 15.04 m, with a standard deviation of 4.98 m. Based on the spatial distribution, the forests in Northwestern and Central Fujian were relatively taller than the forests in Southeastern Fujian. The mean canopy height of all of the prefecture-level cities in Fujian ranged from 12.53 to 26.26 m. The differences between Xiamen and the other cities were larger than those between the other cities (Figure 12d).

4.2.2. Accuracy Evaluation

In order to evaluate the validity of the canopy height estimation method that was used in this study, the accuracy of the GEDI_V27 and the MGEDI_V27 canopy height model was evaluated using 5299 sample points. In the evaluation results, we observed that the GEDI_V27 canopy height model has a low accuracy and a poor agreement with the sample set (Figure 13a, R2 = 0.39, RMSE = 3.15 m, MAE = 2.37 m), while the accuracy of the MGEDI_V27 canopy height model, which was obtained by combining the optical images with the GEDI data, is a significant improvement (Figure 13b, R2 = 0.67, RMSE = 2.24 m, and MAE = 1.85 m). The results thus show that the MGEDI_V27 compensates for the defects of the GEDI satellite-based LiDAR canopy height model to a certain extent. In addition, in order to visualize the advantages of combining the time-series optical remote sensing and the satellite-based LiDAR methods to estimate forest canopy height in subtropical mountainous areas, we plotted the observed canopy height values of some of the sample points and the two canopy height models, as shown in Figure 14. The comparison chart shows that the MGEDI_V27 is more concentrated in the observed value range, which means that the interference that is caused by external factors is reduced. The accuracy of the forest canopy height estimation in Fujian is, therefore, effectively improved.

5. Discussion

Fujian is extremely rich in forest resources, and the effective monitoring of forest resources is important for the stability of the Fujian ecosystem and the spatial analysis of forest carbon sinks [45]. Among the many forest parameters, canopy height is extremely important, but is difficult to obtain [46]. We attempted to use the methods from [14,15,47], however the results were poor, and the accuracy of the obtained results was very low. In addition, we evaluated the new canopy height product [19,20] using a sample dataset from Fujian and found that the accuracy was only about 0.4. The main reason for this is that the GEDI footprint data in Fujian are too sparse, while the environmental gradients in the mountainous region vary greatly, and the change process is highly complex and uncertain [48,49]. Therefore, it is important to address how these problems can be solved while preserving the advantages of satellite-based LiDAR for fast and effective measurements of forest canopy height. This paper combines long-time-series remote sensing images with satellite-based LiDAR canopy height in order to estimate the forest canopy height in a subtropical mountainous region, compensating for the fact that using long-time-series optical image features to estimate the forest tree height can easily reach saturation, while reducing the errors in satellite-based LiDAR canopy height acquisition [50,51,52,53]. In order to investigate the validity of the method, many local multi-source sample datasets were collected in this paper, such as the following: airborne LiDAR, UAV visible light data, tree height measurements in the field, and inventory plot data. We used these sample sets to compare the accuracy of the satellite-based LiDAR GEDI_V27 canopy height model and the MGEDI_V27 (R2, RMSE, and MAE improved by 71.79%, 33.13%, and 22.53%, respectively), and the effectiveness of the method was confirmed. In addition, we also determined the distribution of forest disturbance in Fujian since 1986, the distribution of forest disturbance duration, the distribution of forest age in Fujian in 2020, and the growth curves of the major forest types in Fujian. The research results can provide important technical support in such tasks as the estimation of the stockpile volume, biomass estimation, and carbon sink analysis, and have important significance for forest ecological protection and management in Fujian.
In order to test the validity of this paper, we evaluated the accuracy of two canopy height models according to different forest age groups and slope classes. The forest age was divided into the following three age groups [54]: young forests (0–10 years), middle-aged forests (10–20 years), and mature forests (>20 years), and the slope class was divided into the following five classes: 0–10°, 10–20°, 20–30°, 30–40°, and >40°. The results suggest that the MGEDI_V27 shows an improved canopy height accuracy in all of the age groups and in the different slope classes. For the three age groups, we used 4981 forest plots from the forest plot survey data and included the forest age attributes as reference samples for accuracy verification. The accuracy of the GEDI_V27 was relatively low in all of the age groups (Figure 15), especially in the young forest plots (R2 = 0.18, RMSE = 4.03 m, MAE = 3.14 m). The MGEDI_V27 concentrated more on the forest canopy height values from the field survey in all three of the age groups (Figure 16, R2 = 0.33–0.55, RMSE = 2.15–2.27 m, MAE = 1.78–2.04 m). For the slope class, we used 5299 forest plotsas a reference sample for accuracy verification. The canopy height product GEDI_V27 had the highest accuracy in the slope range of 0–20°, but the accuracy decreased if the slope was greater than 20°. However, it is worth noting that it is not that the canopy height accuracy of the GEDI_V27 decreases with a higher slope, but that the stability of the overall accuracy of the product of the satellite-based LiDAR decreases if the slope is greater than 20° (Figure 17, R2 = 0.32–0.45, RMSE = 2.47–3.38 m, MAE = 2.31–2.49 m). The MGEDI_V27 canopy height model is not affected by the slope (Figure 18, R2 = 0.64–0.75, RMSE = 2.01–2.34 m, MAE = 1.71–1.99 m). The accuracy of the MGEDI_V27 had less variation under the different slope levels and was not significantly affected by topographic factors. There are two reasons for the lower accuracy of the GEDI_V27 (Figure 15 and Figure 17). First, it uses the GEDI-derived RH95 index as the canopy height, which leads to a low forest canopy height in some areas. Second, the geographic positioning, especially in the mountainous areas where it is more complicated, suffers from a bias. Many other canopy height products have been obtained using satellite-based LiDAR [17,18,20,55]. In the future, we will further combine the advantages of various products in order to optimize the forest canopy height estimation approach.
Though the canopy height estimation method in this study shows great potential, there are still some limitations. First, the classification of the forest types is relatively rough, and some special tree species categories, such as eucalyptus and bamboo forests, have growth curves with unique characteristics. If more detailed tree species classification becomes available, then the method in this paper will more effectively improve the accuracy of the canopy height estimation. Second, the temporal resolution of the sample dataset that has been used in this paper is complex, and although it is as close as possible to the time of the GEDI data collection, there are still differences in the time of various data acquisitions, which may also cause some deviation in the canopy height in a small number of areas. Third, the growth curves of the forest types in this paper require a large amount of sample data, and, due to geographical limitations, the same forest types have different growth trajectories in different climates, therefore, the migration of the method in this paper needs to be enhanced. Fourth, in the undisturbed forest areas in Fujian, the forest sometimes does not grow normally, due to the influence of environmental factors. For example, the forests in Fujian that are above 1500 m in elevation do not exceed 10 m in height. Finally, although the GEDI footprint data are sparse in this study, the accuracy of the wall-to-wall satellite-based LiDAR data can be improved by using more advanced interpolation methods if the ICESat-2 data can be combined.

6. Conclusions

In this study, we demonstrate the utility of combining long time series Landsat satellite data with GEDI satellite-based LiDAR data to estimate forest tree height. In order to reduce the errors of satellite-based LiDAR data in complex areas, we produced a forest age distribution map of Fujian in 2020 that was based on long-time-series Landsat images and combined it with a large amount of historical forest plot inventory data in order to determine the relationship between the forest age and the average tree height of the coniferous forest, the broadleaf forest and the mixed forests in Fujian. We then combined this with the GEDI_V27 canopy height model in order to produce a modified forest canopy height in 2020. The main conclusions, which were verified by the accuracy of the estimation results, are as follows:
(1)
The LandTrendr algorithm can effectively estimate forest age, and the error is about one to two years after sample verification. The results show that most of the forest disturbance lengths in Fujian can be recovered in a one-year time range, and there are few forests with disturbance lengths of more than two years.
(2)
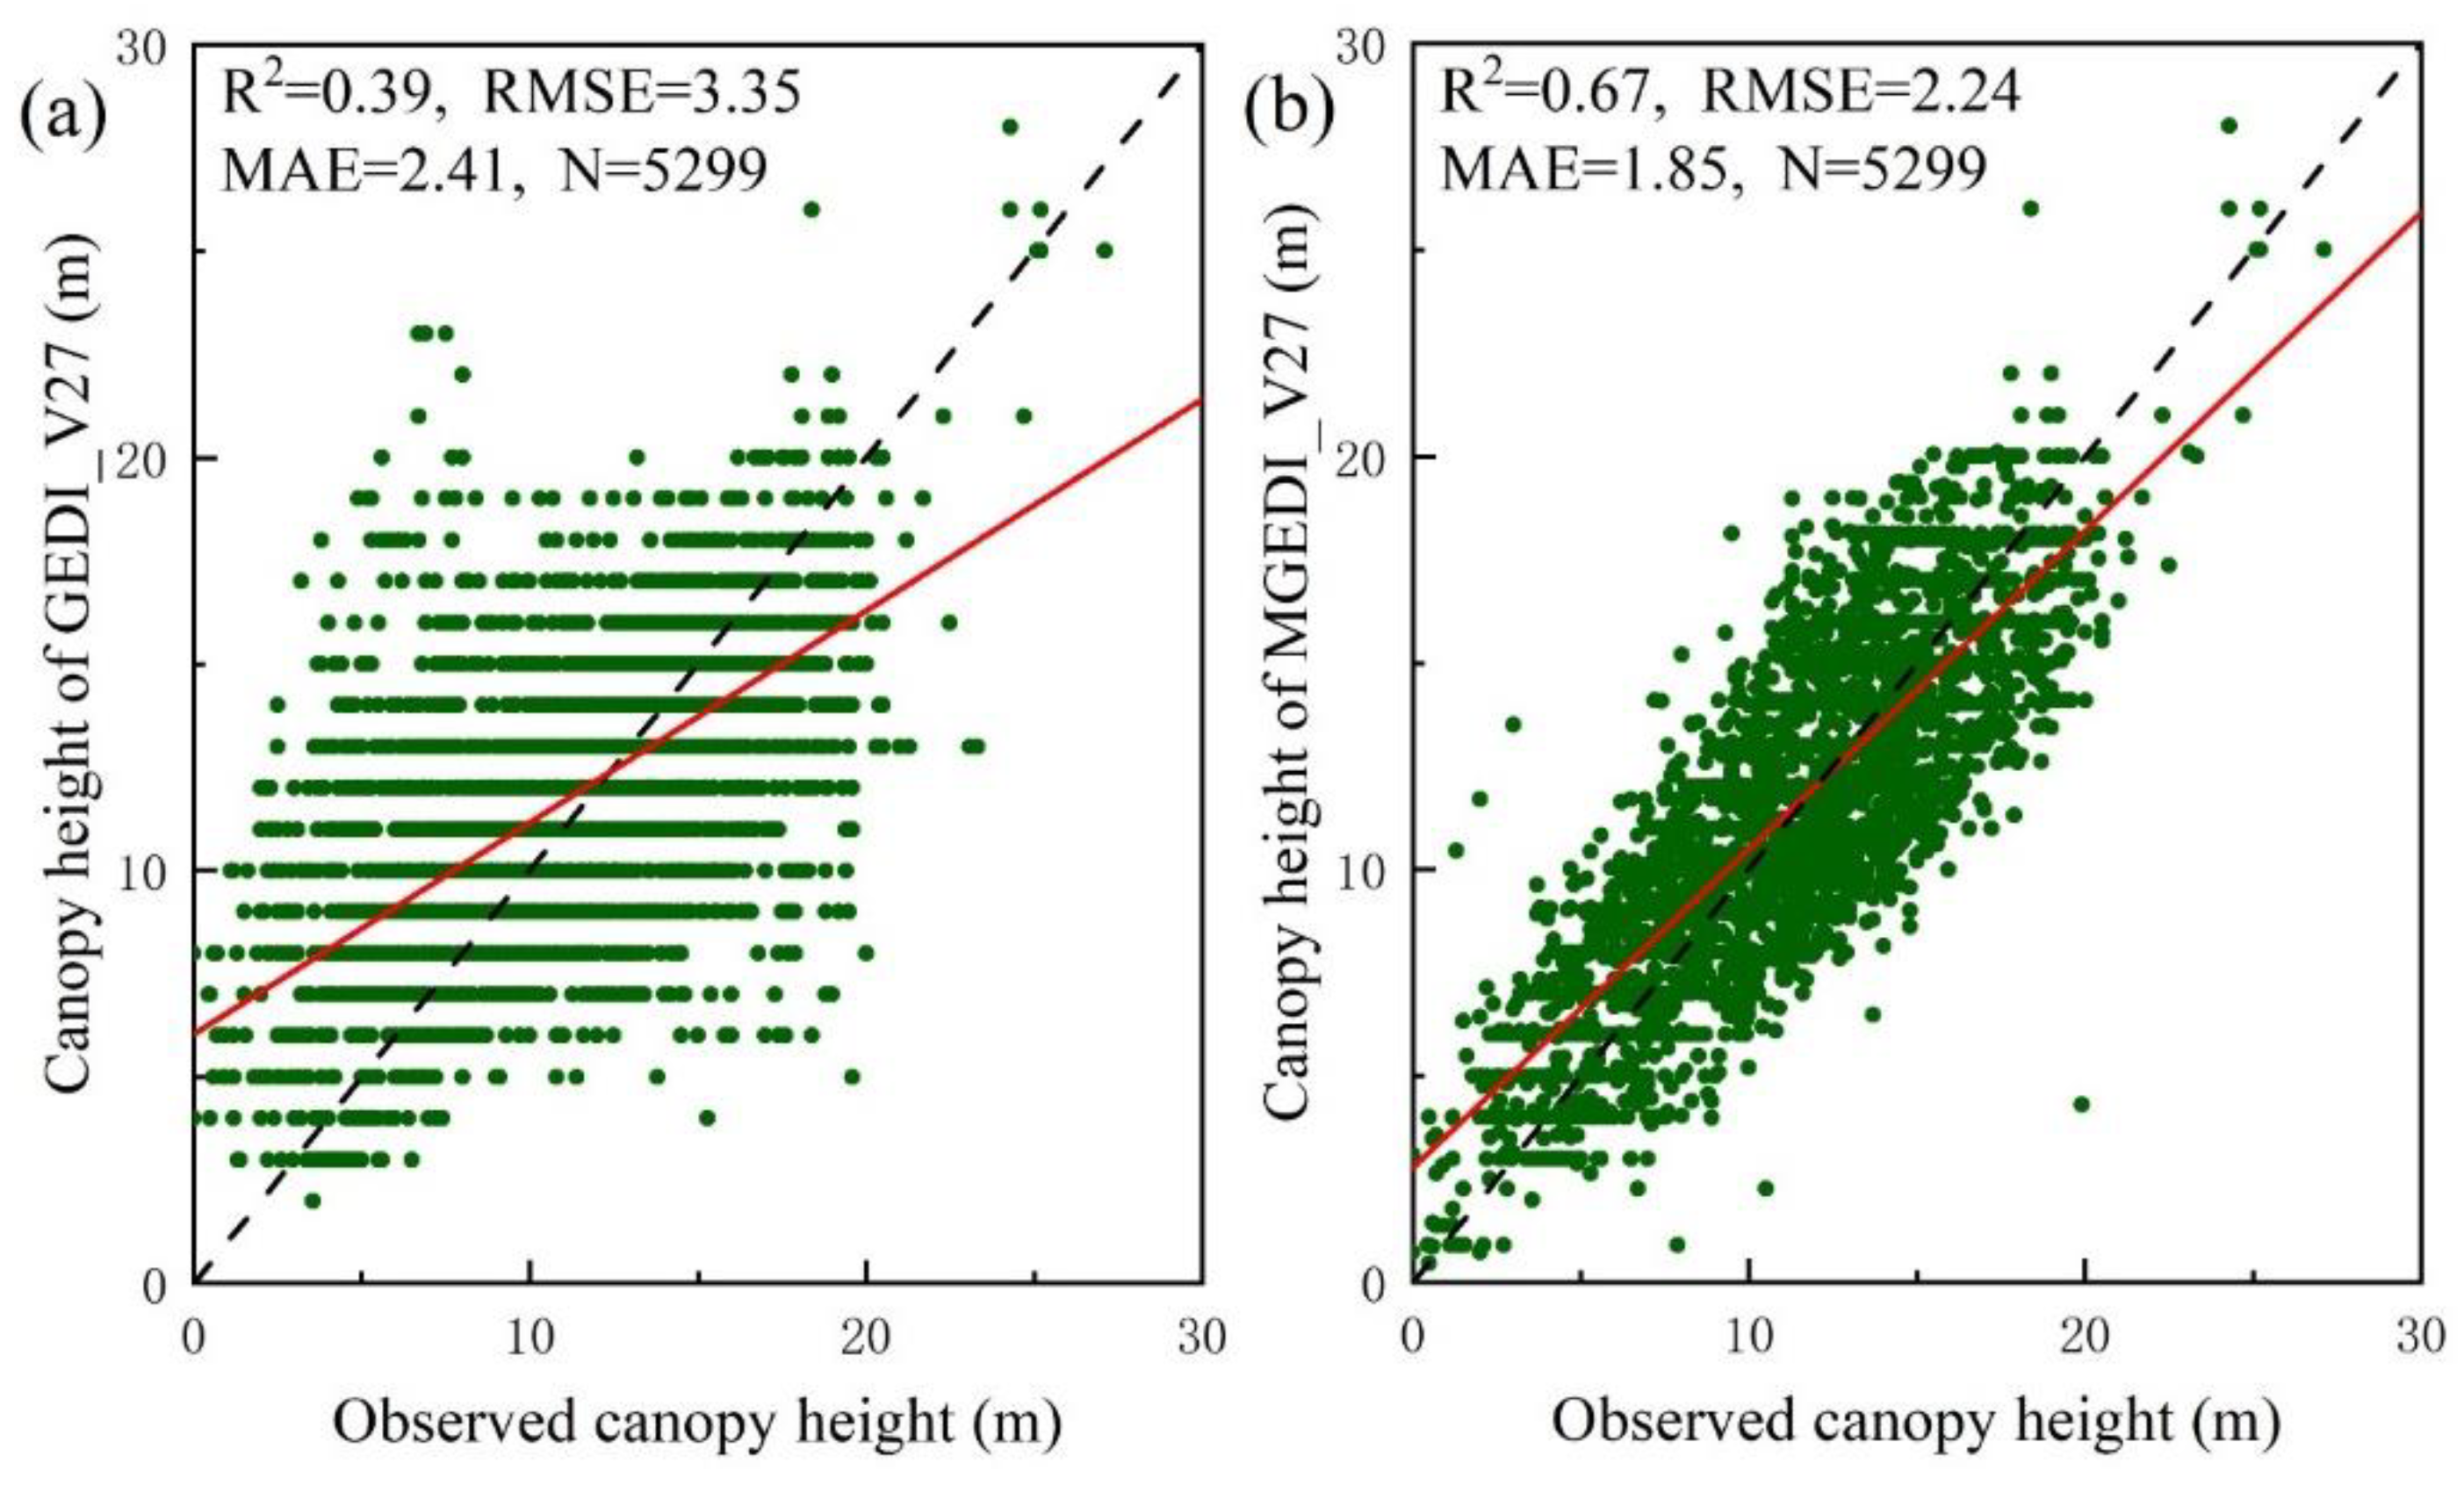
The canopy height products of the satellite-based LiDAR GEDI in Fujian are influenced by the topography and the climate, and the accuracy is lower than that of the global scale. Through the statistical analysis of the observed data, the results show that the R2 is 0.39, the RMSE is 3.35 m, and the MAE is 2.41 m. Therefore, relying only on the satellite-based LiDAR canopy height model cannot meet the needs of subsequent studies on estimating the forest stock, estimating the biomass, and analyzing the forest carbon sink potential.
(3)
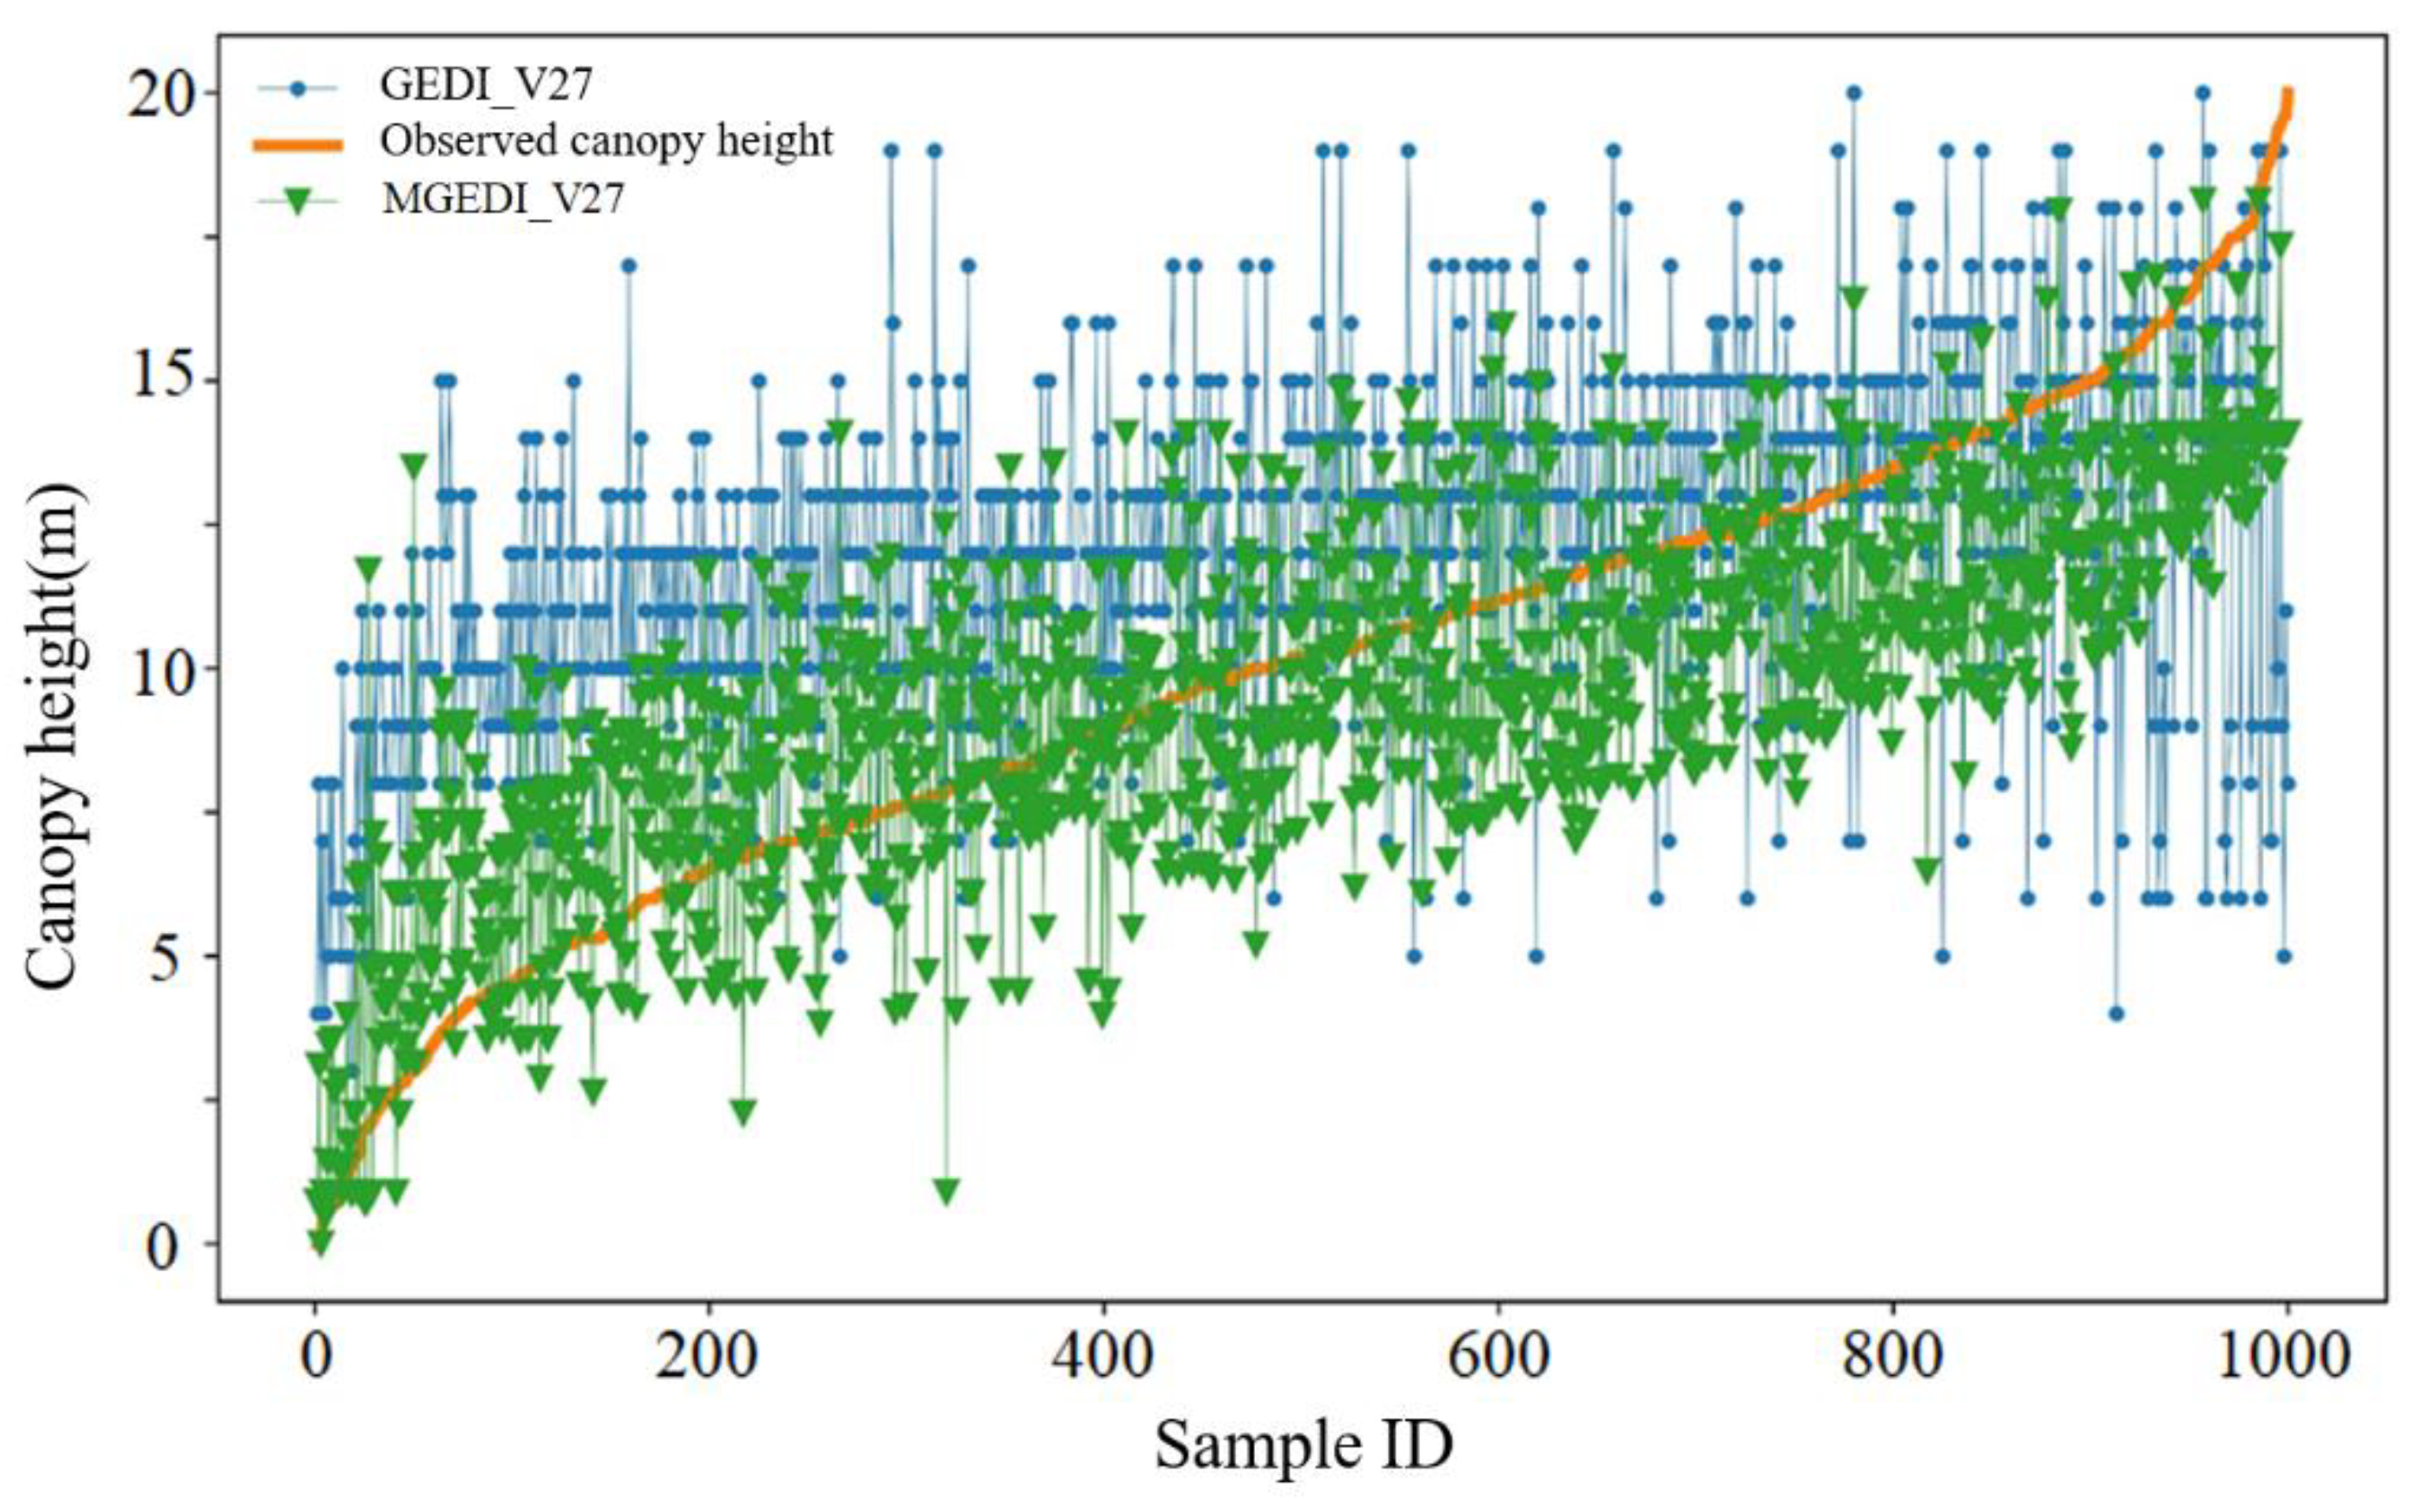
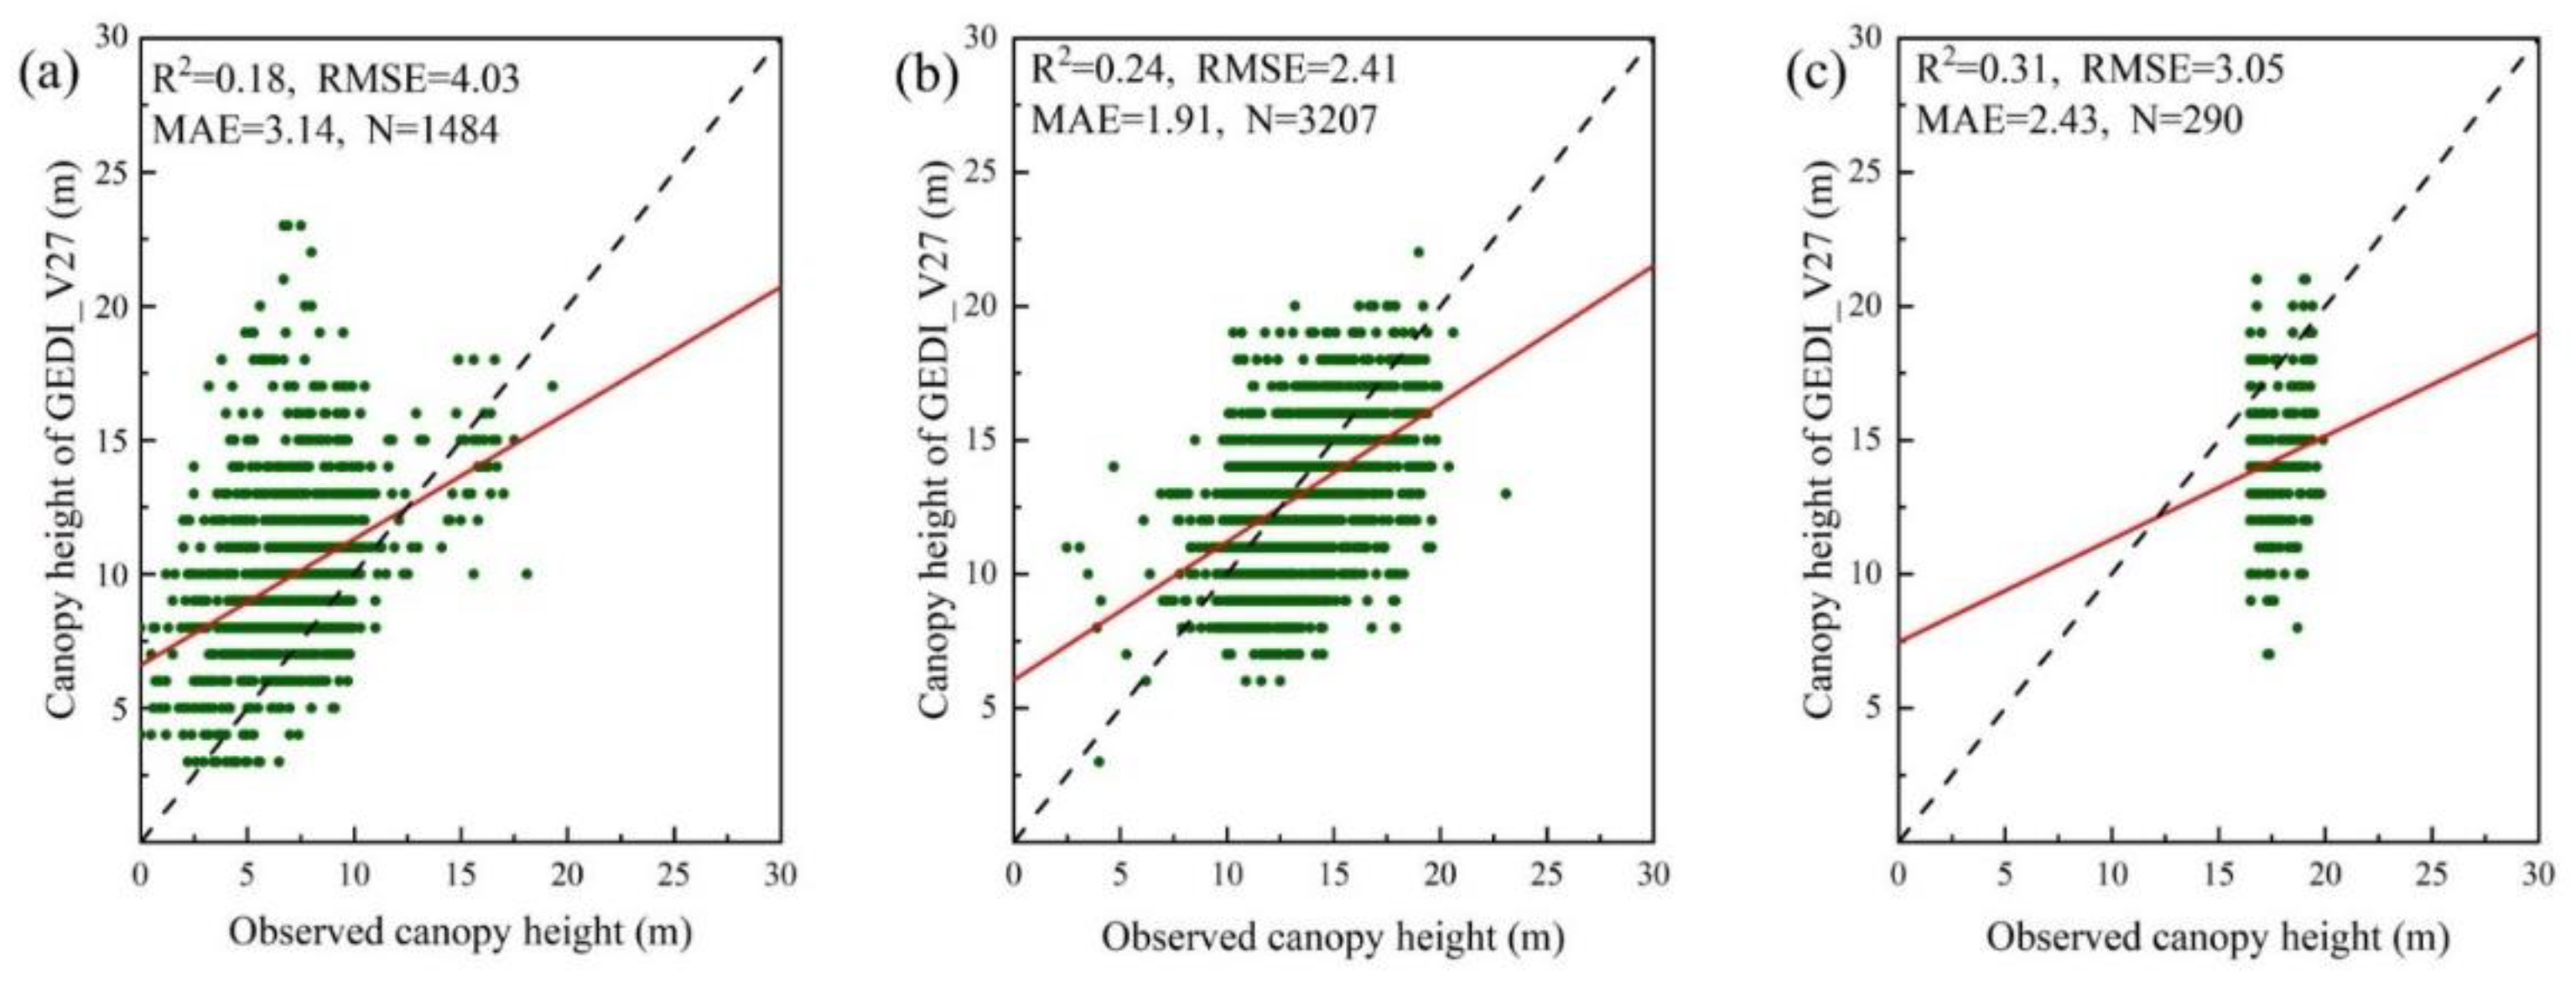
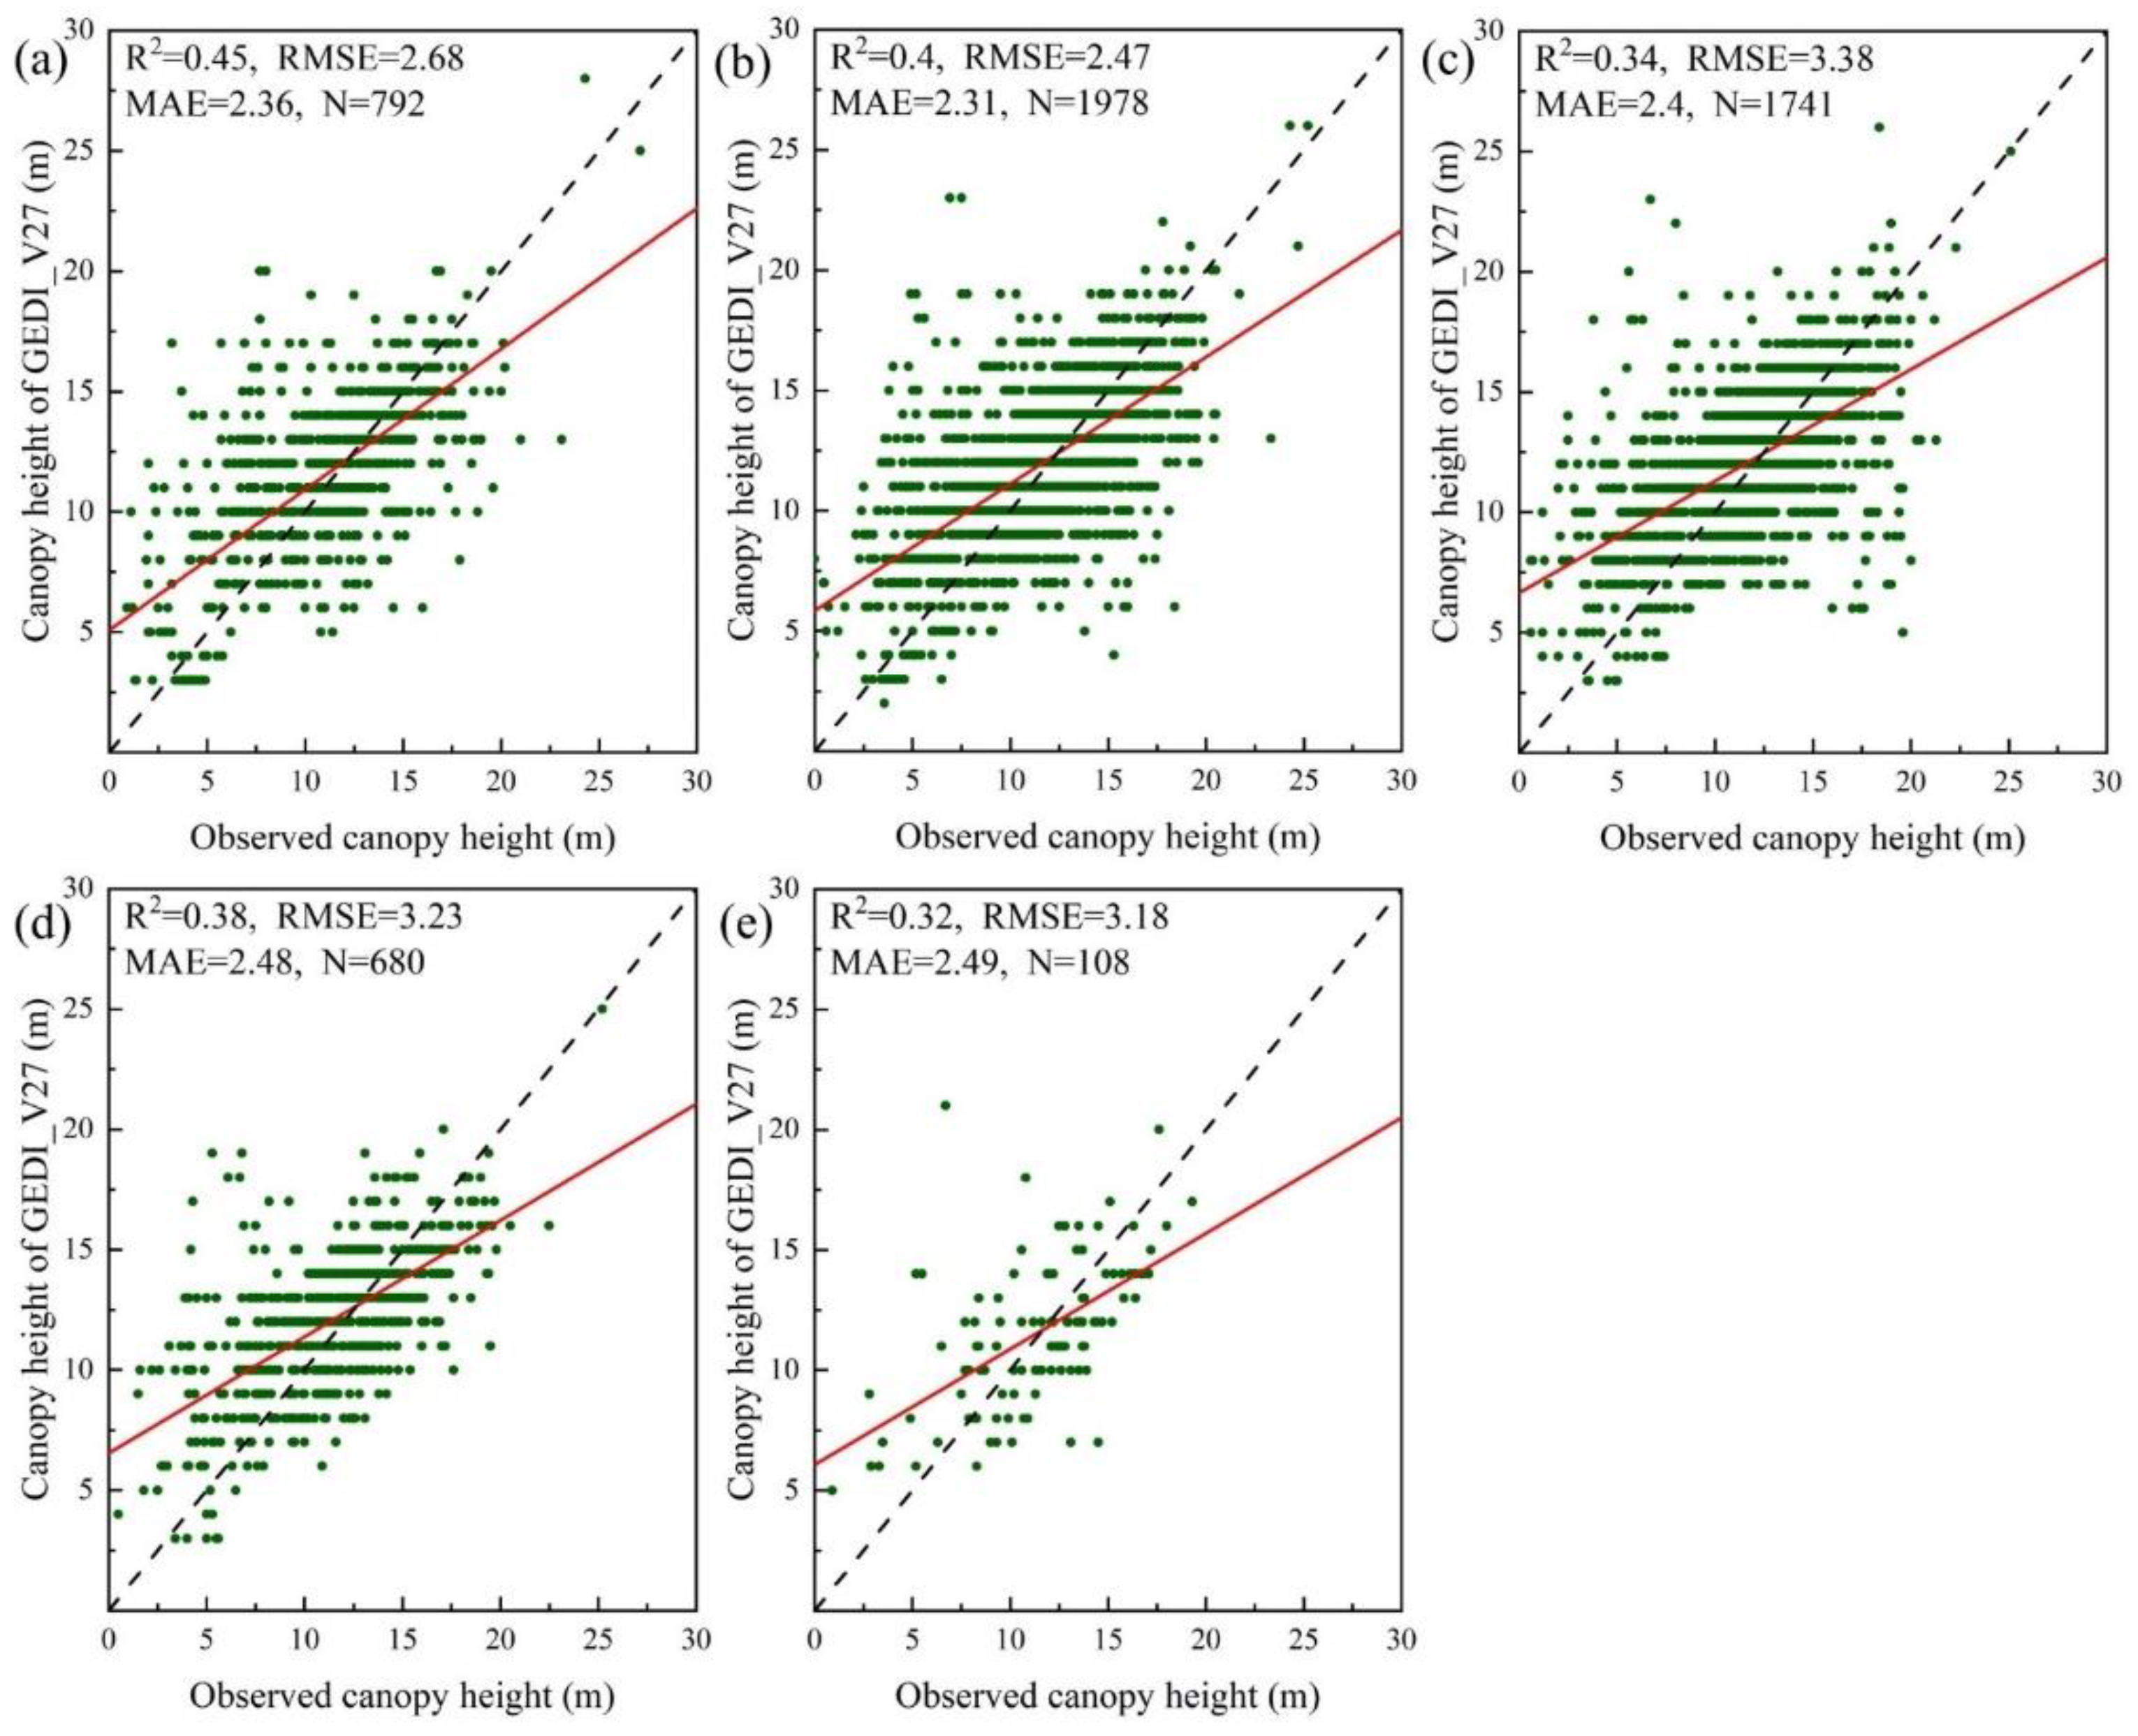
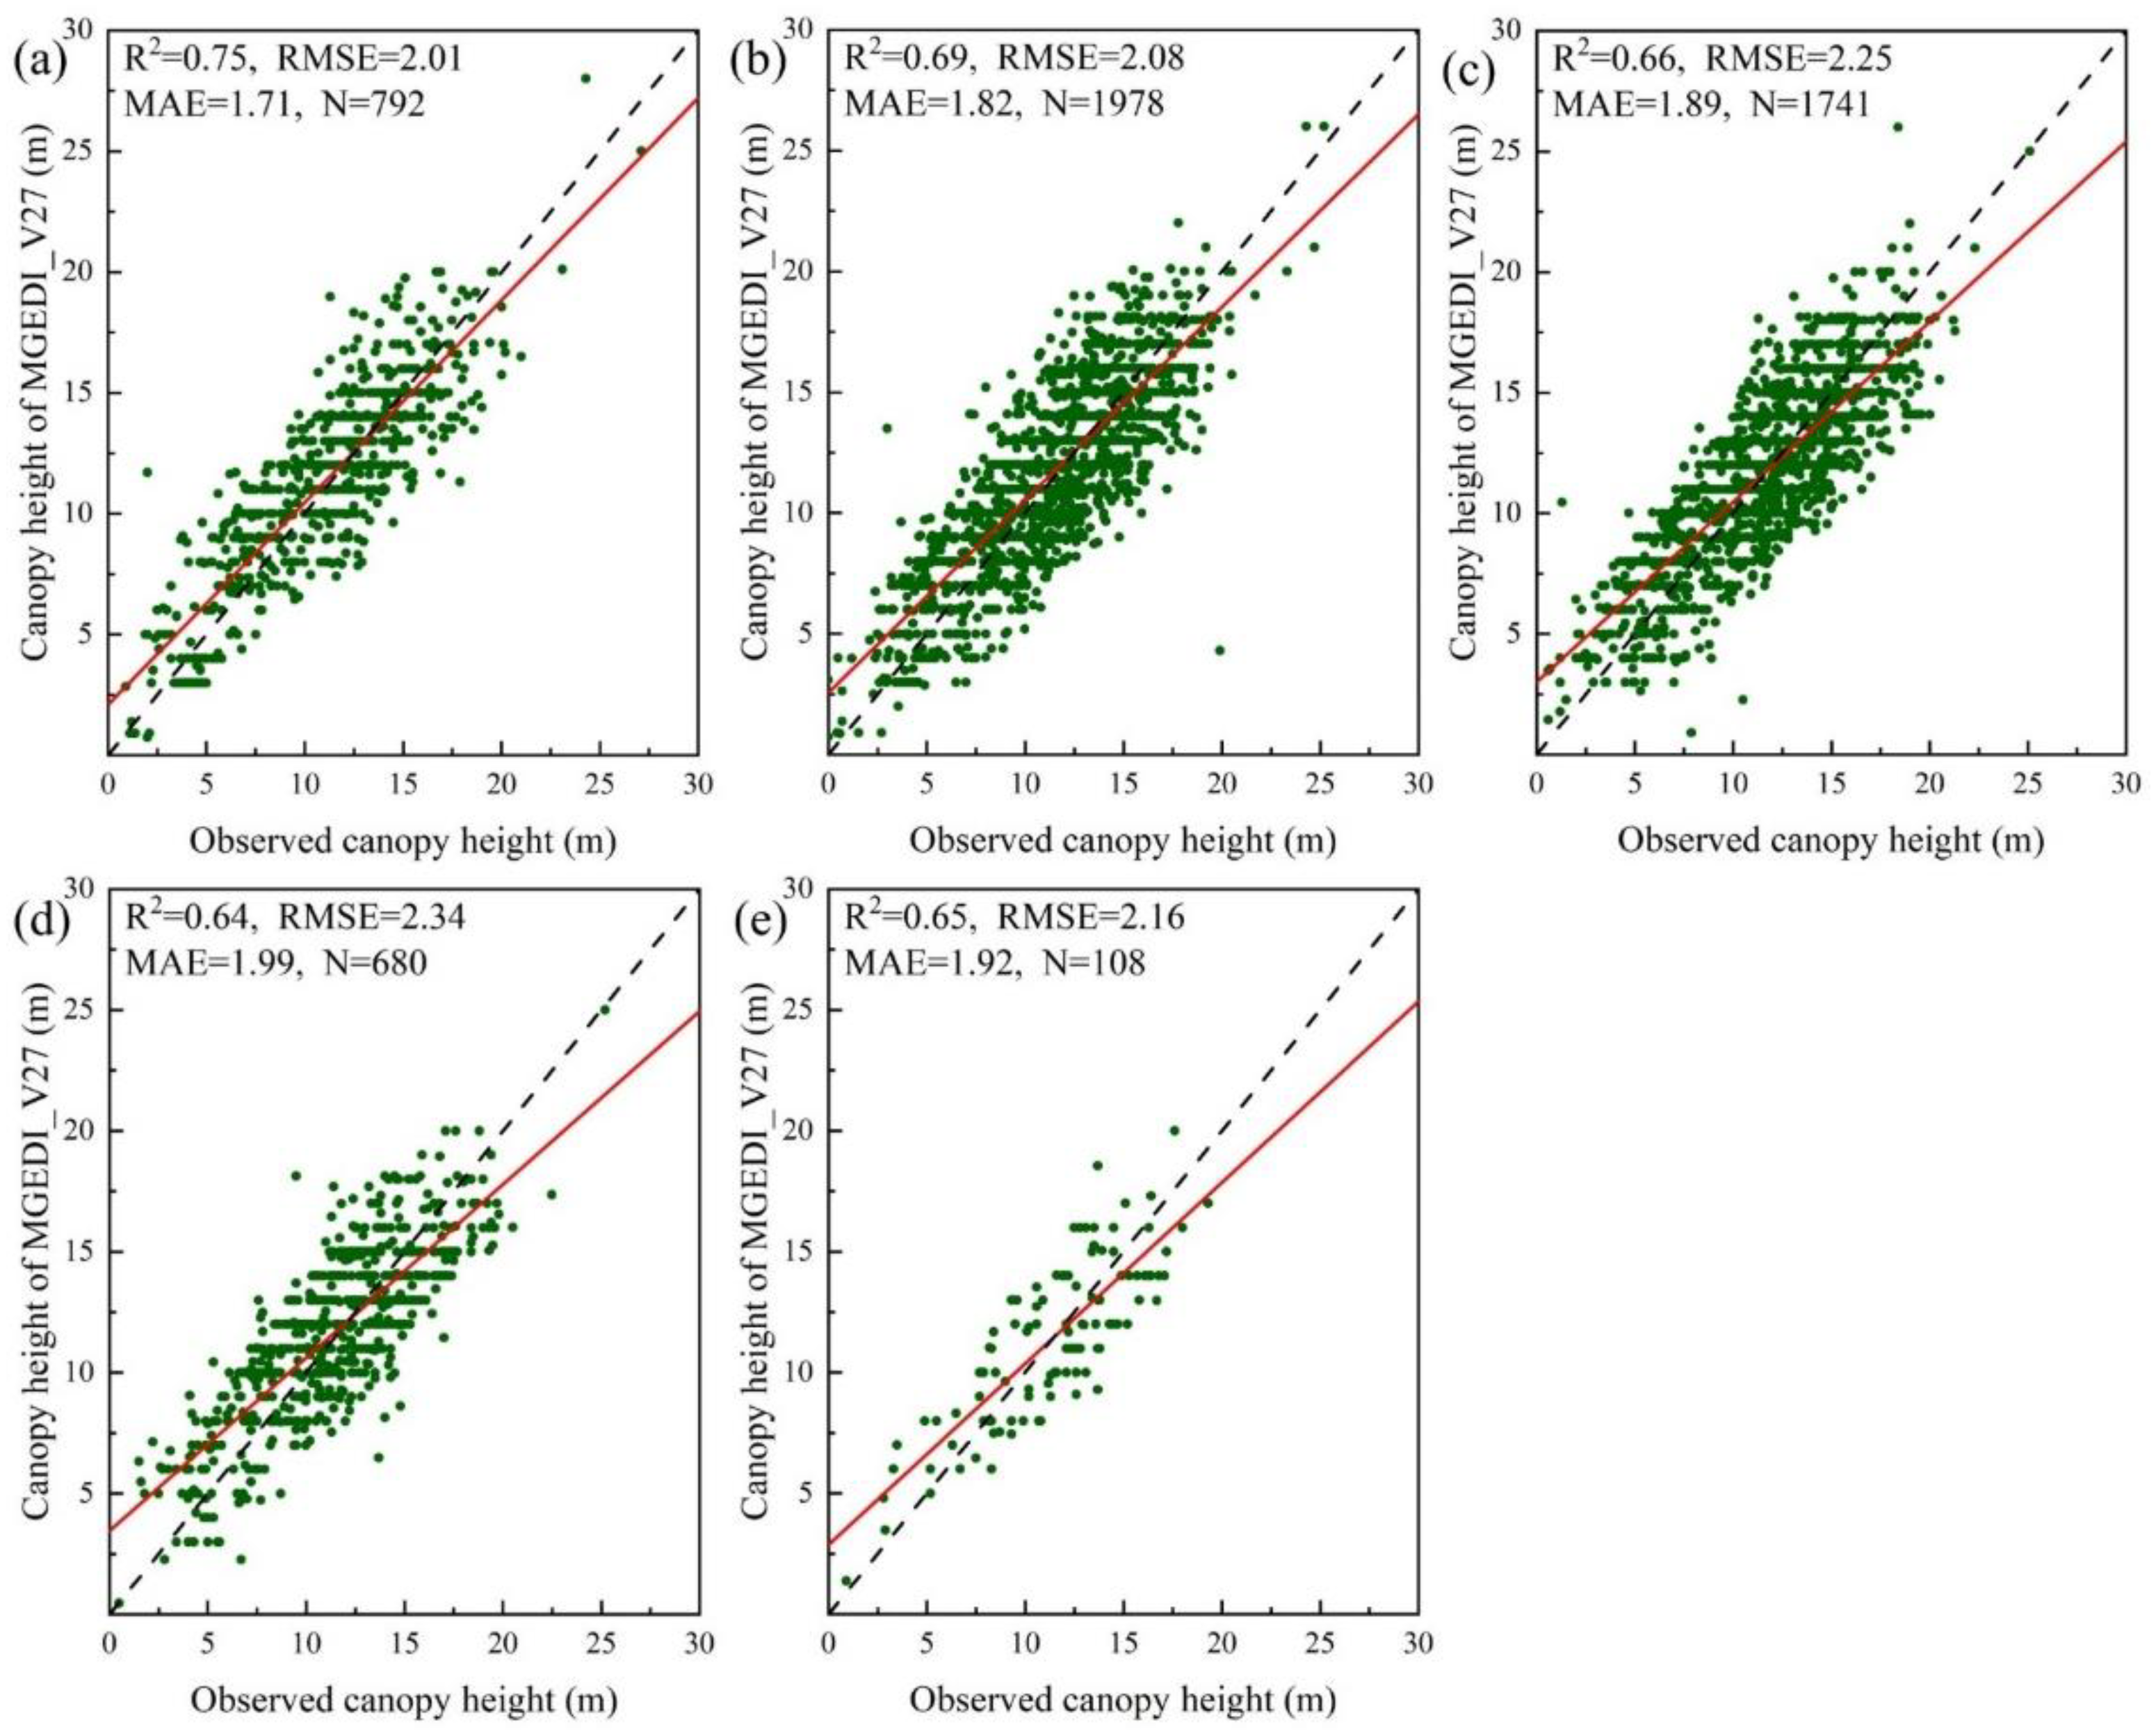
The combination of long-time-series optical remote sensing images and native forest growth curves can improve the accuracy of satellite-based LiDAR canopy height, and, to a certain extent, compensate for the large errors of satellite-based LiDAR data acquisition in complex terrain areas. The accuracy evaluation results of the MGEDI_V27 canopy height that were obtained after the method of this paper were an R2 of 0.67, an RMSE of 2.24 m, and an MAE of 1.85 m. This paper also compares the accuracy values of the GEDI_V27 and the MGEDI_V27 by age group and slope grade. In terms of the age groups, the accuracy of the canopy height that was obtained by the method in this paper was significantly higher (R2, RMSE, and MAE increased by 91.5%, 27.33%, and 20.57%, on average), and the accuracy improvement of the young forests was the highest. The accuracy of the MGEDI_V27 was generally higher than that of the GEDI_V27 at different the slope levels, where the accuracy improvement was more obvious in the areas with a slope that was greater than 20° (R2, RMSE, and MAE increased by 80.96%, 26.82%, and 22.53%, on average).

Author Contributions

Conceptualization: X.Z. and L.D.; methodology and software: Y.H. and Y.C.; data curation, writing—original draft preparation, and visualization: Y.H. and X.W.; writing—review and editing: Y.H. and X.Z.; revising: C.C., T.J. and G.N. All authors have read and agreed to the published version of the manuscript.

Funding

This research was supported by the International Cooperation Project of Fujian, China (No. 2022I0007), the Industry-University Cooperation Project of the Science and Technology Department of Fujian (No. 2022N5008), and the Science and Technology Project of Fujian Provincial Water Conservancy Department (No. MSK202214).

Data Availability Statement

The data presented in this study are available on request from the corresponding author.

Acknowledgments

The authors would like to thank Tan Fanglin, from th Fujian Academy of Forestry Sciences, for providing most of the verification data.

Conflicts of Interest

The authors declare that they have no conflict of interest.

References

  1. Anaya, J.A.; Chuvieco, E.; Palacios-Orueta, A. Aboveground biomass assessment in Colombia: A remote sensing approach. For. Ecol. Manag. 2009, 257, 1237–1246. [Google Scholar] [CrossRef]
  2. Peng, S.; Wen, D.; He, N.; Yu, G.; Ma, A.; Wang, Q. Carbon storage in China’s forest ecosystems: Estimation by different integrative methods. Ecol. Evol. 2016, 6, 3129–3145. [Google Scholar] [CrossRef] [PubMed] [Green Version]
  3. Bonan, G.B. Forests and climate change: Forcings, feedbacks, and the climate benefits of forests. Science 2008, 320, 1444–1449. [Google Scholar] [CrossRef] [PubMed] [Green Version]
  4. Asner, G.P.; Mascaro, J.; Muller-Landau, H.C.; Vieilledent, G.; Vaudry, R.; Rasamoelina, M.; Hall, J.S.; Van Breugel, M. A universal airborne LiDAR approach for tropical forest carbon mapping. Oecologia 2012, 168, 1147–1160. [Google Scholar] [CrossRef]
  5. Lin, X.; Xu, M.; Cao, C.; Dang, Y.; Bashir, B.; Xie, B.; Huang, Z. Estimates of forest canopy height using a combination of ICESat-2/ATLAS data and stereo-photogrammetry. Remote Sens. 2020, 12, 3649. [Google Scholar] [CrossRef]
  6. Campbell, M.J.; Dennison, P.E.; Kerr, K.L.; Brewer, S.C.; Anderegg, W.R. Scaled biomass estimation in woodland ecosystems: Testing the individual and combined capacities of satellite multispectral and lidar data. Remote Sens. Environ. 2021, 262, 112511. [Google Scholar] [CrossRef]
  7. Wang, M.; Sun, R.; Xiao, Z. Estimation of forest canopy height and aboveground biomass from spaceborne LiDAR and Landsat imageries in Maryland. Remote Sens. 2018, 10, 344. [Google Scholar] [CrossRef] [Green Version]
  8. Pang, S.; Li, G.; Jiang, X.; Chen, Y.; Lu, Y.; Lu, D. Retrieval of forest canopy height in a mountainous region with ICESat-2 ATLAS. For. Ecosyst. 2022, 9, 100046. [Google Scholar] [CrossRef]
  9. Davies, A.B.; Oram, F.; Ancrenaz, M.; Asner, G.P. Combining behavioural and LiDAR data to reveal relationships between canopy structure and orangutan nest site selection in disturbed forests. Biol. Conserv. 2019, 232, 97–107. [Google Scholar] [CrossRef]
  10. Goetz, S.; Dubayah, R. Advances in remote sensing technology and implications for measuring and monitoring forest carbon stocks and change. Carbon Manag. 2011, 2, 231–244. [Google Scholar] [CrossRef]
  11. Boudreau, J.; Nelson, R.F.; Margolis, H.A.; Beaudoin, A.; Guindon, L.; Kimes, D.S. Regional aboveground forest biomass using airborne and spaceborne LiDAR in Québec. Remote Sens. Environ. 2008, 112, 3876–3890. [Google Scholar] [CrossRef]
  12. Fayad, I.; Baghdadi, N.; Riédi, J. Quality assessment of acquired gedi waveforms: Case study over france, tunisia and french guiana. Remote Sens. 2021, 13, 3144. [Google Scholar] [CrossRef]
  13. Dubayah, R.; Blair, J.B.; Goetz, S.; Fatoyinbo, L.; Hansen, M.; Healey, S.; Hofton, M.; Hurtt, G.; Kellner, J.; Luthcke, S. The Global Ecosystem Dynamics Investigation: High-resolution laser ranging of the Earth’s forests and topography. Sci. Remote Sens. 2020, 1, 100002. [Google Scholar] [CrossRef]
  14. Fang, L.; Yang, J.; Zhang, W.; Zhang, W.; Yan, Q. Combining allometry and landsat-derived disturbance history to estimate tree biomass in subtropical planted forests. Remote Sens. Environ. 2019, 235, 111423. [Google Scholar] [CrossRef]
  15. Helmer, E.H.; Ruzycki, T.S.; Wunderle, J.M., Jr.; Vogesser, S.; Ruefenacht, B.; Kwit, C.; Brandeis, T.J.; Ewert, D.N. Mapping tropical dry forest height, foliage height profiles and disturbance type and age with a time series of cloud-cleared Landsat and ALI image mosaics to characterize avian habitat. Remote Sens. Environ. 2010, 114, 2457–2473. [Google Scholar] [CrossRef]
  16. Pflugmacher, D.; Cohen, W.B.; Kennedy, R.E.; Yang, Z. Using Landsat-derived disturbance and recovery history and lidar to map forest biomass dynamics. Remote Sens. Environ. 2014, 151, 124–137. [Google Scholar] [CrossRef]
  17. Li, W.; Niu, Z.; Shang, R.; Qin, Y.; Wang, L.; Chen, H. High-resolution mapping of forest canopy height using machine learning by coupling ICESat-2 LiDAR with Sentinel-1, Sentinel-2 and Landsat-8 data. Int. J. Appl. Earth Obs. 2020, 92, 102163. [Google Scholar] [CrossRef]
  18. Simard, M.; Pinto, N.; Fisher, J.B.; Baccini, A. Mapping forest canopy height globally with spaceborne lidar. J. Geophys. Res. Biogeosciences 2011, 116, G04021. [Google Scholar] [CrossRef] [Green Version]
  19. Potapov, P.; Li, X.; Hernandez-Serna, A.; Tyukavina, A.; Hansen, M.C.; Kommareddy, A.; Pickens, A.; Turubanova, S.; Tang, H.; Silva, C.E.; et al. Mapping global forest canopy height through integration of GEDI and Landsat data. Remote Sens. Environ. 2021, 253, 112165. [Google Scholar] [CrossRef]
  20. Adam, M.; Urbazaev, M.; Dubois, C.; Schmullius, C. Accuracy assessment of GEDI terrain elevation and canopy height estimates in European temperate forests: Influence of environmental and acquisition parameters. Remote Sens. 2020, 12, 3948. [Google Scholar] [CrossRef]
  21. Liu, A.; Cheng, X.; Chen, Z. Performance evaluation of GEDI and ICESat-2 laser altimeter data for terrain and canopy height retrievals. Remote Sens. Environ. 2021, 264, 112571. [Google Scholar] [CrossRef]
  22. Roy, D.P.; Kashongwe, H.B.; Armston, J. The impact of geolocation uncertainty on GEDI tropical forest canopy height estimation and change monitoring. Sci. Remote Sens. 2021, 4, 100024. [Google Scholar] [CrossRef]
  23. Liu, X.; Su, Y.; Hu, T.; Yang, Q.; Liu, B.; Deng, Y.; Tang, H.; Tang, Z.; Fang, J.; Guo, Q. Neural network guided interpolation for mapping canopy height of China’s forests by integrating GEDI and ICESat-2 data. Remote Sens. Environ. 2022, 269, 112844. [Google Scholar] [CrossRef]
  24. Zhuang, F.; Qi, Z.; Duan, K.; Xi, D.; Zhu, Y.; Zhu, H.; Xiong, H.; He, Q. A comprehensive survey on transfer learning. Proc. IEEE 2020, 109, 43–76. [Google Scholar] [CrossRef]
  25. Weiss, K.; Khoshgoftaar, T.M.; Wang, D. A survey of transfer learning. J. Big Data 2016, 3, 9. [Google Scholar] [CrossRef] [Green Version]
  26. Maschler, B.; Weyrich, M. Deep transfer learning for industrial automation: A review and discussion of new techniques for data-driven machine learning. IEEE Ind. Electron. Mag. 2021, 15, 65–75. [Google Scholar] [CrossRef]
  27. Rennolls, K. Forest height growth modelling. Forest Ecol. Manag. 1995, 71, 217–225. [Google Scholar] [CrossRef]
  28. Zhang, C.; Ju, W.; Chen, J.M.; Li, D.; Wang, X.; Fan, W.; Li, M.; Zan, M. Mapping forest stand age in China using remotely sensed forest height and observation data. J. Geophys. Res. Biogeosciences 2014, 119, 1163–1179. [Google Scholar] [CrossRef]
  29. Kayitakire, F.; Hamel, C.; Defourny, P. Retrieving forest structure variables based on image texture analysis and IKONOS-2 imagery. Remote Sens. Environ. 2006, 102, 390–401. [Google Scholar] [CrossRef]
  30. Cutler, M.; Boyd, D.S.; Foody, G.M.; Vetrivel, A. Estimating tropical forest biomass with a combination of SAR image texture and Landsat TM data: An assessment of predictions between regions. ISPRS J. Photogramm. 2012, 70, 66–77. [Google Scholar] [CrossRef]
  31. Yang, X.; Liu, Y.; Wu, Z.; Yu, Y.; Li, F.; Fan, W. Forest age mapping based on multiple-resource remote sensing data. Environ. Monit. Assess. 2020, 192, 734. [Google Scholar] [CrossRef] [PubMed]
  32. Sun, C.; Cao, S.; Sanchez-Azofeifa, G.A. Mapping tropical dry forest age using airborne waveform LiDAR and hyperspectral metrics. Int. J. Appl. Earth Obs. 2019, 83, 101908. [Google Scholar] [CrossRef]
  33. Hovi, A.; Lindberg, E.; Lang, M.; Arumäe, T.; Peuhkurinen, J.; Sirparanta, S.; Pyankov, S.; Rautiainen, M. Seasonal dynamics of albedo across European boreal forests: Analysis of MODIS albedo and structural metrics from airborne LiDAR. Remote Sens. Environ. 2019, 224, 365–381. [Google Scholar] [CrossRef]
  34. Dong, J.; Xiao, X.; Chen, B.; Torbick, N.; Jin, C.; Zhang, G.; Biradar, C. Mapping deciduous rubber plantations through integration of PALSAR and multi-temporal Landsat imagery. Remote Sens. Environ. 2013, 134, 392–402. [Google Scholar] [CrossRef]
  35. Hanna, K.D.; Schrader, D.L.; Cloutis, E.A.; Cody, G.D.; King, A.J.; McCoy, T.J.; Applin, D.M.; Mann, J.P.; Bowles, N.E.; Brucato, J.R. Spectral characterization of analog samples in anticipation of OSIRIS-REx’s arrival at Bennu: A blind test study. Icarus 2019, 319, 701–723. [Google Scholar] [CrossRef]
  36. Kuusinen, N.; Tomppo, E.; Shuai, Y.; Berninger, F. Effects of forest age on albedo in boreal forests estimated from MODIS and Landsat albedo retrievals. Remote Sens. Environ. 2014, 145, 145–153. [Google Scholar] [CrossRef]
  37. Shen, J.; Chen, G.; Hua, J.; Huang, S.; Ma, J. Contrasting Forest Loss and Gain Patterns in Subtropical China Detected Using an Integrated LandTrendr and Machine-Learning Method. Remote Sens. 2022, 14, 3238. [Google Scholar] [CrossRef]
  38. Peng, D.; Zhang, H.; Liu, L.; Huang, W.; Huete, A.R.; Zhang, X.; Wang, F.; Yu, L.; Xie, Q.; Wang, C. Estimating the aboveground biomass for planted forests based on stand age and environmental variables. Remote Sens. 2019, 11, 2270. [Google Scholar] [CrossRef] [Green Version]
  39. Kennedy, R.E.; Yang, Z.; Cohen, W.B. Detecting trends in forest disturbance and recovery using yearly Landsat time series: 1. LandTrendr—Temporal segmentation algorithms. Remote Sens. Environ. 2010, 114, 2897–2910. [Google Scholar] [CrossRef]
  40. Dubayah, R.; Hofton, M.; Blair, J.B.; Armston, J.; Tang, H.; Luthcke, S. GEDI L2A Elevation and Height Metrics Data Global Footprint Level V001. NASA EOSDIS Land Processes DAAC. Available online: https://doi.org/10.5067/GEDI/GEDI02_A.001 (accessed on 12 April 2021).
  41. Serna, E.H.; Hernandez-Serna, A. pyGEDI: NASA’s Global Ecosystem Dynamics Investigation (GEDI) Mission Data Extraction, Analysis, Processing and Visualization. Version 0.2, 5 April 2020. Available online: https://pypi.org/project/pyGEDI (accessed on 10 August 2021).
  42. Kennedy, R.E.; Yang, Z.; Gorelick, N.; Braaten, J.; Cavalcante, L.; Cohen, W.B.; Healey, S. Implementation of the LandTrendr algorithm on google earth engine. Remote Sens. 2018, 10, 691. [Google Scholar] [CrossRef]
  43. Ye, L.; Liu, M.; Liu, X.; Zhu, L. Developing a new disturbance index for tracking gradual change of forest ecosystems in the hilly red soil region of southern China using dense Landsat time series. Ecol. Inform. 2021, 61, 101221. [Google Scholar] [CrossRef]
  44. Yu, Y.; Pan, J.; Xing, L.; Jiang, L.; Liu, S.; Yuan, Y.; Yu, H. Identification of high temperature targets in remote sensing imagery based on factor analysis. J. Appl. Remote Sens. 2014, 8, 83622. [Google Scholar] [CrossRef] [Green Version]
  45. Ren, Y.; Wei, X.; Zhang, L.; Cui, S.; Chen, F.; Xiong, Y.; Xie, P. Potential for forest vegetation carbon storage in Fujian, China, determined from forest inventories. Plant Soil 2011, 345, 125–140. [Google Scholar] [CrossRef] [Green Version]
  46. Guo, Q.; Su, Y.; Hu, T.; Guan, H.; Jin, S.; Zhang, J.; Zhao, X.; Xu, K.; Wei, D.; Kelly, M. Lidar boosts 3d ecological observations and modelings: A review and perspective. IEEE Geosci. Remote Sens. Mag. 2020, 9, 232–257. [Google Scholar] [CrossRef]
  47. Ota, T.; Ahmed, O.S.; Franklin, S.E.; Wulder, M.A.; Kajisa, T.; Mizoue, N.; Yoshida, S.; Takao, G.; Hirata, Y.; Furuya, N. Estimation of airborne lidar-derived tropical forest canopy height using landsat time series in Cambodia. Remote Sens. 2014, 6, 10750–10772. [Google Scholar] [CrossRef] [Green Version]
  48. Liu, M.; Cao, C.; Dang, Y.; Ni, X. Mapping forest canopy height in mountainous areas using ZiYuan-3 stereo images and Landsat data. Forests 2019, 10, 105. [Google Scholar] [CrossRef] [Green Version]
  49. Zhang, J.; Nielsen, S.E.; Mao, L.; Chen, S.; Svenning, J.C. Regional and historical factors supplement current climate in shaping global forest canopy height. J. Ecol. 2016, 104, 469–478. [Google Scholar] [CrossRef] [Green Version]
  50. Ahmed, O.S.; Franklin, S.E.; Wulder, M.A.; White, J.C. Characterizing stand-level forest canopy cover and height using Landsat time series, samples of airborne LiDAR, and the Random Forest algorithm. ISPRS J. Photogramm. 2015, 101, 89–101. [Google Scholar] [CrossRef]
  51. Hansen, M.C.; Potapov, P.V.; Goetz, S.J.; Turubanova, S.; Tyukavina, A.; Krylov, A.; Kommareddy, A.; Egorov, A. Mapping tree height distributions in Sub-Saharan Africa using Landsat 7 and 8 data. Remote Sens. Environ. 2016, 185, 221–232. [Google Scholar] [CrossRef] [Green Version]
  52. Shang, C.; Coops, N.C.; Wulder, M.A.; White, J.C.; Hermosilla, T. Update and spatial extension of strategic forest inventories using time series remote sensing and modeling. Int. J. Appl. Earth Obs. 2020, 84, 101956. [Google Scholar] [CrossRef]
  53. Wang, C.; Elmore, A.J.; Numata, I.; Cochrane, M.A.; Shaogang, L.; Huang, J.; Zhao, Y.; Li, Y. Factors affecting relative height and ground elevation estimations of GEDI among forest types across the conterminous USA. Gisci. Remote Sens. 2022, 59, 975–999. [Google Scholar] [CrossRef]
  54. Zhang, Y.; Yao, Y.; Wang, X.; Liu, Y.; Piao, S. Mapping spatial distribution of forest age in China. Earth Space Sci. 2017, 4, 108–116. [Google Scholar] [CrossRef]
  55. Lang, N.; Kalischek, N.; Armston, J.; Schindler, K.; Dubayah, R.; Wegner, J.D. Global canopy height regression and uncertainty estimation from GEDI LIDAR waveforms with deep ensembles. Remote Sens. Environ. 2022, 268, 112760. [Google Scholar] [CrossRef]
Figure 1. Study area. (a) The geographical location of Fujian, (b) a DEM of the study area, (c) forest types in the study area, and (d) a density distribution map of GEDI_2A footprint data in 1 km2 of the study area.
Remotesensing 15 00467 g001
Figure 2. Distribution of field survey sample data in the study area.
Remotesensing 15 00467 g002
Figure 3. Overall technical flowchart for estimating forest canopy height combining time-series optical remote sensing and GEDI satellite-based LiDAR data.
Remotesensing 15 00467 g003
Figure 4. Box plot of the average tree height corresponding to each age. (a) Needleleaf forest. (b) Broadleaf forest. (c) Mixed forest.
Remotesensing 15 00467 g004
Figure 5. Growth curves of three forest types. (a) Needleleaf forest. (b) Broadleaf forest. (c) Mixed forest.
Remotesensing 15 00467 g005
Figure 6. LandTrendr pixel time-series segmentation [42]. (a) Time series of individual bands or spectral indicators of image elements. (b) Segmentation into a series of linear segments by identifying vertices. (c) Significant features of each segment of the indicator trajectory.
Remotesensing 15 00467 g006
Figure 7. Flow chart for estimating canopy height. The average tree height is expressed as HA, the canopy height of the GEDI_V27 is expressed as HGEDI, and the canopy height of the MGEDI_V27 is expressed as HMGEDI. Green pixels indicate an interference area, and blue pixels indicate a non-interference area.
Remotesensing 15 00467 g007
Figure 8. Proportion of the forest disturbance area in Fujian.
Remotesensing 15 00467 g008
Figure 9. Time-series characteristics of forest disturbance in Fujian. (a) Disturbance years from 1987 to 2020. (b) Temporal characteristics of the forest disturbance area.
Remotesensing 15 00467 g009
Figure 10. Forest age distribution map of Fujian in 2020.
Remotesensing 15 00467 g010
Figure 11. Accuracy verification of forest age.
Remotesensing 15 00467 g011
Figure 12. Canopy height estimation results. (a) Canopy height of Fujian estimated from time-series optical images. (b) The GEDI_V27 for the Fujian region. (c) Canopy height distribution of the MGEDI_V27 in Fujian obtained by merging time-series optical remote sensing and the GEDI LiDAR data. (d) Boxplots of the MGEDI_V27 forest canopy height of Fujian grouped by city.
Remotesensing 15 00467 g012
Figure 13. Accuracy assessment results of two canopy height models. (a) Linear regression of canopy height between the GEDI_V27 and the sample set. (b) Linear regression of canopy height between the MGEDI_V27 and the sample set. The dotted line represents a 1:1 match, and the red line represents the trend of the forest canopy height relationship between the field measurements and the two products.
Remotesensing 15 00467 g013
Figure 14. Comparison of canopy height of the GEDI_V27, the MGEDI_V27, and the observed canopy height.
Remotesensing 15 00467 g014
Figure 15. Canopy height accuracy for the three age groups of the GEDI_V27. (a) Young stands (0–10 years). (b) Middle-aged stands (10–20 years). (c) Mature stands (more than 20 years).
Remotesensing 15 00467 g015
Figure 16. Canopy height accuracy for the three age groups of the MGEDI_V27. (a) Young stands (0–10 years). (b) Middle-aged stands (10–20 years). (c) Mature stands (more than 20 years).
Remotesensing 15 00467 g016
Figure 17. Canopy height accuracy of the GEDI_V27 at five slope levels. (a) 0–10°. (b) 10–20°. (c) 20–30°. (d) 30–40°. (e) >40°.
Remotesensing 15 00467 g017
Figure 18. Canopy height accuracy of the MGEDI_V27 at five slope levels. (a) 0–10°. (b) 10–20°. (c) 20–30°. (d) 30–40°. (e) >40°.
Remotesensing 15 00467 g018
Table 1. Used Landsat satellite parameters.
SatelliteSensorAcquisition YearsBands (μm)
Landsat-5TM1984–2012B1-Blue (0.45–0.52)B2-Green (0.52–0.60)
B3-Red (0.63–0.69)B4-NIR (0.76–0.90)
B5-SWIR (1.55–1.75)B6-LWIR (10.40–12.50)
B7-SWIR (2.08–2.35)
Landsat-7ETM+1999–OngoingB1-Blue (0.45–0.52)B2-Green (0.52–0.60)
B3-Red (0.63–0.69)B4-NIR (0.76–0.90)
B5-SWIR (1.55–1.75)B6-LWIR (10.40–12.50)
B7-SWIR (2.08–2.35)B8-Pan (0.52–0.9)
Landsat-8OLI2013–OngoingB1-Coastal (0.43–0.45)B2-Blue (0.45–0.51)
B3-Green (0.53–0.60)B4-Red (0.63–0.68)
B5-NIR (0.85–0.89)B6-SWIR1 (1.56–1.66)
B7-SWIR2 (2.11–2.29)B8-Pan (0.50–0.68)
B9-Cirrus (1.36–1.39)B10-LWIR (10.06–11.19)
Disclaimer/Publisher’s Note: The statements, opinions and data contained in all publications are solely those of the individual author(s) and contributor(s) and not of MDPI and/or the editor(s). MDPI and/or the editor(s) disclaim responsibility for any injury to people or property resulting from any ideas, methods, instructions or products referred to in the content.

