Technical Note

Spatiotemporal Variations of Soil Temperature at 10 and 50 cm Depths in Permafrost Regions along the Qinghai-Tibet Engineering Corridor

1
School of Geographical Sciences, Nanjing University of Information Science & Technology, Nanjing 210044, China
2
College of Resources and Environment, University of Chinese Academy of Sciences, Beijing 101408, China
3
Cryosphere Research Station on Qinghai-Xizang Plateau, State Key Laboratory of Cryosphere Science, Northwest Institute of Eco-Environment and Resources, Chinese Academy of Sciences, Lanzhou 730000, China
*
Author to whom correspondence should be addressed.
Remote Sens. 2023, 15(2), 455; https://doi.org/10.3390/rs15020455
Submission received: 15 November 2022 / Revised: 6 January 2023 / Accepted: 8 January 2023 / Published: 12 January 2023
(This article belongs to the Special Issue Remote Sensing and Land Surface Process Models for Permafrost Studies)

Abstract

:
Soil temperature plays an essential role in the permafrost thermal state and degradation process. Especially the soil temperatures at 10 cm and 50 cm depths in the active layer, which are much easier to be observed in situ, have great effects on the surface water cycles and vegetation, and could be used as the upper boundary for permafrost models to simulate the thermal state of the permafrost and active layer thicknesses. However, due to the limitations of the observation data, there are still large uncertainties in the soil temperature data, including at these two depths, in the permafrost region of Qinghai–Tibet Plateau (QTP). In this study, we evaluated and calibrated the applicability of four daily shallow soil temperature datasets (i.e., MERRA-2, GLDAS-Noah, ERA5-Land, and CFSR) by using the in situ soil temperature data from eight observation sites from 2004 to 2018 in the permafrost region along the Qinghai–Tibet Engineering Corridor. The results revealed that there were different uncertainties for all four sets of reanalysis data, which were the largest (Bias = −2.44 °C) in CFSR and smallest (Bias= −0.43 °C) in GLDAS-Noah at depths of 10 cm and 50 cm. Overall, the reanalysis datasets reflect the trends of soil temperature, and the applicability of reanalysis data at 50 cm depth is better than at 10 cm depth. Furthermore, the GLDAS-Noah soil temperatures were recalibrated based on our observations using multiple linear regression and random forest models. The accuracy of the corrected daily soil temperature was significantly improved, and the RMSE was reduced by 1.49 °C and 1.28 °C at the depth of 10 cm and 50 cm, respectively. The random forest model performed better in the calibration of soil temperature data from GLDAS-Noah. Finally, the warming rates of soil temperature were analyzed, which were 0.0994 °C/a and 0.1005 °C/a at 10 cm and 50 cm depth from 2004 to 2018, respectively.

1. Introduction

Soil temperature is the crucial factor for the permafrost thermal state, which can affect the ecological and hydrological processes in the permafrost region [1,2]. Soil temperature is an essential parameter for land surface process models, ecological models, and hydrological models, and one of the critical variables for model simulation and calibration [3]. The soil temperature at shallow depths mainly refers to the soil temperature at different depths above the vegetation rhizosphere [4], which regulates the exchange of energy and water between the atmosphere and the surface. Shallow soil temperature affects vegetation by changing soil moisture [5]. Moreover, soil temperature affects the carbon cycle, and carbon emissions from permafrost have positive feedback to the climate system [6]. Therefore, an accurate calculation of soil temperatures in permafrost areas is of great scientific significance.
The Qinghai–Tibet Plateau (QTP) has an average altitude of more than 4000 m, known as the “Water Tower of Asia” and the “Third Pole” of the world, and is occupied by the largest low and middle latitude permafrost regions in the world (1.06 × 10⁶ km2, about 40% of the total plateau area) [7,8]. The permafrost exhibited noticeable degradation on the QTP under global warming, manifested as the increase in soil temperature and active layer thickness. The active layer thickness will increase from 0.5–1.5 m to about 1.5–2.0 m by 2030–2050 and reach 2.0–3.5 m by 2080–2100 [9]. Previous studies have shown that the rising of soil temperature could induce an increase in the active layer thickness and further affect carbon emission processes in the permafrost zone [10,11,12]. However, the severe climatic environment makes it challenging to obtain the in situ data on the QTP [13], especially long time-series in situ data. Therefore, there are significant uncertainties in the simulation of soil temperature using the land surface model, and large differences in soil temperature results are simulated by different models [14].
Remote sensing methods can only acquire surface soil data and have limitations in studying deeper soil. In recent years, many studies have been carried out on the permafrost change process based on the reanalysis data on the QTP [15,16,17,18,19]. Most of these have focused on assessing of air temperature, soil temperature, and humidity. Due to the complex subsurface conditions on the QTP, the reanalysis datasets have significant uncertainties on the QTP. The results showed the high applicability of ERA-Interim, and ERA5-Land air temperature data, respectively, but still overestimated the actual temperature [20,21]. The reanalysis datasets underestimate soil temperature and overestimate soil moisture [22]. The soil temperature at shallow depths could affect surface vegetation, ecological processes, and variation in the active layer thickness, of which depths of 10 cm and 50 cm are mostly used by scientists and easily observed in permafrost regions [23]. Daily fluctuations in amplitude of soil temperature gradually decrease from the ground surface downwards, while the 50 cm depth is always used as a cut-off point, where changes in soil temperature have a “top-down” role [24]. Soil temperatures at 50 cm depth are often used as a very effective index to calculate active layer thickness. So, it is necessary to evaluate the applicability of reanalysis datasets and improve their accuracy at 10 cm and 50 cm on the QTP.
Numerous studies have been conducted using multiple linear regression and random forest methods to correct for precipitation, soil moisture, and air temperature, and to improve data accuracy [25,26,27,28]. The retrieval of spatial soil temperature was not well studied, not only mostly due to the limitations of available observation data in such a region with very high elevation, but also to much more complex reasons. Besides the local climate and geographical background, soil temperature is influenced by vegetation [29] and snow depth [30] conditions. DEM produces changes in soil temperature by affecting the absorption of solar radiation heat by the soil [31]. The recent publication of a soil temperature dataset [32] made it possible to validate and calibrate the existing soil temperature datasets. So, the objectives of this study were to: (1) assess the applicability of reanalysis datasets of soil temperature at 10 cm and 50 cm depth based on the observations among different underlying surfaces, (2) calibrate the most applicable reanalysis data using multivariate linear regression and random forest, and (3) examine the spatial and temporal variations of the soil temperature at 10 cm and 50 cm along the Qinghai–Tibet Engineering Corridor (QTEC).

2. Data and Methods

2.1. Study Area

This study established a buffer zone of 200 km from east to west, centered on the section of the national road G109 from QT09 to Ch04. This zone is from 90°36′E in the east to 95°5′E in the west, 31°30′N in the south, and 36°15′N in the north. The main vegetation types are alpine grassland and alpine meadow [33]. The elevation ranges from 4538 m to 4896 m, with its average exceeding 4700 m. All sites are in the permafrost zone, and QT09 and Ch04 are the northern and southern limits of permafrost, respectively. The observation sites along the G109 national highway are shown in Figure 1.

2.2. Data

The measured soil temperature data used in this study were obtained from eight sites along the QTEC [32]. All soil temperature data were measured by 105 T/109 thermocouple temperature sensors with an accuracy of ±0.2 °C at soil depths of 10, 50, 100, 200 cm, and >200 cm and observation intervals of 1 h/2 h. The distribution of the sites is shown in Figure 1, and the site-specific information is shown in Table 1.
Four reanalysis soil temperature datasets were used in this study, namely the MERRA-2 (the Modern-Era Retrospective analysis for Research and Applications, Version2), GLDAS-Noah (Global Land Data Assimilation System Version 2), ERA5-Land (the land component of the fifth generation of European Reanalysis), CFSR (Climate Forecast System Reanalysis) and CFSv2. The NASA Goddard Space Flight Center provides the MERRA-2. It contains the GEOS model and the GSI assimilation system, a dataset that can assimilate modern hyperspectral radiometric and microwave observations, as well as GPS radio [34]. GLDAS is driven by the Global Land Data Assimilation System, jointly developed by NASA Goddard Space Flight Center and NOAA National Centers for Environmental Prediction. The Noah model is one of the GLDAS land surface models [35]. ERA5-Land is an enhanced global dataset generated by the European Centre for Medium-Range Weather Forecasts for the fifth generation of European Reanalysis (ERA5) land component data, which has a higher spatial and temporal resolution than the previous ERA-Interim [36]. CFSR and CFSv2 are reanalysis datasets provided by the US National Centers for Environmental Prediction data information, CFSv2 is a continuation of the CFSR data set in time, and the spatial resolution of CFSv2 is improved compared to CFSR. In this paper, CFSR and CFSv2 are collectively referred to as CFSR&v2. Specific information on the four reanalysis data sets is shown in Table 2.

2.3. Methods

Based on the results of the validation conducted on the soil temperature reanalysis datasets along the QTEC, we corrected the dataset with the highest accuracy. In this study, the GLDAS-Noah soil temperature data were corrected using the normalized difference vegetation index (NDVI), snow depth (SD), and digital elevation model (DEM) data as auxiliary variables. NDVI data were derived from the MODIS Terra/Aqua Vegetation Indices 16-Day L3 Global 250 m SIN Grid. The spatial resolution is 250 m, and the temporal resolution is 16 d. SD data were downloaded from the Tibetan Plateau snow depth downscaling dataset (2000–2018), which has a spatial resolution of 0.05° and a daily temporal resolution [37,38]. DEM was downloaded from the Shuttle Radar Topography Missions (SRTM) [39] 1 km data.
The auxiliary variables (NDVI, SD, DEM) used in the data correction process were still used to extract site data to establish regression relationships with soil temperature data using the neighboring grid matching method.
Multiple linear regression includes two and more independent variables, and the multiple linear regression model is to establish the relationship between the dependent variable and multiple factors. The multiple linear regression equation is as follows:
y = β 0 + β 1 x 1 + β 2 x 2 + + β i x i + ε ,
where y is the dependent variable, x1, x2, ……, xi is the independent variable, βi is the regression coefficient of xi, and ε is the error term [40].
Random forest combines the performance of multiple decision tree algorithms to classify or predict the values of variables with decision trees as the basic unit [41]. Random forest uses the idea of self-sampling integration (bagging): n training samples are taken out from the training set each time there is a put-back to form a new training set, m sub-models are obtained by training using the new training set, for the regression problem, the predicted values are obtained by averaging, and its simulation accuracy is improved by a large number of regression decision trees while avoiding overfitting [42].
In this paper, the linear interpolation method calculated the reanalysis dataset’s soil temperature data at 10 cm and 50 cm depths. The in situ data were spatially matched with the reanalysis data using the neighborhood grid matching method. Correlation coefficient (R), root mean square error (RMSE), and mean bias (Bias), were used to evaluate the applicability of MERRA-2, GLDAS-Noah, ERA5-Land, and CFSR & CFSv2, calculated as follows:
R = n = 1 S ( M n M _ _ ) ( O n O _ _ ) n = 1 S ( M n M _ _ ) 2 n N ( O n O _ _ ) 2 ,
R M S E = n = 1 S ( M n O n ) 2 S ,
Bias   = 1 S n = 1   S ( M n O n ) ,
where M and O represent the reanalysis soil temperature data and site measured soil temperature data, respectively, M _ _   and   O _ _ represent the average of reanalysis soil temperature data and site-measured soil temperature data in the comparison time period, respectively, and S represents the total number of days of data.
The applicability of the reanalysis datasets was ranked by the Brunke composite ranking method [43,44]. The higher the value of correlation coefficient R, the higher the ranking. The smallest value of RMSE, Bias ranked 1, and the larger the value, the lower the ranking in order, and the comprehensive ranking formula was calculated as follows:
M R = 1 1 1 × m × n i = 1 n r a n k i    
where m and n are the number of evaluation indicators and reanalysis datasets, respectively, and ranki is the ranking of the reanalysis dataset under different evaluation indicators.

3. Results

3.1. The Applicability of Reanalysis Data Products

Figure 2 and Figure 3 show the soil temperature at depths of 10 cm and 50 cm between MERRA-2, GLDAS-Noah, ERA5-Land, CFSR reanalysis datasets, and observation data (OBS) at eight stations along the QTEC. The results show that the reanalysis data products all reflect the variation in soil temperature. Figure 4 shows the correlation between the four reanalysis datasets and the measured data is higher in spring and autumn and relatively lower in summer and winter. RMSE and bias between the reanalysis datasets and the measured data are generally higher in winter than in other seasons. The reanalysis datasets underestimated soil temperatures to some extent except in summer, with the greatest underestimation occurring in winter. The correlation between the reanalysis datasets and observation data was higher in spring and autumn than in summer and winter. Compared with other reanalysis datasets, MERRA-2 and GLDAS-Noah had relatively smaller RMSE and bias in the spring, the RMSE and bias of GLDAS-Noah and ERA5-Land were smaller in the autumn and winter, RMSE and Bias of CFSR data in summer were smaller than those in other seasons.
The correlation between the reanalysis datasets and the measured data is high (R ≥ 0.9) for the two depths of 10 cm and 50 cm, except for the Ch04 (Figure 5). The standard deviation and RMSE of the CFSR data at depths of 10 cm and 50 cm depths were higher than those of the other reanalysis datasets, but the correlation coefficients were not significantly different from other reanalysis data, indicating that the CFSR data could generally capture the trend of the actual soil temperature at each site. The mean values of standard deviation and RMSE of CFSR data were 8.00 °C and 4.22 °C for 10 cm and 50 cm at all stations, respectively.
There is a significant difference in the simulation ability of different reanalysis datasets products (Figure 6). Except for the QT09, the GLDAS-Noah data at 10 cm depth has better performance (first and second), and all ranked higher in the composite rank at 50 cm depth (first and second). CFSR had relatively poor applicability at eight sites, ranking both third and fourth in the overall ranking. Overall, the reanalysis soil temperature dataset with the best simulation results in the area along the QTEC is GLDAS-Noah.

3.2. Calibration of Reanalysis Data Products

GLDAS-Noah was calibrated by multiple linear regression and random forest regression models using NDVI, SD, and DEM as the input auxiliary variables (p < 0.05). The corrected GLDAS-Noah soil temperature data were validated, and the accuracy of the multiple linear regression and random forest models were evaluated using three indicators, R2, RMSE, and bias, respectively. The validation results are shown in Table 3.
The RMSE and bias values of 10 cm and 50 cm corrected by the multiple linear regression and random forest regression model were reduced, and the accuracy of the corrected daily soil temperature data was improved significantly (Table 3). The soil temperature data corrected by the random forest regression model is closest to the measured data. The accuracy of the multiple linear regression model was relatively lower than the random forest regression model, and the R2 of the random forest regression model was 0.95, which was higher than that of the multiple linear regression model. RMSE, Bias of the random forest regression model were lower than those of multiple linear regression model. This result indicated that the random forest regression model corrected the shallow soil temperature better than the multiple linear regression model.

3.3. Temporal and Spatial Variation of Soil Temperature in the Shallow Layer

The spatial and temporal variation of the shallow soil temperature was analyzed using the random forest model corrected GLDAS-Noah data, and the results show that the overall soil temperature at 10 cm and 50 cm depths exhibited a fluctuating warming trend from 2004 to 2018, with warming rates of 0.0994 °C/a and 0.1005 °C/a, respectively (Figure 7). Soil warming rates in the permafrost zone were lower than those in the seasonally frozen ground zone, 0.1105 °C/a and 0.1102 °C/a, respectively. The warming rates of 10 cm and 50 cm in the permafrost zone are 0.0976 °C/a and 0.0989 °C/a, respectively.
As shown in Figure 8, the characteristics of the 10 cm and 50 cm warming rate changes in the study area from 2004–2018 are relatively similar. The soil warming rates on the west side of the road from QT08 to Ch01 and the east side of the road from Ch01 to QT05 are about 0.1~0.2 °C/a. The warming rate in most of the area near site Ch04 is high, about 0.1~0.25 °C/a.

4. Discussion

4.1. The Applicability of the Different Reanalysis Soil Temperature Datasets

Figure 6 shows that the GLDAS-Noah soil temperature has the best applicability in the permafrost regions on the QTP, which is consistent with the findings of Yang et al. [22]. Still, Hu et al. [45] also concluded that GLDAS-Noah has high applicability in the 0–10 cm and 10–40 cm soil layers, while CFSv2 has higher applicability than GLDAS-Noah in the 40–100 and 100–200 cm depths. We suggest that the GLDAS-Noah reanalysis product simulates soil temperature better in shallow layers, while the applicability of CFSR soil temperature data is higher in deeper soil layers.
The random forest regression model better corrects for GLDAS-Noah (Table 3), which is based on the integration idea of randomly constructed decision trees that follow a certain logic and are not easily overfitted [46], and the accuracy of the corrected data was improved. Most studies have been conducted using random forest methods to correct the data and improve the data accuracy. Shen et al. used a random forest regression model to calibrate the hydrological model PCR-GLOBWB, and the NSE of calibrated PCR-GLOBWB was 0.60–0.78 [29]. The precipitation data of the numerical model were corrected using quantile mapping and the random forest method, and the correction results of random forest method were better [30]. He et al. used the random forest method to correct the ERA5 near-surface air temperature, and the RMSE was reduced from 5.72 °C to 1.41 °C, and the data accuracy was significantly improved [31].

4.2. The Difference in Spatiotemporal Variations of Soil Temperature

As shown in Figure 7, the soil warming rate in the permafrost zone is lower than in the seasonally frozen ground zone. Hu et al. [45] used a univariate linear regression method to correct the soil temperature data from the CFSR. They concluded that the soil temperature in the permafrost zone showed a warming trend from 1980 to 2015. Zhu et al. [47] concluded that, the study of Hu et al. shows that the rate of soil temperature warming in the permafrost zone at 0–10 cm is 0.0439 °C/a, and Zhu et al. shows that the rate of soil temperature warming in the seasonally frozen ground zone at 10 cm is 0.0577 °C/a. This difference may be due to the release and absorption of heat during the freeze-thaw cycle of the active layer in the permafrost zone. The results of this paper show that the warming rate of soil temperature in the active layer at 10 cm and 50 cm depths in this study area are 0.0976 °C/a and 0.0989 °C/a, respectively, which was close to the results of 0.86 °C/10 a at 50 cm depth [48]. However, Nan et al. suppose the northern area of Ali was the top warming center of the plateau with a value of 0.67 °C/10 a [49]. The result is lower than 0.0976 °C/a in this paper; this difference may be due to GLDAS-Noah underestimating soil temperatures on the QTP, and Nan et al. did not take that into account. However, this study corrected the GLDAS-Noah data, the accuracy of the corrected data was improved, and the corrected data were used to analyze the soil temperature and obtain more accurate warming trend data.

4.3. The Limitation and Uncertainty of Soil Temperature

This study used the neighboring grid matching method to match the reanalysis grids with the monitoring sites spatially. However, due to elevation differences and subsurface heterogeneity, the grid points are not fully representative of the site data [50]. In this study, the depth of the reanalysis data was processed using the linear interpolation method, and the 10 and 50-cm soil temperature data were obtained and evaluated in comparison with the measured data. The matching of soil temperature data depth can also cause data evaluation errors [51]. Furthermore, this study and previous existing studies [22,45,52] have shown that reanalysis soil temperature datasets underestimate the actual soil temperature to some extent. This may be due to the existence of freeze–thaw cycles in the soils of the permafrost region of the QTP, accompanied by phase changes, and the failure to couple critical physical processes such as unfrozen water migration into the current land surface process model [53,54].
In this study, the changes of water and ice during the freeze–thaw process of permafrost were not considered when the data were corrected, and the phase change transformation of water and ice with temperature change is an essential factor in imaging heat transfer and transmission in the permafrost layer. Future study can add the consideration of water and ice in permafrost as auxiliary variables to further correct the soil temperature reanalysis datasets to obtain more accurate soil temperature data in the shallow layer of permafrost area.

5. Conclusions

This study first analyzed the applicability of MERRA-2, GLDAS-Noah, ERA5-Land, and CFSR&v2 soil temperature reanalysis datasets based on the measured soil temperature datasets along the QTEC, and then corrected the GLDAS-Noah soil temperature data and examined the spatial and temporal evolution of soil temperature (10 and 50 cm) based on the corrected data. The main conclusions include:
(1)
The four reanalysis datasets underestimated soil temperature the most in winter. The applicability of the four reanalysis datasets was higher at 50 cm. GLDAS-Noah had the lowest bias (Bias = −0.43 °C) from the measured data at all sites. Overall, the applicability of the GLDAS-Noah data was higher in this study area.
(2)
The multiple linear regression and random forest methods improved the accuracy of the GLDAS-Noah data to some extent. GLDAS-Noah corrected by the random forest model was more consistent with the measured data. The RMSE and bias of the random forest model were lower than those of the multiple linear regression model.
(3)
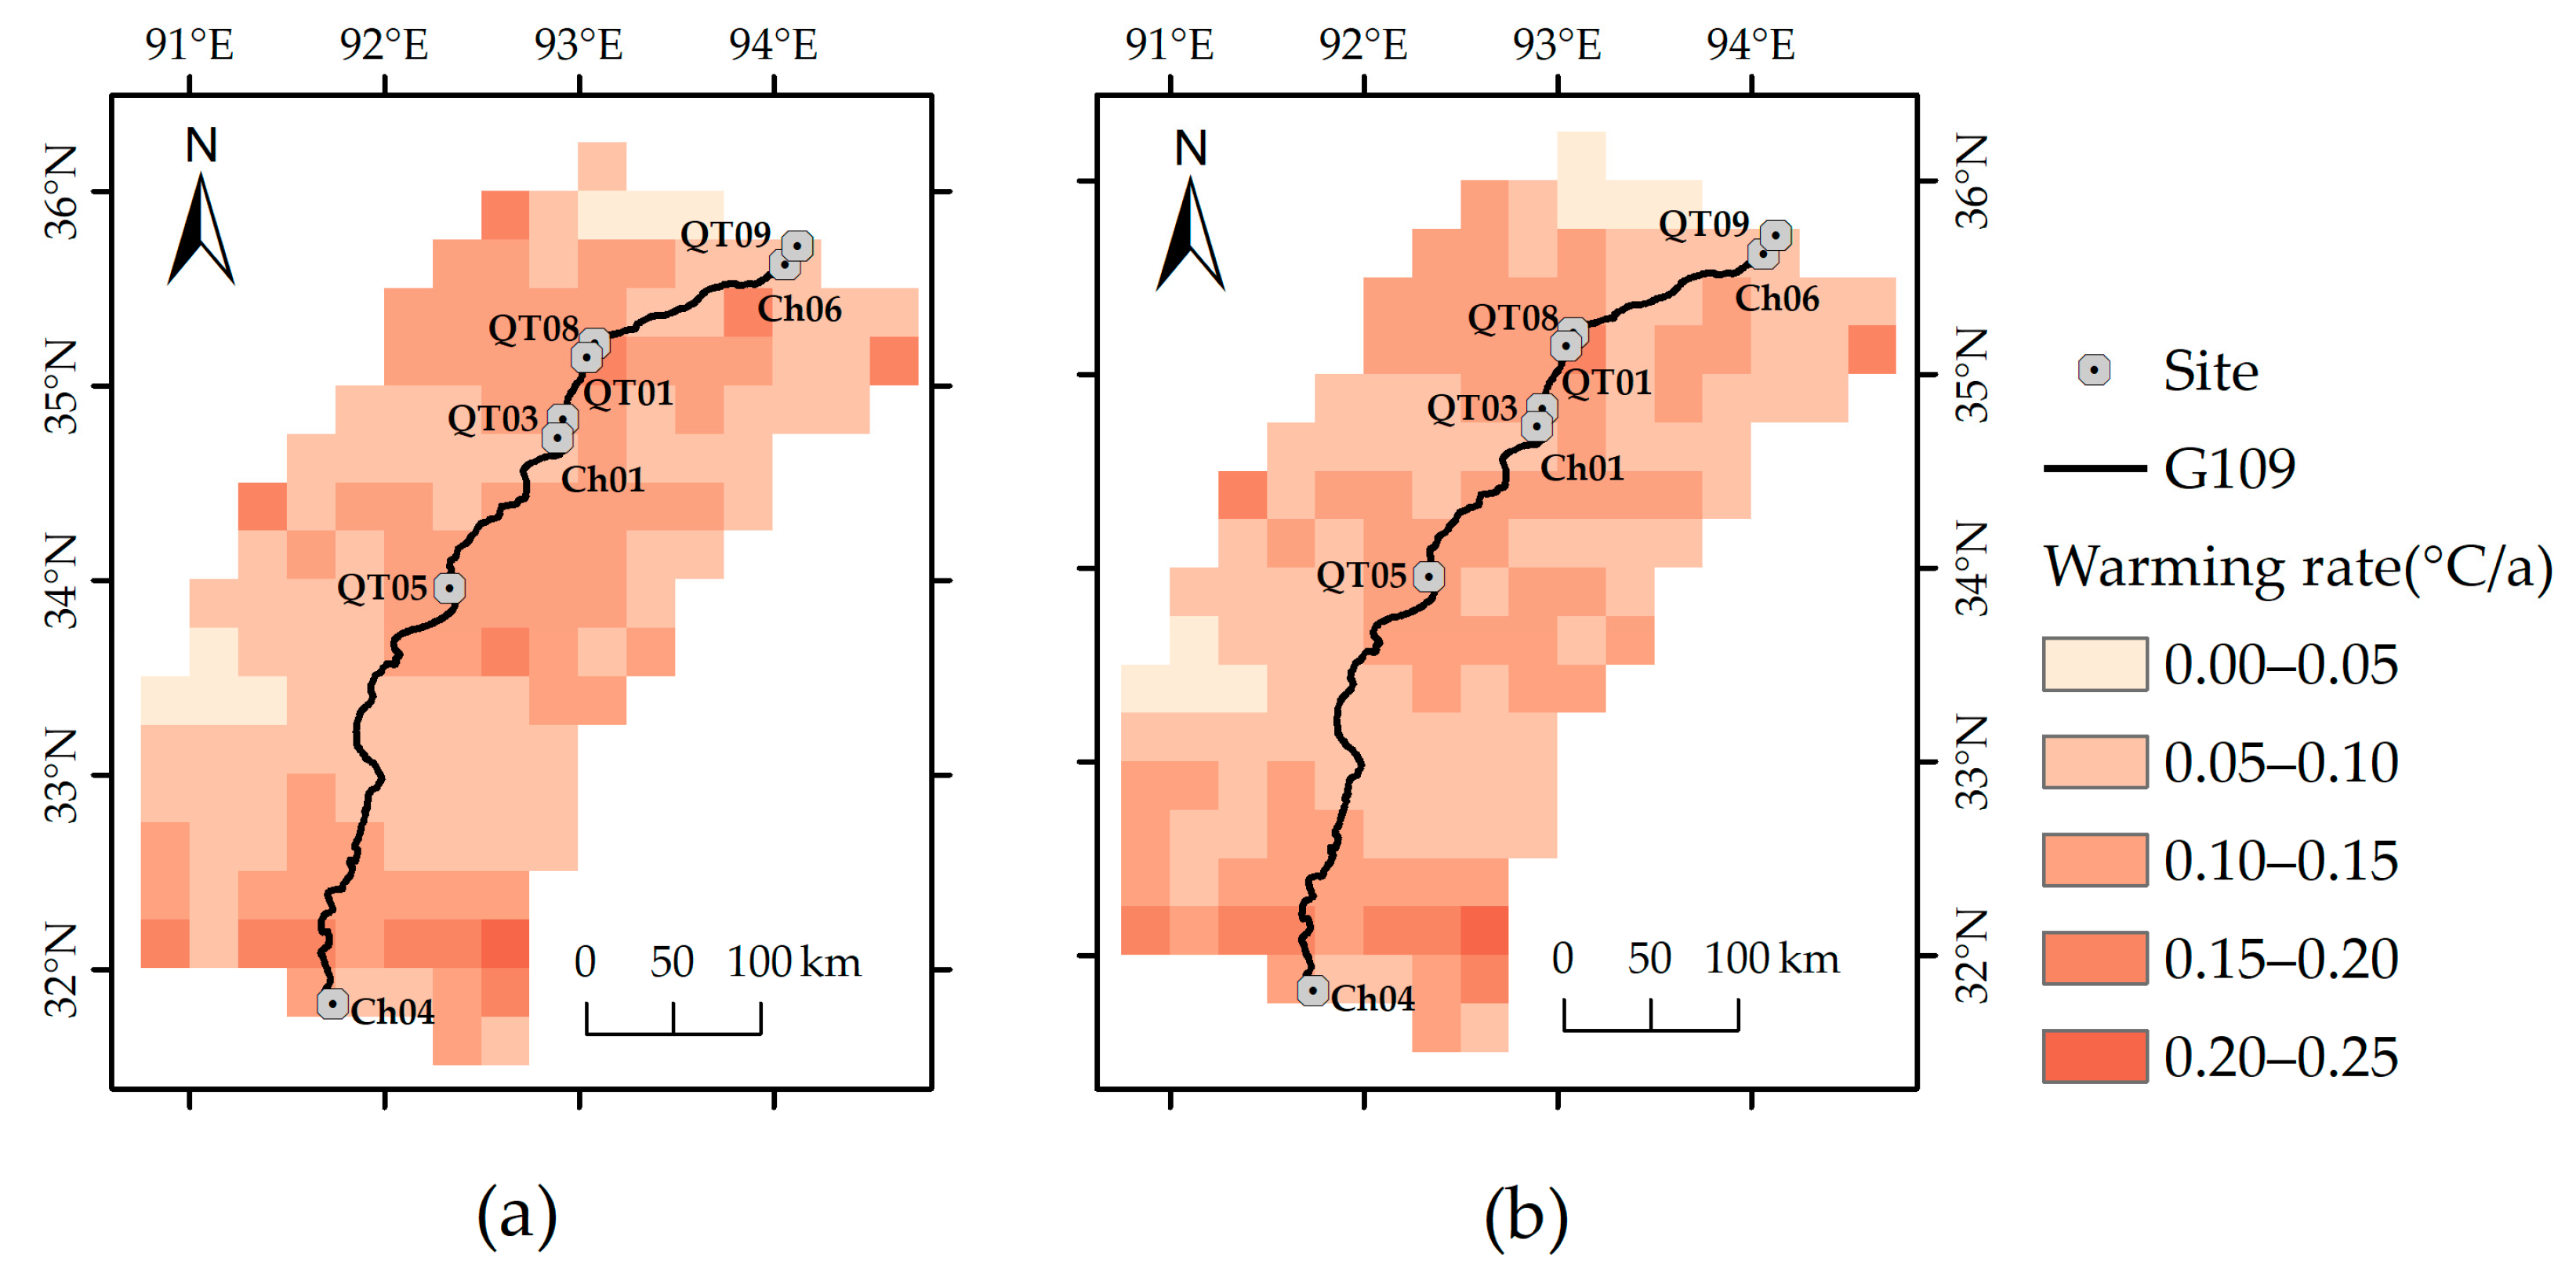
The soil temperature was in a warming state from 2004 to 2018, and the warming rate of the soil temperature at 50 cm depth is slightly higher than that of 10 cm. The warming rate of soil in the seasonally frozen ground regions is higher than that in the permafrost regions.

Author Contributions

Conceptualization, M.J.; methodology, M.J., L.Z. and C.W.; software, M.J., C.W., M.X. and Y.H.; formal analysis, M.J., C.W. and G.H.; investigation, M.J., C.W., G.H. and Y.L.; resources, D.Z., G.L., E.D. and Y.Q.; data curation, M.J., L.Z., D.Z., G.L., E.D. and Y.Q.; writing—original draft preparation, M.J.; writing—review and editing, L.Z., C.W., G.H., J.Z., D.Z. and Z.X.; project administration, L.Z.; funding acquisition, C.W. and L.Z. All authors have read and agreed to the published version of the manuscript.

Funding

This research was funded by the National Natural Science Foundation of China (No. 42001051 and No. 41931180), the Second Tibetan Plateau Scientific Expedition and Research (STEP) program (No. 2019QZKK0201), and the opening research foundation of Key Laboratory of Frozen Soil Engineering (No. SKLFSE201921).

Data Availability Statement

The MERRA-2 data were downloaded from the NASA Goddard Earth Sciences (GES) Data and Information Services Center (DISC) (https://disc.gsfc.nasa.gov/datasets?keywords=%22MERRA-2 (accessed on 8 July 2021)). The GLDAS-Noah data were download from the NASA Goddard Earth Sciences (GES) Data and Information Services Center (DISC) (https://disc.gsfc.nasa.gov/datasets?keywords=GLDAS (accessed on 9 June 2021)). The ERA5-Land data were download from the European Centre for Medium-Range Weather Forecasts (https://cds.climate.copernicus.eu/cdsapp#!/dataset/reanalysis-era5-land?tab=overview (accessed on 27 April 2021)). The CFSR&v2 data were downloaded from the National Centers for Environmental Prediction (https://rda.ucar.edu/datasets/ds093.0/index.html#!cgi-bin/datasets/getSubset?dsnum=093.0&action=customize&_da=y (accessed on 8 October 2021)). Monitoring data in situ from the field observation sites provided by the Cryosphere Research Station on Qinghai-Xizang Plateau of the Chinese Academy of Sciences (CAS), are available online (https://data.tpdc.ac.cn/en/disallow/789e838e-16ac-4539-bb7e-906217305a1d/ (accessed on 8 July 2021)). The NDVI data were downloaded from NASA’s Land Processes Distributed Active Archive Center (LP DAAC) (https://lpdaac.usgs.gov/data/ (accessed on 1 March 2022)). The snow depth data were downloaded from the National Tibetan Plateau Data Center (https://poles.tpdc.ac.cn/zh-hans/data/0515ce19-5a69-4f86-822b-330aa11e2a28/ (accessed on 22 March 2022)). The DEM data were downloaded from the Shuttle Radar Topography Missions (SRTM) (https://www2.jpl.nasa.gov/srtm/ (accessed on 5 April 2022)).

Conflicts of Interest

The authors declare no conflict of interest.

References

  1. Ding, X.; Lai, X.; Fan, G.; Wen, J.; Yuan, Y.; Wang, X.; Wang, Z.; Zhu, L.; Zhang, Y.; Wang, B. Analysis on the applicability of reanalysis soil temperature and moisture datasets over Qinghai-Tibetan plateau. Plateau Meteorol. 2018, 37, 626–641. [Google Scholar]
  2. Lin, Z.; Ren, L.I.; Ding, Y.; Xiao, Y.; Sun, L.; Yang, L. Soil thermal regime in Qinghai-Tibet Plateau and its adjacent regions during 1977–2006. Adv. Clim. Change Res. 2011, 7, 307. [Google Scholar]
  3. Decharme, B.; Martin, E.; Faroux, S. Reconciling soil thermal and hydrological lower boundary conditions in land surface models. J. Geophys. Res. Atmos. 2013, 118, 7819–7834. [Google Scholar] [CrossRef]
  4. Cuo, L.; Zhang, Y.; Bohn, T.J.; Zhao, L.; Li, J.; Liu, Q.; Zhou, B. Frozen soil degradation and its effects on surface hydrology in the northern Tibetan Plateau. J. Geophys Res. Atmos. 2015, 120, 8276–8298. [Google Scholar] [CrossRef] [Green Version]
  5. Onwuka, B.; Mang, B. Effects of soil temperature on some soil properties and plant growth. Adv. Plants Agric. Res. 2018, 8, 34–37. [Google Scholar] [CrossRef]
  6. Turetsky, M.R.; Abbott, B.W.; Jones, M.C.; Anthony, K.W.; Olefeldt, D.; Schuur, E.A.; Grosse, G.G.; Kuhry, P.; Hugelius, G.; Koven, C.; et al. Carbon release through abrupt permafrost thaw. Nat. Geosci. 2020, 13, 138–143. [Google Scholar] [CrossRef]
  7. Cheng, G.; Zhao, L.; Li, R.; Wu, X.; Sheng, Y.; Hu, G.; Zou, D.; Jin, H.; Xin, L.; Wu, Q. Characteristic, changes and impacts of permafrost on Qinghai-Tibet Plateau. Chin. Sci. Bull. 2019, 64, 2783–2795. [Google Scholar]
  8. Zou, D.; Zhao, L.; Sheng, Y.; Chen, J.; Hu, G.; Wu, T.; Wu, J.; Xie, C.; Wu, X.; Pang, Q.; et al. A new map of permafrost distribution on the Tibetan Plateau. Cryosphere 2017, 11, 2527–2542. [Google Scholar] [CrossRef] [Green Version]
  9. Guo, D.; Wang, H.; Li, D. A projection of permafrost degradation on the Tibetan Plateau during the 21st century. J. Geophys. Res. Atmos. 2012, 117, D05106. [Google Scholar] [CrossRef]
  10. Fang, X.; Luo, S.; Lyu, S. Observed soil temperature trends associated with climate change in the Tibetan Plateau, 1960–2014. Theor. Appl. Climatol. 2019, 135, 169–181. [Google Scholar] [CrossRef] [Green Version]
  11. Yang, M.; Nelson, F.E.; Shiklomanov, N.I.; Guo, D.; Wan, G. Permafrost degradation and its environmental effects on the Tibetan Plateau: A review of recent research. Earth Sci. Rev. 2010, 103, 31–44. [Google Scholar] [CrossRef]
  12. Genxu, W.; Yuanshou, L.; Yibo, W.; Qingbo, W. Effects of permafrost thawing on vegetation and soil carbon pool losses on the Qinghai–Tibet Plateau, China. Geoderma 2008, 143, 143–152. [Google Scholar] [CrossRef]
  13. Ma, Y.; Hu, Z.; Xie, Z.; Ma, W.; Wang, B.; Chen, X.; Li, M.; Zhong, L.; Sun, F.; Gu, L.; et al. A long-term (2005–2016) dataset of hourly integrated land–atmosphere interaction observations on the Tibetan Plateau. Earth Syst. Sci. Data 2020, 12, 2937–2957. [Google Scholar] [CrossRef]
  14. Qin, Y.; Zhang, P.; Liu, W.; Guo, Z.; Xue, S. The application of elevation corrected MERRA2 reanalysis ground surface temperature in a permafrost model on the Qinghai-Tibet Plateau. Cold Reg. Sci. Technol. 2020, 175, 103067. [Google Scholar] [CrossRef]
  15. Zhang, Z.; Lin, H.; Wang, M.; Liu, X.; Chen, Q.; Wang, C.; Zhang, H. A Review of Satellite Synthetic Aperture Radar Interferometry Applications in Permafrost Regions: Current Status, Challenges, and Trends. IEEE Geosci. Remote Sens. Mag. 2022, 10, 93–114. [Google Scholar] [CrossRef]
  16. Gao, H.; Nie, N.; Zhang, W.; Chen, H. Monitoring the spatial distribution and changes in permafrost with passive microwave remote sensing. ISPRS J. Photogramm. Remote Sens. 2020, 170, 142–155. [Google Scholar] [CrossRef]
  17. Tian, H.; Liu, L.; Zhang, Z.; Chen, H.; Zhang, X.; Wang, T.; Kang, Z. Spatiotemporal diversity and attribution analysis of land surface temperature in China from 2001 to 2020. J. Geogr. Sci. 2022, 77, 1713–1729. [Google Scholar]
  18. Liangpei, Z.; Jiang, H.E.; Qianqian, Y.; Yi, X.; Yuan, Q. Data-driven multi-source remote sensing data fusion: Progress and challenges. Acta Geod. Et Cartogr. Sin. 2022, 51, 1317. [Google Scholar]
  19. Dan, S.; Shi, C.; Shen, R.; Lei, B. Evaluation of ERA70, CLDAS, and ERA-Interim Reanalysis Surface Soil Temperatures Across China. Meteorol. Sci. Technol. 2021, 49, 830–837. [Google Scholar] [CrossRef]
  20. Hu, G.; Zhao, L.; Wu, X.; Li, R.; Wu, T.; Su, Y.; Hao, J. Evaluation of reanalysis air temperature products in permafrost regions on the Qinghai-Tibetan Plateau. Theor. Appl. Climatol 2019, 138, 1457–1470. [Google Scholar] [CrossRef]
  21. Huang, X.; Han, S.; Shi, C. Evaluation of Three Air Temperature Reanalysis Datasets in the Alpine Region of the Qinghai–Tibet Plateau. Remote Sens. 2022, 14, 4447. [Google Scholar] [CrossRef]
  22. Yang, S.; Li, R.; Wu, T.; Hu, G.; Xiao, Y.; Du, Y.; Zhu, X.; Jie, N.; Ma, J.; Zhang, Y. Evaluation of reanalysis soil temperature and soil moisture products in permafrost regions on the Qinghai-Tibetan Plateau. Geoderma 2020, 377, 114583. [Google Scholar] [CrossRef]
  23. Ramakrishna, A.; Tam, H.M.; Wani, S.P.; Long, T.D. Effect of mulch on soil temperature, moisture, weed infestation and yield of groundnut in northern Vietnam. Field Crops Res. 2006, 95, 115–125. [Google Scholar] [CrossRef] [Green Version]
  24. Hu, Q.; Feng, S. A daily soil temperature dataset and soil temperature climatology of the contiguous United States. J. Appl. Meteorol. 2003, 42, 1139–1156. [Google Scholar] [CrossRef]
  25. Jung, C.; Lee, Y.; Cho, Y.; Kim, S. A study of spatial soil moisture estimation using a multiple linear regression model and MODIS land surface temperature data corrected by conditional merging. Remote Sens. 2017, 9, 870. [Google Scholar] [CrossRef]
  26. Shen, Y.; Ruijsch, J.; Lu, M.; Sutanudjaja, E.H.; Karssenberg, D. Random forests-based error-correction of streamflow from a large-scale hydrological model: Using model state variables to estimate error terms. Comput. Geosci. 2022, 159, 105019. [Google Scholar] [CrossRef]
  27. Zarei, M.; Mohsen, N.; Mastouri, R. Bias correction of global ensemble precipitation forecasts by Random Forest method. Earth Sci. Inform. 2021, 14, 677–689. [Google Scholar] [CrossRef]
  28. He, Y.; Chen, C.; Li, B.; Zhang, Z. Prediction of near-surface air temperature in glacier regions using ERA5 data and the random forest regression method. Remote Sens. Appl. Soc. Environ. 2022, 28, 100824. [Google Scholar]
  29. Song, Y.; Zhou, D.; Zhang, H.; Li, G.; Jin, Y.; Li, Q. Effects of vegetation height and density on soil temperature variations. Chin. Sci. Bull. 2013, 58, 907–912. [Google Scholar] [CrossRef] [Green Version]
  30. Park, H.; Sherstiukov, A.B.; Fedorov, A.N.; Polyakov, I.V.; Walsh, J.E. An observation-based assessment of the influences of air temperature and snow depth on soil temperature in Russia. Environ. Res. Lett. 2014, 9, 064026. [Google Scholar] [CrossRef]
  31. Bennie, J.; Huntley, B.; Wiltshire, A.; Hill, M.O.; Baxter, R. Slope, aspect and climate: Spatially explicit and implicit models of topographic microclimate in chalk grassland. Ecol. Model. 2008, 216, 47–59. [Google Scholar] [CrossRef]
  32. Zhao, L.; Zou, D.; Hu, G.; Wu, T.; Du, E.; Liu, G.; Yao, X.; Ren, L.; Pang, Q.; Qiao, Y.; et al. A synthesis dataset of permafrost thermal state for the Qinghai–Tibet (Xizang) Plateau, China. Earth Syst. Sci. Data 2021, 13, 4207–4218. [Google Scholar] [CrossRef]
  33. Wang, Z.W.; Wang, Q.; Zhao, L.; Wu, X.; Yue, G.; Zou, D.; Nan, Z.; Liu, G.; Pang, Q.; Fang, H.; et al. Mapping the vegetation distribution of the permafrost zone on the Qinghai-Tibet Plateau. J. Mt. Sci. 2016, 13, 1035–1046. [Google Scholar] [CrossRef]
  34. Gelaro, R.; McCarty, W.; Suárez, M.J.; Todling, R.; Molod, A.; Takacs, L.; Randles, C.A.; Darmenov, A.; Bosilovich, M.G.; Reichle, R.; et al. The modern-era retrospective analysis for research and applications, version 2 (MERRA-2). J. Clim. 2017, 30, 5419–5454. [Google Scholar] [CrossRef]
  35. Rodell, M.; Houser, P.; Peters-Lidard, C.; Kato, H.; Kumar, S.; Gottschalck, J.; Mitchell, K.; Meng, J. NASA/NOAA’s global land data assimilation system (GLDAS): Recent results and future plans. In Proceedings of the ECMWF/ELDAS Workshop on Land Surface Assimilation, Reading, UK, 8–11 November 2004; pp. 61–68. [Google Scholar]
  36. Muñoz-Sabater, J.; Dutra, E.; Agustí-Panareda, A.; Albergel, C.; Arduini, G.; Balsamo, G.; Boussetta, S.; Choulga, M.; Harrigan, S.; Hersbach, H.; et al. ERA5-Land: A state-of-the-art global reanalysis dataset for land applications. Earth Syst. Sci. Data Discuss. 2021, 13, 4349–4383. [Google Scholar] [CrossRef]
  37. Yan, D.; Ma, N.; Zhang, Y. Development of a fine-resolution snow depth product based on the snow cover probability in the Tibetan Plateau: Validations and spatial-temporal analyses. J. Hydrol. 2022, 604, 127027. [Google Scholar] [CrossRef]
  38. Yan, D.; Ma, N.; Zhang, Y. A daily, 0.05° Snow depth dataset for Tibetan Plateau (2000–2018). Natl. Tibet. Plateau Data Cent. 2022. [Google Scholar] [CrossRef]
  39. Jarvis, A.; Reuter, H.; Nelson, A.; Edith, G. Hole-Filled Seamless SRTM Data V4, Tech. Rep. International Centre for Tropical Agriculture (CIAT), Cali, Columbia. Available online: http://srtm.csi.cgiar.org (accessed on 5 April 2022).
  40. Bakar, N.M.A.; Tahir, I.M. Applying multiple linear regression and neural network to predict bank performance. Int. Bus. Res. 2009, 2, 176–183. [Google Scholar] [CrossRef]
  41. Dong, H.; Wang, Y.; Li, L. A Review of Random Forest Optimization Algorithms. China Comput. Commun. 2021, 33, 34–37. [Google Scholar]
  42. Li, T.; Tian, Y.; Wu, L.; Liu, L. Landslide Susceptibility Mapping Using Random Forest. Geogr. Geo Inf. Sci. 2014, 30, 25–30+2. [Google Scholar]
  43. Brunke, M.A.; Fairall, C.W.; Zeng, X.; Eymard, L.; Curry, J.A. Which Bulk Aerodynamic Algorithms are Least Problematic in Computing Ocean Surface Turbulent Fluxes. J. Clim. 2003, 16, 619–635. Available online: https://journals.ametsoc.org/view/journals/clim/16/4/15200442_2003_016_0619_wbaaal_2.0.co_2.xml (accessed on 13 July 2022). [CrossRef]
  44. Brunke, M.A.; Wang, Z.; Zeng, X.; Bosilovich, M.; Shie, C. An Assessment of the Uncertainties in Ocean Surface Turbulent Fluxes in 11 Reanalysis, Satellite-Derived, and Combined Global Datasets. J. Clim. 2011, 24, 5469–5493. Available online: https://journals.ametsoc.org/view/journals/clim/24/21/2011jcli4223.1.xml (accessed on 13 July 2022). [CrossRef]
  45. Hu, G.; Zhao, L.; Li, R.; Wu, X.; Wu, T.; Xie, C.; Zhu, X.; Su, Y. Variations in soil temperature from 1980 to 2015 in permafrost regions on the Qinghai-Tibetan Plateau based on observed and reanalysis products. Geoderma 2019, 337, 893–905. [Google Scholar] [CrossRef]
  46. Zhang, F.; Zhang, Y.; Chen, J.; Zhai, X.; Hu, Q. Performance of multiple machine learning model simulation of process characteristic indicators of different flood types. Progress in Geography 2022, 41, 1239–1250. [Google Scholar] [CrossRef]
  47. Zhu, F.; Cuo, L.; Zhang, Y.; Luo, J.J.; Lettenmaier, D.P.; Lin, Y.; Liu, Z. Spatiotemporal variations of annual shallow soil temperature on the Tibetan Plateau during 1983–2013. Clim. Dyn. 2018, 51, 2209–2227. [Google Scholar] [CrossRef]
  48. Li, R.; Zhao, L.; Ding, Y.; Wu, T.; Xiao, Y.; Du, E.; Liu, G.; Qiao, Y. Temporal and spatial variations of the active layer along the Qinghai-Tibet Highway in a permafrost region. Chin. Sci. Bull. 2012, 57, 2864–2871. [Google Scholar] [CrossRef] [Green Version]
  49. Nan, Y.; Fan, G. Analysis of Soil Temperature Variation over the Qinghai-Xizang Plateau from 2000 to 2016. J. Southwest Univ. 2019, 41, 40–51. [Google Scholar]
  50. Qin, Y.; Wu, T.; Li, R. The applicability of ERA-Interim land surface temperature dataset to map the permafrost distribution over the Tibetan Plateau. J. Glaciol. Geocryol. 2015, 37, 1534–1543. [Google Scholar]
  51. Bi, H.; Ma, J.; Zheng, W.; Zeng, J. Comparison of soil moisture in GLDAS model simulations and in situ observations over the Tibetan Plateau. J. Geophys. Res. Atmos. 2016, 121, 2658–2678. [Google Scholar] [CrossRef] [Green Version]
  52. Qin, Y.; Liu, W.; Guo, Z.; Xue, S. Spatial and temporal variations in soil temperatures over the Qinghai–Tibet Plateau from 1980 to 2017 based on reanalysis products. Theor. Appl. Climatol. 2020, 140, 1055–1069. [Google Scholar] [CrossRef]
  53. Yuan, L.; Zhao, L.; Hu, G.; Lu, M.; Zhou, H.; Liu, S.; Qiao, Y. Hydro-thermal dynamic and soil thermal diffusivity characteristics of typical active layer on the central Tibetan Plateau. J. Glaciol. Geocryol. 2020, 42, 378–389. [Google Scholar]
  54. Ma, J.; Li, R.; Liu, H.; Wu, T.; Yao, X.; Du, Y.; Yang, S.; Shi, J.; Qiao, Y. A review on the development of study on hydrothermal characteristics of active in permafrost areas in permafrost areas in Qinghai-Tibet Plateau. J. Glaciol. Geocryol. 2020, 42, 195–204. [Google Scholar]
Figure 1. Location of the study area and monitoring sites (the spatial distribution of frozen ground types is derived from Zou et al., 2017 [8]).
Remotesensing 15 00455 g001
Figure 2. Comparison of the daily average of reanalysis soil temperature to in situ observed at a depth of 10 cm. OBS: observations data, (a) QT09, (b) Ch06, (c) QT08, (d) QT01, (e) QT03, (f) Ch01, (g) QT05, (h) Ch04. (Missing 10 cm records at Ch01 site due to equipment failure.)
Remotesensing 15 00455 g002
Figure 3. Comparison of the daily average of reanalysis soil temperature to in situ observed at a depth of 50 cm. OBS: observations data, (a) QT09, (b) Ch06, (c) QT08, (d) QT01, (e) QT03, (f) Ch01, (g) QT05, (h) Ch04.
Remotesensing 15 00455 g003
Figure 4. R, RMSE, and bias of the reanalyzed datasets and calibrated soil temperature in different seasons. (Spring: March–May, summer: June–August, autumn: September–November, and winter: December–February). (ad) 10 cm, (eh) 50 cm. The left y-axis represents the error values, and the right y-axis represents the correlation coefficient values.
Remotesensing 15 00455 g004
Figure 5. Taylor program for measured soil temperature data at 10 cm (a) and 50 cm (b) compared with the reanalysis soil temperature. (Missing 10 cm records at Ch01 site due to equipment failure).
Remotesensing 15 00455 g005
Figure 6. Comprehensive model ranking in four reanalysis products. 10 cm (a), 50 cm (b). Rank 1 represents the best-performing model, indicating high applicability. (Missing 10 cm records at Ch01 site due to equipment failure.)
Remotesensing 15 00455 g006
Figure 7. Annual variation in soil temperature of 10 cm (a), 50 cm (b).
Remotesensing 15 00455 g007
Figure 8. Spatial distribution of variation trends of the soil temperature at 10 cm (a) and 50 cm (b) over the Qinghai–Tibet engineering corridor (G109) during 2004–2018.
Remotesensing 15 00455 g008
Table 1. Detailed information of monitoring sites.
SitesLocationLongitude
(°E)
Latitude
(°N)
Altitude
(m)
Time PeriodSoil Temperature Depth/cmVegetation Type
QT09Xidatan94.135.745382011–201810, 40, 120, 160Alpine meadows
Ch06Kunlun Pass94.035.647462005–201810, 50, 100, 180Alpine grassland
QT08Wudaoliang93.035.247832010–201810, 40, 120, 200, 240Alpine meadows
QT01Hoh Xil93.035.147342004–201310, 50, 100, 180Alpine meadows
QT03Beiluhe92.934.846562004–201410, 50, 90, 200, 240Alpine meadows
Ch01Wind volcano92.834.748962005–201410, 50, 100, 160Alpine meadows
QT05Kaixinling92.333.946522004–201310, 50, 90, 210, 315Alpine grassland
Ch04Liangdaohe91.731.848082005–201815, 50, 95, 120Alpine meadows
Table 2. Description of reanalysis datasets.
Data NameTemporal ResolutionSpatial ResolutionTime PeriodSoil Temperature Depth/cm
MERRA-21 h0.5° × 0.625°1980–20219.88, 19.52, 38.59, 76.27, 150.7, 1000
GLDAS-Noah3 h0.25° × 0.25°2000–20210–10, 10–40, 40–100, 100–200
ERA5-Land1 h0.1° × 0.1°1950–20210–7, 7–28, 28–100, 100–200
CFSR6 h0.312° × 0.312°1979–20100–10, 10–40, 40–100, 100–200
CFSv26 h0.205° × 0.204°2011–20210–10, 10–40, 40–100, 100–200
Table 3. Assessment of modified soil temperature by correct models, MLR: Multiple Linear Regression Model, RF: Random Forest Model.
DepthModelR2RMSE (°C)Bias (°C)
10 cmoriginal0.893.23−0.62
MLR0.912.14−0.82 × 10⁻²
RF0.951.74−0.55 × 10⁻²
50 cmoriginal0.862.47−0.06
MLR0.881.72−0.64 × 10⁻²
RF0.951.190.26 × 10−2
Disclaimer/Publisher’s Note: The statements, opinions and data contained in all publications are solely those of the individual author(s) and contributor(s) and not of MDPI and/or the editor(s). MDPI and/or the editor(s) disclaim responsibility for any injury to people or property resulting from any ideas, methods, instructions or products referred to in the content.

